Article

An Automated Assessment Method for Chronic Kidney Disease–Mineral and Bone Disorder (CKD-MBD) Utilizing Metacarpal Cortical Percentage

1
College of Pharmacy & Health Care, Tajen University, Pingtung 90741, Taiwan
2
Department of Internal Medicine, Kaohsiung Veterans General Hospital Tainan Branch, Tainan City 71051, Taiwan
3
NanoRay Biotech Co., Ltd., Taipei City 11494, Taiwan
4
Department of Biomedical Engineering, National Cheng Kung University, Tainan City 70101, Taiwan
*
Author to whom correspondence should be addressed.
Electronics 2024, 13(12), 2389; https://doi.org/10.3390/electronics13122389
Submission received: 23 April 2024 / Revised: 12 June 2024 / Accepted: 14 June 2024 / Published: 18 June 2024

Abstract

:
Chronic kidney disease–mineral and bone disorder (CKD-MBD) frequently occurs in hemodialysis patients and is a common cause of osteoporosis. Regular dual-energy X-ray absorptiometry (DXA) scans are used to monitor these patients, but frequent, cost-effective, and low-dose alternatives are needed. This study proposes an automatic CKD-MBD assessment model using histogram equalization and a squeeze-and-excitation block-based residual U-Net (SER-U-Net) with hand diagnostic radiography for preliminary classification. The process involves enhancing image contrast with histogram equalization, extracting features with the SE-ResNet model, and segmenting metacarpal bones using U-Net. Ultimately, a correlation analysis is carried out between the calculated dual metacarpal cortical percentage (dMCP) and DXA T-scores. The model’s performance was validated by analyzing clinical data from 30 individuals, achieving a 93.33% accuracy in classifying bone density compared to DXA results. This automated method provides a rapid, effective tool for CKD-MBD assessment in clinical settings.

1. Introduction

According to statistics, 10% of the global population suffers from chronic kidney disease (CKD), which has become one of the most prevalent non-communicable diseases worldwide. In clinical settings, hyperphosphatemia, hypocalcemia, low serum vitamin D levels, and increased parathyroid hormone levels are common symptoms in patients with chronic kidney disease. These conditions collectively lead to profound changes in bone mineral metabolism, renal osteodystrophy, and extraosseous calcification in kidney disease patients and are directly associated with osteoporosis. This condition is known as chronic kidney disease–mineral and bone disorder (CKD-MBD) [1,2]. Osteoporosis, a systemic bone disorder, is characterized by an elevated risk of fractures [3,4]. If there are changes in bone mineral density (BMD) that go undetected and receive insufficient early intervention, kidney disease patients face a higher risk of fractures, cardiovascular events, and mortality [5,6,7]. On the other hand, recent studies have shown that after distal radius fracture, the incidence of hip and vertebral fractures increases by 1.51 times and 1.4 times, respectively. Moreover, reduced bone density in the distal forearm is linked to a higher risk of osteoporotic fractures [8,9]. Thus, evaluating bone density in the forearm can act as an independent risk factor for predicting future fractures and mortality. This underscores the potential clinical utility of forearm BMD assessment. However, such risk factors are evidently underestimated. Currently, the globally recognized clinical diagnostic system for osteoporosis is dual-energy X-ray absorptiometry (DXA) [10,11]. DXA, an instrument approved by the World Health Organization (WHO), measures BMD in different anatomical regions and distinguishes five stages of osteoporosis based on T-scores. However, DXA primarily measures BMD in the weight-bearing femoral neck region. Consequently, these measurements may not accurately indicate the fracture risk in non-weight-bearing areas like the forearm. Previous research indicates that out of 46,992 subjects, only 20% had undergone DXA osteoporosis screening within two years before distal radius fracture, with males constituting only 5%. Ultimately, only 7% of patients received DXA osteoporosis testing within six months after the fracture [12]. These findings suggest significant underdiagnosis of osteoporosis currently, or an increase in fracture risk factors due to low examination frequency.
As osteoporosis is recognized as a systemic condition with a diffuse impact on the bones of the limbs, several studies have suggested that analyzing BMD measurements in local bone regions can be used for the preliminary diagnosis of osteoporosis [13,14]. In [15], machine-learning algorithms were used to analyze lumbar and abdominal computed tomography (CT) images, and the results were compared with DXA results. The study indicated the high correlation and accuracy rate were 82 and 87%, respectively. However, obtaining lumbar or abdominal X-ray images still requires a full-body CT scan, which leads to a higher cumulative radiation dose for patients, thus limiting the feasibility of this method for CKD-BMD patients who require frequent monitoring and assessment. Additionally, DXA relies on weight-bearing areas (hip joint or spine) for BMD assessment and cannot accurately reflect the potential fracture risk in non-weight-bearing areas (forearm) [16]. Recent research has shown that DXA of the distal forearm may be a superior method for screening bone mineral density (BMD) and assessing the risk of distal forearm fractures compared to central DXA scans. Article [17] examined the medical records of 384 female patients with distal radius fractures. Their findings indicate that BMD of the distal one-third radius is more closely correlated with hip BMD than lumbar BMD (p < 0.05 in each group). This correlation is clinically significant for detecting low BMD in the distal radius, which is linked to osteoporotic distal radius fractures in elderly women. Subsequently, work [18] focused on the correlation between local bone density and DXA. The authors used the cortical thickness ratio of the third metacarpal bone (3MC) as a predictive factor for severe osteoporotic fractures. This research tracked 300 participants over an average follow-up period of 23.7 months. The method involved calculating cortical thickness in the midportion of the 3MC in the participants’ dominant hand and calculating the bone diameter at the same point transversely. The results showed a significant correlation with BMD. Similar studies also indicate the positive benefits of osteoporosis analysis through forearm BMD [17]. The authors of [19] conducted a multicenter validation study. They used the cortical thickness percentage of the second metacarpal bone (2MC) as a predictive factor for BMD levels. In this study, users used a smartphone app to select the narrowest part of the second metacarpal bone and measure the intramedullary/cancellous component at the same level. The app then calculated the 2MCP score using the formula [(A − B)/A] × 100. This research tracked 450 participants across five medical centers over a 12-month period. The results demonstrated a significant correlation between the 2MC cortical thickness percentage and BMD values, with an accuracy rate of 89% in predicting low bone density and osteoporotic conditions. However, many diagnostic or treatment planning applications rely heavily on the precise localization of bony structures in CT images. In addition, manual or semiautomatic bone segmentation can be labor-intensive and time-consuming, which is often not practical in clinical routine. Specifically, detecting the cortical region of the metacarpal bone is particularly challenging due to the similarity in values between the intramedullary components and the narrowest transverse diameter of the metacarpal bone shaft. As a result, accurately identifying and locating intramedullary components in the metacarpal bone area is difficult, often leading to issues of over-segmentation or incomplete segmentation.

2. Related Work

Over the past few decades, researchers have developed numerous sophisticated automatic medical image segmentation methods. Indeed, the smart utilization of CNN feature engineering has swiftly progressed in areas like object detection, image segmentation, and classification [20,21,22,23,24]. With the advancement of medical image segmentation, many deep-learning-based network models have been proposed, and it has been demonstrated that deeper networks are better suited for image segmentation tasks [25,26,27]. In [28], a Lightweight U-Net Architecture Multi-Scale Convolutional Network was presented. Experimental results demonstrated strong performance in segmenting hand bones, particularly for the smaller bones in the hand. However, during the training of deep models, issues such as gradient explosion or vanishing can make training deep models challenging. Currently, optimized activation functions like ReLU (Rectified Linear Unit) are used to address such problems [29]. Based on the above, while the aforementioned methods proved effective for many X-ray image segmentation tasks, their direct application to clinical data reveals insufficient accuracy and robustness. This limitation markedly impedes the broader application of deep-learning methods in clinical bone density analysis.
This study aims to address the limitations of the traditional U-Net in automatic bone segmentation. We proposed an end-to-end CKD-MBD classification framework named SER-U-Net, which incorporates lossless image compression and a squeeze-and-excitation deep residual network (SE-ResNet). This framework embeds the squeeze-and-excitation network (SENet) as a substructure within the residual network. Finally, image segmentation is accomplished based on U-Net. Here, we refer to this model as SER-U-Net. In summary, the aim of this study is to utilize X-ray images of the hand’s metacarpal bones obtained through commercially available low-dose hand X-ray testing instruments. Subsequently, through the established SER-U-Net model, the metacarpal bone region will be automatically selected and cortical bone thickness calculated, as shown in Figure 1. Finally, the correlation between this value and DXA bone density assessment results will be tested. We define our subjects as long-term kidney dialysis patients, as they are at higher risk for renal osteodystrophy or osteoporosis. Suspected osteoporosis patients can undergo full-body bone density scans promptly via DXA instruments and initiate appropriate treatment when necessary.
Overall, the proposed method not only reduces the radiation exposure and costs associated with DXA but also provides a rapid and effective tool for assessing CKD-MBD in clinical settings, potentially leading to better patient outcomes. In summary, this research makes the following contributions:
(1)
Demonstrating the use of SE-ResNet for preprocessing hand X-ray images, replacing standard convolution layers with residual structures, and incorporating batch normalization layers to facilitate faster convergence, address the gradient vanishing problem, and improve metacarpal cortical segmentation accuracy by training deeper networks.
(2)
Demonstrating the accuracy of our system through automated dMCP calculations and assessing its correlation with clinical longitudinal data of kidney disease patients’ hand X-ray images and the DXA dataset.
These contributions collectively enhance the effectiveness and precision of metacarpal cortical segmentation and provide a valuable tool for assessing the condition of long-term kidney disease patients.

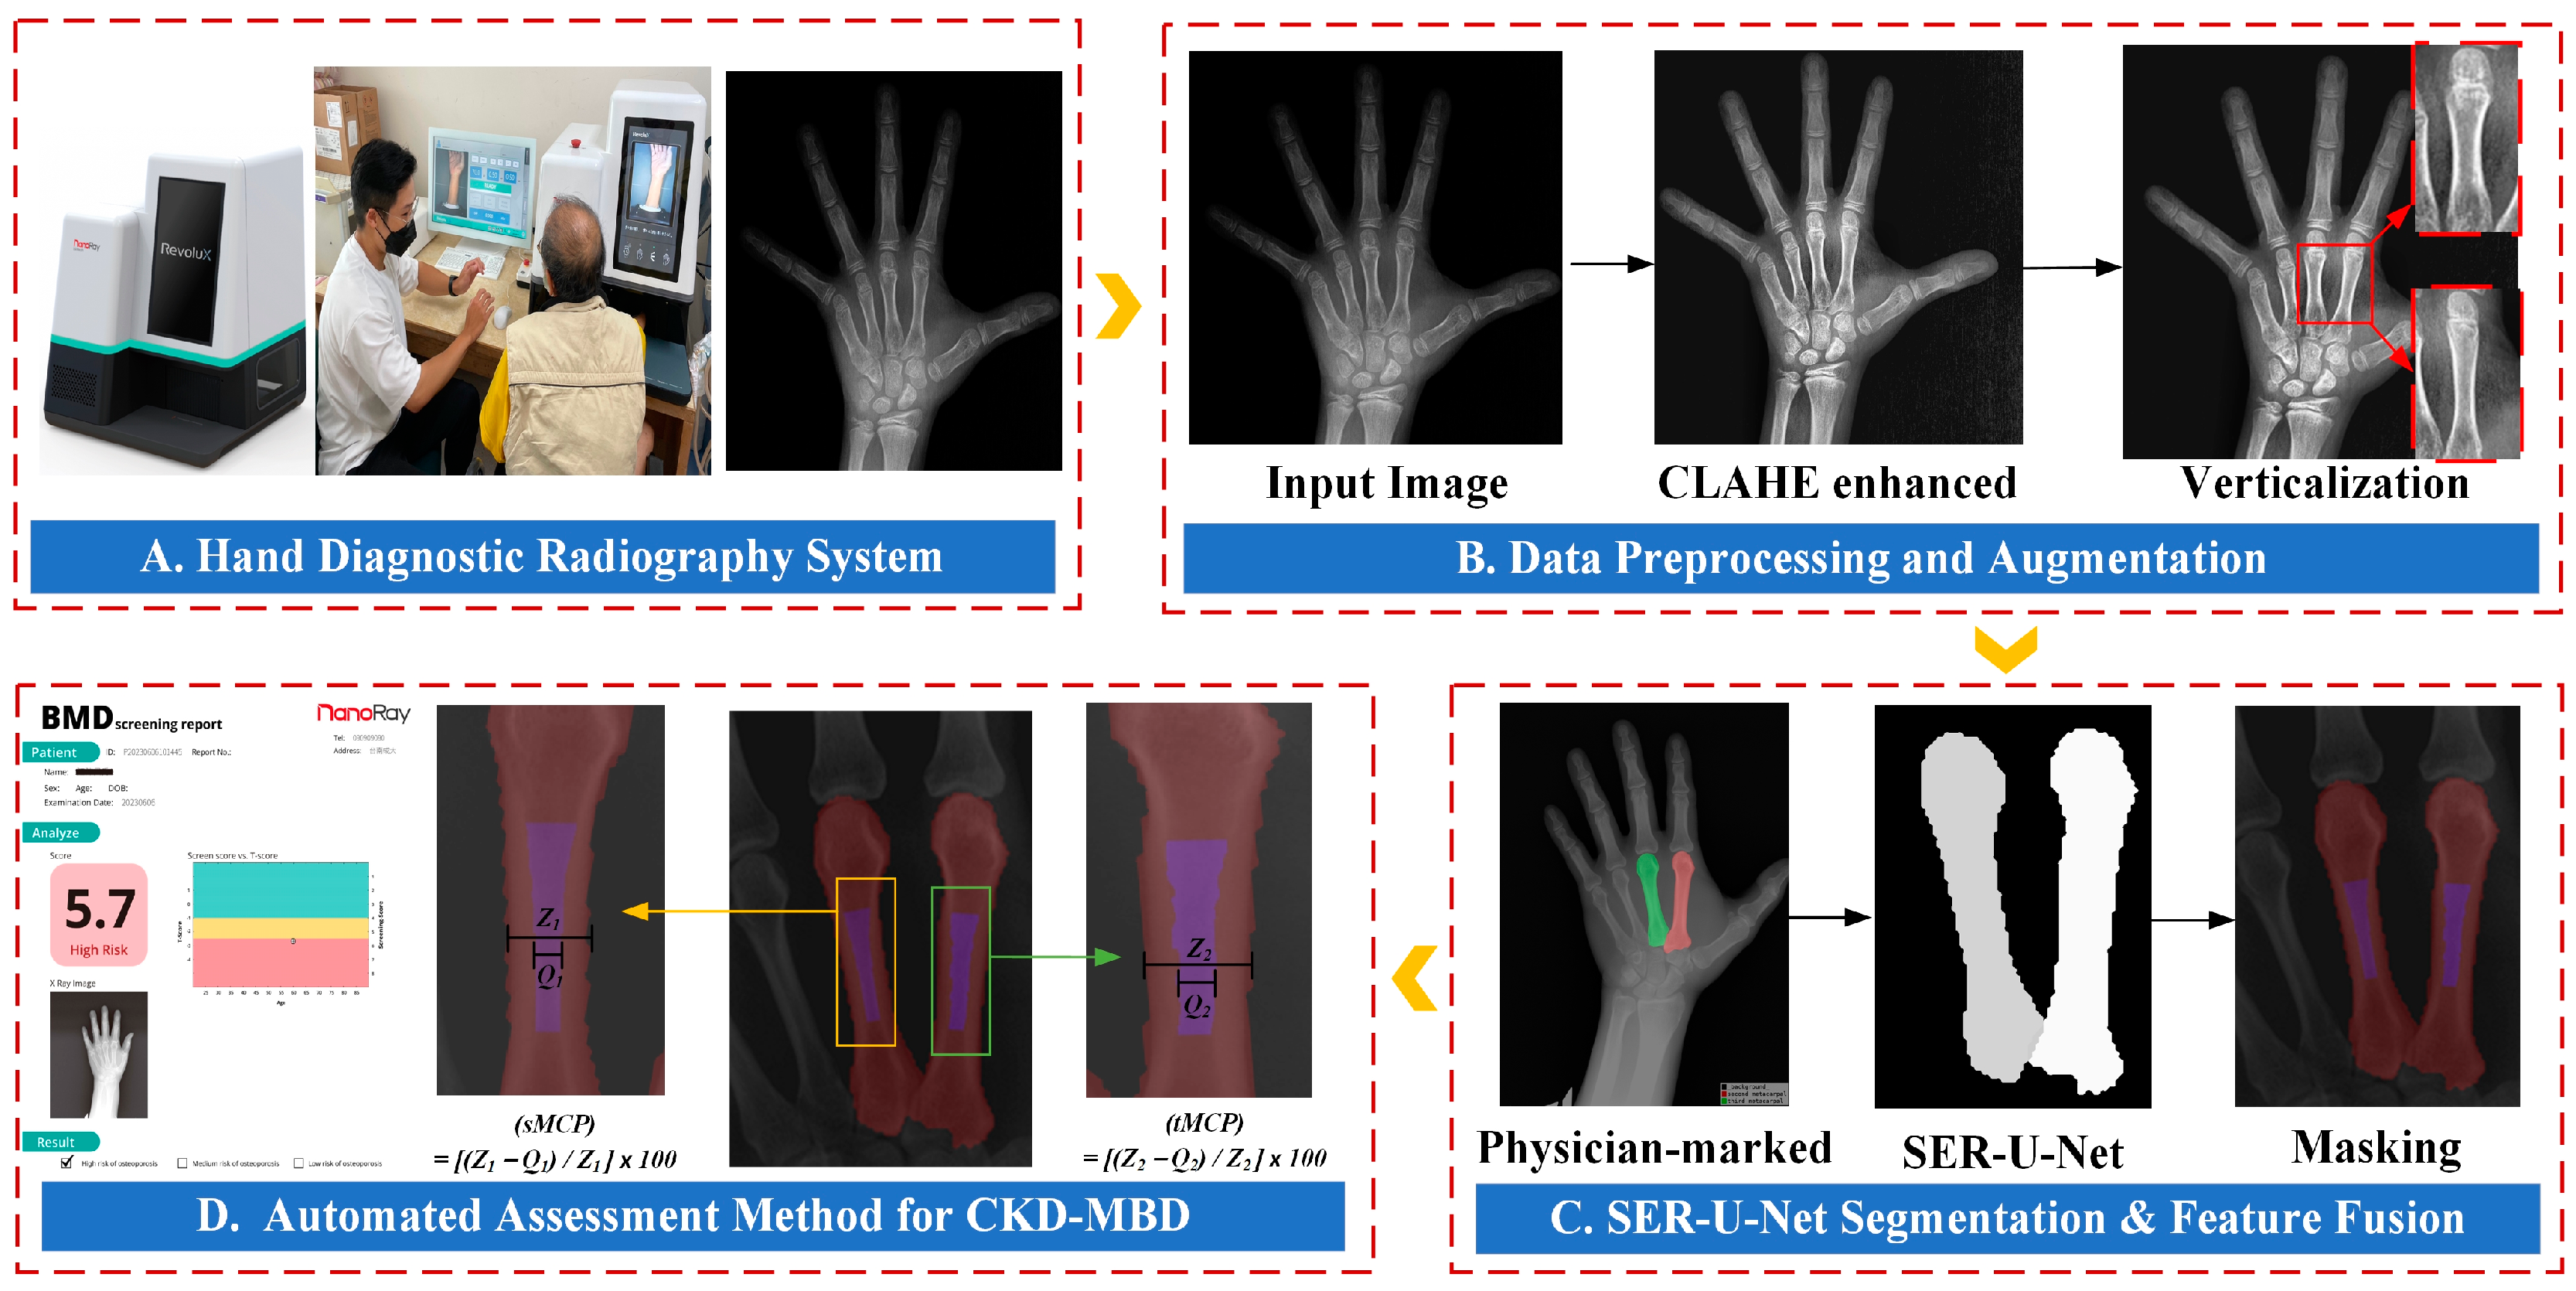
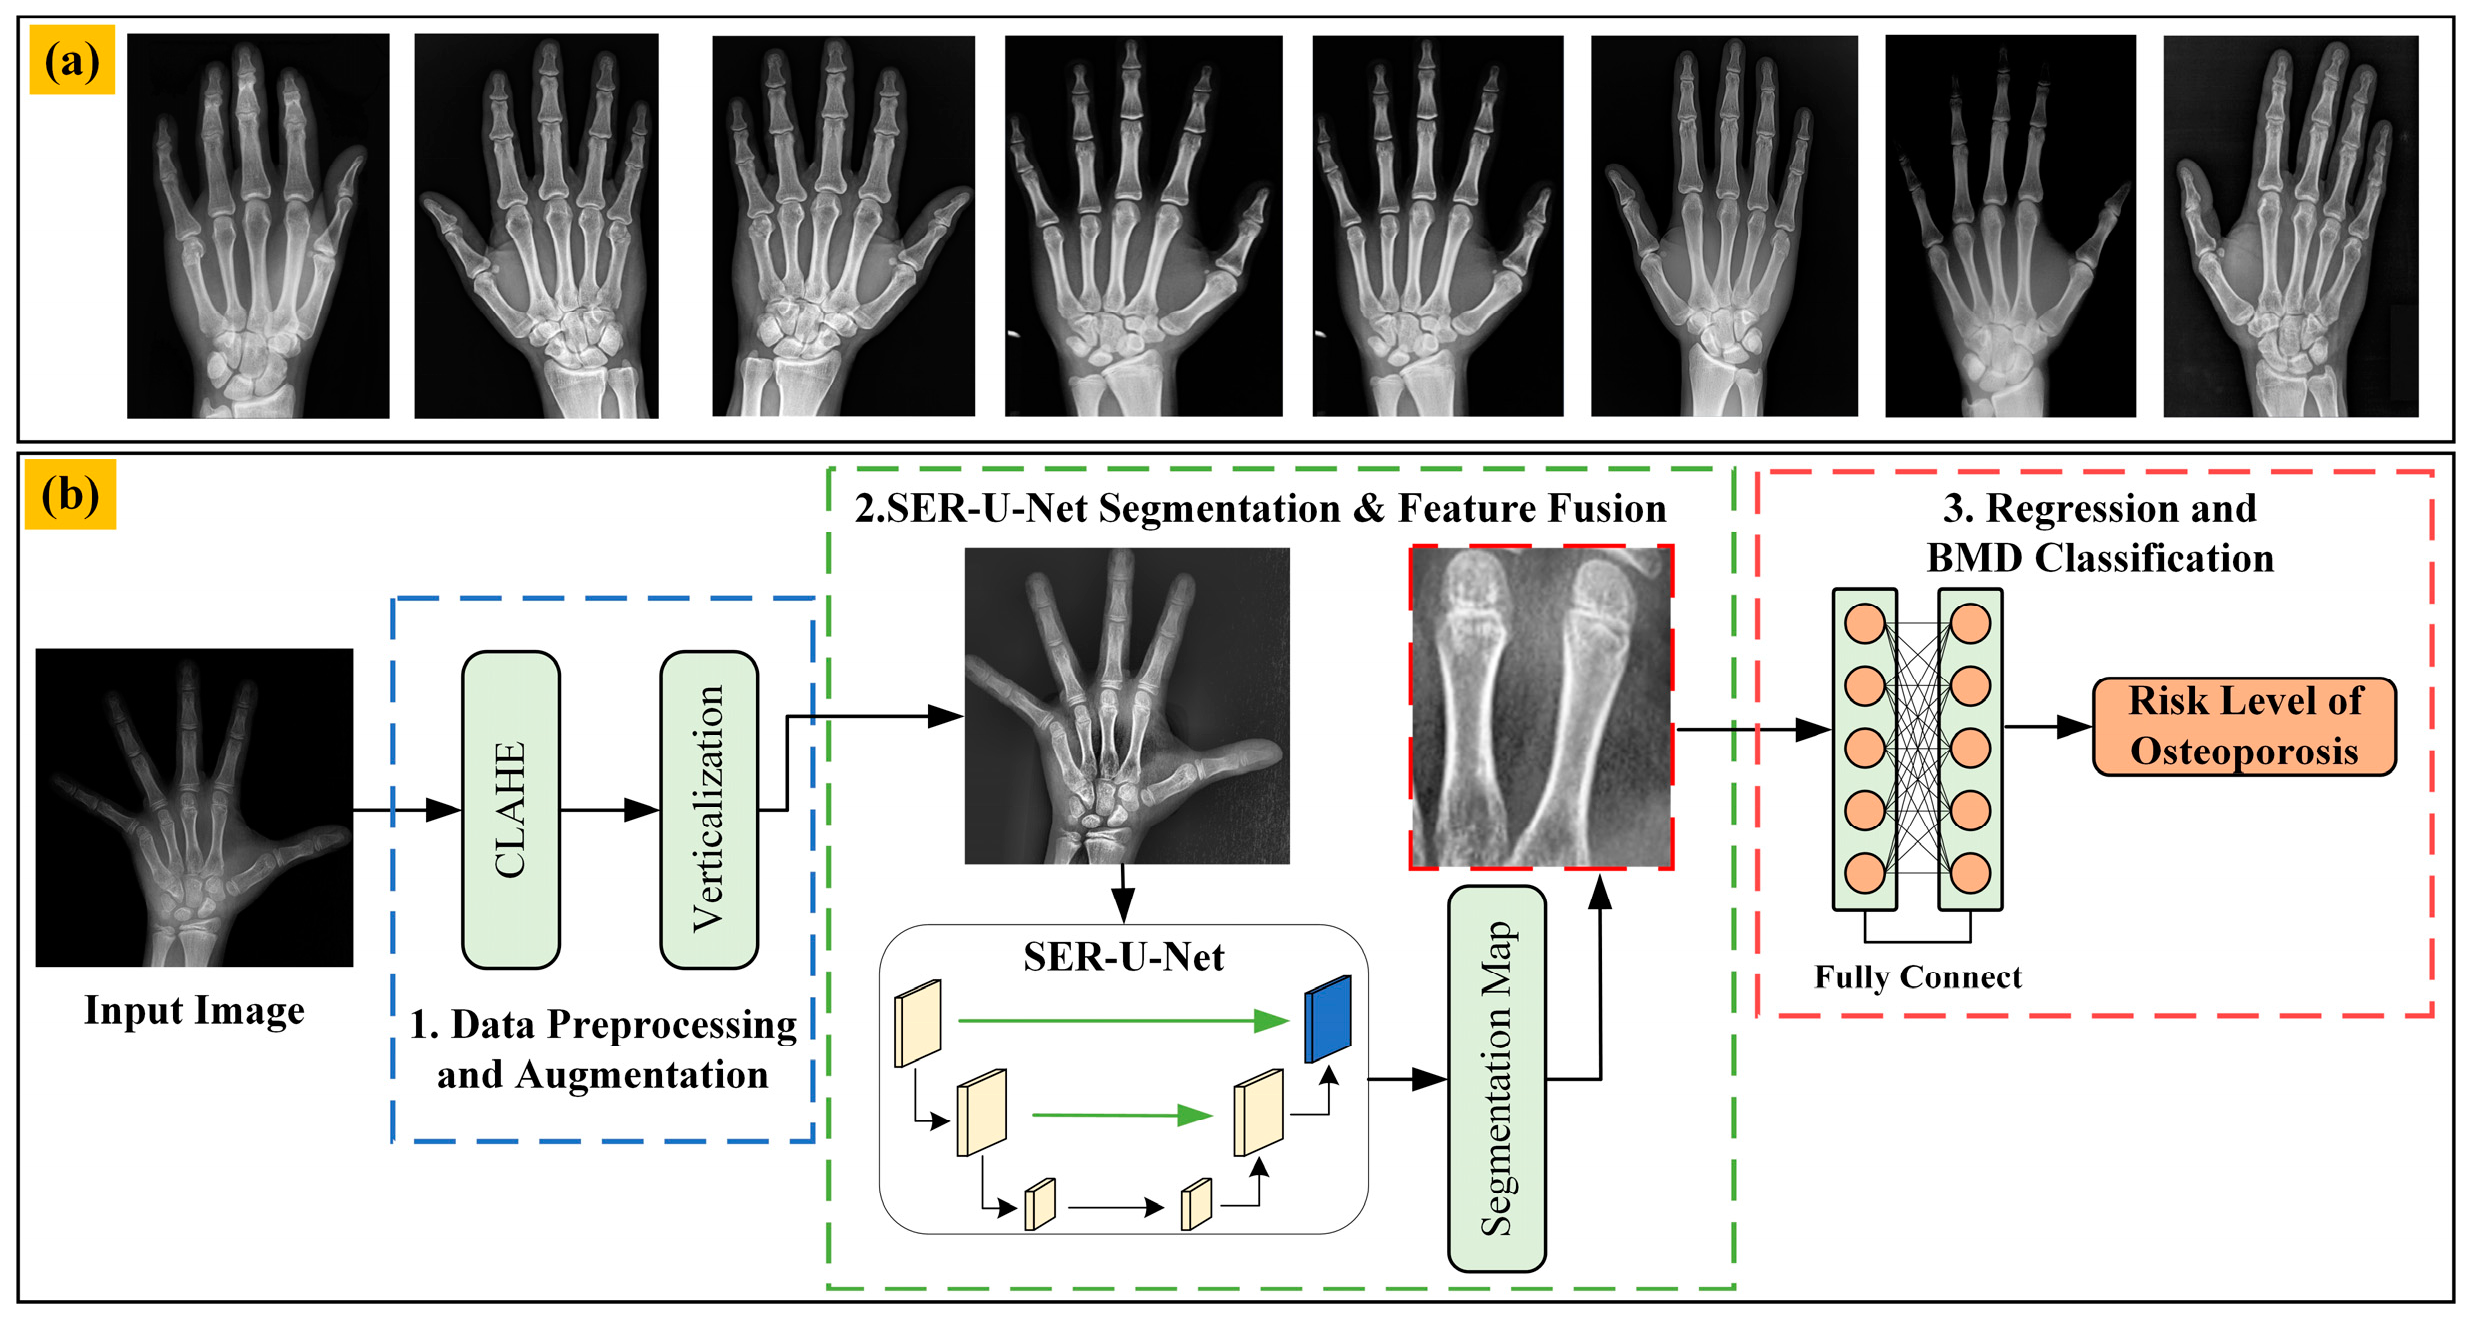
3. Materials and Methods

3.1. Datasets from the Public Internet

The training of CKD-MBD models with clinical image data or open-source computer vision datasets has been relatively limited. However, the Radiological Society of North America (RSNA) provided a significant dataset for their 2017 bone age challenge, consisting of 14,236 hand X-ray images. This dataset is divided into 12,611 images for training, 1425 for validation, and 200 for testing [30]. From the training set, we randomly selected 1500 images of left and right hands as the training set. Following equalization and data augmentation, the images were employed to train the model to identify and label the second and third metacarpal regions of the hand bones. Finally, we randomly selected 140 images from the test set and combined them with the 60 hand X-ray images obtained from the IRB test as the final test set. Figure 2 shows the samples from this combined dataset of 200 images.

3.2. Data Preprocessing and Augmentation

Due to inter-individual variations among patients, such as rheumatoid arthritis, osteoporosis, inflammation, and surgery, X-ray images acquired may exhibit differences in metacarpal grayscale contrast. During the preprocessing stage, the contrast-limited adaptive histogram equalization (CLAHE) method was utilized to improve the contrast and clarity of the images, as shown in Figure 3a. CLAHE works on small regions of the image, enabling it to adaptively enhance contrast based on local variations. This characteristic ensures that fine details in the X-ray images, such as the cortical boundaries of the metacarpal bones, are preserved and enhanced, leading to improved model performance in detecting and segmenting these regions [31,32]. Subsequently, in order to rectify the inconsistency in the output X-ray images due to variations in the positioning of patients’ wrists during X-ray capture, a vertical alignment classification approach was employed for metacarpal bone standardization in the X-ray images. A total of 200 original posteroanterior (PA) hand images, including both left and right hands, were subjected to normalization. In this study, an affine transformation CNN based on LeNet was utilized as the model. Within this mixed dataset, 10% of the images were used for validating the alignment of the metacarpal bone axis relative to the vertical direction (as shown in Figure 3b, while the remaining data were used for model training. In the process of verticalization, image correction is performed between points, 45° and 60°, with adjustments made at intervals of 3° each time. Finally, the excess uninterested background and the ulnar region were cropped to ensure the preprocessed output image size was 512 × 512 × 1.

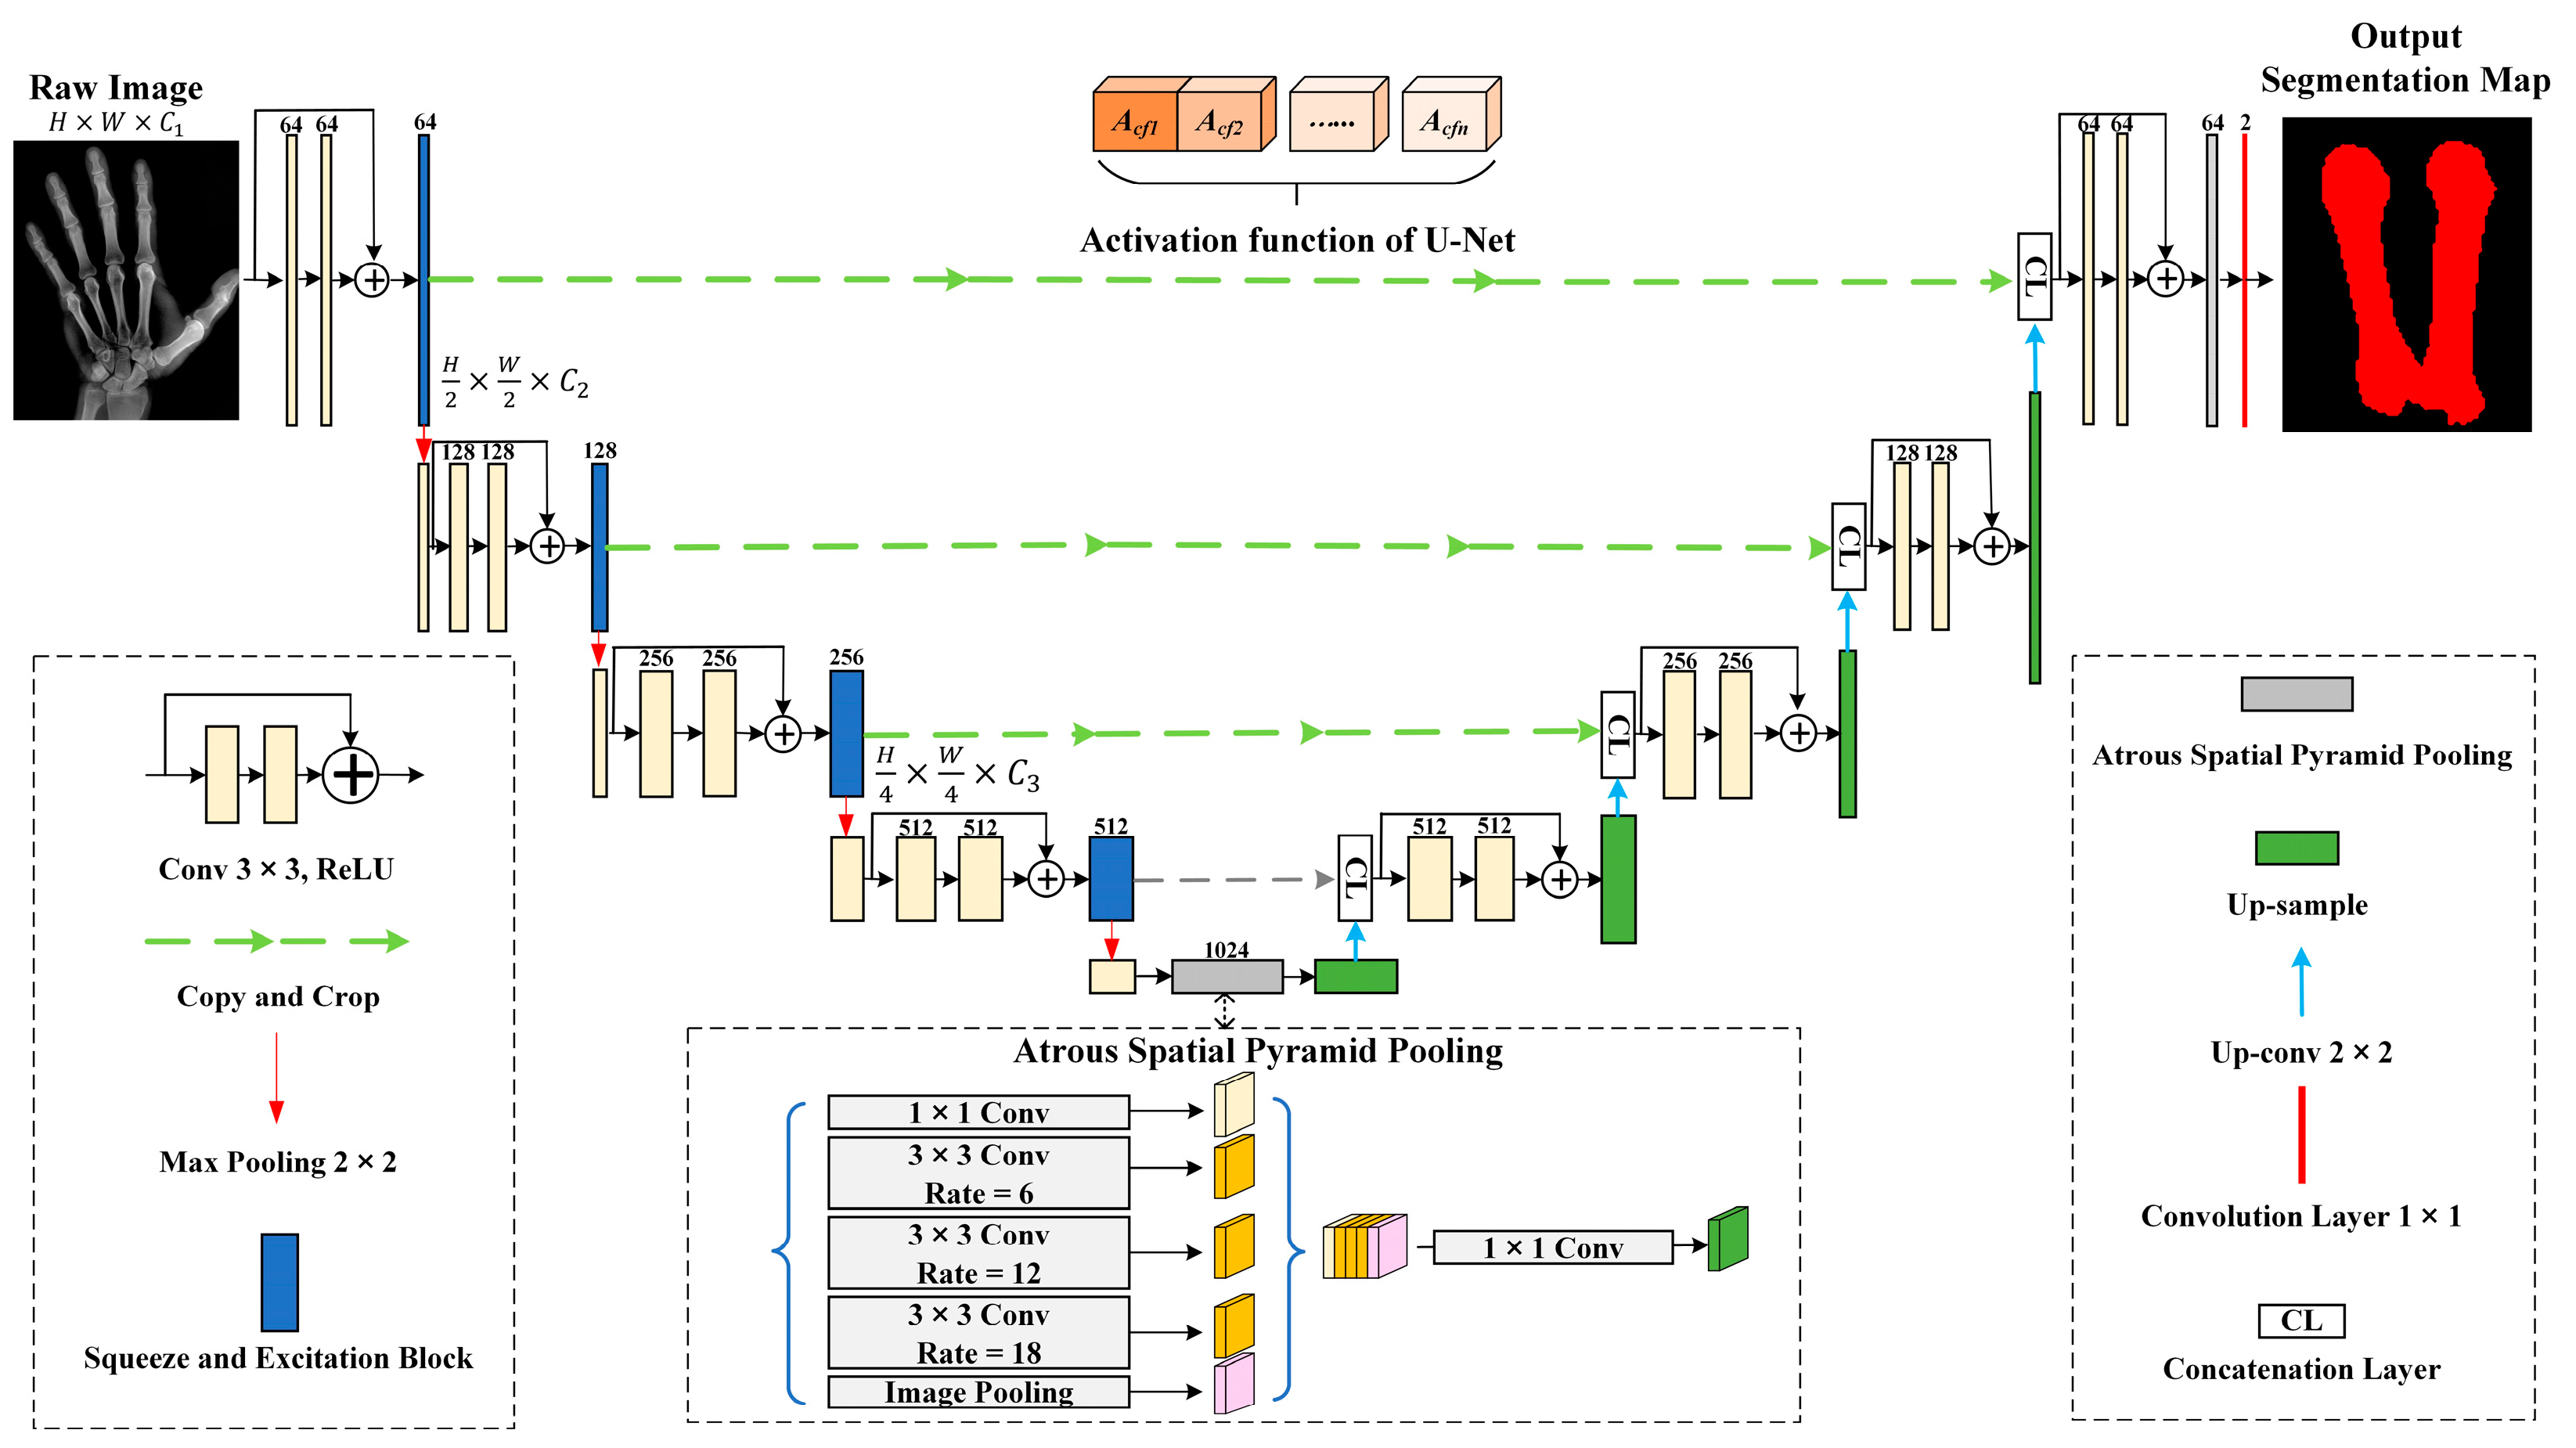
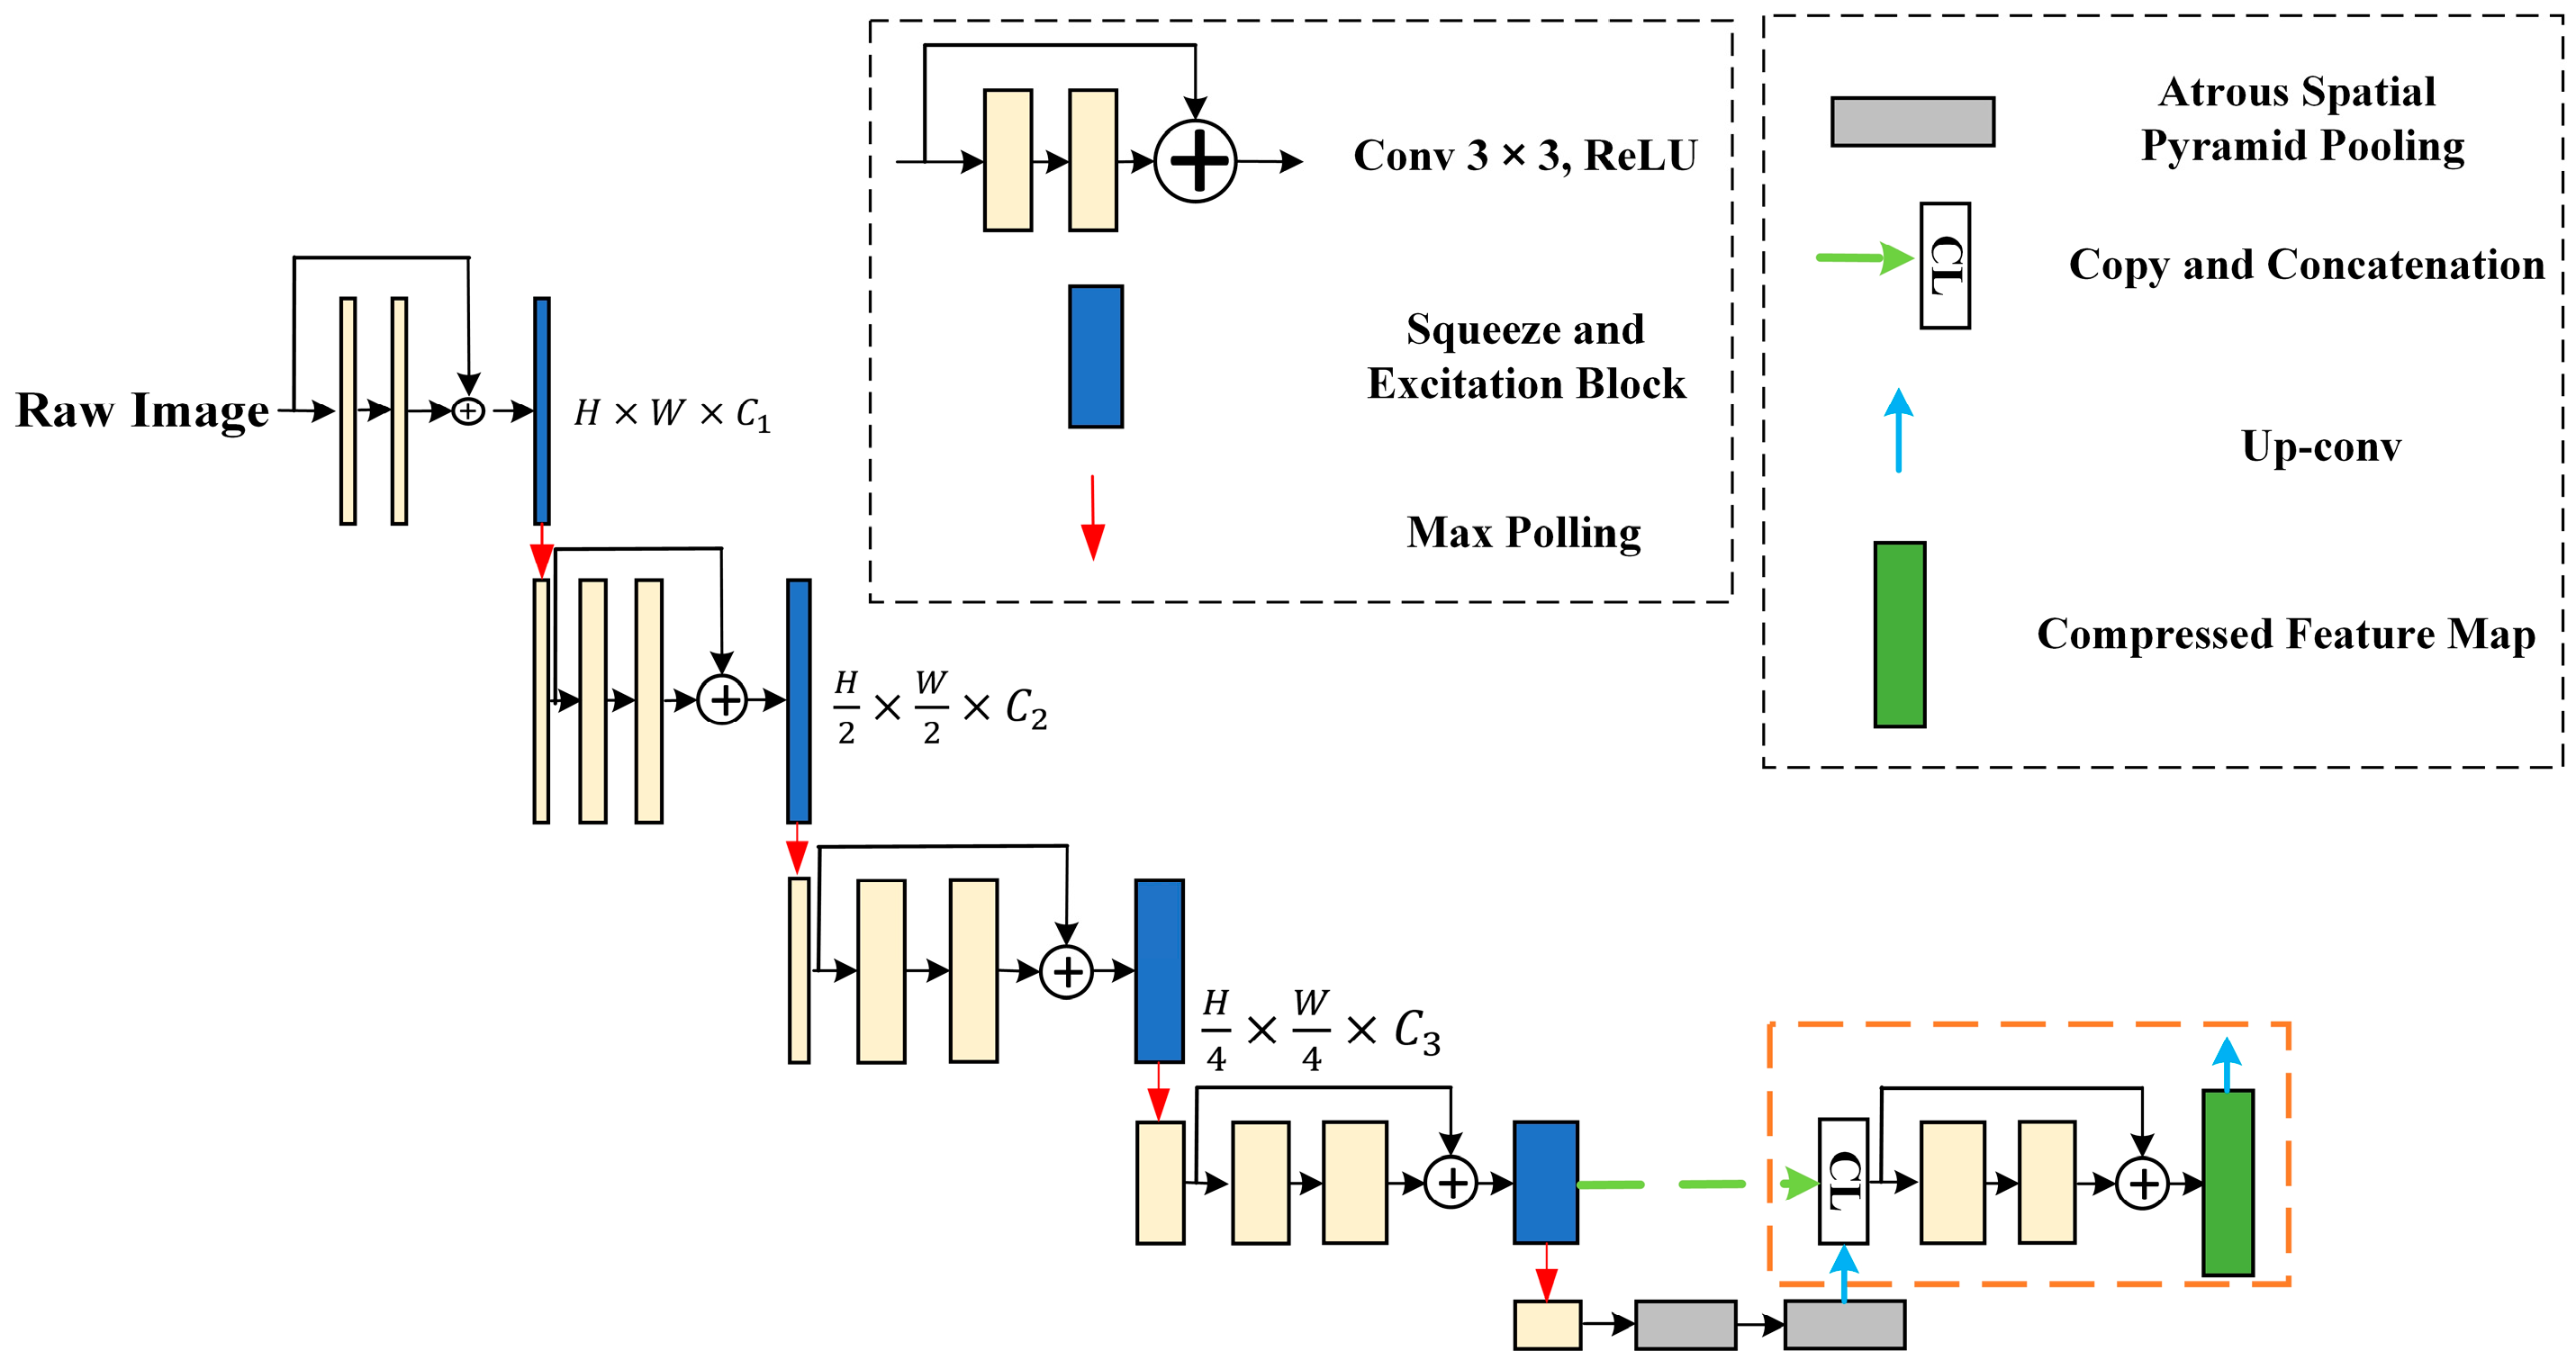
3.3. SER-U-Net Architecture

The SER-U-Net architecture proposed in this study is based on a symmetric structure composed of an encoder and decoder. The process involves compression, SE-ResNet, U-Net segmentation network, regression, and loss functions, as depicted in Figure 4. The overall architecture comprises 8 residual blocks, 4 sets of pooling layers, 4 squeeze-and-excite (SE) blocks, 2 atrous spatial pyramid pooling (ASPP) blocks, and 4 up-sampling blocks. The convolution layer utilizes a kernel size of 3 × 3, while the pooling operation is performed with a size of 2 × 2. Throughout the process, images undergo feature extraction at each stage through a 3 × 3 convolution layer and are enhanced with ReLU activation functions and batch normalization. The former adds nonlinearity to improve recognition, while the latter speeds up model convergence. After repeating this process twice, down-sampling to the next stage is carried out using a 2 × 2 max-pooling layer (MPL). MPL retains the maximum feature value in each pool, reducing the model parameters and mitigating overfitting issues. After four stages of MPL and down-sampling, a 3 × 3 convolution layer is applied, and the result is passed to a transpose convolution layer for decoding. The decoding process is similar to the encoding process but with the additional step of feature fusion. After each deconvolution, the output is combined with some of the features from the encoding with the same channel dimensions. This fusion helps compensate for the lost features during the down-sampling process. The final output undergoes a 1 × 1 convolution layer followed by a Sigmoid function to classify the defined classes, effectively labeling the masks for the 2MC and 3MC regions and ensuring accurate identification and localization of these areas. Overall, the final objective depicted in Figure 4 is to demonstrate the process of segmenting the 2MC and 3MC regions of the hand from the input images. The process involves multiple steps, including compression, SE-ResNet enhancement, U-Net segmentation, regression, and application of loss functions.

3.3.1. X-ray Image Compression Module for Feature Extraction

Previous research findings suggest that larger input image sizes during the model training process may result in enhanced outcomes, as shown in Table 1 [33]. However, an excessively large input size can lead to extended training times and potential training failures. Because of the large size of the X-ray image, there are numerous blank areas surrounding the hand region. Therefore, two issues must be addressed during the preprocessing stage. First, the images contain a lot of meaningless blank areas outside the hand region, and the features of these areas are also learned during the training stage, leading to a waste of computational resources. Second, the segmentation of hand bones using X-ray images typically focuses on a few specific regions, which are much smaller in size compared to the entire image. Blindly reducing the image size can result in the loss of essential metacarpal bone features, thereby decreasing the accuracy rate. Hence, it is vital to maintain the data size within a specific range for the feature extraction network. Preserving the original image features as much as possible enhances subsequent bone density analysis. We executed compression and feature extraction of the original X-ray image within the compression module to achieve this. This module compressed the image to a particular size without compromising critical features. The structure of the compression module is illustrated in Figure 5.
In Figure 5, the process entails adjusting image dimensions through convolution and pooling, achieving initial feature selection via up-sampling and shallow feature fusion. After passing through two convolutional layers with a 3 × 3 kernel, the input data transitions from H × W × 3   t o   H × W × C 1 , where C 1 represents the number of channels. Subsequently, it undergoes max-pooling to compress its size to H 2 × W 2 × C 2 . When it reaches a specific size, feature fusion and extraction take place. In this study, the final size of the feature map is H 4 × W 4 . The purpose of this module is to retain critical features while eliminating redundant spatial information to reduce the original image size, thereby shortening training time and ensuring the preservation of essential features.
After the compression, the segmentation network employed enhances adjustments through the activation function defined in Equation (1) and selects the optimal U-Net segmentation method. This process takes into consideration an objective approach based on entropy and variance. During the execution of U-Net image segmentation, the model requires the provision of minimum variance and maximum entropy, representing the segmentation of the background and the specified metacarpal region, respectively.
A u c =   { A c f 1 ,   A c f 2 , ,   A c f n } arg min          1 Q t + A r c
where the activation function { A c f 1 , A c f 2 , ,   A c f n } was selected by an algorithm that aims to maximize entropy and minimize variance. Entropy was defined as the corresponding states of adaptative intensity levels within each pixel, and it can be expressed using Equation (2). Variance is calculated as the square of the standard deviation of the input or output image values, and it can be represented using Equation (3).
Q t = u W N u log 2 W N u
A r c = σ 2 = ( M A t ) 2 M P
The above process describes the optimization of a U-Net for segmentation that was suitable for various input images. The numerical values of image pixels are denoted by MA, the average pixel value is represented by t, and the pixel count is indicated as MP.

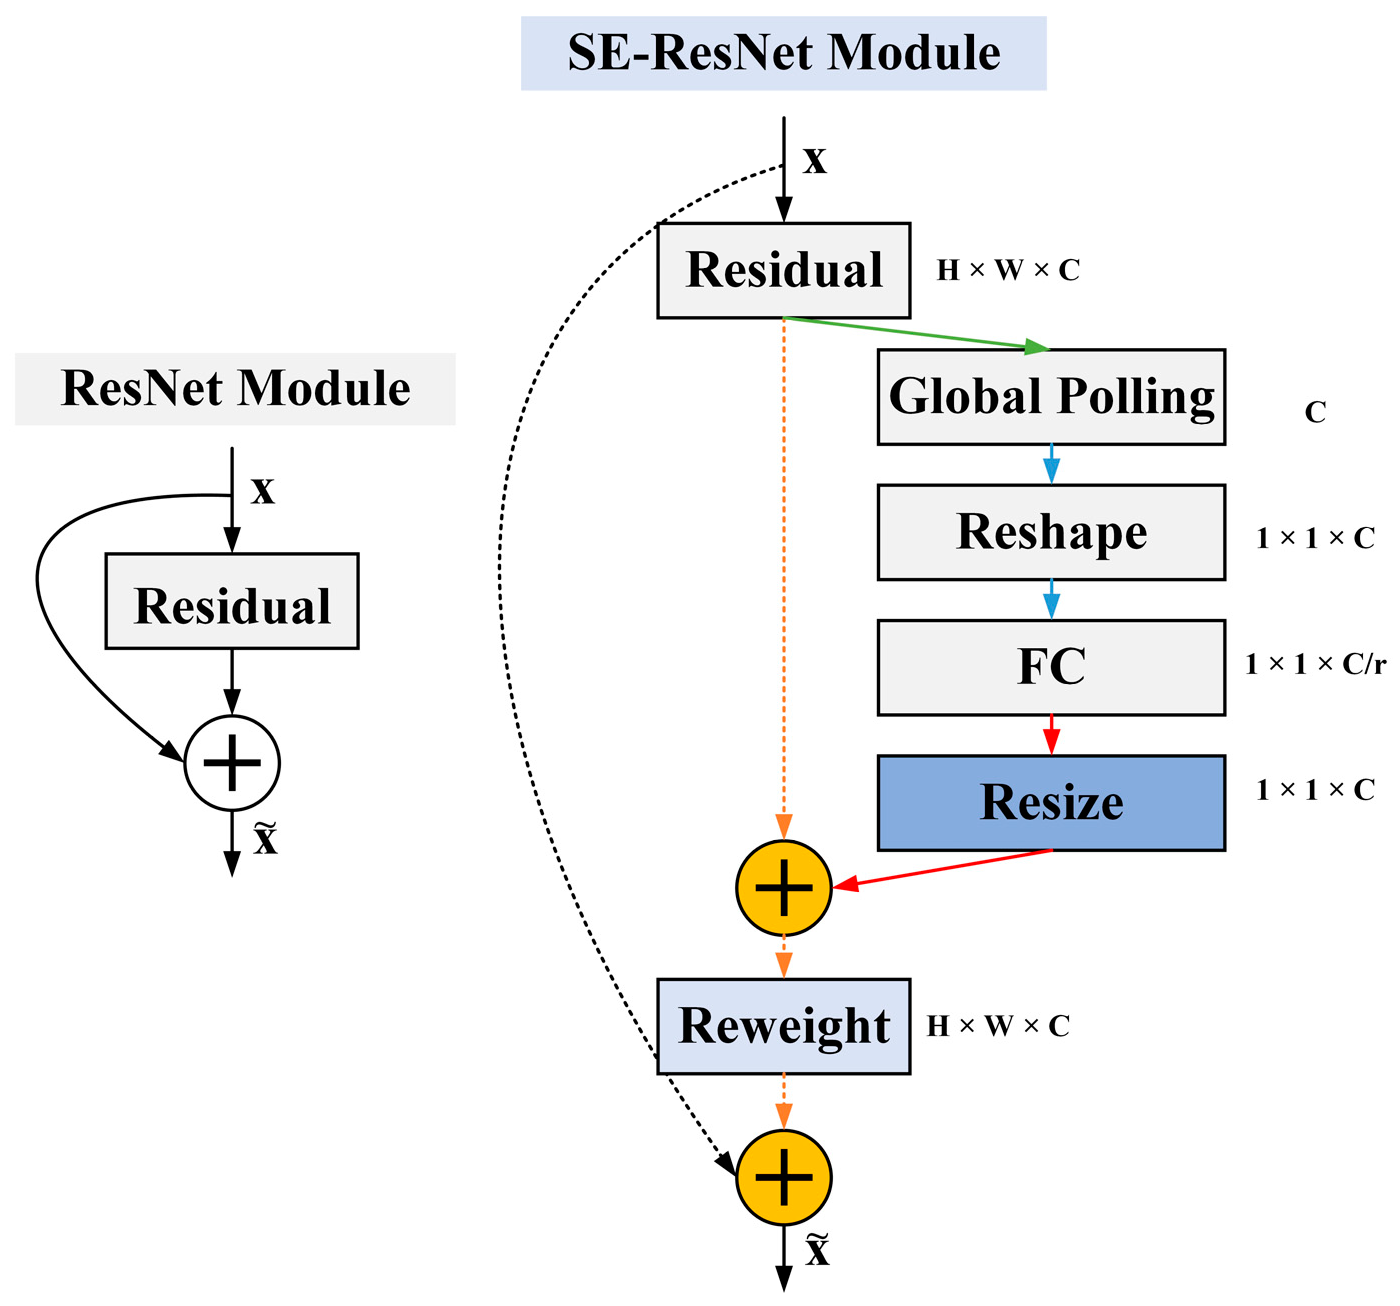
3.3.2. Associating and Learning Features between Channels with SE-ResNet

CNNs have demonstrated superiority in computer vision tasks, and through the use of the SENet, they can connect and learn interchannel features, thereby enhancing feature information and recalibrating strategies to improve the performance of CNN models [34]. In the SE model, input information is compressed using the squeeze operator, which employs global average pooling to create statistical channels. Activation processing involves two fully connected layers, incorporating nonlinearity and ReLU. During this phase, the activation operator assigns weights to the input data, generating weight channels, while the size of feature channels remains consistent through the squeeze and activation operators. Residual blocks in ResNet effectively utilize shallow features to extract more critical features and have been frequently employed as the primary structure for feature extraction in image classification and recognition tasks [35]. Therefore, in this study, we decided to integrate the SE block into the ResNet model, resulting in the SE-ResNet module, as illustrated in Figure 6. In this module, the SE operation takes place before the summation operation [36].
In Figure 6, the ResNet residual blocks incorporate an SE structure. This method not only maximizes the utilization of shallow features but also enables additional channel-wise reweighting of these shallow features, thereby enhancing the extraction of crucial features. Consequently, the output of the SE-ResNet can be defined as (4).
y = F ( f s e x , ω n + x )
where x and y represent the input and output of the SE-ResNet, f s e x stands for the function within the SE block, and ω n denotes the network weights for the n-th input. It is essential to delineate the feature scale images during the compression process. This significantly impacts the reweight values. Since each input feature image may have different dimensions, this paper proposes a scale that can be adjusted based on the dimensions of the feature channels. The output of the u-th SE-ResNet block is defined as (5).
y u = F f s e x u , w n u + x u
Following this, during the training of the U-Net, a pixel-wise loss function is typically established using the cross-entropy formulation. This function gauges the similarity between the predicted distribution and the ground truth distribution, as depicted by the following equation:
L p w = 1 n u = 1 n y ^ u log y u + ( 1 y ^ u ) log ( 1 y u )
where n is the number of samples, y i denotes the predicted probabilities of pixel u belonging to the metacarpal bone, and y ^ u is the ground truth, which is the real value. This particular loss function allows for the individual evaluation of each pixel. Compared to the quadratic loss, it could significantly expedite the training speed of neural networks.
In this study, the training process for the SER-U-Net model utilized the Adam optimizer, with an initial learning rate of 0.001. The learning rate decayed by a factor of 0.1 every 10 epochs to ensure gradual learning. The batch size was set to 16 images per batch, and the training process spanned 50 epochs. To prevent overfitting and ensure optimal training duration, an early stopping strategy was employed. Training was halted early if the validation loss did not decrease for five consecutive epochs, indicating that the model had reached its optimal performance.

3.4. System Evaluation Indicators

In the context of bone segmentation tasks in medical imaging, the dice coefficient (DC) is the most commonly used measurement [37]. DC is computed by directly comparing binary masks of the ground truth and automatic segmentation. It serves as a means to assess the reproducibility of segmentation when the same or different individuals perform multiple segmentations of X-ray images. As shown in Equation (7), the DC value falls within the range of 0 to 1, where a value of 1 indicates a perfect match, and 0 indicates no overlap whatsoever. In addition to the DC, several area error metrics are also computed to provide a comprehensive evaluation of the proposed segmentation method. The similarity index (SI), as determined in Equation (8), serves as a general measure of the automatic segmentation’s resemblance to the ground truth. Simultaneously, the true positive ratio (TPR) can be computed using B d B m B d , and the false positive ratio (FPR) can be calculated via B d B m B d B d . Finally, the false negative rate (FNR) can be derived as 1 T P R based on these metrics.
D C = 2 × B d B m B d + B m
S I = B d B m B d B m
In the above equation, B d represents the set of bone pixels from the ground truth, while B m represents the set of bone pixels obtained from automatic segmentation, as illustrated in Figure 7.
Finally, we summarize the algorithm for metacarpal segmentation as follows (see Algorithm 1):
Algorithm 1: dMCP segmentation
Input:
L = x 1 , y 1 ,   x n , y n : The training data consist of a sample n composed of annotations by medical professionals.
U = x n + 1 , x n + m :Representing the initial unlabeled data as a sample m.
Output:
C = θ 1 , θ 2 ,   θ k : Completed training of U-Nets.
Repeat:
  Step 1. Train the model on L using the loss function defined in Equation (1) to optimize the performance of C = θ 1 , θ 2 ,   θ k .
  Step 2. Assess the uncertainty among different U-Net models in the unlabeled data. We identify and select the data with the highest uncertainty.
  Step 3. Annotate the selected data and add them to the dataset, denoted as L.
Until: dMCP segmentation is satisfied on U.

3.5. Clinical Trial

This study received approval from the institutional review board at Kaohsiung Veterans General Hospital, Taiwan, ROC (IRB No. KSVGH22-CT10-29). A total of 30 participants were enrolled in this study (23 males and 7 females) with a mean age and standard deviation (SD) of 64 ± 9.1 (46 to 83 years old). Informed consent was obtained from each enrolled patient. Participants were arranged in order of their registration, and bone density analysis reports using a clinical DXA instrument (Hologic Co., Ltd., Horizon DXA, Marlborough, MA, USA) were obtained for all 30 cases. These reports, which include three different levels of bone density outcomes, were acquired through DXA measurements and confirmed by radiologists. Detailed information and exclusion criteria are presented in Table 2.
In the course of the IRB process, each subject underwent a minimum of one arm X-ray (NanoRay Co., Ltd., RevoluX, New Taipei City, Taiwan) examination, resulting in the acquisition of hand X-ray images for comparative analysis with the bone density reports from the DXA instrument. During the imaging process, subjects followed the instructions of a radiologist to place their hand as flat as possible within the RevoluX machine, after which a radiographer operated the arm X-ray machine to capture a single X-ray image (with parameters set at 70 kV, 0.3 mA, 0.15 mAs). Each subject had a minimum of four X-ray images taken, including the anterior and posterior views of both the left and right hands. After the imaging, individual participant data, such as age, gender, and cumulative years of renal dialysis, were recorded. In the process, the X-ray images were expertly captured by an experienced physician and were annotated to designate the background, second metacarpal (2MC), third metacarpal (3MC), and the radius bone as 0, 1, 2, and 3, respectively, serving as the ground truth, as shown in Figure 8.

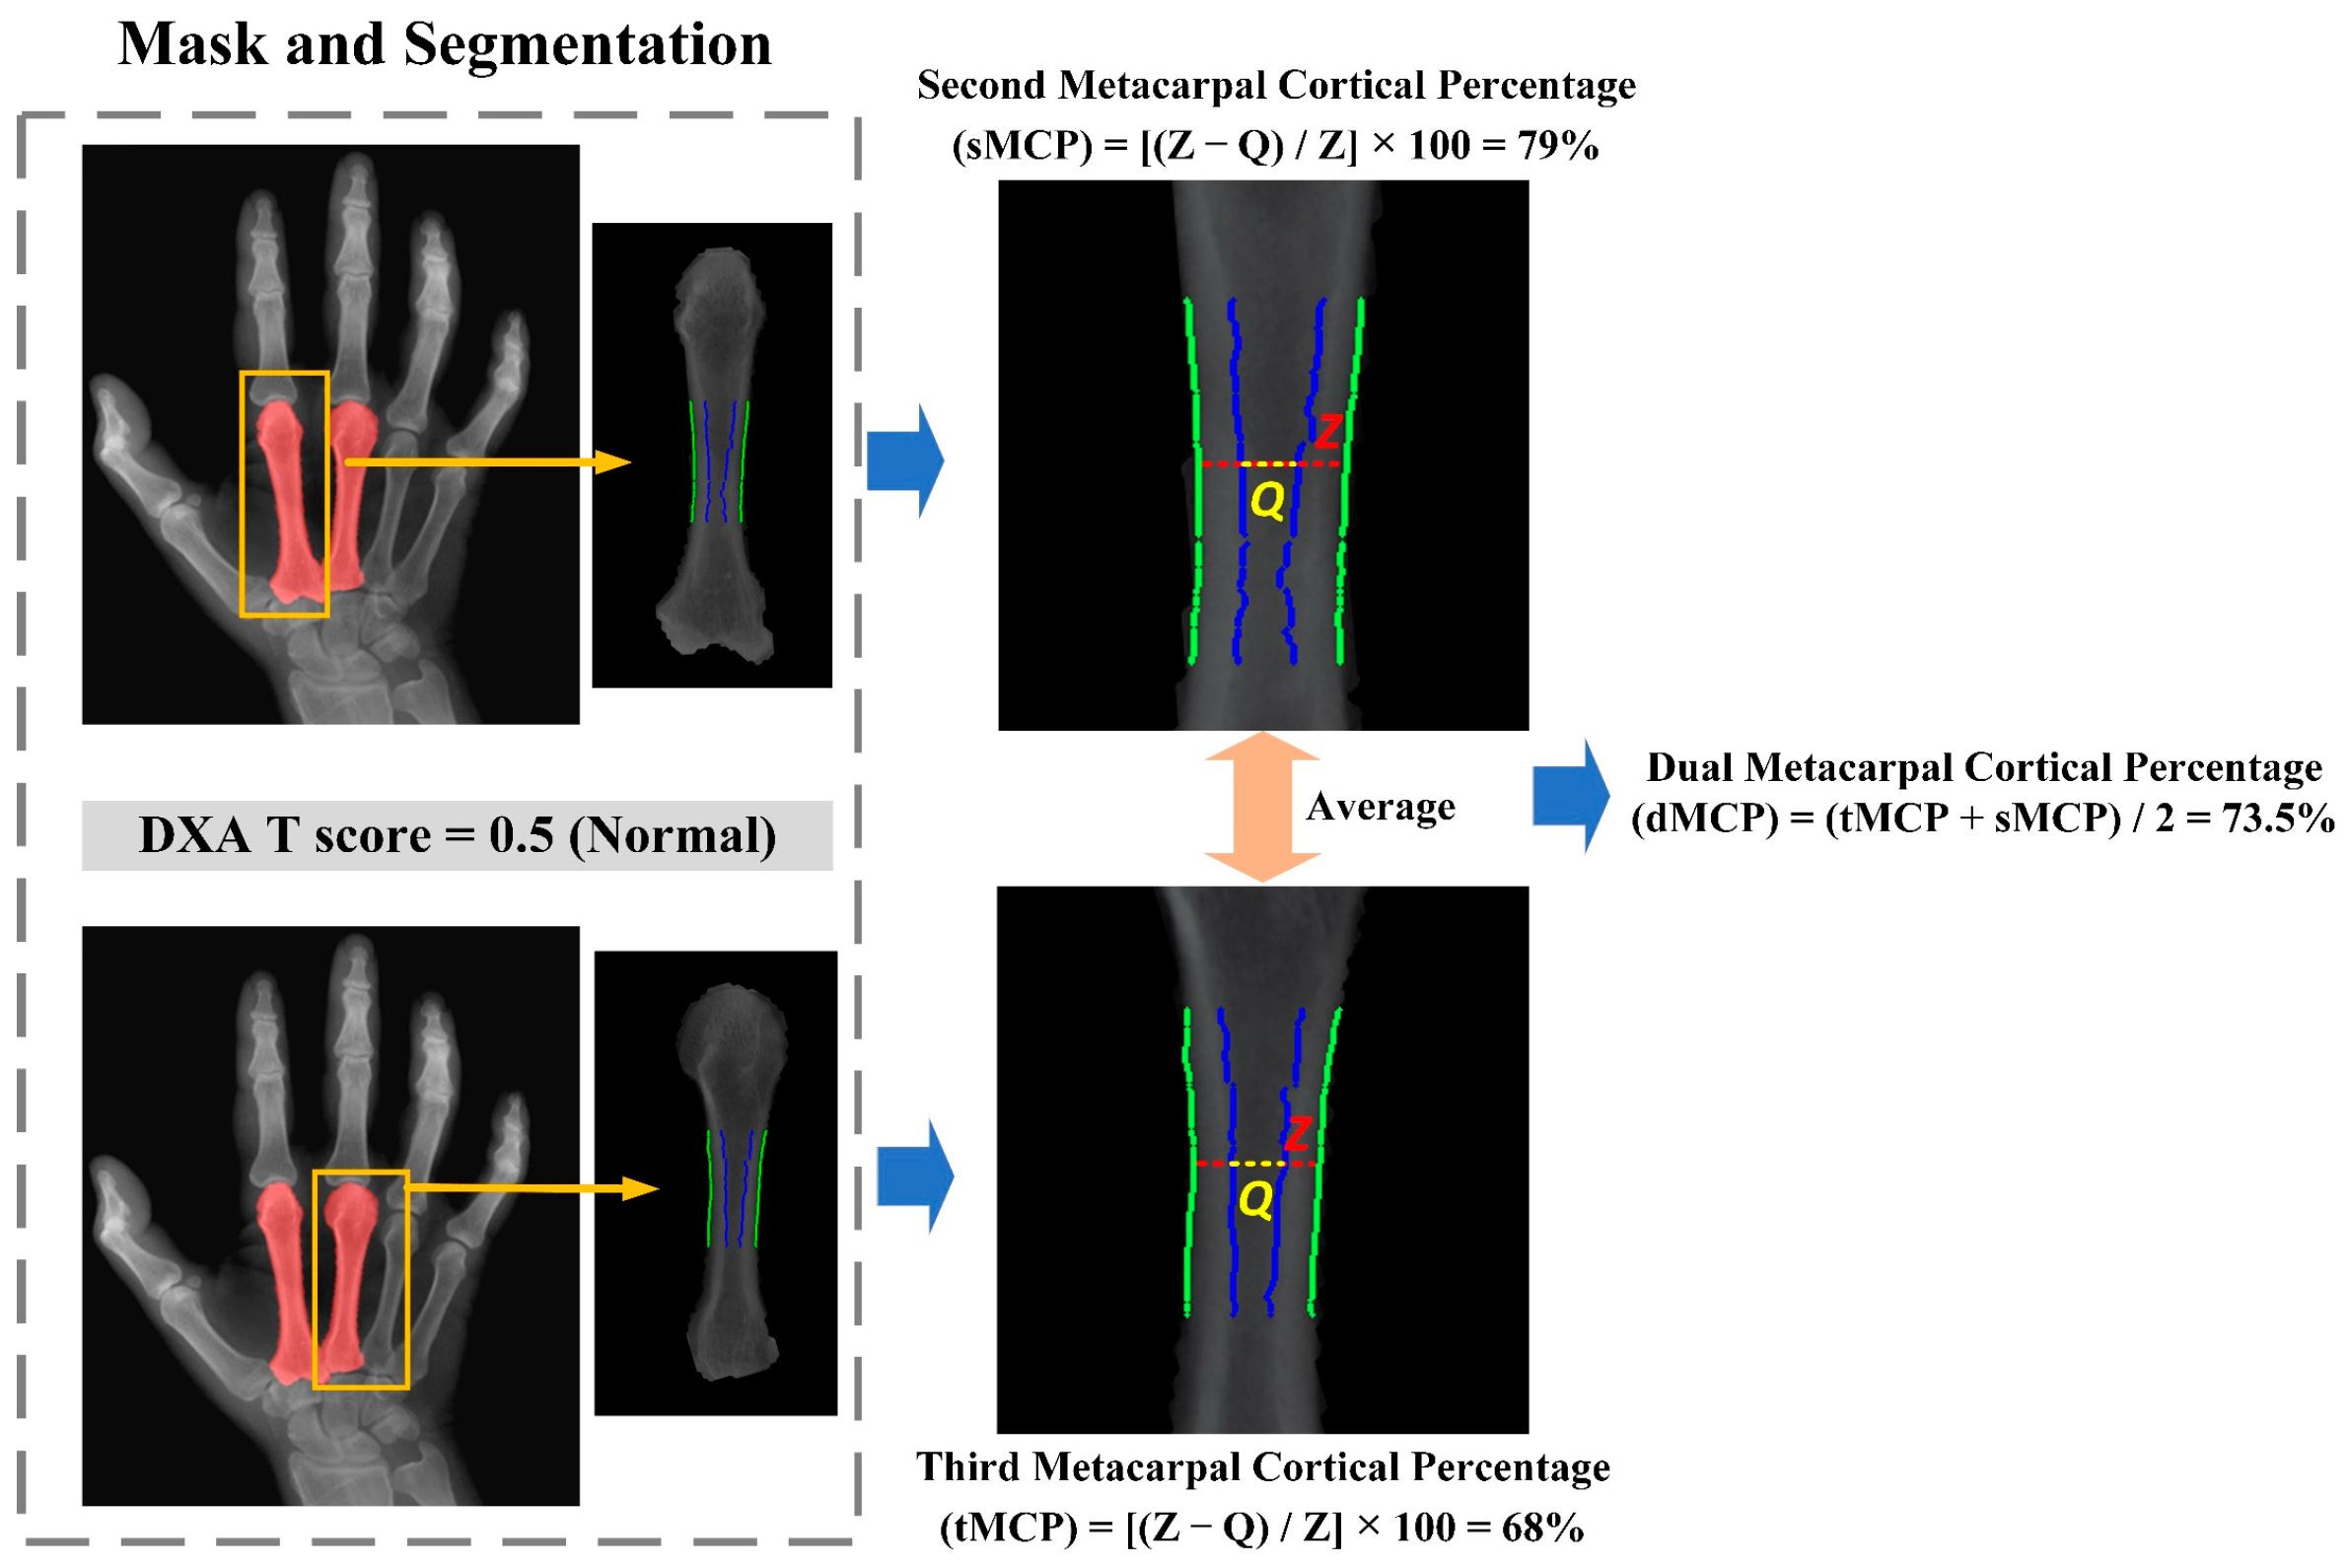
3.6. The Second and Third Metacarpal Cortical Percentage (dMCP) Calculation

After conducting bone region segmentation using a U-Net-based approach, the metacarpal cortical percentage computation process focuses on the central one-third of the metacarpals (Figure 9). Subsequently, the dMCP values, which are the average cortical percentage derived from the 2MC and 3MC regions, were calculated. Here, we utilized a weighted ratio distribution method. When the feature model detects a higher risk for osteoporosis features (MCP < 50) with 2MC or 3MC, the weight proportion for that metacarpal bone will be increased. To establish our test dataset, we obtained 120 hand X-ray images from 30 hemodialysis patients within a four-week period, with the approval of the clinical IRB. Among these, there were 8 cases of individuals with normal bone mineral density, 15 cases of low bone mass, and 7 cases of osteoporosis (including 1 severe osteoporosis by WHO criteria). From the 120 hand X-ray images, a radiologist manually selected the best-quality image for each patient’s arm. In the subsequent steps of the dMCP calculation process, the narrowest transverse diameter of the metacarpal bone shaft is identified as “Z”. A second parallel measurement is then performed for the intramedullary components at the same location, here referred to as “Q”. We employ the formula [(Z − Q)/Z] × 100 to derive the cortical percentage for both 2MC and 3MC, designated as sMCP and tMCP, respectively. Finally, the results are averaged to obtain the outcome of dMCP.

4. Results

4.1. Assessing the Proposed Segmentation Model’s Performance in Comparison to Other Models

To enhance the validation of the SER-U-Net model’s performance, we conducted a comparative analysis against several existing deep-learning methods, namely the original U-Net, SegNet, and FCN-8 [38,39,40]. Table 3 presents the performance of bone segmentation in our study using four different models. All models were tested on preprocessed 512 × 512 images with CLAHE. The experimental results reveal that the original U-Net, although excelling in the true positive region (TPR > 98%), struggles to effectively control the false positive rate (FPR > 15%). This suggests that during the deep network training, the original U-Net encompasses numerous non-target bone regions within its scope. In contrast, this study based on the SER-U-Net model leverages the SENet architecture to facilitate the model in learning interchannel correlations, emphasizing more crucial channel features and suppressing less important ones, resulting in an average DC of 96.62% and an average similarity of 94.48%. Overall, the SegNet model exhibits the poorest performance (DC < 85%, similarity < 75%). In summary, the SER-U-Net method achieves the highest segmentation accuracy in terms of SI and DC metrics. This has significant benefits for the detailed segmentation of smaller bones in the hand, such as the narrowest parts of the metacarpals and the intramedullary components, thereby achieving better dMCP calculation results.

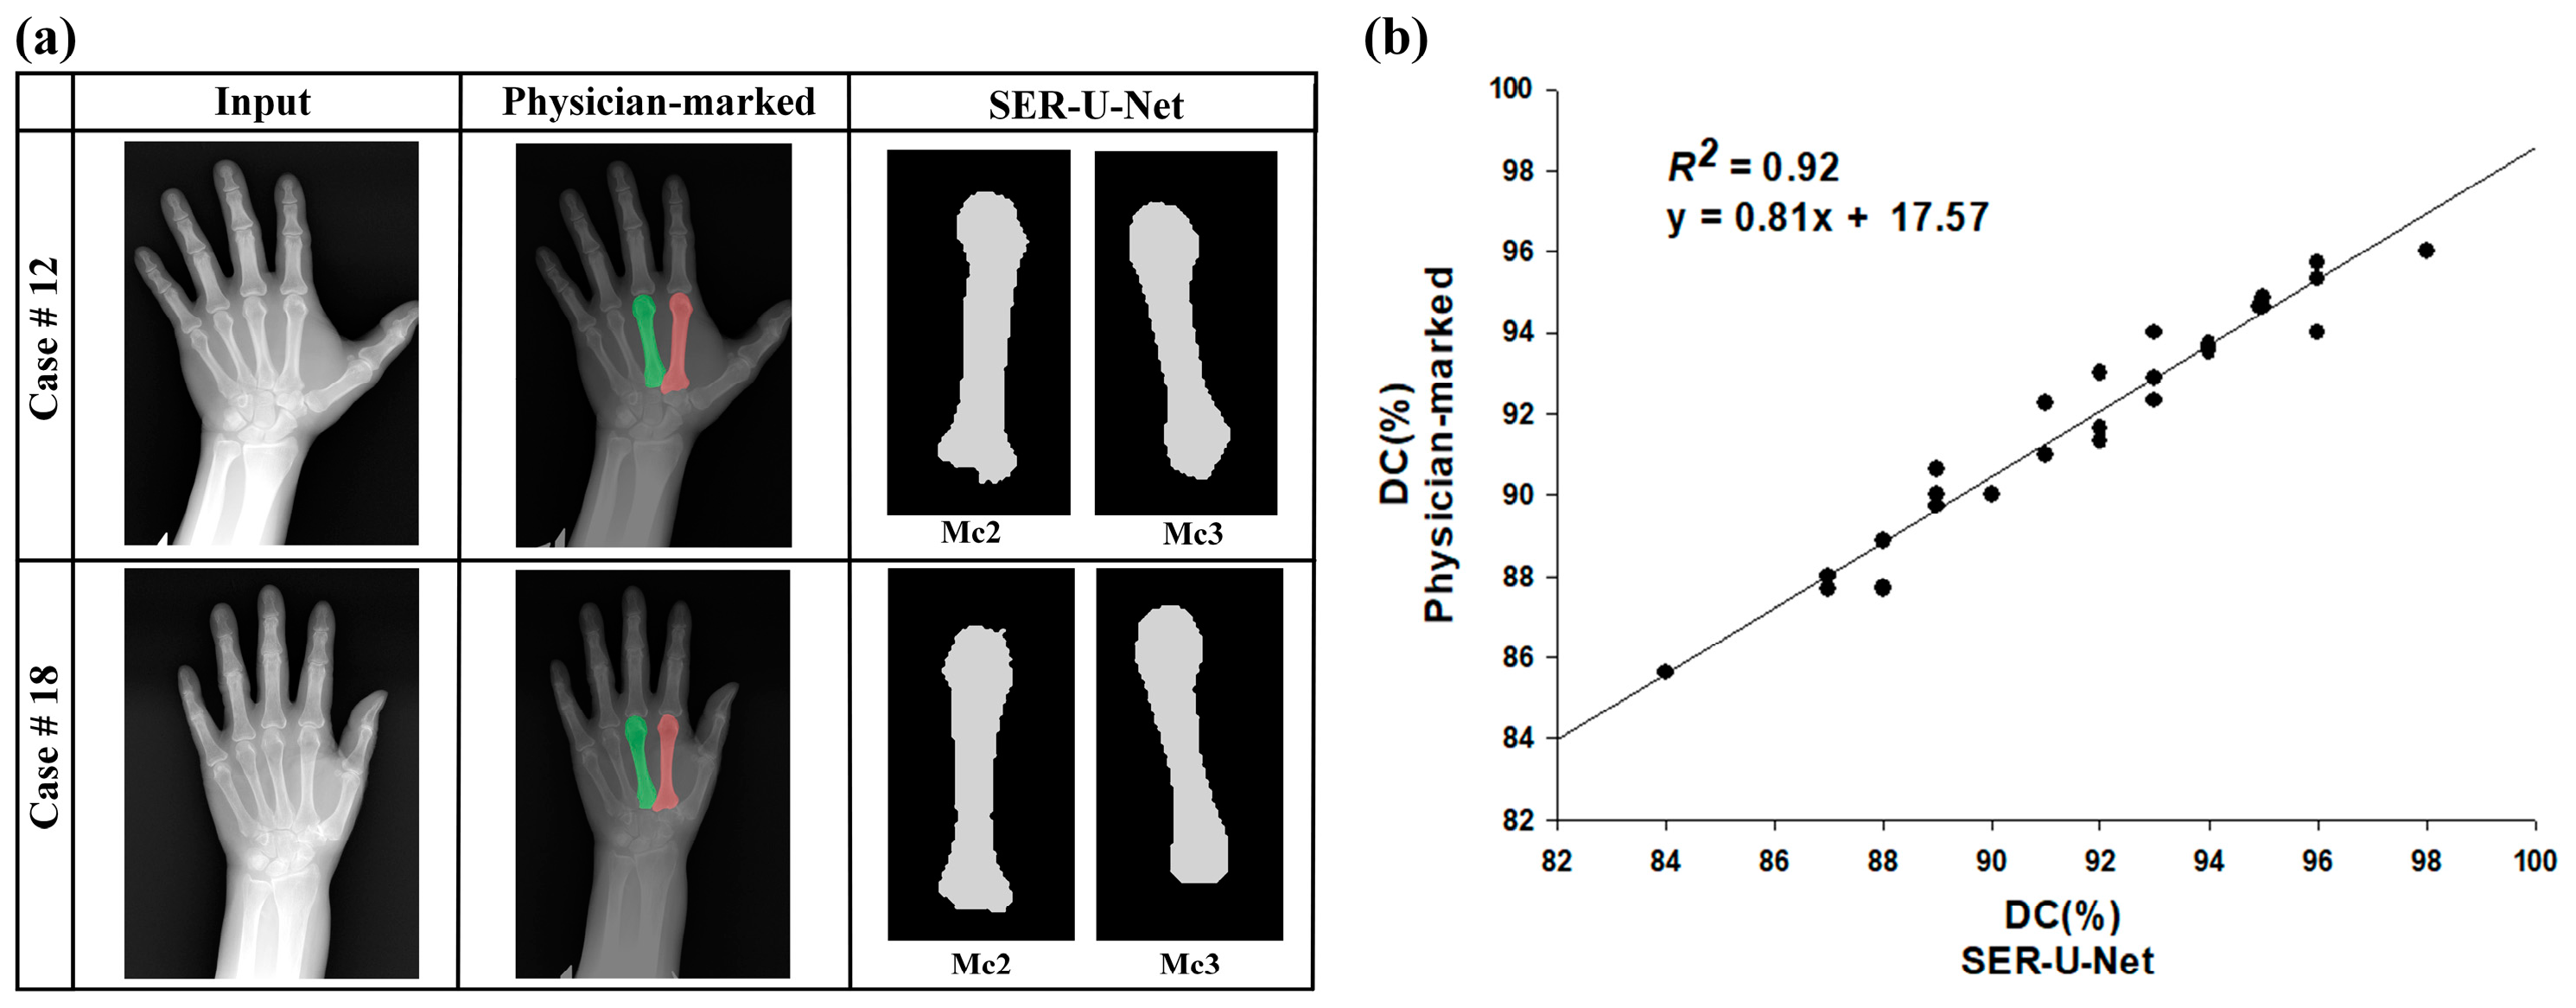
4.2. The SER-U-Net Segmentation Model’s Performance

Table 4 summarizes the performance of our detection model on the test dataset, as described in Section 3.5. The output of each detection model is fed into its corresponding segmentation model, and the manually annotated metacarpal bone regions by medical experts serve as the ground truth for evaluating the segmentation model’s output. Here, we compute the DC and several other metrics for a comprehensive assessment. The results show that both 2MC and 3MC mask models achieve detection accuracies exceeding 96%. The average DC for 2MC segmentation reaches 97.92%, while 3MC segmentation attains an average DC of 96.83%. Figure 10a shows a comparison between physician manual segmentation and SER-U-Net for two clinical cases. Finally, based on manual segmentation of 60 hand X-ray images across 30 clinical cases and the fully automatic method, the correlation is 0.92, as shown in Figure 10b. Among them, the confidence interval estimate (CI) can be calculated, respectively, as shown in Table 5. This indicates that the suggested segmentation method could systematically evaluate the metacarpal region. Overall, the model’s high accuracy in classifying bone density conditions makes it particularly useful in clinical settings for early detection and intervention in osteoporosis among CKD patients. This capability can significantly assist in early diagnosis and treatment planning, thereby improving patient outcomes.

4.3. Automatic BMD Classification Results of Clinical Renal Dialysis Patients

In a cohort of 30 patients meeting the inclusion and exclusion criteria, the mean interval between DXA and hand X-ray examinations was 13 ± 10 days. Figure 11a illustrates the outcomes of model training, showing the classification of bone density in patients with varying degrees of renal osteodystrophy, with dMCP values ranging from 39.4% to 64.4% (mean 54.45% ± 6.3%). The corresponding DXA T-scores, as reflected in Figure 11b, ranged from 1 to −5.8 (mean −1.64 ± 1.4). Based on the classification results and a comparison with the actual DXA bone density analysis reports of patients. The results indicated that when the optimal cortical percentage cutoff for bone loss (represented by the red dashed line) is 51.3%, the system achieves a classification accuracy of 93.3%. It is noteworthy that two patients with low bone density (P1 and P2) were classified as having osteoporosis in the classification system. Further analysis of the hand CT images from these two subjects revealed a significant discrepancy in the cortical percentage within the second and third metacarpal regions—one metacarpal was noticeably better or worse than the other. As reported in the DXA classification, their T-scores were −2.2 and −2.3, respectively, which are near the osteoporosis threshold (T-score < −2.5). This discrepancy could potentially lead to misclassification in the model evaluation.

5. Discussion

Automatic bone density classification has always been a focus of researchers, as it plays a crucial role in the diagnosis of bone pathologies during the process of hemodialysis. This study proposed a fully automated method utilizing the SER-U-Net model to detect and segment the metacarpal bone region in X-ray images and subsequently calculate the cortical percentage of dMCP. In this study, we utilized the dataset provided by the 2017 RSNA Bone Age Challenge, which includes a total of 14,236 hand X-ray images. We randomly selected 1500 hand X-ray images from the training set (a total of 12,611 hand X-ray images) for data augmentation. Subsequently, this dataset was utilized for training the model to identify and segment the second and third metacarpal regions of the hand bones. Finally, 140 images randomly selected from the test set (a total of 200 hand X-ray images) combined with 60 hand X-ray images from 30 chronic kidney disease patients were used, resulting in a total of 200 images used for testing. The ground truth data for accuracy comparison were annotated by medical professionals and included the 2MC, 3MC, and cortical regions. We further compared the similarity between physician segmentation and automatic segmentation models, providing evidence for the effectiveness of the detection model (R2 = 0.92). Furthermore, we conducted a comparison between our proposed method and other existing deep-learning segmentation techniques—namely, the original U-Net, SegNet, and FCN-8. The results indicate that our model surpasses the other three methods in terms of DC and SI. In the final analysis, the system computed dMCP based on segmented cortical bone regions and conducted an accuracy assessment against clinical DXA results. The results indicate that the automatic assessment method proposed in this study achieved a classification accuracy of 93.3% in distinguishing osteoporotic patients among 30 subjects undergoing renal dialysis, with the optimal cutoff value set at 51.3%.
It is noteworthy that two patients with low bone density (P1 and P2) were classified as having osteoporosis in the classification system. Further analysis of the hand CT images from the two subjects revealed a significant discrepancy in cortical percentage within the second and third metacarpal regions (one metacarpal noticeably better or worse than the other). This finding underscores the importance of accurate metacarpal selection, segmentation, and matching of weighting ratios in improving precision. To address this limitation, we conducted a literature review of the recently proposed Segment Anything Model (SAM). Although multiple studies have indicated that the SAM might fail in medical image segmentation tasks [41,42,43,44], a research team recently introduced a novel method called SAM with Condition Embedding block (CEmb-SAM) [45]. Experiments have demonstrated that CEmb-SAM consistently outperforms SAM [46] and MedSAM [47] in segmentation tasks involving peripheral nerves and breast lesions. This architecture will be further analyzed in the team’s future work and is expected to have positive benefits for the selection of the metacarpal cortical area.
Overall, in this study, we used low-dose hand X-ray imaging to capture 2MC and 3MC for cortical percentage calculation. Subsequently, we established a bone density risk level based on dMCP values and successfully classified osteoporotic patients among kidney disease individuals. This suggests that the establishment of such a low-dose hand X-ray machine and classification model could achieve cost-effective rapid bone density screening. It addresses potential renal bone loss that can occur between annual DXA examinations for kidney disease patients, serving as a tool to assess fracture risk and enable early detection and intervention. Ultimately, early screening aims to reduce the incidence of future fragility fractures related to renal issues, thereby alleviating the economic burden associated with osteoporosis.

6. Conclusions

This study indicates a positive correlation between dMCP and DXA whole-body bone density results in patients undergoing renal dialysis. This low-dose hand X-ray examination not only automatic assessment osteoporosis but also filled the gap in bone density tracking during DXA examination intervals. This enables prompt clinical intervention for changes in BMD in kidney disease patients. These findings advocate for the broader adoption of lower-cost PA hand X-rays for osteoporosis screening. Compared to standard DXA, the analytical process in this study framework considers non-weight-bearing skeletal regions and analyzes based on the non-dominant hand. This approach offers higher overall feasibility and cost-effectiveness, especially for CKD-BMD patients requiring frequent testing and assessment. Thus, it enables early assessment of osteoporosis risk in kidney disease patients and opportunities to reduce the likelihood of subsequent injury or disability. One of the future tasks is to enhance the segmentation precision of the cortical region of metacarpophalangeal bones, which aids in reducing dMCP calculation errors. Additionally, the automatically bone segmentation methods could serve as a basis for the detection and segmentation of other joint structures or target markers, including cartilage, effusions, bone marrow lesions, and more. Given the small and intricate nature of these structures, the ability to directly segment without the need for bone recognition eliminates false positives in the labeling process, increase the applicability of the proposed approach to a broader range of fields.

Author Contributions

Conceptualization, M.-J.W. and S.-C.T.; data curation, S.-C.T., Y.-C.G. and W.-S.C.; formal analysis, Y.-C.G.; methodology, M.-J.W. and S.-C.T.; project administration, S.-C.T.; resources, M.-J.W.; software, Y.-C.G.; supervision, M.-J.W. and S.-C.T.; validation, S.-C.T., Y.-C.G. and W.-S.C.; writing—original draft, M.-J.W., Y.-C.G. and W.-S.C.; writing—review and editing, S.-C.T. and W.-S.C. All authors have read and agreed to the published version of the manuscript.

Funding

This research received no external funding.

Institutional Review Board Statement

The study was conducted in accordance with the Declaration of Helsinki and approved by the institutional review board at Kaohsiung Veterans General Hospital, Taiwan, Republic of China (IRB No. KSVGH22-CT10-29).

Informed Consent Statement

Informed consent was obtained from all subjects involved in the study.

Data Availability Statement

The X-ray imaging data used to support the findings of this paper have been deposited in the RSNA repository [30].

Conflicts of Interest

Authors Shao-Chun Tseng was employed by the company NanoRay Biotech Co., Ltd. The remaining authors declare that the research was conducted in the absence of any commercial or financial relationships that could be construed as a potential conflict of interest.

References

  1. Hsu, C.Y.; Chen, L.R.; Chen, K.H. Osteoporosis in patients with chronic kidney diseases: A systemic review. Int. J. Mol. Sci. 2020, 21, 6846. [Google Scholar] [CrossRef]
  2. Cannata-Andía, J.B.; Martín-Carro, B.; Martín-Vírgala, J.; Rodríguez-Carrio, J.; Bande-Fernández, J.J.; Alonso-Montes, C.; Carrillo-López, N. Chronic kidney disease—Mineral and bone disorders: Pathogenesis and management. Calcif. Tissue Int. 2021, 108, 410–422. [Google Scholar] [CrossRef]
  3. Yen, T.Y.; Ho, C.S.; Chen, Y.P.; Pei, Y.C. Diagnostic Accuracy of Deep Learning for the Prediction of Osteoporosis Using Plain X-rays: A Systematic Review and Meta-Analysis. Diagnostics 2024, 14, 207. [Google Scholar] [CrossRef]
  4. Goode, S.C.; Wright, T.F.; Lynch, C. Osteoporosis screening and treatment: A collaborative approach. J. Nurse Pract. 2020, 16, 60–63. [Google Scholar] [CrossRef]
  5. Matsushita, K.; Ballew, S.H.; Wang, A.Y.M.; Kalyesubula, R.; Schaeffner, E.; Agarwal, R. Epidemiology and risk of cardiovascular disease in populations with chronic kidney disease. Nat. Rev. Nephrol. 2022, 18, 696–707. [Google Scholar] [CrossRef]
  6. Sprague, S.M.; Martin, K.J.; Coyne, D.W. Phosphate Balance and CKD–Mineral Bone Disease. Kidney Int. Rep. 2021, 6, 2049–2058. [Google Scholar] [CrossRef]
  7. Tsuchiya, K.; Akihisa, T. The importance of phosphate control in chronic kidney disease. Nutrients 2021, 13, 1670. [Google Scholar] [CrossRef]
  8. O’Mara, A.; Kerkhof, F.; Kenney, D.; Segovia, N.; Asbell, P.; Ladd, A.L. Opportunistic hand radiographs to screen for low forearm bone mineral density: A prospective and retrospective cohort study. BMC Musculoskelet. Disord. 2024, 25, 159. [Google Scholar] [CrossRef]
  9. Choi, H.G.; Kim, D.S.; Lee, B.; Youk, H.; Lee, J.W. High risk of hip and spinal fractures after distal radius fracture: A longitudinal follow-up study using a national sample cohort. Int. J. Environ. Res. Public Health 2021, 18, 7391. [Google Scholar] [CrossRef]
  10. Clynes, M.A.; Westbury, L.D.; Dennison, E.M.; Kanis, J.A.; Javaid, M.K.; Harvey, N.C.; Fujita, M.; Cooper, C.; Leslie, W.D.; Shuhart, C.R. International Society for Clinical Densitometry (ISCD) and the International Osteoporosis Foundation (IOF). Bone densitometry worldwide: A global survey by the ISCD and IOF. Osteoporos. Int. 2020, 31, 1779–1786. [Google Scholar] [CrossRef]
  11. Holubiac, I.Ș.; Leuciuc, F.V.; Crăciun, D.M.; Dobrescu, T. Effect of strength training protocol on bone mineral density for postmenopausal women with osteopenia/osteoporosis assessed by dual-energy X-ray absorptiometry (DEXA). Sensors 2022, 22, 1904. [Google Scholar] [CrossRef]
  12. Parikh, K.; Reinhardt, D.; Templeton, K.; Toby, B.; Brubacher, J. Rate of bone mineral density testing and subsequent fracture-free interval after distal forearm fracture in the Medicare population. J. Hand Surg. 2021, 46, 267–277. [Google Scholar] [CrossRef]
  13. Webber, T.; Patel, S.P.; Pensak, M.; Fajolu, O.; Rozental, T.D.; Wolf, J.M. Correlation between distal radial cortical thickness and bone mineral density. J. Hand Surg. 2015, 40, 493–499. [Google Scholar] [CrossRef]
  14. Sato, Y.; Yamamoto, N.; Inagaki, N.; Iesaki, Y.; Asamoto, T.; Suzuki, T.; Takahara, S. Deep learning for bone mineral density and T-score prediction from chest X-rays: A multicenter study. Biomedicines 2022, 10, 2323. [Google Scholar] [CrossRef]
  15. Roux, C.; Rozes, A.; Reizine, D.; Hajage, D.; Daniel, C.; Maire, A.; Bréant, S.; Taright, N.; Gordon, R.; Tubach, F.; et al. Fully automated opportunistic screening of vertebral fractures and osteoporosis on more than 150,000 routine computed tomography scans. Rheumatology 2022, 61, 3269–3278. [Google Scholar] [CrossRef]
  16. Kim, M.W.; Huh, J.W.; Noh, Y.M.; Seo, H.E.; Lee, D.H. Assessing Bone Mineral Density in Weight-Bearing Regions of the Body through Texture Analysis of Abdomen and Pelvis CT Hounsfield Unit. Diagnostics 2023, 13, 2968. [Google Scholar] [CrossRef]
  17. Ma, S.B.; Lee, S.K.; An, Y.S.; Kim, W.S.; Choy, W.S. The clinical necessity of a distal forearm DEXA scan for predicting distal radius fracture in elderly females: A retrospective case-control study. BMC Musculoskelet. Disord. 2023, 24, 177. [Google Scholar] [CrossRef]
  18. Yoshii, I.; Sawada, N.; Chijiwa, T.; Kokei, S. Usefulness of cortical thickness ratio of the third metacarpal bone for prediction of major osteoporotic fractures. Bone Rep. 2022, 16, 101162. [Google Scholar] [CrossRef]
  19. Burton, H.; Bodansky, D.; Silver, N.; Yao, J.; Horwitz, M. Assessing Bone Mineral Density Using Radiographs of the Hand: A Multicenter Validation. J. Hand Surg. 2023, 48, 1210–1216. [Google Scholar] [CrossRef]
  20. Massoptier, L.; Casciaro, S. A new fully automatic and robust algorithm for fast segmentation of liver tissue and tumors from CT scans. Eur. Radiol. 2008, 18, 1658–1665. [Google Scholar] [CrossRef]
  21. Li, X.; Huang, C.; Jia, F.; Li, Z.; Fang, C.; Fan, Y. Automatic liver segmentation using statistical prior models and free-form deformation. In Medical Computer Vision: Algorithms for Big Data: International Workshop, MCV 2014, Held in Conjunction with MICCAI 2014, Cambridge, MA, USA, September 18, 2014, Revised Selected Papers; Springer International Publishing: Cambridge, MA, USA, 2014; pp. 181–188. [Google Scholar]
  22. Wang, J.; Cheng, Y.; Guo, C.; Wang, Y.; Tamura, S. Shape–intensity prior level set combining probabilistic atlas and probability map constrains for automatic liver segmentation from abdominal CT images. Int. J. Comput. Assist. Radiol. Surg. 2016, 11, 817–826. [Google Scholar] [CrossRef]
  23. Aloysius, N.; Geetha, M. A review on deep convolutional neural networks. In Proceedings of the 2017 International Conference on Communication and Signal Processing (ICCSP), Chennai, India, 6–8 April 2017; IEEE: Piscataway, NJ, USA, 2017; pp. 588–592. [Google Scholar]
  24. Ren, S.; He, K.; Girshick, R.; Sun, J. Faster r-cnn: Towards real-time object detection with region proposal networks. Adv. Neural Inf. Process. Syst. 2015, 28. [Google Scholar] [CrossRef]
  25. Brostow, G.J.; Fauqueur, J.; Cipolla, R. Semantic object classes in video: A high-definition ground truth database. Pattern Recognit. Lett. 2009, 30, 88–97. [Google Scholar] [CrossRef]
  26. Deng, L. Research on Image Recognition Algorithm Based on Deep Convolution Neural Network. Acad. J. Comput. Inf. Sci. 2020, 3. [Google Scholar]
  27. Shaaban, A.; Du, Y.C. An Optical Universal Plasmon-Based Biosensor for Virus Detection. J. Med. Biol. Eng. 2023, 43, 258–265. [Google Scholar] [CrossRef]
  28. Ding, L.; Zhao, K.; Zhang, X.; Wang, X.; Zhang, J. A lightweight U-Net architecture multi-scale convolutional network for pediatric hand bone segmentation in X-ray image. IEEE Access 2019, 7, 68436–68445. [Google Scholar] [CrossRef]
  29. Szegedy, C.; Liu, W.; Jia, Y.; Sermanet, P.; Reed, S.; Anguelov, D.; Erhan, D.; Vanhoucke, V.; Rabinovich, A. Going deeper with convolutions. In Proceedings of the IEEE Conference on Computer Vision and Pattern Recognition, Boston, MA, USA, 7–12 June 2015; pp. 1–9. [Google Scholar]
  30. Halabi, S.S.; Prevedello, L.M.; Kalpathy-Cramer, J.; Mamonov, A.B.; Bilbily, A.; Cicero, M.; Pan, I.; Pereira, L.A.; Sousa, R.T.; Flanders, A.E.; et al. The RSNA pediatric bone age machine learning challenge. Radiology 2019, 290, 498–503. [Google Scholar] [CrossRef]
  31. Serrano-Díaz, D.G.; Gómez, W.; Vera, A.; Leija, L. Contrast Enhancement of 3D X-ray Microtomography Using CLAHE for Trabecular Bone Segmentation. In Proceedings of the 2023 Global Medical Engineering Physics Exchanges/Pacific Health Care Engineering (GMEPE/PAHCE), Songdo, Republic of Korea, 27–31 March 2023; pp. 1–6. [Google Scholar]
  32. Aung, A.A.; Win, Z.M. Preprocessing with contrast enhancement methods in bone age assessment. Comput. Inf. Sci. 2020, 31–45. [Google Scholar] [CrossRef]
  33. He, J.; Jiang, D. Fully automatic model based on se-resnet for bone age assessment. IEEE Access 2021, 9, 62460–62466. [Google Scholar] [CrossRef]
  34. Hu, J.; Shen, L.; Sun, G. Squeeze-and-excitation networks. In Proceedings of the IEEE Conference on Computer Vision and Pattern Recognition, Salt Lake City, UT, USA, 18–23 June 2018; pp. 7132–7141. [Google Scholar]
  35. He, K.; Zhang, X.; Ren, S.; Sun, J. Deep residual learning for image recognition. In Proceedings of the IEEE Conference on Computer Vision and Pattern Recognition, Las Vegas, NV, USA, 27–30 June 2016; pp. 770–778. [Google Scholar]
  36. Jiang, Y.; Chen, L.; Zhang, H.; Xiao, X. Breast cancer histopathological image classification using convolutional neural networks with small SE-ResNet module. PLoS ONE 2019, 14, e0214587. [Google Scholar] [CrossRef]
  37. Almajalid, R.; Zhang, M.; Shan, J. Fully automatic knee bone detection and segmentation on three-dimensional MRI. Diagnostics 2022, 12, 123. [Google Scholar] [CrossRef]
  38. Lv, Y.; Wang, J.; Wu, W.; Pan, Y. Performance comparison of deep learning methods on hand bone segmentation and bone age assessment. In Proceedings of the 2022 International Conference on Culture-Oriented Science and Technology (CoST), Lanzhou, China, 18–21 August 2022; IEEE: Piscataway, NJ, USA, 2021; pp. 375–380. [Google Scholar]
  39. Fradi, M.; Zahzah, E.H.; Machhout, M. Real-time application based CNN architecture for automatic USCT bone image segmentation. Biomed. Signal Process. Control 2022, 71, 103123. [Google Scholar] [CrossRef]
  40. Meng, L.K.; Khalil, A.; Ahmad Nizar, M.H.; Nisham, M.K.; Pingguan-Murphy, B.; Hum, Y.C.; Salim, M.I.M.; Lai, K.W. Carpal bone segmentation using fully convolutional neural network. Curr. Med. Imaging 2019, 15, 983–989. [Google Scholar] [CrossRef]
  41. Deng, R.; Cui, C.; Liu, Q.; Yao, T.; Remedios, L.W.; Bao, S.; Landman, B.A.; Wheless, L.E.; Coburn, L.A.; Huo, Y.; et al. Segment anything model (sam) for digital pathology: Assess zero-shot segmentation on whole slide imaging. arXiv 2023, arXiv:2304.04155. [Google Scholar]
  42. He, S.; Bao, R.; Li, J.; Grant, P.E.; Ou, Y. Accuracy of segment-anything model (sam) in medical image segmentation tasks. arXiv 2023, arXiv:2304.09324. [Google Scholar]
  43. Hu, C.; Xia, T.; Ju, S.; Li, X. When sam meets medical images: An investigation of segment anything model (sam) on multi-phase liver tumor segmentation. arXiv 2023, arXiv:2304.08506. [Google Scholar]
  44. Zhou, T.; Zhang, Y.; Zhou, Y.; Wu, Y.; Gong, C. Can sam segment polyps? arXiv 2023, arXiv:2304.07583. [Google Scholar]
  45. Shin, D.; Kim, M.D.B.; Baek, S. CEmb-SAM: Segment Anything Model with Condition Embedding for Joint Learning from Heterogeneous Datasets. In International Conference on Medical Image Computing and Computer-Assisted Intervention; Springer Nature: Cham, Switzerland, 2023; pp. 275–284. [Google Scholar]
  46. Kirillov, A.; Mintun, E.; Ravi, N.; Mao, H.; Rolland, C.; Gustafson, L.; Xiao, T.; Whitehead, S.; Berg, A.C.; Girshick, R.; et al. Segment anything. In Proceedings of the IEEE/CVF International Conference on Computer Vision, Paris, France, 2–6 October 2023; pp. 4015–4026. [Google Scholar]
  47. Ma, J.; He, Y.; Li, F.; Han, L.; You, C.; Wang, B. Segment anything in medical images. Nat. Commun. 2024, 15, 654. [Google Scholar] [CrossRef]
Figure 1. Flowchart of the proposed methodology.
Electronics 13 02389 g001
Figure 2. (a) Examples of hand X-ray dataset as final test set. (b) The overall process framework includes: (1) data preprocessing, (2) SER-U-Net segmentation and feature fusion, and (3) Regression and BMD classification.
Electronics 13 02389 g002
Figure 3. The image preprocessing workflow, incorporating (a) CLAHE image enhancement and (b) vertical alignment.
Electronics 13 02389 g003
Figure 4. The proposed architecture diagram of SER-U-Net in this study.
Electronics 13 02389 g004
Figure 5. The structure of the compression module shows various operations, each indicated by arrows of different colors.
Electronics 13 02389 g005
Figure 6. SE-ResNet module structure [36].
Electronics 13 02389 g006
Figure 7. An illustration displaying the true positive, false positive, and false negative masks.
Electronics 13 02389 g007
Figure 8. RevoluX X-ray machine and its corresponding annotated images, which include the background, 2MC, 3MC, and radius, are labeled as 0, 1, 2, and 3, respectively.
Electronics 13 02389 g008
Figure 9. Schematic diagram of dMCP calculation. The picture shows the results of normal subjects.
Electronics 13 02389 g009
Figure 10. (a) Two groups of clinical hand X-ray image segmentation cases. (b) Correlation between physician manual and automatic model segmentation (R2 = 0.92).
Electronics 13 02389 g010
Figure 11. Demonstration of analysis used to calculate dMCP. (a) Results for subjects with normal bone density and osteoporosis. Among them, the red area represents the segmented 2MC and 3MC regions, while the blue area indicates the intramedullary components and the narrowest transverse diameter. (b) Scatter plot showing X-ray images of 30 subjects using dMCP classification results and correlation between DXA T-scores.
Electronics 13 02389 g011
Table 1. The mean absolute error for training images of different sizes [33].
Image SizeTime/sMAE/m
128 × 12828112.9
256 × 25637311.2
512 × 51276410.2
1024 × 102423449.6
Table 2. The experimental results of clinical evaluation.
ResultsMenWomenTotal
Variable
Age (average ± SD)63.2 ± 8.167.2 ± 12.964.2 ± 9.3
Sex (n; %)23; 76.77; 23.330; 100
Time on dialysis (years)
 Less than 1 year2; 502; 504; 13.3
 1~4 years11; 78.63; 21.414; 46.7
 5 years or above10; 83.32; 16.712; 40
DXA BMD (T-score) result
 Normal Bone Density9; 901; 1010; 33.3
 Osteopenia12; 92.31; 7.713; 43.3
 Osteoporosis2; 28.65; 71.47; 23.3
Exclusion criteria were:
Age > 85 years
Arteriovenous fistulas (AVF) or arteriovenous grafts (AVG) for kidney disease patients were created within less than 8 weeks and 6 weeks, respectively.
Any acute or chronic condition that would impair the patient’s ability to participate in the study.
Refusal to provide informed consent.
Table 3. The performance of the testing set for metacarpal segmentation using SER-U-Net and other models.
TPR (%)FPR (%)FNR (%)DC (%)SI (%)
SER-U-Net97.825.662.3796.6294.48
U-Net98.1615.280.6288.4192.75
SegNet84.2522.1614.3372.2884.39
FCN-891.754.317.5090.3793.06
Table 4. The model’s automatic detection performance on the test set.
Manual Detection
(Physician-Marked)
Automatic Detection
(SER-U-Net)
p-Valuep-Value
SI (%)DC (%)SI (%)DC (%)(DC)(SI)
2MC95.8296.0296.7197.920.3890.320
3MC96.0397.7195.9196.830.3040.249
Table 5. The confidence interval estimate (CI) of the model’s performance.
MeanSD95% CI
Lower LimitUpper Limit
SER-U-NET0.910.0330.900.93
Physician-marked0.920.0270.910.93
Disclaimer/Publisher’s Note: The statements, opinions and data contained in all publications are solely those of the individual author(s) and contributor(s) and not of MDPI and/or the editor(s). MDPI and/or the editor(s) disclaim responsibility for any injury to people or property resulting from any ideas, methods, instructions or products referred to in the content.

