Article

Artificial Neural Network-Based Real-Time Power Management for a Hybrid Renewable Source Applied for a Water Desalination System

1
Laboratoire des Systèmes Electriques LR11ES15, ENIT, Université de Tunis El Manar, Tunis 1002, Tunisia
2
Department of Electrical Engineering, ENSIT, Université de Tunis, Tunis 1008, Tunisia
*
Author to whom correspondence should be addressed.
Electronics 2024, 13(13), 2503; https://doi.org/10.3390/electronics13132503
Submission received: 3 June 2024 / Revised: 20 June 2024 / Accepted: 23 June 2024 / Published: 26 June 2024
(This article belongs to the Special Issue Digital Control of Power Electronics)

Abstract

:
Water desalination systems integrated with stand-alone hybrid energy sources offer a remarkable solution to the water–energy challenge. Given the complexity of these systems, selecting an appropriate energy management system is crucial. In this regard, employing artificial intelligence techniques to develop and validate an energy management system can be an effective approach for handling such intricate systems. Therefore, this paper presents an ANN-based energy management system (ANNEMS) for a pumping and desalination system connected to an isolated hybrid renewable energy source. Thus, a parametric sensitivity algorithm was developed to identify the optimal neural network architecture. The water–energy management-based supervised multi-layer perceptron neural network demonstrated effective power sharing within a short time frame, achieving accuracy criteria of RMSE, R, and R² between the actual and estimated electrical power of the three motor pumps. The ANNEMS is defined to facilitate real-time power sharing distribution among the various system motor pumps on the test bench, considering the generated power profile and water tank levels. The proposed strategy employs power field oriented control to maintain DC bus voltage stability. Experimental results from the implementation of the proposed ANNEMS are provided. Therein, the power levels of the three motor pumps demonstrated consistent adherence to their reference values. In summary, this study highlights the significance of selecting appropriate energy management for real-time experimental validation.

1. Introduction

According to the United Nations (UN) in 2020, the global rate of the water use has increased by 1% per year since the 1980s, and it is projected that by 2050 it could exceed 30% of current levels. Indeed, water availability directly affects food security and the production capacity of each country [1]. Although access to drinking water and basic sanitation is a human right and essential for food security, health, and hygiene, there are still very alarming facts in the world. A staggering 844 million individuals lack access to safe drinking water, 2.4 billion people lack access to basic sanitation, 2 billion people live in regions experiencing high water stress, and 4 billion people suffer from stark water scarcity for at least one month in a year [2]. Water management is therefore a crucial issue that merits special attention. For this reason, it is necessary to have new technologies to provide fresh water such as desalination, which requires energy for its operation [3]. Water desalination systems are energy-intensive. In addition to the water problem, according to the International Energy Agency (IEA), 600 million of the 674 million people in sub-Saharan Africa will become without access to electricity by 2030, most in rural areas [4]. Hence, the use of renewable energy sources, especially photovoltaic and wind, is an attractive solution to address the problems of energy and water simultaneously [5,6,7]. However, the different energy management strategies have common objectives: avoiding deep discharge of energy storage units, decreasing peak load demand, and reducing the storage/destocking energy phase. They also aim to maintain the stability of the continuous bus, reduce the cost of operation and maintenance, and increase the efficiency of the system [8]. Many studies have contributed to defining the methodology for managing energy between different energy sources. In the literature, energy management strategies are generally classified into two categories: “rules-based” strategies and “optimization-based” strategies whose implementation differs depending on the application. In the field of stationary applications (smart home), an energy management system (EMS) coupled with an autonomous hybrid renewable energy source (PV–wind–hydrogen-battery) [9] was used to meet the power requirement of a stand-alone house located in Alora (Malaga) in Spain. The simulation results show that the proposed control meets the objectives established for the EMS and achieves a total saving of 13% compared to other simple systems based on control states. In [10], the authors used different recurrent neural network (RNN) structures to predict future weather and freshwater demand scenarios to accomplish the power supply of a hybrid renewable energy system coupled to a reverse osmosis (RO) desalination unit. Stefano Leonori et al. [11] studied different strategies for the synthesis of a fuzzy rule-based energy management system using a genetic algorithm to maximize the profit generated by the exchange of energy with the grid, assuming a Time Of Use (TOU) energy pricing policy, while simultaneously reducing the complexity of the rule-based management system. The results show that the performance associated with the benefit of the optimized energy management system is nearly 90% of optimal performance (upper limit) even when the rule-based system is reduced to less than 30 rules. In [12], a multi-artificial neural network (MANN) which is composed of four neural networks is proposed to predict the electrical characteristics of a PV module by combining several neural networks under different environmental conditions. This MANN is used to study the dependence of the output performance on solar irradiance and temperature. Compared with the traditional single-ANN (SANN) method, the proposed method shows better accuracy under different operating conditions. Additionally, experimental research demonstrated that integrating reverse osmosis (RO) units with renewable energy technologies could reduce specific energy consumption by allowing the desalination unit to operate at partial load [13].
In the majority of the research on desalination systems powered by renewable energy sources, batteries are commonly utilized to stabilize the DC bus and to provide energy during production deficits. In this study, the authors have eliminated the use of batteries. Consequently, the regulation of the DC bus is achieved through one of the converters on the motor pump side. The intermittent power generated by renewable sources must be optimally managed between the three motor pumps to meet the water consumption profile. The development and experimental validation of an artificial intelligence-based energy management system represents a key contribution of this work.
In this context, a brackish water reverse osmosis desalination system is adopted to produce and store water, meeting the required water demand. Furthermore, the produced hybrid PV/wind energy will be used to operate the proposed system in real time using a test bench prototype. This paper is an extension of previous work, where the design of a dynamic simulator incorporating various system models has been detailed. Additionally, a primary controller based on fuzzy logic has been developed to manage the distribution of generated power among the different components of the pumping and desalination system [14]. To maximize the quantity of produced water, certain parameters of the fuzzy controller are optimized using genetic algorithms [15]. The novelty of this article lies in developing an enhanced power management system based on an artificial neural network (ANN), which is implemented and tested in real time on an experimental desalination prototype located in our electrical laboratory. The ANN is trained using the results obtained from a fuzzy controller optimized through genetic algorithms. This study focuses on managing an integrated architecture combining a water pumping and desalination system. Building on previous research, the work also aims to optimize the number of neurons in the hidden layer of the neural network to minimize the computation time.
The proposed paper is organized as follows: the system modeling is presented in Section 2. Then, the integrated energy management is formulated and the obtained results are discussed in Section 3 and Section 4, respectively. The experimental performance provided by the implementation of the proposed energy management system is presented in Section 5. The summary is dedicated in the last part.

2. Modeling of the Proposed System

The proposed system integrates two energy sources: photovoltaic panels and wind generators. These sources are connected to power converters, specifically DC/DC and AC/DC converters, which feed a DC bus voltage. This configuration powers a water desalination unit applying the reverse osmosis (RO) technique.
The desalination unit primarily consists of the following components: a low-pressure motor pump (P1) to extract brackish water from the well, a physico-chemical pre-treatment station for the feed water, and an RO membrane combined with a multi-stage high-pressure motor pump (P2) for desalination. Additionally, the system includes a produced water treatment station, a low-pressure motor pump (P3) for water storage, and two storage tanks for brackish and permeate water. Notably, instead of electrochemical storage, this study uses a water tank (water tower) for hydraulic storage to increase the freshwater availability (Figure 1).

2.1. Hybrid PV/Wind Source

The wind turbines and PV panels operate synergistically to enhance the availability of fresh water. The energy generated by each component of the hybrid power system is calculated by modeling each component individually. The output power of the wind turbine and the power produced by the PV system are determined using the following expressions [16,17]:
P W T = ( 1 / 2 ) · η v · η g · C p , o p t · ρ · A W T · V w i n d 3
where η v and η g are, respectively, the static converter efficiency and, generator efficiency, ρ is the air density (kg/ m 3 ), A W T is the wind turbine swept area ( m 2 ), and V w i n d is the wind speed (m/s).
P P V = η r · η p c · [ 1 β · ( T c e l l T N O C T )
Here, T c e l l is the cell temperature, A P V is the photovoltaic panels area, η r is the reference efficiency of the photovoltaic module, η p c is the degradation factor, β is the generator efficiency temperature coefficient (ranging from 0.004 to 0.006 per °C), and T N O C T is the normal operating cell temperature when cells operate under standard conditions.
The cell temperature is an expression of the irradiation I r [W/ m 2 ] and the ambient temperature T a [°C] which is defined by the following [18]:
T c e l l = 30 + 0.0175 × ( I r 300 ) + 1.14 × ( T a 25 )

2.2. Hydraulic System Modeling

2.2.1. Modeling of the Desalination Motor Pump and Reverse Osmosis

In this study, a multi-stage vertical centrifugal pump is applied to produce permeate water and concentrate in the desalination system employing the reverse osmosis technique. The design of the pump is based on the membrane characteristics, including flow, pressure, and size. Consequently, only a single model is used to integrate the motor pump with the desalination process. To develop the hydraulic–electric models of the water desalination unit, the authors in [19] employed professional software such as ROSA Version 6.0, Wincaps-2017, and Matlab Version:9.4.0 (R2018a). They selected Grundfos motor pumps of type CRN- (1S-36; 3-29; 10-18) and Filmtec membrane of type BW30-(2540; 4040; 330; 400) for the reverse osmosis desalination process. The study determines the evolution of the output flow in function of the electrical power of the motor pump P2, including the pumps and membrane elements at different frequencies. Subsequently, the relation between the output flow Q 2 and the electrical power P e 2 of the desalination pump P2 is derived based on the membrane capacity (MC):
Q 2 = 0.0122 × P e 2 0.534 × M C 0.552
P e 2 m i n = 104.8 × M C 0.678 P e 2 m a x = 479.7 × M C 0.705
Thus, to find out the produced freshwater quantity, the conversion rate of various membranes at different frequencies of the associated P2 pumps is calculated. The relation between the conversion rate T c in function of the flow rate Q 2 and the membrane capacity MC is given by the following:
T c = 0.162 × Q 2 0.452 × M C 0.353
The permeate flow Q 2 p and the concentrate flow Q 2 r are calculated as the following relations:
Q 2 p = T c × Q 2 Q 2 r = Q 2 Q 2 p

2.2.2. Modeling of the Drawing Water Motor Pump P1

Generally, centrifugal pumps are widely used for water pumping systems. For this reason, the authors decided to use a submerged three-phase centrifugal motor pump operating at a fixed speed (fixed power) to fill the first brackish water tank from the well. According to the specifications of the chosen hydraulic system, the range of Grundfos motor pumps SP 14A-(5;7;10) is the best choice for this case. The relation between the output flow Q 1 of the pumping pump P1, and the input electrical power P e 1 of the used SP 14A is given by [18]
Q 1 = 0.0022 × P e 1 1.16 + 6.8

2.2.3. Modeling of the Water Storage Motor Pump P3

The selected model for the low-pressure motor pump is CRTE 4-(4;6;8). This choice was guided by considerations of water tower height, permeate flow rate, and minimal power generation requirements. The relation between the flow rate Q 3 , and the electrical power P e 3 is approximated by [18]
Q 3 = 2.18.10 7 × P e 3 2.15 + 3.44

2.2.4. Capacity of Water Tanks

In this study, three water storage tanks are used: a brackish water tank, a permeate water tank which is produced by the desalination process, and a freshwater tank (tower). The tank level is determined by the difference between the input flow Q i n and the output flow Q o u t . To control the instantaneous flow of water in these tanks, the authors used the following expression:
S r × d h r / d t ( t ) = Q i n ( t ) Q o u t ( t )
where S r is the tank section (m²), h r is the tank water level (m), Q i n is the input flow of water, and Q o u t is the output flow of water.

3. The Integrated Energy Management

In this section, an advanced energy management system is designed using an ANN strategy to optimize the power distribution from a hybrid power source. This hybrid power supplies a water pumping and reverse osmosis desalination process. The system’s input parameters comprise the hybrid power P h y b and the three water tanks levels (H1, H2 and H3). The system’s outputs are the reference power levels for the three motor pumps. The steps of this innovative approach are outlined as follows:
  • Step 1: Design the dynamic simulator-based system models [19];
  • Step 2: Develop a fuzzy-logic energy management system [14];
  • Step 3: Develop an optimized fuzzy-logic energy management system [15];
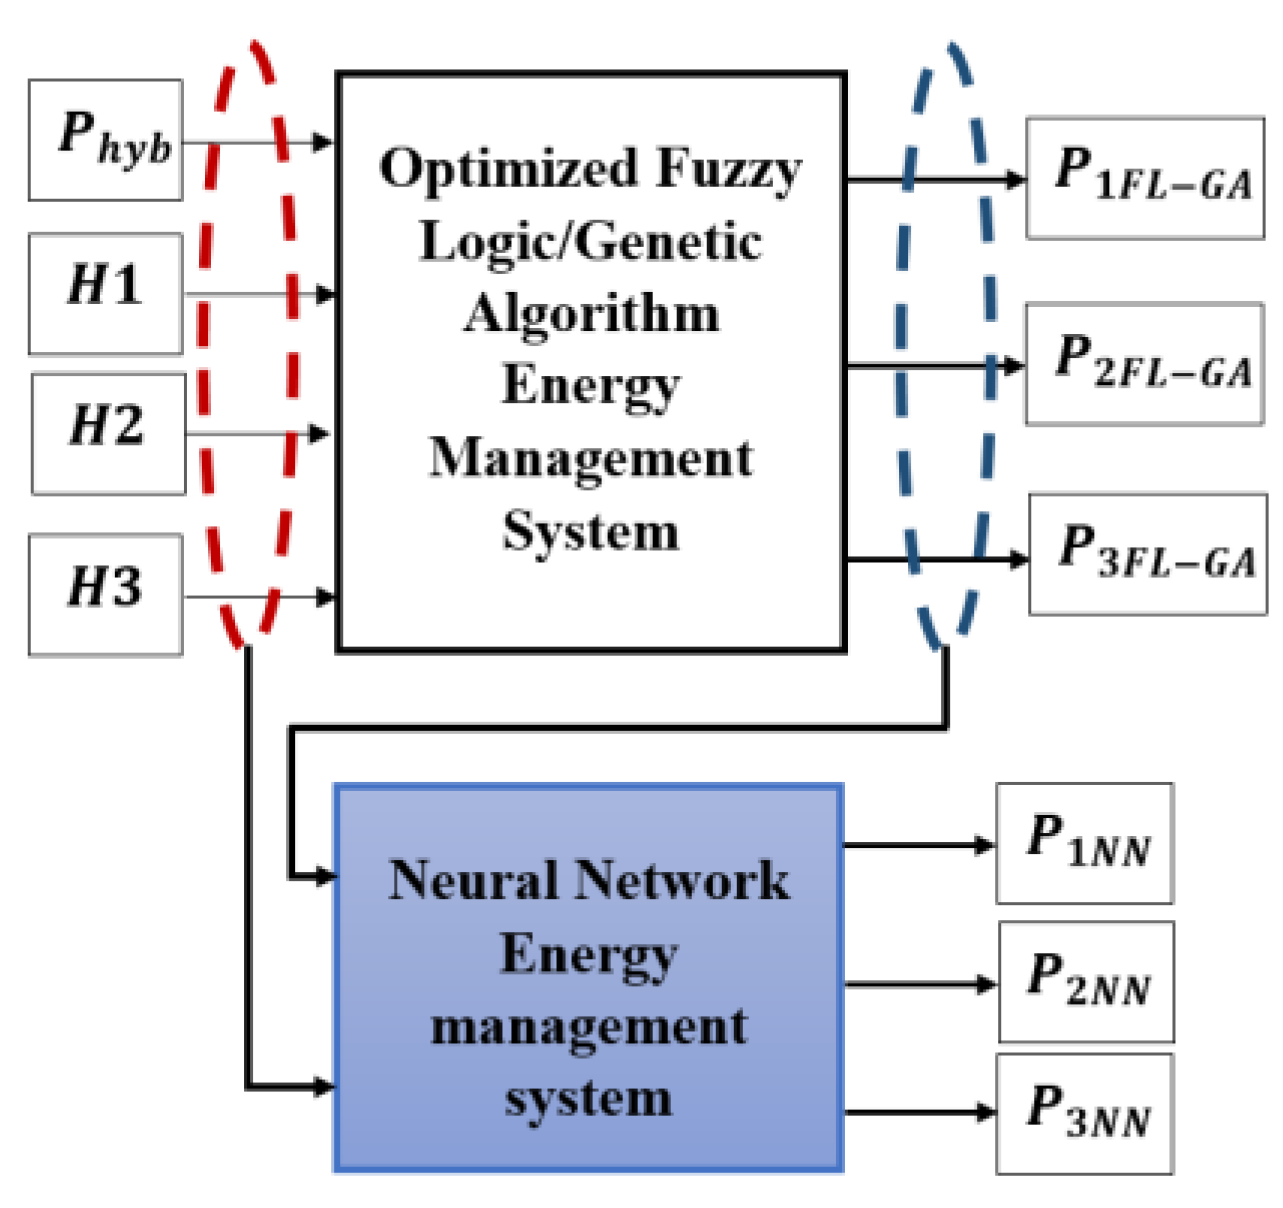
  • Step 4: Develop an ANNEMS based on the optimized fuzzy-logic results;
  • Step 5: Carry out experimental validation of the developed ANNEMS in real time using a test bench prototype.

3.1. Principale of the Dynamic Simulator

A dynamic simulator has been developed to integrate the power management of the proposed energy/water system, enabling the simulation of the temporal evolution of various variables. This dynamic simulator encompasses the different models of the hydraulic and electrical process subsystems previously mentioned. Meteorological data are also required. Therefore, the annual meteorological data of southern Tunisia for the year 2019 are used and programmed with an acquisition period of 1 h (sampling data: 8760 points). These data are collected from the National Institute of Meteorology (Tunisia) (Figure 2). In addition, actual freshwater consumption data were acquired in November 2019; then, the actual freshwater demand profile was extrapolated over a full year taking into account seasonal variations using correction factors.

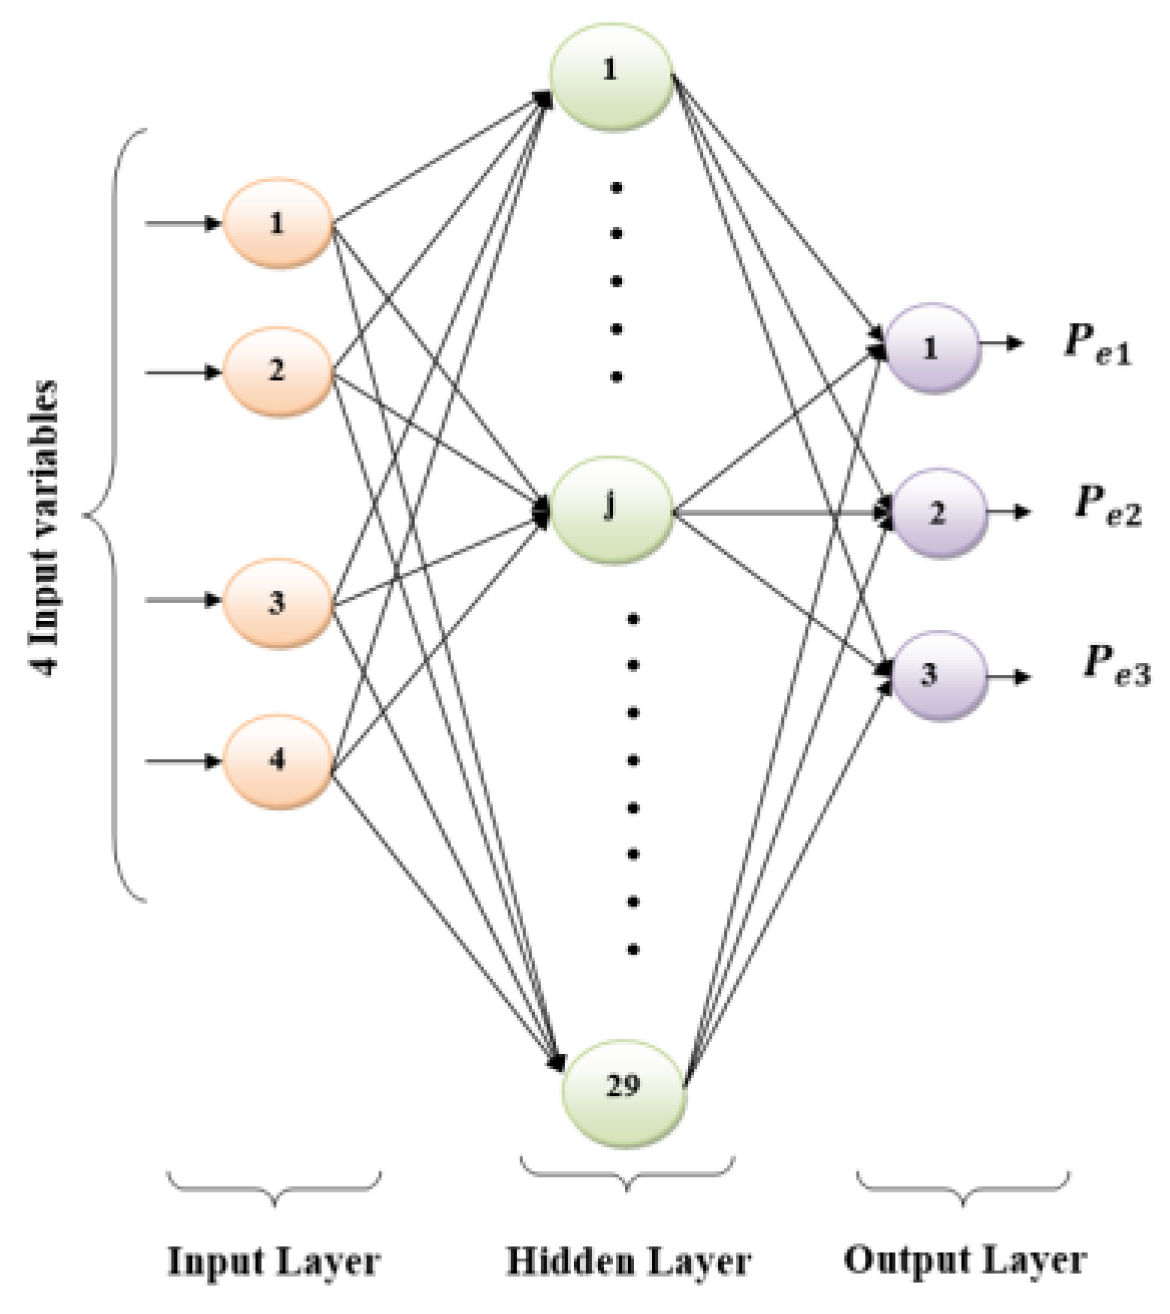
3.2. Artificial Neural Network Power Management Strategy

To highlight a real-time energy management strategy, the authors propose to exploit artificial neural networks (ANNs) as an effective solution. The artificial neural network is a widely used technique for managing power flows between energy components. Inspired by the functionality of biological neurons, an ANN consists of at least two layers of neurons: an input layer and output layer, typically including more and more hidden layers (multi-layer). Each layer comprises numerous specialized neurons. In this study, the ANN model features four neurons in the input layer, representing the hybrid power and the three tank’s levels, and three neurons in the output layer, corresponding to the three motor pumps’ power. There are two families of learning mechanisms for the neural network: supervised learning and unsupervised learning. In a supervised learning model, the data are structured into two sets: the input data, which are the input variables of the model, and the output data, which are the correct results that the model must pursue. In an unsupervised model, only input data are used for modeling, without explicitly providing associated “correct” output data. The majority of highly successful neural networks today employ supervised training, where both input and output data are provided for training. Among these, the multilayer perceptron (MLP) backpropagation algorithm with supervised training is widely preferred due to its accuracy and its suitability for implementation on large datasets [20]. It achieves a higher accuracy rate and reduces prediction errors through the use of backpropagation. It can also easily work with non-linear problems which is performed with the studied system. For this reason, the obtained results by an optimized fuzzy logic energy management system are used for the training [15] (Figure 3).
The original dataset must be divided into three sets for training, validation and testing. Thus, a 10-fold cross-validation partitioning scheme was implemented. The datasets were divided into 90% for training validation and 10% for testing. Subsequently, the training-validation data were further subdivided into 90% for training and 10% for validation purposes.
During the training, the algorithm regularly changes the synaptic weights of the ANN until the characteristics of the dataset have been learned, and it consists of the cyclical repetition of forward propagation and backward propagation (repetition until the parameters are optimized). The training stops when a predetermined number of training epochs is completed, or when the error obtained with the training data decreases and the error obtained with the validation data increases over six consecutive iterations. To find the best ANN architecture, the type of learning function, the number of hidden layers, the number of neurons in each hidden layer, and the appropriate type of transfer function must also be found. After conducting multiple tests, the authors decided to set the number of hidden layers to a single layer, as it was found that the number of layers does not significantly impact the proposed system. As for the other parameters, they can be quantified by calculating the mean squared error (MSE), although some other researchers use the mean absolute error (MAE) or the mean absolute percentage error (MAPE) [21,22,23]. In this study, the authors will employ three performance functions to assess the accuracy of the outputs. These functions include the correlation coefficient R, the RMSE and the determination coefficient R² [24,25,26,27] which are defined as follows:
R = y o ( i ) y e ( i )
R M S E = i = 1 n ( y e i y o i ) 2 n
R 2 = i = 1 n ( y e i y e ¯ ) ( y o i y 0 ¯ ) i = 1 n ( y e i y e ¯ ) i = 1 n ( y o i y 0 ¯ ) 2
where y e and y o are, respectively, the estimated and observed output values, and y e ¯ and y 0 ¯ represent their mean values.
The initial stage in defining the architecture of an artificial neural network involves selecting the optimal training function among various functions used in previous research. During this phase, the number of hidden layers, the number of neurons within each hidden layer, and the transfer functions (from hidden layer to output layer) are iteratively determined. In this instance, the initial configuration consists of one hidden layer with 15 neurons, using the transfer functions logsig for the hidden layer and purelin for the output layer.
The training and testing results for the three evaluation metrics mentioned earlier are presented in Table 1. According to the data in the table, the ANN achieves its optimal performance using the Levenberg–Marquardt-based training function Bayesian regularization (trainbr).
Following the same methodology as with the training function selection, an experiment was conducted to determine the optimal combination of transfer functions for the hidden and output layers. All combinations of commonly used transfer functions, including hyperbolic tangent (Tansig), pure linear (purelin), and sigmoid (logsig), were tested to identify the most effective pairing. According to Table 2, the combination [Tansig–purelin] yielded the most successful results. Here, “Tansig” activates the neurons in the hidden layer, while “Purelin” activates those in the output layer. These findings will guide the subsequent tests aimed at determining the optimal number of neurons in the hidden layer.

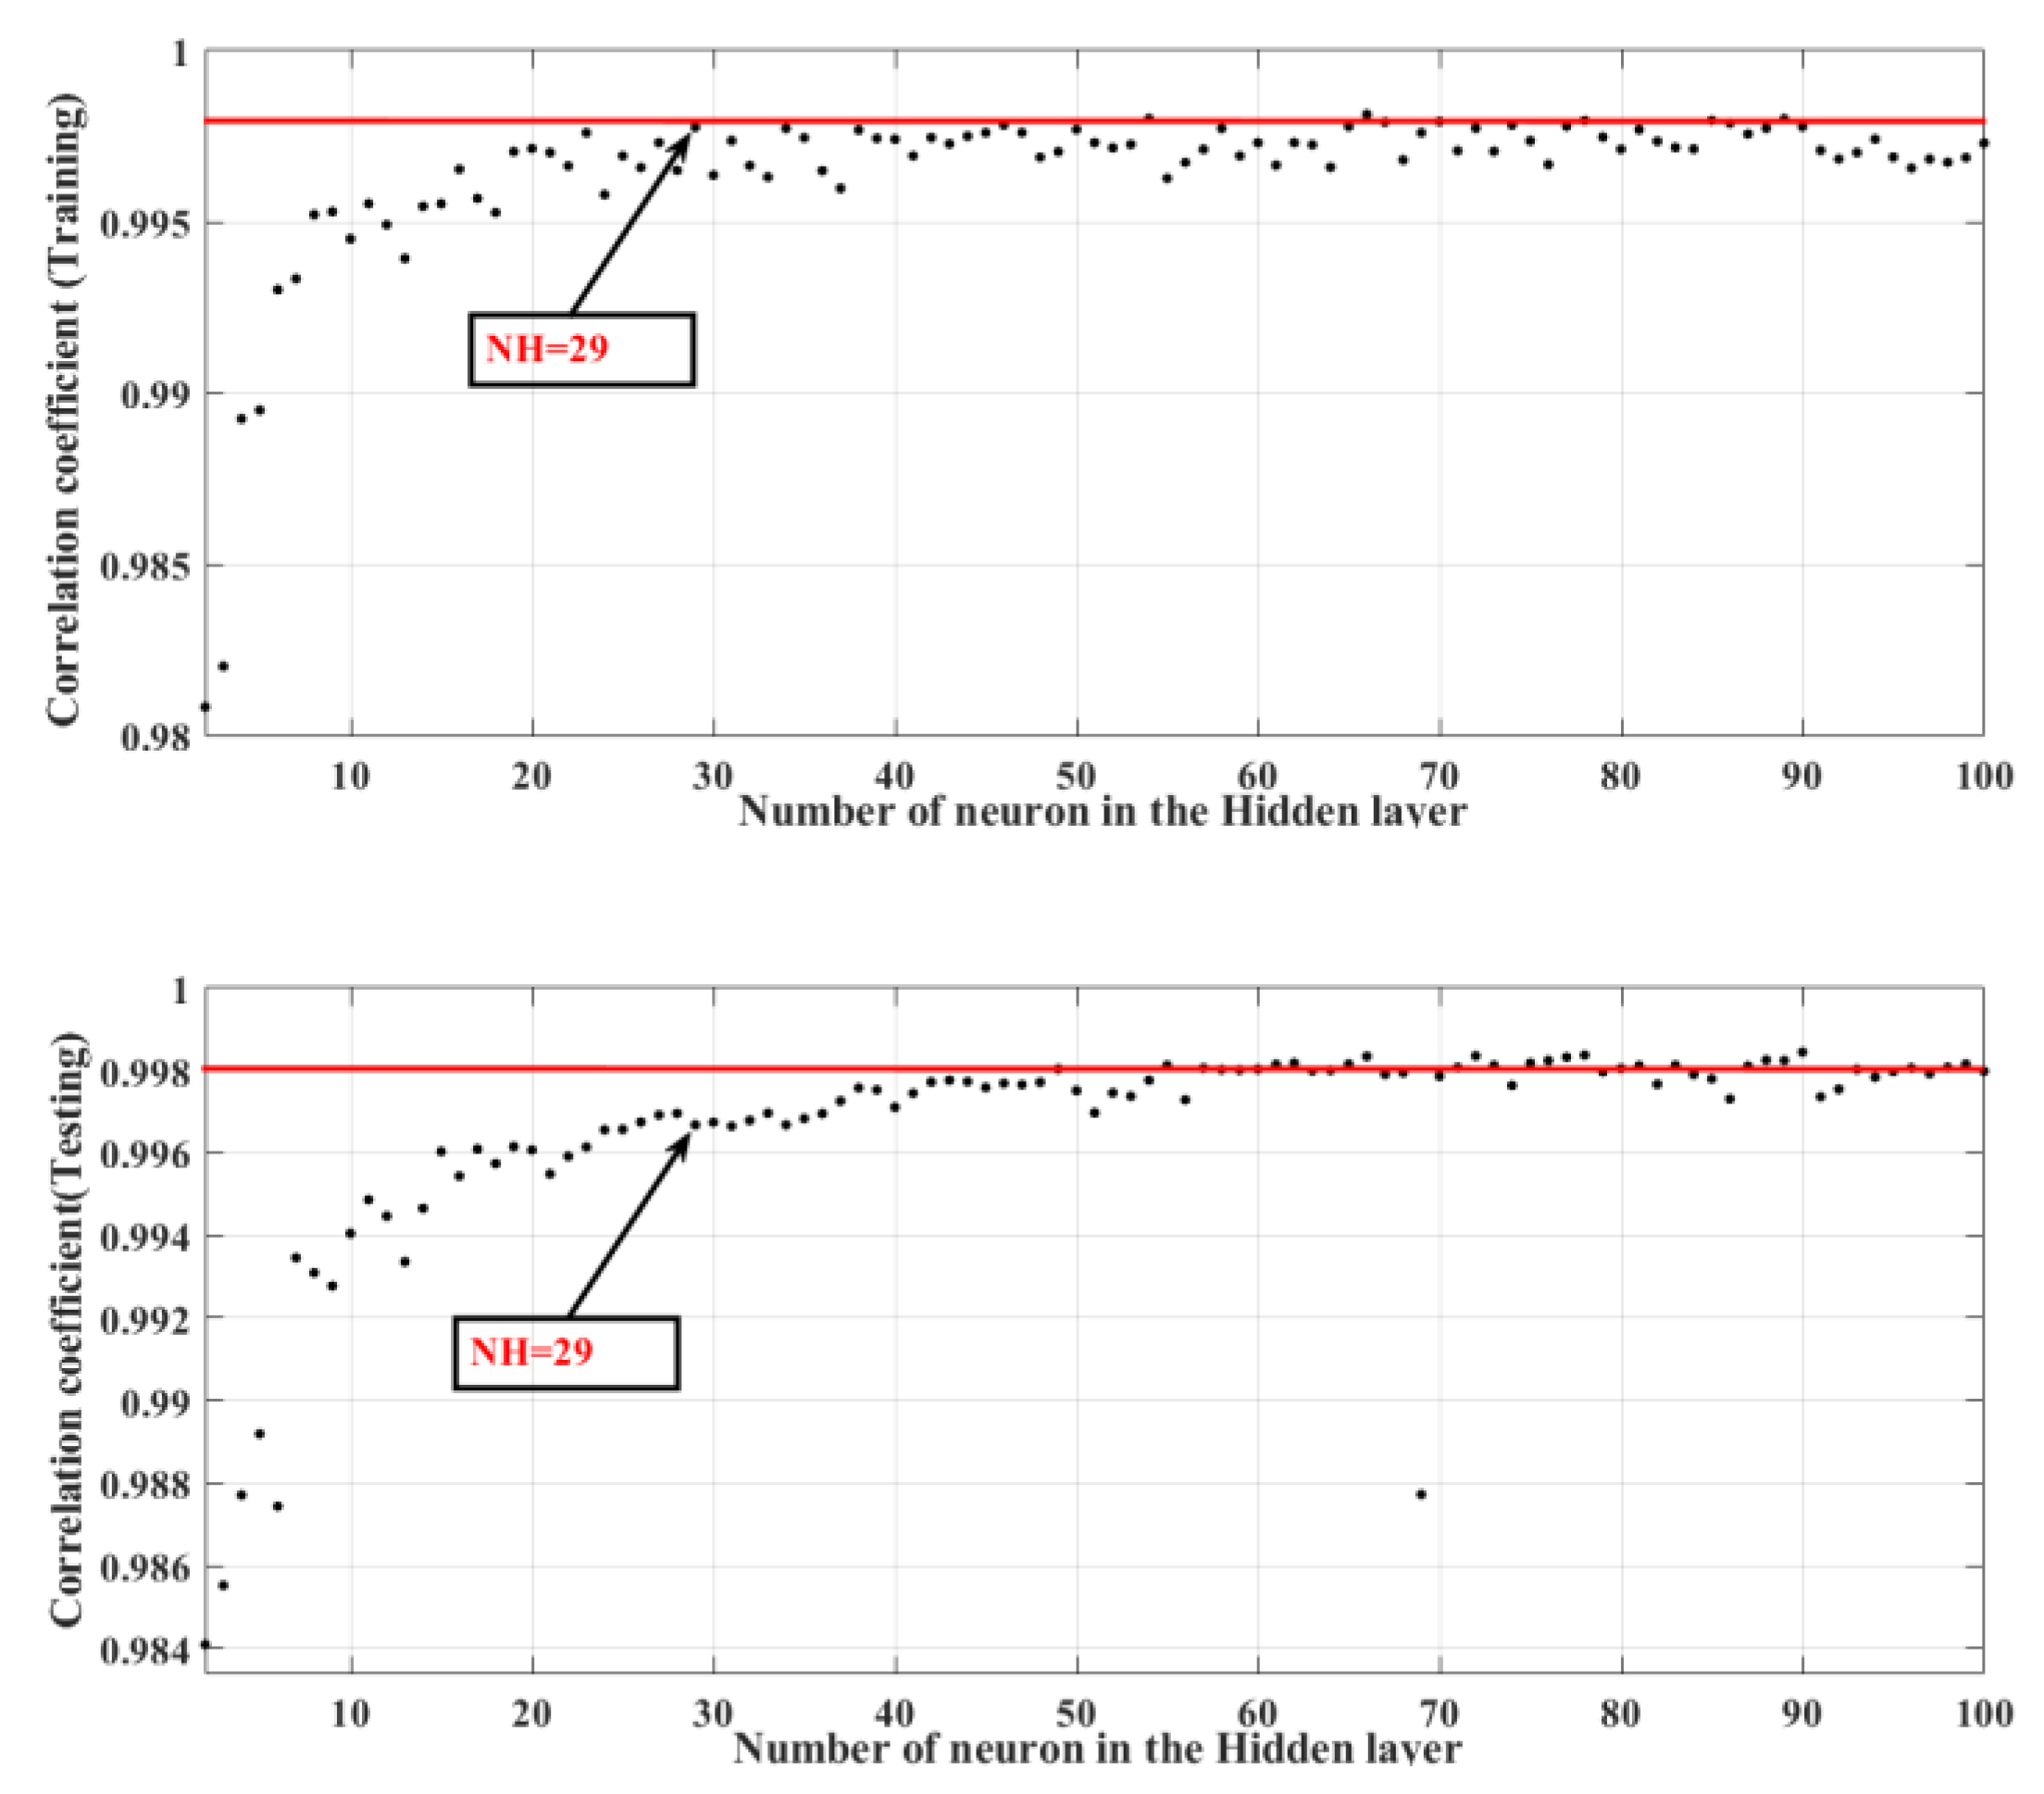
3.3. Parametric Sensitivity Algorithm

Based on the preceding findings related to training function and transfer functions, a parametric sensitivity algorithm (PSA) was developed to determine the optimal number of neurons in the hidden layer. To expedite the computation time, a series of tests were conducted to establish an appropriate range, which was set from 2 to 100 neurons. The PSA process was then repeated for this range to identify the optimal number of neurons in the hidden layer for the ANN-based water/energy management system.
Figure 4 displays the results of the PSA, showing the correlation coefficient R as a function of the number of neurons in the hidden layer during both the training and testing phases. Based on these results, the most effective architecture for this ANN energy management system involves 29 neurons in the hidden layer (NH = 29). The neural network model successfully estimated power distribution throughout the year, achieving high values for the correlation coefficient R (99%), a root mean square error (RMSE) of 167.2 W, and a coefficient of determination R 2 of 99%.
Figure 5 presents the complete architecture of the developed ANNs, where the input layer comprises four neurons corresponding to hybrid power data P h y b and the levels of the three tanks (H1, H2, and H3). The output layer determines the reference power for the three motor pumps.

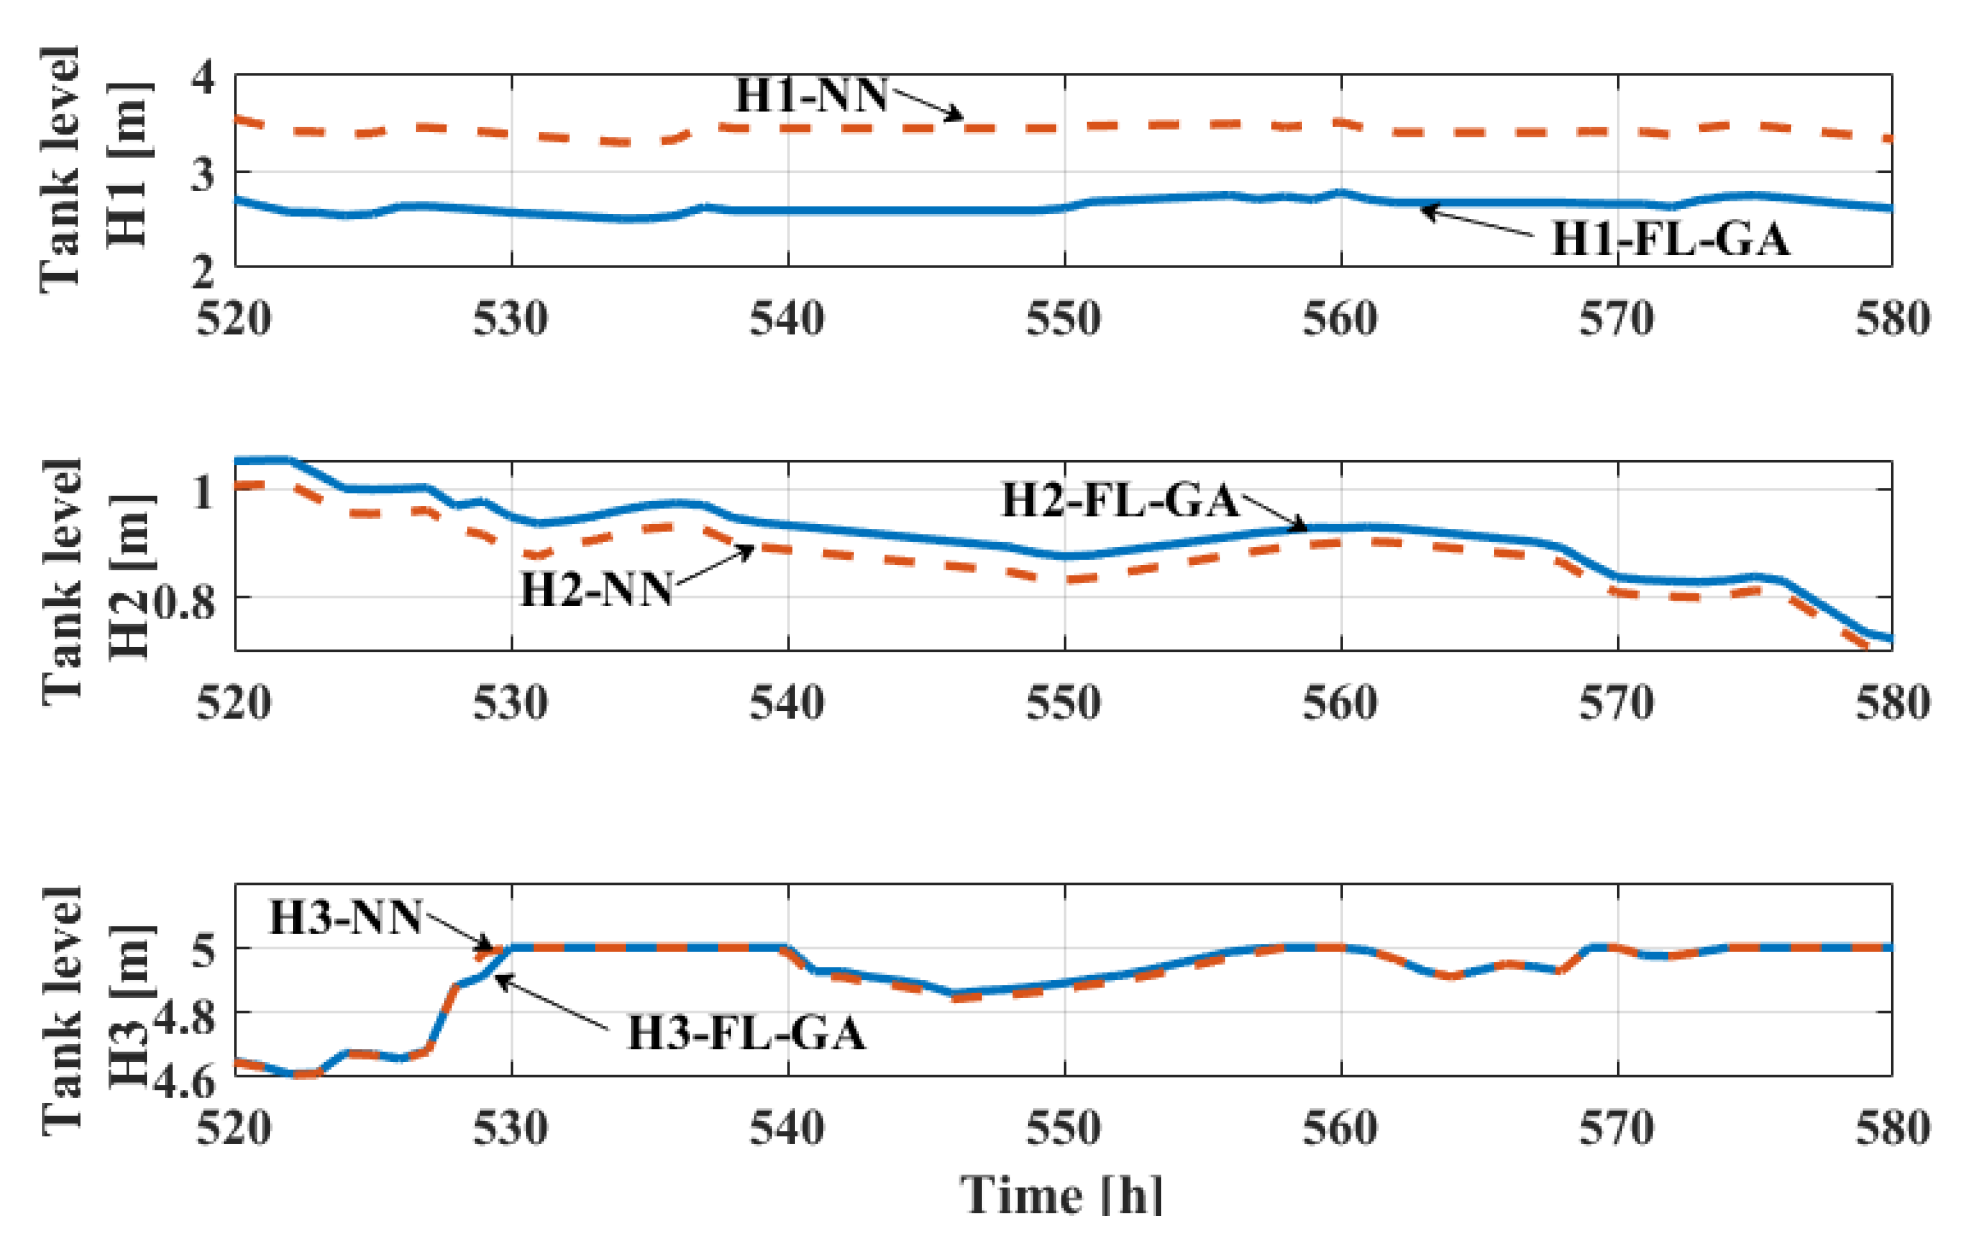
4. Analysis of Errors Generated in Neural Network EMS

This section entails comparing the outcomes of the reverse osmosis water desalination plant integrated with the neural network energy management system against those achieved with the fuzzy logic energy management system optimized by the genetic algorithm, which was utilized during training. Figure 6 illustrates the used hybrid power profile as well as the comparative results of the power sharing between the three motor pumps in the system. Figure 7 shows the comparison of the three associated levels’ tanks. By analyzing these figures, the ANN results follow those of the optimized fuzzy logic, excluding certain errors that do not affect the functionality of the overall system. For the brackish water tank level profile (H1), for example, the greatest difference between the two EMSs is shown by comparing it with the other tank level profiles. For the other two water tanks (permeate and freshwater tanks levels), the responses of both EMSs are almost the same. Despite this difference, the operating mode of the system as shown in Table 3 does not change.
For the EMS outputs designated by the three motor pumps’ power, it is clear that the results of the pumping motor pump P1 are equal. For the desalination motor pump, there are small differences at some points (instants) of the given profile; for example, for t = 520 h, the value of the power using the fuzzy manager optimized by the genetic algorithm is equal to 2600 W against that using the neural network which is equal to 2800 W. Referring to the motor pump’s power limits, it is possible to pump, desalinate, or store water. In this case, given that both brackish water and freshwater tanks’ levels are high, the energy management has chosen the desalination mode ( P e 2   > P e 2 m i n ), but with two different powers. Similarly, for t = 561 h, while the neural management power for the desalination motor pump is close to 2850 W, it must be lower (close to 2600 W) than the FL-GA energy management system. Its value ( P e 2   > P e 2 m i n ) for the two water tank levels (brackish and fresh) is high, which favors the operation of the desalination motor pump. Also, for the other points, even with slight variations, the operating mode of the system remains unchanged. In conclusion, both Figure 6 and Figure 7 show that the ANNEMS follows the same references given by the optimized fuzzy EMS.

5. Experimental Validation of the ANNEMS

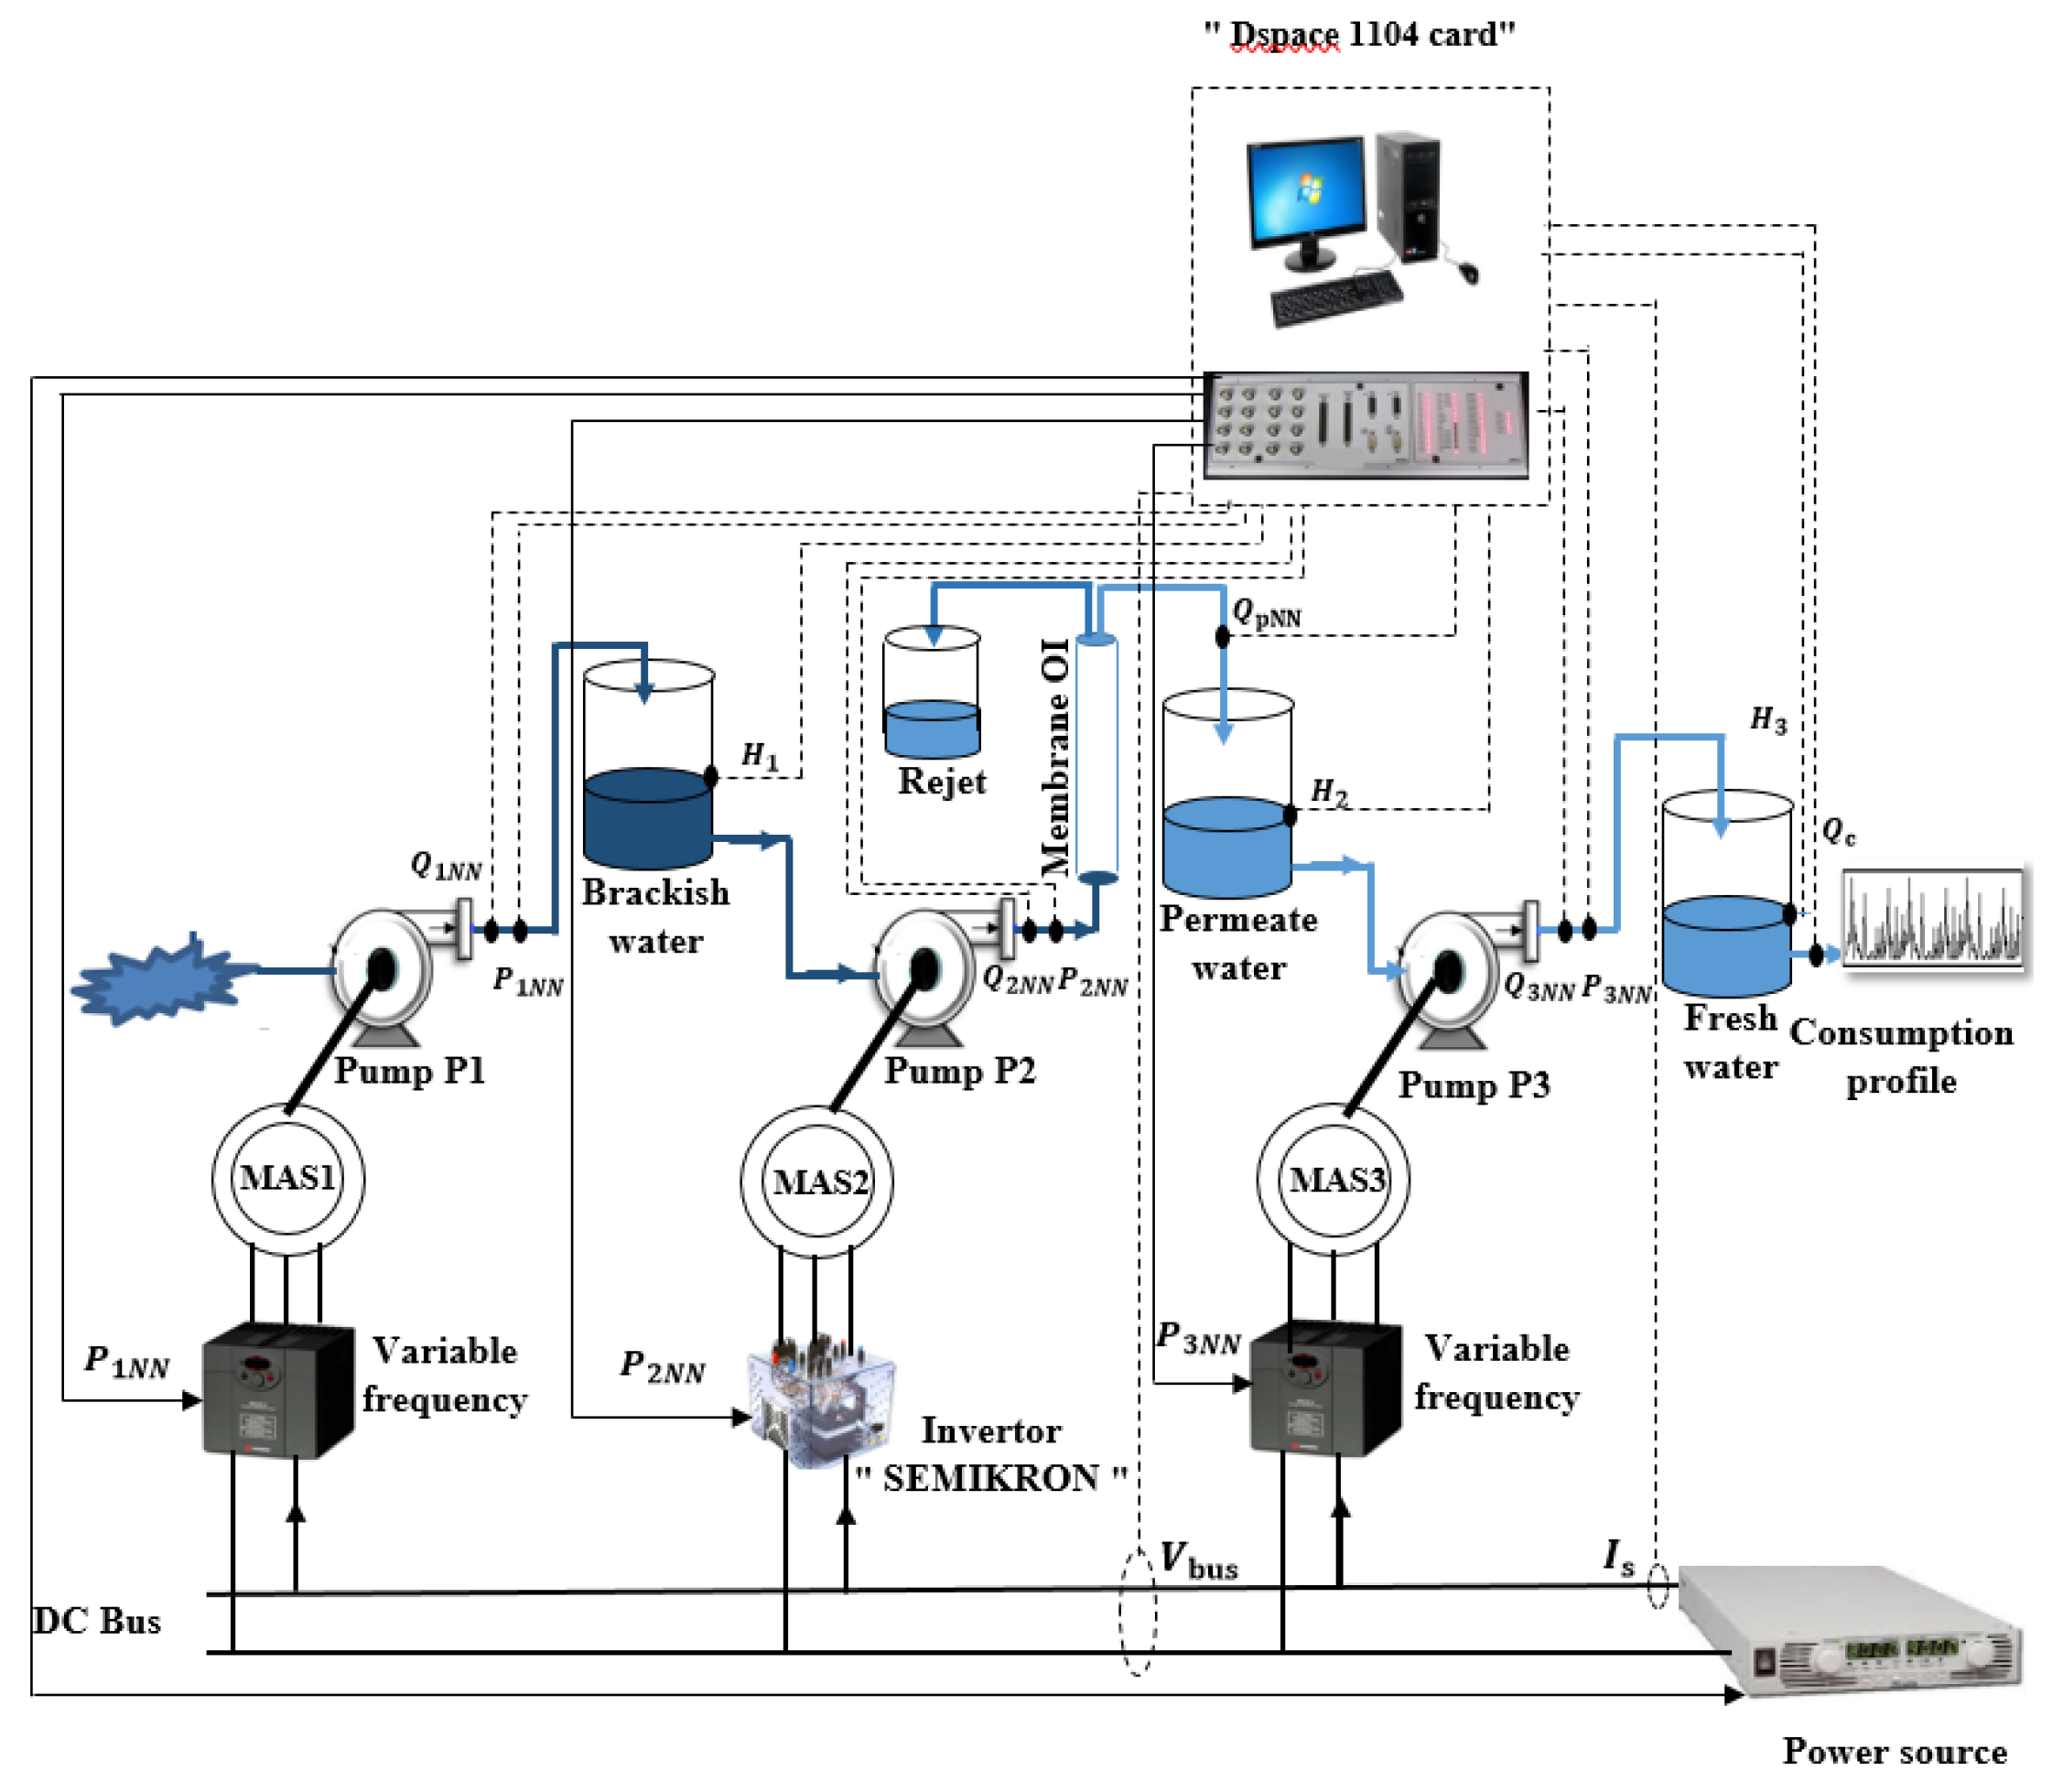
5.1. Experimental Test Bench Characteristics

An experimental test bench was designed to validate the proposed energy management system’s effectiveness and performance. To enable the behavioral investigation of the experimental model and analyze the acquired practical data, the hybrid renewable source can be substituted with a programmable DC power supply. The used emulated source specifications are detailed in Table 4. Two motor pumps with ratings of 1.1 kW and 0.75 kW, corresponding to the pumps P1 and P3 as indicated in Figure 1, were employed. Additionally, a 0.75 kW motor pump was used for desalination, paired with a reverse osmosis module featuring a VONTRON LP21-4040-type spiral membrane. The hydraulic component specifications are detailed in Table 5 and Table 6. For the three water tanks, hardware-in-the-loop emulators were designed. An overview of the experimental test bench and its various components is depicted in Figure 8.

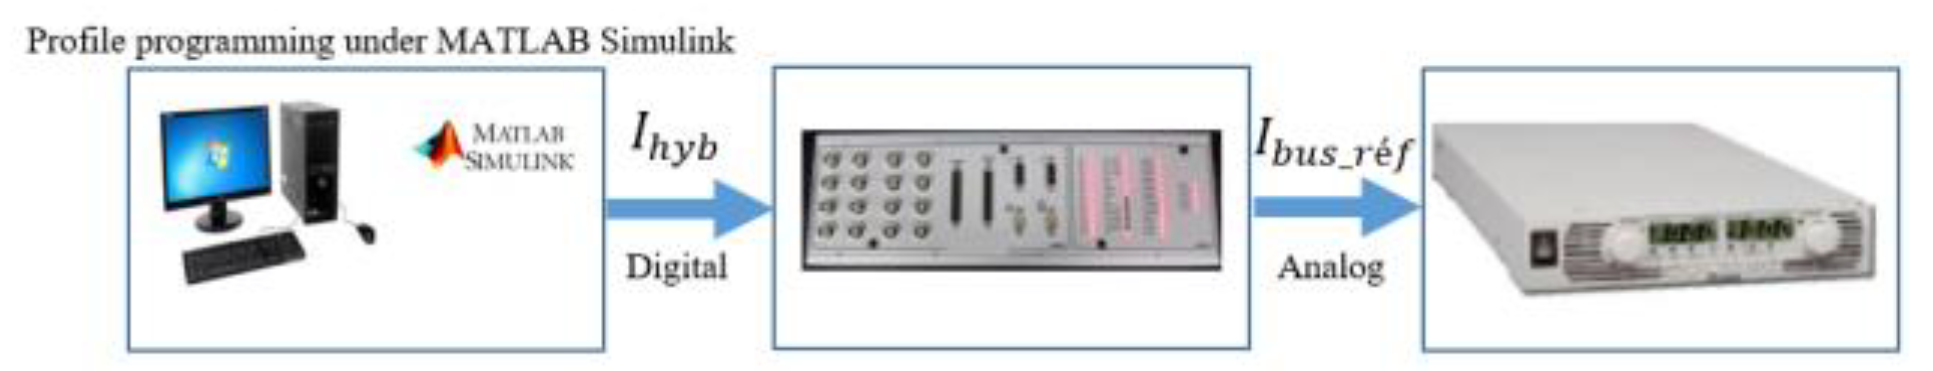
5.1.1. PV/Wind Emulator

The programmable DC power supply was used to emulate renewable energy sources by generating a variable power profile. It operates in two modes: either in voltage source or current source mode. In the case of the voltage source, the voltage is equal to the reference value, and the output current must be less than the reference current. In the current source mode, the generated current is equal to the reference value, and the voltage becomes lower than the reference voltage depending on the equivalent applied DC load. In this case study, the variable profile of the current I h y b generated at the end of the simulation result is processed and converted into digital format by the Matlab/Simulink interface then sent via the dSPACE DS1104 card as an analog reference I b u s r e f to the programmable DC power supply. The emulation process is shown in Figure 9.

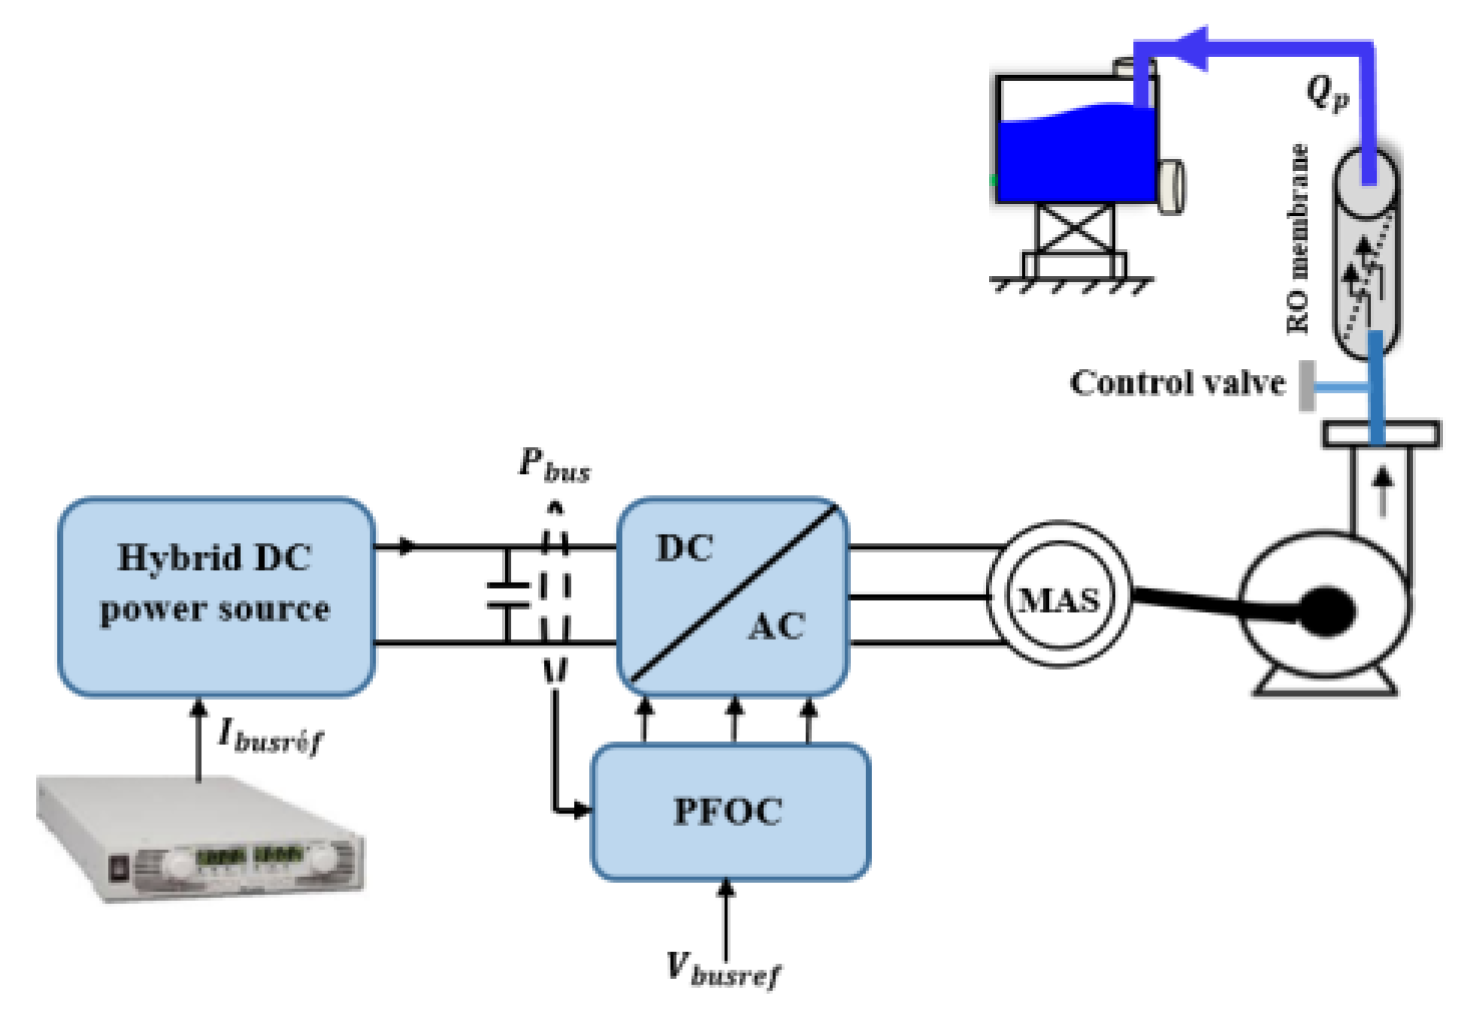
5.1.2. Implementation of the Control Strategy (PFOC)

As mentioned previously, the water pumping/desalination system has three motor pumps which require three power-controlled inverters. This paper uses two variable frequencies drives for the two motor pumps (P1 and P3) operating at fixed speed (equivalent to fixed power). On the other hand, a SEMIKRON inverter coupled with a power field oriented control (PFOC) strategy is used to drive the motor pump intended for water desalination. Consequently, the motor pump operates at variable power depending on the operating mode and the evolution of the produced power from renewable sources. The originality of PFOC resides in controlling the DC bus voltage and the magnetization state of the induction motor pump. Figure 10 illustrates the proposed block diagram of the control strategy (PFOC) [28]. This control strategy must be first implemented and tested on the dSPACE card.
For this reason, to verify the good performance of the DC bus voltage control loop of the PFOC strategy, the authors have developed the test cycle presented in Figure 11. Initially, the authors configure the programmable power supply to set the voltage and current to approximately V   b u s ≈ 320 V and I b u s = 1 A, respectively. At t = 0 s, the power supply operates as a voltage source so V   b u s ≈ 320 V and I b u s = 0. At t = 3.5 s, the DC bus voltage switches to a reference of 300 V settled by the PFOC strategy. Consequently, the power supply switches to current source mode to impose I b u s = 1 A. At t = 10 s, the authors program, through the power supply, a new current limit to 2 A. At t = 18 s, the authors change the current limit again to 1.5 A. The DC bus voltage remains at the reference of 300 V. At t = 25 s, the system was stopped, the power supply switches to voltage source mode at its initial reference with a value close to 320 V. In conclusion, Figure 11 demonstrates the effective voltage regulation performance during the transitions between the two modes and while adjusting the bus current: when regulating the DC bus voltage, the bus power changes in the same way as the current.

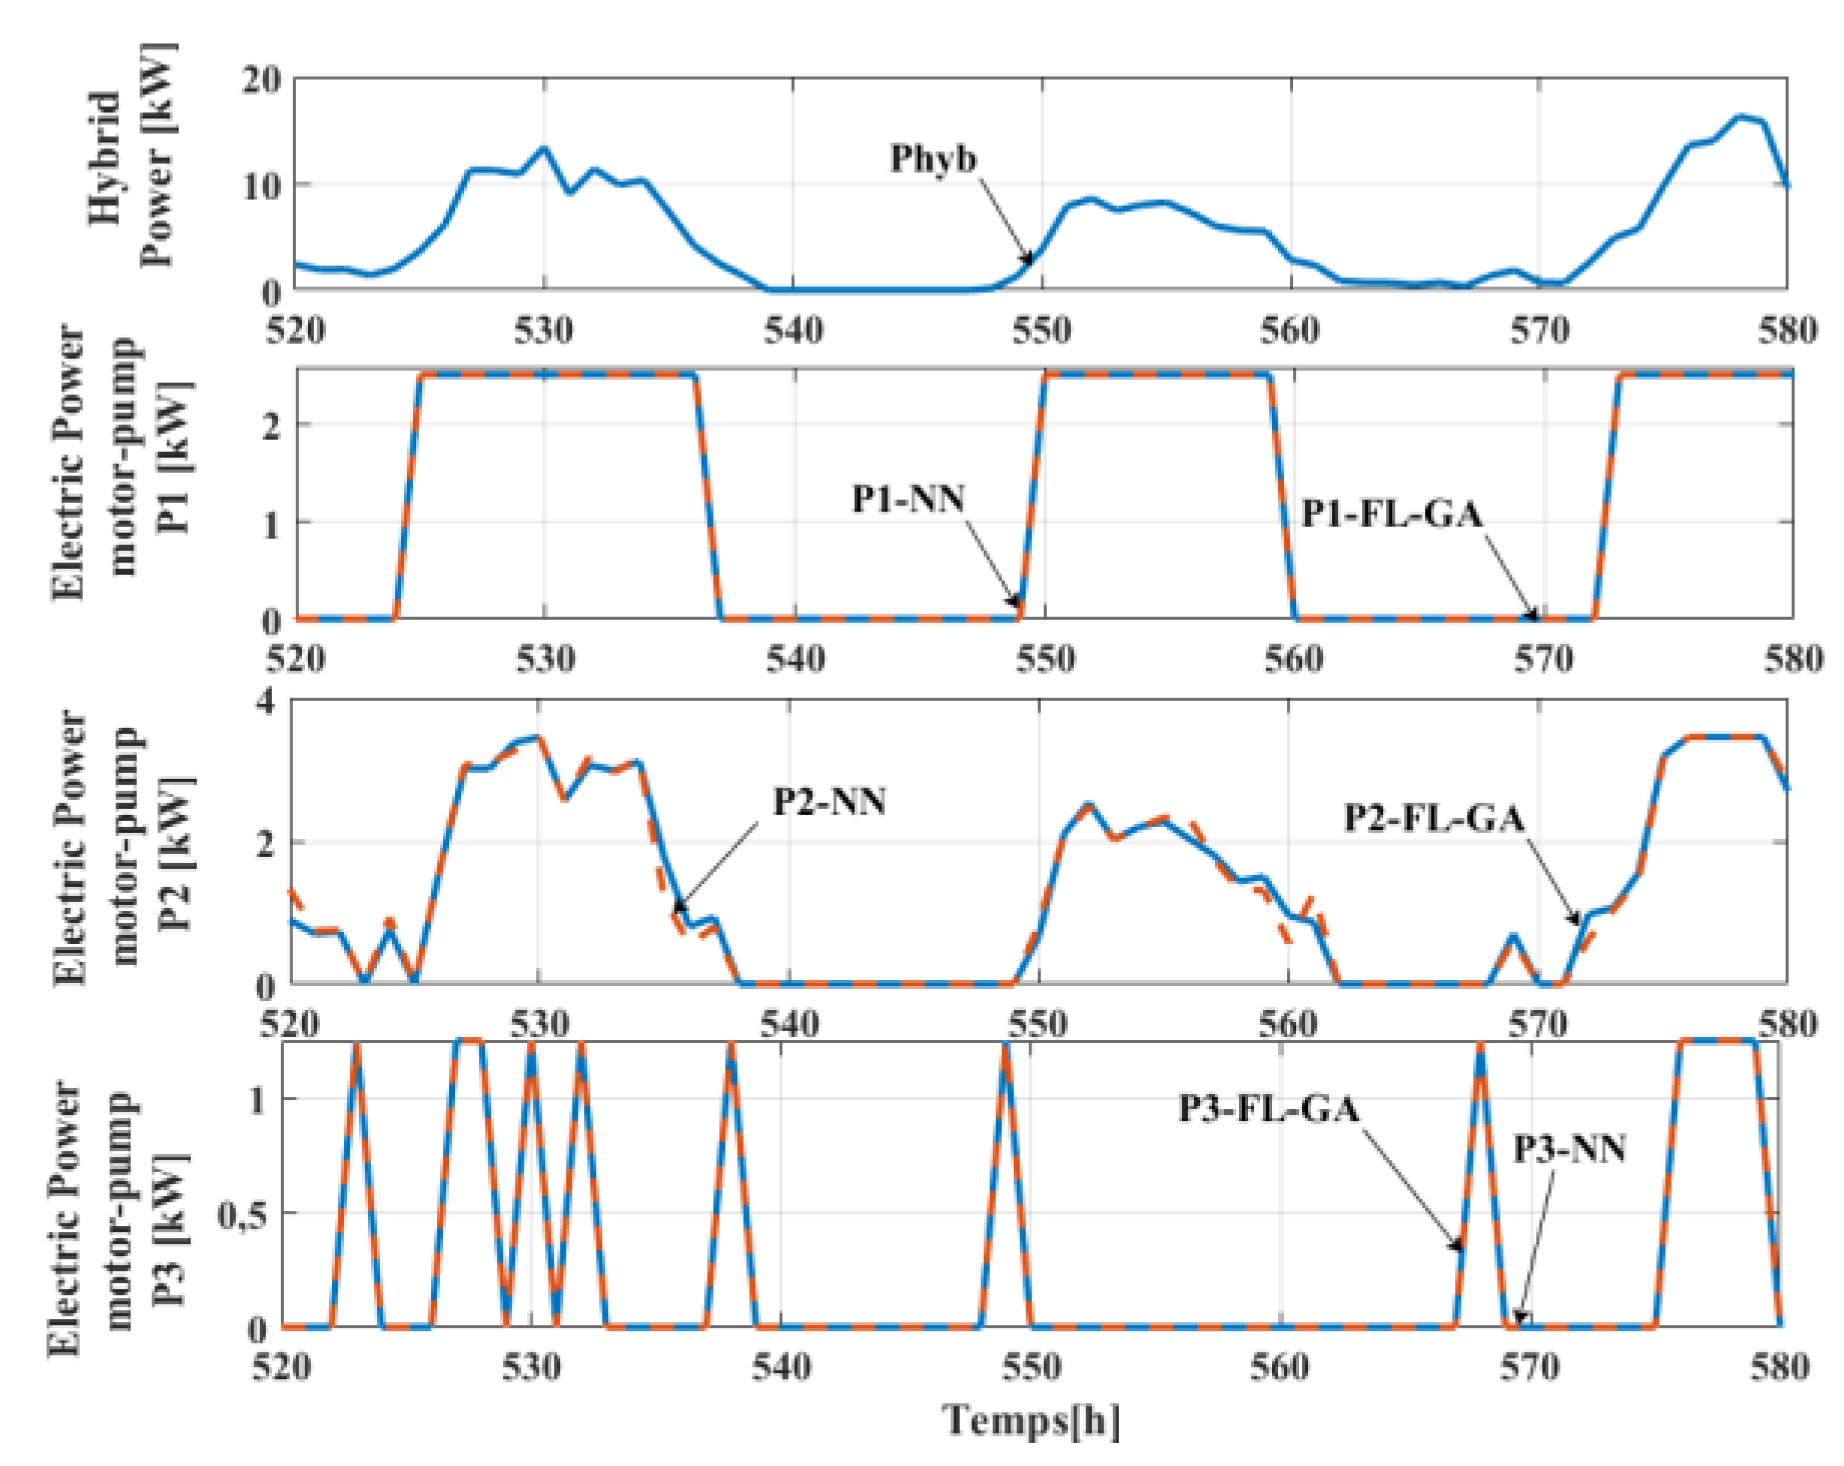
5.2. Implementation and Analysis of the Neural Network Energy Management Experimental Results

The PFOC strategy and the ANNEMS were implemented in the DSPACE dS1104 board with a sampling period of 200 µs. The switching frequency of the PWM is set at 6 kHz and tested on the pumping/desalination test bench prototype. The block diagram of the experimental test bench is illustrated in Figure 12. Then, to perform a robustness test of the control and management system and analyze the results, a daily climatic data profile scaled in 100 s was used to check the different operating modes (Figure 13). The experimental results are presented in Figure 14, Figure 15 and Figure 16. Those of pumping and storage motor pumps have shown that the powers follow their reference and can be considered fixed. Furthermore, for the desalination motor pump power, it is variable and it follows the reference one. The water tanks’ levels are shown in Figure 17.
For this profile, five operating modes are presented: system shutdown, desalination, pumping, storage and desalination, pumping and desalination and storage. At the beginning of this practical scenario, the electrical power emitted by the hybrid source is zero until 13 s. During this interval, the EMS activates Mode 0 (system shutdown). Thus, there is stability in the water tanks’ levels H1 and H2 and a reduction in the tank level H3 due to the water consumption. Between 13 s and 28 s, the power generated is greater than the storage motor pump limit P e 3 and the minimum power of the desalination motor pump P e 2 m i n . Also, the storage and permeate water tanks are full. Thus, the EMS remains in Mode 0. Between 28 s and 49 s, the electrical power delivered by the source is at a maximum. The EMS decides to operate all the motor pumps (Mode 7) by imposing fixed reference values, P1-NN* and P3-NN*, for the pumping and storage motor pumps. The desalination motor pump operates at its maximum power value. Then, the water tank level H1 decreases since the desalination motor pump is operating at its maximum power, which is greater than that of the pumping motor pump. In addition, the water tank level H3 is decreased due to the increase in the consumption flow rate. At t = 40 s, due to the decline in the water consumption, the water tank level H3 is increased. Between 49 s and 63 s, the hybrid electric power declines and Mode 2 is activated where the EMS must operate only the desalination. This leads to a decrease in the brackish water tank level H1, an increase in the permeate water tank level H2, and stability in the freshwater tank level H3 owing to the low water demand. Then, between 63 s and 73 s, the EMS switches to operate the three motor pumps. Hence, there is a decrease in the two tank levels H1 and H2, while the freshwater tank level H3 reaches its maximum value. Between 78 s and 93 s, the power delivered decreases and the desalination motor pump and the storage pump operate (Mode 4). During the interval between 93 s and 101 s, the power is low and the system is shutdown (Mode 0). The water tank levels H1 and H2 are constant, and the freshwater tank decreases which is justified by the height demand for consumption.

6. Conclusions

During this study, a standalone reverse osmosis pumping and desalination process integrated with a renewable energy source (PV/wind) was developed and validated using a test bench prototype. This innovative approach aims to reduce battery costs by employing hydraulic storage instead of electrochemical storage. The novelty of this paper lies in the development of an energy management strategy based on artificial neural networks, which can be replicated and validated by other researchers with similar system prototypes. To determine the optimal architecture of the artificial neural network, inputs and outputs from an FL-GA energy management system were used for modeling (training and validation). Neural networks require the configuration of multiple parameters, prompting the development of a parametric sensitivity algorithm to identify the best network architecture. Several solutions and neural network configurations were proposed, with the optimal solution chosen based on three evaluation criteria: the correlation coefficient R, root mean square error (RMSE), and coefficient of determination R².
Finally, the paper concludes with an experimental validation of the developed energy management system using a pumping/desalination prototype. The model and energy management strategy contribute to sustainable ecosystem development by maximizing freshwater production. This approach aligns with sustainable development principles, promoting a balanced integration of economic, social, and environmental factors.

Author Contributions

Conceptualization, A.Z.; methodology, A.B.R.; formal analysis, J.B. and A.B.R.; investigation, A.Z.; resources, J.B.; writing—original draft preparation, A.Z.; writing—review and editing, A.B.R. and J.B.; supervision, J.B. All authors have read and agreed to the published version of the manuscript.

Funding

This work was supported by the Tunisian Ministry of Higher Education and Research under Grant LSE–ENIT-LR 11 ES15 and the PHC-Unique project CMCU: 2023-2025 code “23G1124”.

Data Availability Statement

Data are contained within the article.

Conflicts of Interest

The authors declare no conflicts of interest.

References

  1. Vinci, G.; Maddaloni, L.; Mancini, L.; Prencipe, S.A.; Ruggeri, M.; Tiradritti, M. The Health of the Water Planet: Challenges and Opportunities in the Mediterranean Area. An Overview. Earth 2021, 2, 894–919. [Google Scholar] [CrossRef]
  2. The United Nations World Water Development Report 2019. Available online: https://www.unwater.org/ (accessed on 8 May 2024).
  3. Greenlee, L.F.; Lawler, D.F.; Freeman, B.D.; Marrot, B.; Moulin, P. Reverse Osmosis Desalination: Water Sources, Technology, and Today’s Challenges. Water Res. 2009, 43, 2317–2348. [Google Scholar] [CrossRef] [PubMed]
  4. Rhouma, A.B.; Belhadj, J.; Roboam, X. Energy management and control strategy for water pumping system fed by intermittent renewable sources. In Proceedings of the 12th International Conference on Modeling and Simulation of Electric Machines, Converters and Systems (ELECTRIMACS’2017), Toulouse, France, 4–6 July 2017. [Google Scholar]
  5. García-Rodríguez, L. Renewable Energy Applications in Desalination: State of the Art. Sol. Energy 2003, 75, 381–393. [Google Scholar] [CrossRef]
  6. Alkaisi, A.; Mossad, R.; Sharifian-Barforoush, A. A Review of the Water Desalination Systems Integrated with Renewable Energy. Energy Procedia 2017, 110, 268–274. [Google Scholar] [CrossRef]
  7. Macana, C.A.; Pota, H.R.; Zhu, Q.; Guerrero, J.M.; Vasquez, J.C. Experiments on a Real-Time Energy Management System for Islanded Prosumer Microgrids. Electronics 2019, 8, 925–942. [Google Scholar] [CrossRef]
  8. OECD. Energy Policies of IEA Countries; OECD: Paris, France, 2017. [Google Scholar]
  9. García, P.; Torreglosa, J.P.; Fernández, L.M.; Jurado, F. Optimal energy management system for stand-alone wind turbine/photovoltaic/hydrogen/battery hybrid system with supervisory control based on fuzzy logic. Int. J. Hydrogen Energy 2013, 33, 14146–14158. [Google Scholar] [CrossRef]
  10. Li, Q.; Loy-Benitez, J.; Nam, K.; Hwangbo, S.; Rashidi, J.; Yoo, C. Sustainable and reliable design of reverse osmosis desalination with hybrid renewable energy systems through supply chain forecasting using recurrent neural networks. Energy 2019, 178, 277–292. [Google Scholar] [CrossRef]
  11. Dimitriou, E.; Loukatos, D.; Tampakakis, E.; Arvanitis, K.G.; Papadakis, G. An Experimental Investigation of an Open-Source and Low-Cost Control System for Renewable-Energy-Powered Reverse Osmosis Desalination. Electronics 2024, 13, 813–833. [Google Scholar] [CrossRef]
  12. Leonori, S.; Paschero, M.; Frattale Mascioli, F.M.; Rizzi, A. Optimization strategies for Microgrid energy management systems by Genetic Algorithms. Appl. Soft Comput. 2020, 86, 105–903. [Google Scholar] [CrossRef]
  13. Wang, S.; Zhang, Y.; Zhang, C.; Yang, M. Improved artificial neural network method for predicting photovoltaic output performance. Glob. Energy Interconnect. 2020, 3, 553–561. [Google Scholar] [CrossRef]
  14. Zgalmi, A.; Ben Rhouma, A.; Cherif, H.; Belhadj, J. Energy management based fuzzy-logic of a reverse osmosis desalination powered with hybrid system. In Proceedings of the IEEE 2nd International Conference on Signal, Control and Communication (SCC), Hammamet, Tunisia, 20–22 December 2021. [Google Scholar]
  15. Zgalmi, A.; Ben Rhouma, A.; Cherif, H.; Belhadj, J. Intelligent Artificial power sharing of water desalination plant fed by renewable source. In Proceedings of the IEEE International Conference on Electrical Sciences and Technologies in Maghreb (CISTEM), INSAT, Tunis, Tunisia, 26–28 October 2022. [Google Scholar]
  16. Layadi, T.M.; Champenois, G.; Mostefai, M. Modeling and Design Optimization of an Autonomous Multisource System Under a Permanent Power-Supply Constraint. IEEE Trans. Sustain. Comput. 2015, 3, 872–880. [Google Scholar] [CrossRef]
  17. Abbes, D.; Martinez, A.; Champenois, G. Eco-design optimisation of an autonomous hybrid wind–photovoltaic system with battery storage. IET Renew. Power Gener. 2012, 6, 358–371. [Google Scholar] [CrossRef]
  18. Zaibi, M.; Cherif, H.; Champenois, G.; Sareni, B.; Roboam, X.; Belhadj, J. Sizing methodology based on design of experiments for freshwater and electricity production from multi-source renewable energy systems. Desalination 2018, 446, 94–103. [Google Scholar] [CrossRef]
  19. Zgalmi, A.; Cherif, H.; Belhadj, J. Smart energy management based on the artificial neural network of a reverse osmosis desalination unit powered by renewable energy sources. In Innovative and Intelligent Technology-Based Services for Smart Environments—Smart Sensing and Artificial Intelligence, 1st ed.; Ben Slama, S., Choubani, F., Benavente-Peces, C., Abdelkarim, A., Eds.; CRC Press: London, UK, 2021; pp. 181–188. [Google Scholar]
  20. Dhanalakshmi, V.; Bino, D.; Saravanan, A.M. Opinion mining from student feedback data using supervised learning algorithms. In Proceedings of the 3rd MEC International Conference on Big Data and Smart City (ICBDSC), Mascat, Oman, 15–18 March 2016. [Google Scholar]
  21. Shang, Y.; Li, S. FedPT-V2G: Security enhanced federated transformer learning for real-time V2G dispatch with non-IID data. Appl. Energy 2024, 358, 122–626. [Google Scholar] [CrossRef]
  22. Zhu, N.; Wang, Y.; Yuan, K.; Yan, J.; Li, Y.; Zhang, K. GGNet: A novel graph structure for power forecasting in renewable power plants considering temporal lead-lag correlations. Appl. Energy 2024, 364, 123–194. [Google Scholar] [CrossRef]
  23. Tan, M.; Hu, C.; Chen, J.; Wang, L.; Li, Z. Multi-node load forecasting based on multi-task learning with modal feature. Eng. Appl. Artif. Intell. 2022, 112. [Google Scholar] [CrossRef]
  24. Taki, M.; Rohani, A.; Yildizhan, H. Application of machine learning for solar radiation modeling. Theor. Appl. Climatol. 2021, 143, 1599–1613. [Google Scholar] [CrossRef]
  25. Rahimi, M.; Abbaspour-Fard, M.H.; Rohani, A. A multi-data-driven procedure towards a comprehensive understanding of the activated carbon electrodes performance (using for supercapacitor) employing ANN technique. J. Renew. Energy 2021, 180, 980–992. [Google Scholar] [CrossRef]
  26. Siavash, N.K.; Ghobadian, B.; Najafi, G.; Rohani, A.; Tavakoli, T.; Mahmoodi, E.; Mamat, R.; Mazlan, M. Prediction of power generation and rotor angular speed of a small wind turbine equipped to a controllable duct using artificial neural network and multiple linear regression. Environ. Res. 2021, 196, 110434. [Google Scholar] [CrossRef] [PubMed]
  27. Rahimi, M.; Abbaspour-Fard, M.H.; Rohani, A. Synergetic effect of N/O functional groups and microstructures of activated carbon on supercapacitor performance by machine learning. J. Power Sources 2022, 521, 230–968. [Google Scholar] [CrossRef]
  28. Ben Rhouma, A.; Roboam, X.; Belhadj, J.; Sareni, B. Improved Control Strategy for Water Pumping System Fed by Intermittent Renewable Source. Energies 2023, 16, 7593. [Google Scholar] [CrossRef]
Figure 1. Integrated solar/wind energy generation and water reverse osmosis desalination process.
Electronics 13 02503 g001
Figure 2. The annual meteorological data and the water consumption profile.
Electronics 13 02503 g002
Figure 3. ANNEMS structure.
Electronics 13 02503 g003
Figure 4. Correlation coefficient training results and correlation coefficient testing results of the parametric sensitivity algorithm.
Electronics 13 02503 g004
Figure 5. The developed ANN architecture.
Electronics 13 02503 g005
Figure 6. Comparative results of FL-GA and ANN simulations of the three motor pumps for a hybrid profile.
Electronics 13 02503 g006
Figure 7. Comparative results of FL-GA and ANN of the three water levels (H1, H2, and H3) for a hybrid profile.
Electronics 13 02503 g007
Figure 8. Experimental test bench prototype.
Electronics 13 02503 g008
Figure 9. Emulation process.
Electronics 13 02503 g009
Figure 10. Block diagram of the control strategy (PFOC).
Electronics 13 02503 g010
Figure 11. Voltage and current evolution as a function of the DC bus power variation.
Electronics 13 02503 g011
Figure 12. Block diagram of the experimental test bench.
Electronics 13 02503 g012
Figure 13. Actual and reference hybrid power variation.
Electronics 13 02503 g013
Figure 14. Actual and reference pumping motor pump power variation.
Electronics 13 02503 g014
Figure 15. Actual and reference desalination motor pump power variation.
Electronics 13 02503 g015
Figure 16. Actual and reference storage motor pump power variation.
Electronics 13 02503 g016
Figure 17. The fluctuations in the levels of the three tanks and the variations in water consumption.
Electronics 13 02503 g017
Table 1. ANN training results based on training function.
Training
Algorithm
Correlation
Coefficient (R)
RMSE (W) R 2
EntrainmentTestEntrainmentTestEntrainment
Trainbfg 0.947670.94554601589.60.9323
Trainbr0.98030.98033243.7220.90.9896
Traincgb0.958860.95872515.35120.9517
Traincgf0.865020.862211071994.30.7606
Traincgp0.965180.96182520.7512.90.9508
Traingd0.442120.44284677467810.08678
Traingdm0.418490.42706325533010.1348
Traingda0.771080.77326115333010.4116
Traingdx0.895040.89161786.1744.90.8739
Trainlm0.978330.97845291.4253.20.9851
Trainoss0.960160.96637678.2651.50.914
Trainrp0.966920.96766540524.20.9467
Trainscg0.960040.96063530.1526.90.9487
Table 2. The training performance of all combinations of commonly utilized transfer functions in both hidden and output layers.
Function Type in the Output and Hidden LayersCorrelation
Coefficient (R)
RMSE (W) R 2
EntrainmentTestEntrainmentTestEntrainment
[Tansig–purelin]0.980310.9804248.3217.30.9892
[Tansig–tansig]0.981210.98106265227.50.9878
[Tansig–logsig]0.796570.79676128212660.6667
[Logsig–logsig]0.803260.80468128412670.666
[Logsig–tansig]0.979840.98044202.61670.9928
[Logsig–purelin]0.981280.98135295.3247.70.9846
[Purelin–logsig]0.619520.61924130212820.6607
[Purelin–purelin]0.816550.816711006978.30.7744
[Purelin–tansig]0.795110.79442482.5477.90.9578
Table 3. The hydraulic management modes.
ScenariosPumpingDesalinationStorage
Mode
M0---
M1--
M2--
M3--
M4-
M5-
M6-
M7
Note: √: active pump; -: inactive pump.
Table 4. Technical Information of the programmable DC power supply.
DC Power Supply
ReferenceKEYSIGHT-N8762
Output DC power range0–5100 W
Output DC voltage range0–600 V
Output DC current range0–8.5 A
Table 5. Related values of the pumping and storage pumps.
Pumping Motor PumpStorage Motor Pump
LOWARA 5HM06LOWARA CEA 80/5
1.1 kW0.75 kW
3 Phases, 50 Hz3 Phases, 50 Hz
240 V-3.6 A240 V-3.65 A
40–142 L/min30–100 L/min
Table 6. RO membrane characteristics.
RO Membrane
ReferenceVONTRON LP21-4040
Diameter–Area4”–40 m²
Minimum salt rejection99.5%
Freshwater nominal flow 9.1 m³/day
Maximum operating pressure 15.5 bar
Maximum recovery rate 15%
Maximum water temperature brackish water pH range25 °C
Disclaimer/Publisher’s Note: The statements, opinions and data contained in all publications are solely those of the individual author(s) and contributor(s) and not of MDPI and/or the editor(s). MDPI and/or the editor(s) disclaim responsibility for any injury to people or property resulting from any ideas, methods, instructions or products referred to in the content.

