Article

Effect of Different Weight on the Movable PZT Device on the Damage Detection Performance of Electromechanical Impedance Technique

Department of Civil Engineering, Seoul National University of Science and Technology, Seoul 01811, Republic of Korea
*
Author to whom correspondence should be addressed.
Electronics 2024, 13(13), 2589; https://doi.org/10.3390/electronics13132589
Submission received: 21 May 2024 / Revised: 21 June 2024 / Accepted: 26 June 2024 / Published: 1 July 2024

Abstract

:
This study presents a novel approach to conducting the electromechanical impedance (EMI) technique for delamination detection in composite structures without the need for permanently attaching PZT (Lead Zirconate Titanate) transducers to the surface. Instead, a device is created that can be simply placed on top of the composite structure, enabling one to perform the EMI technique for detecting damage. The primary objective is to investigate the effectiveness of this device in detecting delamination within composite materials. Additionally, this study explores the impact of placing additional weight on top of the transducer to investigate the performance of the device subjected to higher pressure. Experimental results and analysis will be presented to evaluate the feasibility and reliability of this approach for non-destructive testing and structural health monitoring of composite components. This research is significant as it lays the groundwork for developing automated damage detection systems using robotics in the near future. By demonstrating the proposed concept that can be easily integrated into robotic platforms, this study contributes to the advancement of automation in structural health monitoring. Implementing this technique in robotic systems has the potential to revolutionize maintenance practices by enabling continuous, real-time monitoring of composite structures, enhancing safety, and minimizing downtime due to structural defects. Moreover, the investigation into the impact of additional weight on the transducer’s performance is crucial for setting minimum weight limits in robotic systems, ensuring optimal functionality and accuracy during automated damage detection tasks.

1. Introduction

Composite materials have become increasingly prevalent in a wide range of industries due to their desirable properties such as high strength-to-weight ratio, corrosion resistance, and versatility in design [1]. However, one of the inherent challenges associated with composite structures is the detection and monitoring of internal defects, particularly delamination, which can significantly compromise structural integrity over time. Delamination refers to the separation or debonding of layers within a composite material, often caused by manufacturing inconsistencies, impact damage, or environmental factors such as moisture ingress or temperature fluctuations. Detecting delamination at an early stage is critical to preventing catastrophic failures and ensuring the long-term reliability and safety of composite components. Up to date, various authors have investigated detecting the delamination of composite structures using non-destructive testing (NDT) techniques. These include ultrasonic testing [2,3,4], thermography [5,6,7], acoustic emission [8,9,10], electromagnetic testing [11,12] and electromechanical impedance technique [13,14,15]. Here, the EMI technique offers several advantages compared to other NDT techniques, such as its sensitivity to small defects and cost effectiveness.
The EMI technique has emerged as a promising method for non-destructive evaluation and structural health monitoring of composite structures. Traditionally, this technique involves permanently bonding piezoelectric transducers, such as PZT transducers, to monitor changes in impedance caused by structural defects. PZT transducers are also widely used due to their advantages. For example, Griffin et al. [16] conducted a study to determine the quality of piezoelectric wafer active sensors (PWAS) used in structural health monitoring (SHM) by applying piezoelectric sensors to acoustic emission applications. Wang et al. [17] proposed a damage imaging method using an enhanced Lamb wave virtual time reversal (VTR) algorithm through a PZT transducer. And Dipon et al. [18] developed a low-power data logging system that collects energy through a stacked PZT converter from vehicle vibrations on the road. Regarding the EMI technique, the permanent attachment of sensors may not be practical for certain applications, particularly in aerospace, civil infrastructure, or marine industries where surface integrity must be preserved. In response to this challenge, our study proposes a novel approach to EMI-based delamination detection that eliminates the need for permanent sensor attachment. Instead, a device is created that can simply be placed on top of composite materials, allowing one to conduct the EMI technique for damage detection without compromising structural integrity. This innovative concept aims to facilitate efficient and cost-effective inspection of composite components, enabling the timely detection of delamination without requiring complex installation procedures or modifications to the structure. The innovation of this new proposed idea lies in the development of a portable device that can be easily applied and removed, providing a practical solution that has not been previously explored in EMI applications. Furthermore, our research investigates the impact of applying additional weight to the PZT transducer to investigate the performance of the device subjected to higher pressure. This aspect of the study is crucial for understanding the interaction between sensor placement and detection performance, particularly in the context of future automation and robotics applications for structural health monitoring. Additionally, we present comprehensive experimental findings and analysis to validate the effectiveness and reliability of our non-permanent EMI technique for delamination detection in composite structures. The results of this study contribute to advancing the field of non-destructive testing and pave the way for developing automated damage detection systems using robotics. By leveraging non-invasive sensing techniques and exploring innovative sensor configurations, our research aims to enhance the safety, durability, and efficiency of composite structures across various industrial sectors.

2. Electromechanical Impedance Technique

2.1. The Electromechanical Impedance Technique

In the context of SHM, the EMI technique utilizes the piezoelectric properties of PZT transducers, which can convert mechanical stress or strain into electrical signals and vice versa. In a typical EMI setup, PZT transducers are permanently attached to the surface of a structure using adhesives or bonding agents. These transducers act as both sensors and actuators, capable of generating and detecting mechanical waves or vibrations within the structure. When the structure is subjected to external forces, impacts, or internal defects (such as delamination in composite materials), the mechanical properties and impedance of the structure undergo changes. The attached PZT transducers can detect these changes by monitoring variations in electrical impedance, which are indicative of alterations in the structural integrity or condition. This can be seen with the 1-D equation shown in Equation (1), where the electrical admittance (the inverse of impedance), Y ω directly relates to the mechanical impedance of the structure, Z s ω and the attached PZT transducer, Z a ω . This means that any changes in the structure will change its mechanical impedance, which can be detected by monitoring the electrical impedance of the attached PZT patch [19]. Rest of the variables in the equation I , V , ω , a , ε 33 T , δ , d 3 x , Y ¯ x x E are the PZT output current, PZT input voltage, input frequency, geometric constant, dielectric constant, loss tangent, piezoelectric constant, and Young’s modulus, respectively.
Y ω = i ω a ε 33 T 1 i δ Z s ω Z s ω + Z a ω d 3 x 2 Y ¯ x x E
The EMI technique requires one to acquire impedance signatures before and after acquiring impedance signatures, which can be achieved using a statistical metric known as Root mean square deviation (RMSD). The RMSD values have been used to analyze the EMI technique in general, as it has been found to be effective in identifying damage by various researchers. The equation for RMSD is shown below, where Z i o and Z i represents the signatures before and after damage, respectively. The variable N in the equation represents the number of the impedance signature:
RMSD = N R e Z i R e ( Z i o ) 2 / N R e ( Z i o ) 2

2.2. Experimental Setup

To investigate the damage detection performance of the proposed PZT device, two glass fiber-reinforced polymer (GFRP) 210 mm square plates were made. The difference in the composite structures was the thickness of the top plates, where 0.2 mm and 0.6 mm thick GFRP were attached to the bottom plate of 0.6 mm using epoxy. Then, the areas were divided into intact and damaged areas, where damage was given by delaminating the two plates, as shown in Figure 1. In general, the EMI technique can be performed using various equipment. These include an AD5933 evaluation board, a function generator connected to an oscilloscope, and various impedance analyzers. Using the impedance analyzer IM3570 for this study, the proposed PZT device was connected, and the test involved simply putting the PZT device onto the surface of the composite structure’s surface to acquire impedance signatures. The main part of the analyze was to evaluate the damage detection performance of the PZT device by measuring the impedance signatures of the intact and damaged areas without permanently attaching the PZT device to the surface of the composite structure.

3. Development of the Impedance Measuring PZT Device

3.1. Related Work

In general, the EMI technique requires the permanent attachment of PZT transducers to the target structure. This permanent bonding process involves applying adhesives or bonding agents, which can alter the surface characteristics of the structure and may not be suitable for certain applications where surface integrity must be preserved or where temporary monitoring is needed. In recent years, researchers have explored alternative approaches to EMI that do not involve permanent sensor attachment. Singh et al. [20] demonstrated that the surface-mounted PZT sensor (SMPS) sensor has more sensing areas than the surface-bonded PZT sensor (SBPS), and [21] demonstrated the accuracy of structural monitoring by developing a complete strain transfer and reusable sensor adhesion method to the required location with attachment through magnetic force. Liu et al. [22] confirmed the reusability of a PZT transducer using an ethylene-acrylic acid copolymer (EAA) adhesive film, and Moharana et al. [23] analyzed the ability to predict cement behavior through the construction of a metal foil-based reusable PZT sensor. In addition, the detachable nature of the PZT sensor allows it to be used in concrete hydration monitoring [24,25,26] and cement mortar monitoring [27], and studies have shown that it has a more sensitive response and is more reliable and efficient. Additionally, with regard to the adhesive layer, Parpe et al. [28] interpreted the ability to detect and interpret structural damage from EMI signatures for debonding of adhesives and sensor breakage, and Saravanan [29] proposed a methodology to pre-diagnose damage present in smart PZT sensors and adhesive layers using EMI techniques.
By developing techniques that allow temporary attachment of the PZT transducer with high accuracy, the accessibility and versatility of EMI for structural health monitoring can be significantly enhanced, opening up new possibilities for effective and efficient damage detection in various engineering applications.

3.2. Model of PZT Device

Figure 2 shows the sensor device that can be placed onto the GFRP plate and performs impedance measurement. The upper part of the sensor device is 30 mm in width, 56 mm in length, and 35 mm in height. The lower part includes the sensor device with the PZT transducer attached, where the bottom surface of the metal piece is in contact with the host structure surface. In this area, the metal piece and the PZT sensor are bonded through epoxy, and at this time, the epoxy is from the Loctite manufacturer, and two-component epoxy is diluted and used, and it is very resistant to moisture and impact. Changes in bonding quality can affect EMI results, so the application situation should be considered. Considering the experimental characteristics of multiple measurements, the author can say that it is optimized in that it prevents damage to the PZT sensor and is less affected by temperature. The PZT patch is of the PSI-5A4E type, has high piezoelectric performance, and maintains constant performance despite extreme temperature changes. The PZT sensor is attached wide to the metal surface because the larger the area in contact with the surface of the metal piece, the more sensitive it is, and smooth signal acquisition is possible. If the PZT sensor is brought into direct contact with the surface without a metal surface, it is difficult to maintain consistent and uniform contact, which makes accurate EMI measurement difficult. Additionally, Na et al. [30] showed that using different metal thicknesses with the same PZT size resulted in different resonance frequency ranges. Here, the authors used this finding to detect damage to composite structures. Thus, the proposed device can easily move around the surface of the host structure and detect damage.
Nguyen et al. [31] showed that the thicker the adhesive layer, the less piezoelectric damage is possible. In this paper, EMI errors occurring in the adhesive layer can be blocked because it is not used, and it is made detachable by utilizing this. And through experiments, we propose the effect of weight on damage detection and monitoring by building PZT sensors using different weighting devices.

4. Performance of the PZT Device Subjected to Different Structure Thicknesses

4.1. Impedance Sigantures for a 0.2 mm Top Thickness Composite Structure

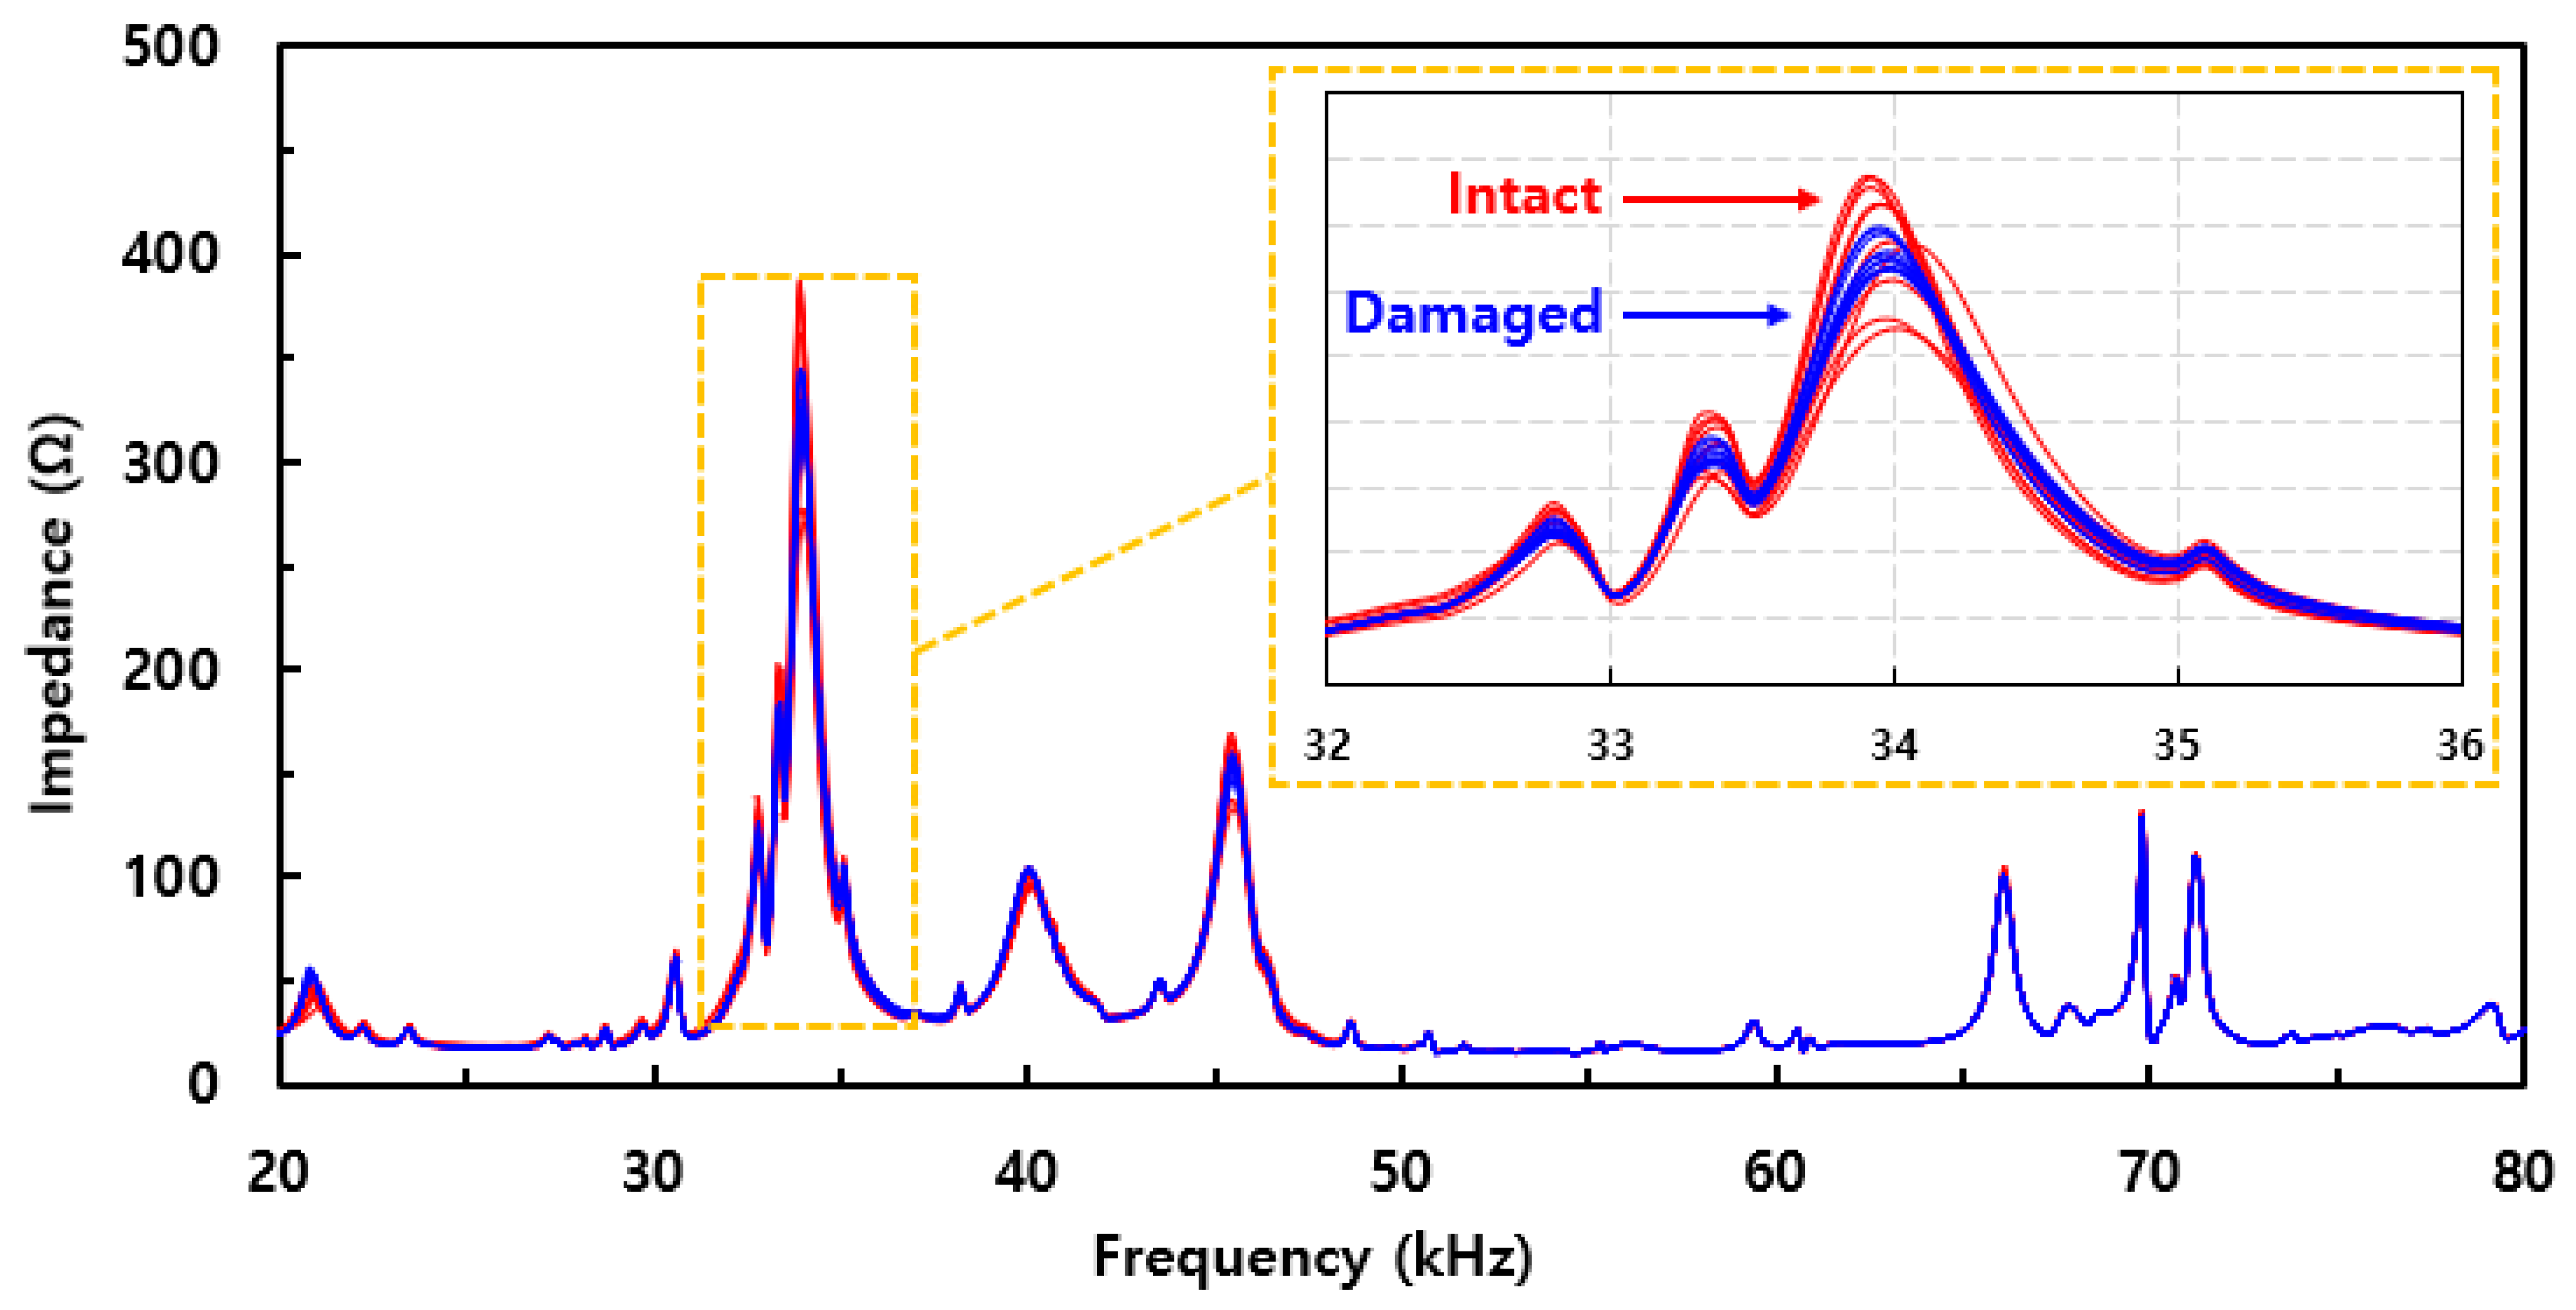
To analyze the performance of the proposed device shown in the previous section, impedance signatures were measured by randomly placing the PZT device between the intact and damaged areas of the composite structure with a top plate thickness of 0.2 mm. Although a slight difference in the position of the PZT device can occur due to random placement, the difference between the intact and damaged areas should be large enough to distinguish the impedance signatures from the two different areas. The reason for this is to create a method that can be used in the real world, as it is virtually impossible to replace the PZT device on the exact same spot every time. Here, 10 impedance signatures were randomly measured from each of the two different types of areas. This is shown in Figure 3, where 20 impedance signatures from the frequency range of 20 kHz to 80 kHz are shown. The red-colored lines represent an intact case, and the blue-colored lines represent a damaged case. The first observation is that there are multiple impedance peaks throughout the frequency range, where the largest peaks can be found near 33 kHz, with the impedance values going up to 390 ohms. The second-largest peak is located around 45 kHz, with impedance values between 130 ohms and 170 ohms. When the largest peaks are zoomed in between the frequency range of 32 kHz and 36 kHz, one can see the variations in the impedance signatures subjected to repeated measurements. The fluctuation in the signatures is more severe in the intact case compared to the damaged case, as the blue lines overlap each other, which is a positive outcome as this means that the impedance signatures do not change significantly subjected to different damaged areas of the composite structure. On the other hand, the fluctuation in the impedance signatures is noticeably large for the intact area (red colored lines), where the height of the peaks varies subjected to repeated measurements from intact areas. Such an outcome could possibly cause false alarms when finding damaged areas using the proposed idea.
Additional peaks can be found near 40 kHz and from 66 kHz to 72 kHz, where the impedance values are smaller compared to the other peaks. From these peaks, the variations in the impedance signatures are very small, regardless of the intact and damaged areas. Thus, from this experiment, we can see that the two largest peaks located near 33 kHz and 45 kHz would be useful when detecting delamination damage to the composite structure shown in this study.

4.2. Impedance Signatures for a 0.6 mm Top Thickness Composite Structure

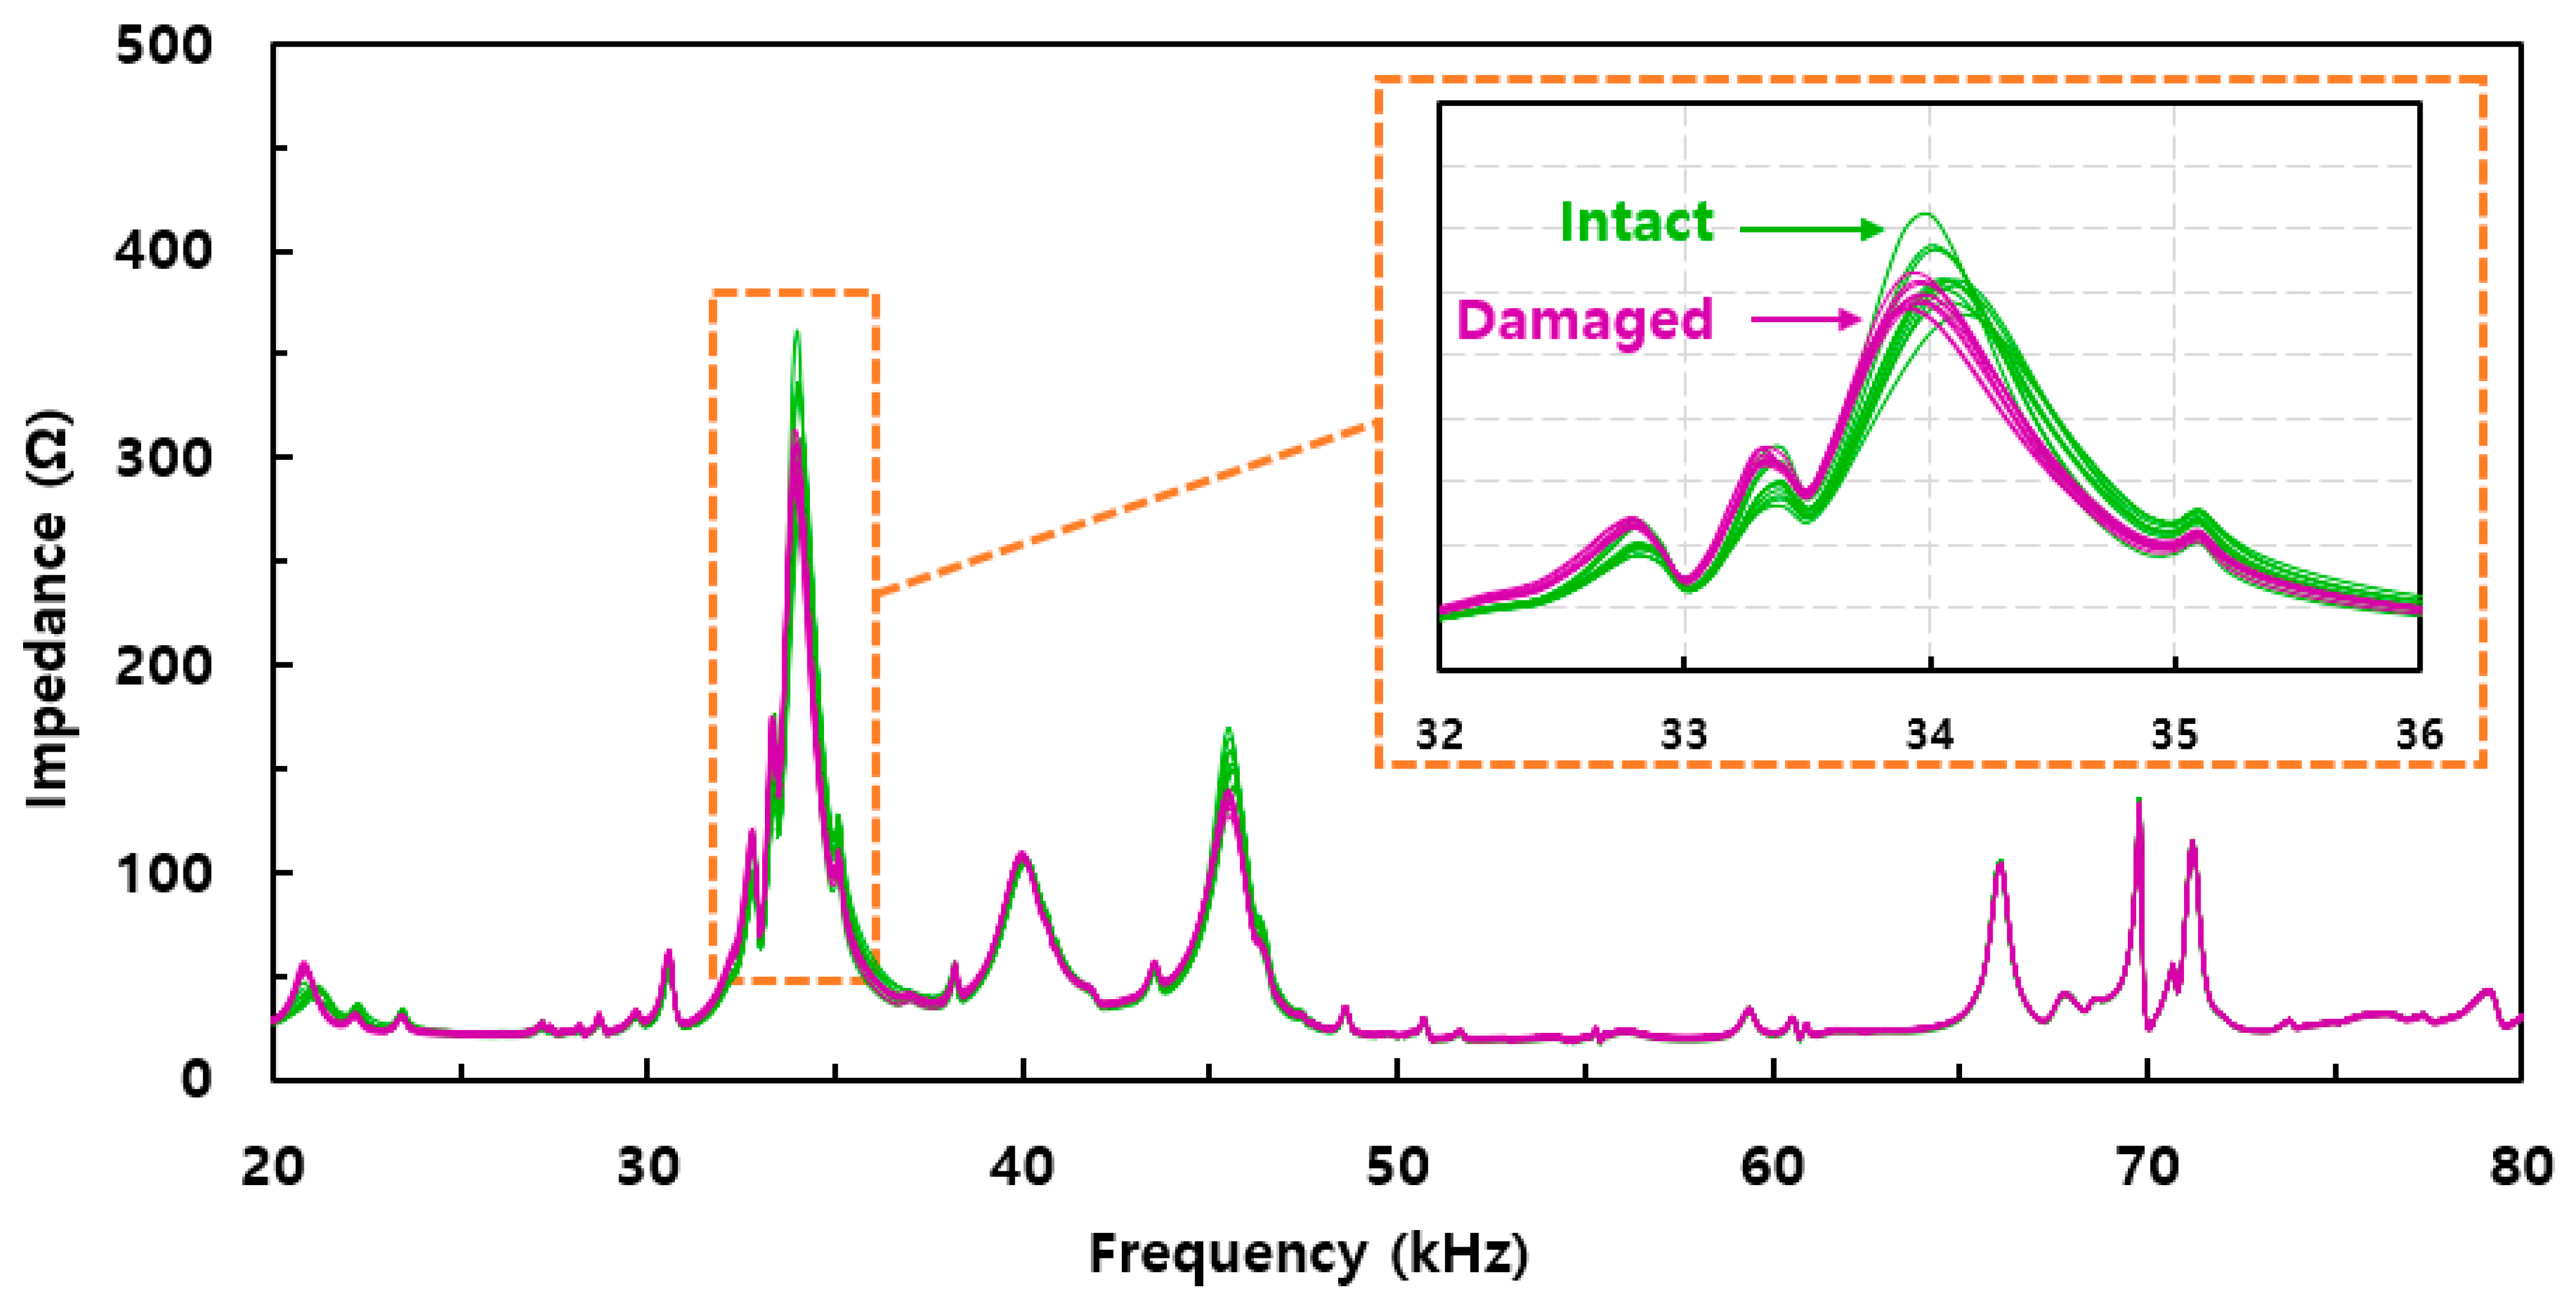
Similar to the test conducted in the previous section, 10 impedance signatures were randomly measured between the intact and damaged areas of another composite structure with 0.6 top plate thickness to evaluate how the thickness of the structure affects the outcome. The 20 impedance signatures are shown in Figure 4, where the variations in the signatures show a similar trend compared to the previous section. However, the difference can be seen in the height of the impedance peaks, where the highest impedance value near 34 kHz is around 360 ohms from the intact case (green line). When the signatures are zoomed in from 32 kHz to 36 kHz, a clear difference can be seen between the intact and damaged cases. This time, the fluctuations in the impedance signatures are less severe compared to the previous section with the composite plate of 0.2 mm top thickness. Furthermore, the resonance frequency range seems to be subjected to damage as most of the impedance signatures have shifted in the left direction compared to the intact case.
With the second highest peaks located near 46 kHz, a clear difference between the two different cases can be identified where the peaks of the signatures from the damaged cases are lower than the peaks from the intact case. For the other smaller peaks located near 40 kHz and from 66 kHz to 72 kHz, the variations in the signatures are barely noticeable subjected to repeated measurements for both intact and damaged cases. Thus, this experimentally proves that the useful information regarding the impedance signatures is the large peaks located between 30 kHz and 50 kHz.

4.3. Analyses of Averaged Impedance Sigantures for 0.2 mm and 0.6 mm Top Plate Composites

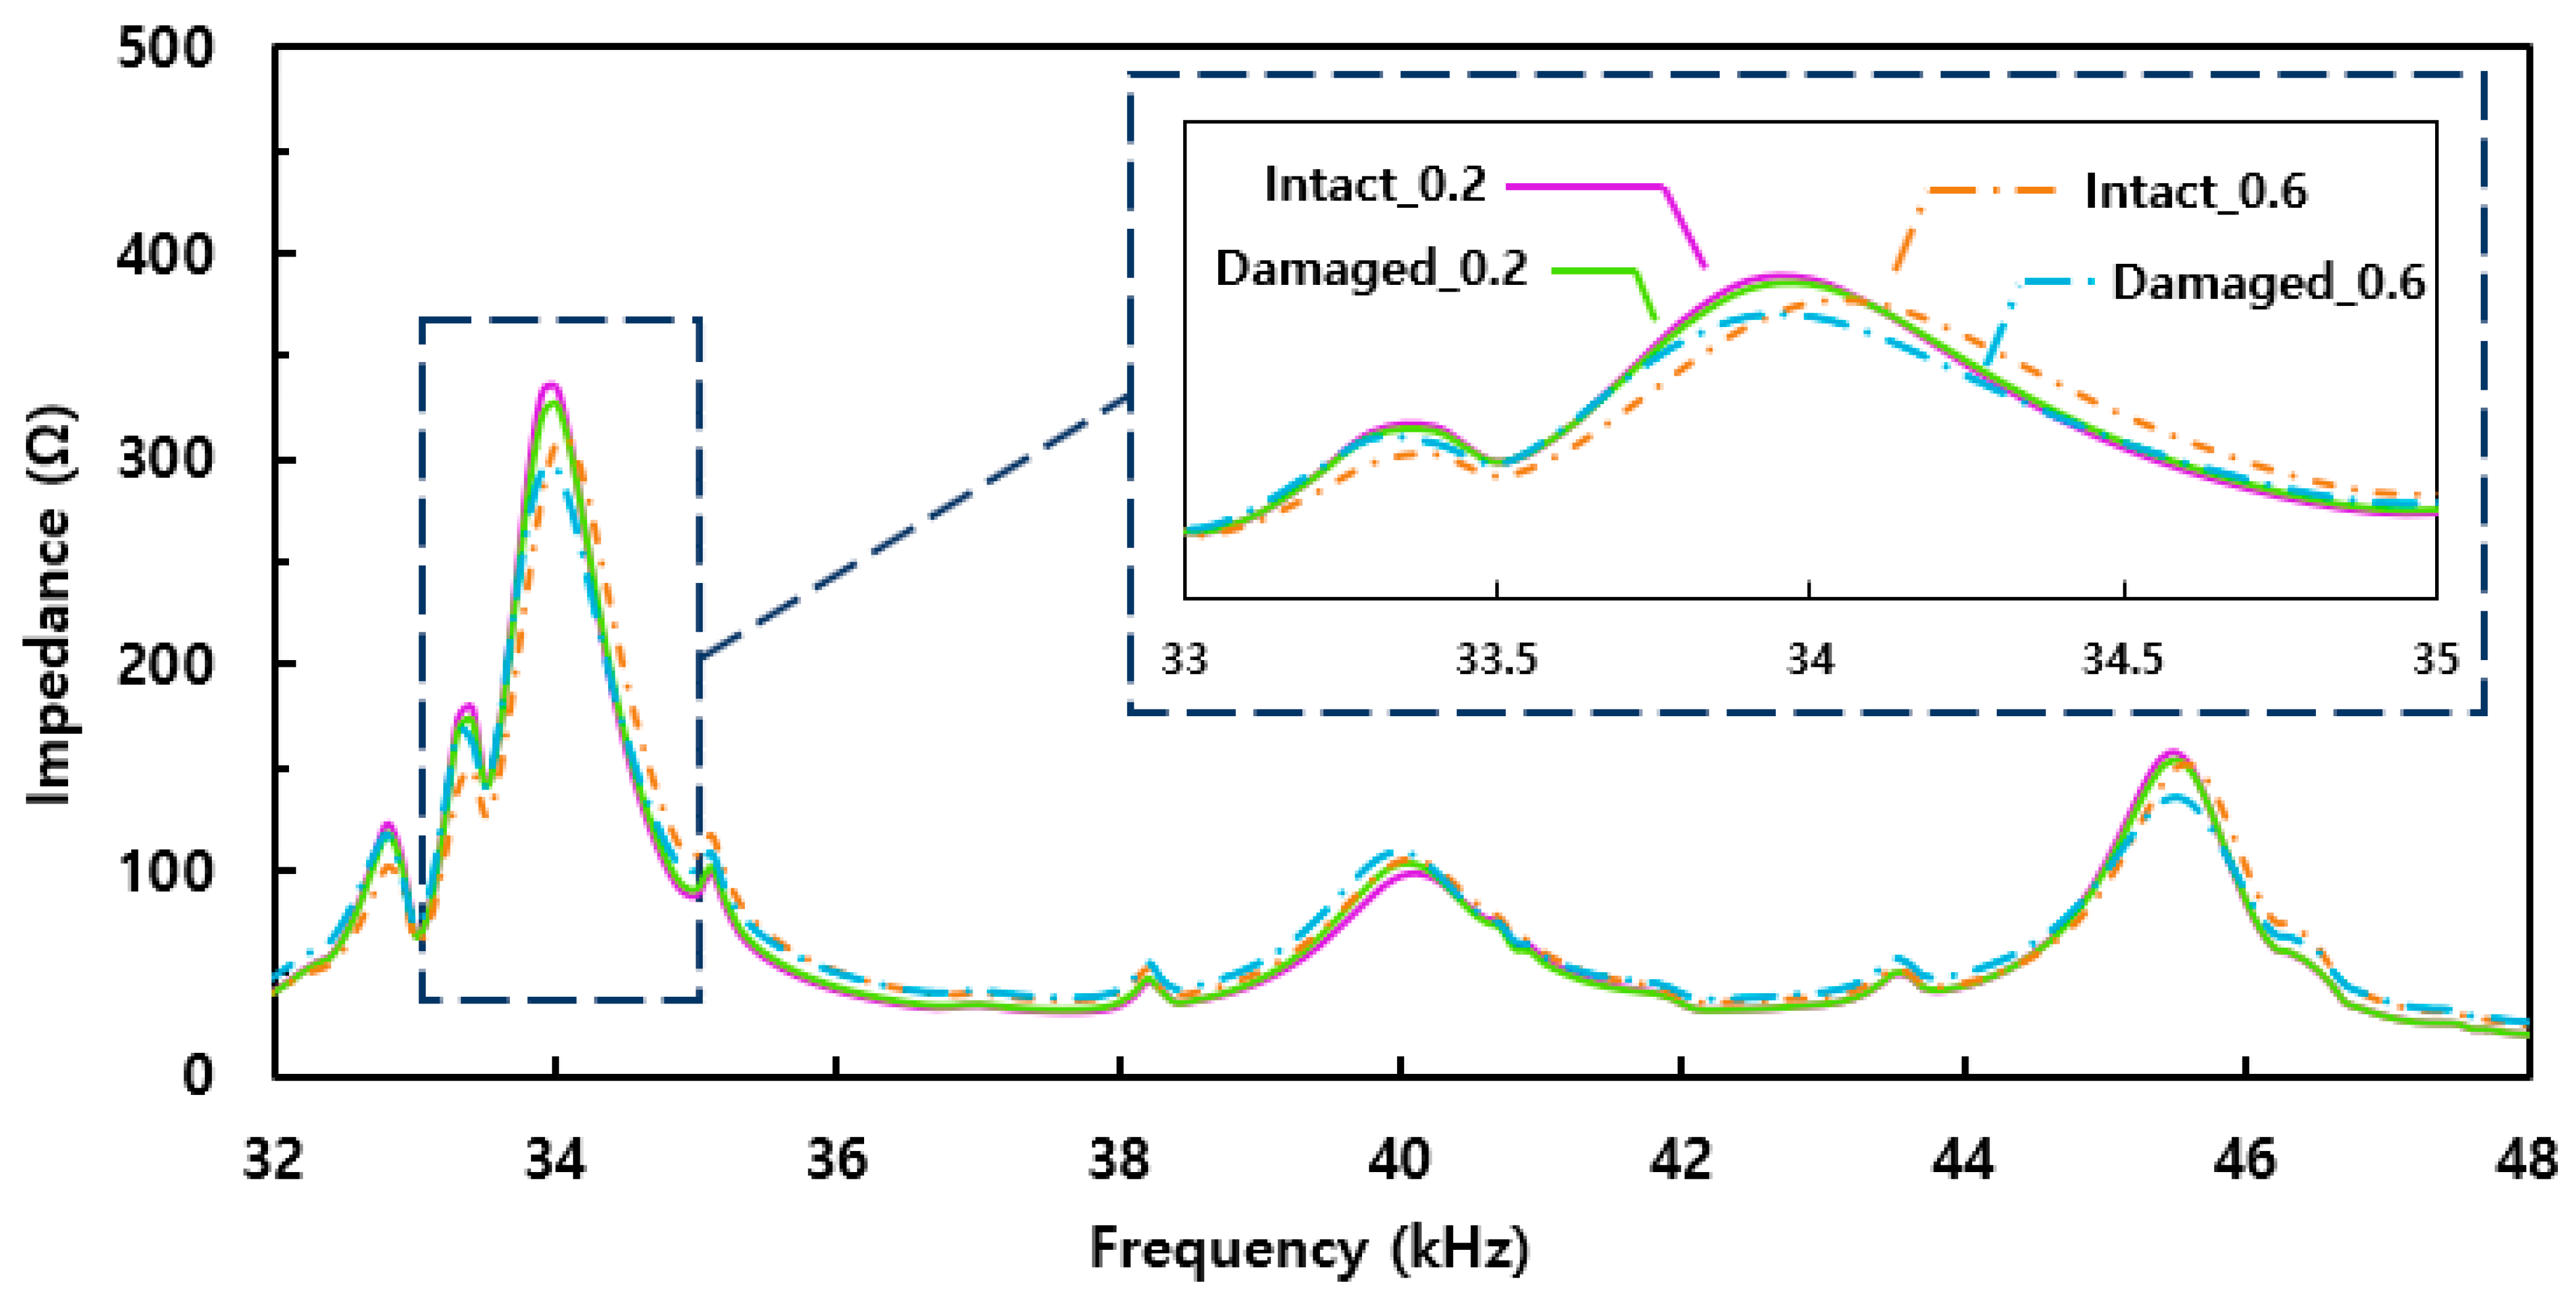
From the experiments conducted in the previous two subsections, variations in the impedance signatures were noticeable for large peaks that were located between 30 kHz and 50 kHz. In general, higher modes of vibration are generally more sensitive to damage. However, from our experiments, the largest peaks were observed in the lower frequency range, and this area is usually selected to conduct the EMI technique as it is sensitive to damage. Thus, the frequency range of 32 kHz to 48 kHz was used for the remainder of the study to investigate the performance of the proposed idea. To quantify the severity of damage, RMSD was used in this frequency range to evaluate the performance of the proposed concept. To achieve this, the 10 impedance signatures from each of the intact and damaged cases have been averaged and drawn in Figure 5. “Intact_0.2” and “Damaged_0.2” represent the averaged signatures from the composite structure with the top plate thickness of 0.2 mm, and this rule is applied the same for the “Intact_0.6” and “Damaged_0.6” signatures for analysis.
From the figure, the difference between Intact_0.2 and Damaged_0.2 is barely noticeable, where the RMSD value calculated here is 2.69%. Although the intact case signatures showed large variations with high impedance values in the previous section, the very small difference in the averaged signatures and the low RMSD value show that the proposed idea is not effective when detecting delamination of the composite structure with a 0.2 mm top plate thickness. On the other hand, the averaged signatures of Intact_0.6 and Damaged_0.6 shows a clear difference between the two cases, where Damaged_0.6 shows smaller impedance values for the peaks located near 34 kHz and 46 kHz. Here, the calculated RMSD value was 11.00%, which is about four times higher compared to the RMSD values calculated from Intact_0.2 and Damaged_0.2. Thus, this experimentally proves that thinner structures do not always result in better outcomes, as shown by this experiment.

5. Performance of the PZT Device Subjected to an Increase in Weight

5.1. Impedance Signature Analysis with Additional 50 g

The fact that the PZT transducer is not permanently attached to the host structure and that it has the ability to move freely around the surface, as proposed in this study, is an advantage when monitoring large structures. However, the downside of this concept is its repeatability and accuracy, as the impedance signatures change every time they are measured. Furthermore, the large variations in the impedance signature subjected to repeated measurements could cause false alarms, as shown in the previous experiments. Thus, to increase the damage detection performance of the proposed idea, the contact between the PZT device and the host structure surface must be secured and also achieve temporary attachment simultaneously. As this proposed idea can be used to create an automated device in the future, making the device heavier to create more firm contact with the surface could affect the damage detection performance. To investigate this, a 50 g weight is attached to the PZT device, and the same test conducted in Section 3 is performed.
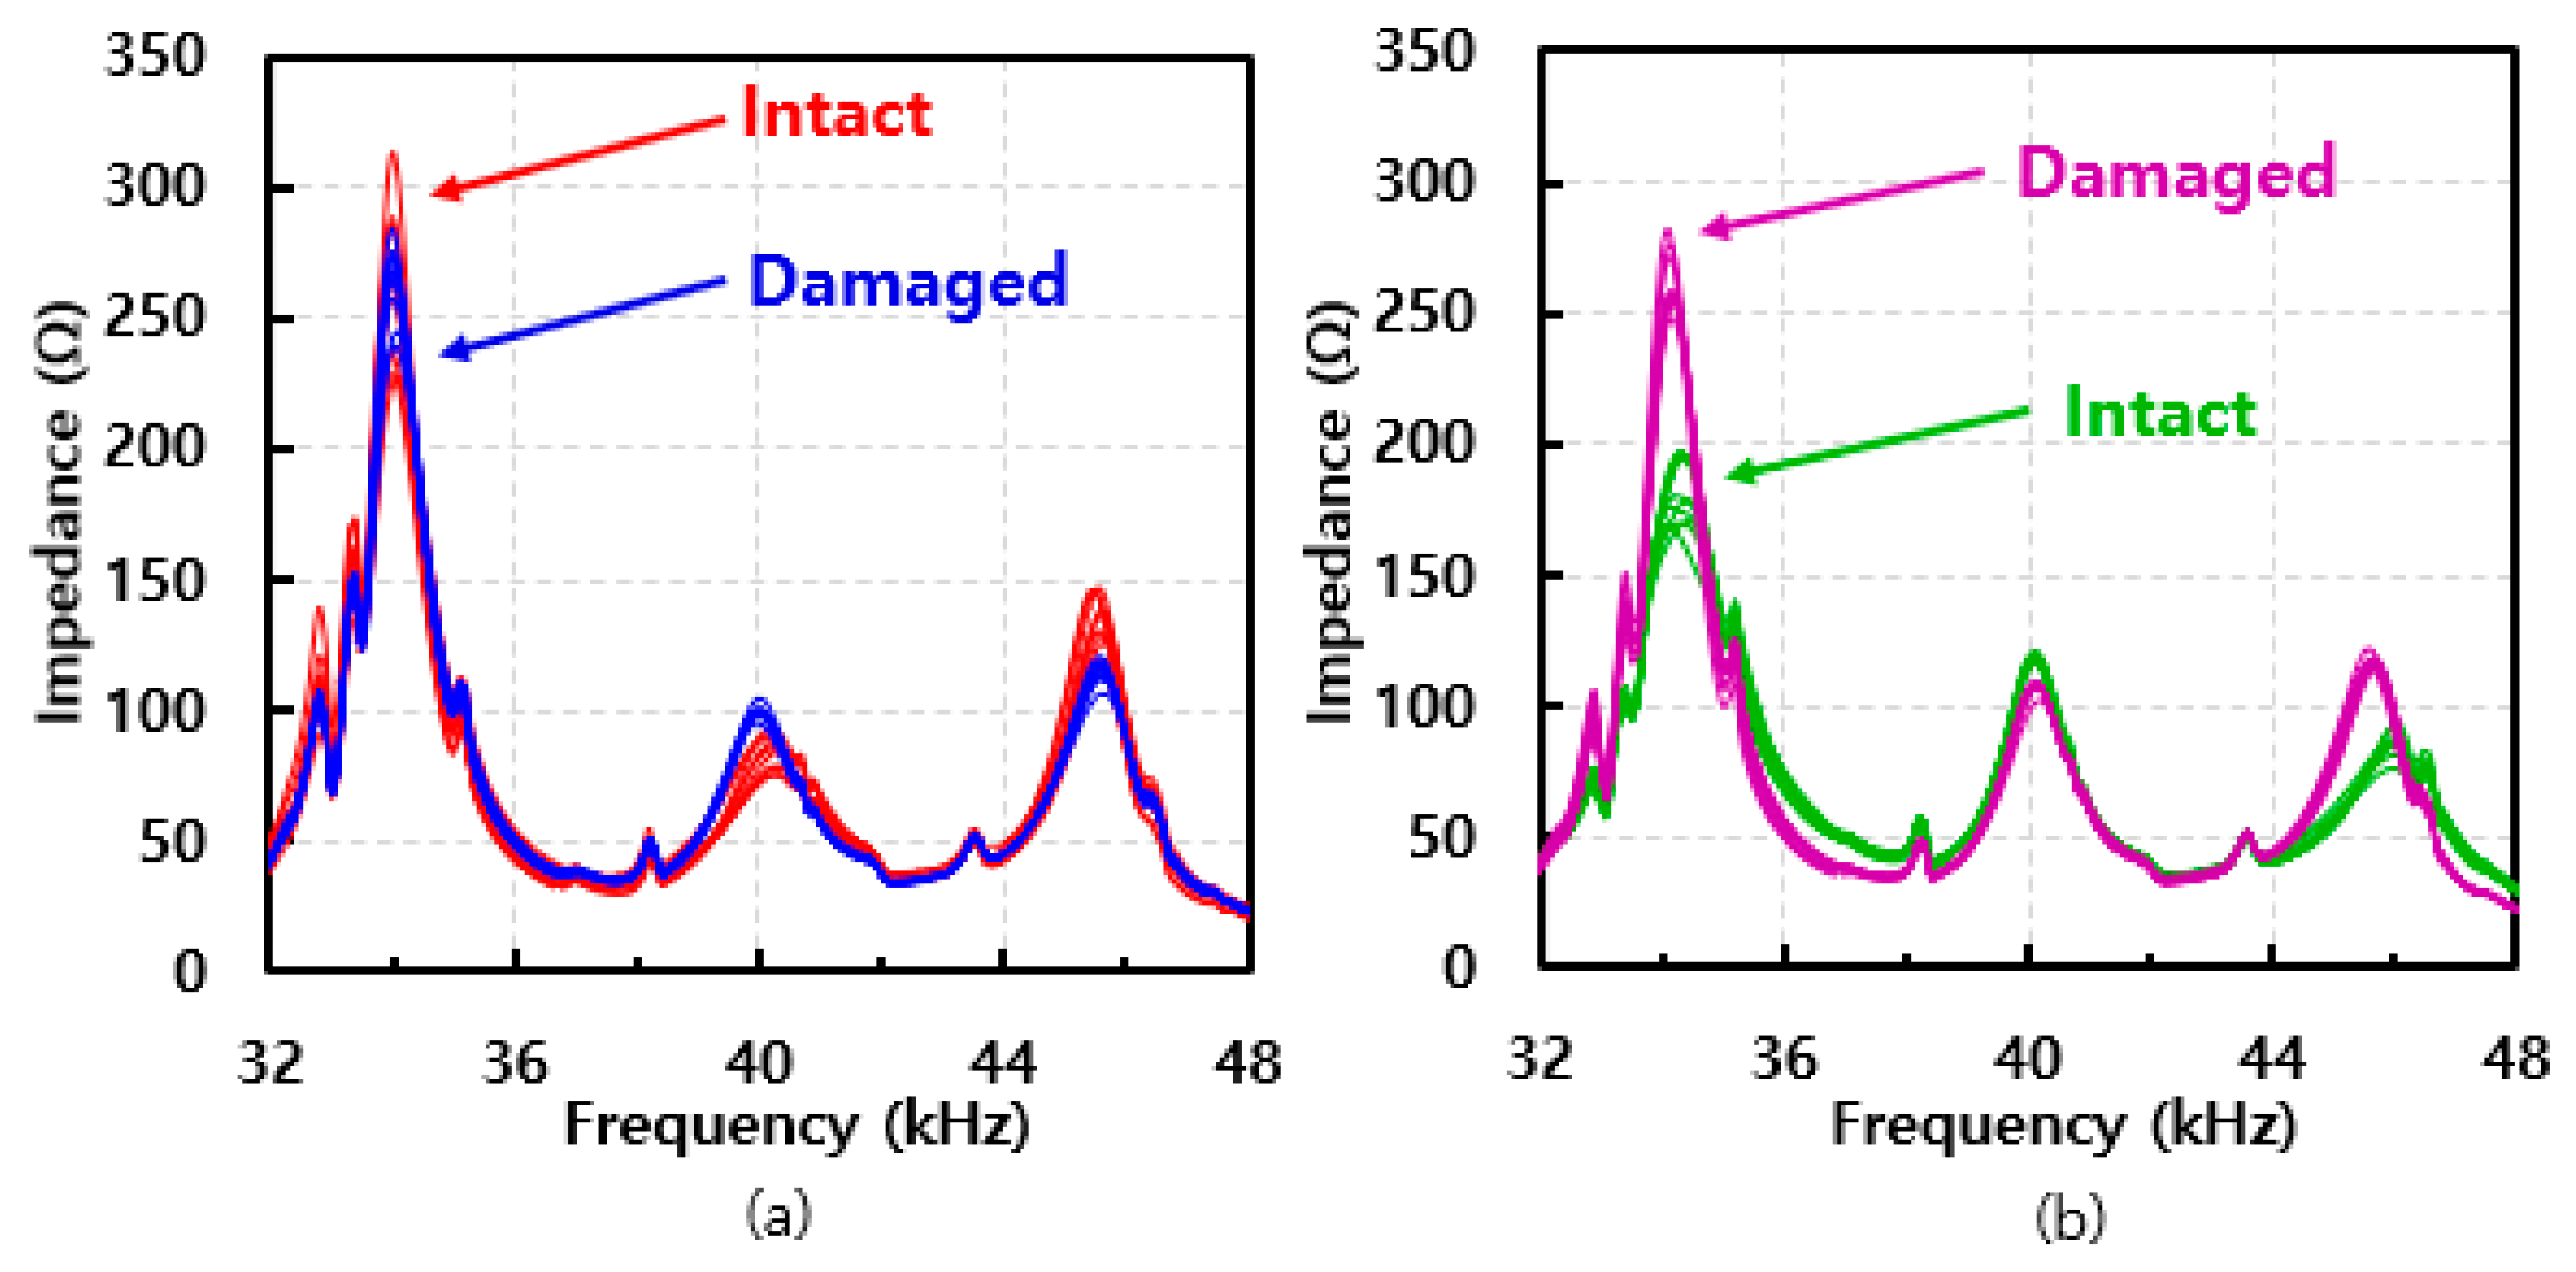
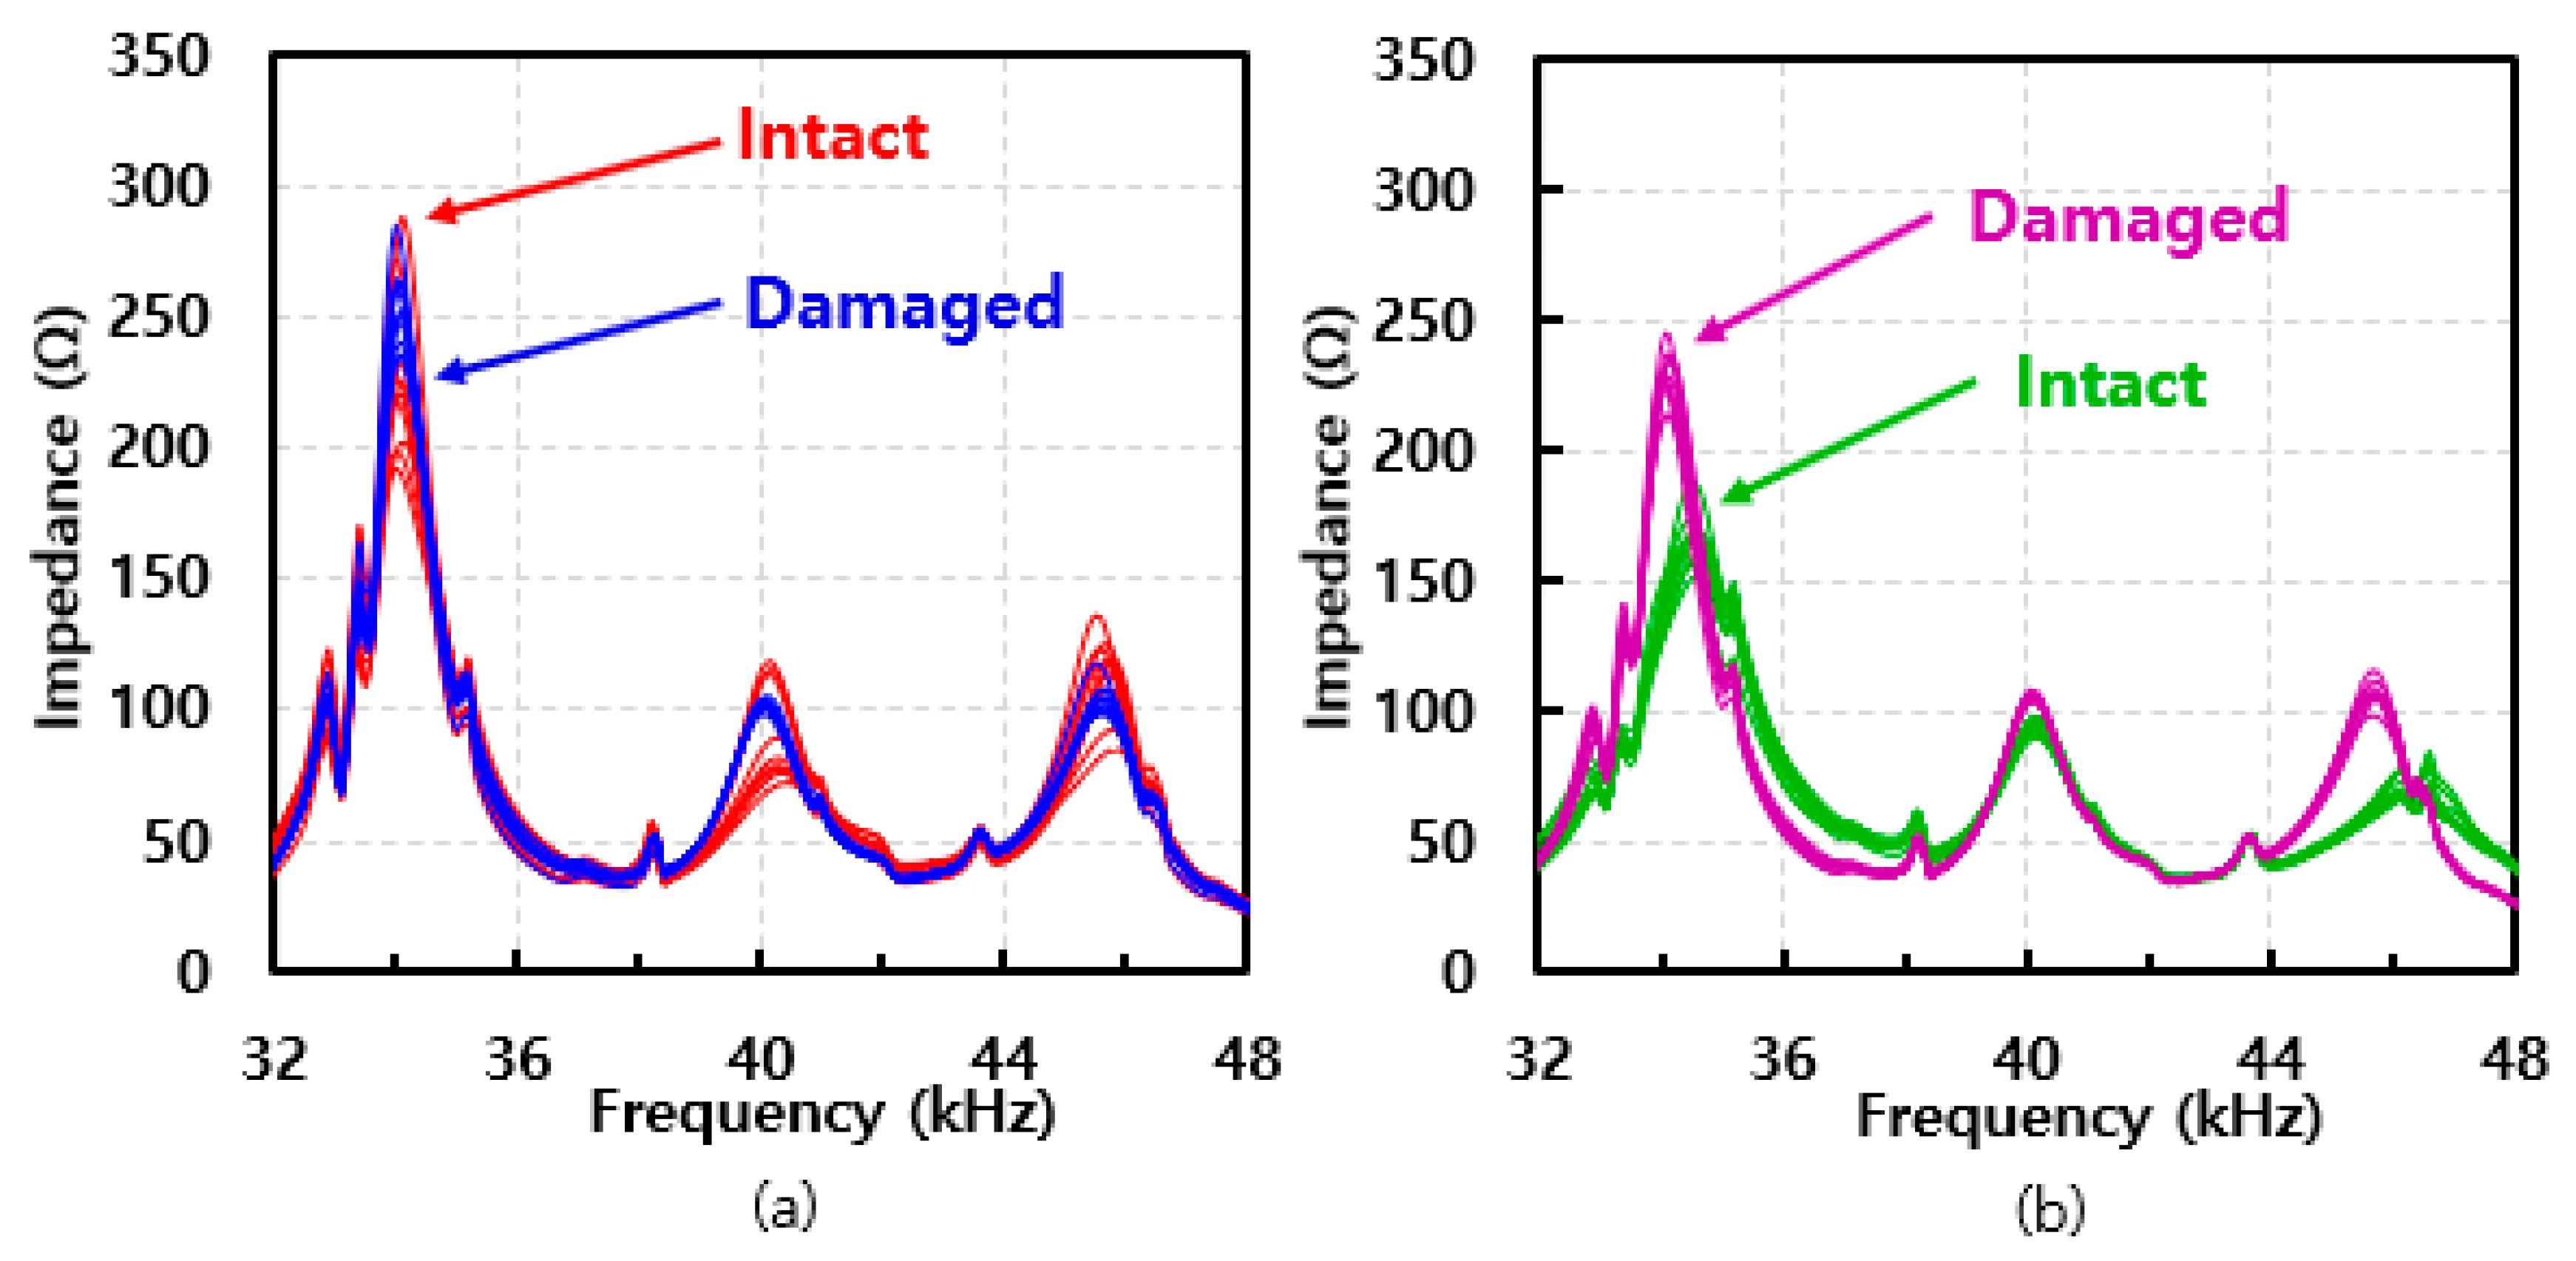
All the impedance signatures acquired from the two different composite structures with thicknesses of 0.2 mm and 0.6 mm on top plate are shown in Figure 6a and Figure 6b, respectively. Comparing both figures, an interesting observation is made here regarding the height of the impedance signature peaks. With Figure 6a, the impedance peaks are generally higher for the damaged case near 40 kHz compared to the intact case, but this trend becomes opposite at the 46 kHz frequency, with the damaged case signatures having lower values in general. For Figure 6b, the impedance peaks are higher for the intact case near 40 kHz and become lower at around 46 kHz compared to the damaged case. This trend is different compared to Figure 6a, which experimentally shows that the different thicknesses of composites can result in a totally different outcome.

5.2. Impedance Signature Analysis with an Additional 100 g

Increasing the weight of the PZT device seems to increase the damage detection performance, as seen in the previous subsection. Thus, the weight of the device was further increased by adding another 50 g to the device, and all the impedance signatures were again measured for analysis. Figure 7a,b shows the impedance signatures with the 100 g weight for 0.2 mm and 0.6 mm top plate thicknesses, respectively. By observation, most of the impedance signatures show a similar trend compared to Figure 6. For Figure 7a, more variations in the impedance signatures are observed for the intact case experimentally, proving that increasing the weight of the device to create a better contact between the PZT device and the host structure surface does not always result in better damage detection performance. For Figure 7b, the largest peaks located near 34 kHz have noticeably decreased compared to Figure 6b, showing that increasing the weight of the device can decrease the impedance peaks in general. An interesting observation is made here at 40 kHz where the intact case impedance peak values are lower than the signatures from the damaged cases, an opposite outcome compared to Figure 6b.

5.3. Averaged Signature Analysis of Additional 50 g and 100 g

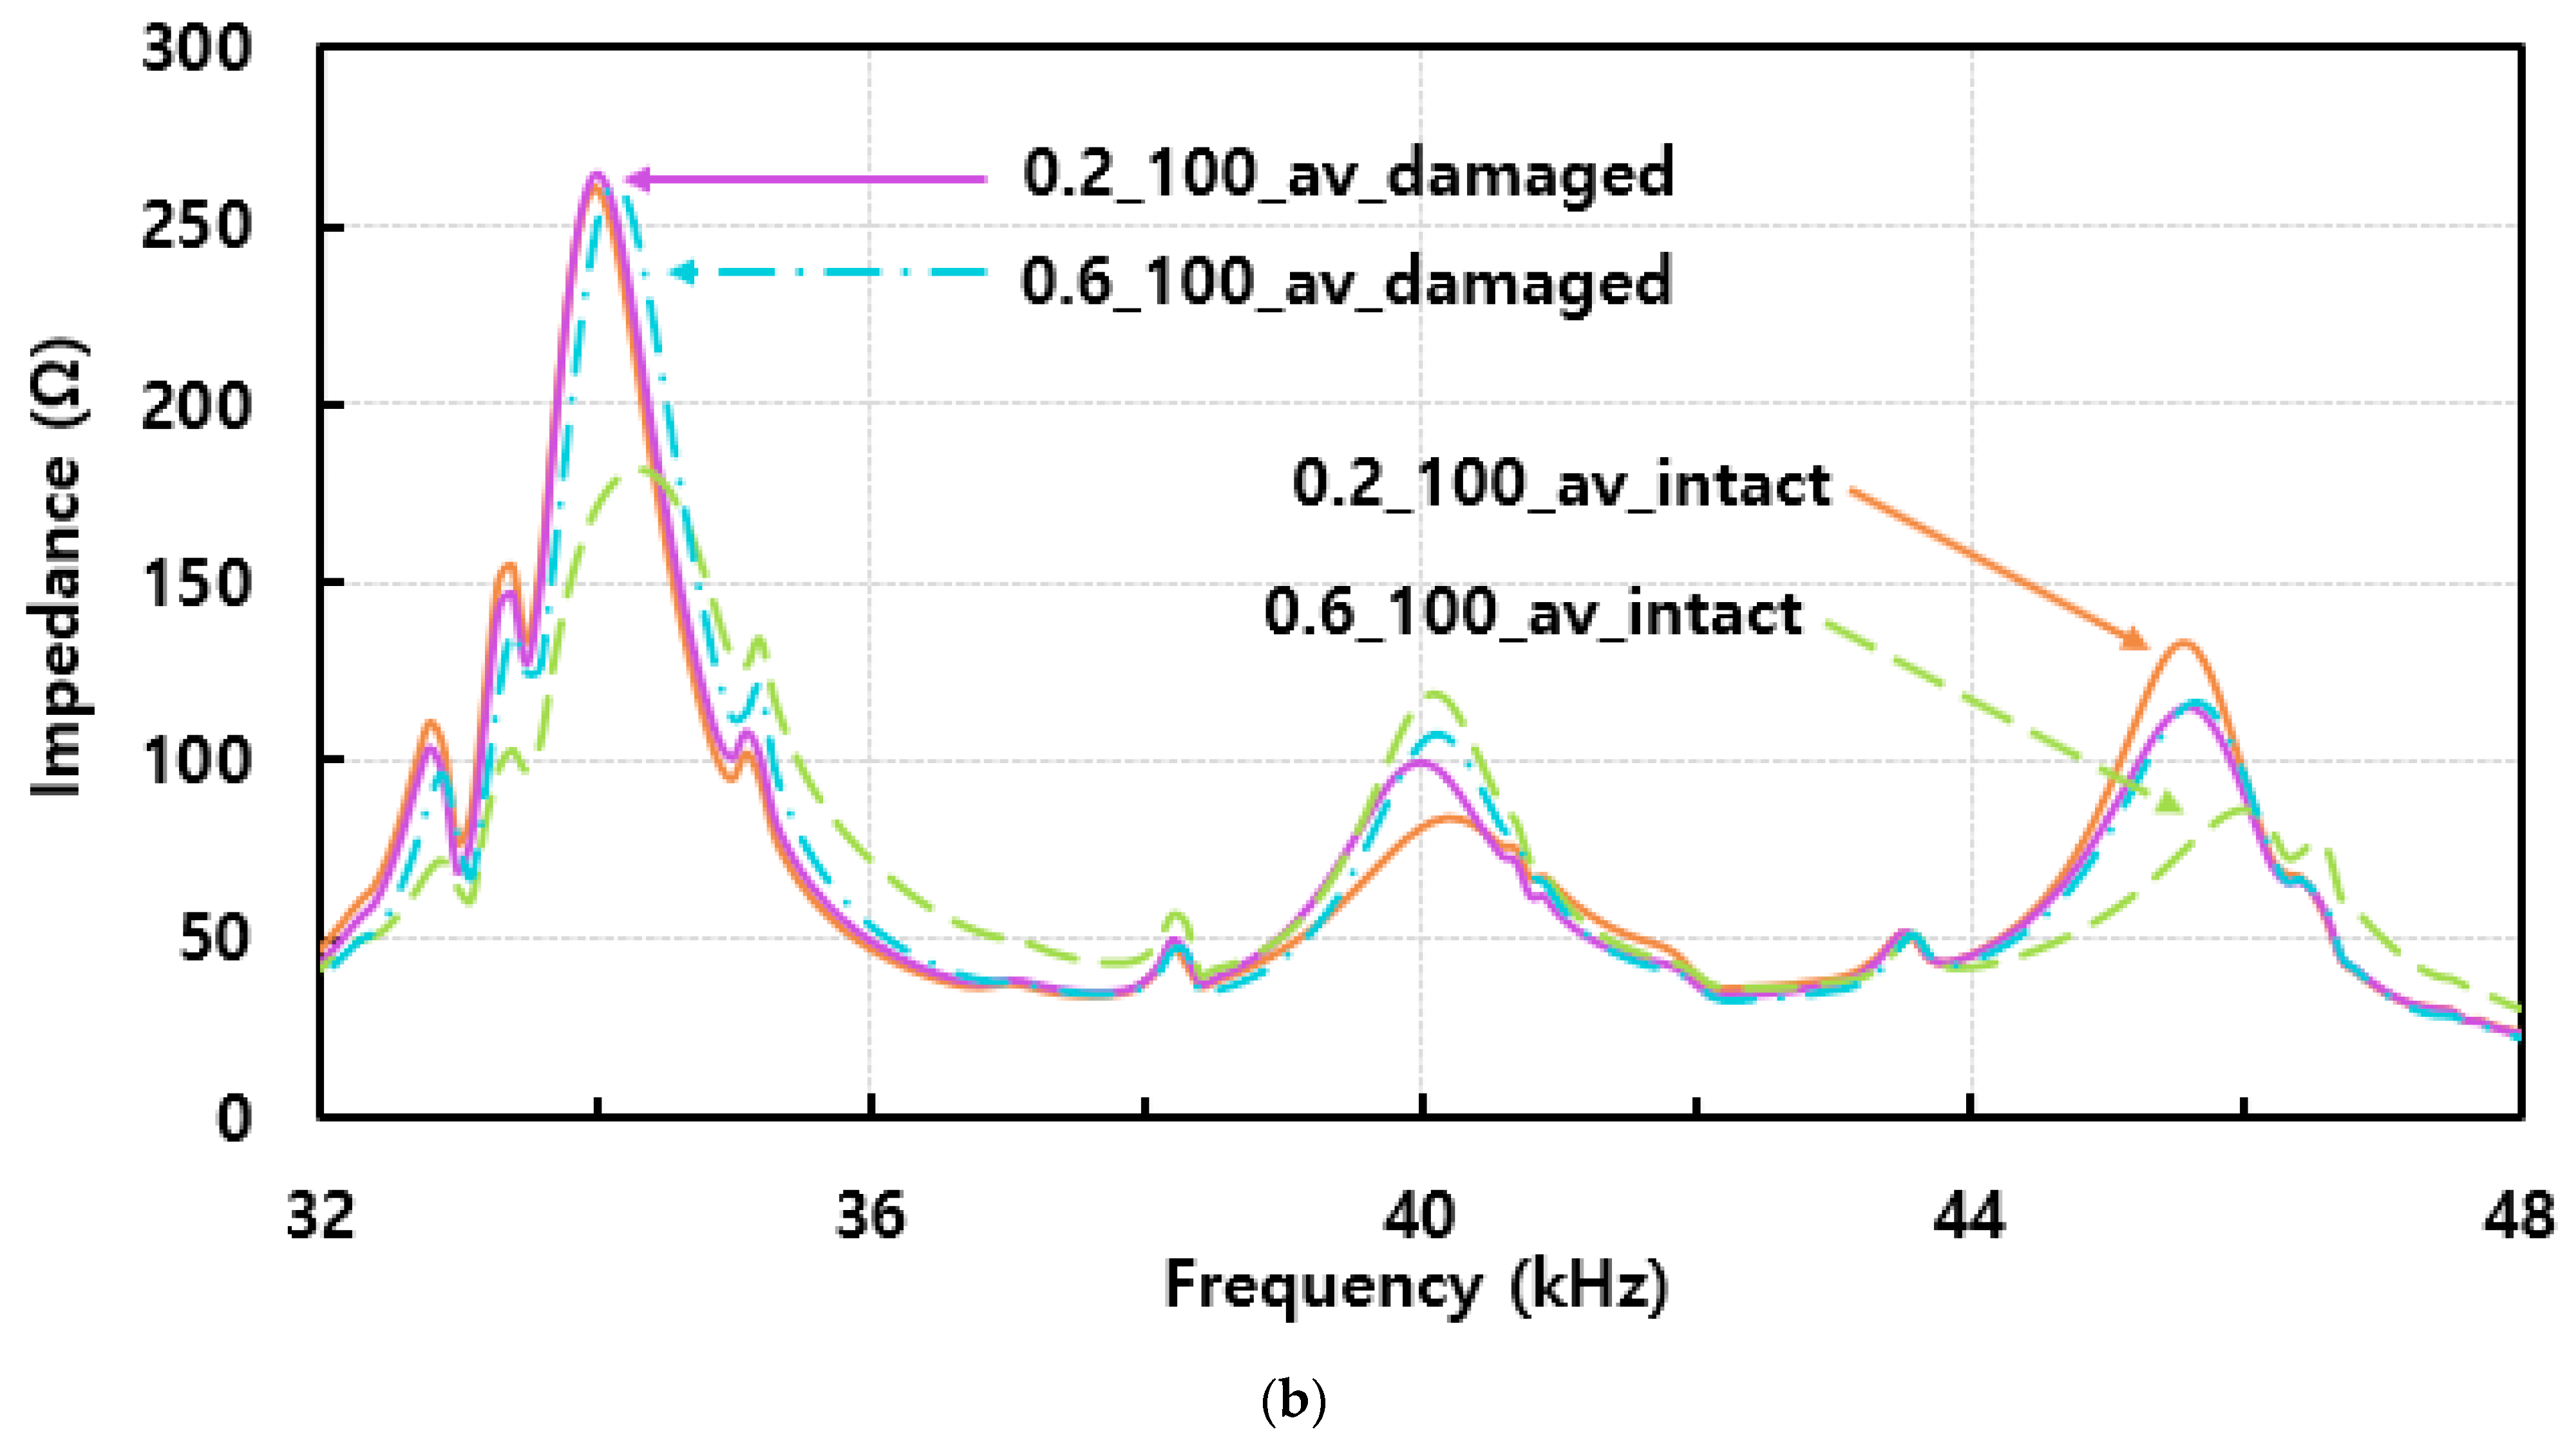
By averaging the impedance signatures from the previous subsections, is it simple to identify the difference between different cases. Figure 8a,b represents the averaged impedance signatures for the experiments with 50 g and 100 g weights, respectively. The labels in the figure represent which of the impedance signatures have been averaged as “0.2_50_damaged”, which means a 0.2 mm top plate with a 50 g weight test for the damaged cases. First with Figure 8a, the RMSD value calculated for the 0.2 mm top thickness structure was 7.62%, which is a better outcome compared to the lighter device in Section 4.3 of 2.69%. As for the impedance signature, the clear difference is observed in near the 40 kHz and 46 kHz between the damaged and intact cases. Next, with the 0.6 mm top thickness structure, the RMSD value calculated for 0.6_50_damage and 0.6_50_intact was 24.88%, which shows a significant improvement in damage detection performance compared to Section 4.3 of 11.00%. Furthermore, a clear difference can be seen when comparing both averaged impedance signatures, as each of the signatures can be easily identified from the figure. Thus, this experimentally proves that increasing the weight of the device can improve the performance of the proposed concept. Observing Figure 8b with the increased weight of the device, the RMSD value calculated for the 0.2 mm thick top plate structure was 7.88%, which is a very small improvement compared to Figure 8a. Here, one can assume that increasing the weight of the device does not always result in a better outcome. As for the impedance signatures, it is simple to visually identify the difference between the two averaged signatures. For the 0.6 mm -thick top plate structure, the RMSD value was 30.16%, which once again improved the damage detection ability compared to the previous test in Figure 8a with 24.88%. Again, the difference between the two impedance signatures is the largest of all the averaged impedance signatures obtained for this study.

5.4. Reliability Evaluation of the PZT Device Subjected to Different Weights

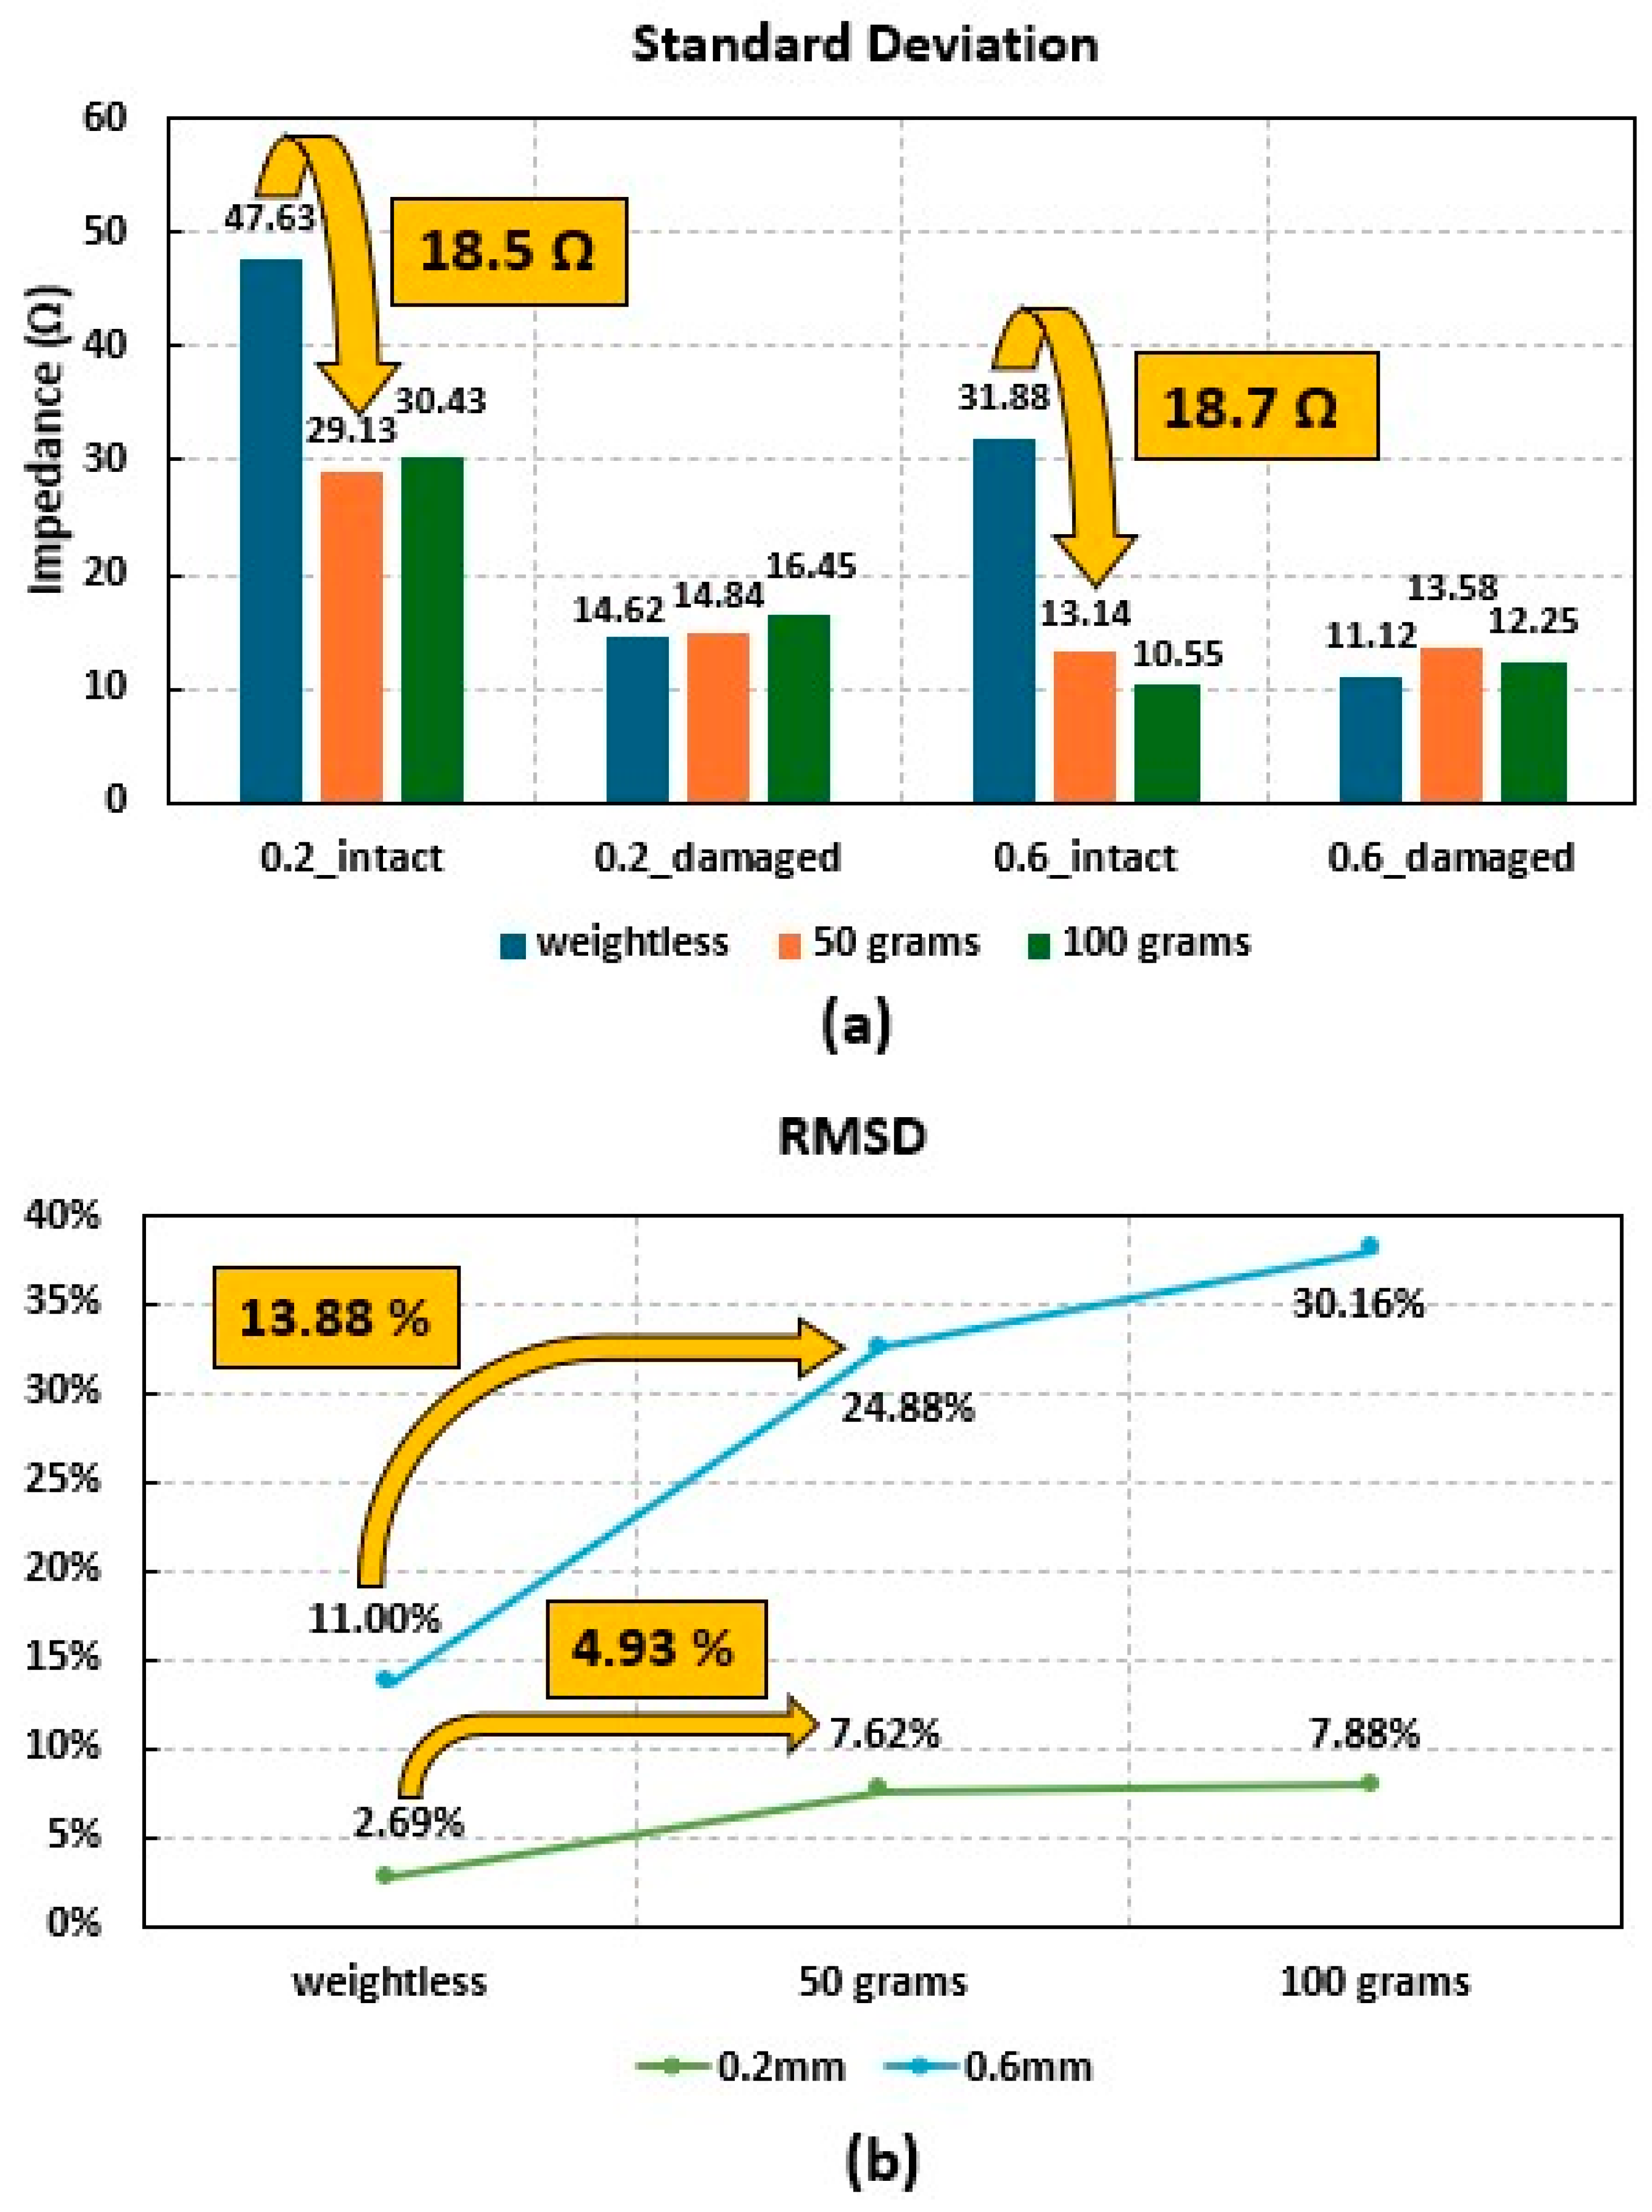
To evaluate the performance of the PZT device subjected to different weights, a standard deviation was calculated for all the tests conducted in this work. Since the PZT transducer is not permanently attached to the host surface and is replaced for every new measurement, this slight difference in the repositioning of the PZT device can alter the signature dramatically. Figure 9 shows all the standard deviation values calculated, where 0.2_intact and 0.2_damaged represent results from a 0.2 mm thickness plate for intact and damaged cases, respectively. In Figure 9a, which is the results without any additional weight, the highest standard deviations for intact and damaged cases for 0.2 mm thick plates were 47.63 Ω and 14.62 Ω respectively. For 0.6 mm thick plates, the highest standard deviation results for the intact and damaged cases were 31.88 Ω and 11.12 Ω, respectively, where all the highest values can be seen around 34 kHz. From the results, it seems that the proposed idea is more reliable when finding damaged cases, compared to intact case as the standard deviation values are lower. In Figure 9b, with the 50 g of additional weight, the highest standard deviations for intact and damaged parts for 0.2 mm thick plates were 29.13 Ω and 14.84 Ω, respectively, and for 0.6 mm thick plates, they were 13.14 Ω and 13.58 Ω, respectively. Compared to the previous results with no weight, the standard deviation values have been reduced for intact cases, which is a positive outcome regarding reliability of the proposed idea. In Figure 9c with the 100 g of extra weight, the highest standard deviations for intact and damaged cases for 0.2 mm thick plates were 30.43 Ω and 16.45 Ω, respectively, and for 0.6 mm thick plates, they were 10.55 Ω and 12.25 Ω, respectively. Here, no significant improvement to regarding reliability can be seen. Although there has been a slight reduction in values in some cases, the values are too small to guarantee any outcome. However, from the calculated standard deviation values, we can conclude that reliability can be improved with additional weight on the PZT device.

6. Discussion of Weight and Standard Deviation of the PZT Device

Through the measurement of the EMI signal of the PZT sensor, the ability to detect delamination damage according to the device weight and the thickness of the structure was analyzed. First, the RMSD was calculated to proceed with the quantitative judgment on the weights in Figure 5 and Figure 8. As can be seen in Figure 10a, it had a larger RMSD value at a thickness of 0.6 mm than 0.2 mm and increased with increasing weight. In particular, the increase rate had the largest change when 50 g was added in the absence of weight, with a difference of 4.93% for 0.2 mm and 13.88% for 0.6 mm. These values are much larger than the RMSD when the weight was increased from 50 g to 100 g.
In addition, reliability was analyzed through the standard deviation of repeated impedance values. From Figure 9, it was confirmed that the standard deviation of the device without weight is greater than the standard deviation of the device with 50 g and 100 g added. In Figure 10b, it was confirmed that the biggest difference in standard deviation was when no weight was applied to the intact area and when 50 g was applied, along with the low standard deviation in the damaged area. The difference in these values is 18.5 Ω at 0.2 mm and 18.7 Ω at 0.6 mm, and from these values, it can be concluded that adding weight regardless of the difference in thickness in the intact area has a positive effect on the reliability of damage detection.
Due to the sensor size of the device and the type of epoxy, the weight suitable for the sensor device may differ. In this experiment, when 50 g was added, the standard deviation decreased the most, and the RMSD increased the most. Therefore, in this paper, it was judged that the best performance was achieved when 50 g weight was tested at 0.6 mm, setting a standard of more than 20% for RMSD and less than 15 Ω for standard deviation. Therefore, adding too much weight is economically disadvantageous compared to the efficacy increase rate, so it can be concluded that both the rate of increase in accuracy and the rate of increase in reliability must be considered together.

7. Conclusions

In this study, the concept of conducting the EMI technique for delamination detection in composite structures without the need for permanently attaching transducers to the surface was introduced and tested. The first part of this study showed the design concept of the PZT device that can easily move around the surface of a host structure. The impedance analyzer IM3570 was used to acquire impedance signatures from the frequency range of 20 to 80 kHz to see how the signatures vary subjected to intact and damaged areas of the composite plate created for this study. Using two different composites with 0.2 mm and 0.6 mm top plate thicknesses, the PZT device showed that it was able to distinguish between intact and damaged areas. However, impedance signatures showed large fluctuations subjected to repeated measurements within the same area.
To improve the damage performance of the proposed PZT device concept, the weight of the device was increased by adding a 50 g weight to the device to allow better contact between the PZT device and the surface of the structure. Here, the experiments successfully showed that the RMSD values increased from 2.69% to 7.62% for the 0.2 mm top plate composite structure. This improvement was also observed for the composite structure with a 0.6 mm top plate, where increasing the weight resulted in increasing the RMSD value from 11.00% to 24.88%. The last part of this study involved further increasing the weight of the structure by adding another 50 g to achieve an additional 100 g for the PZT device. Although more improvement in damage detection performance was seen, the increase in the RMSD values was quick and small, increasing from 7.62% to 7.88% with the 0.2 mm top-thickness composite structure. However, for the 0.6 mm top-thickness composite structure, the RMSD values increased from 24.88% to 30.16%, which showed a noticeable improvement.
The last section of the work involved calculating the standard deviation values for all cases to investigate the reliability and performance of the proposed idea. The results showed that additional weight can affect the reliability performance of the PZT device. The experiments show that increasing the weight of the PZT device does not always improve the reliability of the proposed idea. For future work, different PZT device designs and weights should be investigated to achieve the best performance of the proposed idea.

Author Contributions

W.S.N. was responsible for the conceptualization and methodology of the work; H.-W.C. carried out the investigation, conducted experiments, and participated in writing the manuscript by analyzing data. All authors have read and agreed to the published version of the manuscript.

Funding

This study was supported by the Research Programs funded by SeoulTech (Seoul National University of Science and Technology).

Data Availability Statement

All data generated or analyzed and materials used during this study are included in this published article.

Conflicts of Interest

The authors declare no conflicts of interest.

References

  1. Hsissou, R.; Seghiri, R.; Benzekri, Z.; Hilali, M.; Rafik, M.; Elharfi, A. Polymer composite materials: A comprehensive review. Compos. Struct. 2021, 262, 113640. [Google Scholar] [CrossRef]
  2. Zhao, G.; Wang, B.; Wang, T.; Hao, W.; Luo, Y. Detection and monitoring of delamination in composite laminates using ultrasonic guided wave. Compos. Struct. 2019, 225, 111161. [Google Scholar] [CrossRef]
  3. Wang, X.; Wang, Q.; Zhang, L.; Yu, J.; Liu, Q. Three-Dimensional Defect Characterization of Ultrasonic Detection Based on GCNet Improved Contrast Learning Optimization. Electronics 2023, 12, 3944. [Google Scholar] [CrossRef]
  4. Scarponi, C.; Briotti, G. Ultrasonic detection of delaminations on composite materials. J. Reinf. Plast. Compos. 1997, 16, 768–790. [Google Scholar] [CrossRef]
  5. Ghadermazi, K.; Khozeimeh, M.A.; Taheri-Behrooz, F.; Safizadeh, M.S. Delamination detection in glass–epoxy composites using step-phase thermography (SPT). Infrared Phys. Technol. 2015, 72, 204–209. [Google Scholar] [CrossRef]
  6. Moskovchenko, A.I.; Vavilov, V.P.; Bernegger, R.; Maierhofer, C.; Chulkov, A.O. Detecting delaminations in semitransparent glass fiber composite by using pulsed infrared thermography. J. Nondestruct. Eval. 2020, 39, 1–10. [Google Scholar] [CrossRef]
  7. Chrysafi, A.P.; Athanasopoulos, N.; Siakavellas, N.J. Damage detection on composite materials with active thermography and digital image processing. Int. J. Therm. Sci. 2017, 116, 242–253. [Google Scholar] [CrossRef]
  8. Saeedifar, M.; Zarouchas, D. Damage characterization of laminated composites using acoustic emission: A review. Compos. Part B Eng. 2020, 195, 108039. [Google Scholar] [CrossRef]
  9. Fotouhi, M.; Najafabadi, M.A. Acoustic emission-based study to characterize the initiation of delamination in composite materials. J. Thermoplast. Compos. Mater. 2016, 29, 519–537. [Google Scholar] [CrossRef]
  10. Silversides, I.; Maslouhi, A.; LaPlante, G. Acoustic emission monitoring of interlaminar delamination onset in carbon fibre composites. Struct. Health Monit. 2013, 12, 126–140. [Google Scholar] [CrossRef]
  11. Ni, Q.Q.; Hong, J.; Xu, P.; Xu, Z.; Khvostunkov, K.; Xia, H. Damage detection of CFRP composites by electromagnetic wave nondestructive testing (EMW-NDT). Compos. Sci. Technol. 2021, 210, 108839. [Google Scholar] [CrossRef]
  12. Dehui, W.; Fan, Y.; Teng, W.; Wenxiong, C. A novel electromagnetic nondestructive testing method for carbon fiber reinforced polymer laminates based on power loss. Compos. Struct. 2021, 276, 114421. [Google Scholar] [CrossRef]
  13. Wandowski, T.; Malinowski, P.H.; Ostachowicz, W.M. Delamination detection in CFRP panels using EMI method with temperature compensation. Compos. Struct. 2016, 151, 99–107. [Google Scholar] [CrossRef]
  14. Singh, S.K.; Soman, R.; Wandowski, T.; Malinowski, P. A variable data fusion approach for electromechanical impedance-based damage detection. Sensors 2020, 20, 4204. [Google Scholar] [CrossRef]
  15. Kim, Y.S.; Na, W.S. Implementation of biomimicry for detecting composite structure damage using impedance-based Non-destructive testing method. Appl. Sci. 2023, 13, 876. [Google Scholar] [CrossRef]
  16. Griffin, C.; Giurgiutiu, V. Piezoelectric Wafer Active Sensor Transducers for Acoustic Emission Applications. Sensors 2023, 23, 7103. [Google Scholar] [CrossRef]
  17. Wang, J.; Shen, Y. An enhanced Lamb wave virtual time reversal technique for damage detection with transducer transfer function compensation. Smart Mater. Struct. 2019, 28, 085017. [Google Scholar]
  18. Dipon, W.; Gamboa, B.; Guo, R.; Bhalla, A. Energy harvesting using a stacked PZT transducer for self-sustainable remote multi-sensing and data logging system. J. Compos. Sci. 2022, 6, 49. [Google Scholar] [CrossRef]
  19. Liang, C.; Sun, F.P.; Rogers, C.A. Coupled electro-mechanical analysis of adaptive material systems—determination of the actuator power consumption and system energy transfer. J. Intell. Mater. Syst. Struct. 1994, 5, 12–20. [Google Scholar]
  20. Singh, S.K.; Shanker, R. Determining the Sensing Region of Surface Bonded PZT Sensor and Surface Mounted PZT Sensor in Electro-Mechanical Impedance Technique for Non-Destructive Testing. Russ. J. Nondestruct. Test. 2022, 58, 934–949. [Google Scholar] [CrossRef]
  21. Singh, S.K.; Shanker, R.; Ranjan, A. Health Monitoring of Steel Structures Using Surface Mountable and Detachable PZT Sensor. J. Intell. Mater. Syst. Struct. 2024, 35, 380–392. [Google Scholar] [CrossRef]
  22. Liu, Q.; Chai, Y.; Wang, Y.; Sun, H.; Qing, X. Adhesively Bonding a Reusable PZT Transducer for Structural Health Monitoring (SHM) with an Ethylene-Acrylic Acid Copolymer Adhesive. Int. J. Adhes. 2022, 119, 103256. [Google Scholar] [CrossRef]
  23. Moharana, S.; Bhalla, S. Development and Evaluation of an External Reusable Piezo-Based Concrete Hydration-Monitoring Sensor. J. Intell. Mater. Syst. Struct. 2019, 30, 2770–2788. [Google Scholar] [CrossRef]
  24. Baral, S.; Adhikari, S.; Negi, P.; Bhalla, S. Development and Evaluation of Reusable Piezo Sensors for Health Monitoring of Thin-Walled Steel Structures. J. Civ. Struct. Health Monit. 2022, 12, 647–657. [Google Scholar] [CrossRef]
  25. Yang, Y.; Divsholi, B.S.; Soh, C.K. A Reusable PZT Transducer for Monitoring Initial Hydration and Structural Health of Concrete. Sensors 2010, 10, 5193–5208. [Google Scholar] [CrossRef]
  26. Divsholi, B.S.; Yang, Y. Application of Reusable PZT Sensors for Monitoring Initial Hydration of Concrete. Sens. Smart Struct. Technol. Civ. Mech. Aerosp. Syst. 2009, 7292, 698–706. [Google Scholar]
  27. Tawie, R.; Lee, H.-K. Characterization of Cement-Based Materials Using a Reusable Piezoelectric Impedance-Based Sensor. Smart Mater. Struct. 2011, 20, 085023. [Google Scholar] [CrossRef]
  28. Parpe, A.; Jothi Saravanan, T. New refined analytical models for various bonding conditions of an adhesively bonded smart PZT transducer using the EMI technique. Smart Mater. Struct. 2021, 30, 125015. [Google Scholar] [CrossRef]
  29. Saravanan, T.; Jothi, T.; Chauhan, S.S. Study on pre-damage diagnosis and analysis of adhesively bonded smart PZT sensors using EMI technique. Measurement 2022, 188, 110411. [Google Scholar] [CrossRef]
  30. Na, W.; Baek, J. Adhesive Defect Monitoring of Glass Fiber Epoxy Plate Using an Impedance-Based Non-Destructive Testing Method for Multiple Structures. Sensors 2017, 17, 1439. [Google Scholar] [CrossRef]
  31. Nguyen, C.H.; Pietrzko, S.; Buetikofer, R. The influence of temperature and bonding thickness on the actuation of a cantilever beam by PZT patches. Smart Mater. Struct. 2004, 13, 851. [Google Scholar] [CrossRef]
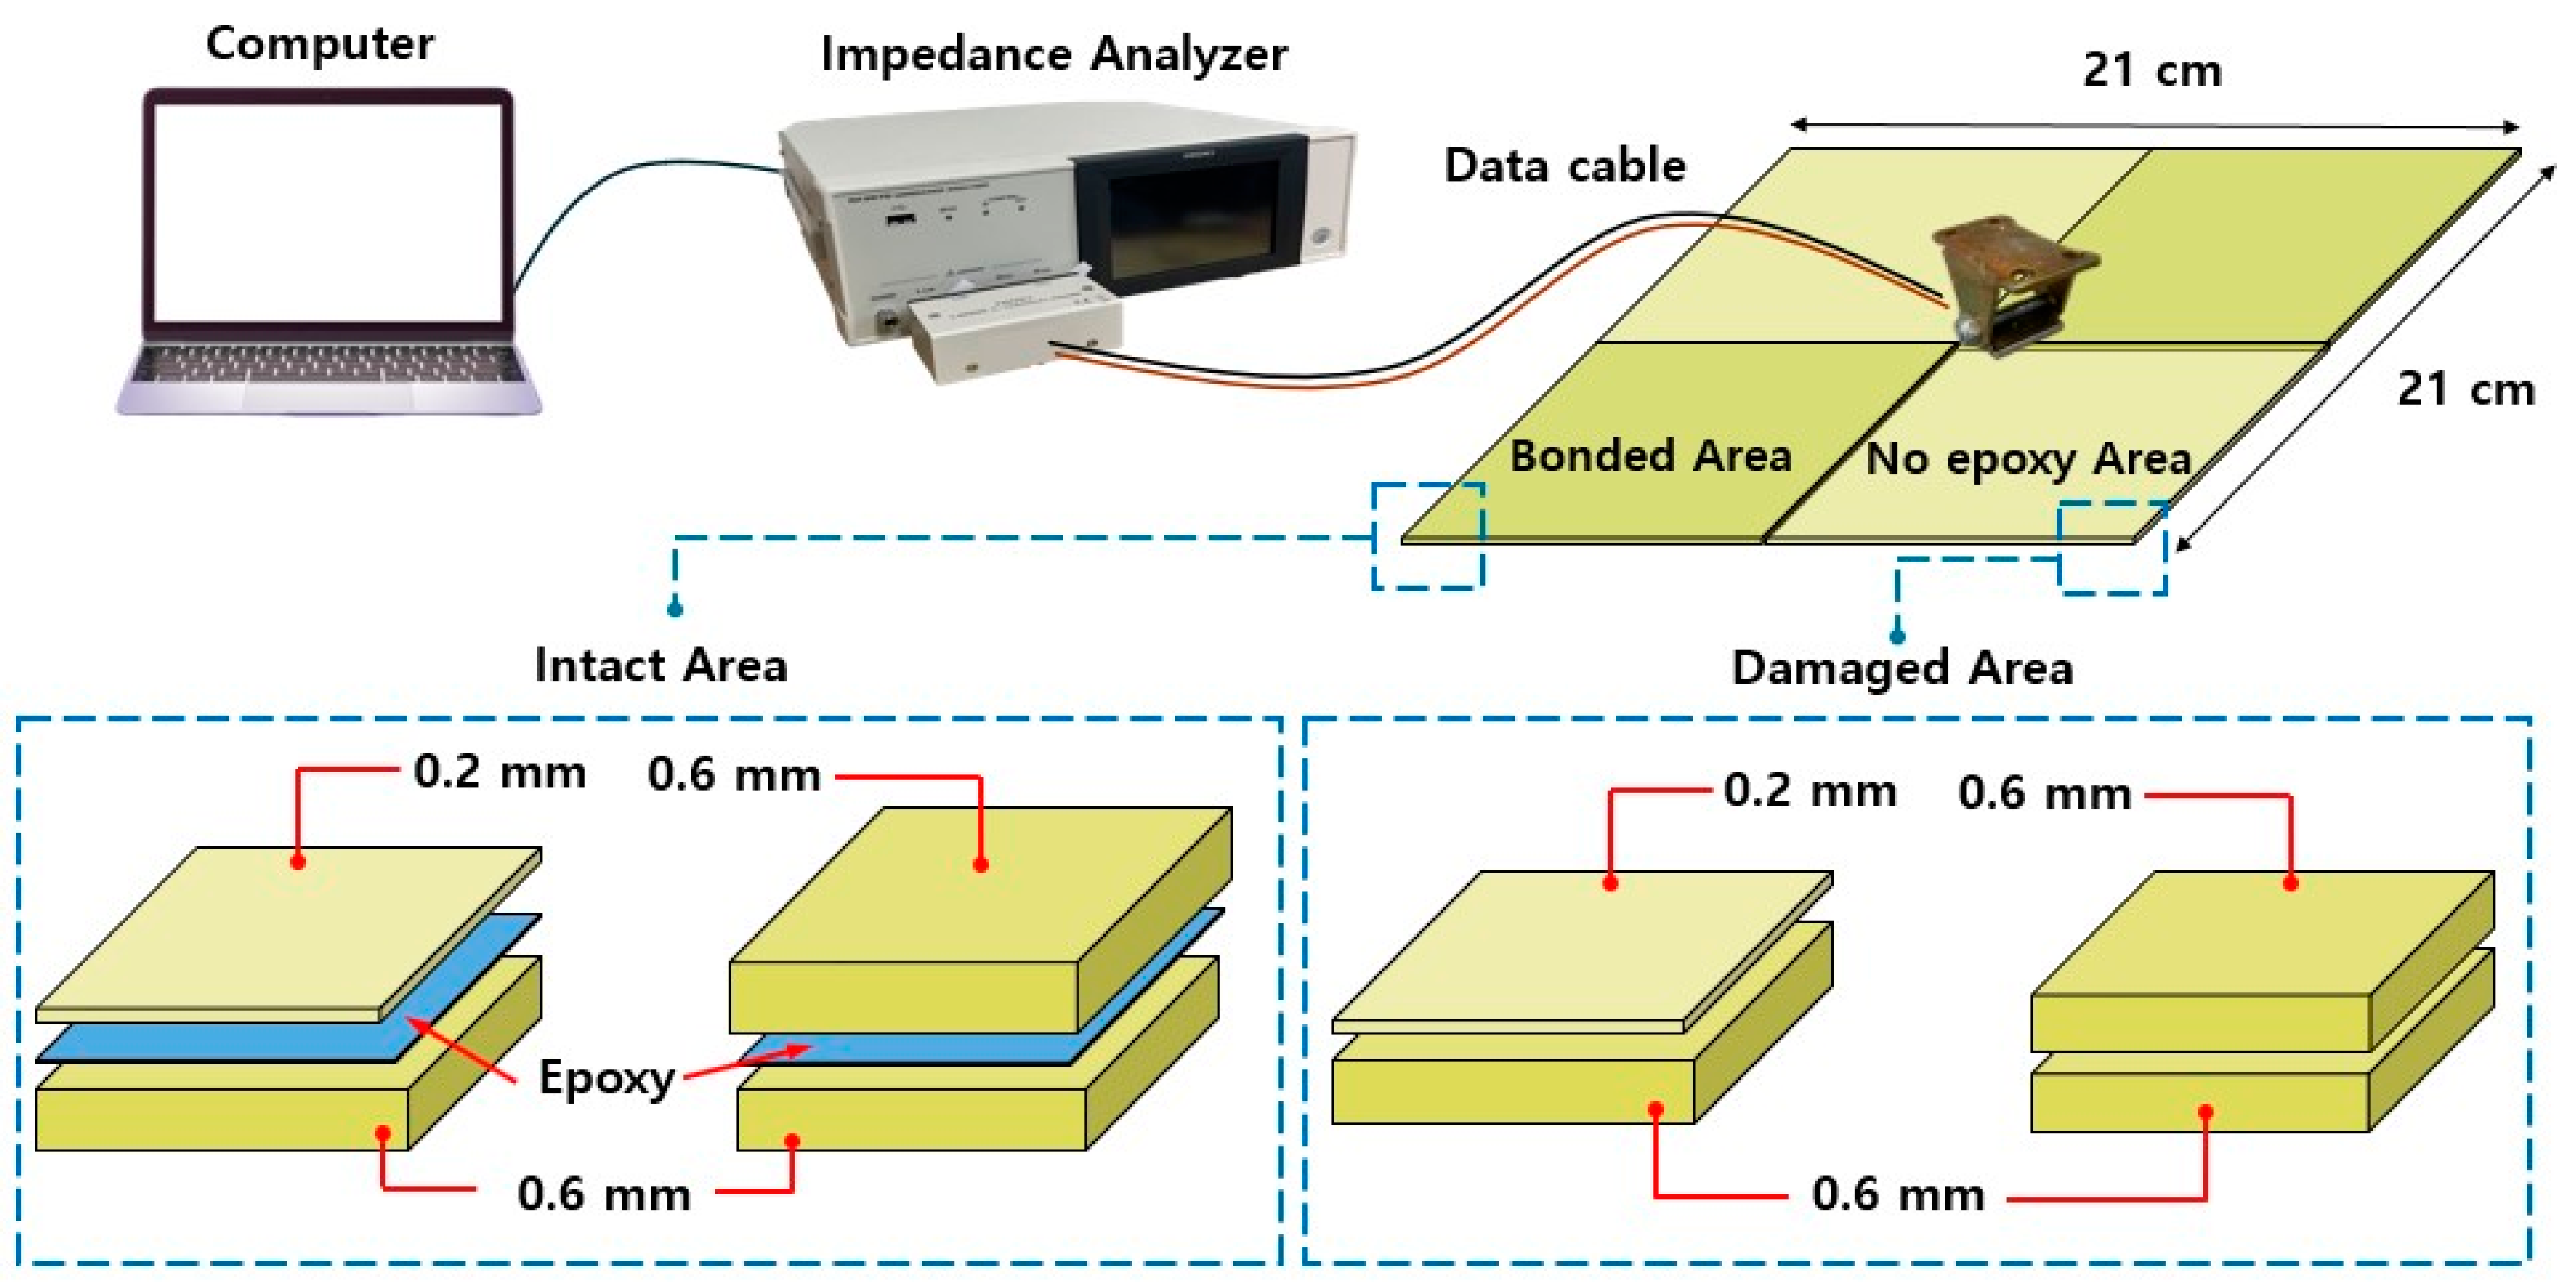
Figure 1. Impedance measuring system setup.
Electronics 13 02589 g001
Figure 2. The proposed PZT device concept.
Electronics 13 02589 g002
Figure 3. 0.2 mm top plate intact vs. damaged impedance signatures.
Electronics 13 02589 g003
Figure 4. 0.6 mm top plate intact vs. damaged impedance signatures.
Electronics 13 02589 g004
Figure 5. Averaged impedance signatures for 0.2 mm and 0.6 mm composites.
Electronics 13 02589 g005
Figure 6. Additional 50 g weight on (a) 0.2 mm intact vs. damaged; (b) 0.6 mm intact vs. damaged.
Electronics 13 02589 g006
Figure 7. Additional 100 g weight on (a) 0.2 mm intact vs. damaged; (b) 0.6 mm intact vs. damaged.
Electronics 13 02589 g007
Figure 8. Averaged intact vs. damaged area signatures on (a) 50 g case; (b) 100 g case.
Electronics 13 02589 g008aElectronics 13 02589 g008b
Figure 9. Standard deviation of impedance signature by thickness according to weight: (a) weightless; (b) 50 g case; (c) 100 g case.
Electronics 13 02589 g009
Figure 10. Reliability and Accuracy Criteria for Comparison of PZT Damage Detection Capabilities (a) Standard Deviation; (b) RMSD.
Electronics 13 02589 g010
Disclaimer/Publisher’s Note: The statements, opinions and data contained in all publications are solely those of the individual author(s) and contributor(s) and not of MDPI and/or the editor(s). MDPI and/or the editor(s) disclaim responsibility for any injury to people or property resulting from any ideas, methods, instructions or products referred to in the content.