Article

Multi-Frequency Spectral–Spatial Interactive Enhancement Fusion Network for Pan-Sharpening

1
School of Information Science and Engineering, Yunnan University, Kunming 650500, China
2
College of Big Data, Yunnan Agricultural University, Kunming 650201, China
*
Author to whom correspondence should be addressed.
Electronics 2024, 13(14), 2802; https://doi.org/10.3390/electronics13142802
Submission received: 13 June 2024 / Revised: 3 July 2024 / Accepted: 4 July 2024 / Published: 16 July 2024
(This article belongs to the Topic Computational Intelligence in Remote Sensing: 2nd Edition)

Abstract

:
The objective of pan-sharpening is to effectively fuse high-resolution panchromatic (PAN) images with limited spectral information and low-resolution multispectral (LR-MS) images, thereby generating a fused image with a high spatial resolution and rich spectral information. However, current fusion techniques face significant challenges, including insufficient edge detail, spectral distortion, increased noise, and limited robustness. To address these challenges, we propose a multi-frequency spectral–spatial interaction enhancement network (MFSINet) that comprises the spectral–spatial interactive fusion (SSIF) and multi-frequency feature enhancement (MFFE) subnetworks. The SSIF enhances both spatial and spectral fusion features by optimizing the characteristics of each spectral band through band-aware processing. The MFFE employs a variant of wavelet transform to perform multiresolution analyses on remote sensing scenes, enhancing the spatial resolution, spectral fidelity, and the texture and structural features of the fused images by optimizing directional and spatial properties. Moreover, qualitative analysis and quantitative comparative experiments using the IKONOS and WorldView-2 datasets indicate that this method significantly improves the fidelity and accuracy of the fused images.

1. Introduction

High-resolution multispectral (HRMS) image fusion, which has extensive applications in agriculture, forestry, urban planning, and environmental monitoring [1,2,3,4], is a critical technique for enhancing image resolution and quality. However, due to technical constraints, remote sensing satellites can only capture low-resolution multispectral (LRMS) and high-resolution panchromatic (PAN) images, making it difficult to directly acquire HR-MS images [5]. LRMS exhibits excellent spectral resolution but low spatial resolution, while PAN images possess a high spatial resolution but low spectral resolution. It is worth fusing these two kinds of images to generate images with both high spatial and spectral resolutions [6,7].
Currently, HRMS fusion methods can be categorized into three methods, including component substitution (CS), multiresolution analysis (MRA), and deep neural network (DNN)-based methods. CS enhances image details by replacing or adjusting certain components of the multispectral image using the high-resolution PAN image. Some CS methods have been proposed. For example, it has been used in the literature [8] to product an experimental SPOT image map. PCA [9] was introduced to merge the TM and PAN data to replace the first principal component. In the literature [10], Gram–Schmidt was used to capture the spectral responses of the sensors and integrate them into the Gram–Schmidt spectral sharpening method to generate fused images with the same spatial sharpness. Brovey [11] discussed two methods based on ratioing of data from different image channels. Althrough CS has advantages, it may distort spectral information when intensively replacing luminance or intensity components. Therefore, multiresolution analysis (MRA) was introduced to decompose the PAN and multispectral images into different scales or levels using one or more image decomposition techniques. It is enabling independent processing of different frequency components. Common MRA methods include wavelet [12,13], various Laplacian-based fusion methods with an adaptive spatial injection mode [14], contourlet [15], and ATWT-M2 [16]. However, MRA methods typically involve complex computations. The selections of transformation type, number of layers, and other parameters significantly impact the quality of the final image, requiring careful adjustment for optimal results.
DNN-based fusion technology has demonstrated remarkable effects in effectively handling the integration of multispectral and PAN images. Yuan et al. [17] proposed a multiscale and multi-depth convolutional neural network (MSDCNN). Zhang et al. [18] proposed a bidirectional pyramid network (BDPN) to better achieve spectral preservation and detail extraction. Wang et al. [19] proposed a multiscale U-shaped convolutional neural network (MUCNN) for fully utilizing the multispectral information of involved images. Feng et al. [20] conducted a multilevel parallel feature injection network (MPFINet) to balance spatial enhancement and spectral preservation. A spatial–spectral dual back-project network (S2DBPN) was introduced by Zhang et al. [21] to fuse images by exploiting BP in the spatial and spectral domains. After this, Zhang et al. [22] proposed a deep multiscale LD network (DMLD) to enhance the spatial and spectral information in the fused images.
Despite their advantages, these DNN-based fusion methods often suffer from noise or negative features which are repeatedly extracted and variously superimposed due to specific prior knowledge. Moreover, these methods rely on the extraction of multiscale features, leading to feature redundancy and artifact replication in the learned features.
To address the limitations of existing methods, we propose a multi-frequency enhanced fusion network that integrates the benefits of spectral–spatial interaction fusion and multi-frequency feature enhancement. Our approach involves analyzing the correlation between the source image and the high-resolution image, leveraging frequency domain information to enhance spatial information and generate high-resolution multispectral (HRMS) images. Additionally, we thoroughly explore the potential of the panchromatic (PAN) image by considering the characteristics of each band in the multispectral (MS) image. We employ a wavelet transform to perform a multi-resolution analysis on the MS image, capturing both global features and local details. This approach optimizes the directionality and spatial alignment of the source image, ensuring more precise alignment of texture and structural information across different scale images. The main contributions of this work include:
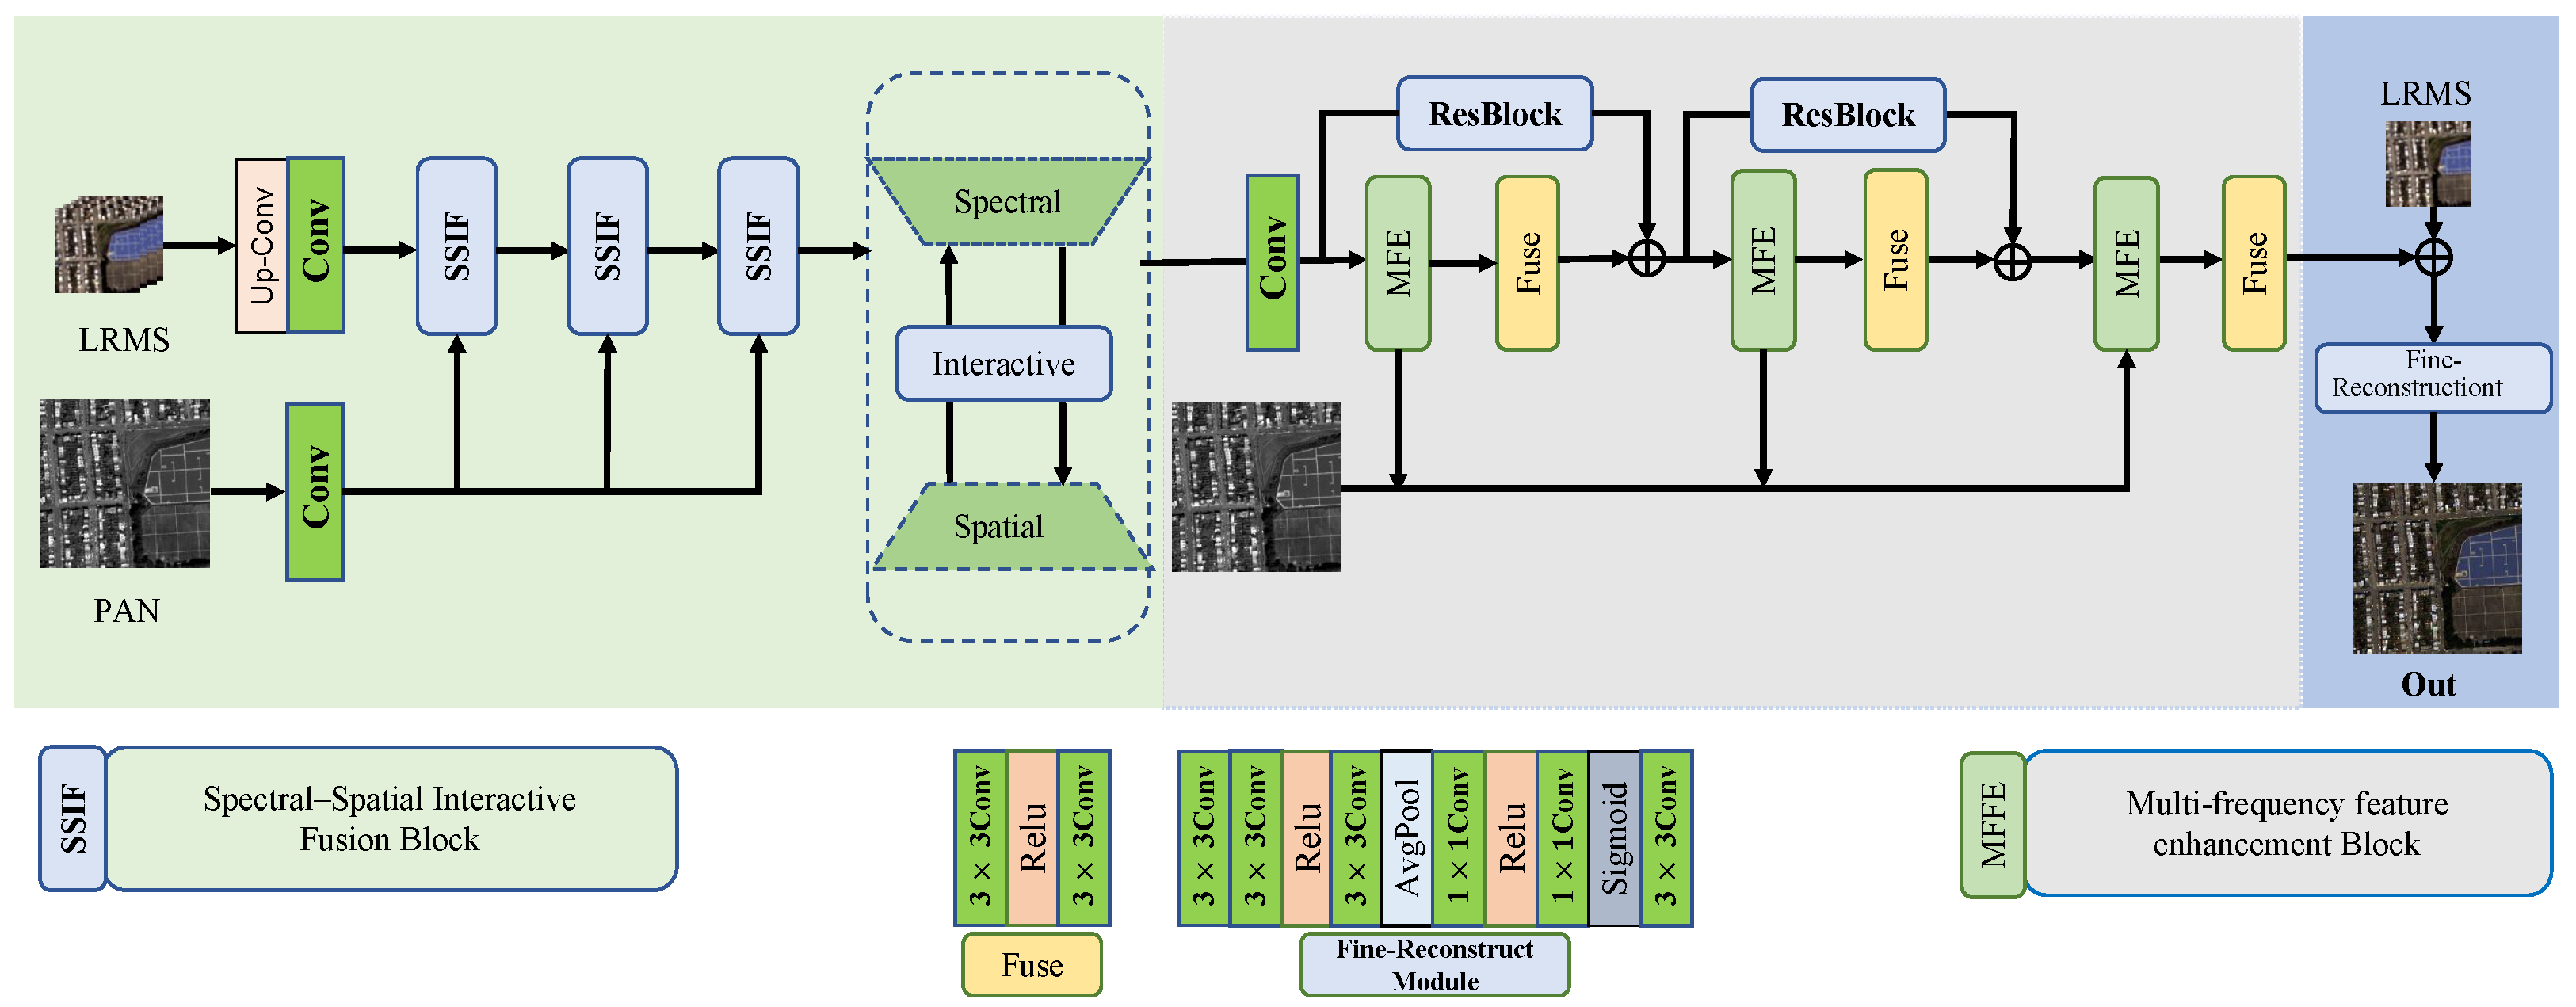
  • A novel multi-frequency spectrum–spatial interaction enhanced fusion network (MFSINet) is proposed, leveraging a multi-resolution analysis to integrate complementary features from both the spatial and frequency domains, thereby enhancing the quality of pan-sharpened fusion.
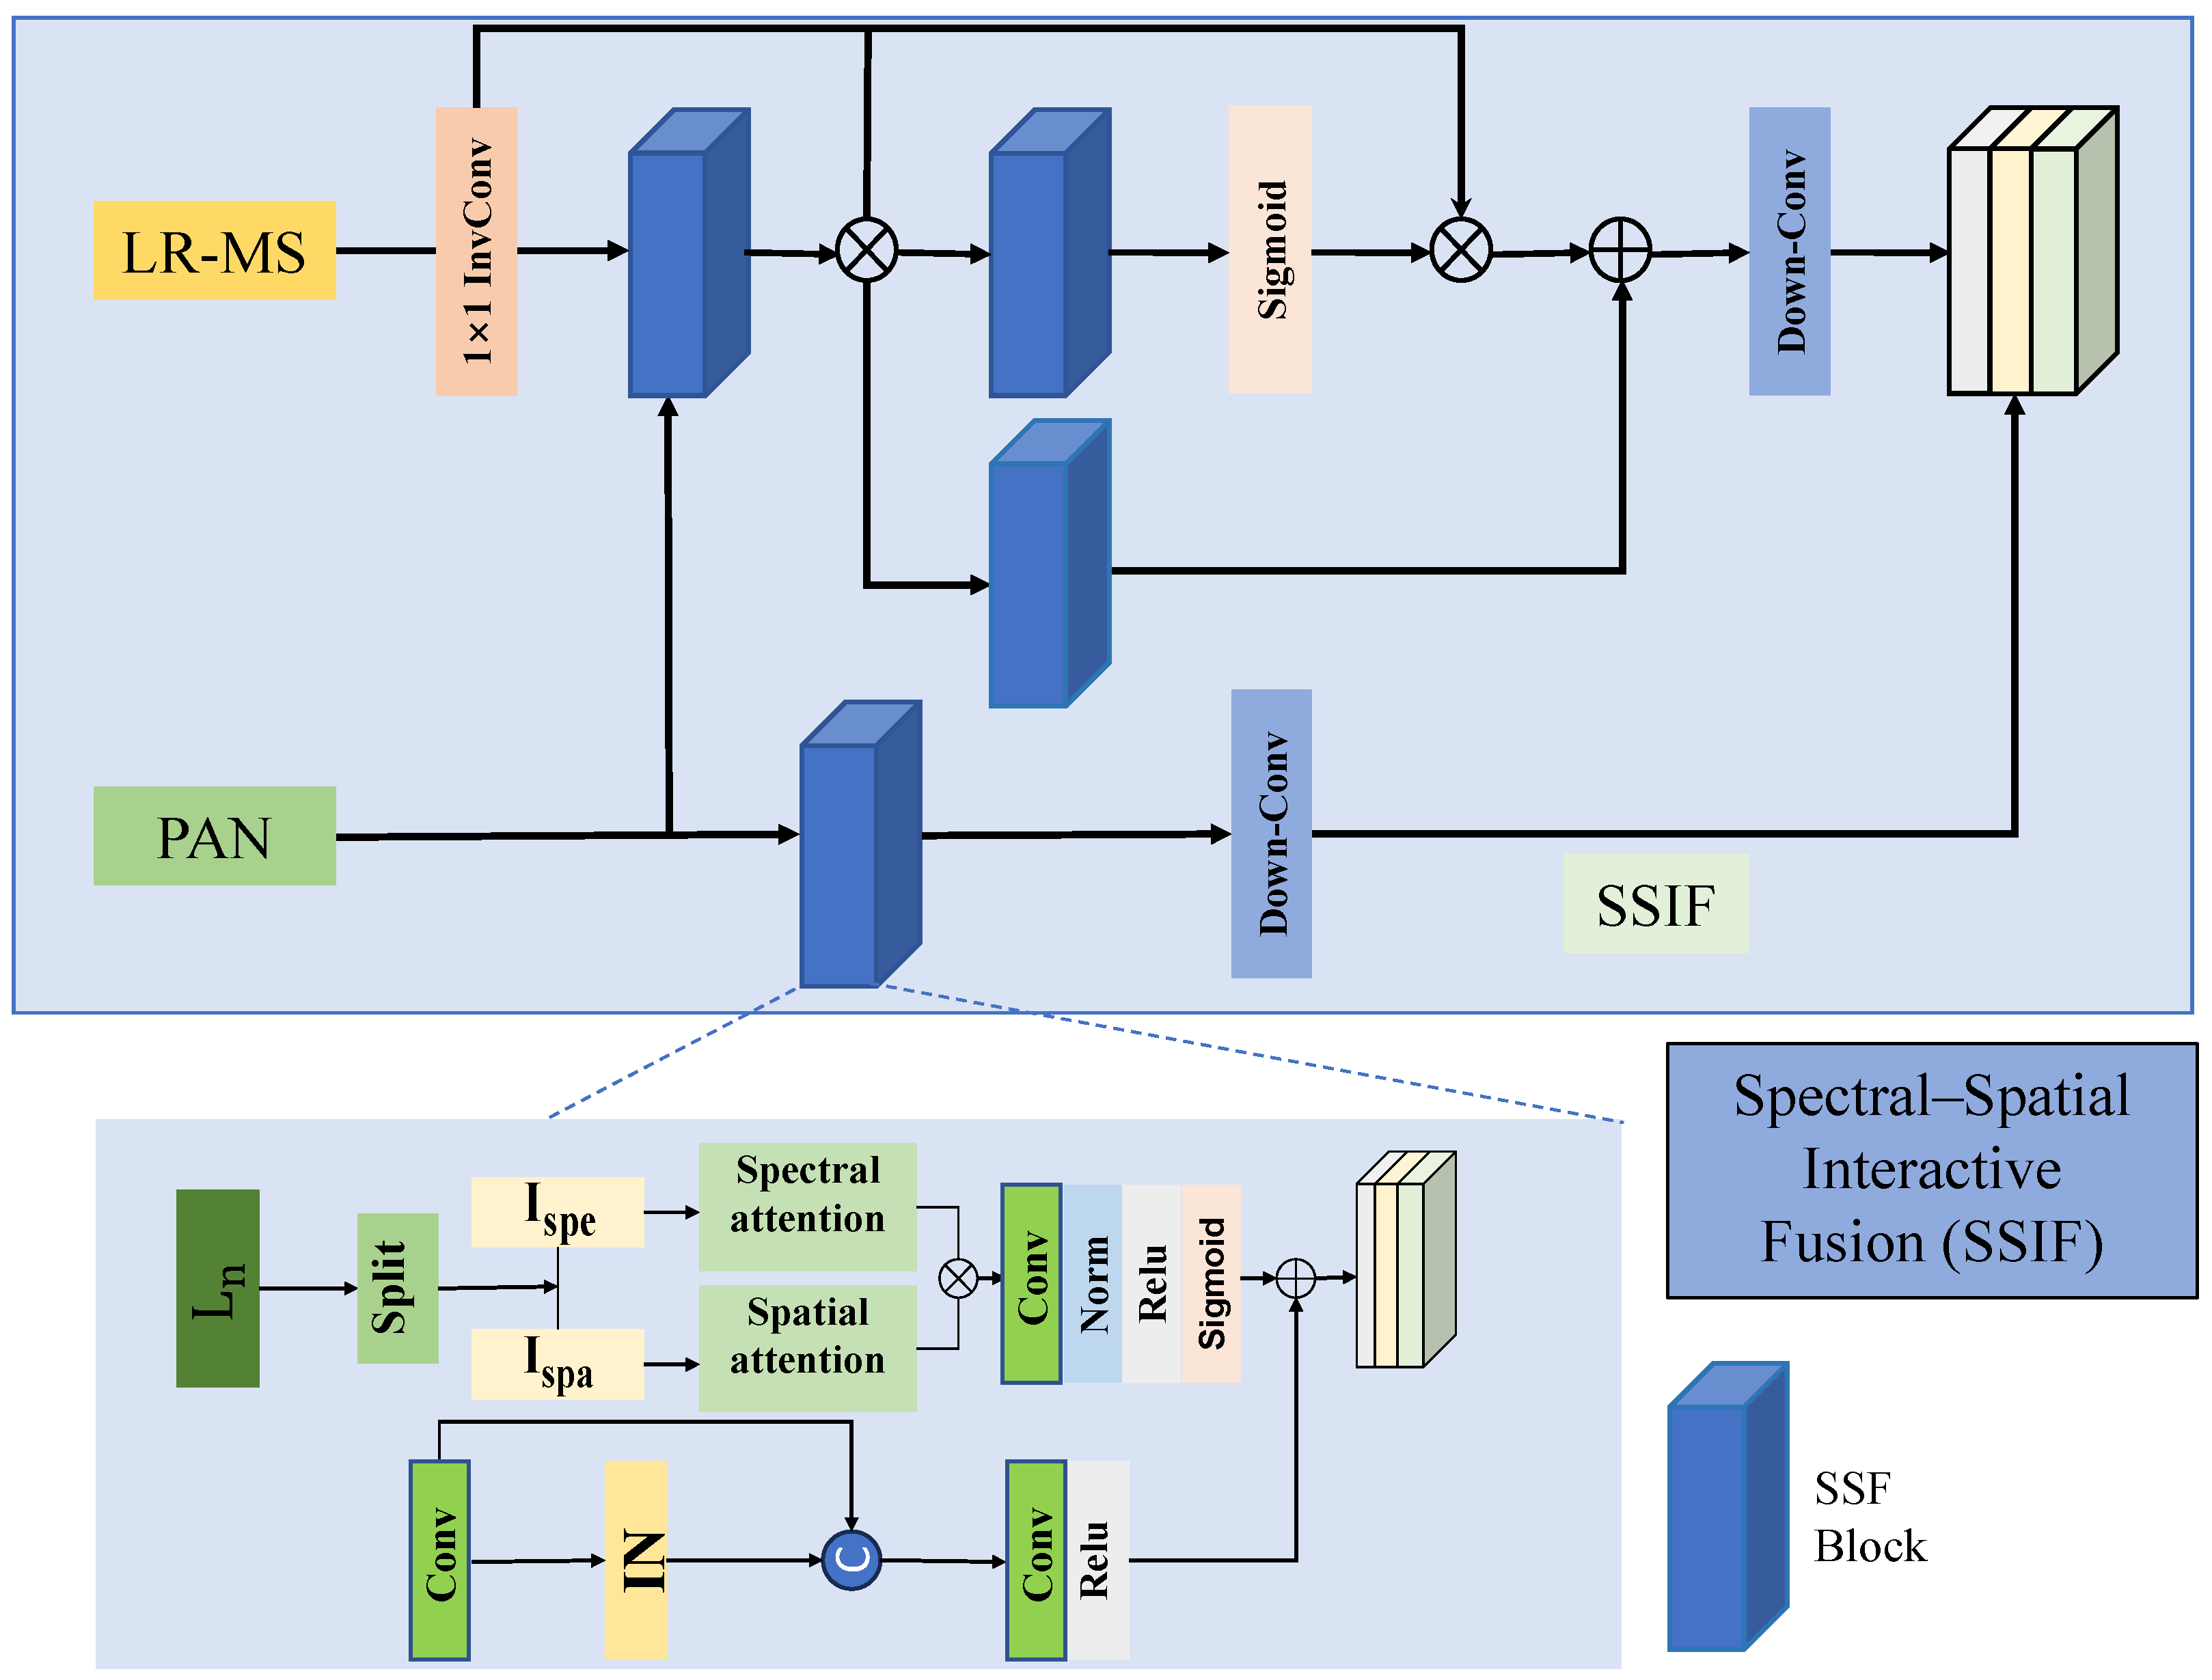
  • A spectral–spatial interaction fusion block has been developed to construct multi-scale spatial and spectral interactions. This approach promotes the effective fusion and interaction of information across different scales at both the spectral and spatial levels.
  • We propose a multi-frequency feature enhancement scheme that fully leverages the advantages of wavelet transform in multi-frequency analysis and edge-preserving fusion. This approach accurately represents image texture and structural information from both directional and spatial perspectives.
  • Extensive experiments conducted on the IKONOS and WorldView-2 datasets demonstrate that our method is comparable to state-of-the-art algorithms in both qualitative and quantitative analyses.
The structure of this article is outlined as follows. Section 2 describes the related work on spectral–spatial interactive and multi-frequency feature enhancement. Subsequently, Section 3 details the analysis of the proposed MFSINet network architecture. Section 4 evaluates the performance of the proposed MFSINet by comparing it with other state-of-the-art methods on both full-resolution and reduced-resolution datasets. Conclusions are drawn in Section 5.

2. Related Work

2.1. Spectral–Spatial Interactive Fusion

Spectral–spatial interactive fusion is an advanced image processing technique that dynamically fuses spectral and spatial information to produce high-quality, high-resolution fused images, making it particularly suitable for a variety of remote sensing image processing tasks, including pan-sharpening applications. In this technique, spectral features reflect the importance of spectral information across different bands, while spatial features reveal the significance of spatial information within the multispectral image bands. The high correlation between spectral and spatial features is central to this approach. To maintain the integrity of fused features and maximize feature utilization, current methodologies attempt to combine spectral information and spatial features effectively through the construction of multiscale feature fusion platforms. For instance, the SENet [23] architecture enhances model performance by focusing on the relationships between channels in feature maps, incorporating SE blocks that adaptively adjust channel feature responses to boost the network’s representational power. Shen et al. [24] constructed a fusion framework, where iterative optimization algorithms were used to refine the fusion model. Mei et al. [25] proposed a spectral–spatial attention network for hyperspectral image classification that learns the correlations within the spectral continuum and the spatial relationships between adjacent pixels. Nie et al. [26] developed a spectral–spatial attention interaction network that extracts and iteratively interacts with features to efficiently transfer spectral–spatial information, significantly enhancing information integration efficiency. He et al. proposed a novel pan-sharpening approach (MSDDN) [27] by exploring the distinguished information in both the spatial and frequency domains to capture multiscale dual-domain information, generating high-quality pan-sharpening results. Moreover, a batch of excellent deep learning algorithms has also been developed. Xu et al. [28] proposed two optimization solutions with deep prior regularization. A gradient projection algorithm was used, and the iterative steps were generalized. After that, an improved and advanced purely transformer-based model for pan-sharpening was proposed [29].

2.2. Multi-Frequency Feature Enhancement

Multi-frequency feature enhancement technology aims to improve image detail and contrast by enhancing features across multiple frequency bands. This technology involves the use of multiscale feature enhancement networks, which adjust their processing approach based on the specific characteristics of the data at different scales or frequency bands, thus optimizing image processing outcomes. Wavelet transform [30,31] is a key method for achieving multi-frequency feature sparse enhancement, allowing the decomposition of an image or signal into different frequency components, each representing local frequency characteristics at a specific scale. The advantages of wavelet transforms [32] lie in its ability to simultaneously provide spatial and frequency detail information, which is crucial for applications involving multiscale or multi-frequency features such as image compression, denoising, feature extraction, and feature enhancement. The orthogonal multiresolution wavelet [33] representation defined by S.G. Mallat has been widely applied in data compression, texture differentiation, and fractal analysis of image encoding. Shu et al. [34] developed a wavelet-based video compression algorithm, demonstrating the compressive capabilities of wavelet transforms in video file processing. Guo et al. [35] designed a deep convolutional neural network to predict the “missing details” in wavelet coefficients of low-resolution images to achieve super-resolution (SR) results. Liu et al. proposed a novel multi-level wavelet CNN (MWCNN) [36] model that better balances receptive field size and computational efficiency. Moreover, Some sparse representation image fusion algorithms have been widely used for pan-sharpening problems [37,38]. By leveraging the sparse properties of images, these algorithms effectively preserve edges and texture details, maintain spectral information, and perform better in reducing spectral distortion.

3. Proposed Method

3.1. Motivation

Existing methods primarily utilize spatial information to generate pan-sharpened images, often overlooking the interrelationship between frequency domain and spatial information. To address these challenges, we thoroughly consider incorporating frequency domain information into the fusion of MS images, utilizing a spectral–spatial interaction fusion block to enhance the rich texture information. Moreover, it is noteworthy that high-resolution multispectral image fusion poses another challenge: the issue of scale mismatch. Different regions exhibit significant characteristic differences at varying spatial scales. Therefore, we adopt a multi-frequency feature enhancement scheme, fully exploiting the advantages of wavelet transform variants in resolution analysis and edge-preserving fusion. This approach accurately represents image texture and structural information from both directional and spatial perspectives.

3.2. Network Framework

As shown in Figure 1, due to the differing scales of LRMS and PAN images, the MFSINet architecture first performs upscaling on the low-resolution multispectral (LRMS) image to match the scale of the panchromatic (PAN) image. Subsequently, the super-resolution processing of the LRMS image is optimized using the spatial and frequency domain features of the PAN image. Through the spectral–spatial interactive fusion (SSIF) subnetwork, an interactive mechanism for MS image fusion is established. This mechanism leverages the rich spectral information of the LRMS image and the clear spatial information of the PAN image to more accurately capture the complex features within the images. The results of this fusion process are then passed to the second stage: the multi-frequency feature enhancement (MFFE) subnetwork. Here, the high spatial resolution of the panchromatic image and the rich spectral data of the multispectral image are used to process data with local characteristics and multiscale information, producing images that maintain a high spatial resolution and spectral characteristics. Through the integration of spatial domain and multi-scale information across three stages, a high-resolution HRMS fusion result is obtained. The entire network operation is as follows:
H = U P 4 + F ( U P L , P )
F ( · ) = S S I F 3 M F F E 3 F R
where UP represents the upsampling convolution operation, F ( · ) represents the Fusion result output, S S I F 3 represents the spectral–spatial interactive fusion module, and M F F E 3 represents the multi-frequency enhancement module. The symbol Ⓒ represents the cascading between modules. The symbol 3 denotes three serial operations. Additionally, FRrepresents the fine reconstruction model operation. UP is crucial for increasing the spatial resolution of the input feature maps, ensuring that the subsequent fusion process can integrate fine-grained details. The SSIF module enhances the fusion process by leveraging both spectral and spatial information through attention mechanisms, thus preserving critical structural and textural information. The MFFE module applies multi-frequency analysis to capture and enhance features at various frequency scales, which is essential for maintaining high-quality image reconstruction. Finally, FR further refines the fused image, improving detail and accuracy by utilizing convolutional layers, activation functions, and pooling operations to balance local information and global features. This comprehensive approach ensures that the output image retains both a high resolution and high fidelity in the spectral and spatial domains.

3.2.1. Spectral–Spatial Interactive Fusion Block (SSIF)

In the spectral–spatial interactive fusion block, both LRMS and PAN images are sampled simultaneously and mapped into the feature space. The SSIF framework is illustrated in Figure 2. Given the scale discrepancy between the two images, they are mapped to matching dimensions through upscaling/downscaling processes. This approach maintains the structural and textural information of the images by leveraging multiscale global and local features. This interaction, facilitated by spectral and spatial attention mechanisms [39], helps capture more detailed information and features within the images. The spectral attention mechanism [40,41] weights the spectral channel features to enhance the model’s efficiency in using spectral information, focusing on locally significant spectral data. Conversely, spatial attention focuses on the pixel arrangement, assigning weights to each pixel position to emphasize or suppress feature representations accordingly, thus enhancing the model’s capability in spatial representation. This is formulated as follows:
S S I F = D O W N [ S S F ( C O N V L , P A N ) ]
( X 1 , X 2 ) = S p l i t ( L , P )
X = C O N V [ S P E A ( X 1 ) × S A P E ( X 2 ) ]
X = CONV { IN [ CONV ( L , P ) ] cat Res ( L , P ) }
S S F = X + X
where D O W N represents the downsampling convolution operation, S S F represents the spectral and spatial fusion block, Split represents the channel split operation, S P E A represents spectral information, S A P E represents spatial attention, IN represents instance normalization, and Res represents the residual connection.
Hierarchical instance normalization [42] is used to interact with features across different layers, facilitating richer feature extraction and promoting information transfer and integration. Therefore, in the SSIF module, we integrate spatial and frequency features to fuse the local multiscale characteristics of LRMS and PAN images in the spatial domain. Additionally, we utilize the global and local spatial features of the PAN image to optimize the detail and structural feature learning of the LRMS image.

3.2.2. Multi-Frequency Feature Enhancement (MFFE)

Directly outputting the SSIF fusion results can lead to missing local features. Therefore, we employ the multi-frequency feature enhancement (MFFE) module to integrate the prominent spatial and multi-frequency features from SSIF. By using wavelet transform to capture multi-resolution information, the MFFE module enhances the quality of the fused image. The MFFE framework is illustrated in Figure 3. Initially, the images are convolved to extract preliminary features. Using wavelet transforms, these features are decomposed by frequency, yielding representations at various frequency scales. Our method utilizes the wavelet function: a simple yet powerful function that decomposes the input signal into approximation coefficients and detail coefficients using low-pass and high-pass filters. The resulting coefficients are in complex form. Operations F a b s and F a n g l e generate amplitude and phase components, respectively, with F a b s extracting amplitude information indicative of signal magnitude and F a n g l e extracting phase information indicative of relative phase or timing delays. The wavelet transform generates both low-frequency and high-frequency information, encompassing LL (low-frequency approximation), LH (horizontal detail), HL (vertical detail), and HH (diagonal detail) coefficients. Subsequent convolution and inverse wavelet transform (IDWT) processes reconstruct the signal details [43,44], comprising A (low-frequency), H (horizontal high-frequency), V (vertical high-frequency), and D (diagonal high-frequency) components. This step is essential in wavelet analysis for image reconstruction and denoising, formulated as follows:
M F F E = I D W T [ D W T ( C O N V M s , C O N V P a n ) ]
D W T = D e c ( L L , L H , H L , H H )
( L L , L H , H L , H H ) = C o m p l e x { A b s [ L P ( L , P ) ] , A n g l e [ H P ( L , P ) ] }
( A , H , V , D ) = C O N V ( L L , L H , H L , H H )
I D W T = R e c ( A , H , V , D )
where DWT represents the wavelet transform and IDWT represents the inverse wavelet transform. CONV represents convolution processing, which performs high-pass and low-pass filtering on MS and PAN images to extract features. Dec represents decomposition using a wavelet function, breaking the input signal into four parts: LL, LH, HL, and HH coefficients. The combination of these coefficients is used to extract different frequency components of the image, each processed separately to enhance specific features of the image. Complex refers to decomposing the wavelet transform results of the MS and PAN images into amplitude and phase. The amplitude part reflects the intensity information in the image, while the phase part contains the structural information. By processing these pieces of information separately, the details and features of the image can be better preserved during image fusion. Abs represents calculating the magnitude, and Angle represents calculating the phase. (A, H, V, D) represent the combination of new low-frequency and high-frequency sub-bands generated in the inverse wavelet transform. Rec represents reconstruction, where the input tensor is divided into four sub-tensors corresponding to the low-frequency and high-frequency coefficients of the inverse wavelet transform. The original signal is reconstructed from these coefficients through the inverse wavelet transform.
The multi-frequency feature enhancement strategy decomposes the input features into sub-bands of different frequencies, concentrating the primary energy of the signal into a few specific sub-bands. This facilitates better capture of salient features in image fusion, as each sub-band is dedicated to processing information within distinct frequency ranges. Moreover, the orthogonality property of wavelet transform reduces redundant information in feature fusion, avoiding the so-called noise iteration and thereby enhancing the model’s performance in feature extraction and task resolution.

3.2.3. Fine Reconstruction

The fine reconstruction module, implemented through multiple convolutional layers, activation functions, and pooling operations, aims to utilize the processed image’s local information and channel interdependencies to compensate for global features. This further refinement and restoration aims to improve the details and accuracy of image processing results, yielding higher-quality or more precise HR images.

3.3. Loss Function

To effectively optimize the model’s accuracy in both spatial and frequency domains, we employ a spatial and frequency L 1 loss function aimed at closely approximating the generated fusion results to the source images. The loss function for our proposed MFSINet can be represented as follows:
Loss = 1 K { i = 1 } k f P k , L k H k 1
where the G T is denoted as H k , where the combination of LRMS and PAN images resilts in ( P k , L k ) ( k = 1 , 2 , , k ) as the network output.

4. Experimental Results and Analysis

In this section, we provide a detailed description of the experimental setup, hyperparameter settings, and dataset details, including a comparative analysis of data at reduced and full resolutions. Finally, we demonstrate the superiority of our proposed method in terms of performance metrics through ablation study analysis.

4.1. Experimental Details

4.1.1. Datasets

Two publicly available datasets, namely IKONOS and WorldView-2 (WV-2), are employed to train and test the proposed method. The IKONOS dataset comprises 120 training samples and 80 testing samples. In contrast, the WorldView-2 dataset provides high-resolution imagery across 8 spectral bands, with 400 training samples and 100 testing samples. Due to the unavailability of the pan-sharpened ground truth (GT) [45], we adopted Wald’s protocol [46] to construct the reduced-resolution datasets. Specifically, we downsampled the MS and panchromatic (PAN) images by a factor of four. We used the original MS images as the ground truth (GT), resulting in low-resolution MS images sized 64 × 64 and high-resolution PAN images sized 256 × 256, while the full-resolution MS and PAN images both measured 256 × 256. These synthesized datasets were used for training purposes.

4.1.2. Implementation Details and Metrics

We trained the proposed MFIFNet using a single NVIDIA 4090 GPU with 24 GB of RAM, a 12th Gen lntel Core i9-12900K CPU (lntel, Santa Clara, CA, USA), and a 64-bit Windows 11 operating system. The implementation was performed using PyTorch 1.11.0. Measurement metrics were computed using MATLAB R2023a, and we employed a Adam optimizer with a learning rate of 0.0001. The training process lasted for 500 epochs, with the model being saved every 100 epochs. For the reduced-resolution dataset, the fused results were evaluated using metrics such as the Erreur Relative Globale Adimensionnelle de Synthèse (ERGAS) [47], spectral angle mapper (SAM) [48], spatial correlation coefficient (SCC) [49], and image quality (Q) [50]. ERGAS measures the global relative error in image quality, SAM and SCC evaluate the spectral similarity and spatial correlation between the fusion result and source images, and Q assesses image quality by comparing the similarity of the test image to the reference one in terms of brightness, contrast, and structure. Moreover, the quality with no reference (QNR) [51] was used, which is expressed as Q N R = ( 1 D s ) α ( 1 D λ ) β [52]. D λ (spectral distortion) and D s (spatial distortion) were utilized to assess the full-scale fused results by calculating both spectral and spatial distortions [53].

4.1.3. Compared Methods

Our MFIFNet is compared against eight state-of-the-art ones, including Brovey [11] from CS, ATWT-M2 [54] from MRA, MSDCNN [17], BDPN [18], MUCNN [19], MPFINet [20], S2DPBN [21], and DMLD [22]. Note that the first two ones are traditional methods, whereas the latter six ones are DL-based methods. In particular, to ensures a fair comparison, all DL-based methods were re-trained on the same training and testing datasets.

4.2. Comparative Analysis

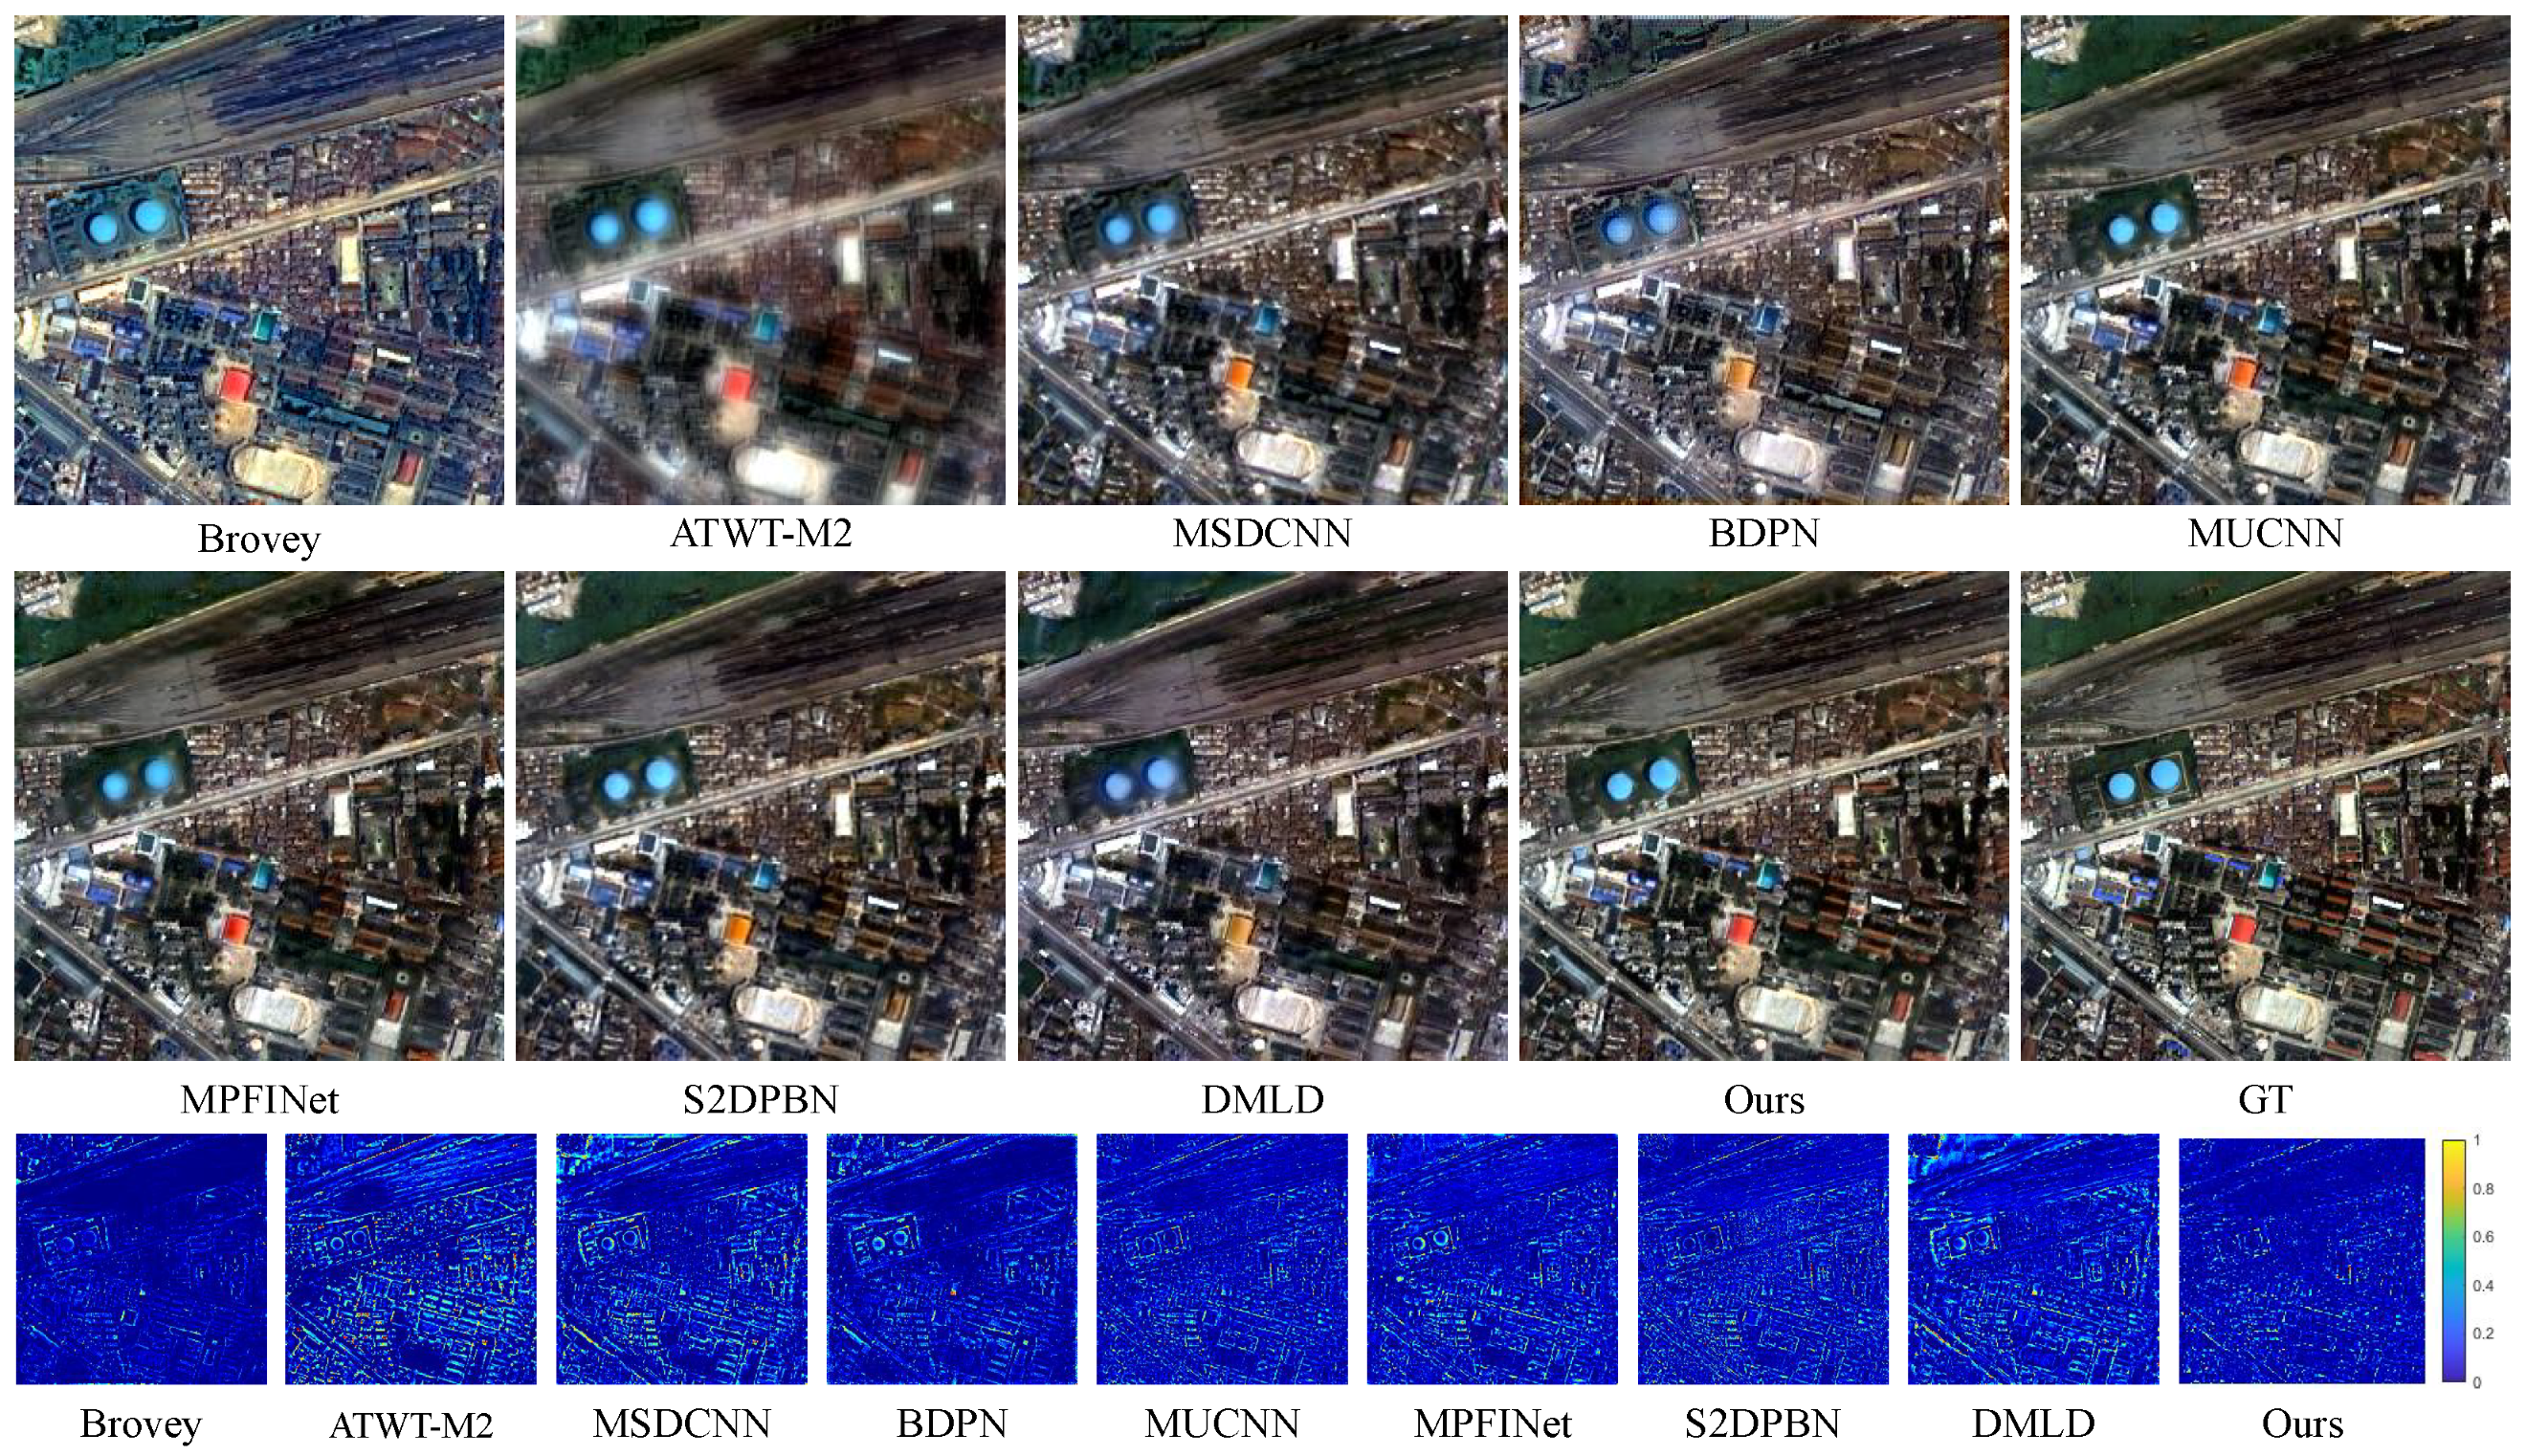
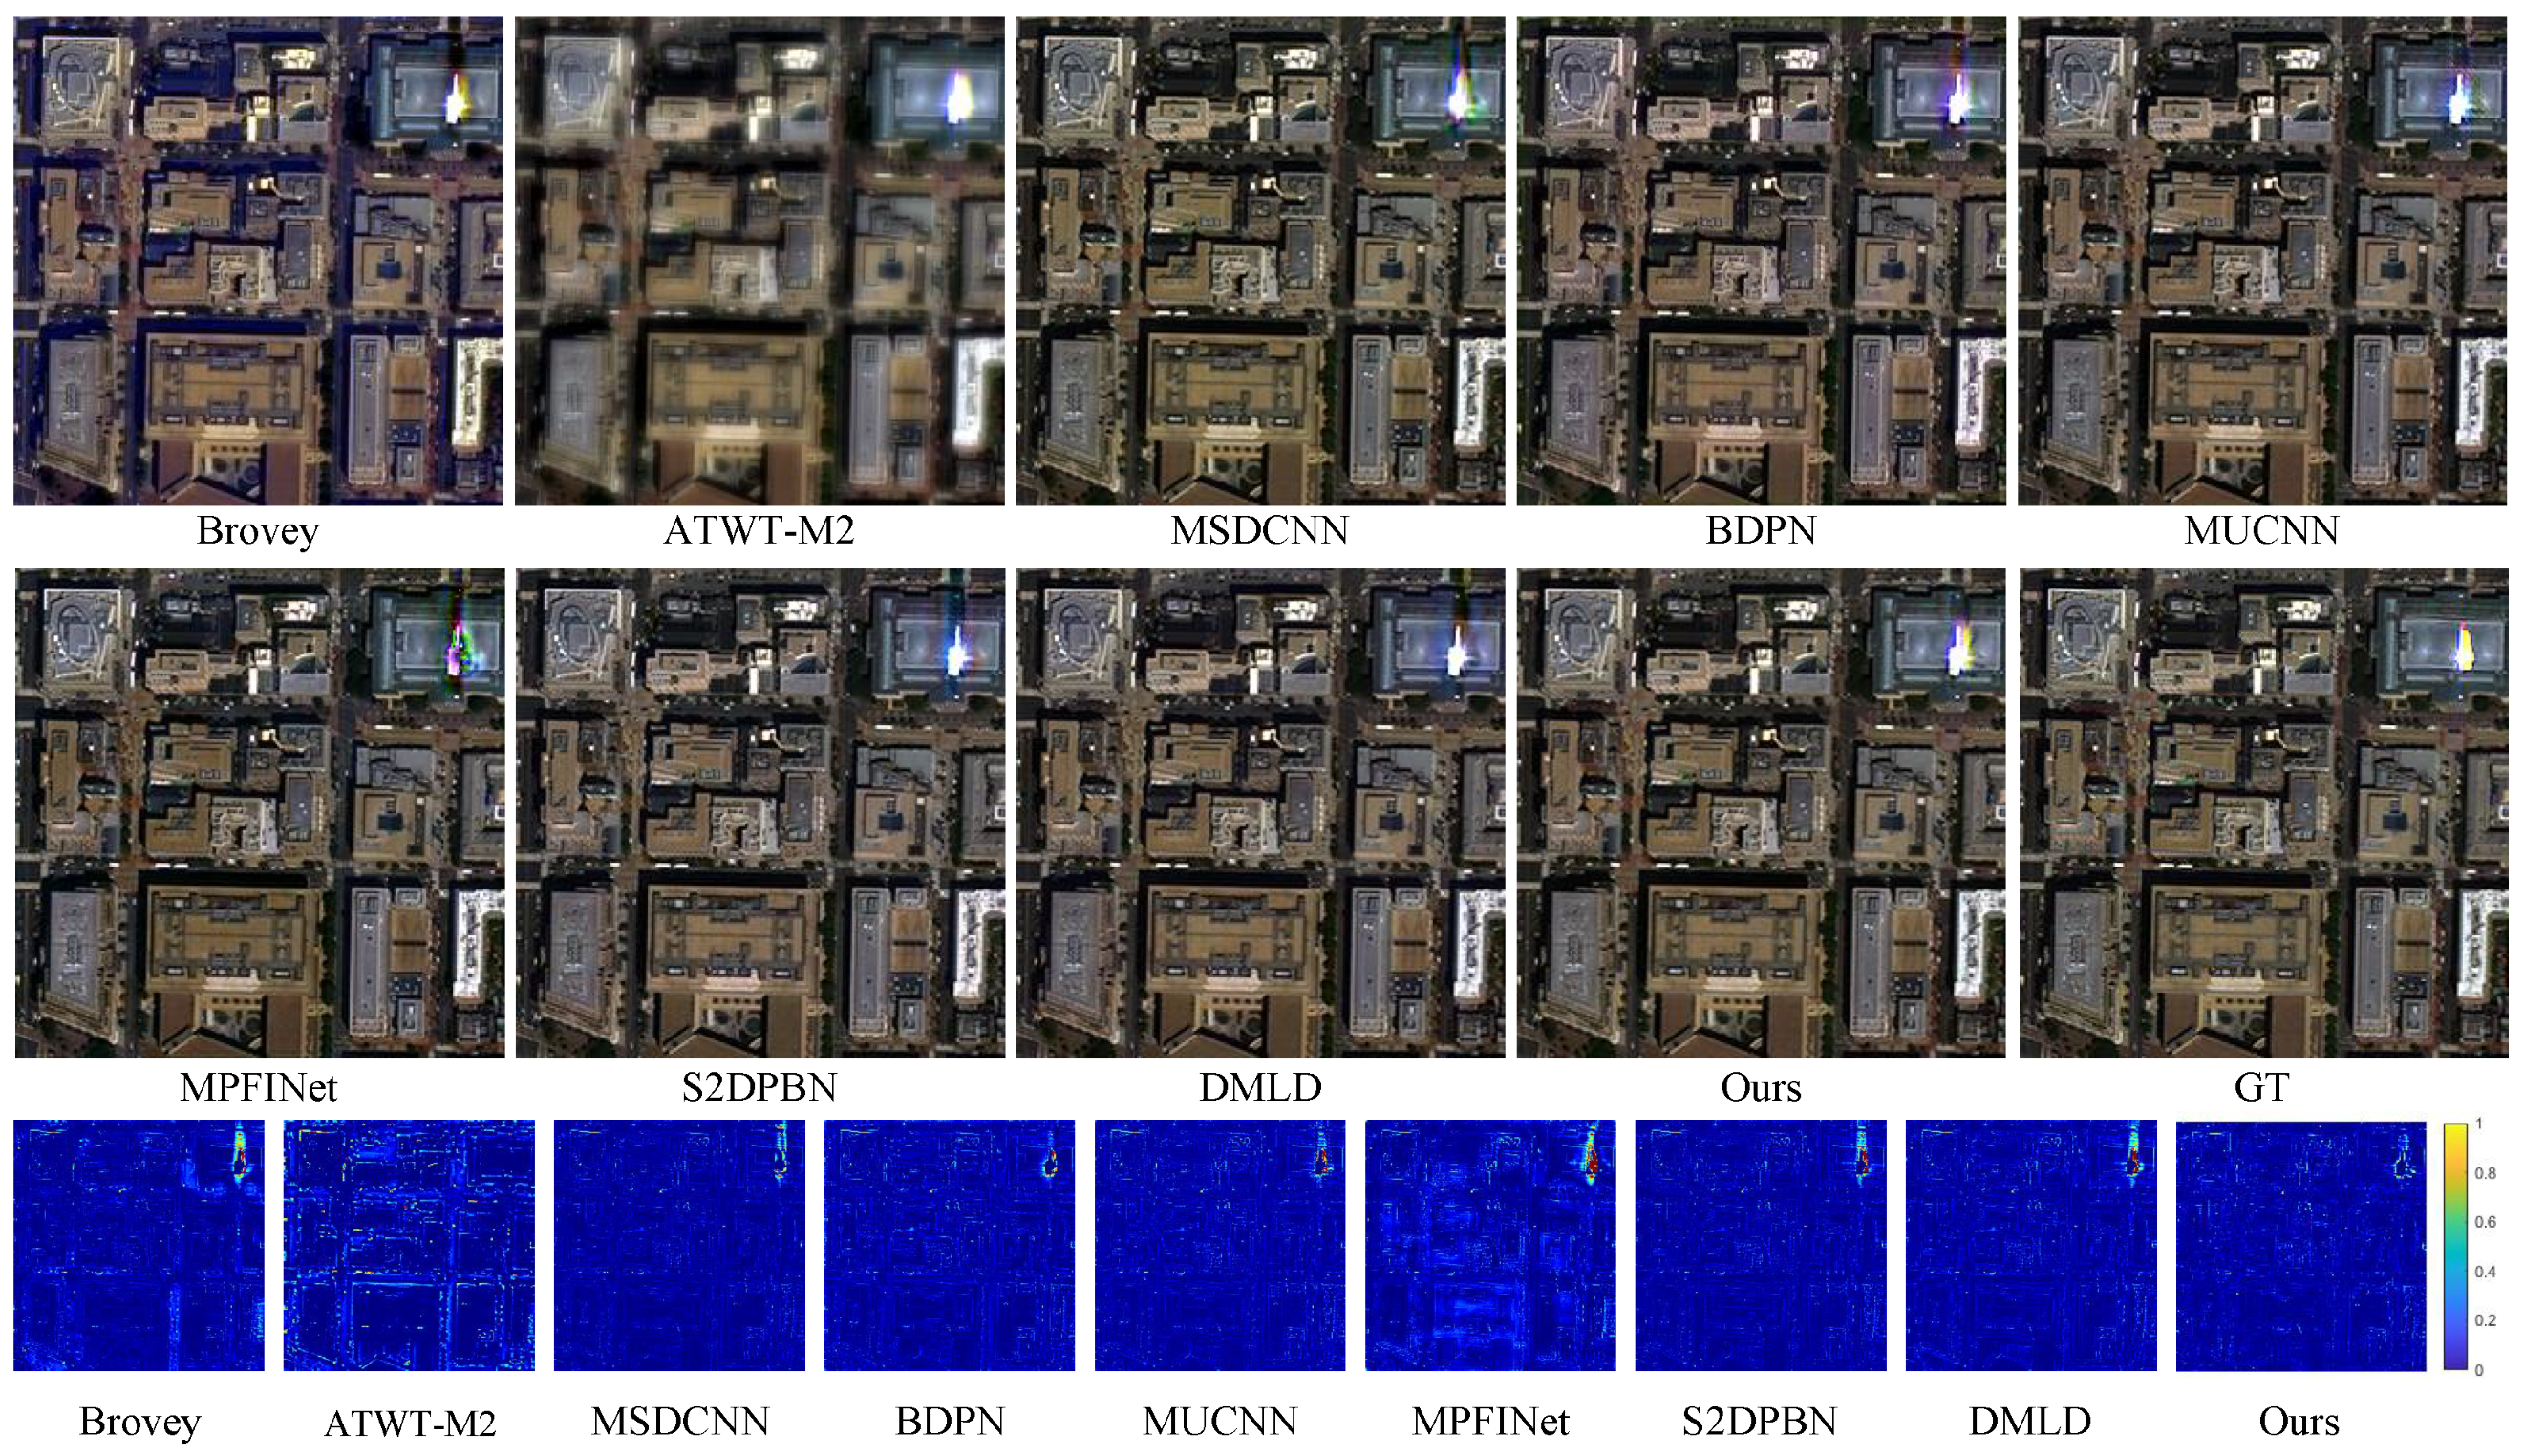
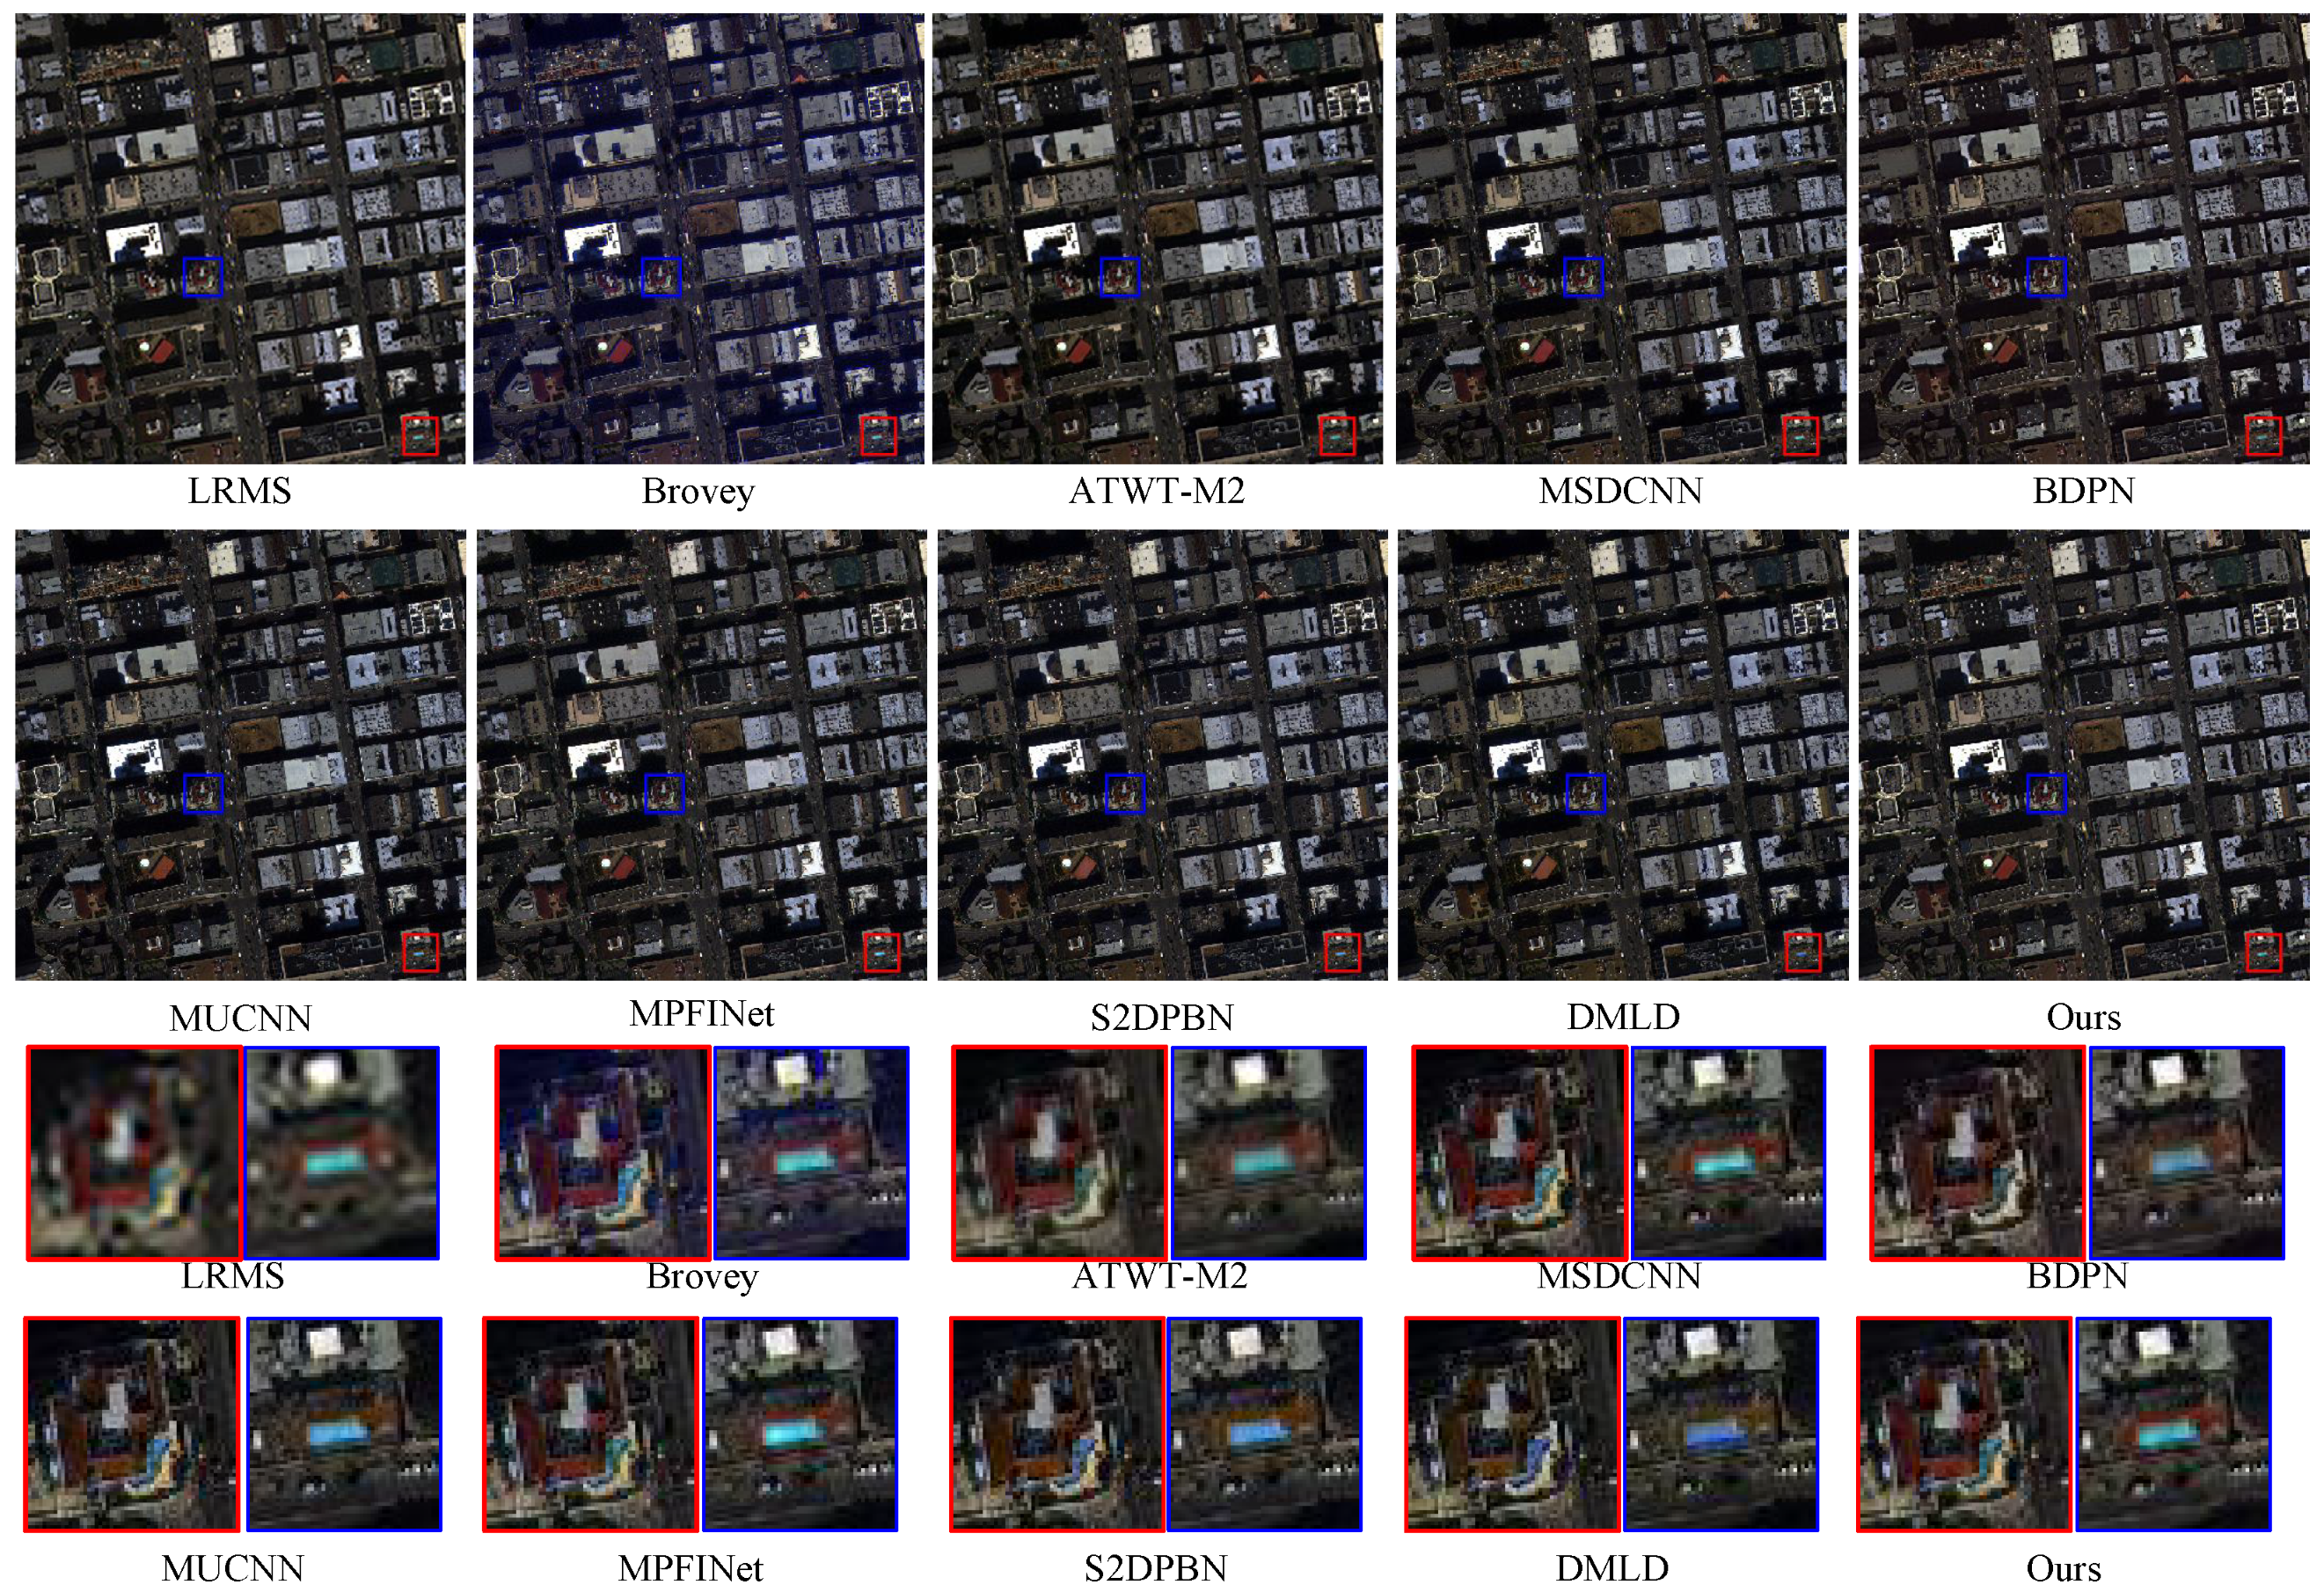
4.2.1. Experiments on Reduced-Resolution Datasets

Figure 4 and Figure 5 provide qualitative comparisons of the reduced-resolution dataset results for IKONOS and WorldView-2, respectively. These figures present a more intuitive representation of the effectiveness of each fusion method by including absolute error maps of the fusion results relative to the ground truth for each band. Figure 4 clearly demonstrates that the fusion results obtained by ATWT-M2 exhibit significant blurring with a grayish appearance, while Bovey’s results tend to have a bluish tint. DL-based methods demonstrate the closest resemblance to the ground truth in terms of spatial details and spectral fidelity. MSDCNN, BDPN, DMLD, and MPFINet show improvements in spectral preservation. However, some loss of information is still noticeable, such as the blurring of edge structures around the two blue dots in the top left corner of Figure 4 and significant spectral distortion on the red roofs in the middle part of the images, as observed by MUCNN and S2DPBN. In Figure 5, traditional methods display significant image blurring, whereas the DL-based methods also exhibit spatial distortions, such as the presence of brightly colored spots on the rooftops in the upper right corner. Compared to the ground truth, the DL-based methods show noticeable color distortions or aberrations, resulting in confusion when labeling and a loss of spectral information related to the rooftop. The absolute error maps also reflect significant reconstruction errors in texture and edge areas, as well as a notable loss of spatial details, indicating an inability to accurately reconstruct the fused images. Importantly, our proposed method demonstrates similarity in both spectral and spatial information fusion with the ground truth, effectively reducing information redundancy and improving the pan-sharpening results.
On the other hand, Table 1 and Table 2 present the performance metrics for reduced-resolution data, with optimal scores highlighted in red. It is evident that our method outperforms the others across all metrics, particularly in terms of quantitative performance compared to traditional methods. Specifically, on the IKONOS dataset, our method demonstrated improvements of 0.05, 0.36, and 0.91 in Q4, ERGAS, and SAM over BDPN. On the WV-2 dataset, compared to the previously best method, MPFINet, the proposed algorithm improved by 0.17 in ERGAS and 0.07 in SAM, achieving the best performance across four assessment metrics and better preservation of spectral information and spatial details.

4.2.2. Experiments on Full-Resolution Datasets
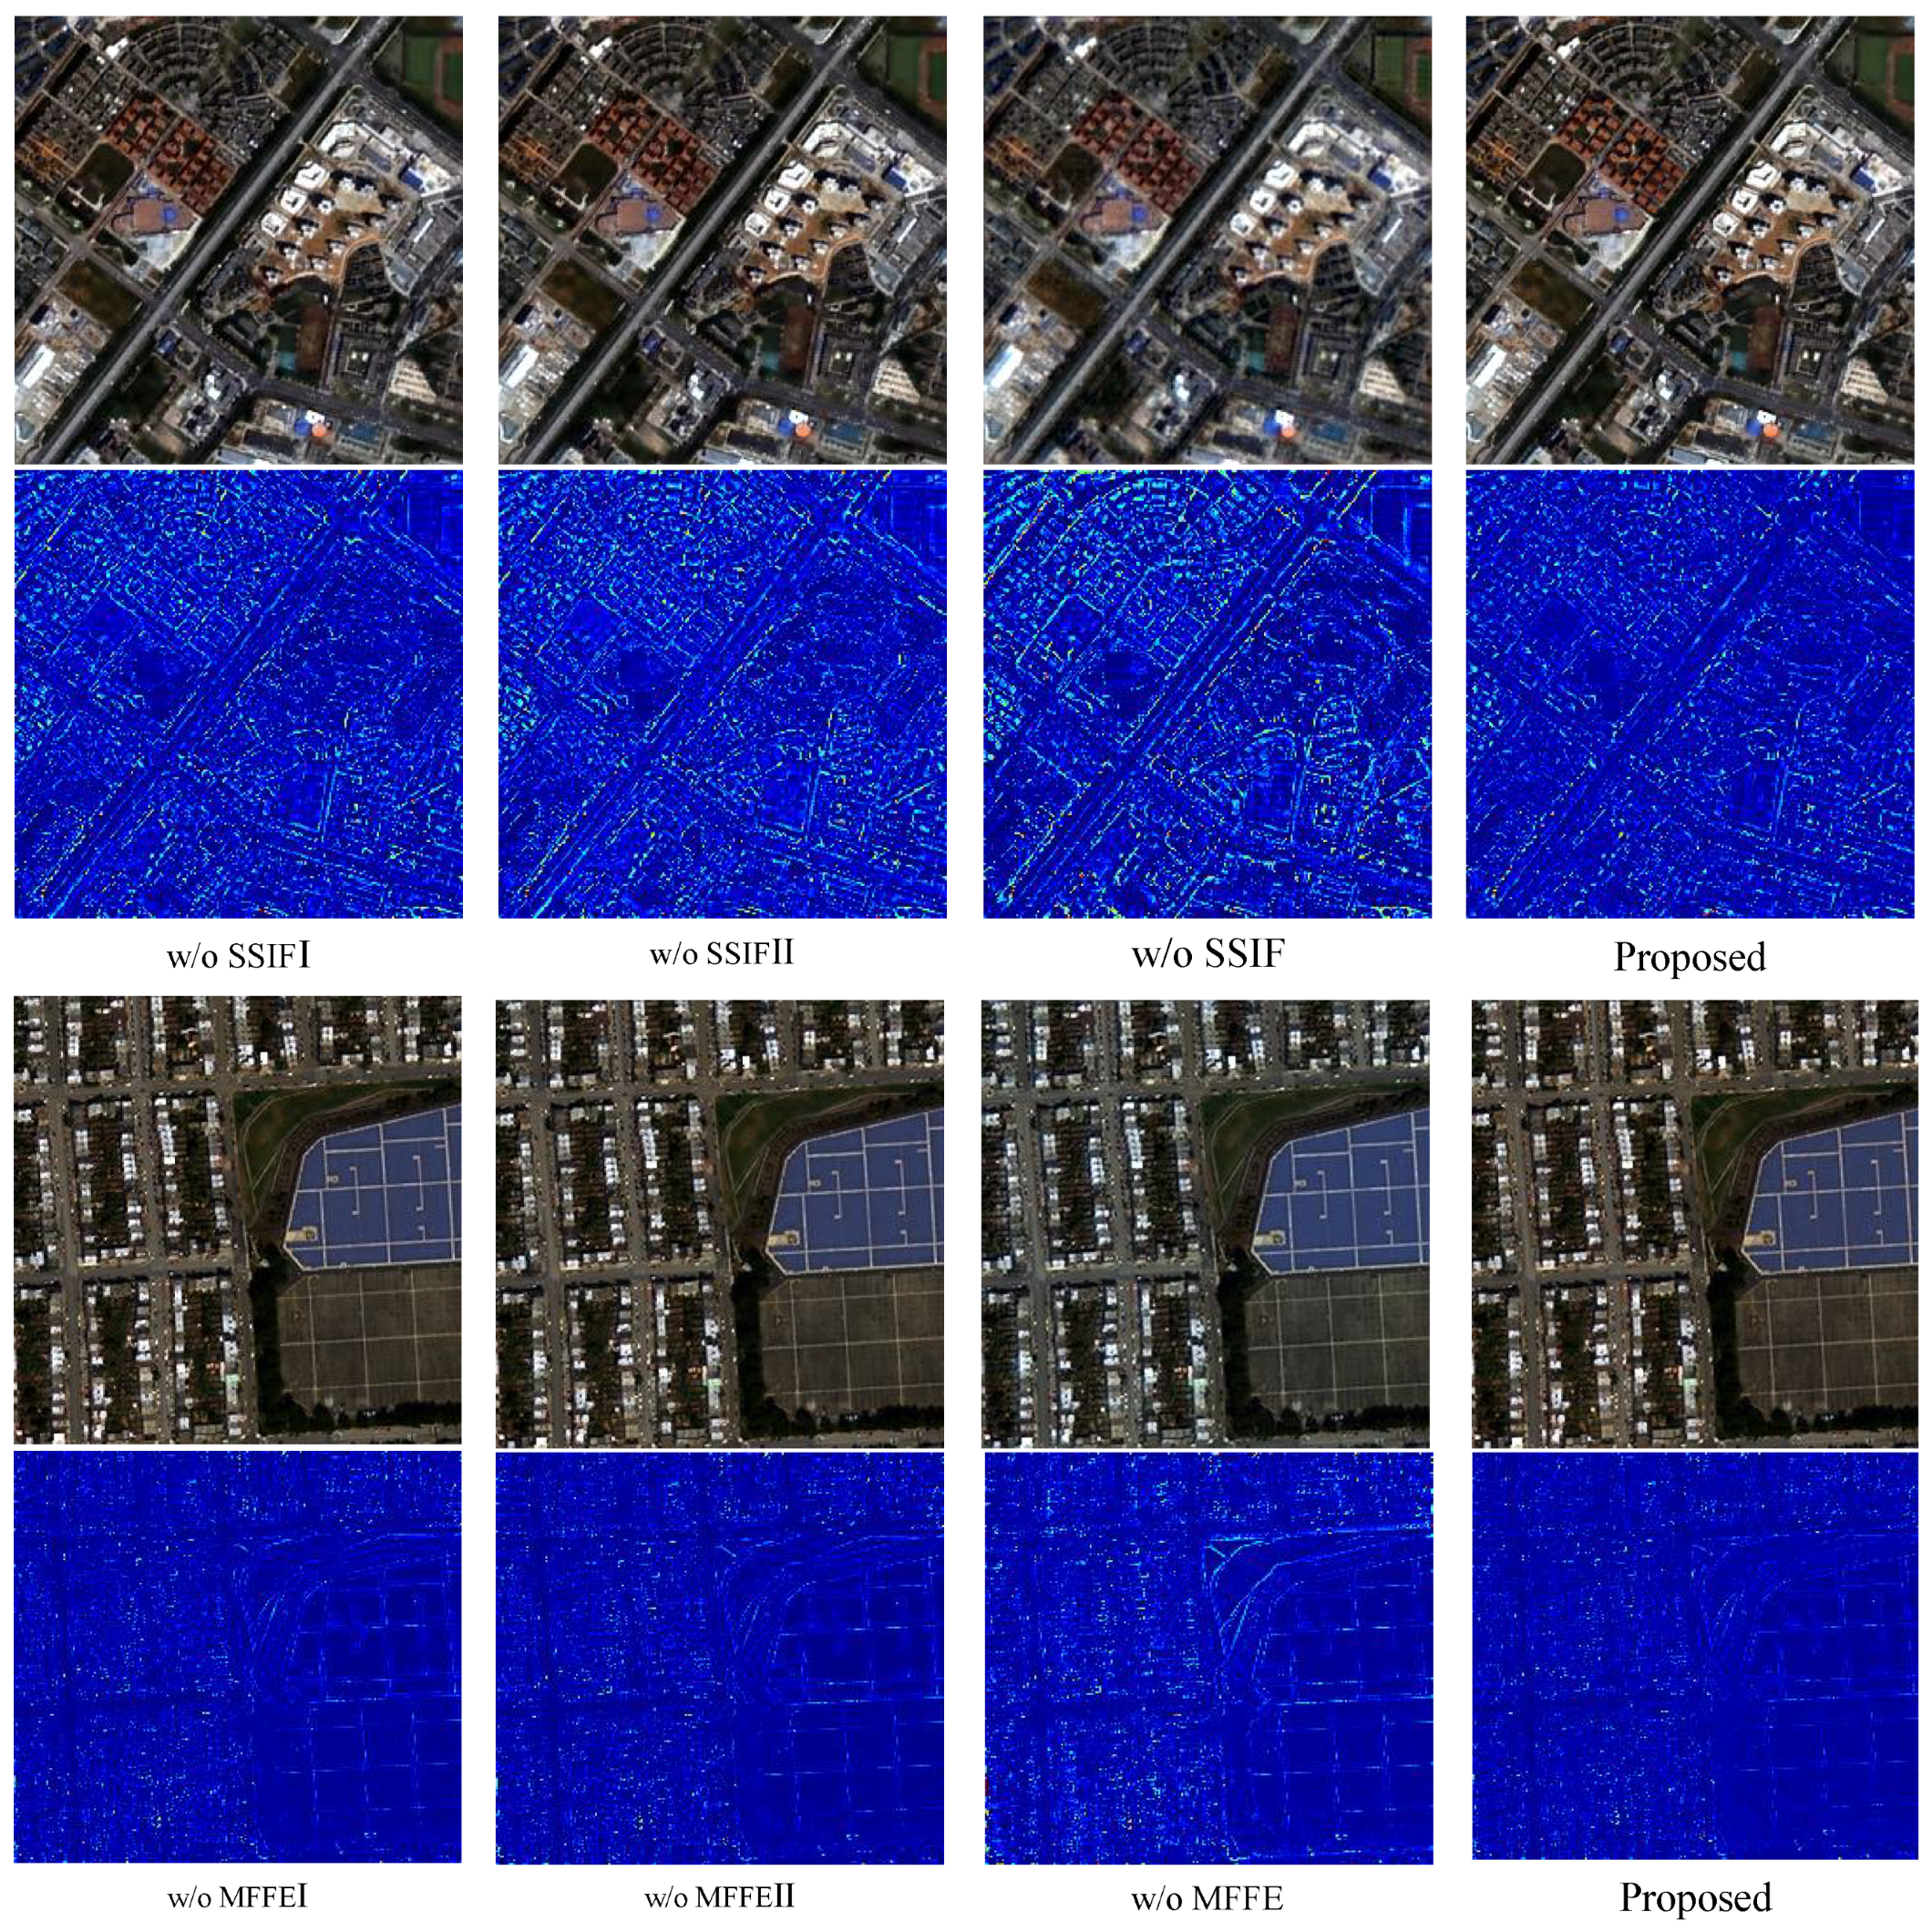
To validate the effectiveness on the practical application, we conducted further experiments using full-resolution data from IKONOS and WorldView-2. The experiment results are illustrated in Figure 6 and Figure 7. Since real MS images in full-resolution scenarios are not available in the real world, we provide magnified views of certain details below the fused results for a more intuitive visual comparison. These details are distinguished by blue and red boxes. As depicted in Figure 6 and Figure 7, the results obtained by Brovey appear noticeably blurred, whereas the results of ATWT-M2 exhibit an overall whitening effect on the image. MSDCNN, BDPN, and DMLD display undersaturated colors, resulting in spectral distortions, as shown in Figure 7, where the rooftop colors shift from red and blue to yellow and light green. Moreover, MPFINet, MUCNN, and S2DPBN overly enhance the red and blue parts of the rooftops, leading to significant spatial distortions and blurred edge contours.
On the other hand, we employ QNR, D λ , and D s as metrics for quantitative evaluation, and the results are depicted in Table 1 and Table 2. It can be observed in Table 1 that our method reinforces the excellence by showcasing the highest scores across all of the evaluated parameters. Then, based on Table 2, our method exhibits superior performance in terms of QNR and ranks second in the D λ and D s metrics. Moreover, the proposed method outperforms all competing pan-sharpening techniques in terms of the fused results, as depicted in Figure 6 and Figure 7, preserving spatial and spectral information within the fused images.

4.3. Ablation Study

To demonstrate the validity of the proposed components in our method, we implemented six degraded versions. The corresponding metric results are presented in Table 3. First, on the IKONOS dataset, the spectral–spatial interactive fusion model mainly consists of three SSIF stages, and we removed the first SSIF, the second SSIF, and all SSIF blocks, respectively, as the first three degraded versions. Then, on the WorldView-2 dataset, the first MFFE, the second MFFE, and all MFFE modules were removed as the last three degraded versions, respectively.
Regarding subjective vision, Figure 8 demonstrates that the degraded fused results of IKONOS exhibit both noise and blurriness in structure and detail, especially for the regions with red rooftops. Similarly, it is evident for the WorldView-2 dataset that the absence of all MFFE modules leads to the poorest fusion performance. Therefore, the absolute error maps demonstrate that, compared to the other degraded models, the proposed spectral–spatial interactive fusion block and multi-frequency feature enhancement block components are more robust in the training process.
Moreover, as depicted in Table 3, the proposed method achieved the best index value in terms of objective evaluation, whereas the removal of all the SSIF and MFFE blocks led to significantly inferior fusion results, highlighting the crucial role of SSIF and MFFE in enhancing network performance. The removal of all SSIF or MFFE blocks leads to significantly inferior fusion results, highlighting the crucial role of SSIF and MFFE in enhancing network performance.

5. Conclusions

To better achieve the fusion of LR-MS images with PAN images, we propose a novel remote sensing image pan-sharpening network, MFSINet, which leverages multi-scale and multi-resolution analyses of source images to guide the super-resolution of LR-MS images via salient features in both the spatial and frequency domains. Initially, we constructed the spectral–spatial interactive fusion block to extract and integrate spectral and spatial information, enhancing and preserving the accuracy of the extracted details. Building upon this, we designed the multi-frequency feature enhancement block, which utilizes multi-frequency information and multi-scale methods to enhance the pan-sharpening effects, thereby improving spatial resolution and spectral fidelity.
Experiments on low-resolution and full-resolution datasets from the IKONOS and WorldView-2 satellites demonstrate the effectiveness of our proposed MFSINet. Specifically, on the IKONOS dataset, our method improved in Q4, ERGAS, and SAM by 0.05, 0.36, and 0.91, respectively, over BDPN. On the WV-2 dataset, it outperformed MPFINet, with improvements of 0.17 in ERGAS and 0.07 in SAM, achieving the best performance across four assessment metrics and better preservation of the spectral information and spatial details.
Our method outperforms traditional and contemporary methods, showcasing a robust generalization capability. Despite its effectiveness, our approach currently relies on a supervised strategy due to the lack of ground truth for pan-sharpening. Unsupervised learning-based pan-sharpening methods, which do not require ground truth for training, hold significant practical value and have become a research hotspot. As part of future research, we plan to investigate an unsupervised framework to improve the generalization capability. Additionally, we will focus on extending the application of our framework in the agricultural domain.

Author Contributions

Conceptualization, Y.T. and T.L.; methodology, Y.T., P.L. and G.X.; software, H.L.; validation, Y.T. All authors have read and agreed to the published version of the manuscript.

Funding

This work was supported by the Major Special Science and Technology Project of Yunnan Province, No. 202202AE09002105.

Data Availability Statement

The data and codes presented in this study are available on request from the corresponding author.

Conflicts of Interest

The authors declare no conflicts of interest.

References

  1. Zhou, F.; Xu, C.; Hang, R.; Zhang, R.; Liu, Q. Mining joint intra-and inter-image context for remote sensing change detection. IEEE Trans. Geosci. Remote Sens. 2023, 61, 4403712. [Google Scholar]
  2. Hang, R.; Li, Z.; Liu, Q.; Ghamisi, P.; Bhattacharyya, S.S. Hyperspectral Image Classification With Attention-Aided CNNs. IEEE Trans. Geosci. Remote Sens. 2021, 59, 2281–2293. [Google Scholar] [CrossRef]
  3. Tong, X.; Xie, H.; Weng, Q. Urban Land Cover Classification with Airborne Hyperspectral Data: What Features to Use? IEEE J. Sel. Top. Appl. Earth Obs. Remote Sens. 2014, 7, 3998–4009. [Google Scholar] [CrossRef]
  4. Zhang, R.; Liu, Q.; Hang, R. Tropical Cyclone Intensity Estimation Using Two-Branch Convolutional Neural Network From Infrared and Water Vapor Images. IEEE Trans. Geosci. Remote Sens. 2020, 58, 586–597. [Google Scholar] [CrossRef]
  5. Lu, H.; Yang, Y.; Huang, S.; Tu, W.; Wan, W. A Unified Pansharpening Model Based on Band-Adaptive Gradient and Detail Correction. IEEE Trans. Image Process. 2022, 31, 918–933. [Google Scholar] [CrossRef] [PubMed]
  6. Javan, F.D.; Samadzadegan, F.; Mehravar, S.; Toosi, A.; Khatami, R.; Stein, A. A review of image fusion techniques for pan-sharpening of high-resolution satellite imagery. ISPRS J. Photogramm. Remote Sens. 2021, 171, 101–117. [Google Scholar] [CrossRef]
  7. Ma, L.; Liu, Y.; Zhang, X.; Ye, Y.; Yin, G.; Johnson, B.A. Deep learning in remote sensing applications: A meta-analysis and review. ISPRS J. Photogramm. Remote Sens. 2019, 152, 166–177. [Google Scholar] [CrossRef]
  8. Carper, W.; Lillesand, T.; Kiefer, R. The use of intensity-hue-saturation transformations for merging SPOT panchromatic and multispectral image data. Photogramm. Eng. Remote Sens. 1990, 56, 459–467. [Google Scholar]
  9. Chavez, P.; Sides, S.C.; Anderson, J.A. Comparison of three different methods to merge multiresolution and multispectral data: Landsat TM and SPOT panchromatic. Photogramm. Eng. Remote Sens. 1991, 57, 295–303. [Google Scholar]
  10. Zhang, K.; Zhang, F.; Feng, Z.; Sun, J.; Wu, Q. Fusion of panchromatic and multispectral images using multiscale convolution sparse decomposition. IEEE J. Sel. Top. Appl. Earth Obs. Remote Sens. 2021, 14, 426–439. [Google Scholar] [CrossRef]
  11. Gillespie, A.R.; Kahle, A.B.; Walker, R.E. Color enhancement of highly correlated images. II. Channel ratio and “chromaticity” transformation techniques. Remote Sens. Environ. 1987, 22, 343–365. [Google Scholar] [CrossRef]
  12. Nunez, J.; Otazu, X.; Fors, O.; Prades, A.; Pala, V.; Arbiol, R. Multiresolution-based image fusion with additive wavelet decomposition. IEEE Trans. Geosci. Remote Sens. 1999, 37, 1204–1211. [Google Scholar] [CrossRef]
  13. DadrasJavan, F.; Samadzadegan, F.; Fathollahi, F. Spectral and spatial quality assessment of IHS and wavelet based pan-sharpening techniques for high resolution satellite imagery. Image Video Process. 2018, 6. [Google Scholar] [CrossRef]
  14. Choi, J.; Yu, K.; Kim, Y. A new adaptive component-substitution-based satellite image fusion by using partial replacement. IEEE Trans. Geosci. Remote Sens. 2011, 49, 295–309. [Google Scholar] [CrossRef]
  15. Li, H.; Liu, F.; Yang, S.; Zhang, K.; Su, X.; Jiao, L. Refined pan-sharpening with NSCT and hierarchical sparse autoencoder. IEEE J. Sel. Top. Appl. Earth Obs. Remote Sens. 2016, 9, 5715–5725. [Google Scholar] [CrossRef]
  16. Ranchin, T.; Wald, L. Fusion of high spatial and spectral resolution images: The ARSIS concept and its implementation. Photogramm. Eng. Remote Sens. 2000, 66, 49–61. [Google Scholar]
  17. Yuan, Q.; Wei, Y.; Meng, X.; Shen, H.; Zhang, L. A multiscale and multidepth convolutional neural network for remote sensing imagery pan-sharpening. IEEE J. Sel. Top. Appl. Earth Obs. Remote Sens. 2018, 11, 978–989. [Google Scholar] [CrossRef]
  18. Zhang, Y.; Liu, C.; Sun, M.; Ou, Y. Pan-sharpening using an efficient bidirectional pyramid network. IEEE Trans. Geosci. Remote Sens. 2019, 57, 5549–5563. [Google Scholar] [CrossRef]
  19. Wang, Y.; Deng, L.J.; Zhang, T.J.; Wu, X. SSconv: Explicit spectral-to-spatial convolution for pansharpening. In Proceedings of the 29th ACM International Conference on Multimedia, Virtual Event, China, 20–24 October 2021; pp. 4472–4480. [Google Scholar]
  20. Feng, Y.; Jin, X.; Jiang, Q.; Wang, Q.; Liu, L.; Yao, S. MPFINet: A Multilevel Parallel Feature Injection Network for Panchromatic and Multispectral Image Fusion. Remote Sens. 2022, 14, 6118. [Google Scholar] [CrossRef]
  21. Zhang, K.; Wang, A.; Zhang, F.; Wan, W.; Sun, J.; Bruzzone, L. Spatial-Spectral Dual Back-Projection Network for Pansharpening. IEEE Trans. Geosci. Remote Sens. 2023, 61, 5406015. [Google Scholar] [CrossRef]
  22. Zhang, K.; Yang, G.; Zhang, F.; Wan, W.; Zhou, M.; Sun, J.; Zhang, H. Learning Deep Multiscale Local Dissimilarity Prior for Pansharpening. IEEE Trans. Geosci. Remote Sens. 2023, 61, 1–15. [Google Scholar] [CrossRef]
  23. Hu, J.; Shen, L.; Sun, G. Squeeze-and-excitation networks. In Proceedings of the IEEE Conference on Computer Vision and Pattern Recognition, Salt Lake City, UT, USA, 18–23 June 2018; pp. 7132–7141. [Google Scholar]
  24. Shen, H.; Jiang, M.; Li, J.; Yuan, Q.; Wei, Y.; Zhang, L. Spatial–spectral fusion by combining deep learning and variational model. IEEE Trans. Geosci. Remote Sens. 2019, 57, 6169–6181. [Google Scholar] [CrossRef]
  25. Mei, X.; Pan, E.; Ma, Y.; Dai, X.; Huang, J.; Fan, F.; Du, Q.; Zheng, H.; Ma, J. Spectral-spatial attention networks for hyperspectral image classification. Remote Sens. 2019, 11, 963. [Google Scholar] [CrossRef]
  26. Nie, Z.; Chen, L.; Jeon, S.; Yang, X. Spectral-Spatial Interaction Network for Multispectral Image and Panchromatic Image Fusion. Remote Sens. 2022, 14, 4100. [Google Scholar] [CrossRef]
  27. He, X.; Yan, K.; Zhang, J.; Li, R.; Xie, C.; Zhou, M.; Hong, D. Multi-scale dual-domain guidance network for pan-sharpening. IEEE Trans. Geosci. Remote Sens. 2023, 61, 1–13. [Google Scholar] [CrossRef]
  28. Xu, S.; Zhang, J.; Zhao, Z.; Sun, K.; Liu, J.; Zhang, C. Deep gradient projection networks for pan-sharpening. In Proceedings of the IEEE/CVF Conference on Computer Vision and Pattern Recognition, Nashville, TN, USA, 20–25 June 2021; pp. 1366–1375. [Google Scholar]
  29. Meng, X.; Wang, N.; Shao, F.; Li, S. Vision Transformer for Pansharpening. IEEE Trans. Geosci. Remote Sens. 2022, 60, 1–11. [Google Scholar] [CrossRef]
  30. Zhang, L.; Zhang, J. A new saliency-driven fusion method based on complex wavelet transform for remote sensing images. IEEE Geosci. Remote Sens. Lett. 2017, 14, 2433–2437. [Google Scholar] [CrossRef]
  31. Palsson, F.; Sveinsson, J.R.; Ulfarsson, M.O.; Benediktsson, J.A. Model-based fusion of multi- and hyperspectral images using PCA and wavelets. IEEE Trans. Geosci. Remote Sens. 2015, 53, 2652–2663. [Google Scholar] [CrossRef]
  32. Zhang, J.; He, X.; Yan, K.; Cao, K.; Li, R.; Xie, C.; Zhou, M.; Hong, D. Pan-Sharpening With Wavelet-Enhanced High-Frequency Information. IEEE Trans. Geosci. Remote Sens. 2024, 62, 5402914. [Google Scholar] [CrossRef]
  33. Mallat, S.G. A theory for multiresolution signal decomposition: The wavelet representation. IEEE Trans. Pattern Anal. Mach. Intell. 1989, 11, 674–693. [Google Scholar] [CrossRef]
  34. Shu, Z.; Lei, M. A new wavelet transform convolution algorithm. In Proceedings of the 2011 IEEE 3rd International Conference on Communication Software and Networks, Xi’an, China, 27–29 May 2011; pp. 41–44. [Google Scholar]
  35. Guo, T.; Seyed Mousavi, H.; Huu Vu, T.; Monga, V. Deep wavelet prediction for image super-resolution. In Proceedings of the IEEE Conference on Computer Vision and Pattern Recognition Workshops, Honolulu, HI, USA, 21–26 July 2017; pp. 104–113. [Google Scholar]
  36. Liu, P.; Zhang, H.; Lian, W.; Zuo, W. Multi-level wavelet convolutional neural networks. IEEE Access 2019, 7, 74973–74985. [Google Scholar] [CrossRef]
  37. Zhu, X.X.; Grohnfeldt, C.; Bamler, R. Exploiting Joint Sparsity for Pansharpening: The J-SparseFI Algorithm. IEEE Trans. Geosci. Remote Sens. 2016, 54, 2664–2681. [Google Scholar] [CrossRef]
  38. Han, X.; Leng, W.; Xu, Q.; Li, W.; Tao, R.; Sun, W. A Joint Optimization Based Pansharpening via Subpixel-Shift Decomposition. IEEE Trans. Geosci. Remote Sens. 2023. [Google Scholar] [CrossRef]
  39. Waswani, A.; Shazeer, N.; Parmar, N.; Uszkoreit, J.; Jones, L.; Gomez, A.; Kaiser, L.; Polosukhin, I. Attention is all you need. arXiv 2017, arXiv:1706.03762. [Google Scholar]
  40. Yang, Z.; Xu, M.; Liu, S.; Sheng, H.; Zheng, H. Spatial-spectral Attention Bilateral Network for Hyperspectral Unmixing. IEEE Geosci. Remote Sens. Lett. 2023, 20, 5507505. [Google Scholar] [CrossRef]
  41. Qu, K.; Wang, C.; Li, Z.; Luo, F. Spatial-Spectral Attention Graph U-Nets for Hyperspectral Image Classification. IEEE Trans. Geosci. Remote Sens. 2023, 61, 5528317. [Google Scholar] [CrossRef]
  42. Zhou, M.; Huang, J.; Yan, K.; Yang, G.; Liu, A.; Li, C.; Zhao, F. Normalization-based feature selection and restitution for pan-sharpening. In Proceedings of the 30th ACM International Conference on Multimedia, Lisboa, Portugal, 10–14 October 2022; pp. 3365–3374. [Google Scholar]
  43. Zhou, M.; Huang, J.; Fang, Y.; Fu, X.; Liu, A. Pan-sharpening with customized transformer and invertible neural network. In Proceedings of the AAAI Conference on Artificial Intelligence, Vancouver, Canada, 20–27 February 2022; Volume 36, pp. 3553–3561. [Google Scholar]
  44. Kingma, D.P.; Dhariwal, P. Glow: Generative flow with invertible 1x1 convolutions. arXiv 2018, arXiv:1807.03039. [Google Scholar]
  45. Xie, G.; Nie, R.; Cao, J.; Li, H.; Li, J. A Deep Multi-Resolution Representation Framework for Pansharpening. IEEE Trans. Geosci. Remote Sens. 2024, 62, 5517216. [Google Scholar] [CrossRef]
  46. Alparone, L.; Wald, L.; Chanussot, J.; Thomas, C.; Gamba, P.; Bruce, L.M. Comparison of pansharpening algorithms: Outcome of the 2006 GRS-S data-fusion contest. IEEE Trans. Geosci. Remote Sens. 2007, 45, 3012–3021. [Google Scholar] [CrossRef]
  47. Pushparaj, J.; Hegde, A.V. Evaluation of pan-sharpening methods for spatial and spectral quality. Appl. Geomat. 2017, 9, 1–12. [Google Scholar] [CrossRef]
  48. Yuhas, R.H.; Goetz, A.F.; Boardman, J.W. Discrimination among semi-arid landscape endmembers using the spectral angle mapper (SAM) algorithm. In Proceedings of the JPL, Summaries of the Third Annual JPL Airborne Geoscience Workshop, Volume 1: AVIRIS Workshop, Pasadena, CA, USA, 1–5 June 1992. [Google Scholar]
  49. Wang, Z.; Bovik, A.C. A universal image quality index. IEEE Signal Process. Lett. 2002, 9, 81–84. [Google Scholar] [CrossRef]
  50. Garzelli, A.; Nencini, F. Hypercomplex quality assessment of multi/hyperspectral images. IEEE Geosci. Remote Sens. Lett. 2009, 6, 662–665. [Google Scholar] [CrossRef]
  51. Alparone, L.; Aiazzi, B.; Baronti, S.; Garzelli, A.; Nencini, F.; Selva, M. Multispectral and panchromatic data fusion assessment without reference. Photogramm. Eng. Remote Sens. 2008, 74, 193–200. [Google Scholar] [CrossRef]
  52. Li, H.; Nie, R.; Cao, J.; Jin, B.; Han, Y. MPEFNet: Multi-level Progressive Enhancement Fusion Network for Pansharpening. IEEE J. Sel. Top. Appl. Earth Obs. Remote Sens. 2023, 16, 9358–9368. [Google Scholar] [CrossRef]
  53. Zhang, Y.; Yang, X.; Li, H.; Xie, M.; Yu, Z. DCPNet: A Dual-Task Collaborative Promotion Network for Pansharpening. IEEE Trans. Geosci. Remote Sens. 2024, 62, 5404016. [Google Scholar] [CrossRef]
  54. Vivone, G.; Alparone, L.; Chanussot, J.; Dalla Mura, M.; Garzelli, A.; Licciardi, G.A.; Restaino, R.; Wald, L. A critical comparison among pansharpening algorithms. IEEE Trans. Geosci. Remote Sens. 2014, 53, 2565–2586. [Google Scholar] [CrossRef]
Figure 1. Framework of the proposed MFSINet.
Electronics 13 02802 g001
Figure 2. Framework of the proposed SSIF.
Electronics 13 02802 g002
Figure 3. Framework of the proposed MFFE.
Electronics 13 02802 g003
Figure 4. Results images of the nine methods and GT on the IKONOS simulated dataset, as well as images of the absolute error.
Electronics 13 02802 g004
Figure 5. Resulting images of the nine methods and GT on the WV-2 simulated dataset, as well as images of the absolute error.
Electronics 13 02802 g005
Figure 6. Resulting images of the nine methods on the IKONOS real dataset. The lower part indicates the magnified details of the fused results (red and blue boxes).
Electronics 13 02802 g006
Figure 7. Resulting images of the nine methods on the WV-2 real dataset. The lower part indicates the magnified details of the fused results (red and blue boxes).
Electronics 13 02802 g007
Figure 8. Resulting images of different types of ablation experiments on the IKONOS (top) and WV-2 (bottom) simulated datasets, along with the absolute error images.
Electronics 13 02802 g008
Table 1. Quantitative comparison of all methods on the IKONOS simulation dataset. ↑ indicates that larger values are preferable, while ↓ indicates that smaller values are preferable.
MethodsReduced ResolutionFull Resolution
Q4↑ ERGAS↓ SAM↓ SCC↑ QNR↑ D s D λ
Brovey0.73472.52673.40470.88800.70840.21430.1097
ATWT-M20.69192.86903.45830.83230.76050.15590.1089
MSDCNN0.87661.61872.37380.94740.85630.10710.0468
BDPN0.84341.90063.03740.92770.78020.15450.0802
MUCNN0.88221.55322.22270.94760.83330.10260.0812
MPFINet0.87541.62112.19460.94910.84050.11230.0624
S2DPBN0.86551.67262.40630.94690.84090.09240.0788
DMLD0.85601.82162.68230.93970.83870.10810.0694
OURS0.89051.54052.12380.94930.88400.07130.0504
Table 2. Quantitative comparison of all methods on the WV-2 simulation dataset. ↑ indicates that larger values are preferable, while ↓ indicates that smaller values are preferable.
MethodsReduced ResolutionFull Resolution
Q8↑ ERGAS↓ SAM↓ SCC↑ QNR↑ D s D λ
Brovey0.82126.31617.92860.90070.86880.10880.0251
ATWT-M20.72347.38837.92240.83820.83890.10880.0587
MSDCNN0.96053.27385.11680.96320.87310.09400.0363
BDPN0.94833.70565.84990.94700.87320.10050.0293
MUCNN0.95433.49415.35280.95580.87090.09660.0360
MPFINet0.96013.38075.00550.96010.88860.07400.0403
S2DPBN0.95873.30875.17630.96190.86140.08850.0550
DMLD0.95523.49825.33480.95810.86600.10760.0296
OURS0.96233.20974.93570.96430.89480.07960.0278
Table 3. Average objective evaluation of different model combinations in the ablation study on the IKONOS (top) and WV-2 (bottom) simulation datasets. ↑ indicates that larger values are preferable, while ↓ indicates that smaller values are preferable.
DatasetVersionsSSIF ISSIF IISSIF IIIQ4↑ERGAS↓SAM↓SCC↑
IKONOSI××0.88201.58902.19900.9467
II××0.88151.59482.21660.9461
III××0.79602.22953.00670.8942
Ours0.8905 1.54052.12380.9493
DatasetVersionsMFFEIMFFEIIMFFEQ8↑ERGAS↓SAM↓SCC↑
WV-2I××0.96073.24394.99060.9623
II××0.96033.25515.03070.9625
III××0.93984.01286.03830.9397
Ours0.96233.20974.93570.9643
Disclaimer/Publisher’s Note: The statements, opinions and data contained in all publications are solely those of the individual author(s) and contributor(s) and not of MDPI and/or the editor(s). MDPI and/or the editor(s) disclaim responsibility for any injury to people or property resulting from any ideas, methods, instructions or products referred to in the content.

