Abstract
Compared with general images, objects in remote sensing (RS) images typically exhibit a conspicuous diversity due to their arbitrary orientations. However, many of the prevalent detectors generally apply an inflexible strategy in setting the angles of anchor, ignoring the fact that the number of possible orientations is predictable. Consequently, their processes integrate numerous superfluous angular considerations and hinder their efficiency. To deal with this situation, we propose a dynamic density-driven estimation network (DDE-Net). We design three core modules in DDE-Net: a density-map and mask generation module (DGM), mask routing prediction module (MRM), and spatial-balance calculation module (SCM). DGM is designed for the generation of a density map and mask, which can extract salient features. MRM is for the prediction of object orientation and corresponding weights, which are used to calculate feature maps. SCM is used to affine transform the convolution kernel, which applies an adaptive weighted compute mechanism to enhance the average feature, so as to balance the spatial difference to the rotation feature extraction. A broad array of experimental evaluations have conclusively shown that our methodology outperforms existing state-of-the-art detectors on common aerial object datasets (DOTA and HRSC2016).
1. Introduction
For RS images, object detection is a crucial computer vision technique utilized for both object identification and localization, which has been widely employed across diverse domains such as crop surveillance, resource prospecting, and environmental conservation. In the past several years, the field of aerial object detection has witnessed substantial advancements, and this progress is largely attributed to rigorous research efforts centered on convolutional neural networks (CNNs). Existing detectors have achieved strong enhancement, effectively improving accuracy and real-time capability. Despite this, the horizontal convolution of CNNs could not effectively extract the rotating features in an RS image, and targets with arbitrary orientation raise a considerable problem for the precise localization of detectors.
Single-stage and two-stage detectors constitute the primary classifications of current CNN-based detection frameworks. These detectors [1,2,3,4,5] initially extract features through convolution and preset a set of prior horizontal anchors on the feature map, followed by performing classification and regression tasks. Even so, they lack the ability to extract features that are invariant to rotation. Meanwhile, horizontal anchors cannot accurately capture the actual boundary and angle of the object when dealing with rotating targets, resulting in misalignment of the anchors, which affects detection quality [6,7].
In view of this, some improvements have been applied to the RS detector, such as a more efficient target region of interest (RoI) extraction mechanism and more flexible target representation forms. Ding [8] proposed an effective mechanism for extracting the RoI of rotating objects. In the process of spatial transformation of RoI, the mechanism grasps the parameters required for the transformation with the guidance of the oriented bounding box (OBB) annotation. This design significantly alleviates the inconsistency between RoIs and objects, and furthermore, it eliminates the necessity for devising a large array of anchors for detection. Xie [9] proposed an oriented region proposal network (Oriented RPN), which could generate outstanding RoI extract recommendations for rotating targets. Oriented RPN is a lightweight full-convolution network, which significantly decreases parameters and the over-fitting risk. In addition, a directional object representation scheme called midpoint offset representation is proposed. For any directional object, the author uses six characteristics to define it. Based on maintaining the horizontal regression mechanism, the midpoint offset representation imposes a clear range limit on the regional recommendation. In order to detect rotating targets more effectively, Guo [10] proposed a convex hull feature adaptation method (CFA). CFA builds a convex polygon model of the target and then dynamically selects a series of feature points on the feature map based on the geometry to accommodate objects with irregular layouts and orientations.
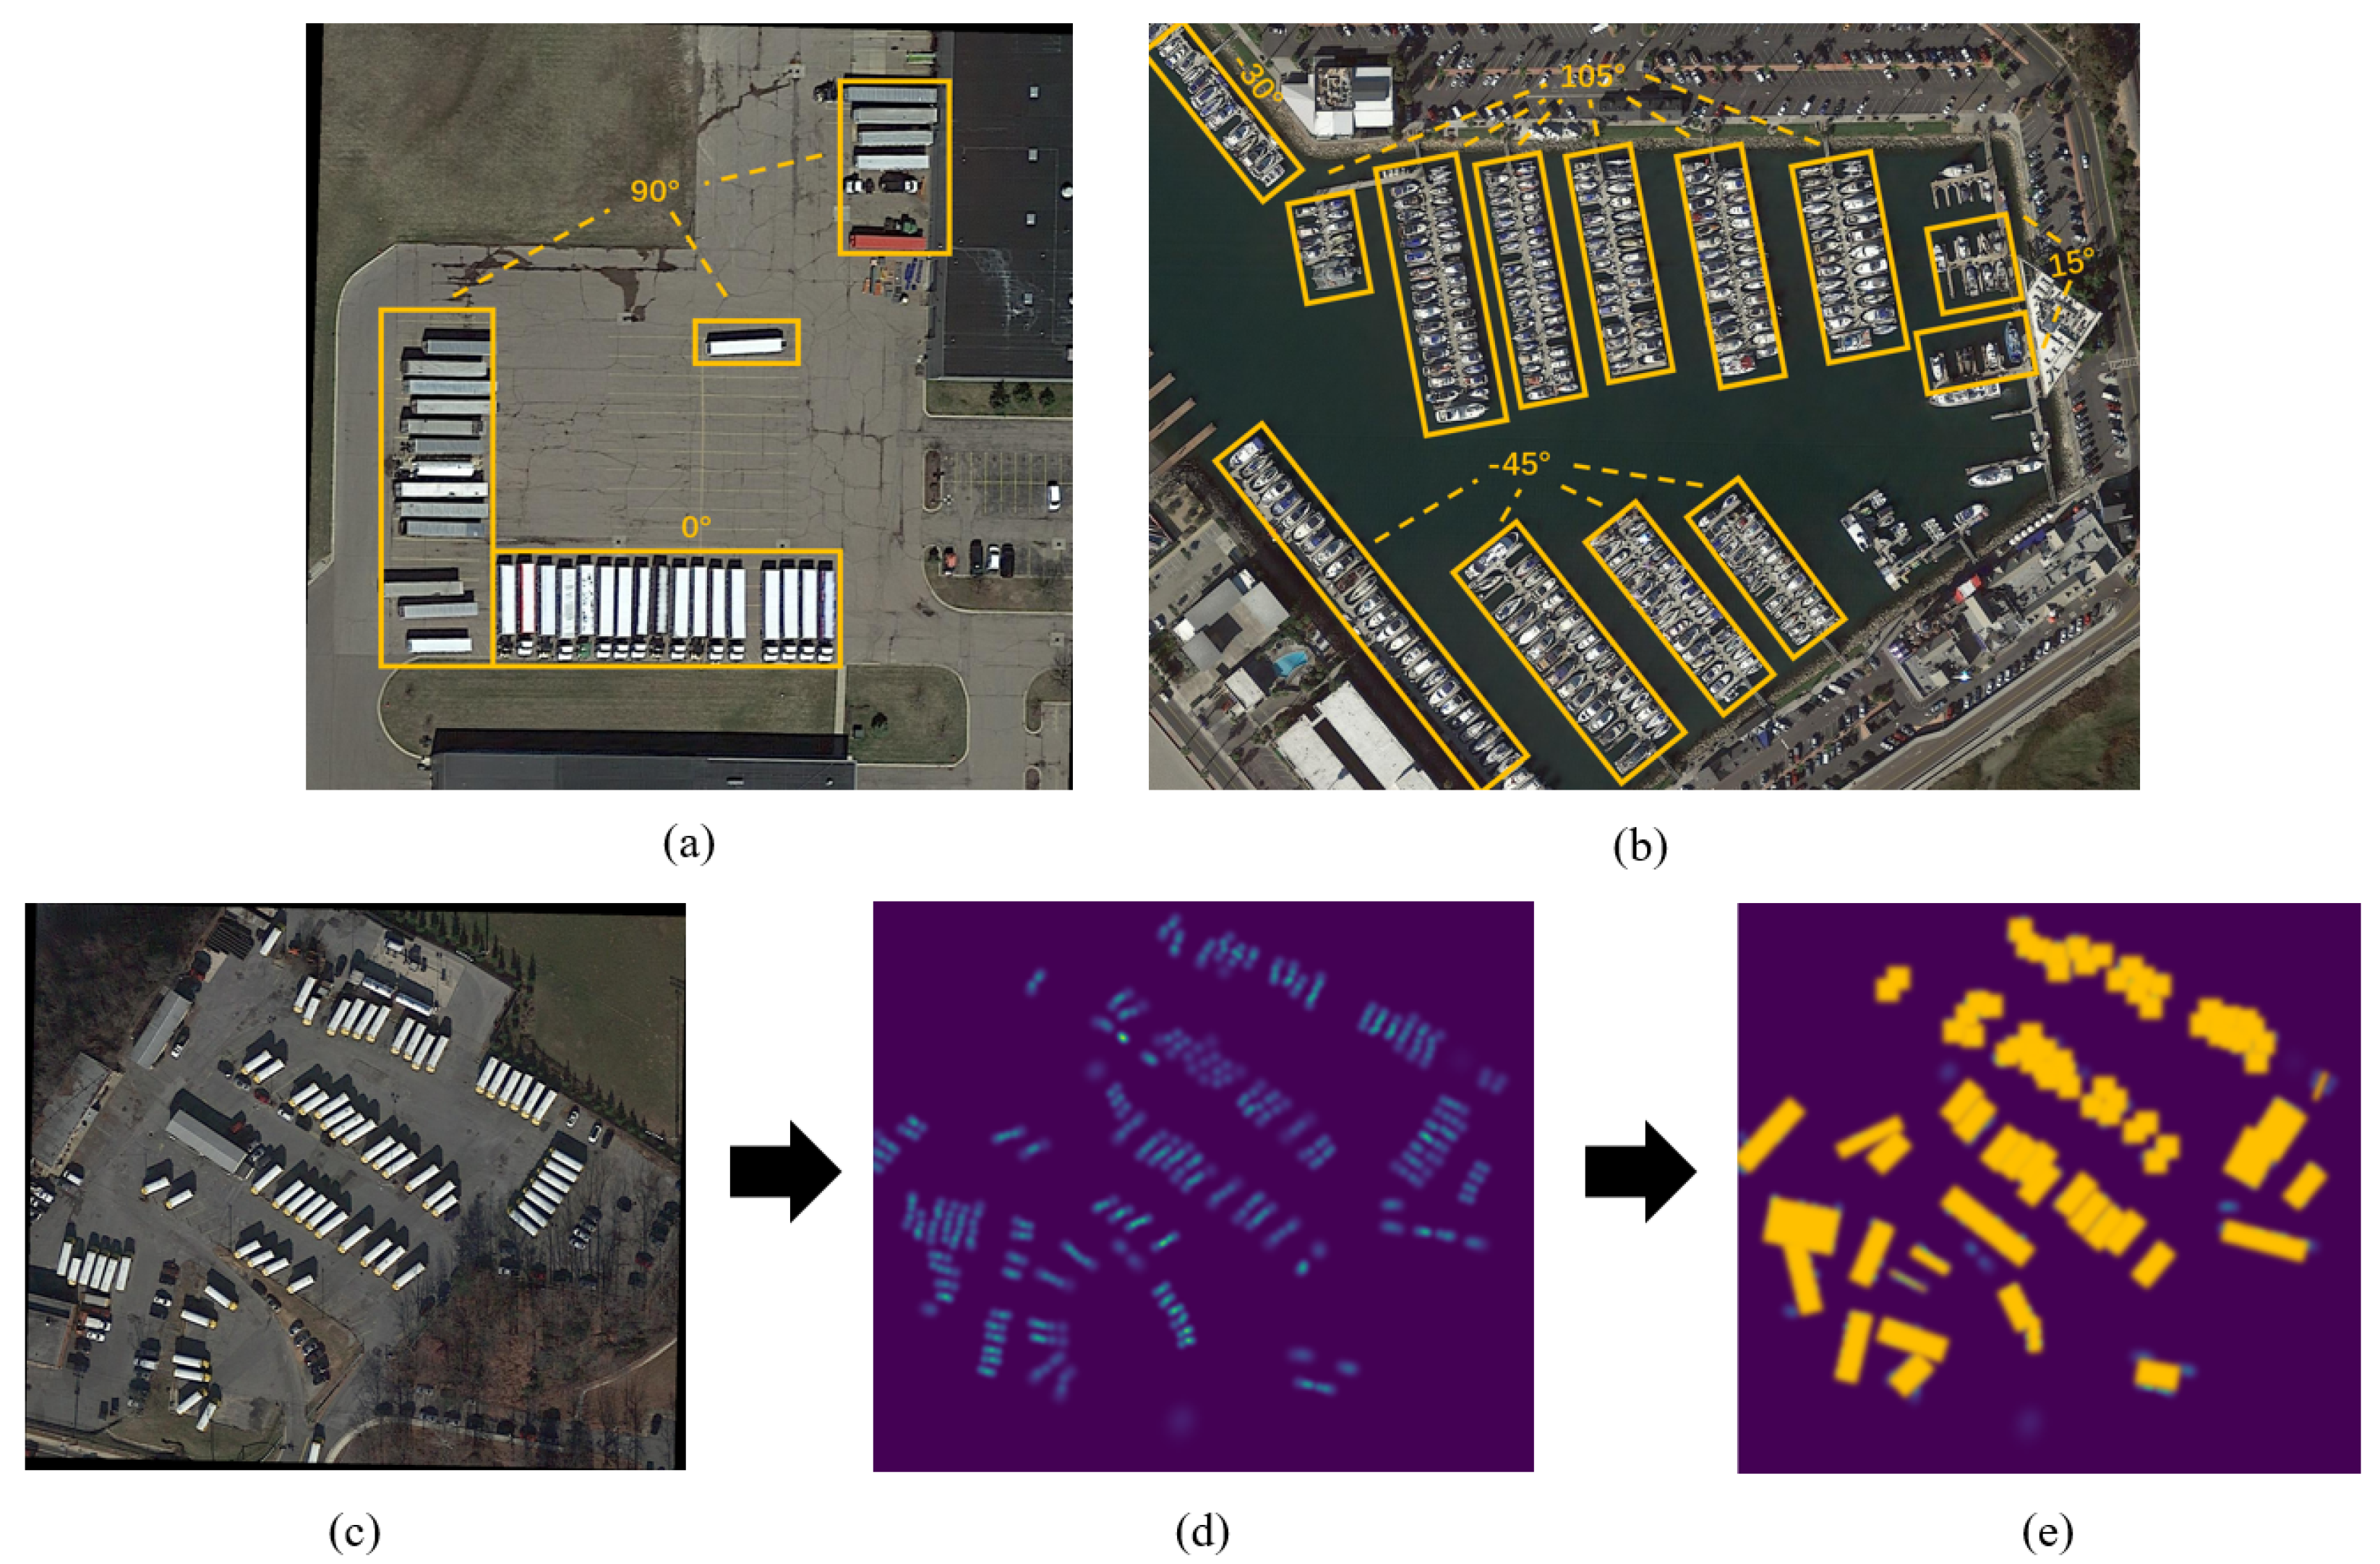
Nevertheless, these works did not take into account the fact that the number of possible orientations in RS images are limited and predictable; they still used redundant and unnecessary angles, which led to ineffective detection. Different object types within RS images typically exhibit regionally dense distributions across a set of orientations, and the area of regions corresponding to each orientation is dissimilar as well. The contribution of different regions to the rotation features extraction is generally inconsistent, as shown in Figure 1.
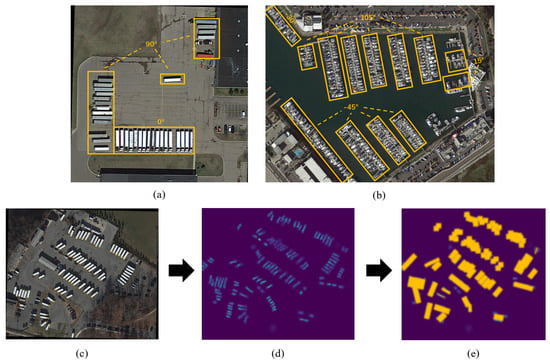
Figure 1.
Distribution of objects with different orientations and process from density map to mask. (a,b) Objects with the same or similar orientations are distributed regionally; these regions are marked with yellow boxes. (c) The original RS image. (d) The object to be detected in the density map is highlighted, such as the large vehicle in (c), and the area with more objects has higher pixel intensity. (e) A mask is generated on the basis of the density map by setting a certain threshold, as shown with the yellow rectangles.
Existing research has made some improvements with regard to using object orientation to obtain rotation features, but for specific angles, the general approach is to set the orientation numbers in advance and then predict the values. For example, Figure 1b contains four possible orientations, which include −45°, −30°, 15°, and 105°. ARC [11] sets four slots for possible orientations based on experience and then predicts the specific value of each rotation angle. It should be noted that ARC will set a fixed slot number, but the number of orientations covered in distinct images is generally different, as shown in Figure 1: two angles (0° and 90°) in (a), and four angles (−45°, −30°, 15° and 105°) in (b). Due to the lack of prior information on orientation, there will be a discrepancy between the predefined number and the actual number, which will lead to missed detection or false alarm. At the same time, too many angles to be detected may result in a large computational cost.
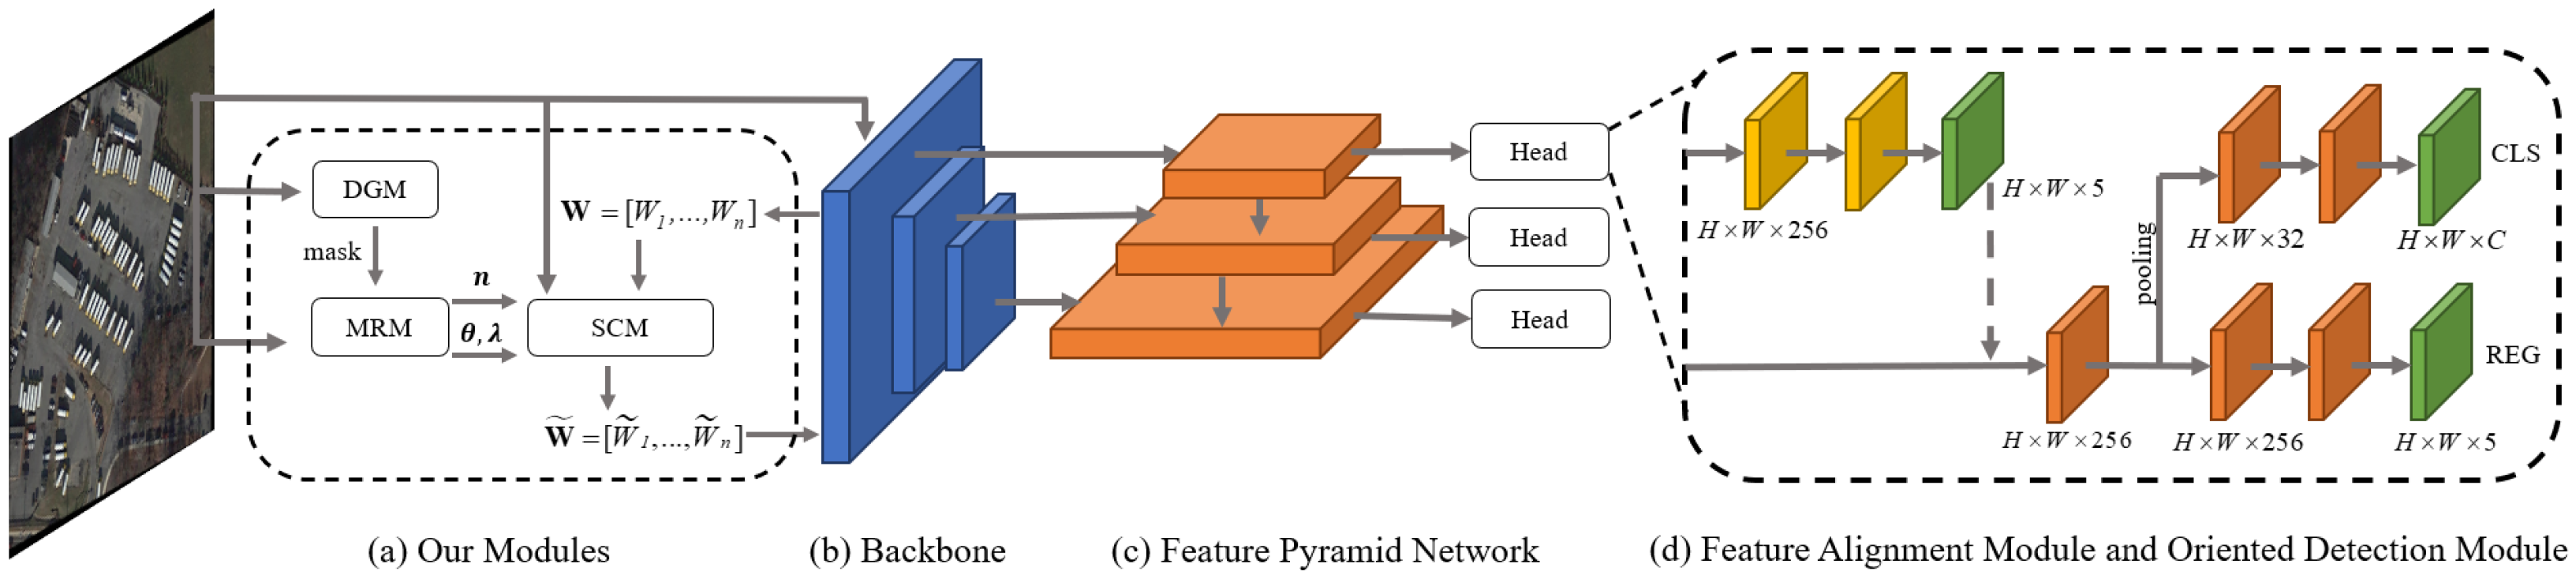
To address the aforementioned issues, we propose a dynamic density-driven estimation network (DDE-Net). This network has three novel modules: a density-map and mask generation module (DGM), mask routing prediction module (MRM), and spatial-balance calculation module (SCM). These three modules, in conjunction with feature extraction networks such as ResNet [12], collectively form the new backbone.
Evidently, regions that contain a greater number of objects exhibit higher pixel intensity compared to those with fewer objects (see the density map in Figure 1). Inspired by this, by setting a certain threshold, we use DGM to generate a density map, and filter out pixel values of regions with no or limited objects. The density map is enhanced with pixel-level inversion, where the inverted mask can better highlight regional features. MRM is utilized to obtain the prior information of the orientation numbers from the proportion of the mask in the overall map. Then, more image background information is retained while down-sampling to decrease the dimensionality and maintain the invariant feature, so that it can better focus on the target’s orientation. Through the combination layer of linear weighting and nonlinear function, the specific angle of orientation and its corresponding weight can be more accurately obtained.
An RS image can be divided into many regions of interest for detection, and each region contains different valuable information for detection. This information contributes differently to the extraction of rotational features. To address this imbalance, we propose SCM. This applies the adaptive weighted computing mechanism (AWC) to calculate the average rotation feature map.
The three modules we introduce in DDE-Net are seamlessly integrated with excellent coupling, smoothly conferring the network with enhanced adaptability to detect objects of various orientations. Our method was rigorously tested on two widely recognized benchmark datasets (DOTA [13] and HRSC2016 [14]). Extensive experiments showed that performance could be significantly improved on both datasets by using DDE-Net. In short, the contributions of this paper can be summarized as follows:
- We analyze the existing oriented object detectors and find that they have not do effective prior processing for the number and value of orientations in RS images, which will cause missed detection or false alarm problems.
- We introduce the idea of the density map and mask into aerial object detection and use the density mask proportion to obtain the prior information of possible orientations.
- We proposed three tightly-coupled modules in DDE-Net: DGM, MRM, and SCM. DDE-Net utilizes the prior orientation information and AWC to balance the varied feature information, enabling the detector to better focus on rotated objects.
2. Related Works
2.1. Rotated Object Detection
Because the current convolution structure lacks the capability to extract rotation-invariant features, and the horizontal anchors cannot accurately describe the orientation information, the existing detectors have encountered difficulties in compactness and accuracy in locating targets that exhibit multi-directional properties. To solve these problems, existing works have been improved in two directions: enhancing target rotation feature extraction and applying flexible and efficient target representation.
SCRDet [15] uses a network design that combines multi-layer features and effective anchor sampling to reduce the interference of image noise, and enhances the visibility of target features through a multi-dimensional attention network under supervision. A constant IOU factor is introduced into the smooth L1 loss function to increase the accuracy in estimating object rotation. Li [16] used adaptive point representation to represent the target instance. Its initial adaptive point is formed from the center point and then carefully adjusted to better match the detection target. In order to acquire the directional bounding box, three-directional transformation functions were designed according to the layout of learning points. This method can not only achieve accurate target detection, but also captures the underlying geometry of objects in any direction. Xu [17] described the features of the four aspect ratios of the detection target through the sliding offset method. At the same time, a tilt factor is introduced based on the proportion of the detection target’s area to its horizontal bounding box, to steer the selection of the target’s direction detection, which effectively solves the problem of target detection direction identification. Hou [18] proposed a unified representation of normal distribution, which can transform an oriented bounding box (OBB), quadrilateral bounding box (QBB), and PointSet into a Gaussian distribution, and optimize the parameters of maximum likelihood estimation. Furthermore, the authors researched the use of three Gaussian optional indices as adjustable parameters to refine the regression loss performance. An end-to-end, refined single-stage rotation detector for efficient and precise object detection was introduced by Xue [19]. The fundamental mechanism of feature optimization is to re-integrate the position information of the constantly adjusted bounding box into the relevant feature units through pixel-level feature interpolation, so as to achieve the reconstruction and alignment of features. Via pixel-level feature interpolation, the feature optimization mechanism reintegrates the position information of the dynamically adjusted bounding box into the corresponding feature units, so as to achieve the remodeling and alignment of features. In addition, an approximate SkewIoU loss is proposed to solve the problem of non-differentiability of SkewIoU calculation. Approximate SkewIoU loss is divided into vectors for the propagation of gradients and . Through such a combination, the result is highly consistent with SkewIoU, and the loss function is derivable as well.
However, these works usually focus on the optimization and enhancement of the detector, and the original feature extraction operation is rarely involved.
2.2. Density Map Estimation
In RS images, we often observe that its coverage is wide, and the local objects in the image are densely distributed. The general detector cannot count and detect the number of objects it contains efficiently and quickly. The density map can show the specific position of the target head and roughly outline the spatial layout, which makes it an effective tool for target counting estimation [20].
Zhang [21] proposed geometric adaptation and fixed kernel. They generated a density map by convolution with Gauss, which could adapt to the change of target size caused by the perspective effect or image resolution. Li [22] introduced an extended CNN based on VGG16 [23]. Its main function is to integrate context information of different scales in a wide range of scenes. Apart from expanding the receptive field, the application of an extended convolution layer maintains the image resolution without damage, which improves the quality of the density map significantly. Xu [24] proposed a learning to scale module (L2SM), which could effectively scale multiple dense regions to multiple similar density levels. L2sm uses a multi-scale feature fusion strategy to process multi-scale feature data, and ensures that it is not interfered with by irrelevant image content through an attention mechanism, thus improving the robustness of density estimation for dense areas. Employing an example-based approach, a density estimation method [25] discerns pixel-level resemblance in the source image and utilizes a local linear embedding algorithm to generate the density map, simultaneously preserving the inherent geometric attributes. Vishwanath [26] proposed a contextual pyramid CNN (CP-CNN) for generating high-quality crowd density and count estimation. CP-CNN parses the context information of the crowd image from the global and local levels. The global context understands the density level of the whole scene, while the local context focuses on the density changes and details in a specific area. In addition, the high-dimensional feature map generated by CP-CNN not only contains the rich information of the original image, but has also undergone preliminary abstract and structured processing. At the same time, the density map is trained by combining anti-loss and pixel-level Euclidean loss to ensure that the accuracy of the population estimation is improved and the visual quality (including clarity, edge sharpness, etc.) reaches a high level.
2.3. Dynamic Network
“Dynamic network” refers to a kind of neural network that can realize real-time adaptive adjustment in the structure, parameters, calculation path, and functions of the network according to the specific needs of the received data or tasks [27,28]. This flexibility seeks to boost the adaptability of the model to complex input modes, reduce redundant calculations, improve resource efficiency, and maintain or improve performance. During the reasoning process, dynamic networks exhibit the capability to adjust their architectural configuration or parametric settings in response to the given input, thereby conferring upon them several benefits over their static counterparts, including enhanced efficiency, expressive power, adaptability, compatibility, and interpretability.
Su [29] introduced a pixel-adaptive convolution (PAC) operation, where the standard convolution is efficiently enhanced by incorporating filter weights with a spatial variation kernel that is influenced by the local pixel features. PAC uses local pixel features that can be learned to generate spatial change kernels and dynamically adjust the weights of convolution filters to achieve adaptive processing of input image content, which significantly improves the accuracy and flexibility of the convolutional neural network in image understanding and modeling. Zhu [28] proposed a reformulation of Deformable ConvNets, which was refined to better concentrate on relevant image areas, thanks to a boost in modeling capabilities and more robust training procedures. By introducing deformable convolution to dynamically adjust the sampling position and a modulation mechanism to change the amplitude of different position features, this method realizes the dual dynamic optimization of convolution kernel parameters, and enhances the adaptability of the network to image geometric changes and the ability to focus on related regions. Pu [30] proposed a method that generates a variety of augmented samples by shifting image features along directions that have semantic significance. This method designs the enhanced strength . With the scheme of linear increase with the training process, the dual-update mechanism is implemented under the meta-learning framework. By partially freezing the specific network structure, the network layer participating in the training is dynamically adjusted to realize the trade-off between training time and model performance and improve the training efficiency.
3. Method
DDE-Net consists of the three proposed modules (DGM, MRM, and SCM), a backbone network, a feature pyramid network (FPN) [31], a feature alignment module (FAM) [32], and an oriented detection module (ODM) [32]. The detection head, consisting of FAM and ODM, is utilized on each scale of the feature pyramid. Figure 2 illustrates the overall structure of the DDE-Net.
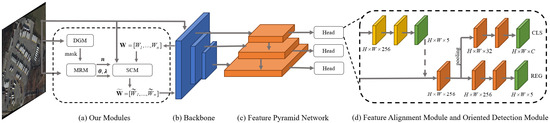
Figure 2.
Architecture of DDE-Net. DDE-Net consists of three proposed modules (a): a backbone network (b), FPN (c), and FAM and ODM (d).
In this section, we introduce DGM (Section 3.1), MRM (Section 3.2), and SCM (Section 3.3) in sequence. We elaborate on the mechanisms used within each module and delineate their interrelationships. In addition to the three novel modules mentioned above, FPN, FAM, and ODM are essential components in RS detectors and are interconnected to complete the detection task.
3.1. Density-Map and Mask Generation Module (DGM)
DGM contains a density map generation network with MCNN [21] used for the backbone. The shape of the image to be input to the network is . We apply multiple-column CNNs, each of which is equipped with convolution kernels of different sizes. This design aims to accurately align and recognize the head locations of various-sized objects in two-dimensional planes. The backbone architecture is shown in Figure 3.
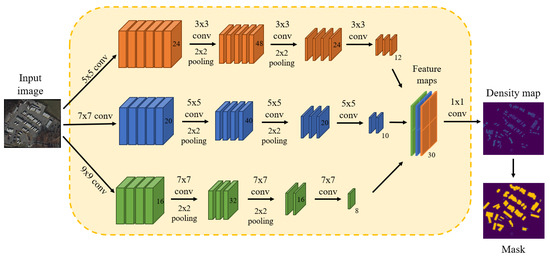
Figure 3.
Density map generation network in DGM. It comprises three parallel CNNs, each with filters that have varying local receptive field sizes. Pooling is applied for each 2 × 2 region, and ReLU is adopted as the activation function.
Owing to the incorporation of two pooling layers in MCNN, the spatial dimensions of its output feature map undergo a fourfold reduction in both the vertical and horizontal dimensions. In order to ensure that the original resolution of the image is not damaged, we use cubic interpolation to enlarge the generated density map by four times to restore its original fineness. In instances where the height or width of an image fails to be divisible by four, we revert the image to its native resolution. When constructing the density map generation network, we use the loss function based on the average absolute error of the pixel level, which can be written as:
where are the parameters of the density map generation network, N is the number of images in the training set, is the input image, is the ground-truth (GT) density map, and is the generated density map.
We apply the adaptive kernel method to generate the GT density map. During the process of generating the GT density map, we introduce the adaptive kernel method. In this method, we use a Gaussian kernel to smooth the target object, so as to create a realistic density distribution map. The diffusion parameter is calculated by the k-nearest-neighbor (KNN) method, as shown in Equation (2).
where is the target object; is the Gaussian kernel, and it performs convolution with ; and is the average distance of k nearest targets.
Generally, regions that cover more objects have higher pixel intensity on the density map than those that cover few objects. By setting the density pixel threshold, we are able to estimate the regions of interest of object aggregation and filter the invalid regions covering fewer or no objects.
In our method, we use the sliding window, and the size of the window is set according to the average area of potential objects in the image under the bird’s-eye view. We slide the window in steps of its own size, compute the aggregate pixel intensities within the current window, and subsequently assess this sum against a predefined threshold. If lower than the threshold value, the pixel intensities across the entire current window are set to 0; otherwise, they are set to 1. The inverted density map is what we call “the density map mask”, and for convenience, we abbreviate it as “mask”. By introducing different thresholds, the size and number of regions of interest can be dynamically adjusted. A smaller threshold will obtain a larger range of regions, while increasing the threshold will raise the region quantity, but the corresponding regions will be reduced, as shown in Figure 4.
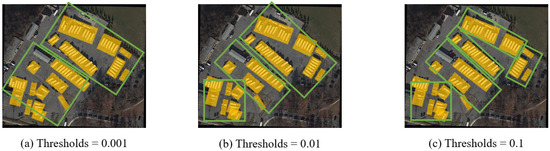
Figure 4.
Visualization of masks with different thresholds. A smaller threshold value will obtain a larger range of local object areas, while increasing the threshold value will increase the number of areas, but the area of each area will be reduced. The thresholds (a–c) are 0.001, 0.01, and 0.1.
3.2. Mask Routing Prediction Module (MRM)
The components of the MRM are shown in Figure 5.
Figure 5.
Components in MRM. (a,b) Convolution layer and pooling layer to extract the feature. (c) Routing prediction in two branches.
By calculating the proportion of the number of pixels marked as 1 in the mask relative to the total, we can calculate the approximate proportion of objects within the image, as shown in Equation (3):
where is the number of pixels marked as 1 in the mask.
After the proportion is calculated, the estimated value n, which represents the possible orientation numbers, is obtained according to the corresponding relationship, as shown in Table 1.

Table 1.
Corresponding relationship between props and n. Correspondence between the proportion of pixels marked as 1 in the density mask and the estimated value n of potential objects quantity in the input image.
The routing prediction constitutes a pivotal aspect of the MRM, which is responsible for calculating the rotation angles and combination weight based on the data-driven method. The origin input image with a shape of is sent to a lightweight depthwise convolution layer with a kernel size of 3 × 3, and then processed by normalization and the ReLU activation function.The activated feature passes through the average pooling layer, and its output dimension is . The feature vector that went through pooling layer is sent to two different branches. These two branches are processed independently and in parallel.
One branch is the rotation angle prediction branch, consisting of a linear layer followed by a softsign activation function. The number of output channels of the linear layer is determined by the estimated value n. In order to avoid learning biased angles, additive bias is not learned in the linear layer. Equation (4) presents the formula for the softsign layer.
where C is the expansion coefficient, which is used to expand the rotation search range.
The other branch, responsible for predicting the combination weights, is composed of a linear layer and sigmoid activation function. The linear layer’s output channels are set based on the predicted value of n.
3.3. Spatial-Balance Calculation Module (SCM)
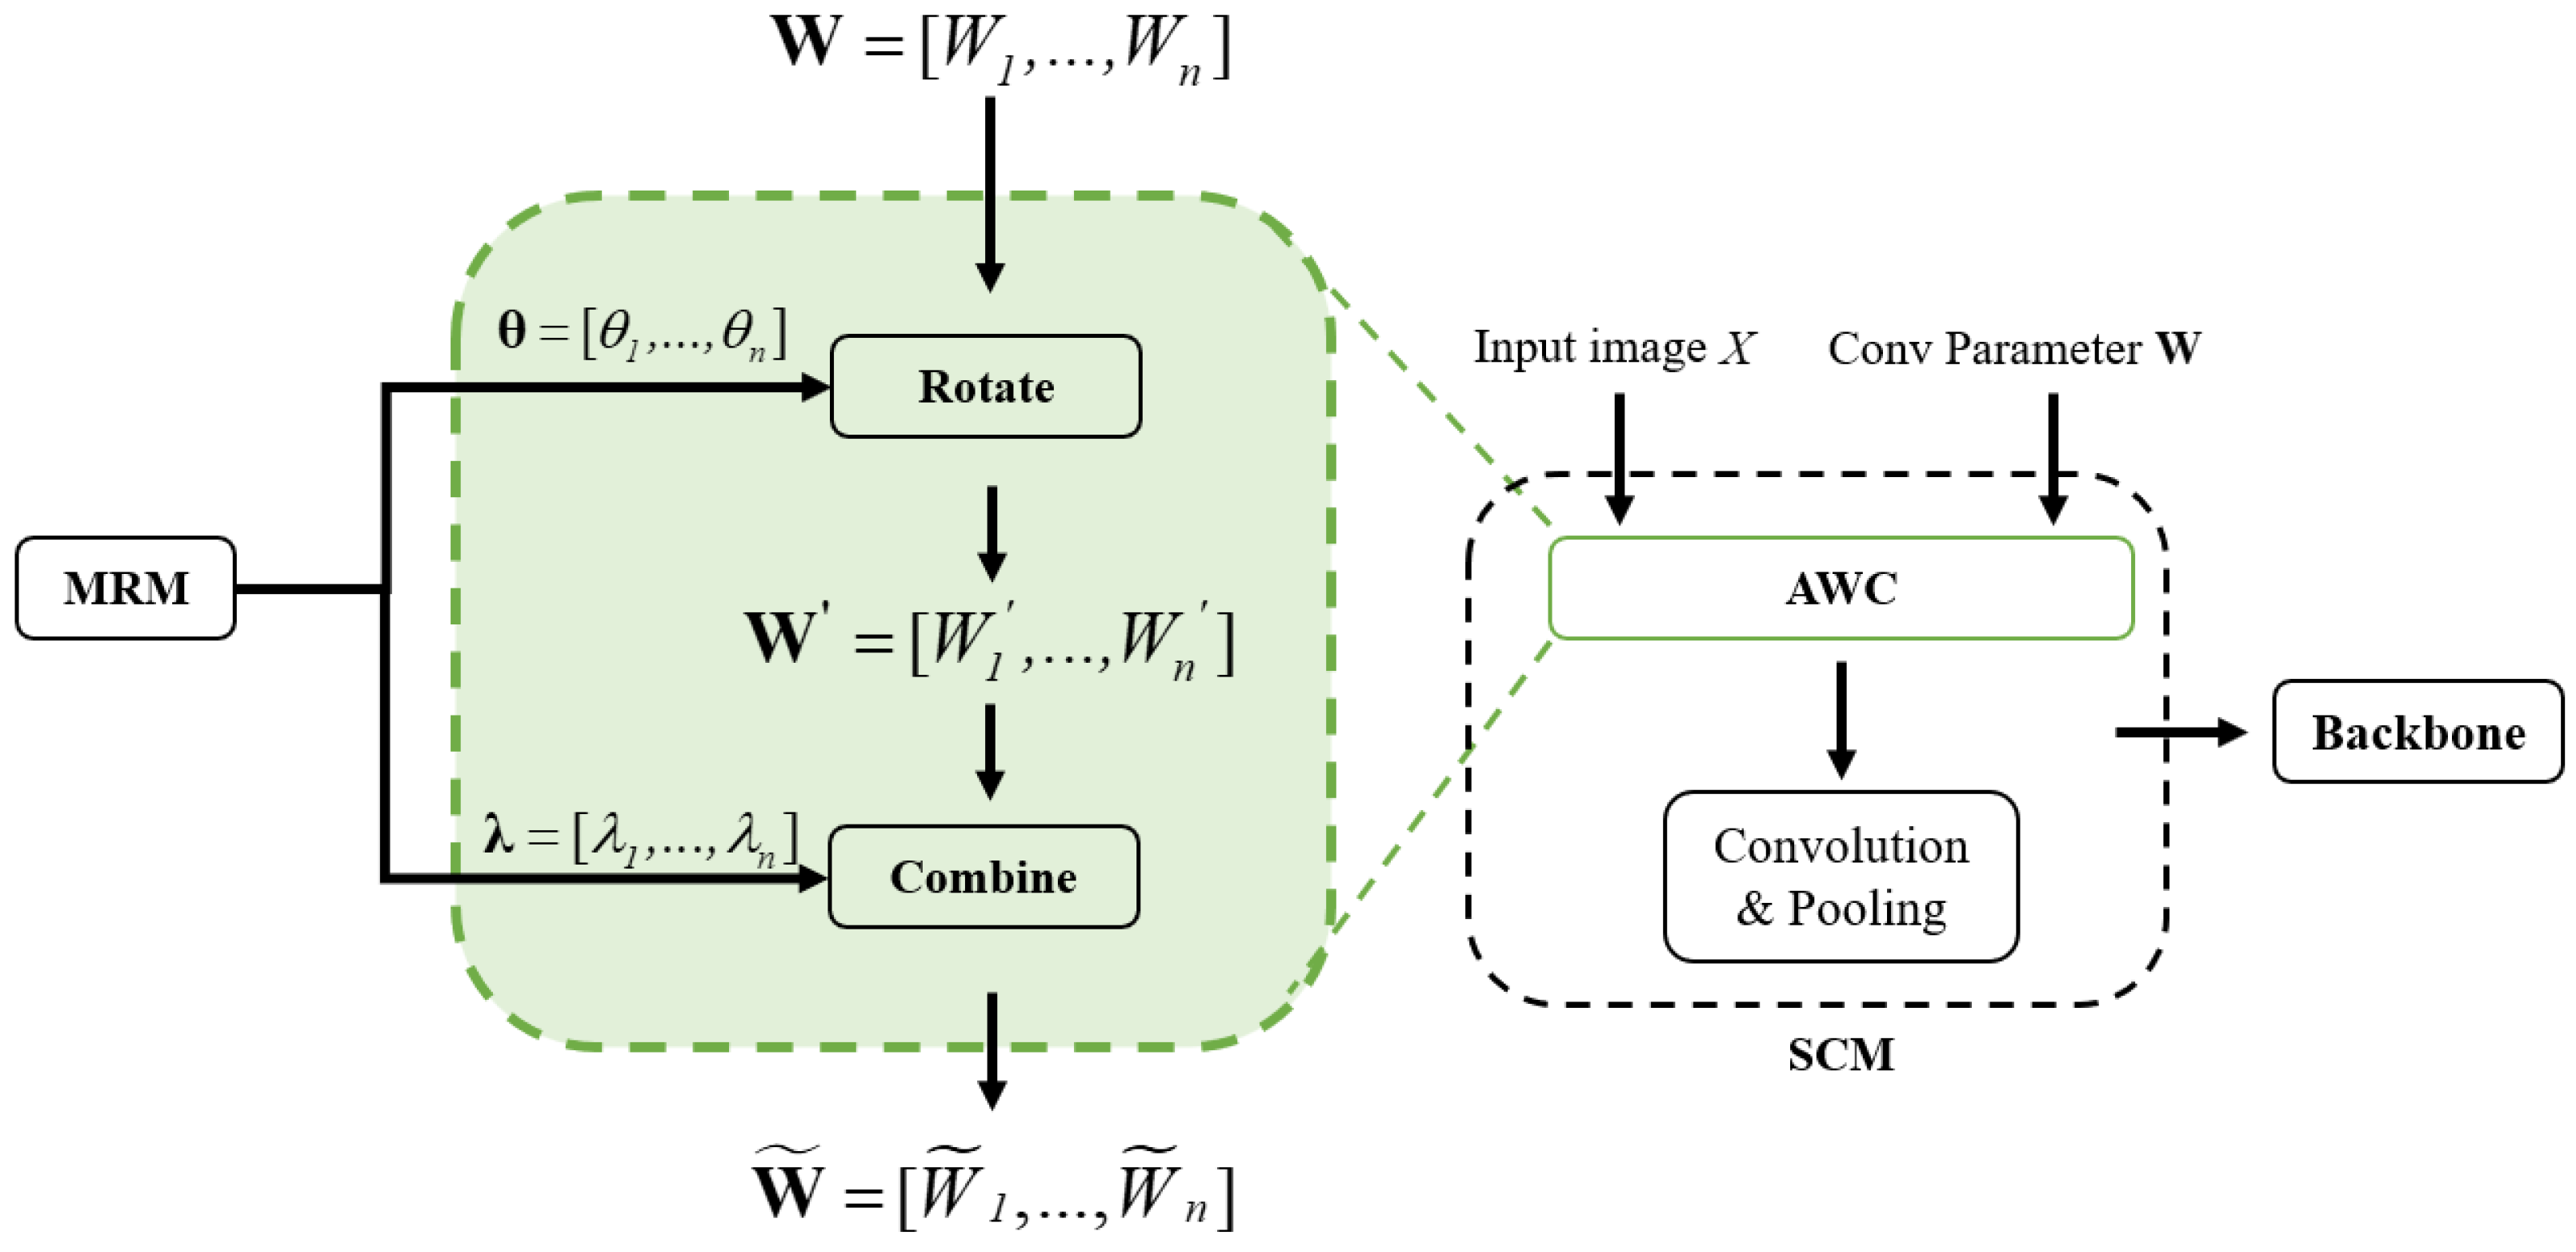
In order to balance the spatial difference caused by the contribution of different regions, referred to as ARC, we propose AWC to deal the rotating feature contribution differences. AWC uses the angles obtained by the MRM to perform affine rotation transformation on the convolution kernel, and then performs weighted average processing according to the weights to calculate the preliminary average feature map, which extends the expressiveness of the network in capturing the characteristics of objects in various directions, and maintains the high efficiency of its operation through complex convolution calculation. The preliminary feature map continues to be input into the backbone for subsequent processing. AWC is shown in Figure 6.
Figure 6.
AWC in SCM. Convolution kernels apply radial rotation transformation according to the rotation angle . The affine transformation matrix corresponding to the angle rotates the original convolution kernel sampling points through the transformation matrix to obtain the new convolution kernel sampling points after rotation. The n rotated convolution kernels convolute the input x independently, and the features extracted by each convolution are weighted and summed according to the weight .
A feature map is extracted by n convolution kernels , and n is obtained in the MRM. The shape of each convolution kernel is . For an RS image x, the MRM has already obtained a set of rotation angles and the weight corresponding to each angle. Convolution kernels apply affine rotation transformation according to the rotation angle . Firstly,
where is the angle corresponding to each kernel , is the convolution kernel after rotation, and is an affine transformation operation. The details are as follows:
We regard the parameters of the original convolution kernel as a set of sampling points on the overall two-dimensional plane where the convolution kernel is located. For instance, with regard to the 3 × 3 convolution kernel, we use bilinear interpolation to sample nine points on the two-dimensional kernel plane, which can cover the whole two-dimensional kernel plane in the form of interpolation. Then, we get the affine transformation matrix corresponding to the angle . After that, we can get the new convolution kernel sampling points after rotation by rotating the sampling points of the original kernel through the transformation matrix. The calculation formula is shown in Equation (6).
where are original sampling parameters, and is the sampling parameter after transformation.
We use n rotated kernels to perform a convolution operation on the input x independently, and sum the features extracted by each convolution according to the weight , as shown in Equation (7).
where * is the convolution operation, and y is the weighted combined feature map for output.
4. Experiments
4.1. Datasets
We use two RS image datasets containing complex rotating object scenes to evaluate the method proposed in this paper: DOTA and HRSC2016.
DOTA is the recognized largest public data set because of its wide range of data and diverse scenes. This dataset is composed of RS images provided by Google Earth [33] and two Chinese satellites, GF-2 and JL-1, including 2806 images and 188,282 instance targets marked with horizontal and rotating anchors. It covers the following 15 classes: plane (PL), baseball diamond (BD), bridge (BR), ground track field (GTF), small vehicle (SV), large vehicle (LV), ship (SH), tennis court (TC), basketball court (BC), storage tank (st), football field (SBF), dome (RA), port (HA), swimming pool (SP), and helicopter (HC). DOTA covers a variety of ground complex scenes and contains instance targets of various sizes, directions, and shapes. The images of the training set, verification set, and test set account for , , and of the total number of images, respectively, and the resolution of each image is between 800 × 800 and 4000 × 4000. Due to the high resolution of an image, we split it into several small images during training. The training set has 15,749 images, and the validation set has 5297 images. The results are sent to the DOTA official website to obtain the mean average precision of each category and the overall average precision.
HRSC2016 stands as another alternative, widely acknowledged benchmark dataset employed in the realm of arbitrarily oriented ship detection tasks. This dataset is composed of remote sensing images provided by Google Earth, including 27 types of ground objects and 1061 images ranging in size from 300 × 300 to 1500 × 900, using the OBB annotation format. Similar to DOTA, HRSC2016 also has the characteristics of rich target categories, large amount of data, rotating aggregation, etc. In the actual training process, we merged the training set and validation set together for training. Consistent with the evaluation protocols of PASCAL VOC 2007 [34] and VOC 2012, we adopt the mean average precision as an evaluation criterion for the detection accuracy on the HRSC2016.
4.2. Evaluation Metric
4.2.1. Precision-Recall Curve
A precision-recall curve expresses the nonlinear relationship between accuracy and recall. A predicted bounding box is considered a true positive if the IoU with the ground truth box is greater than 0.5; otherwise, it is labeled as a false positive. Furthermore, if multiple detections overlap with the same real bounding box at the same time, only one is counted as a true positive, while the rest are classified as false positives.
4.2.2. Average Precision and Mean Average Precision
Average precision (AP) is the average value of accuracy in the range of recall rate from 0 to 1, representing the area contained in the P-R curve. A higher AP value indicates superior detection capabilities. The specific expression is shown in Equation (8).
AP is usually calculated in a specific category, that is, it is calculated separately for each target category. In general target detection, the detector usually needs to detect multiple categories of targets. To evaluate the overall detection capability across all target categories, the mean average precision (mAP) across all categories is commonly employed as the ultimate performance indicator, as shown in Equation (9).
where C represents the number of target categories in the dataset.
4.2.3. False Predicted and False Negative Ratio
False predicted ratio (FPR) and false negative ratio (FNR) are important metrics used to evaluate detector performance in object detection. These metrics are calculated based on a confusion matrix. FPR represents the proportion of samples that are actually classified as negative but incorrectly classified as positive; it is shown in Equation (10). FNR represents the proportion of samples that are actually positive but incorrectly classified as negative; it is shown in Equation (11). If a detector incorrectly identifies the background as a target object, it will be considered as part of the FPR. On the contrary, if the detector fails to recognize the actual target object present in the image, it will be considered as part of the FNR.
where is the number of false positive cases, is the number of false negative cases, and is the number of true negatives cases.
4.3. Training and Inference Information
In this paper, ResNet50 and ARC-R50, which have been pre-trained with the ImageNet dataset [35], are selected as the backbone of DDE-Net. All experiments are deployed on servers with GPU. The GPU model is RTX-3080. The overall code architecture is based on the mmrotate toolbox [36]. In addition, other parameter settings and data processing and augmentation strategies will be set according to different datasets.
In the specific experimental parameter setting, we use adaptive moment estimation (Adam) as the parameter optimization algorithm of the model, and the weight attenuation coefficient is set to 0.0001. In terms of data processing, we cut the original large-scale image according to the sliding window mode with a step size of 512 and a window size of . During the processes of multi-scale training and evaluation, 0.5 and 1.0 scales are selected to scale the size of the original image, and then the scaled large-scale image is cropped according to the sliding window mode with a step size of 512 and a window size of . In addition, we randomly select strategies such as rotation, translation, and image flipping as the data expansion method during the training period.
We trained DDE-Net with 16 epochs on DOTA and 32 epochs on HRSC2016. We have collected specific training times and inference speed. Each epoch on the DOTA dataset includes 6400 iterations, while on HRSC2016 it includes 300 iterations. The details have shown in Table 2.
Table 2.
DDE-Net’s training and inference information.
4.4. Ablation Studies
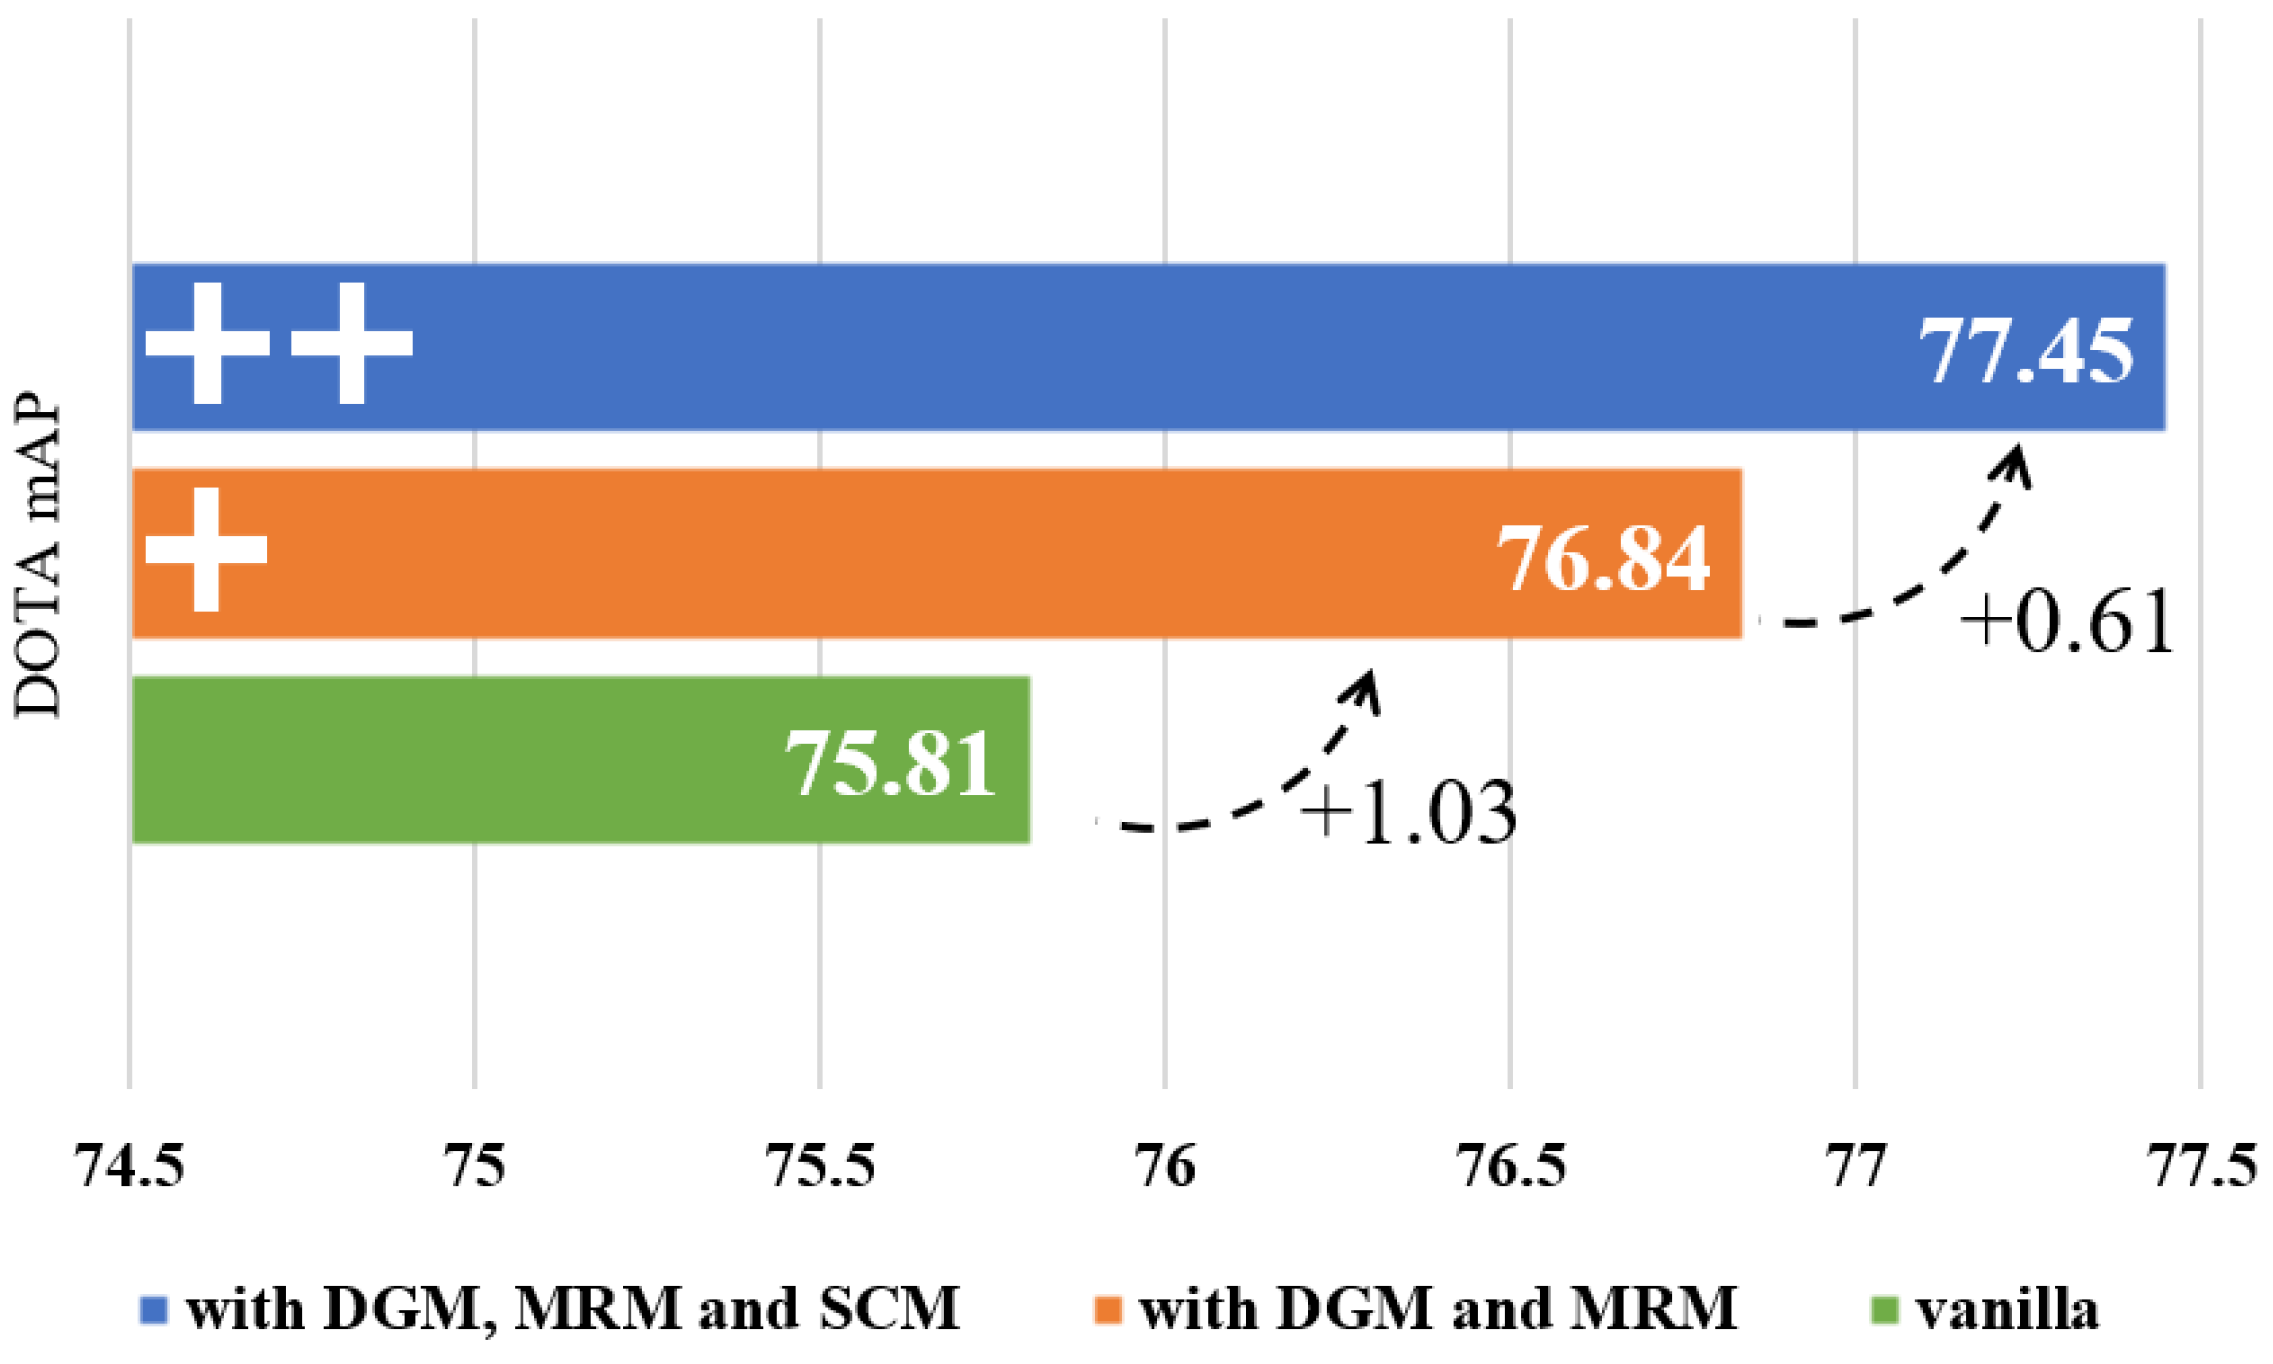
To assess the effectiveness of various components within DDE-Net, we compare the vanilla DDE-Net and a DDE-Net that applies the modules we propose in Section 3. The result is shown in Figure 7. We do the ablation studies on DOTA, and the specific conclusions are presented as follows.

Figure 7.
Ablation studies of different modules in DDE-Net. Vanilla DDE-Net refers to the network without DGM, MRM, and SCM, as illustrated in Figure 2.
4.4.1. With DGM and MRM
Firstly, we compared mAP performance of the vanilla and DGM+MRM versions of the DDE-Net on the DOTA, as shown in the green and orange rows of Figure 7. Before the introduction of the modules proposed in Section 3, the mAP of the vanilla DDE-Net is 75.81. With DGM and MRM, the mAP reaches 76.84. By using the angles and weights obtained from these two modules, it has an increase of 1.03 compared to the vanilla version. Note that the angles and weights obtained by the DGM and MRM are still involved in the update of the kernel parameters in the SCM during actual use; however, it does not involve AWC.
It was observed that incorporating DGM and MRM enhances the detector’s capabilities, which shows that the introduction of density map will not have a negative impact on the existing RS image information. On the contrary, the density map can focus on the dense distribution area of the target to be detected. At the same time, the improvement of mAP proves that after density inversion based on the generated density map, the relatively accurate possible angle of a rotating object can be predicted through the depth convolution double branch, which confirms the utility of our method for detecting rotating objects.
We randomly selected 1000 images from the DOTA dataset and 300 images from HRSC2016 as the test set, then inputted them into the separate pipelines of DGM and MRM to examine the prediction accuracy. The final results indicate that the accuracy on the DOTA dataset is 72.6%, and on HRSC2016 it is 85.6%, as shown in Table 3. The third column in the table represents the accuracy of the approximate number of orientations. The results are within an acceptable range, which verifies that our module provides positive assistance to the system.
Table 3.
Prediction accuracy of DGM and MRM.
4.4.2. With SCM
Building upon DGM + MRM, we propose SCM and achieve an mAP of 77.45. Compared with the vanilla version, the full version obtains a 1.64 increase in mAP, and a 0.61 increase with the DGM + MRM version. The difference is shown in the blue row of Figure 7.
This shows that the contribution of different regions to the rotation feature extraction is generally different, and the detection accuracy is subject to variation depending on the specific range of contributions. AWC, which is proposed to balance the difference, can consider how various regions affect the detection precision for the entire rotating object. The balanced calculation of different weights can also make the detector more flexible and able to extract higher-quality feature maps.
4.4.3. Dynamic Prediction for Number of Orientations
In order to prove that the function of dynamically predicting the number of orientations n in the MRM can effectively improve the detection speed and efficiency, we compared three methods:
- Oriented R-CNN with ResNet as the backbone without orientation prediction;
- Oriented R-CNN that is equipped with an ARC module for predicting the number of orientations n in advance;
- DDE-Net, which predicts the number of angles n dynamically.
We used DOTA to test the FLOPs, FPS, and mAP. The FPS was obtained on an RTX-3080 graphics card with the batch-size of 1.
From the results in Table 4, it can be seen that Oriented R-CNN with ResNet50 is slightly better than DDE-Net in network parameters and FPS on DOTA, but it has a relatively large loss in mAP (−1.46); With ResNet101 as the backbone, although the mAP is improved, it is still lower than our method (−1.16). At the same time, compared with ResNet50, ResNet101 inevitably brings about a sharp increase in network parameters and FLOPs, as well as a decline in FPS, which reduces the efficiency of detection tasks.
Table 4.
Ablation studies on dynamic prediction for number of orientations. The first and second rows of the table refer to Oriented R-CNN as the framework, with ResNet50 or ResNet101 as backbone. The ARC module is applied on Oriented R-CNN and with ResNet50 as its backbone. DDE-Net is applied with DGM, MRM, and SCM, and with ResNet50 as backbone.
Compared with the ARC module in , our method has lower FLOPs (−0.08) and smaller parameters (−3.93), on the premise that mAP loss is very small (−0.08) and FPS is the same. It can be proved that DDE-Net can decrease the complexity of computations and the quantity of parameters within the network while ensuring that the loss of accuracy is within an acceptable range, and avoid the waste of resources caused by invalid calculation. This trend is particularly obvious under the pre-defined ARC module in : when setting , the increase of mAP is very small (+0.11), but the corresponding increase of FLOPs (+0.15) and the amount of parameters required by the network increases significantly (+26.07).
This shows that obtaining the prior orientation information can improve the accuracy with relatively small resource cost. If the number of orientations n was specified in advance for prediction processing, it would not be able to better capture the rotating target feature information in the actual task. At the same time, because the feature information contained in an image is certain, if n is set too large, it will cause excessive resource overhead and reasoning calculation.
Therefore, DDE-Net dynamically predicts the possible orientations of the rotating target in an RS image, which can reduce the resource cost and improve the reasoning speed while maintaining mAP.
4.5. Comparisons
In this section, we compare our proposed DDE-Net with other detectors on DOTA and HRSC2016, and the outcomes are presented in Table 5 and Table 6. The overall experimental data include the AP of each category and the mAP across all categories on DOTA, and the mAP as well as the AP under 0.5 and 0.75 thresholds () on HRSC2016.
Table 5.
Results on DOTA compared with other methods. In the backbone column, H104 represents the 104-layer hourglass architecture [37], while DLA34 signifies the 34-layer deep layer aggregation network [38], and ReR50 is proposed in ReDet [39] with rotation-equivariant operations.
Table 6.
Results on HRSC2016 compared with other methods.
We compared the FPR and FNR of DDE-Net and other detectors, and the results are shown in the Table 7. From the table, it can be seen that the FPR of DDE-Net is lower than the another two detectors. This indicates that DDE-Net can effectively capture detailed features by enhancing feature extraction through DGM-MRM-SCM, thereby reducing the probability of false detections. At the same time, the FNR of DDE-Net is significantly lower than the other two detectors, indicating that the dynamic angle prediction can effectively include the orientation information of objects and can better handle arbitrary orientation problems during the detection process.
Table 7.
Results on FPR and FNR compared with other methods.
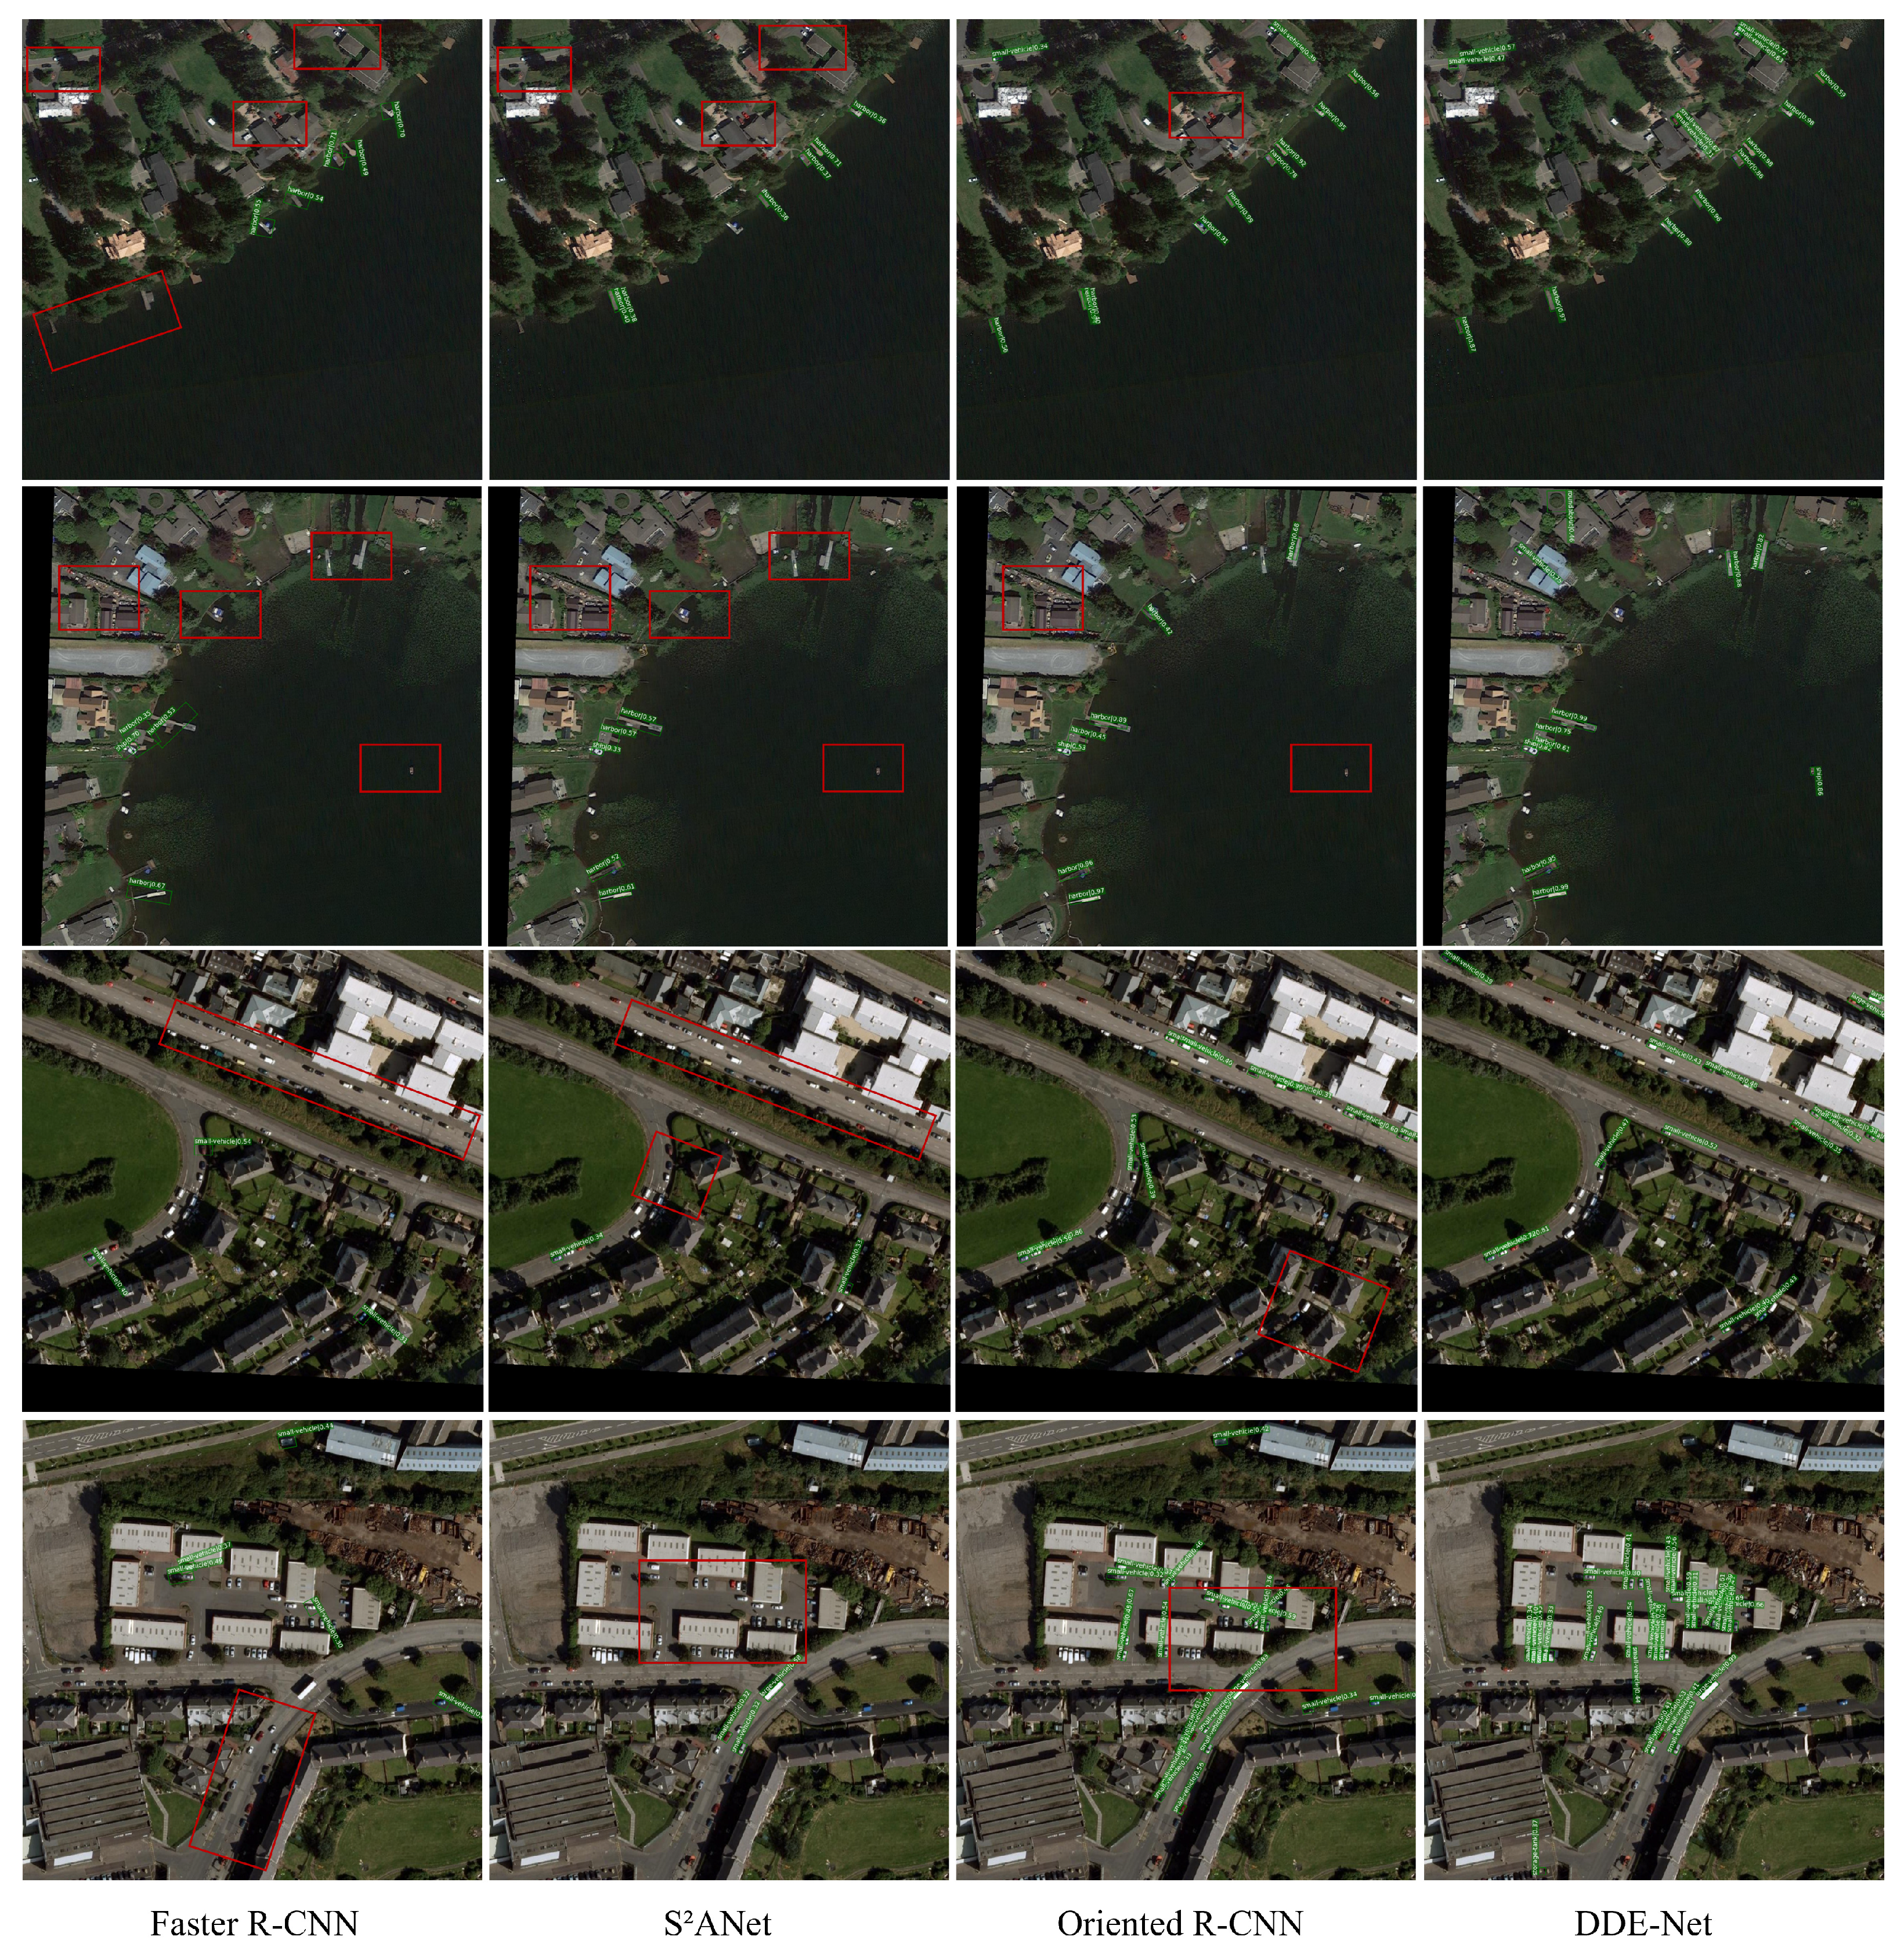
We present a visual comparison of the detection results between DDE-Net and other models in Figure 8. It can be intuitively seen that the detection performance of DDE-Net is relatively better than the other detectors.
Figure 8.
Visual comparison. The red box in the images indicates errors made by other methods.
4.5.1. Result on DOTA
We compared DDE-Net and other mainstream rotated object detectors on DOTA. As shown in Table 5, DDE-Net outperforms other detection methods in terms of AP for the PL, BR, TC, BC, SBF, and RA categories. Beyond these prominent categories, DDE-Net’s performance remains commendable, either aligning with or surpassing the mean AP levels observed across the remaining categories. This consistency in demonstrating competitive or superior detection capabilities across the entire gamut of object types underscores the versatility and robustness of the proposed architecture. It adapts to the unique challenges posed by objects of varying sizes, shapes and orientations, effectively mitigating potential pitfalls associated with fixed-angle anchor settings employed by conventional detectors.
Notably, for large, regular-shaped categories such as PL, SBF, and RA, which account for a high proportion of the image and easily form dense distributions, the density map generated by DDE-Net through DGM can accurately capture and highlight the two-dimensional information of key targets, effectively filtering the background interference. For example, even in dense parking areas such as airports, DDE-Net obtains information about the relative position and aggregation degree of aircraft, which helps the network effectively distinguish aircraft from complex runways, buildings, and other features. In this process, SCM dynamically adjusts the orientation of the convolution kernel by calculating the spatial weight, so that when dealing with such targets with obvious dense distribution characteristics, the network can balance the contribution of different regions to the extraction of rotating features, and reduce the computational burden caused by local over-density, while maintaining the sensitivity to edges or sparse-distribution parts, further improving the accuracy for large and dense targets.
For the categories with obvious rotation characteristics such as BR, SH, and HA, the orientation and its weight information predicted by the MRM play a key role, which enables the network to more accurately locate and recognize the arbitrary pose of these targets in the image, and avoid missing detection or false alarm caused by fixed angle setting. At the same time, the SCM calculates weights adaptively and adjusts the intensity of feature extraction for different parts to ensure that when the network processes such targets that may have complex rotation angles, it can extract the spatial information of each part in a balanced way and avoid the detection deviation caused by too large or too small local weights, so as to enhance the detection ability for targets with significant rotation characteristics.
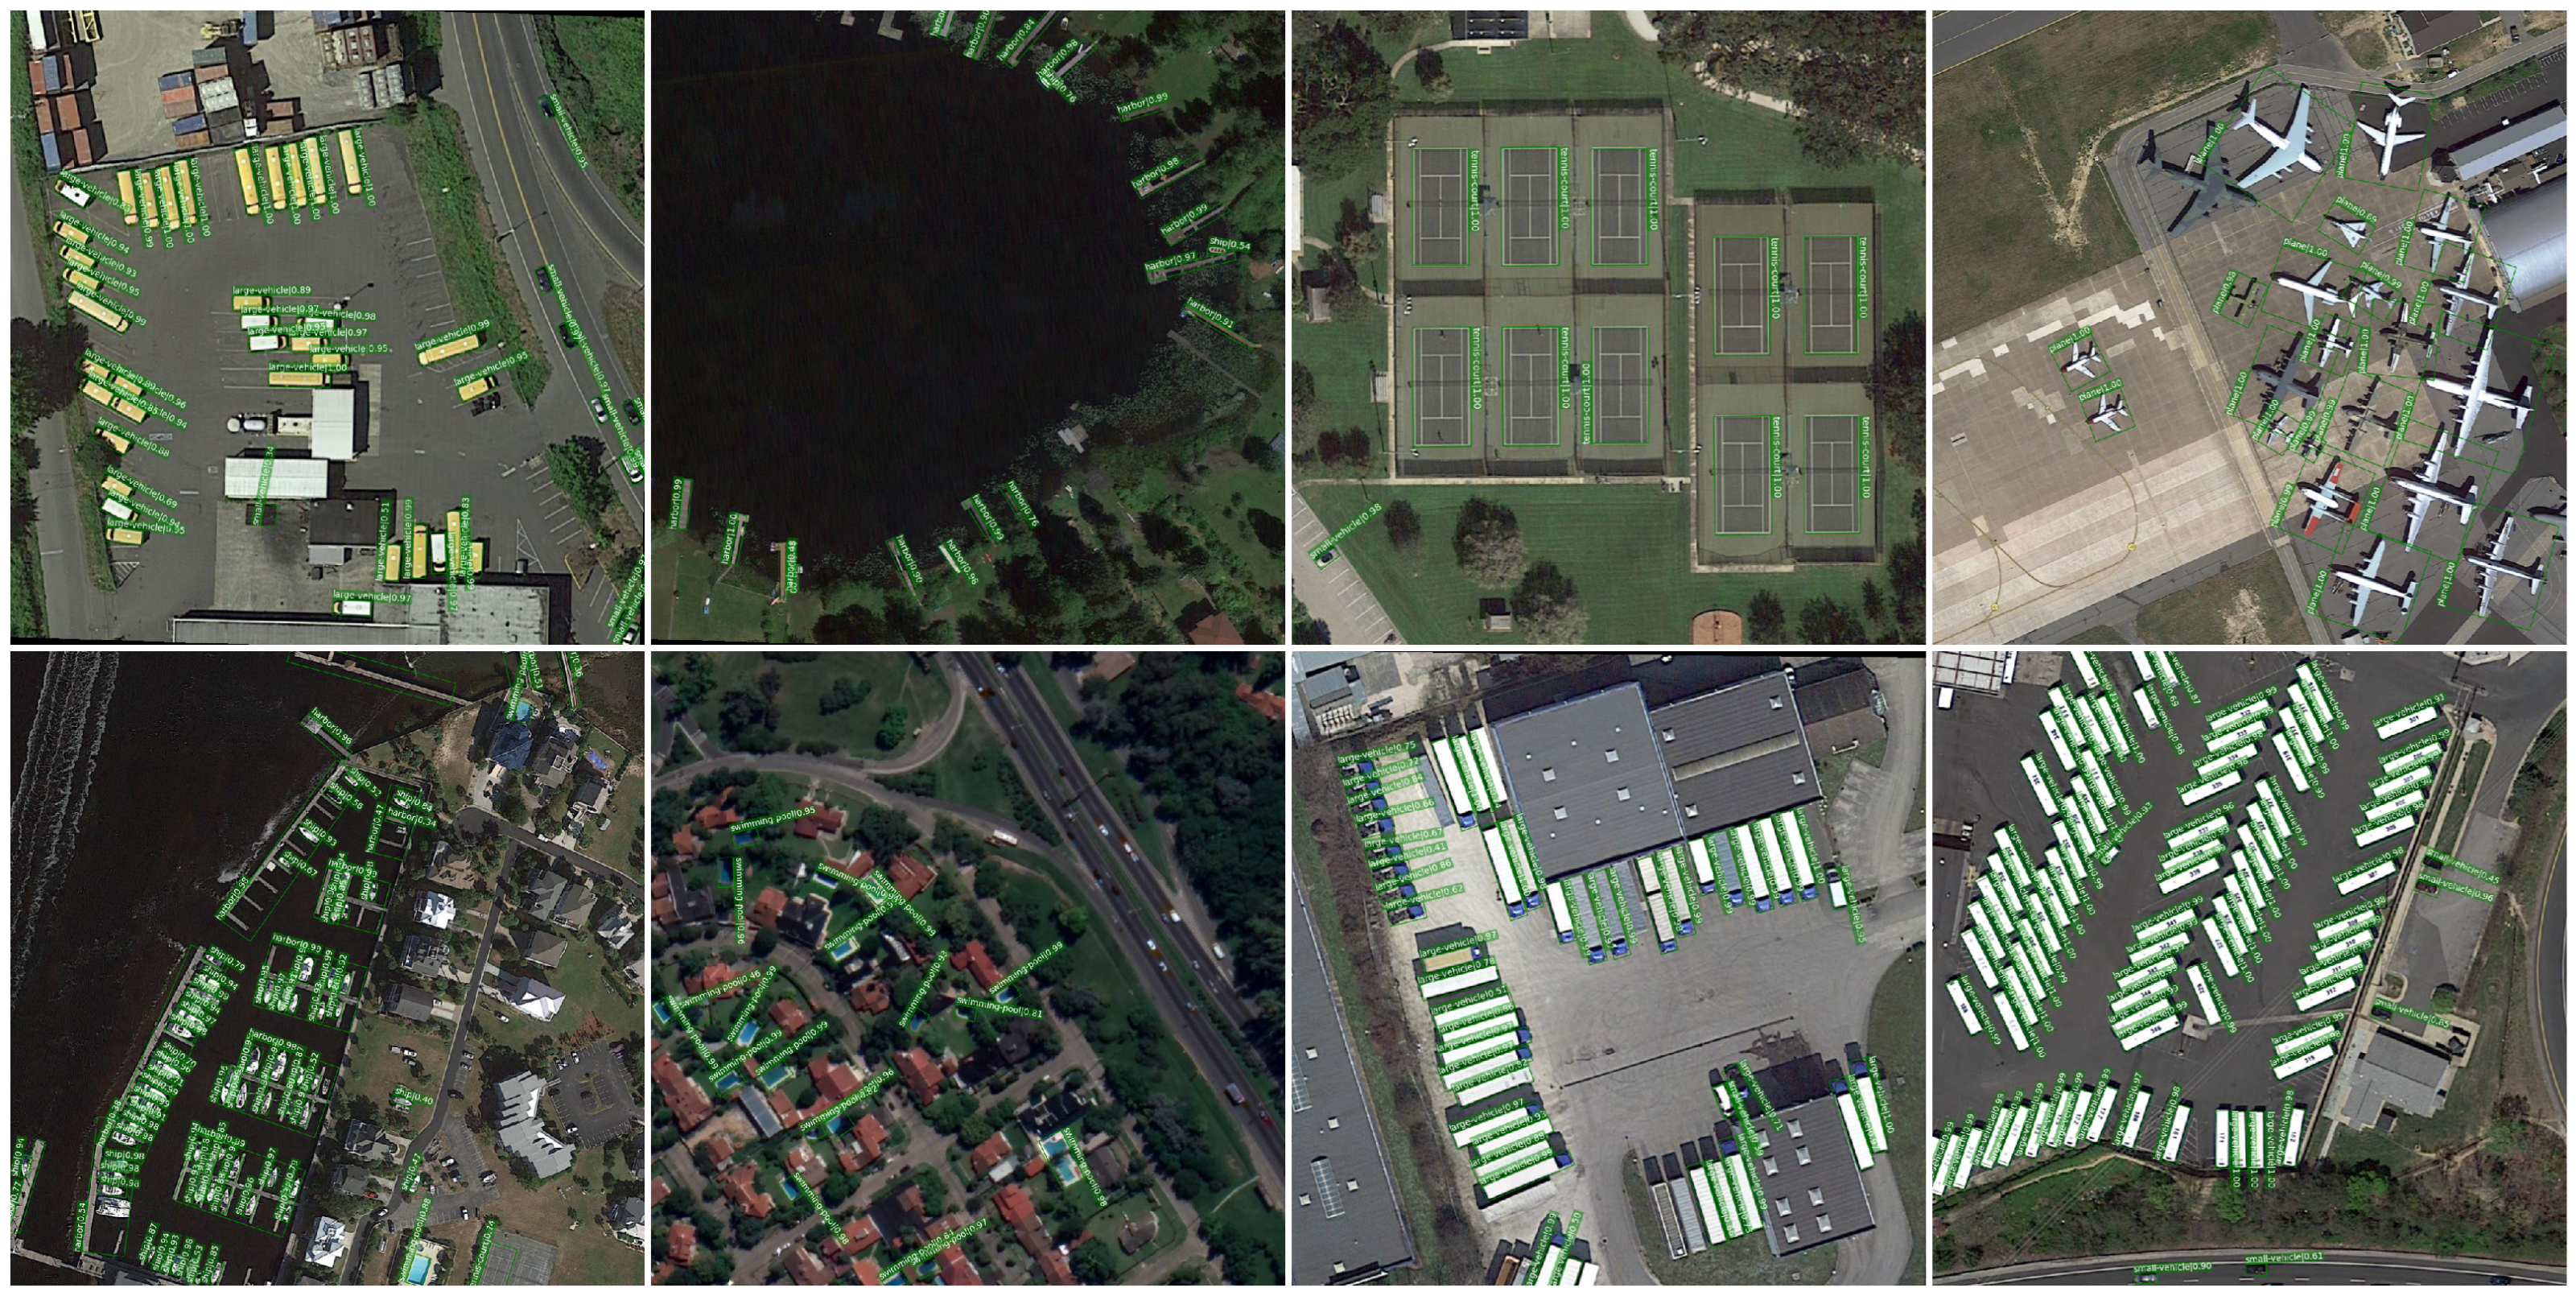
In mAP, DDE-Net based on ResNet50 and ResNet101 reached 77.45% and 77.69%, respectively, which was not only ahead of other comparison methods, but also verified the robustness and universality of DDE-Net in processing various rotating objects. The visualization results (see Figure 9) further confirmed this point: even in the case of complex background, dense targets, or extreme rotation angle, DDE-Net can still accurately detect all kinds of targets, and its boundary frame is highly consistent with the actual contour, which fully reflects the superior performance of the network in processing the detection task of rotating objects at various angles.

Figure 9.
Visualization results on DOTA.
4.5.2. Reuslt on HRSC2016
On HRSC2016, we compared the detection effect of Rotated RetinaNet, S²ANet, and Oriented R-CNN with our DDE-Net. Moreover, we also compared the addition of an ARC module on these detectors. As shown in Table 6, DDE-Net has obtained a higher mAP. Compared with specific ship object detectors, DDE-Net has an mAP 19.28 higher than Rotated RetinaNet, 15.59 higher than S²ANet, and 1.15 higher than Oriented R-CNN. Meanwhile, the AP under 0.5 and 0.75 thresholds of DDE-Net are also better than other detectors. Figure 10 displays various HRSC2016 detection outcomes.
Figure 10.
Visualization results on HRSC2016.
For ships in HRSC2016, they may be densely or sparsely distributed in RS images, and the background is complex, including oceans, port facilities, other ships, etc. By generating a density map of the ship, DGM effectively captures and highlights the two-dimensional distribution information of the ship in the image, especially in dense areas, which can clearly distinguish the ship from the background, filter out irrelevant interference, and improve the accuracy of detection. The density map generated by the DGM helps to strengthen its contour features in a complex background, so that the network can accurately locate and segment the ship distribution area. At the same time, for a target with significant rotation characteristics, the MRM can accurately identify the attitude of the ship when it is parked or sailing at a variety of non-standard angles by predicting the possible direction of the ship and its corresponding weight information, so as to avoid false detection or missing detection caused by fixed angle setting. This flexible adaptation to ship rotation characteristics greatly improves the detection performance of DDE-Net. In addition, for targets with complex shape and multiple significant feature areas, such as ships, the SCM calculates the spatial weight and dynamically adjusts the convolution kernel to ensure that the spatial information of each part may be extracted in a balanced way when processing such targets with complex rotation angles. This helps the network to avoid detection bias caused by excessive or too small local weight when processing the characteristics of different parts of the ship, and further enhances the detection accuracy of all kinds of ships.
5. Discussion
This section will explore the advantages and limitations of DDE-Net, as well as future directions for improvement, starting from its technical characteristics.
Beginning with the distribution characteristics of rotating objects, DDE-Net uses a density map and masks to predict the orientation numbers in a novel way. The results based on the DGM and MRM show that the DDE-Net prediction process is dynamic, which improves the flexibility and accuracy of handling object detection tasks in arbitrary directions. From the perspective of resource efficiency and modules’ collaborative work, DDE-Net optimizes the utilization of computing resources, and the tightly coupled design enhances the model’s adaptability to different scenarios and object types.
However, some system errors still exist in DDE-Net. One noteworthy point is the missed detection issue caused by orientation errors. We proposed a method to dynamically predict orientations when processing prior information, and our motivation is to improve the computational efficiency of the detector with a limited but correct number of orientations. However, there is still the possibility of omission in the actual process. Specifically, as shown in Table 1, we use manual experience to classify the possible number of orientations according to Equation (3). However, in the actual experiments, we obtained an accuracy of 72.6%, and there are still examples that exceed the corresponding relationship in the table. When DGM and MRM miss certain angles, it is difficult to obtain rotation features during convolution in SCM, which may result in missed detections.
Meanwhile, background or non-relevant features may be incorrectly classified as an object of interest, which may lead to false positives [52]. Moreover, over-fitting to training data may also lead to such issues. The model might perform well on the training data but poorly on new and unseen data if it has over-fitted to the specific characteristics of the training dataset. DDE-Net has not designed a solution superior to other detectors for these issues. Figure 11 shows two possible errors that may occur with DDE-Net.
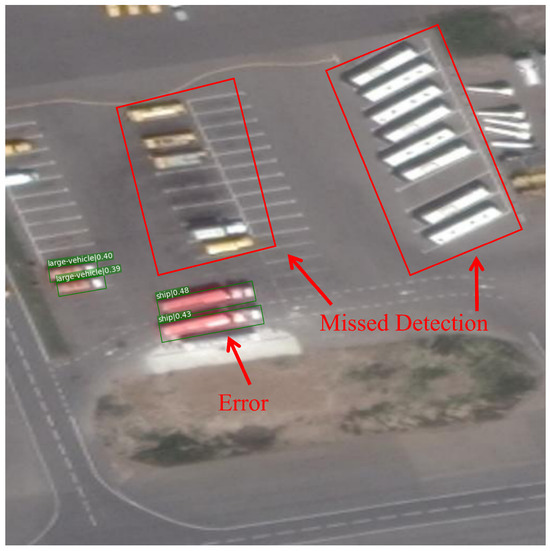
Figure 11.
Errors that may occur with DDE-Net.
To further optimize the detection performance of DDE-Net, we can consider two aspects: data augmentation and network architecture improvement. We can consider using image processing techniques such as cropping, adjusting brightness or contrast, and injecting noise to enhance the system’s anti-interference and stability towards the input image. An attention mechanism can be introduced into the network architecture to enable the model to focus on the most relevant feature regions. Lightweight design is also a direction to consider [53], which can be used to build smaller and more efficient model architectures and resource-friendly models.
6. Conclusions
In this paper, we noticed the problem that the existing aerial object detectors do not effectively deal with the number and value of orientations covered in RS images. Therefore, we have proposed DDE-Net, with a tight-coupling network structure, which includes three novel functional modules: DGM, MRM, and SCM. Ablation and comparison experiments have fully proved that the DGM and MRM boost detector capabilities and dynamically predict possible orientations in an RS image. Meanwhile, the SCM could make the detector more flexible and able to extract a higher-quality feature map, which could reduce the resource cost and improve the inference speed while maintaining the accuracy of mAP.
Author Contributions
Methodology, B.W.; validation, J.C.; writing—original draft, B.W.; supervision, X.X. and Y.L.; project administration, D.J. and L.X. All authors have read and agreed to the published version of the manuscript.
Funding
This research received no external funding.
Data Availability Statement
The original contributions presented in the study are included in the article, further inquiries can be directed to the corresponding author.
Conflicts of Interest
Authors Boyu Wang, Xiaokai Xia, Luo Xu and Jiangmai Cheng were employed by the company China Electronics Technology Group Corporation. The remaining authors declare that the research was conducted in the absence of any commercial or financial relationships that could be construed as a potential conflict of interest.
References
- Girshick, R.; Donahue, J.; Darrell, T.; Malik, J. Rich Feature Hierarchies for Accurate Object Detection and Semantic Segmentation. In Proceedings of the 2014 IEEE Conference on Computer Vision and Pattern Recognition, Columbus, OH, USA, 23–28 June 2014. [Google Scholar] [CrossRef]
- Girshick, R. Fast R-CNN. In Proceedings of the 2015 IEEE International Conference on Computer Vision (ICCV), Santiago, Chile, 7–13 December 2015. [Google Scholar] [CrossRef]
- Ren, S.; He, K.; Girshick, R.; Sun, J. Faster R-CNN: Towards Real-Time Object Detection with Region Proposal Networks. IEEE Trans. Pattern Anal. Mach. Intell. 2017, 28, 1137–1149. [Google Scholar] [CrossRef] [PubMed]
- Redmon, J.; Divvala, S.; Girshick, R.; Farhadi, A. You Only Look Once: Unified, Real-Time Object Detection. In Proceedings of the 2016 IEEE Conference on Computer Vision and Pattern Recognition (CVPR), Las Vegas, NV, USA, 27–30 June 2016. [Google Scholar] [CrossRef]
- Liu, W.; Anguelov, D.; Erhan, D.; Szegedy, C.; Reed, S.; Fu, C.Y.; Berg, A.C. SSD: Single Shot MultiBox Detector. In Computer Vision—ECCV 2016: Proceedings of the 4th European Conference, Amsterdam, The Netherlands, 11–14 October 2016; Lecture Notes in Computer Science; Springer: Berlin/Heidelberg, Germany, 2016; pp. 21–37. [Google Scholar] [CrossRef]
- Yu, Y.; Yang, X.; Li, Q.; Zhou, Y.; Da, F.; Yan, J. H2RBox-v2: Incorporating Symmetry for Boosting Horizontal Box Supervised Oriented Object Detection. In Proceedings of the Advances in Neural Information Processing Systems, New Orleans, LO, USA, 10–16 December 2023; Oh, A., Naumann, T., Globerson, A., Saenko, K., Hardt, M., Levine, S., Eds.; Curran Associates, Inc.: Red Hook, NY, USA, 2023; Volume 36, pp. 59137–59150. [Google Scholar]
- Xu, H.; Liu, X.; Xu, H.; Ma, Y.; Zhu, Z.; Yan, C.; Dai, F. Rethinking Boundary Discontinuity Problem for Oriented Object Detection. In Proceedings of the IEEE/CVF Conference on Computer Vision and Pattern Recognition, Seattle, WA, USA, 17–21 June 2024. [Google Scholar]
- Ding, J.; Xue, N.; Long, Y.; Xia, G.S.; Lu, Q. Learning RoI Transformer for Oriented Object Detection in Aerial Images. In Proceedings of the 2019 IEEE/CVF Conference on Computer Vision and Pattern Recognition (CVPR), Long Beach, CA, USA, 15–20 June 2019. [Google Scholar] [CrossRef]
- Xie, X.; Cheng, G.; Wang, J.; Yao, X.; Han, J. Oriented R-CNN for Object Detection. In Proceedings of the 2021 IEEE/CVF International Conference on Computer Vision (ICCV), Montreal, BC, Canada, 11–17 October 2021. [Google Scholar] [CrossRef]
- Guo, Z.; Liu, C.; Zhang, X.; Jiao, J.; Ji, X.; Ye, Q. Beyond Bounding-Box: Convex-hull Feature Adaptation for Oriented and Densely Packed Object Detection. In Proceedings of the 2021 IEEE/CVF Conference on Computer Vision and Pattern Recognition (CVPR), Nashville, TN, USA, 20–25 June 2021. [Google Scholar] [CrossRef]
- Pu, Y.; Wang, Y.; Xia, Z.; Han, Y.; Wang, Y.; Gan, W.; Wang, Z.; Song, S.; Huang, G. Adaptive Rotated Convolution for Rotated Object Detection. In Proceedings of the IEEE/CVF International Conference on Computer Vision, Paris, France, 2–6 October 2023. [Google Scholar]
- He, K.; Zhang, X.; Ren, S.; Sun, J. Deep Residual Learning for Image Recognition. In Proceedings of the 2016 IEEE Conference on Computer Vision and Pattern Recognition (CVPR), Las Vegas, NV, USA, 27–30 June 2016. [Google Scholar] [CrossRef]
- Ding, J.; Xue, N.; Xia, G.S.; Bai, X.; Yang, W.; Yang, M.; Belongie, S.; Luo, J.; Datcu, M.; Pelillo, M.; et al. Object Detection in Aerial Images: A Large-Scale Benchmark and Challenges. IEEE Trans. Pattern Anal. Mach. Intell. 2021, 44, 7778–7796. [Google Scholar] [CrossRef] [PubMed]
- Liu, Z.; Wang, H.; Weng, L.; Yang, Y. Ship Rotated Bounding Box Space for Ship Extraction from High-Resolution Optical Satellite Images with Complex Backgrounds. IEEE Geosci. Remote Sens. Lett. 2016, 13, 1074–1078. [Google Scholar] [CrossRef]
- Yang, X.; Yang, J.; Yan, J.; Zhang, Y.; Zhang, T.; Guo, Z.; Sun, X.; Fu, K. SCRDet: Towards More Robust Detection for Small, Cluttered and Rotated Objects. In Proceedings of the 2019 IEEE/CVF International Conference on Computer Vision (ICCV), Seoul, Republic of Korea, 27 October–2 November 2019. [Google Scholar] [CrossRef]
- Li, W.; Chen, Y.; Hu, K.; Zhu, J. Oriented RepPoints for Aerial Object Detection. In Proceedings of the 2022 IEEE/CVF Conference on Computer Vision and Pattern Recognition (CVPR), New Orleans, LA, USA, 18–24 June 2022. [Google Scholar] [CrossRef]
- Xu, Y.; Fu, M.; Wang, Q.; Wang, Y.; Chen, K.; Xia, G.S.; Bai, X. Gliding Vertex on the Horizontal Bounding Box for Multi-Oriented Object Detection. IEEE Trans. Pattern Anal. Mach. Intell. 2021, 43, 1452–1459. [Google Scholar] [CrossRef]
- Hou, L.; Lu, K.; Yang, X.; Li, Y.; Xue, J. G-Rep: Gaussian Representation for Arbitrary-Oriented Object Detection. Remote Sens. 2022, 15, 757. [Google Scholar] [CrossRef]
- Yang, X.; Yan, J.; Feng, Z.; He, T. R3Det: Refined Single-Stage Detector with Feature Refinement for Rotating Object. In Proceedings of the AAAI Conference on Artificial Intelligence, Virtually, 2–9 February 2021; pp. 3163–3171. [Google Scholar] [CrossRef]
- Gao, G.; Ji, G.; Liu, Q.; Wang, Q.; Wang, Y. CNN-based Density Estimation and Crowd Counting: A Survey. arXiv 2020, arXiv:2003.12783. [Google Scholar]
- Zhang, Y.; Zhou, D.; Chen, S.; Gao, S.; Ma, Y. Single-Image Crowd Counting via Multi-Column Convolutional Neural Network. In Proceedings of the 2016 IEEE Conference on Computer Vision and Pattern Recognition (CVPR), Las Vegas, NV, USA, 26 June–1 July 2016. [Google Scholar] [CrossRef]
- Li, Y.; Zhang, X.; Chen, D. CSRNet: Dilated Convolutional Neural Networks for Understanding the Highly Congested Scenes. In Proceedings of the 2018 IEEE/CVF Conference on Computer Vision and Pattern Recognition, Salt Lake City, UT, USA, 18–23 June 2018. [Google Scholar] [CrossRef]
- Simonyan, K.; Zisserman, A. Very Deep Convolutional Networks for Large-Scale Image Recognition. In Proceedings of the International Conference on Learning Representations, San Diego, CA, USA, 7–9 May 2015. [Google Scholar]
- Xu, C.; Qiu, K.; Fu, J.; Bai, S.; Xu, Y.; Bai, X. Learn to Scale: Generating Multipolar Normalized Density Maps for Crowd Counting. In Proceedings of the IEEE/CVF International Conference on Computer Vision, Seoul, Republic of Korea, 27 October–2 November 2019. [Google Scholar]
- Wang, Y.; Zou, Y. Fast visual object counting via example-based density estimation. In Proceedings of the 2016 IEEE International Conference on Image Processing (ICIP), Phoenix, AZ, USA, 25–28 September 2016. [Google Scholar] [CrossRef]
- Sindagi, V.A.; Patel, V.M. Generating High-Quality Crowd Density Maps using Contextual Pyramid CNNs. In Proceedings of the 2017 IEEE International Conference on Computer Vision (ICCV), Venice, Italy, 22–29 October 2017. [Google Scholar] [CrossRef]
- Han, Y.; Huang, G.; Song, S.; Yang, L.; Wang, H.; Wang, Y. Dynamic Neural Networks: A Survey. IEEE Trans. Pattern Anal. Mach. Intell. 2022, 44, 7436–7456. [Google Scholar] [CrossRef]
- Zhu, X.; Hu, H.; Lin, S.; Dai, J. Deformable ConvNets v2: More Deformable, Better Results. In Proceedings of the 2019 IEEE/CVF Conference on Computer Vision and Pattern Recognition (CVPR), Long Beach, CA, USA, 15–20 June 2019. [Google Scholar] [CrossRef]
- Su, H.; Jampani, V.; Sun, D.; Gallo, O.; Learned-Miller, E.; Kautz, J. Pixel-Adaptive Convolutional Neural Networks. In Proceedings of the 2019 IEEE/CVF Conference on Computer Vision and Pattern Recognition (CVPR), Long Beach, CA, USA, 15–20 June 2019. [Google Scholar] [CrossRef]
- Pu, Y.; Han, Y.; Wang, Y.; Feng, J.; Deng, C.; Huang, G. Fine-grained Recognition with Learnable Semantic Data Augmentation. IEEE Trans. Image Process. 2023, 33, 3130–3144. [Google Scholar] [CrossRef] [PubMed]
- Lin, T.Y.; Goyal, P.; Girshick, R.; He, K.; Dollar, P. Focal Loss for Dense Object Detection. In Proceedings of the 2017 IEEE International Conference on Computer Vision (ICCV), Venice, Italy, 22–29 October 2017. [Google Scholar] [CrossRef]
- Han, J.; Ding, J.; Li, J.; Xia, G.S. Align Deep Features for Oriented Object Detection. IEEE Trans. Geosci. Remote Sens. 2022, 60, 5602511. [Google Scholar] [CrossRef]
- Gorelick, N.; Hancher, M.; Dixon, M.; Ilyushchenko, S.; Thau, D.; Moore, R. Google Earth Engine: Planetary-scale geospatial analysis for everyone. Remote Sens. Environ. 2017, 202, 18–27. [Google Scholar] [CrossRef]
- Everingham, M.; Van Gool, L.; Williams, C.K.I.; Winn, J.; Zisserman, A. The Pascal Visual Object Classes (VOC) Challenge. Int. J. Comput. Vis. 2010, 88, 303–338. [Google Scholar] [CrossRef]
- Russakovsky, O.; Deng, J.; Su, H.; Krause, J.; Satheesh, S.; Ma, S.; Huang, Z.; Karpathy, A.; Khosla, A.; Bernstein, M.; et al. ImageNet Large Scale Visual Recognition Challenge. Int. J. Comput. Vis. 2015, 115, 211–252. [Google Scholar] [CrossRef]
- Zhou, Y.; Yang, X.; Zhang, G.; Wang, J.; Liu, Y.; Hou, L.; Jiang, X.; Liu, X.; Yan, J.; Lyu, C.; et al. MMRotate: A Rotated Object Detection Benchmark using PyTorch. In Proceedings of the 30th ACM International Conference on Multimedia, Lisbon, Portugal, 10–14 October 2022. [Google Scholar]
- Yang, J.; Liu, Q.; Zhang, K. Stacked Hourglass Network for Robust Facial Landmark Localisation. In Proceedings of the 2017 IEEE Conference on Computer Vision and Pattern Recognition Workshops (CVPRW), Honolulu, HI, USA, 21–26 July 2017. [Google Scholar] [CrossRef]
- Zhou, X.; Wang, D.; Krähenbühl, P. Objects as Points. arXiv 2019, arXiv:1904.07850. [Google Scholar]
- Han, J.; Ding, J.; Xue, N.; Xia, G.S. ReDet: A Rotation-equivariant Detector for Aerial Object Detection. In Proceedings of the 2021 IEEE/CVF Conference on Computer Vision and Pattern Recognition (CVPR), Nashville, TN, USA, 20–25 June 2021. [Google Scholar] [CrossRef]
- Pan, X.; Ren, Y.; Sheng, K.; Dong, W.; Yuan, H.; Guo, X.; Ma, C.; Xu, C. Dynamic Refinement Network for Oriented and Densely Packed Object Detection. In Proceedings of the IEEE/CVF Conference on Computer Vision and Pattern Recognition, Seattle, WA, USA, 13–19 June 2020. [Google Scholar] [CrossRef]
- Chen, Z.; Chen, K.; Lin, W.; See, J.; Yu, H.; Ke, Y.; Yang, C. PIoU Loss: Towards Accurate Oriented Object Detection in Complex Environments. In Computer Vision—ECCV 2020: Proceedings of the 16th European Conference, Glasgow, UK, 23–28 August 2020; Lecture Notes in Computer Science; Springer: Berlin/Heidelberg, Germany, 2020; pp. 195–211. [Google Scholar] [CrossRef]
- Qian, W.; Yang, X.; Peng, S.; Yan, J.; Guo, Y. Learning Modulated Loss for Rotated Object Detection. In Proceedings of the AAAI Conference on Artificial Intelligence, Online, 22 February–1 March 2022; pp. 2458–2466. [Google Scholar] [CrossRef]
- Ming, Q.; Zhou, Z.; Miao, L.; Zhang, H.; Li, L. Dynamic Anchor Learning for Arbitrary-Oriented Object Detection. In Proceedings of the AAAI Conference on Artificial Intelligence, Online, 22 February–1 March 2022; pp. 2355–2363. [Google Scholar] [CrossRef]
- Azimi, S.M.; Vig, E.; Bahmanyar, R.; Körner, M.; Reinartz, P. Towards Multi-class Object Detection in Unconstrained Remote Sensing Imagery. In Computer Vision—ACCV 2018: Proceedings of the 14th Asian Conference on Computer Vision, Perth, Australia, 2–6 December 2018; Lecture Notes in Computer Science; Springer: Cham, Switzerland, 2019; pp. 150–165. [Google Scholar] [CrossRef]
- Zhang, G.; Lu, S.; Zhang, W. CAD-Net: A Context-Aware Detection Network for Objects in Remote Sensing Imagery. IEEE Trans. Geosci. Remote Sens. 2019, 57, 10015–10024. [Google Scholar] [CrossRef]
- Li, C.; Xu, C.; Cui, Z.; Wang, D.; Zhang, T.; Yang, J. Feature-Attentioned Object Detection in Remote Sensing Imagery. In Proceedings of the 2019 IEEE International Conference on Image Processing (ICIP), Taipei, Taiwan, 22–25 September 2019. [Google Scholar] [CrossRef]
- Wang, J.; Yang, W.; Li, H.C.; Zhang, H.; Xia, G.S. Learning Center Probability Map for Detecting Objects in Aerial Images. IEEE Trans. Geosci. Remote Sens. 2021, 59, 4307–4323. [Google Scholar] [CrossRef]
- Fu, K.; Chang, Z.; Zhang, Y.; Sun, X. Point-Based Estimator for Arbitrary-Oriented Object Detection in Aerial Images. IEEE Trans. Geosci. Remote Sens. 2021, 59, 4370–4387. [Google Scholar] [CrossRef]
- Wang, J.; Ding, J.; Guo, H.; Cheng, W.; Pan, T.; Yang, W. Mask OBB: A Semantic Attention-Based Mask Oriented Bounding Box Representation for Multi-Category Object Detection in Aerial Images. Remote Sens. 2019, 11, 2930. [Google Scholar] [CrossRef]
- Cheng, G.; Wang, J.; Li, K.; Xie, X.; Lang, C.; Yao, Y.; Han, J. Anchor-Free Oriented Proposal Generator for Object Detection. IEEE Trans. Geosci. Remote Sens. 2022, 60, 5625411. [Google Scholar] [CrossRef]
- Hou, L.; Lu, K.; Xue, J.; Li, Y. Shape-Adaptive Selection and Measurement for Oriented Object Detection. In Proceedings of the AAAI Conference on Artificial Intelligence, Singapore, 13–24 June 2022. [Google Scholar]
- Li, Y.; Hou, Q.; Zheng, Z.; Cheng, M.M.; Yang, J.; Li, X. Large Selective Kernel Network for Remote Sensing Object Detection. In Proceedings of the 2023 IEEE/CVF International Conference on Computer Vision (ICCV), Paris, France, 1–6 October 2023; pp. 16748–16759. [Google Scholar] [CrossRef]
- Pu, X.; Xu, F. Low-Rank Adaption on Transformer-based Oriented Object Detector for Satellite Onboard Processing of Remote Sensing Images. arXiv 2024, arXiv:2406.02385. [Google Scholar]


Disclaimer/Publisher’s Note: The statements, opinions and data contained in all publications are solely those of the individual author(s) and contributor(s) and not of MDPI and/or the editor(s). MDPI and/or the editor(s) disclaim responsibility for any injury to people or property resulting from any ideas, methods, instructions or products referred to in the content. |
© 2024 by the authors. Licensee MDPI, Basel, Switzerland. This article is an open access article distributed under the terms and conditions of the Creative Commons Attribution (CC BY) license (https://creativecommons.org/licenses/by/4.0/).