Article

Detection of Stress Distribution in Surrounding Rock of Coal Seam Roadway Based on Charge Induction Principle

1
School of Environmental Science, Liaoning University, Shenyang 110036, China
2
Liaoning Key Laboratory of Mining Environment and Disaster Mechanics, Liaoning Technical University, Fuxin 123000, China
3
Institute of Disaster Rock Mechanics, Liaoning University, Shenyang 110036, China
*
Author to whom correspondence should be addressed.
Electronics 2024, 13(15), 3075; https://doi.org/10.3390/electronics13153075
Submission received: 21 June 2024 / Revised: 18 July 2024 / Accepted: 26 July 2024 / Published: 3 August 2024

Abstract

:
Rock burst is a worldwide prevention and control problem, and the main reason for its occurrence is the concentration of stress in the surrounding rock of the coal roadway. Therefore, it is of great significance to realize the rapid and accurate detection of the stress distribution in the surrounding rock of the roadway for the prevention and control of rock burst. Based on the principle of charge induction, this paper adopts a research method combining theoretical analysis and indoor and field tests to carry out a study on the charge induction detection of stress distribution of surrounding rock in coal seam roadways using the self-developed coal rock charge induction monitor. A theoretical analysis of the charge induction intensity in relation to the stress level is carried out. Indoor tests on the law of charge induction for graded loading of large sized coal samples are carried out. Field detection tests of the charge induction law at different drilling depths on the solid coal side and the large coal pillar side of the coal seam roadway are carried out. The results show a positive correlation between the charge signal intensity and the stress magnitude. The induced charge of coal samples has a tendency to increase with the increase in graded loading stress level. The magnitude of the induced charge can reflect the stress level of the coal body. On the solid coal side, the induced charge has a tendency of increasing and then decreasing with the increase in detection depth. The final results are in good agreement with the results of the drill chip method, which better reflects the distribution of the lateral support pressure of the roadway. On the side of the large coal pillar, the induced charge has a tendency to increase, then decrease, and then increase with the increase in probing depth, which is in good agreement with the distribution of lateral support pressure formed in the elastic core area of the large coal pillar. Therefore, the charge induction technology can be used as a fast, non-contact detection means for the partitioning and stress distribution of the roadway enclosure, which can provide guidance for the target prevention and controlling rock burst and for designing roadway support.

1. Introduction

After excavating an underground coal seam roadway, the stress equilibrium of the original rock is disrupted, resulting in stress redistribution. Consequently, the stress reduction zone, stress increase zone, and protolith stress zone emerge sequentially, corresponding to the fracture zone, plastic zone, and elastic zone, respectively [1,2,3,4,5,6]. Detecting the extent of the fracture and plastic zones in the surrounding rock allows for the determination of appropriate support parameters. Additionally, measuring the peak area of abutment pressure in the surrounding rock provides critical insights for predicting and preventing coal rock dynamic disasters. As a result, achieving a rapid and accurate detection of roadway surrounding rock partition and stress distribution holds significant scientific and engineering value.
In the past, the commonly used geophysical methods for detecting the stress or fracture zone of roadway surrounding rock include the acoustic wave method, electromagnetic method, geological radar method, seismic wave method, multi-point displacement meter method, borehole camera method, and resistivity method [7,8,9,10,11,12,13,14]. In recent years, with the development of science and technology, infrared detection technology, fiber grating sensing technology, and micro-current technology have been gradually applied to the stress detection of roadway surrounding rock [15,16,17,18,19]. The above methods reveal the stress detection mechanism of roadway surrounding rock from different angles, which greatly promotes the accurate detection of surrounding rock stress distribution. However, with the increasing depth of coal mining year by year, the geological conditions are becoming more and more complex, which are restricted by the degree of surrounding rock fragmentation, difficulty of pore formation, difference in rock mass electrical properties, underground electromagnetic interference, cost, influence of production, and other factors, so the above methods cannot be widely used [20]. Therefore, it is necessary to continuously explore new methods for the rapid and accurate detection of roadway surrounding rock stress under complex conditions.
Studies have shown that the deformation and failure process of coal body has charge generation due to piezoelectric effects, friction effects, micro-fractures leading to tip charge separation, and other reasons [21,22,23,24], and the abnormal change in charge signal is closely related to the stress process of the coal body. The charge signal generated by coal rock loading can be extracted and analyzed by a high-sensitivity charge acquisition system, thus forming a coal rock charge induction-monitoring method. This method has the advantages of non-contact, continuity, and strong anti-interference processing. Triantis et al. found a linear relationship between charge signal and deformation by applying uniform velocity stress to the rock during the application of the pressure stimulated currents (PSCs) technique [25,26,27]. Vallianatos et al. presented the MCD model for the generation of electric current in rocks under stress, which was influenced by the motion of charge bearing dislocations [28,29,30]. Pan et al. [31,32] used charge induction technology to predict rock burst and found that the higher the stress of the coal sample in the uniaxial compression process, the stronger the charge induction signal. The charge induction value measured in the field has a certain relationship with the stress level of the coal body. Zhao et al. [33,34] studied the time–frequency characteristics of the charge signal in the process of fault stick–slip instability. The amplitude of the charge signal is larger when the fault stick–slip occurs under high stress. Lyu et al. [35] studied the corresponding relationship between the charge signal and the energy accumulation and release of coal in the process of coal fracture and found that the induced charge intensity was positively correlated with the increase in dissipated energy and sudden increase in released energy. Wang Gang et al. [36,37] studied the corresponding relationship between stress and charge in the process of the uniaxial compression fracture of coal samples and found that there is a nonlinear coupling relationship between loading stress and cumulative charge, which can be characterized by polynomials. Ding Xin et al. [38] studied the mechanical characteristics and charge signal characteristics of the coal sample failure process under different loading paths.
In summary, the amplitude of the charge induction signal can reflect the stress level of the coal body, but whether it can be used for the stress detection of the surrounding rock of the roadway has not been studied. Based on this, this paper adopts the research method of combining indoor and field tests. Firstly, according to the stress distribution characteristics of surrounding rock in underground coal seam mining, the charge induction law test of the coal body grading loading process is carried out to explore the sensitivity of charge signal to different stress levels. On this basis, the charge induction law test of different drilling depths on the solid coal side and large coal pillar side of the coal seam roadway was carried out to detect the stress distribution of the surrounding rock of the roadway and compared with the detection results of the drilling cuttings method. The research results can provide a new method for the stress distribution of roadway surrounding rock and the depth detection of the plastic zone and provide guidance for the prevention and control of coal rock dynamic disasters.

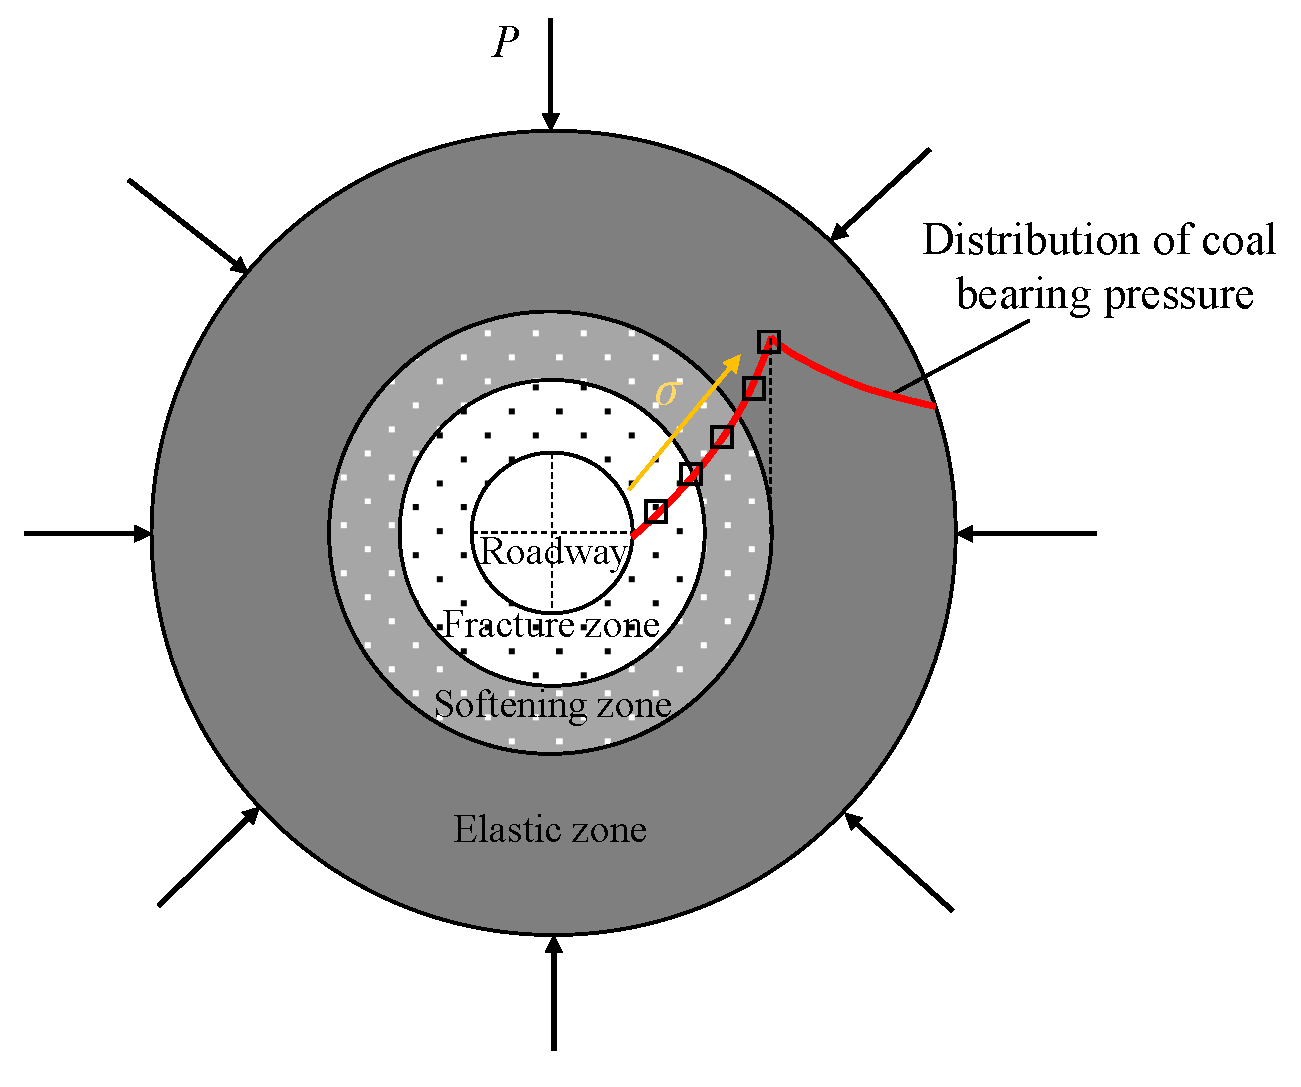
2. Stress Distribution in Coal Body Mining

Underground roadway excavation or coal seam mining will redistribute the stresses in the protoliths and form a coal body crushing area, fractured area, and plastic area sequentially in the space around the roadway and in front of the workings, as shown in Figure 1. Different areas of the coal body in space presents different stress levels; from the crushing area to the fractured area and then to the plastic area coal body, stress gradually increases, forming the roadway lateral support pressure increase area and the working face over the support pressure increase area, as shown in Figure 2. The coal body in the plastic area in front of the working face will gradually evolve into the fractured area and crushing area in time with the continuous mining of the coal seam, and the stress level of the coal body in this process will also gradually increase. Therefore, the surrounding rock of the roadway and the coal body in front of the working face are always under constant load or change from one load level to another load level under the action of mining. When the stress level of the coal body reaches the critical stress of rock burst disaster, rock burst disaster will occur.

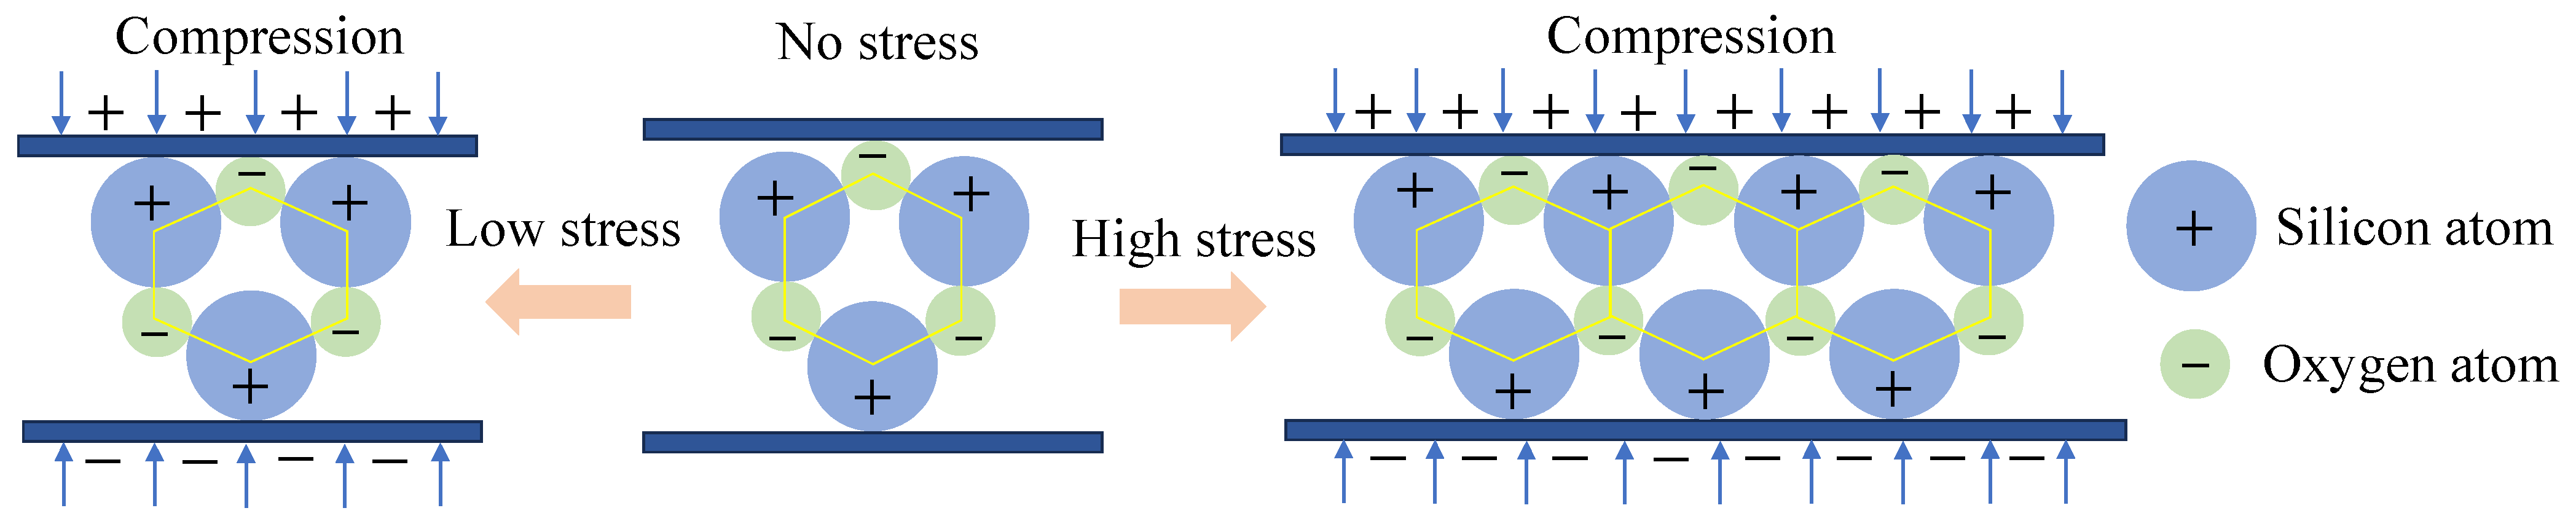
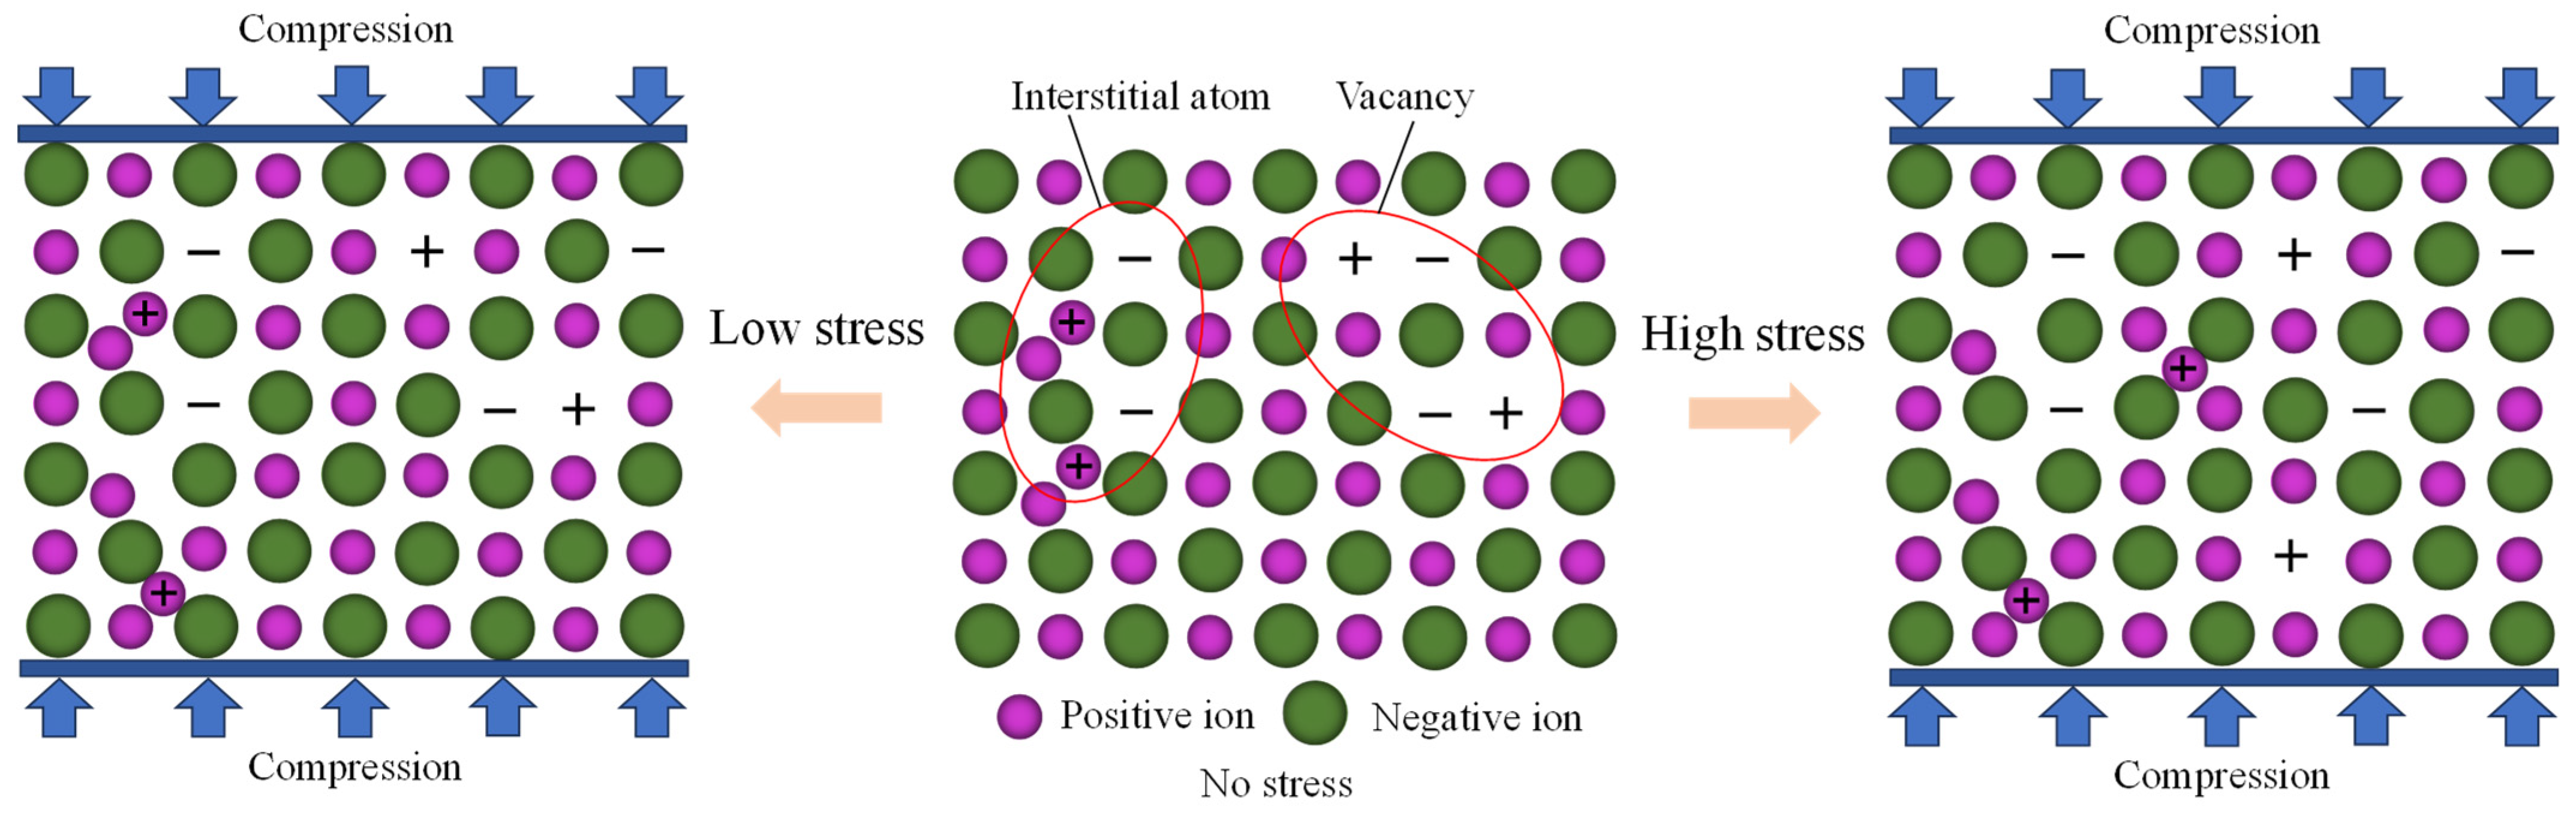
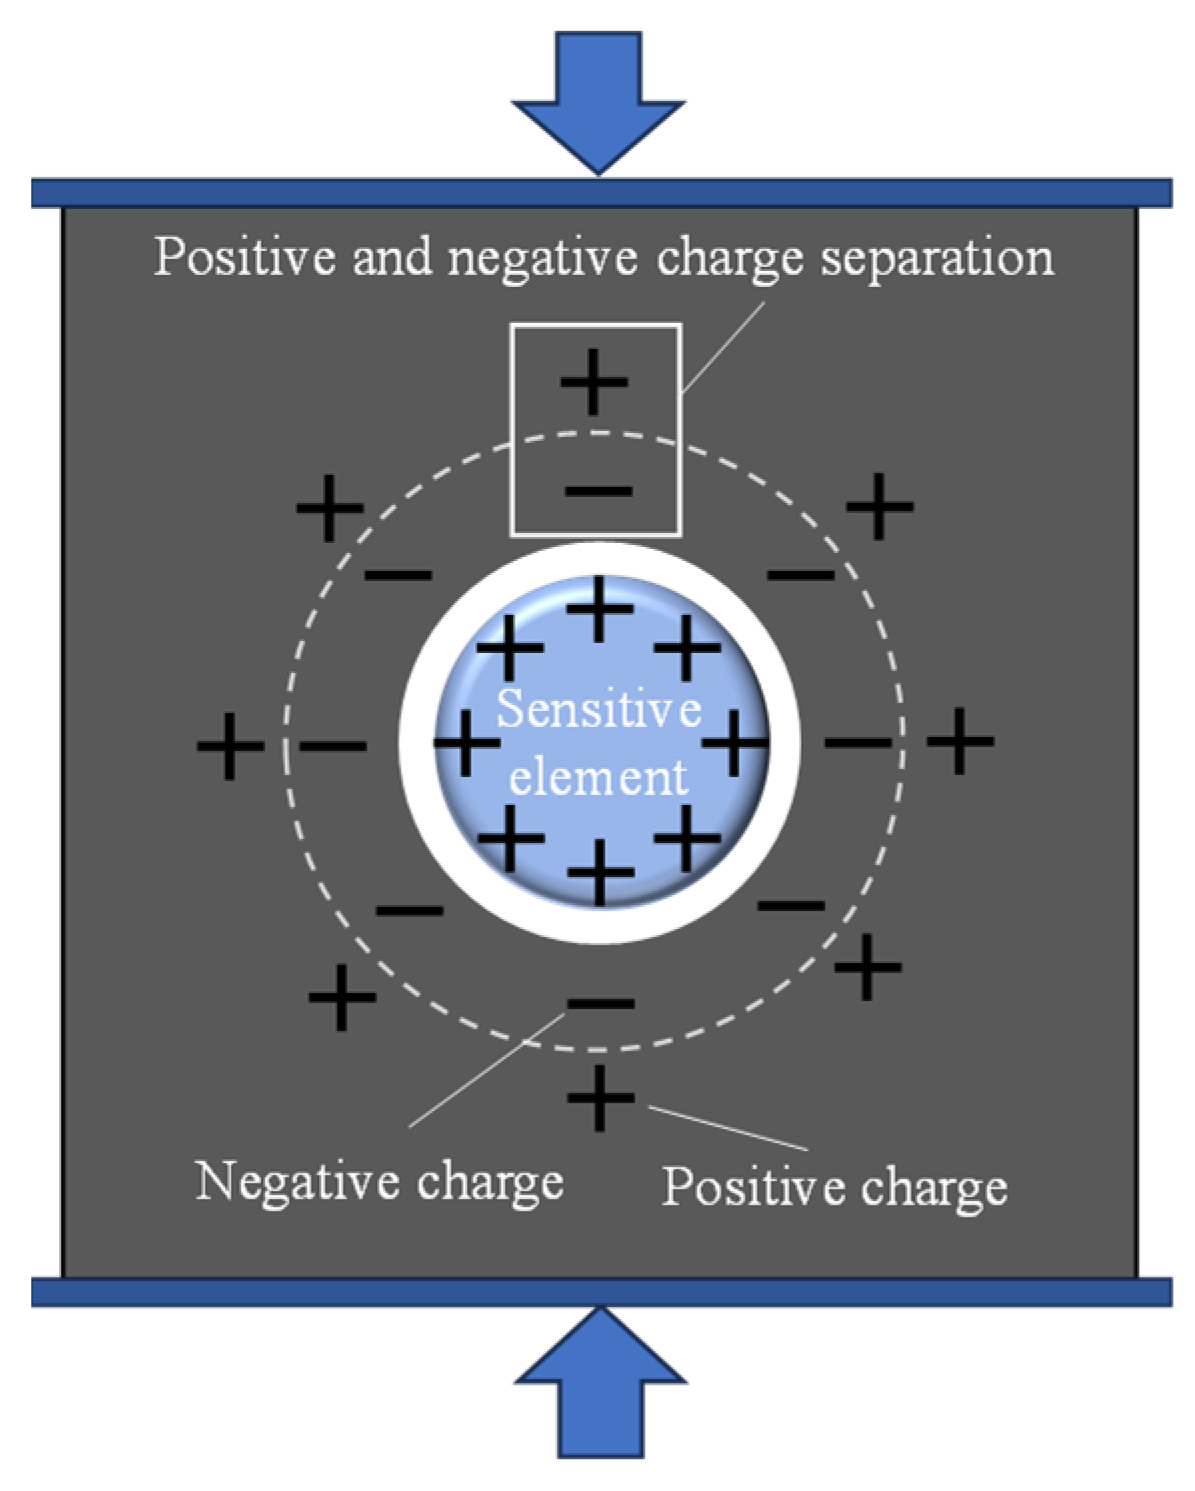
3. Mechanism of Charge Generation in Stress-Activated Coals

The mechanism of coal rock charge generation due to stress involves several phenomena, including the piezoelectric effect, dislocation theory, frictional electrification, and charge separation during crack propagation. The piezoelectric effect occurs when certain crystalline materials, such as quartz, are deformed by an external force, causing internal polarization and the appearance of positive and negative charges on opposite surfaces. As illustrated in Figure 3, when quartz is unstressed, the charges of each atom are balanced. Under stress, the crystal structure deforms, altering the relative positions of positive and negative ions, which results in negative charges at the upper end and positive charges at the lower end. The greater the stress, the stronger the piezoelectric effect and the higher the accumulation of surface charges. A certain amount of silicon dioxide is contained in different coal bodies, and the charge is generated during the loading process due to the piezoelectric effect.
Dislocation is a special configuration of crystal atom arrangement and a defect inside the crystal. There are many dislocations in coal rock materials. Due to their original deformation, dislocations with charges have been generated. These dislocations are neutralized by point defects with opposite charges under static conditions. When stress is applied, dislocations begin to move. The movement speed is much larger than the original neutral point defect, resulting in polarization and charge separation, as shown in Figure 4. The larger the stress level, the faster the dislocation moves and the greater the charge separation.
Coal and rock materials are composed of mineral particles, other minerals, and cements. These different substances are mainly connected by weak van der Waals forces. Under the action of stress, sliding and dislocation will occur between the mineral particles of coal and rock, and an electric dipole layer will be formed at the interface of the two substances. If the two objects are separated quickly, the charge on both sides of the electric dipole layer will not disappear completely, resulting in excess negative charge at one end and positive charge at the other end, forming charge separation. The larger the stress level is, the stronger the friction effect is and the greater the surface accumulated charge is.
The crack propagation of coal and rock materials will destroy the chemical bonds between the atoms at the crack front, including covalent bonds, ionic bonds, molecular bonds, hydrogen bonds, etc. These chemical bonds are combined together due to the interaction of electricity, and the broken bonds will become dangling bonds with different charges on both sides of the fracture wall, forming charge separation. Under the action of low stress, the crack mainly propagates along the grain boundary, and the propagation is mainly carried out at the edge of the particle. Under the action of high stress, the crack propagates through the grain boundary, which will cause the rupture of the strong chemical bond to produce a large amount of electricity. Kirikaev et al. [24] measured the electric field of granite columnar samples under uniaxial compression and found that the field values were linearly related to the applied stress, as shown in Figure 5.

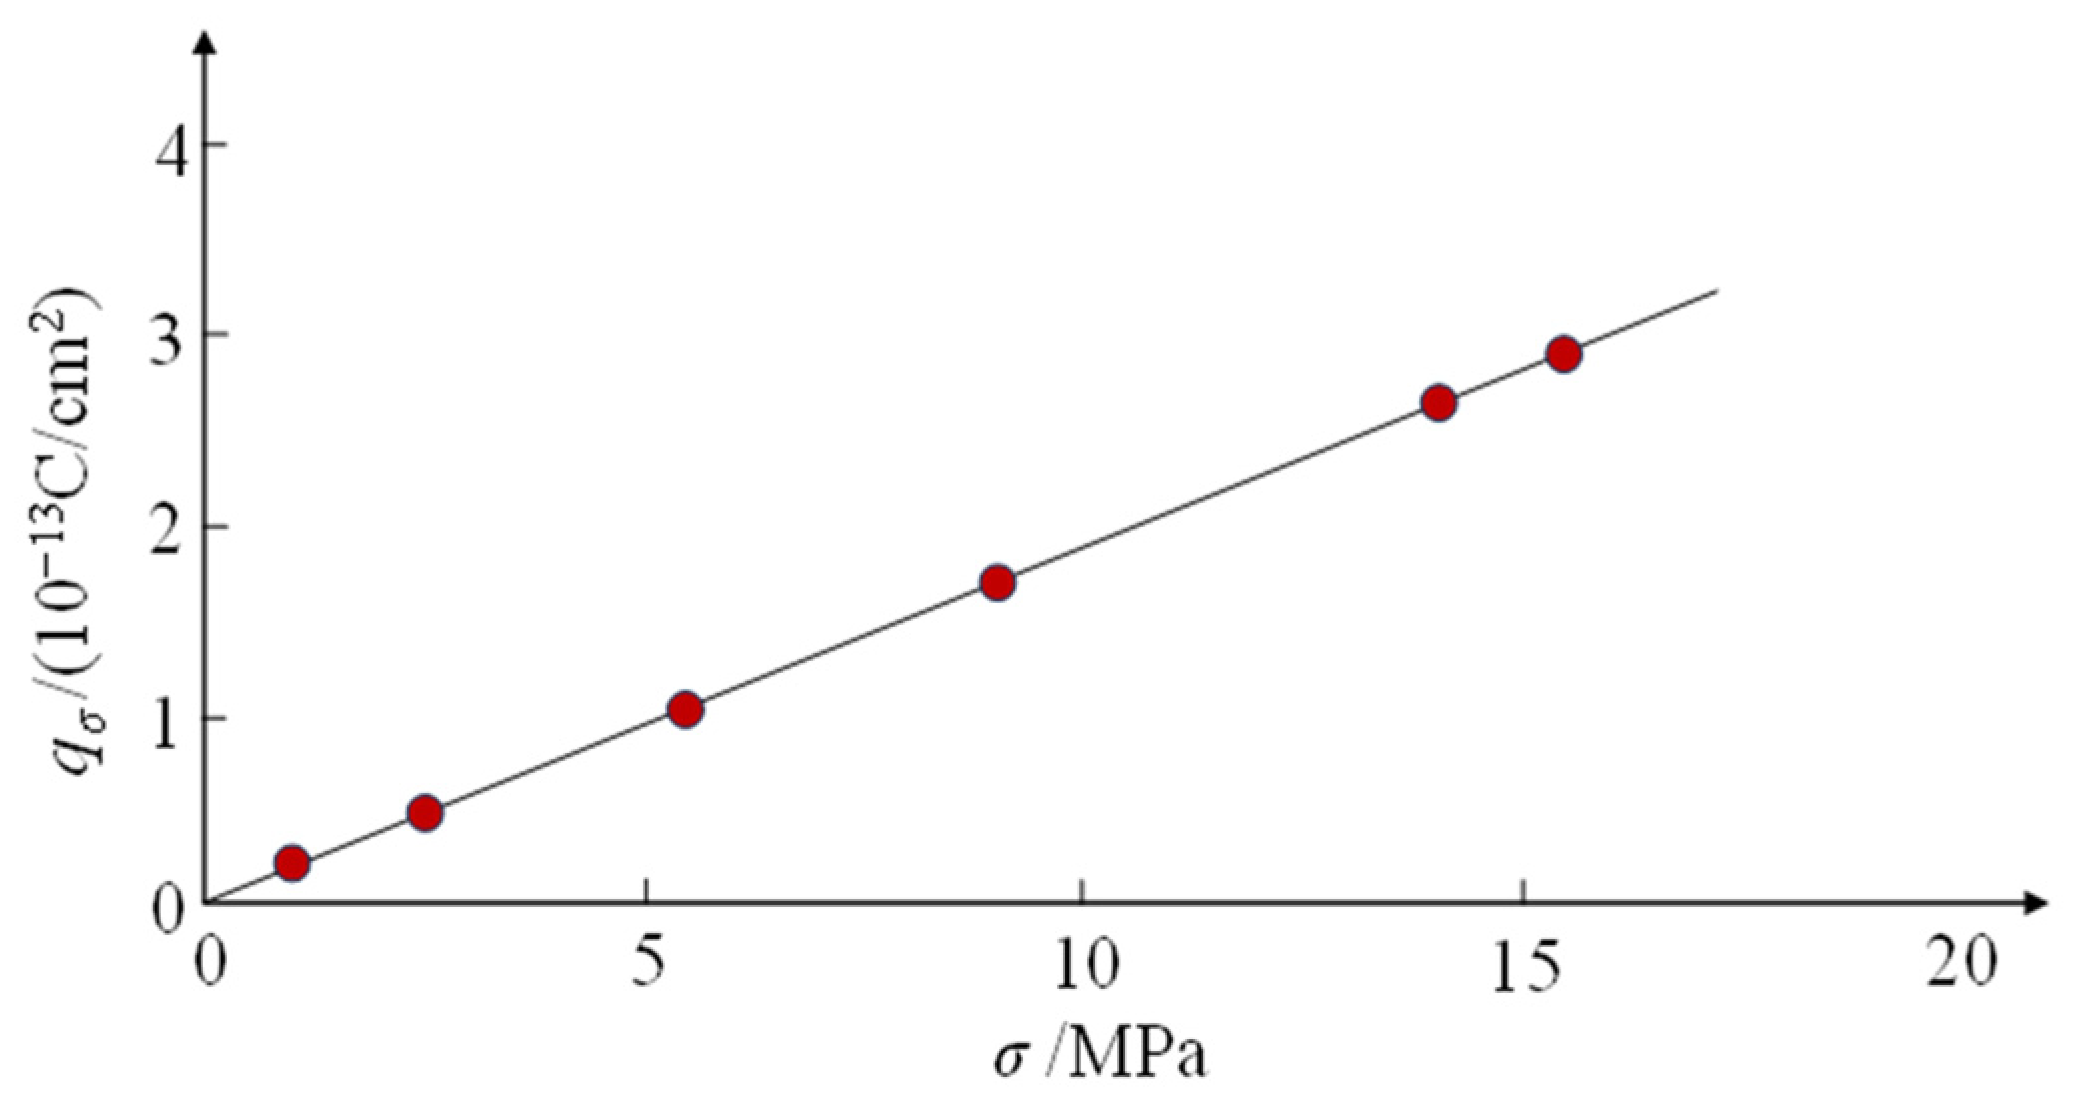
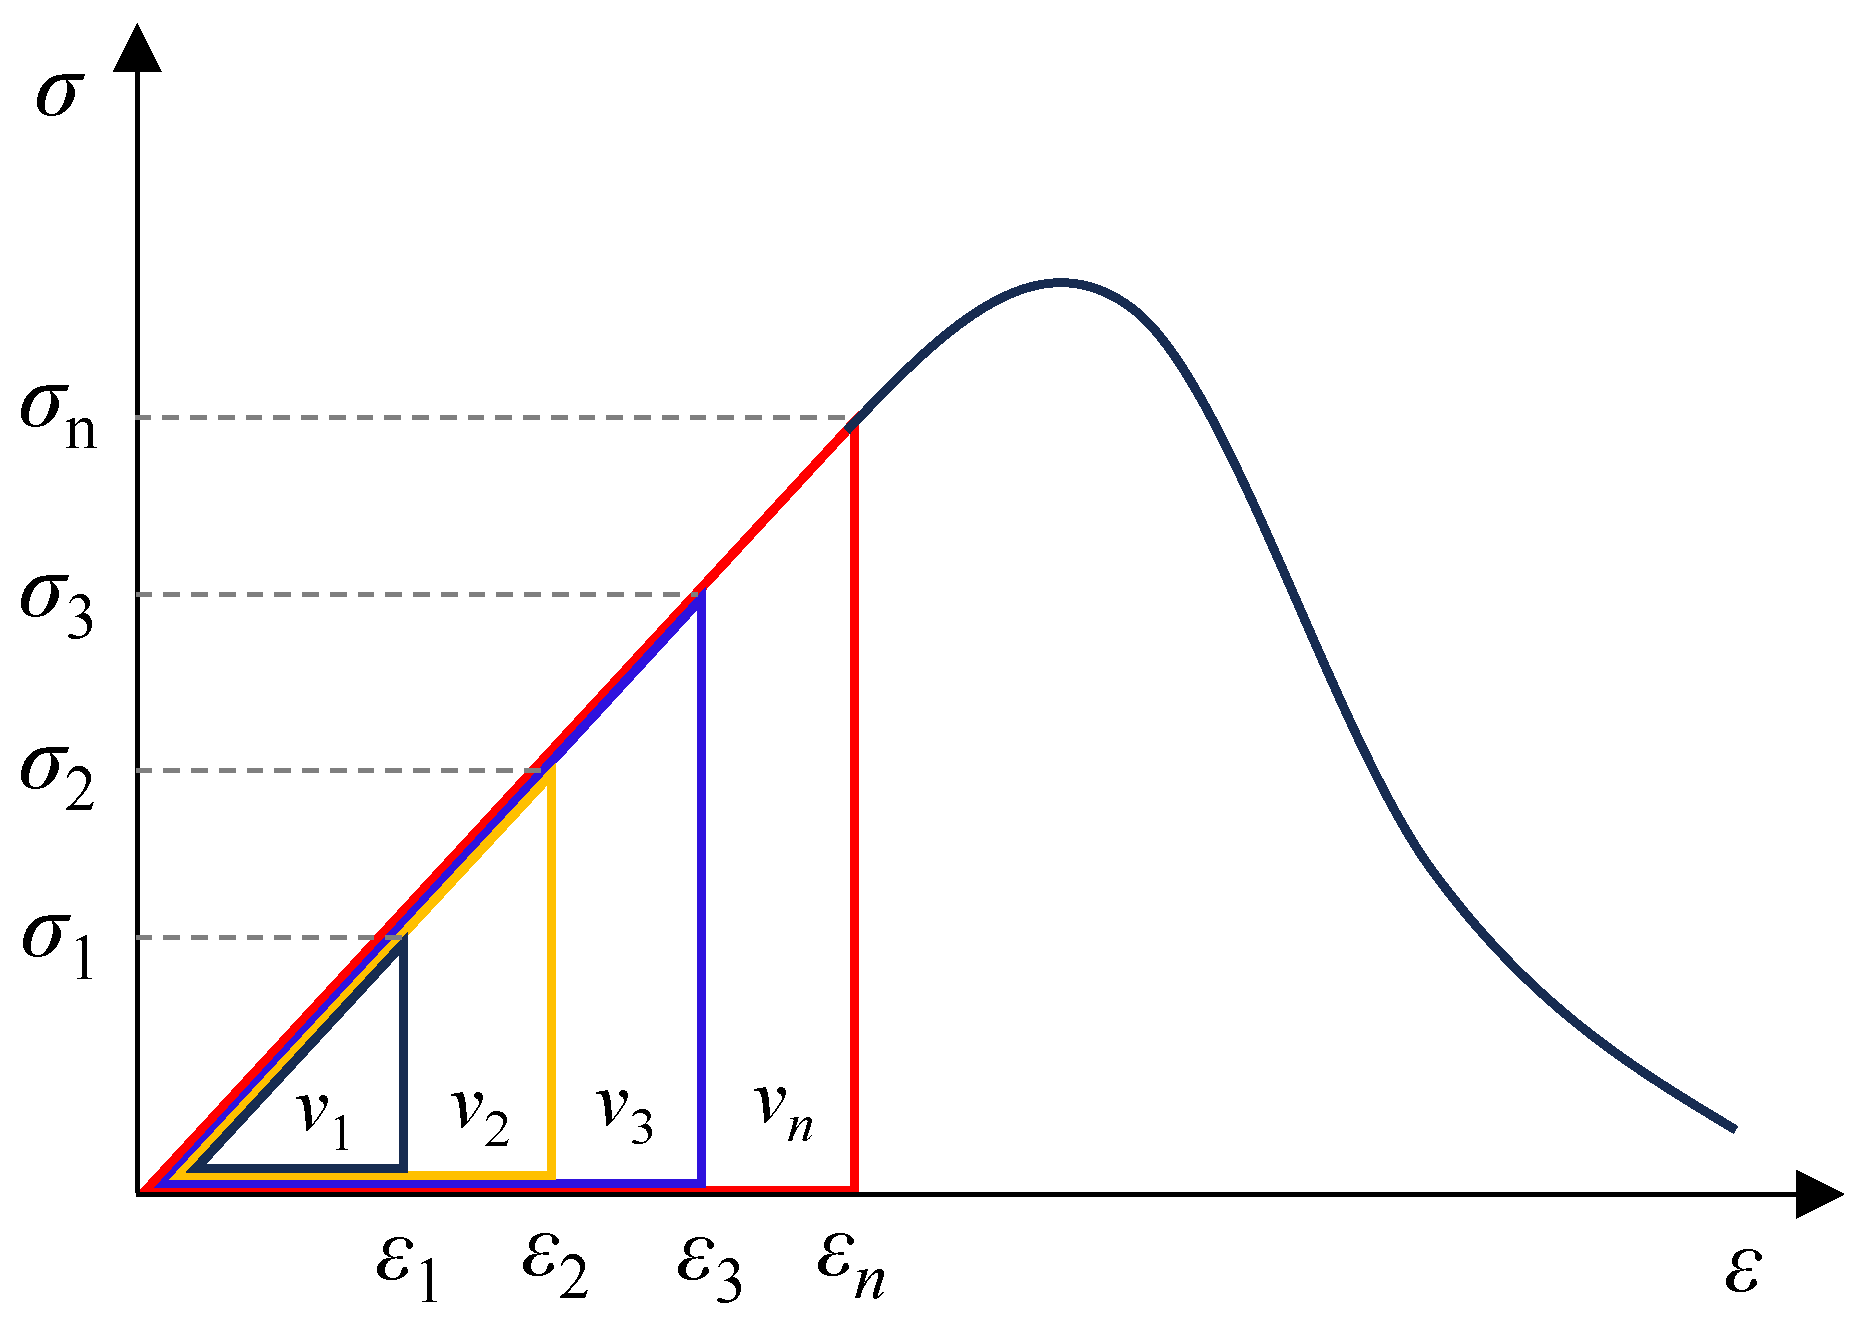
4. Theoretical Analysis of the Relationship between Charge Induction Intensity and Stress Level

Through the above analysis, external loads on the coal body generate free electrons. The movement of these electrons alters the potential of fracture surfaces, subsequently affecting the electric field intensity around the coal body and significantly changing the electric field energy. The piezoelectric effect, degree of dislocation, frictional effects, and microcrack propagation during loading are closely linked to the elastic energy accumulated within the coal volume. Studies [35,39] have explored the relationship between charge signals and the energy accumulation and release in coal during loading, finding a positive correlation between induced charge intensity and the release of elastic energy. The greater the energy accumulated during the pre-peak stage of coal loading, the more strain energy is released. Thus, the electric field energy around a coal body under external loading is positively correlated with the accumulated elastic energy. Figure 6 shows the elastic energy densities accumulated in coal volumes under different stress levels during the pre-peak phase of uniaxial loading.
The expression for the elastic energy density of the coal body under the action of different stress levels during the pre-peak stage of uniaxial loading is given by [35]
ν = σ ε 2 = σ 2 2 E
In Equation (1), v is the coal body elastic energy density; σ is the coal body stress; ε is the coal body strain; and E is the coal body elastic modulus.
Normally, the uniform intensity electric field energy density ω is [39]
ω = β e 2 2
In Equation (2), ω is the energy density of the uniform intensity electric field; β is the dielectric constant; and e is the electrostatic field strength at a certain moment.
According to the positive correlation between the energy of the electric field around the coal body and the accumulated elastic energy,
ω v
β e 2 2 σ 2 2 E
e σ
In summary, it is suggested that the electric field strength of the coal body under external loading is positively correlated with the stress level. This also implies that the induced charge strength increases with the stress level, which is in alignment with the experimental findings reported in the literature [24,36].

5. Charge Induction Law Test for Graded Loading Coal Bodies

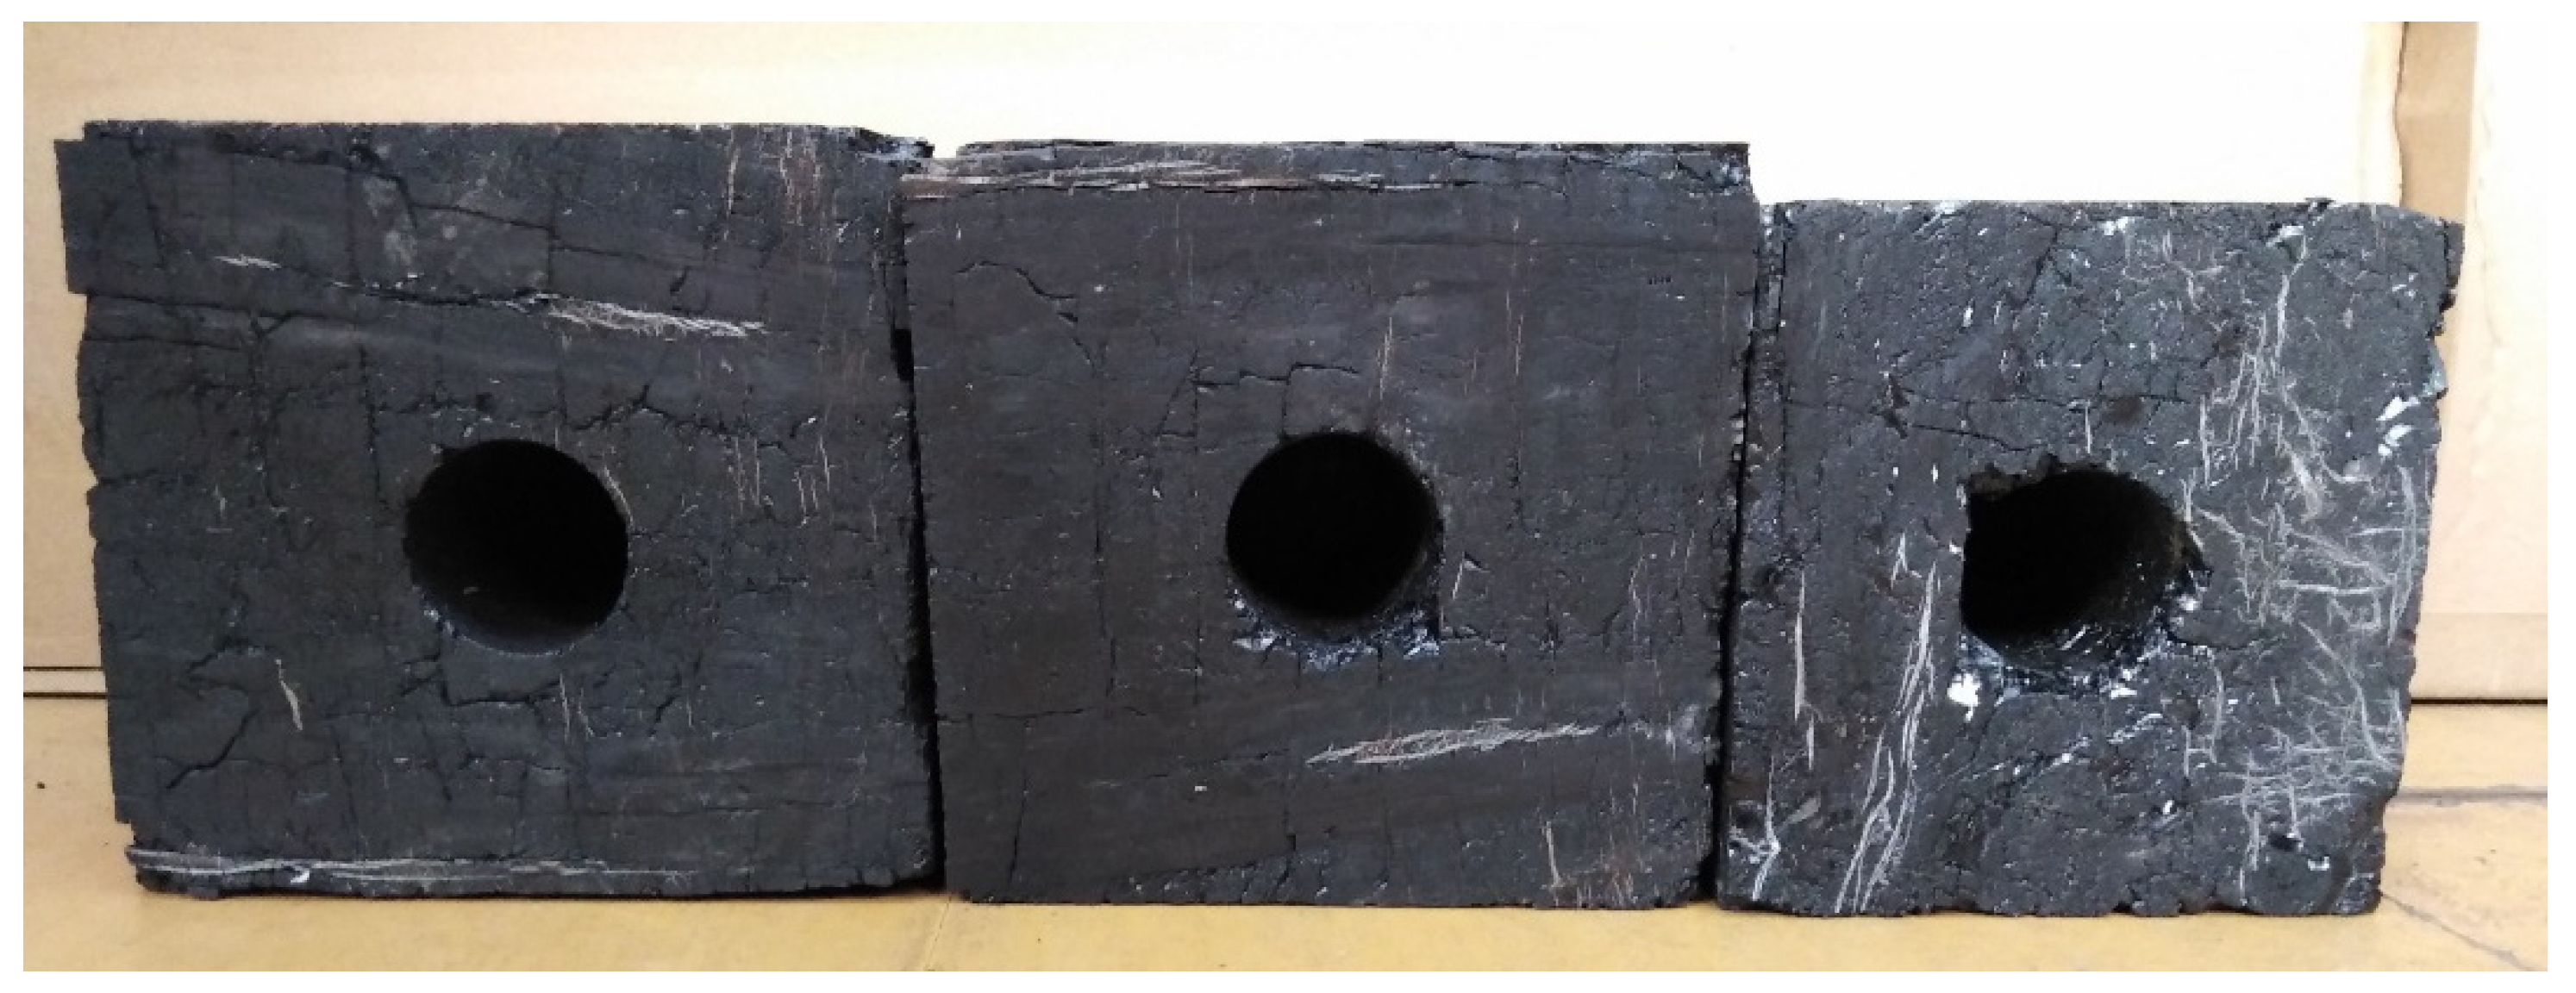
5.1. Specimen Preparation

The raw coal used in the test was from a mine in China. Before the test, in order to reduce the damage degree of the borehole to the coal body, a large block of raw coal was selected to prepare a square regular coal sample with a length, width, and height of 14~16 cm. As shown in Figure 7, a circular monitoring borehole with a diameter of 4 cm and a depth of 7 cm was drilled in the center of the coal sample to approximate the equivalent on-site charge-monitoring borehole.

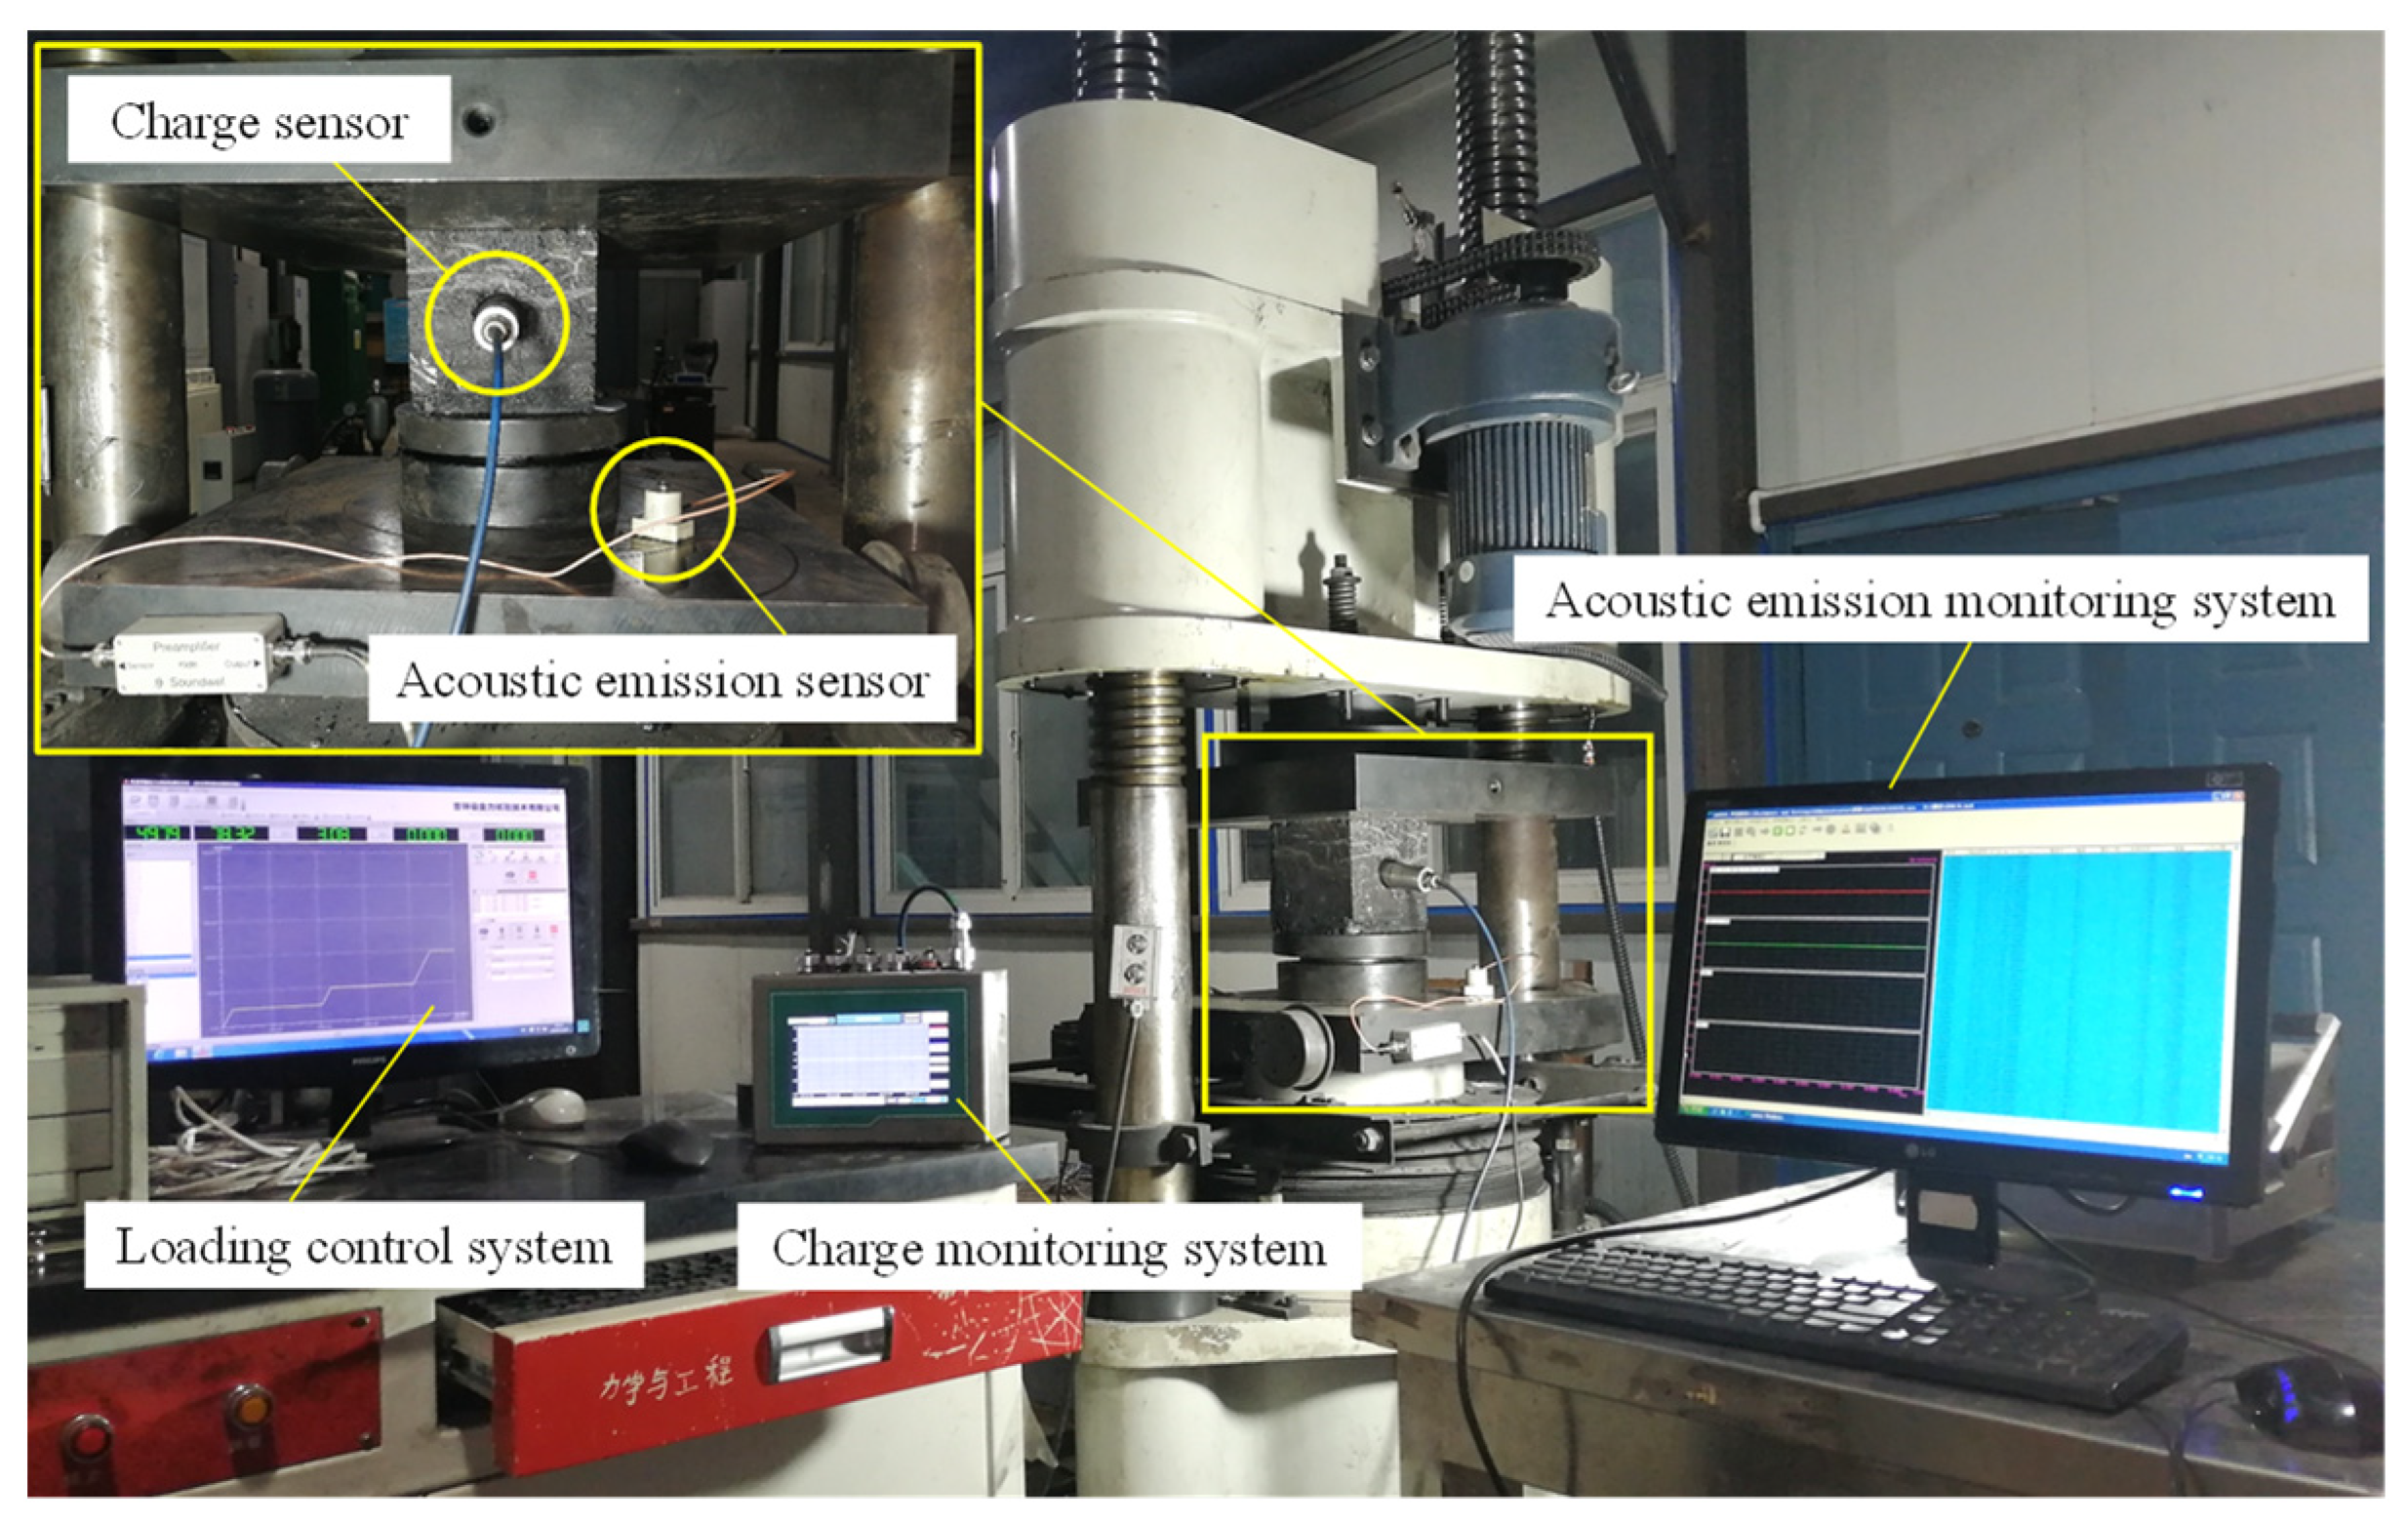
5.2. Experiment System

The test system included a loading system, a charge-monitoring system, and an acoustic emission monitoring system, as shown in Figure 8. The loading system was a YAW-2000 hydraulic universal testing machine with a maximum axial load of 2000 kN. The charge-monitoring system is a self-developed portable coal rock charge detector, which mainly consists of a charge-sensing probe and a data collector [40]. The acoustic emission monitoring system was the SAEU2S acoustic emission monitoring system produced by Beijing Shenghua Xingye Technology Company Limited of China (Beijing, China of company), which mainly consists of acoustic emission sensors and data collectors. Sensor frequency was 10 to 1000 kHz, the sensitivity peak was >75 dB, the parameter and waveform threshold were both 40 dB, the main amplifier gain was 20 dB, and the sampling point was 1024.

5.3. Experiment Methods and Steps

The test loading type was graded loading, the loading method was force loading, the loading rate was 0.1 kN/s, the loading level was set to 1 MPa, 2 MPa, 4 MPa, 6 MPa, 8 MPa, and the constant load time of each stage was about 30 min. During the test, the charge sensor was fixed in the monitoring hole, and the sensor’s sensitive element was not in contact with the coal body. The charge induction diagram is shown in Figure 9, and the charge signal monitoring frequency was 2000 Hz. In order to prevent the influence of coal sample deformation on the acoustic emission probe, the acoustic emission probe was fixed on the base of the press, and the acoustic emission monitoring frequency was 3 MHz.
The specific test steps are as follows:
(1) Install all test equipment and make sure that the equipment operates normally.
(2) Put the coal sample into the shielded cylinder and put insulating paper between the sample and the indenter to prevent the charge from overflowing. Debugging equipment and setting parameters.
(3) Start the loading system first and then the charge-monitoring system.
(4) Save the test results. Take photos of coal sample destruction and process the data.

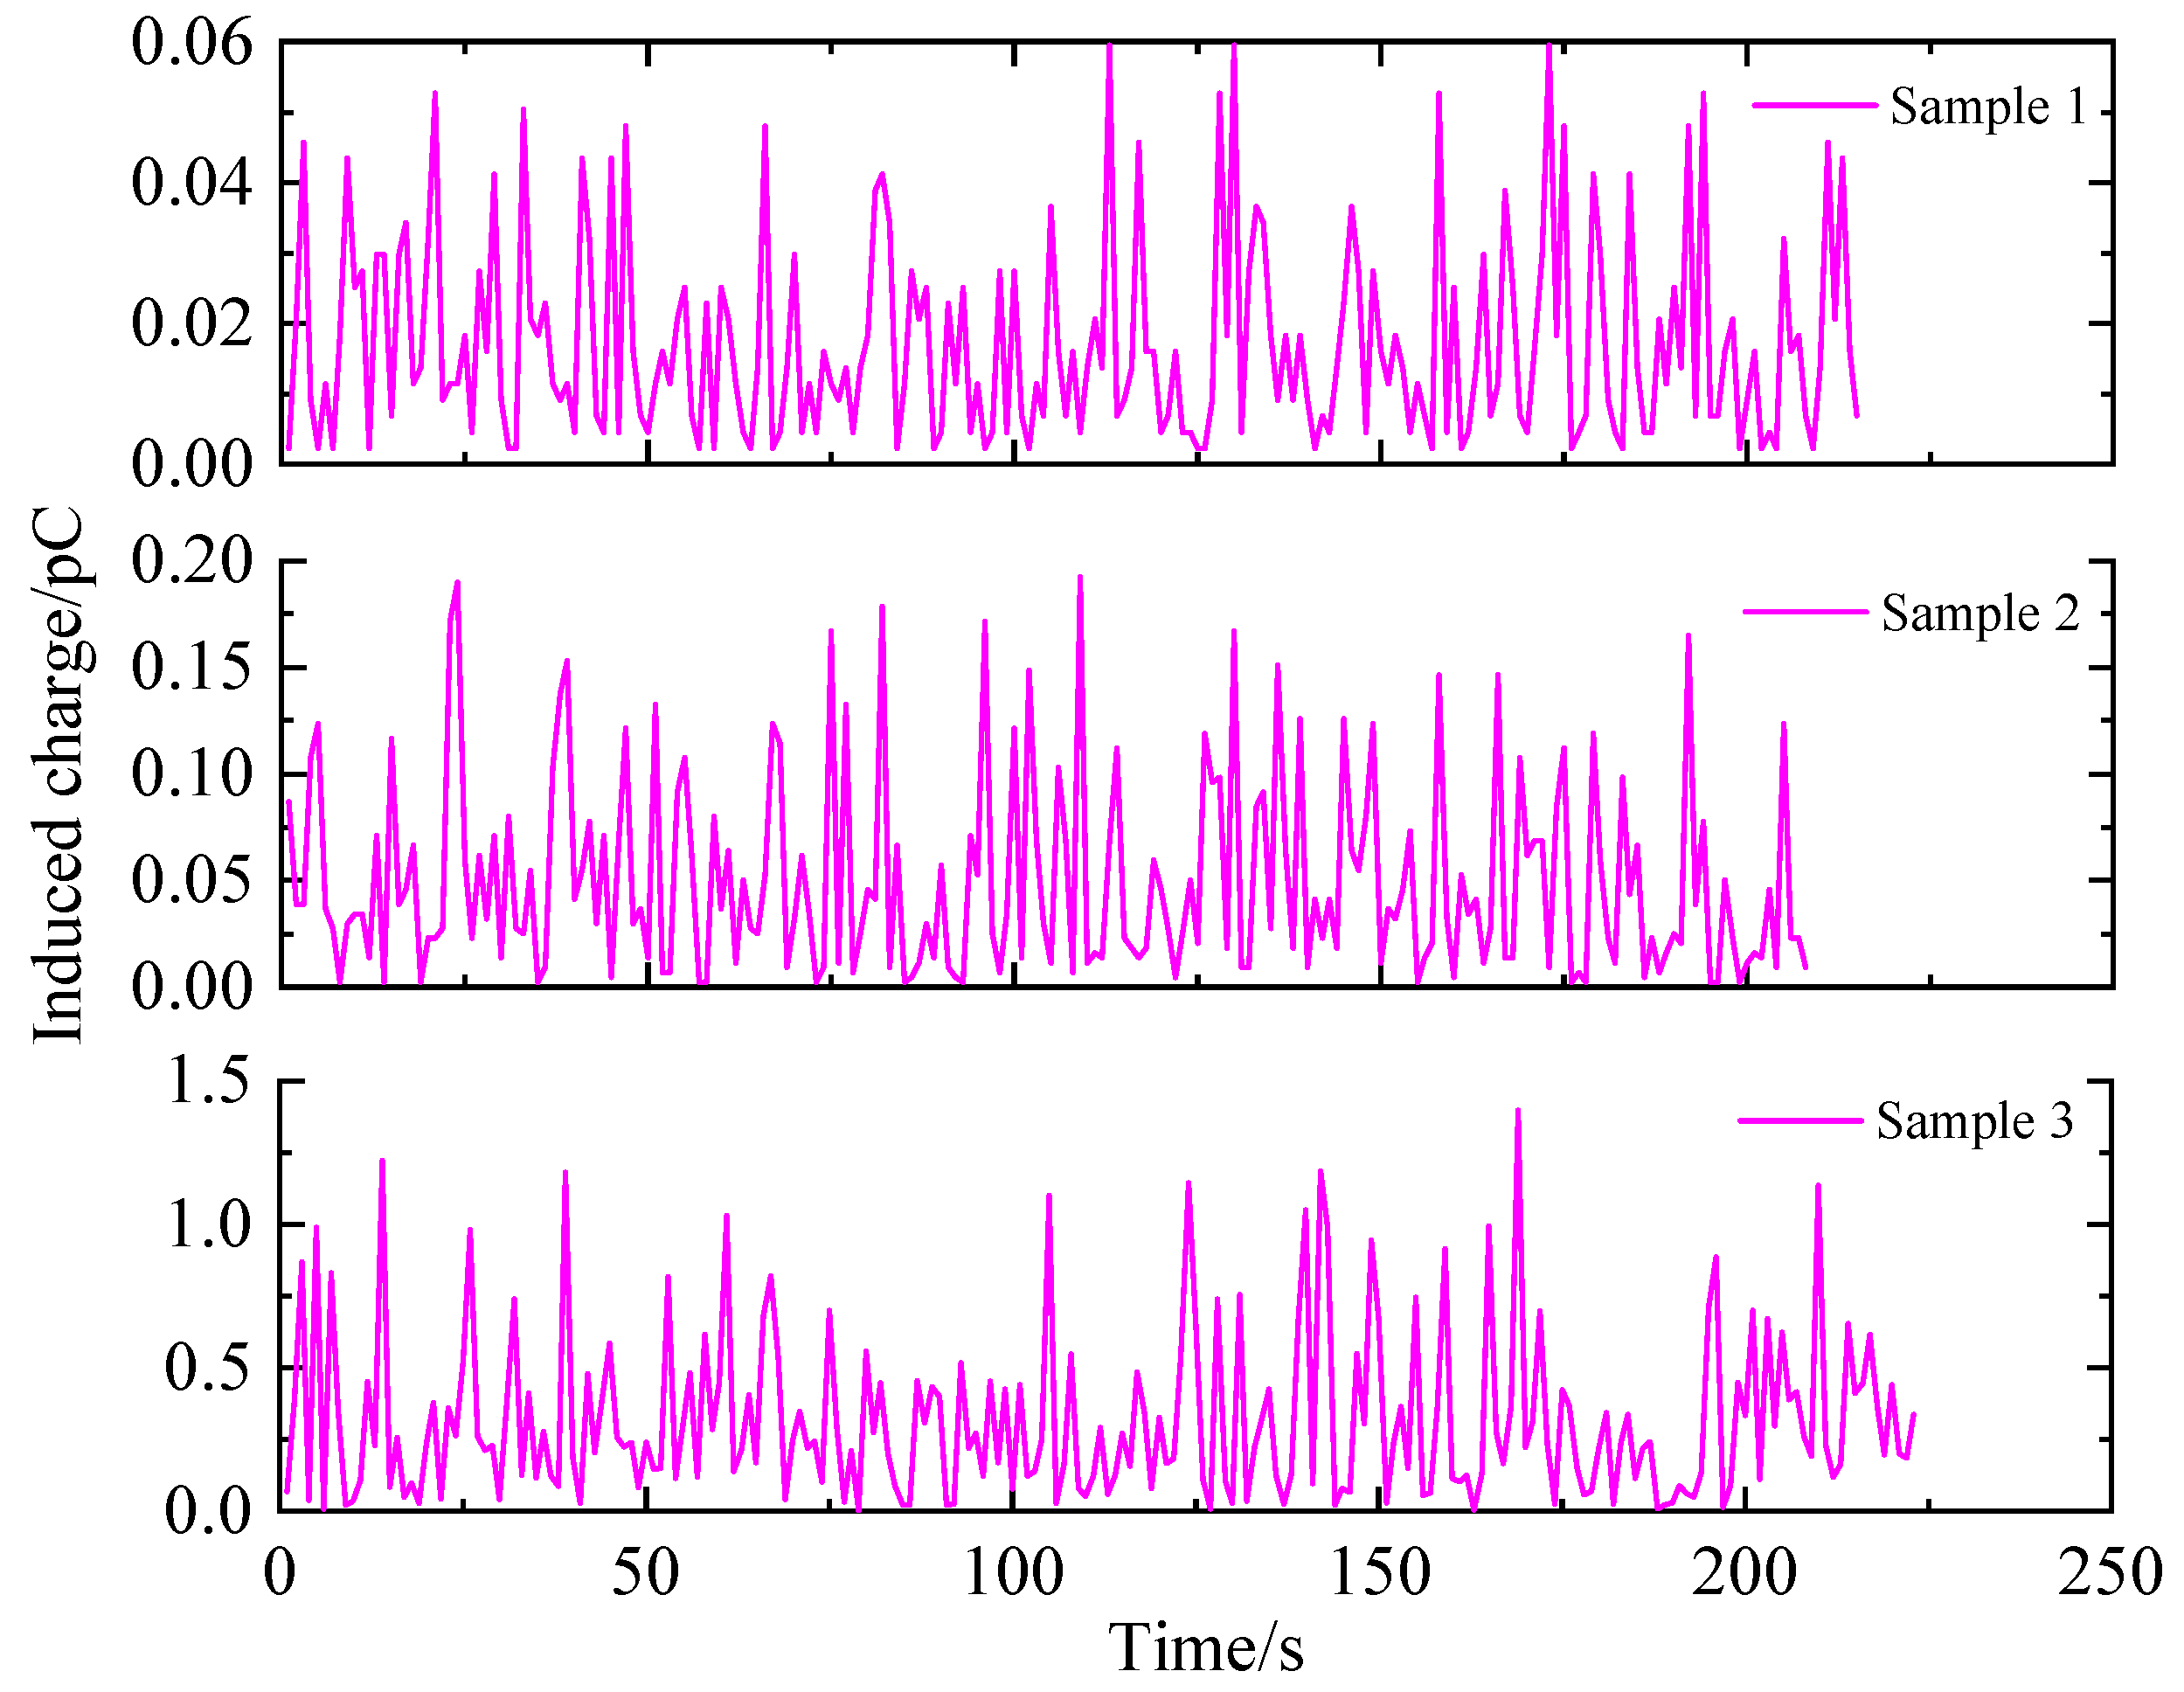
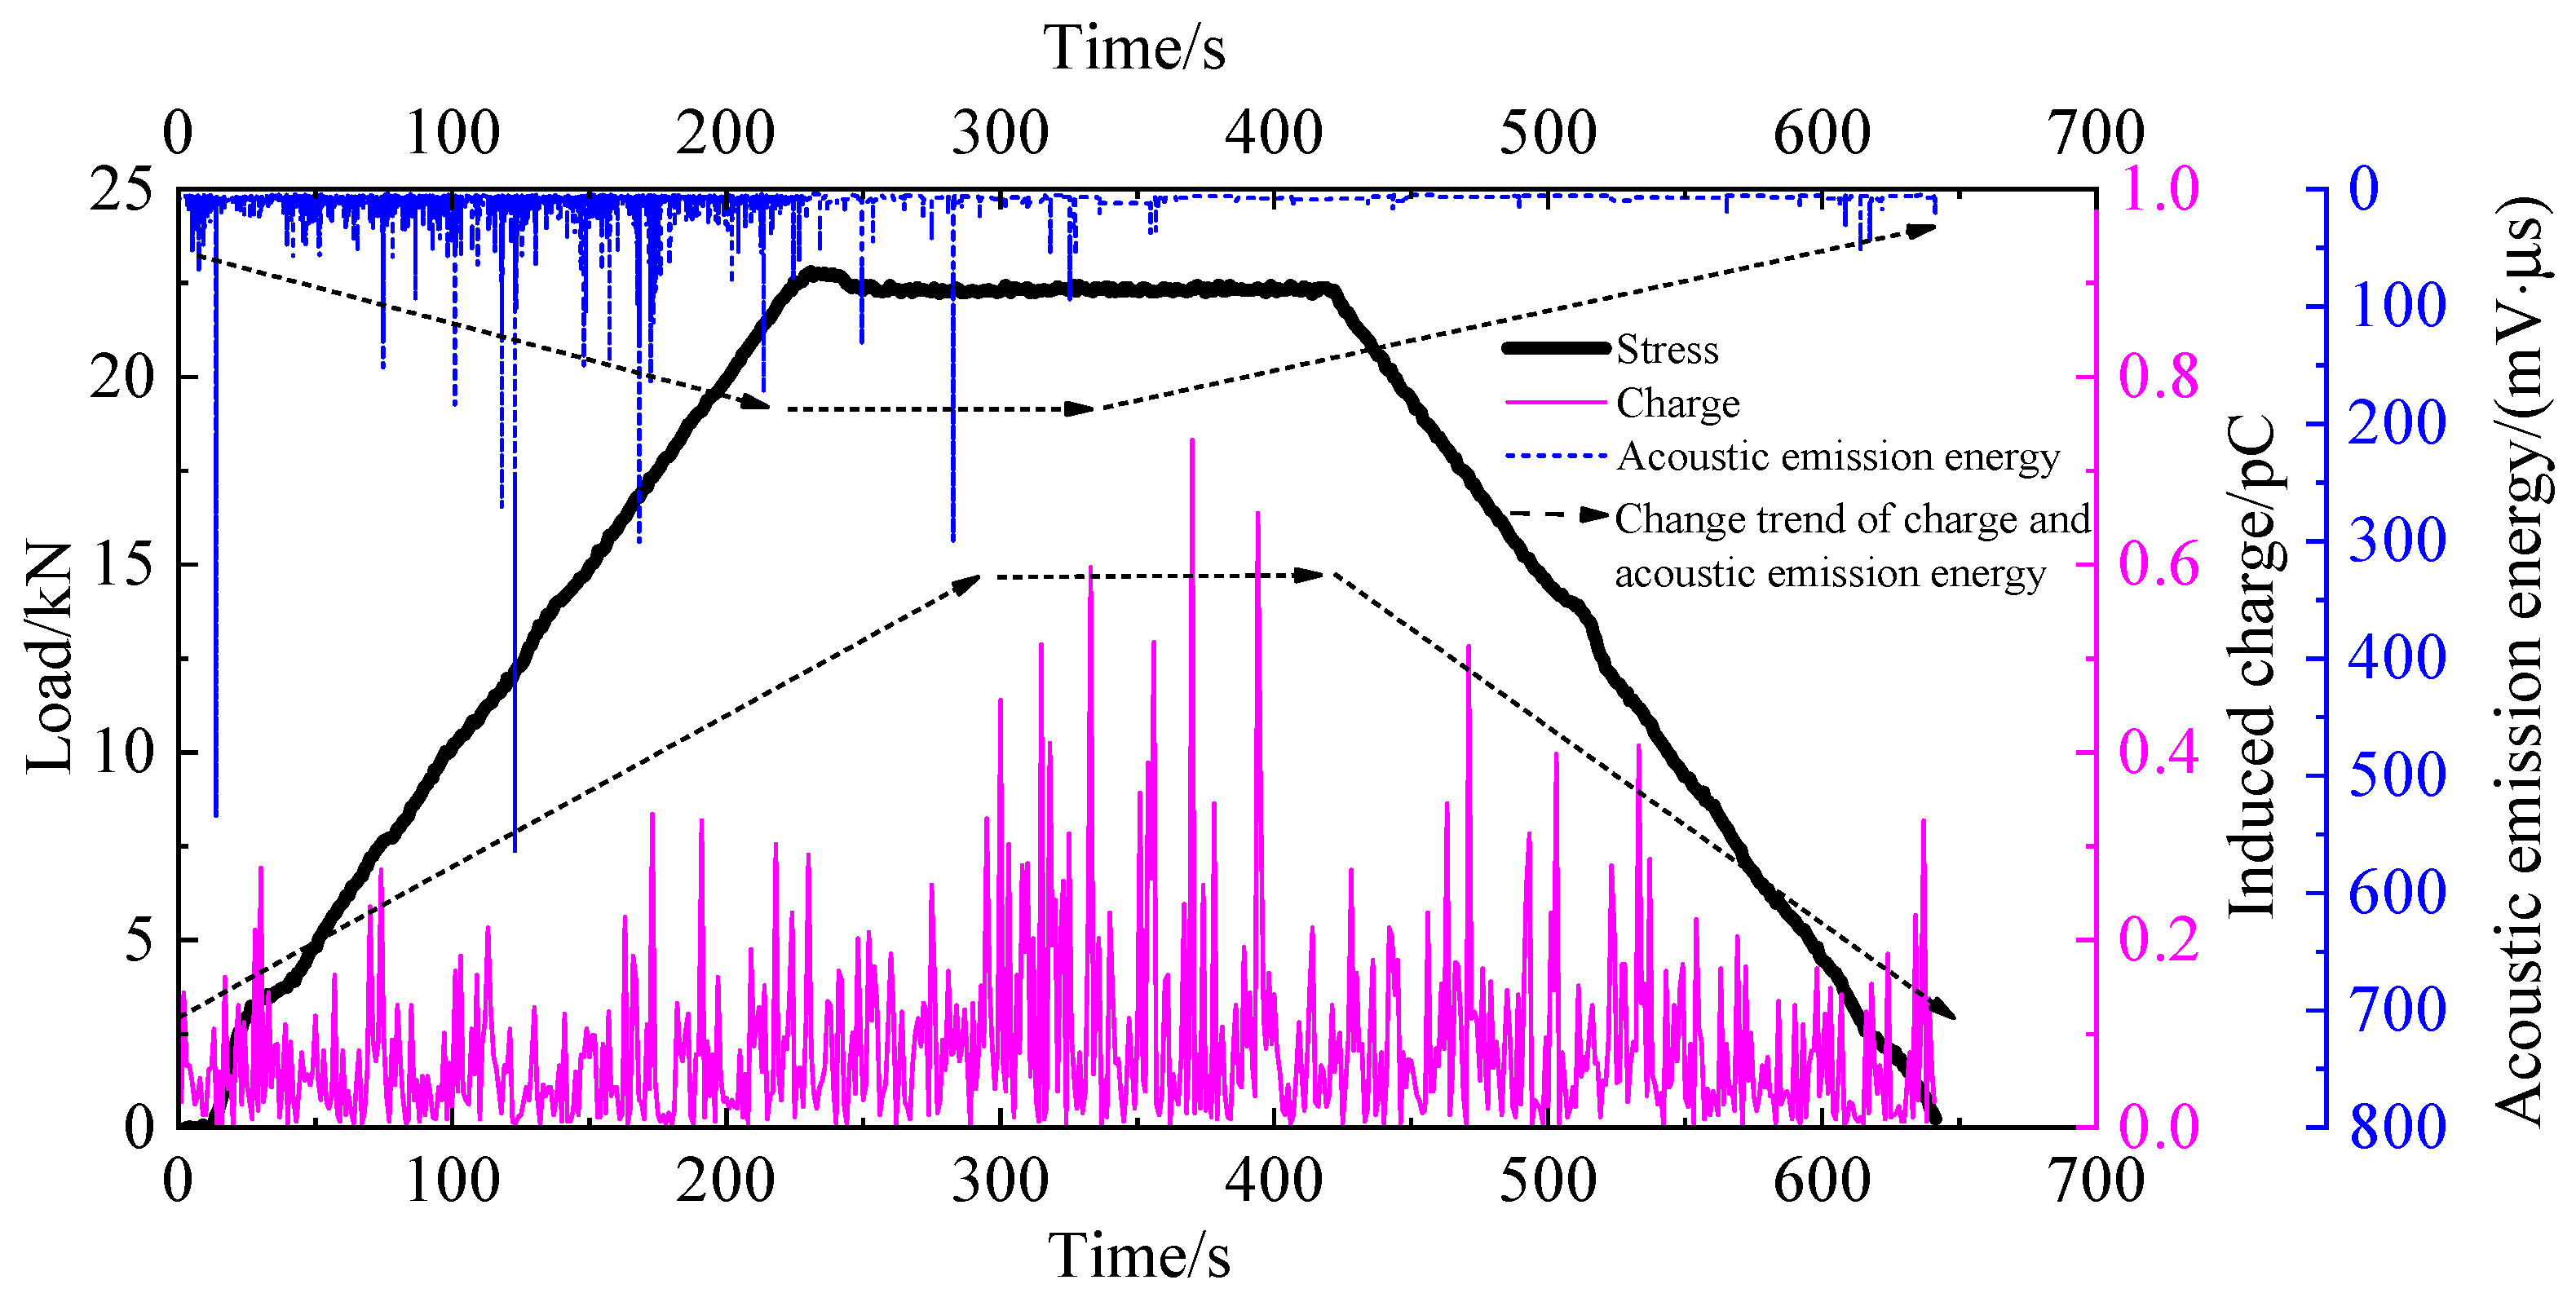
5.4. Test Results and Analyses

The results of the charge signal in the internal monitoring hole of the coal sample without external load are shown in Figure 10. It can be seen that without external force, the noise effect around the coal sample borehole causes the sensor to sense the noise signal, which has a low amplitude and steady fluctuation.
The characteristics of charge and acoustic emission signals during the loading and unloading process are shown in Figure 11. Firstly, the sample is loaded to 23 kN, then the load is kept constant, and finally, the load is unloaded to 0 kN. In the loading stage, the amount of induced charge and acoustic emission energy tend to increase gradually. In the constant load stage, the amount of induced charge remains large, while the acoustic emission energy is small. In the unloading stage, the induced charge and acoustic emission energy gradually decrease. Therefore, the magnitude of induced charge and acoustic emission energy is in good agreement with the magnitude of stress, and the charge induction signal is more sensitive to high stress level.
The results of the charge induction signal and acoustic emission signal of coal samples in the process of graded loading are shown in Figure 12. With the increase in the stress level of coal samples, the amount of induced charge of each sample has a significant increasing trend. The change in charge signal has a close correlation with the increase in stress level, but the change law of the charge signal of each sample has its own characteristics. In the first stage of the loading and dead load process, the induced charge of sample 1 is large. The reason for this is that in the initial stage of loading, the sample is in the compaction stage, and the pore cracks in the sample are closed. In this process, a large number of friction dislocations occur between coal particles, and a charge is generated. In the second and third stage of loading and in the dead load stage, the charge signal is relatively stable. When the stress level of the coal sample is loaded from 4 MPa to 6 MPa, the amount of induced charge increases suddenly. Then, during the constant load process of 6 MPa and 8 MPa, the amount of induced charge always maintains a high level, and the amount of induced charge reaches the maximum value of 0.18 pC during the constant load process of 8 MPa. Sample 2 also has a large amount of induced charge in the first-stage constant load stage and remains stable in the second-stage constant load stage. As the stress level increases, the amount of induced charge gradually increases, and the amount of induced charge reaches the maximum value of 0.60 pC during the 8 MPa constant load process. The acoustic emission energy released by the sample increases sharply during each loading process and then remains stable during the constant load stage. However, with the gradual increase in the stress level, the acoustic emission energy released by the sample increases gradually in both the loading stage and the constant load stage. The characteristics of the charge and acoustic emission signals of sample 3 in the step loading process are roughly the same as those of sample 2, but in the last 6 MPa constant load stage, the amount of induced charge tends to decrease. The reason is that the stress level at the beginning of the constant load is close to the failure strength of the sample. After the constant load is kept for 1 min, the sample is partially damaged, and some coal blocks are ejected. The sample partially releases the accumulated elastic energy, and the acoustic emission energy reaches the maximum value. At the same time, the stress drop occurs, which leads to a decrease in the amount of induced charge compared with the previous constant load stage, but it still maintains a high level.
The average value of the induced charge of each sample at different stress levels is shown in Table 1. The relationship between the average value of the induced charge and the stress level of each sample at different constant load stages is shown in Figure 13. When the stress of sample 1 is 1 MPa, 2 MPa, and 4 MPa, the average amount of induced charge is basically the same as that without loading. When the stress increases to 6 MPa, the average amount of induced charge begins to increase. Compared with no load, it increases by 56.25%. When the stress increases to 8 MPa, the average amount of induced charge increases by 75%. In specimen 2, the mean value of induced charge starts to increase at a stress of 1 MPa, and compared with the no-load effect, the mean value of induced charge increases by 24%. The mean values of induced charge reaches the maximum at the stresses of 6 MPa and 8 MPa, and the mean values of induced charge increase by 80% compared with the unloaded condition. The mean value of induced charge for specimen 3 at a stress of 1 MPa is almost the same as in the case of no loading. When the stress is increased to 2 MPa and 4 MPa, the mean value of induced charge starts to increase by 9% compared with the unloaded effect. When the stress level is 6 MPa, some of the elastic energy is released due to the local destruction of the specimen, resulting in a decrease in the mean value of the induced charge. Overall, although the sensitivity of the induced charge to the stress level varies from specimen to specimen, the mean value of the induced charge of each specimen has a tendency to increase and then level off as the stress increases.
In summary, the induced charge of coal samples has a positive correlation with the stress level, which presents consistency with the theoretical derivation in the law, which is consistent with the theoretical derivation results. Therefore, the magnitude of the induced charge can indirectly reflect the stress level of the coal body, which can provide a theoretical basis for the charge detection of the stress distribution of the surrounding rock in the field.

6. Stress Distribution Charge Detection Test of Roadway Surrounding Rock

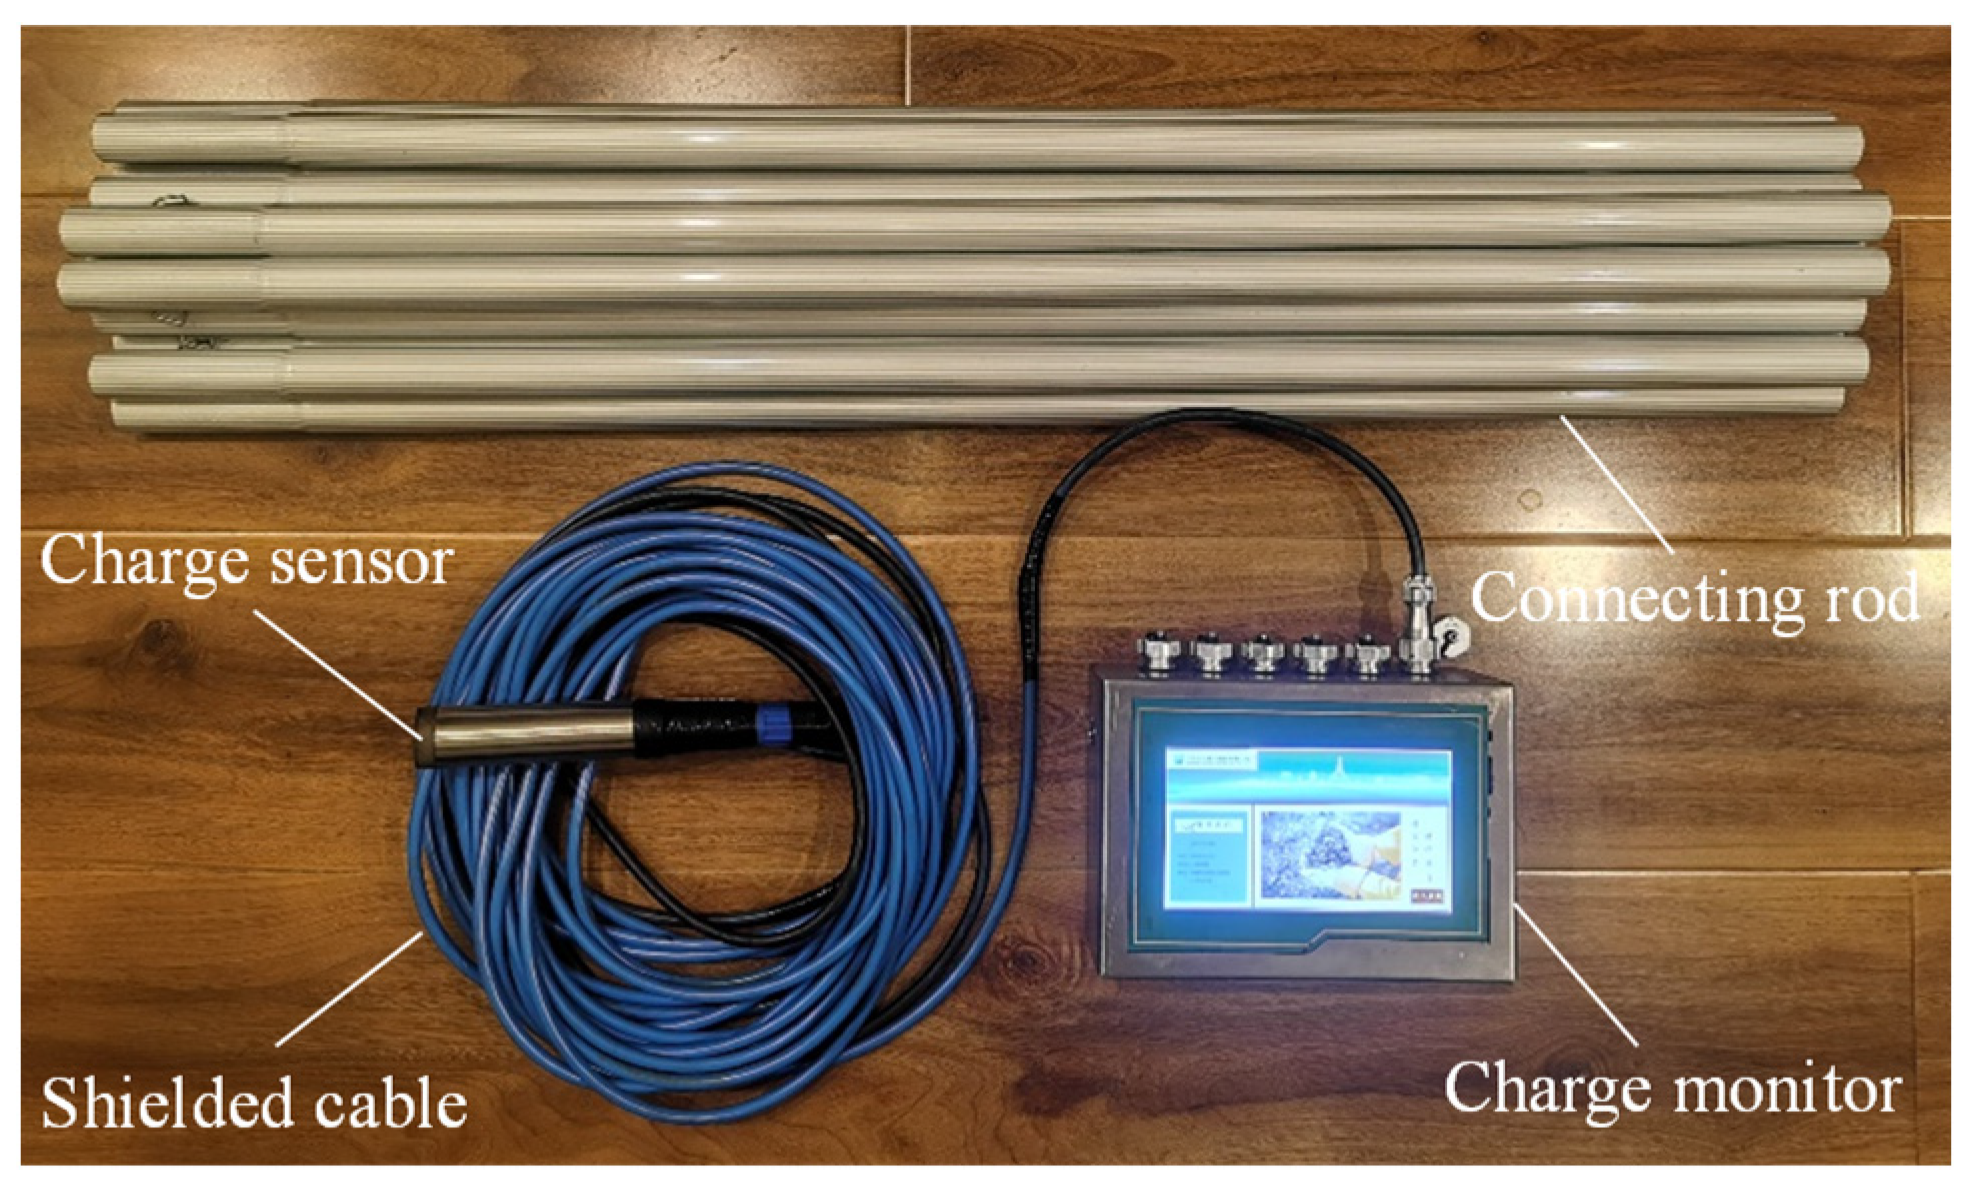
6.1. Charge-Monitoring Equipment

It can be shown in Figure 14 that the field test utilized an independently developed portable coal and rock charge monitor. This device, designed for visualization, multichannel functionality, and portability, encompassed a charge sensor with a shielded cable and a data acquisition unit. It could display charge signal changes and assess the stress state of coal and rock in real time, supporting four monitoring channels to simultaneously track multiple underground points. The monitor featured a 16-bit sampling accuracy and could operate continuously for over 8 h. With a sampling frequency of 1000 Hz, it captured maximum values, and its measurement range was −75 pC to 75 pC. The device operated within a temperature range of −20 °C to 60 °C.

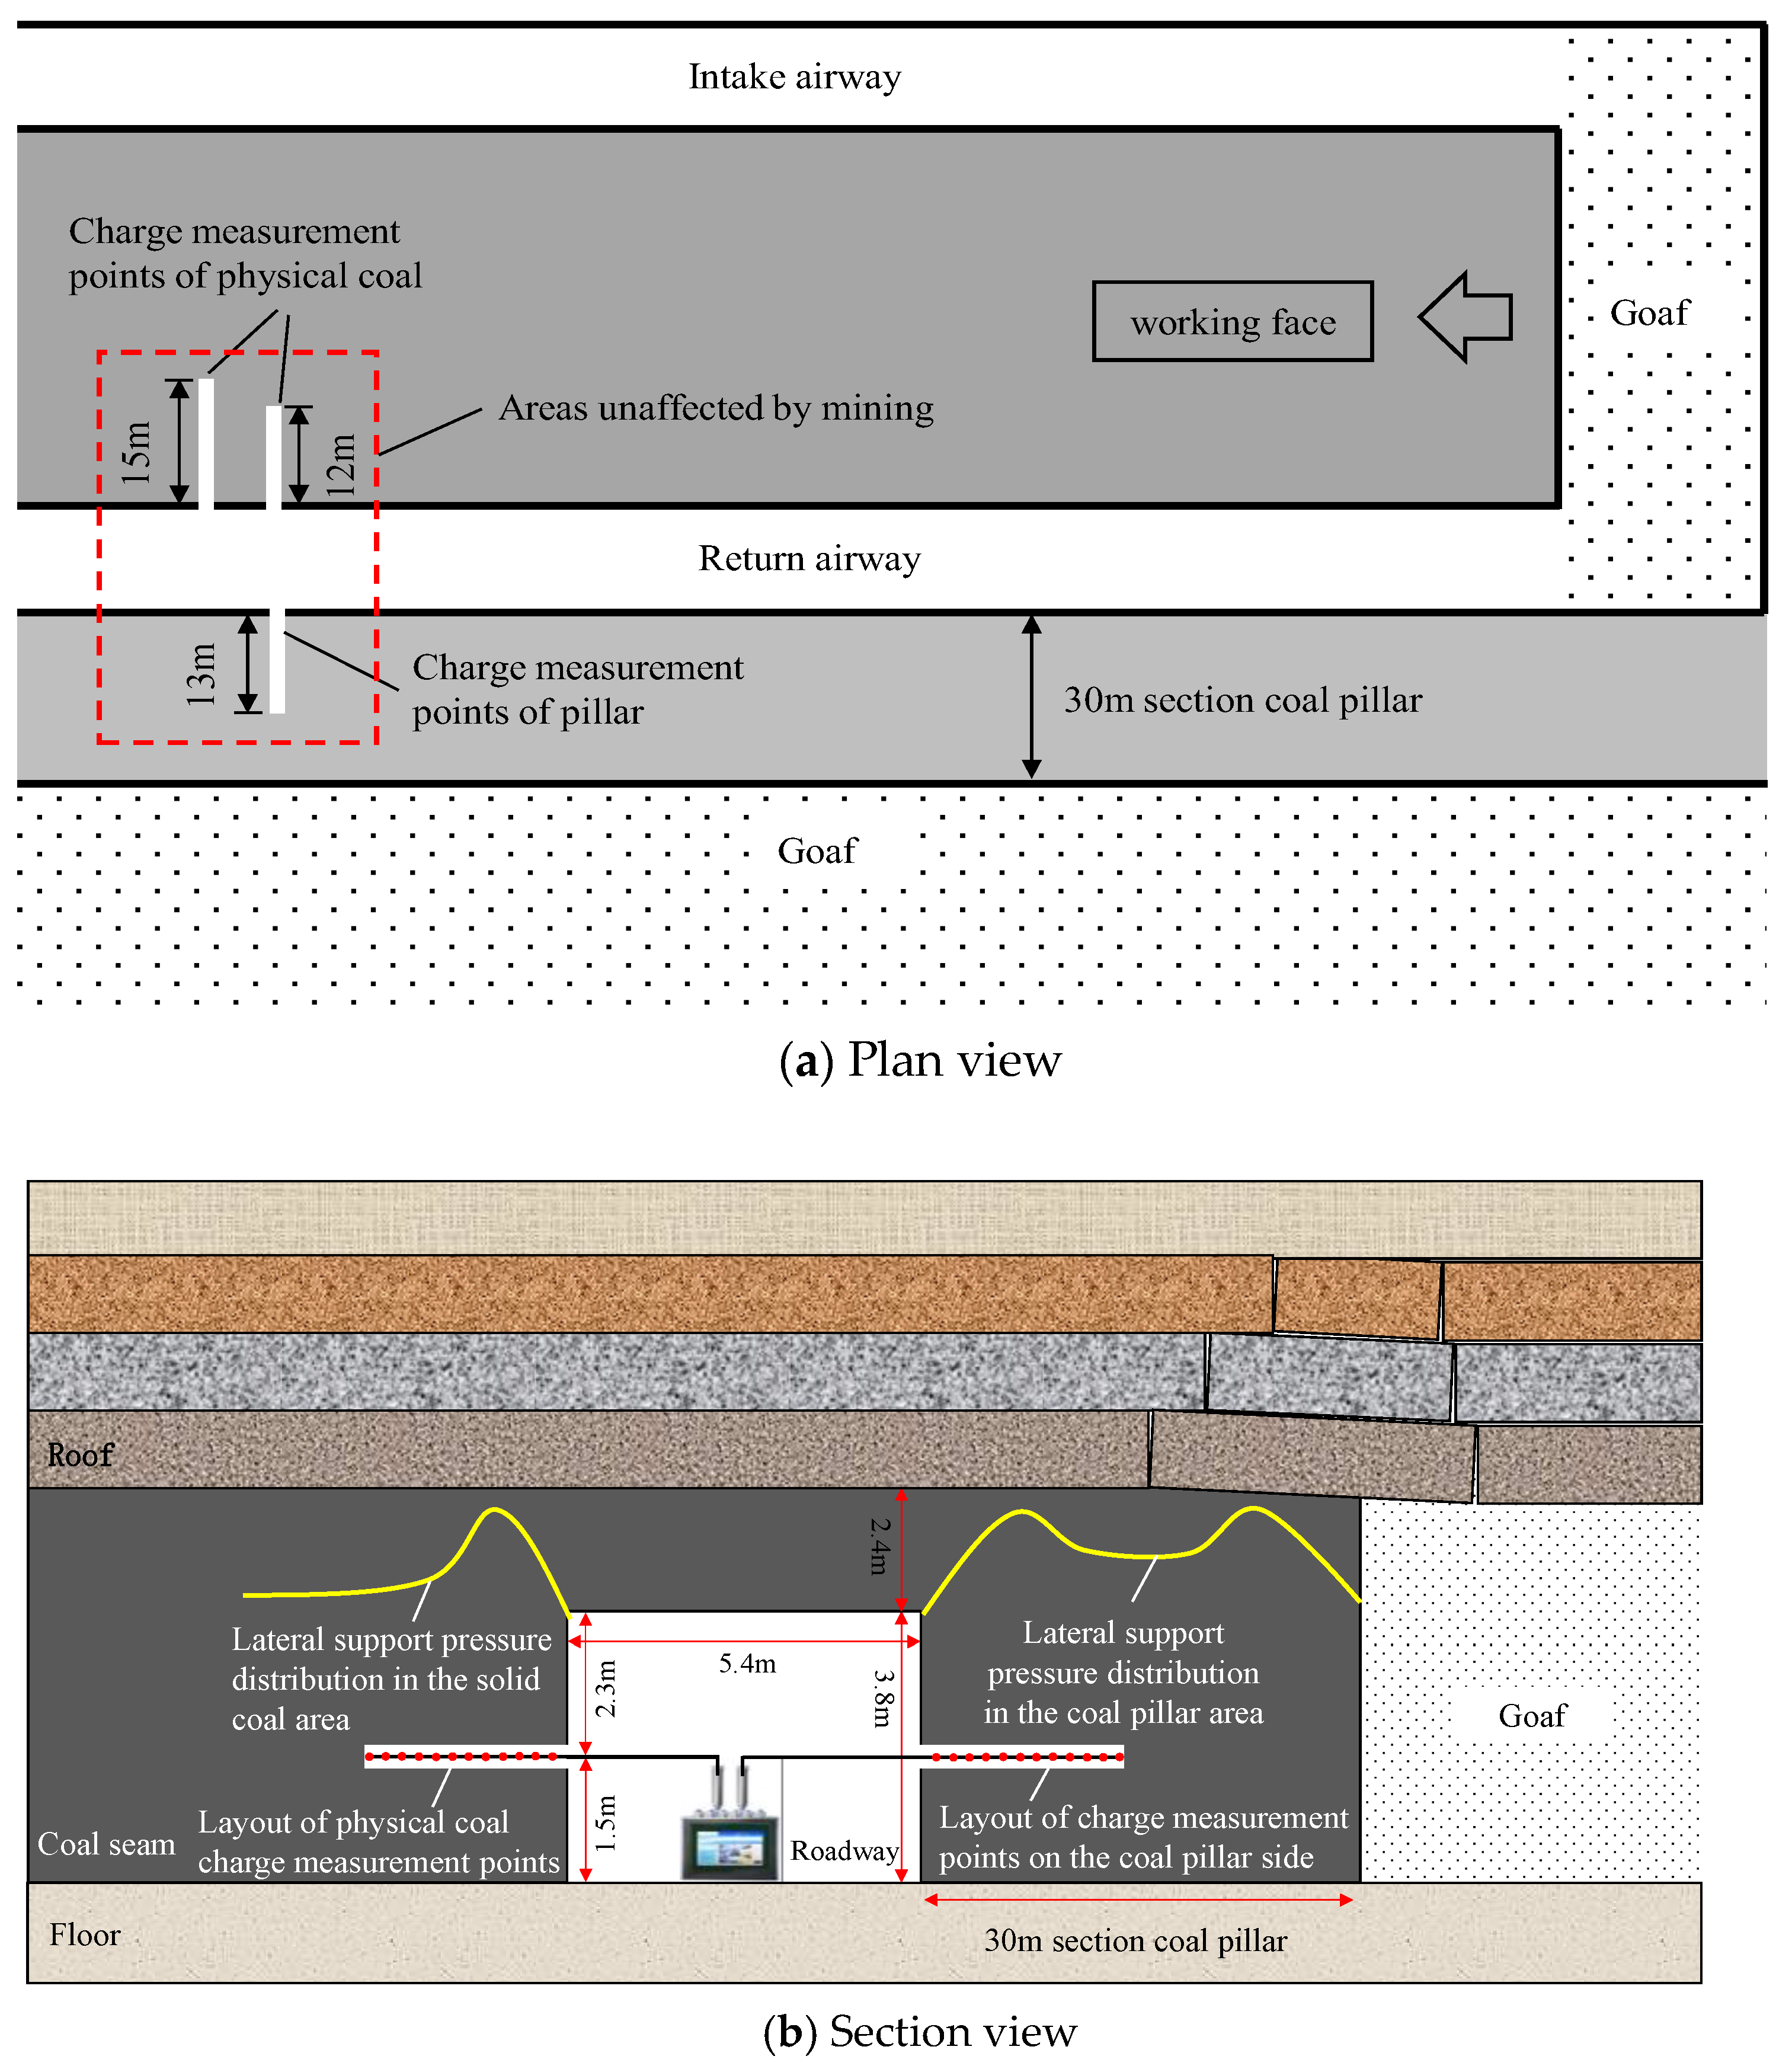
6.2. Monitoring Site and Monitoring Point Layout

The charge-monitoring site was situated in a coal seam tunnel of a mine in China. The roadway had solid coal on the left side and an open area on the right side, leaving a 30 m coal pillar. The depth of the roadway was 600 m. The thickness of the coal seam in the roadway was 6.2 m, and the uniaxial pressure strength was 7.3 MPa. The direct roof of the coal seam was sandy mudstone with a thickness of 6.2 m and a uniaxial pressure strength of 60.4 MPa. The basic roof of the coal seam was medium-grained sandstone with a thickness of 18.4 m and a uniaxial compressive degree of 67.5 MPa. The width of the roadway was 3.8 m, and the height was 5.4 m. The exploration area was without complex geological formations. To detect the stress distribution of the tunnel’s surrounding rock, the charge-monitoring point was chosen as an area unaffected by mining. Monitoring was carried out on both the physical coal side and the coal pillar side. A vertical coal wall was drilled into the coal seam 1.5 m from the tunnel’s bottom. The influence range of secondary stress distribution in the surrounding rock of the circular roadway was roughly 3~5 times the radius of the roadway. The calculated range of secondary stress distribution in the surrounding rock of the roadway was about 12 m. Then, combined with the actual situation on the site, the depth of the charge-monitoring holes was set at 12~15 m. Charge monitoring was conducted at intervals of every meter from the outside to the inside, with each meter being monitored for 3–5 min. Figure 15 and Figure 16 provide a schematic of the charge-monitoring scheme and field-monitoring process, respectively.

6.3. Monitoring Results and Analysis

The real-time monitoring results of charge signals per meter at different measuring points are shown in Figure 17. By averaging the real-time induced charge per meter at each measuring point, the average charge was obtained at various drilling depths, as depicted in Figure 18. Measuring points No. 1 and No. 2 were located on the solid coal side, while measuring point No. 3 was on the coal column side. The results of the borehole peeping at different depths are presented in Figure 19. The maximum peeping depth is 5 m; beyond this depth, excessive pulverized coal obstructs further peeping. At monitoring depths ranging between 1 and 4 m, the coal body is generally fragmented, indicating it is within the fracture zone and in the residual stress stage. The charge signals at each measuring point are relatively stable, with small charge amounts. The average charges at measuring points No. 1, No. 2, and No. 3 in the crushing zone are 5.09 pC, 3.62 pC, and 6.36 pC, respectively.
When the monitoring depth reaches 5 m, the coal body changes from a broken block to fissure shape. Combined with the change in charge quantity, the monitoring depth of 5~9 m can be regarded as the plastic zone of the coal body. The coal body is in the stage of stress increase, and the charge quantity is obviously enhanced. The charge of measuring points No. 1, No. 2, and No. 3 reached the maximum at the monitoring depth of 9 m, 8 m, and 7 m, which were 7.92 pC, 11.67 pC, and 14.91 pC, respectively. The average charge of measuring points No. 1, No. 2, and No. 3 in the plastic zone is 6.77 pC, 8.86 pC, and 12.60 pC, respectively. The peak position of the charge in the coal pillar area is closest to the roadway, and the average charge and peak value of the charge are the largest, which is consistent with the stress concentration in the coal pillar area.
When the monitoring depth exceeds the peak position of the charge, it can be regarded as an elastic zone, and the coal body is in the protolith stress zone. The charge of measuring points No. 1 and No. 2 has a tendency to decrease first and then stabilize at a higher level, and measuring point No. 3 has a tendency to decrease first, then stabilize, and then increase, which corresponds to the elastic core area easily formed by the 30 m coal pillar. The average charge of measuring points No. 1, No. 2, and No. 3 in the elastic zone is 6.28 pC, 8.45 pC, and 9.44 pC, respectively. The ratio of the peak value of the average charge to the average charge in the elastic zone can reflect the stress concentration degree of the surrounding rock of the roadway. The stress concentration factors of measuring points No. 1, No. 2, and No. 3 are 1.3, 1.4, and 1.6, respectively, which is consistent with the larger stress concentration factor in the coal pillar area.
The coal seam drilling cuttings were detected near the solid coal side charge-monitoring point, as shown in Figure 20. When the drilling depth is 1~3 m, the amount of drilling cuttings is small; when the drilling depth is 4~8 m, the amount of drilling cuttings increases obviously. When the drilling depth reaches 8 m, the amount of drilling cuttings reaches the maximum value of 4.68 kg. When the drilling depth is 9~14 m, the amount of drilling cuttings first decreases and then stabilizes at a higher level. The average amount of drilling cuttings is 3.91 kg, and the stress concentration factor is 1.2. The research shows that the amount of drilling cuttings per meter can better reflect the zoning and stress distribution of roadway surrounding rock. Therefore, 1~3 m can be approximately regarded as the fracture zone or stress reduction zone of surrounding rock, 4~8 m as the plastic zone or stress increase zone of surrounding rock, and more than 9 m as the elastic zone or protolith stress zone. The relationship between the amount of cuttings per meter and the amount of charge in the borehole on the solid coal side is shown in Figure 21. With the increase in drilling depth, the variation law of drilling cuttings and charge per meter is in good agreement, and the peak position of the two is basically consistent with the reflected stress concentration factor. Therefore, charge induction technology can be used to detect the stress distribution of roadway surrounding rock. Compared with the drilling cuttings method, charge induction technology can use the existing boreholes to realize the portable and non-contact detection of the stress distribution of the surrounding rock of the roadway. The detection efficiency is high and does not affect the production.
Overall, with the increase in drilling depth, the surrounding rock can be categorized into the fracture zone, plastic zone, and elastic zone. On the solid coal side, the corresponding charge induction signal shows a peak, with the charge initially increasing, then decreasing, and finally stabilizing. This pattern of charge variation aligns well with the amount of drilling cuttings. On the coal column side, the charge induction signal exhibits a secondary peak, with the charge initially increasing, then decreasing, and finally increasing again. Hence, the charge amounts at different borehole depths correlate well with the stress distribution in the roadway’s surrounding rock. By examining the size and position of charges at various drilling depths, the depth of the plastic zone and the peak area of lateral abutment pressure can be determined. This information provides targeted guidance for preventing and controlling coal and rock dynamic disasters such as rock burst.

7. Discussion and Conclusions

Charge induction detection technology belongs to the emerging coal rock deformation and rupture monitoring technology in recent years. A large number of laboratory experimental studies and underground field test studies have proved the feasibility of its use in coal rock stress monitoring. The main innovation of this paper is to use the charge induction monitoring technology for the detection of the stress distribution of the surrounding rock in the roadway. Compared with the previous laboratory charge monitoring, this paper innovatively carries out the research on the charge induction law of graded loading coal rock, which is more in line with the stress state of the coal body in the field. Charge signal characteristics and acoustic emission characteristics are also compared and analyzed, reflecting the advantages of charge induction for constant load high stress detection. Compared with the previous underground field charge detection, which was carried out at different distances from the coal mining face at the same drilling depth, mainly exploring the distribution of over-supporting pressure in the face, this paper is the first to carry out the charge detection test at different drilling depths of the coal seam, reflecting the stress distribution char-acteristics of the peripheral rock in the roadway through the detection of the size of the induced electric charge per meter of the drilling hole. Reference [7] used the electromagnetic radiation method to detect the pressure relief zone of the roadway surrounding rock to obtain useful re-search results, but the detection depth was relatively small at a maximum depth of 7 m, and the authors did not use other means to verify the detection results. In this paper, the charge induction method is used to detect the range of broken, plastic, and elastic zones of the surrounding rock in the solid coal and coal pillar side roadway. The detection depth is large, and the maximum depth reaches 15 m, which can reach the elastic zone of surrounding rock. Using a comparison and analysis with the drill chip method, the two detection results have greater consistency. However, this study mainly reflects the stress distribution of the surrounding rock qualitatively by the magnitude of the induced charge and does not give the actual stress magnitude of the surrounding rock. In a follow-up work, we will carry out in-depth research on the quantitative relationship between coal rock stress and charge, aiming to achieve the quantitative detection of the size of the surrounding rock stress and provide quantitative guidance for the design of roadway support and the monitoring and prevention of coal rock power disasters.
  • The coal sample has charge and acoustic emission during the step loading process, and the magnitude of the induced charge and acoustic emission energy is in good agreement with the stress level. The charge induction signal is more sensitive to the high stress of constant load, which can indirectly reflect the stress level of the coal body.
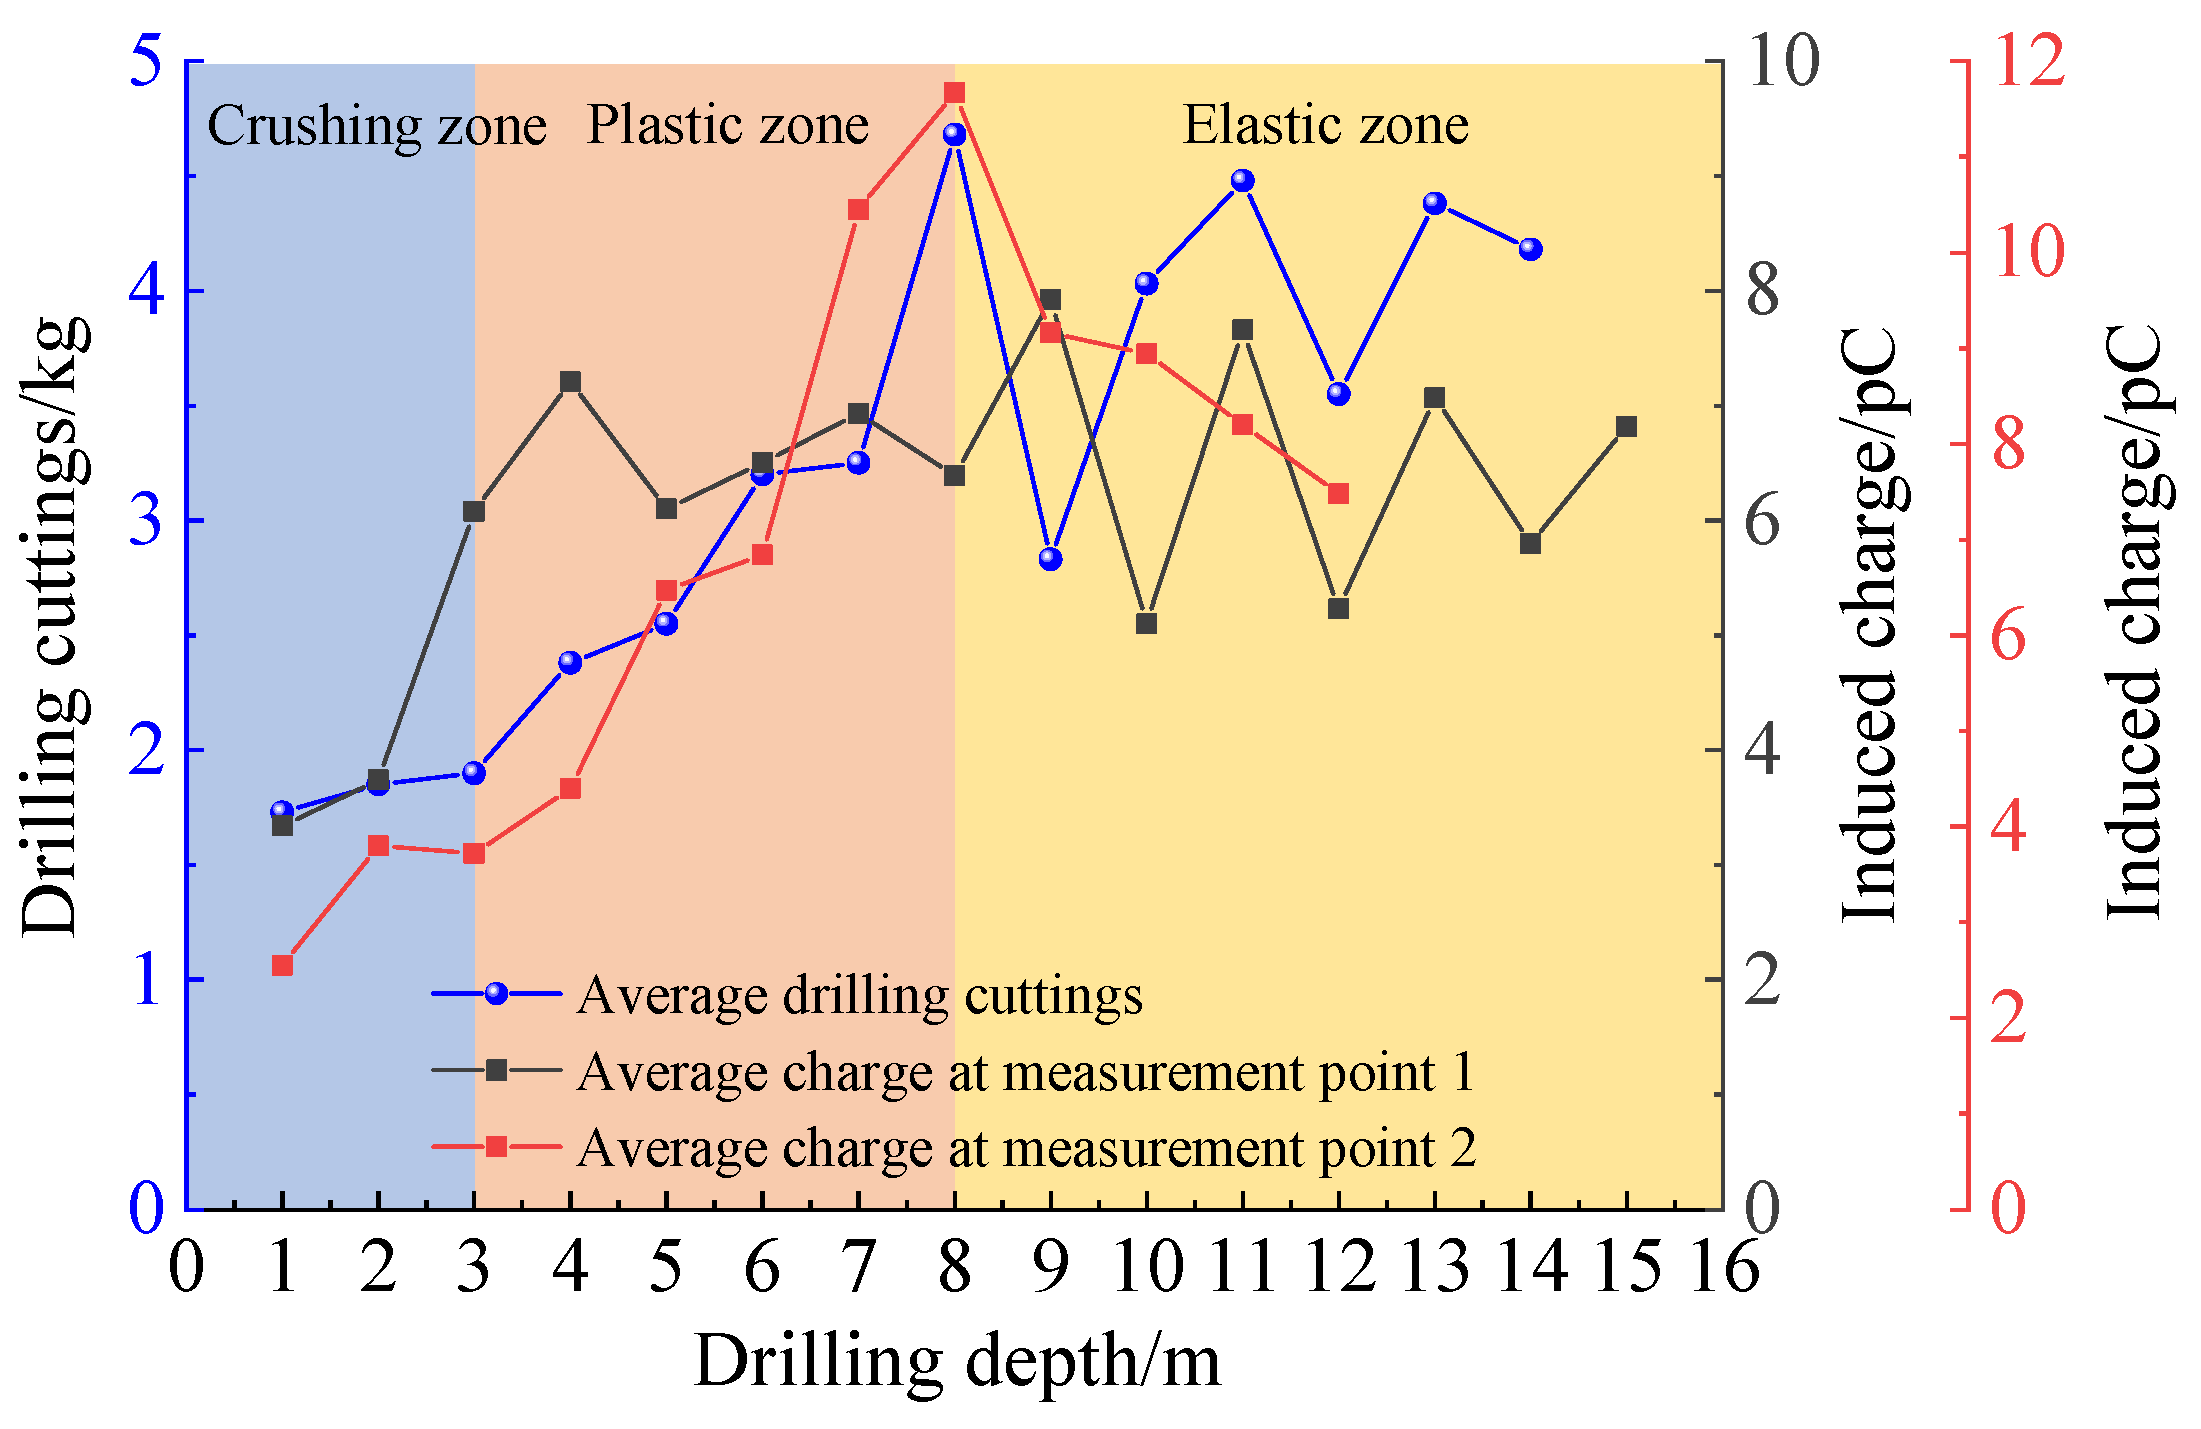
  • The induced charge is small when the drilling depth of the solid coal side seam is 1~4 m. When the drilling depth is 5~9 m, the induced charge increases significantly. When the drilling depth is more than 9 m, the induced charge is smaller and then is stable. With the increase in drilling depth, the inductive signal of charge on the solid coal side has a wave peak, the position of the wave peak is 8~9 m from the roadway, and the stress concentration coefficient is 1.3~1.4.
  • The induced charge is small when the drilling depth of the coal seam on the side of the coal pillar is 1~4 m. When the drilling depth is 5~7 m, the induced charge increases significantly. When the drilling depth is more than 7 m, the induced charge is smaller and then increases steadily. With the increase in drilling depth, the charge induction signal on the side of the coal pillar has a secondary wave peak, and the position of the first wave peak is 7 m from the roadway with a stress concentration factor of 1.6.
  • With the increase in drilling depth, the amount of induced charge and drill cuttings per meter is in good agreement with the stress distribution in the roadway perimeter rock, and the location of the peak charge and drill cuttings is in agreement with the reflected stress concentration factor. Compared with the drilling chip method, charge induction technology has the advantages of being portable and non-contact, with high inspection efficiency and no disruption to production.
  • By analyzing the size and position of charges at various borehole depths, the depth of the plastic zone and the peak area of lateral abutment pressure can be determined. This analysis provides targeted guidance for preventing and controlling coal and rock dynamic disasters, such as rock burst.

Author Contributions

Conceptualization, G.W. and A.W.; methodology, G.W. and A.W.; validation, D.F. and L.D. (Lianpeng Dai); formal analysis, L.D. (Lulu Du) and D.F.; investigation, G.W., L.D. (Lulu Du), D.F., T.S. and L.D. (Lianpeng Dai); resources, T.S.; writing—original draft, G.W.; writing—review and editing, A.W.; supervision, A.W.; funding acquisition, G.W. and A.W. All authors have read and agreed to the published version of the manuscript.

Funding

The research was funded by the National Natural Science Foundation of China (Grant no. 52304219; 52374201), Liaoning Provincial Science and Technology Plan Project (Grant no. 2022-BS-117), and Open Project of Liaoning Technical University Liaoning Province Key Laboratory of Mining Environment and Disaster Mechanics (Grant no. MEDM2023-B-5).

Data Availability Statement

The data that support the findings of this study are available from the first author upon reasonable request.

Conflicts of Interest

The authors declare that they have no known competing financial interests or personal relationships that could have appeared to influence the work reported in this paper.

References

  1. Pan, Y.S.; Wang, A.W. Disturbance response instability theory of rock bursts in coal mines and its application. Geohazard Mech. 2023, 1, 1–17. [Google Scholar] [CrossRef]
  2. Liu, Q.; Li, J.L.; Liang, B.; Liu, J.; Sun, W.J.; He, J.; Lei, Y. Complex wettability behavior triggering mechanism on imbibition: A model construction and comparative study based on analysis at multiple scales. Energy 2023, 275, 127434. [Google Scholar] [CrossRef]
  3. Sabapathy, R.; Paul, P.S.; Mandal, P.K. Evaluation of bump-proneness of underground coal mines using burst energy coefficient. Arab. J. Geosci. 2019, 12, 579. [Google Scholar] [CrossRef]
  4. Zhao, R.; Tao, M.; Zhao, H.T.; Wu, C.Q.; Cao, W.Z. Theoretical study on dynamic stress redistribution around circular tunnel with different unloading paths. Comput. Geotech. 2023, 163, 105737. [Google Scholar] [CrossRef]
  5. Konicek, P.; Ptacek, J.; Waclawik, P.; Kajzar, V. Long-term Czech experiences with rockbursts with applicability to today’s underground coal mines. Rock Mech. Rock Eng. 2019, 52, 1447–1458. [Google Scholar] [CrossRef]
  6. Qiao, Z.; Li, C.W.; Wang, Q.F.; Xu, X.M. Principles of formulating measures regarding preventing coal and gas outbursts in deep mining: Based on stress distribution and failure characteristics. Fuel 2024, 356, 129578. [Google Scholar] [CrossRef]
  7. He, X.Q.; Wang, E.Y.; Zhang, R.G.; Liu, M.J. Determination of coal rock unloading zones using coal rock damage electromagnetic radiation characteristics. Saf. Coal Mines 1996, 2, 17–19. [Google Scholar] [CrossRef]
  8. Tian, X.; Song, D.; He, X.; Liu, H.; Wang, W.; Li, Z. Investigation of micro-surface potential of coals with different metamorphism by AFM. Measurement 2021, 172, 108915. [Google Scholar] [CrossRef]
  9. Fehdi, C.; Nouioua, I.; Belfar, D.; Djabri, L.; Salameh, E. Detection of underground cavities by combining electrical resistivity imaging and ground penetrating radar surveys: A Case Study from Draa Douamis Area (North East of Algeria). In H2Karst Research in Limestone Hydrogeology; Environmental Earth Sciences; Springer: Cham, Switzerland, 2014. [Google Scholar] [CrossRef]
  10. Kolesnikov, Y.I.; Fedin, K.V. Detecting underground cavities using microtremor data: Physical modelling and field experiment. Geophys. Prospect. 2018, 66, 342–353. [Google Scholar] [CrossRef]
  11. Laurent, A.; Leparoux, D.; Capdeville, Y.; Durand, O. Detectability of underground cavities by surface seismic waves using das fiber optic recordings: Feasibility Analysis. In Proceedings of the NSG2022 28th European Meeting of Environmental and Engineering Geophysics, Belgrade, Serbia, 18–22 September 2022. [Google Scholar] [CrossRef]
  12. Xia, H.Q.; Jiang, S.X. Geostress effect on resistivity and its relevant correction method. Petroleum 2023, 9, 412–418. [Google Scholar] [CrossRef]
  13. Choi, J.-R.; Kim, S.-S.; Park, S.-K.; Shin, K.-S.; Kang, B.-C. A case study of electrical resistivity and borehole imaging methods for detecting underground cavities and monitoring ground subsidence at abandoned underground mines. J. Korean Earth Sci. Soc. 2013, 34, 195–208. [Google Scholar] [CrossRef]
  14. Jiang, Q.; Feng, X.T.; Su, G.S.; Chen, G. Intelligent back analysis of rock mass parameters for large underground caverns under high earth stress. Chin. J. Rock Mech. Eng. 2007, 26, 2654–2662. [Google Scholar]
  15. Ma, S.L.; Zhang, M.W.; Ma, L.; Tian, Z.C.; Li, X.; Su, Z.H.; Bian, S.C. Experimental investigation on stress distribution and migration of the overburden during the mining process in deep coal seam mining. Geoenviron. Disasters 2023, 10, 24. [Google Scholar] [CrossRef]
  16. Gao, L.; Zhao, S.H.; Zhan, X.Y.; Zhao, Z.Q.; Liu, P.Z.; Wang, Y.; Liu, P. Stress distribution characteristics of the surrounding rock of the gob-side coal–rock roadway in a gently inclined coal seam under the influence of excavation and mining disturbance based on infrared detection. Int. J. Geomech. 2023, 23, 12. [Google Scholar] [CrossRef]
  17. Ju, Y.; Nie, X.D.; Zhu, Y.; Wang, K.; Zhou, H.W.; Ge, S. Stress distribution and roof subsidence of surrounding strata considering in situ coal conversion and CO2 mineralization backfilling: Photoelastic experiments using 3D-printed models of mining faces and goafs. Sci. Total Environ. 2024, 912, 169368. [Google Scholar] [CrossRef]
  18. Li, D.X.; Wang, E.Y.; Yue, J.H.; Zhang, X.; Wang, D.M.; Ju, Y.Q. A weak current technique for coal and rock dynamic disaster prediction and its application. Chin. J. Rock Mech. Eng. 2022, 41, 764–774. [Google Scholar] [CrossRef]
  19. Li, D.; Wang, E.; Li, Z.; Ju, Y.; Wang, D.; Wang, X. Experimental investigations of pressure stimulated currents from stressed sandstone used as precursors to rock fracture. Int. J. Rock Mech. Min. Sci. 2021, 145, 104841. [Google Scholar] [CrossRef]
  20. Zhao, Y.S.; Liang, C.S.; Liu, C.D. Exploration of drill chip method to measure the pressure of envelope rock. YanTu GongCheng XueBao 1987, 9, 104–110. [Google Scholar]
  21. Nitson, U. Electromagnetic emission accompanying fracture of quartz-bearing rocks. Geophys. Res. Lett. 1977, 4, 333–336. [Google Scholar] [CrossRef]
  22. Kuksenko, V.S.; Makhmudov, K.F.; Ponomarev, A.V. Relaxation of electric fields induced by mechanical loading in natural dielectrics. Phys. Solid State 1997, 39, 1065–1066. [Google Scholar] [CrossRef]
  23. Cress, G.O.; Brady, B.T.; Rowell, G.A. Sources of electromagnetic radiation from fracture of rock samples in laboratory. Geophys. Res. Lett. 1987, 14, 331–334. [Google Scholar] [CrossRef]
  24. Kirikaev. Electric Field of Rock under Force Loading; Xu, Y., Translator; Beijing Earthquake Press: Beijing, China, 1993. [Google Scholar]
  25. Triantis, D.; Anastasiadis, C.; Stavrakas, I. The correlation of electrical charge with strain on stressed rock samples. Nat. Hazards Earth Syst. Sci. 2008, 8, 1243–1248. [Google Scholar] [CrossRef]
  26. Triantis, D.; Stavrakas, I.; Anastasiadis, C.; Kyriazopoulos, A.; Vallianatos, F. An analysis of pressure stimulated currents (PSC), in marble samples under mechanical stress. Phys. Chem. Earth 2006, 31, 234–239. [Google Scholar] [CrossRef]
  27. Stavrakas, I.; Anastasiadis, C.; Triantis, D.; Vallianatos, F. Piezo stimulated currents in marble samples: Precursory and concurrent-with-failure signals. Nat. Hazards Earth Syst. 2003, 3, 243–247. [Google Scholar] [CrossRef]
  28. Vallianatos, F.; Tzanis, A. Electric current generation associated with the deformation rate of a solid: Preseismic and coseismic signals. Phys. Chem. Earth 1998, 23, 933–939. [Google Scholar] [CrossRef]
  29. Vallianatos, F.; Tzanis, A. A model for the generation of precursory electric and magnetic fields associated with the deformation rate of the earthquake focus. In Seismic Atmospheric & Ionospheric Electromagnetic Phenomena; Hayakawa, M., Ed.; Terra Scientific Publishing Co.: Tokyo, Japan, 1999; Available online: https://cir.nii.ac.jp/crid/1571698599922647424 (accessed on 30 June 2017).
  30. Vallianatos, F.; Triantis, D.; Tzanis, A.; Anastasiadis, C.; Stavrakas, I. Electric earthquake precursors: From laboratory results to field observations. Phys. Chem. Earth 2004, 29, 339–351. [Google Scholar] [CrossRef]
  31. Pan, Y.S.; Luo, H.; Xiao, X.C.; Zhao, Y.F.; Li, Z.H. Experimental study on mechanical charge induction law of coal containing gas under triaxial compression. China Coal Soc. 2012, 37, 918–922. [Google Scholar] [CrossRef]
  32. Pan, Y.S.; Luo, H.; Tang, Z.; Li, Z.H.; Zhao, Y.F. Study on the charge induction law of tensile instability damage of coal rock body. J. Rock Mech. Eng. 2013, 32, 1297–1303. [Google Scholar]
  33. Zhao, Y.F.; Jing, G.; Fan, Y.; Pan, Y. Experimental study on the microseism and charge signal time-frequency characteristics in the process of fault stick-slip instability. Chin. J. Rock Mech. Eng. 2020, 39, 1385–1395. [Google Scholar] [CrossRef]
  34. Zhao, Y.F.; Jing, G.; Cheng, C.J.; Li, B. Tests for fracture characteristics of fractured sandstone and micro-seismic and charge induced signal laws. J. Vib. Shock 2020, 39, 211–219. [Google Scholar] [CrossRef]
  35. Lyu, J.G.; Wang, Z.Q.; Yang, T.; Tang, Z.; Pan, Y.S.; Peng, Y.S. The relationship between storage-dissipation-release of coal energy and intensity of induced charge. Constr. Build. Mater. 2022, 357, 129375. [Google Scholar] [CrossRef]
  36. Wang, G.; Pan, Y.S.; Xiao, X.C.; Wu, D.; Zhao, H.R.; Wang, A.W.; Ding, X. Study on the relationship between stress and charge of coal mass under uniaxial compression. Shock Vib. 2019, 12, 9412697. [Google Scholar] [CrossRef]
  37. Wang, G.; Pan, Y.S.; Xiao, X.C. Research on damage characteristics and charge law of uniaxially loaded coal body and its application. Chin. Geotech. 2019, 40, 1823–1831. [Google Scholar] [CrossRef]
  38. Ding, X.; Xiao, X.-C.; Wu, D.; Lv, X.-F. Mechanical properties and charge signal characteristics in coal material failure under different loading paths. Int. J. Coal Sci. Technol. 2019, 6, 138–149. [Google Scholar] [CrossRef]
  39. Lyu, J.G.; Peng, Y.S.; Tang, Z.; Zhao, H.; Wang, X.; Wang, Z.; Bao, X.; Fu, H. Recognition of induced charge in coal failure process and its practice of underground application. J. China Coal Soc. 2022, 47, 1547–1558. [Google Scholar] [CrossRef]
  40. Pan, Y.S.; Zhao, Y.F.; Fu, L.; Li, G.; Ji, C. Rock Charge Radiometer. CN101487901B, 4 August 2010. [Google Scholar]
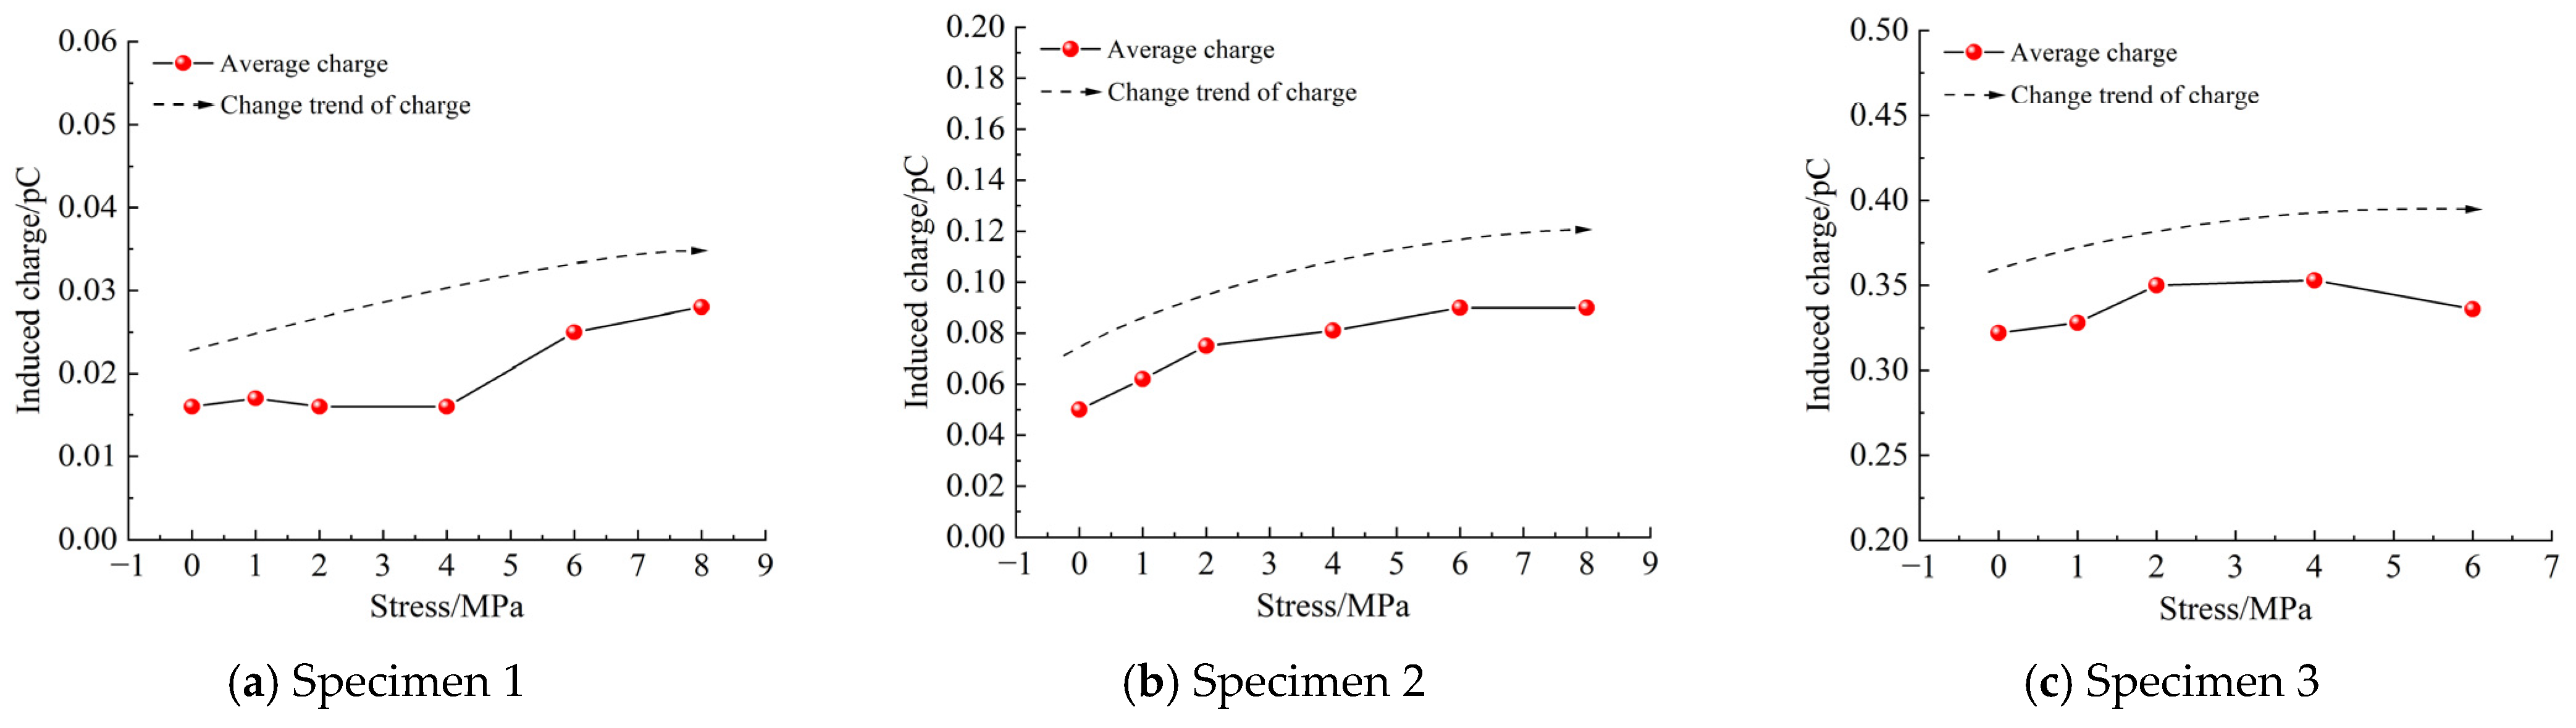
Figure 1. Stress distribution in the surrounding rock of the roadway.
Electronics 13 03075 g001
Figure 2. Distribution of mining stresses in the coal body in front of the coal mining workings.
Electronics 13 03075 g002
Figure 3. Schematic diagram of the piezoelectric effect.
Electronics 13 03075 g003
Figure 4. Schematic diagram of dislocation theory.
Electronics 13 03075 g004
Figure 5. Rock induced charge versus stress.
Electronics 13 03075 g005
Figure 6. Elastic energy density of coal accumulation under different stress levels.
Electronics 13 03075 g006
Figure 7. Coal samples.
Electronics 13 03075 g007
Figure 8. Test system.
Electronics 13 03075 g008
Figure 9. Schematic diagram of charge sensing in drilled holes.
Electronics 13 03075 g009
Figure 10. Coal sample noise signal without external force.
Electronics 13 03075 g010
Figure 11. The characteristics of acoustic charge signals of a coal sample during loading and unloading.
Electronics 13 03075 g011
Figure 12. The characteristics of acoustic charge signals of coal samples during staged loading.
Electronics 13 03075 g012
Figure 13. Relationship between induced charge and stress level of coal samples.
Electronics 13 03075 g013
Figure 14. Portable coal and rock charge monitor.
Electronics 13 03075 g014
Figure 15. Schematic diagram of the charge measurement point layout.
Electronics 13 03075 g015
Figure 16. Monitoring location and charge-monitoring process diagram.
Electronics 13 03075 g016
Figure 17. Real-time monitoring results of charge signals at each measurement point.
Electronics 13 03075 g017
Figure 18. Average value of the induced charge at each measurement point.
Electronics 13 03075 g018
Figure 19. Peephole results for the coal body at different drilling depths.
Electronics 13 03075 g019
Figure 20. Solid coal side seam drill cuttings.
Electronics 13 03075 g020
Figure 21. Coal seam drill cuttings versus electrical charge.
Electronics 13 03075 g021
Table 1. Mean values of induced charges of coal samples with different stress levels.
Stress/MPa012468
Induced charge quantity of specimen 1/pC0.0160.0170.0160.0160.0250.028
Induced charge quantity of specimen 2/pC0.0500.0620.0750.0810.0900.090
Induced charge quantity of specimen 3/pC0.3220.3280.3500.3530.336
Disclaimer/Publisher’s Note: The statements, opinions and data contained in all publications are solely those of the individual author(s) and contributor(s) and not of MDPI and/or the editor(s). MDPI and/or the editor(s) disclaim responsibility for any injury to people or property resulting from any ideas, methods, instructions or products referred to in the content.

