
Medical Image Classification with a Hybrid SSM Model Based on CNN and Transformer


Abstract
1. Introduction
- An SSM-based MambaConvT model is proposed and its potential application in medical image classification tasks is explored.
- Full experiments were conducted on six datasets, four of which are public and two are private, and the results show that the MambaConvT model has excellent performance on different classification tasks.
- It provides a valuable reference for the future development of more effective SSM-based medical classification models.
2. Related Works
2.1. CNN Module
2.2. Transformer Module
2.3. State-Space Module
3. Methodology
3.1. Mamba Module
3.2. MambaConvT Architecture
3.3. Conv-SSM-T Module
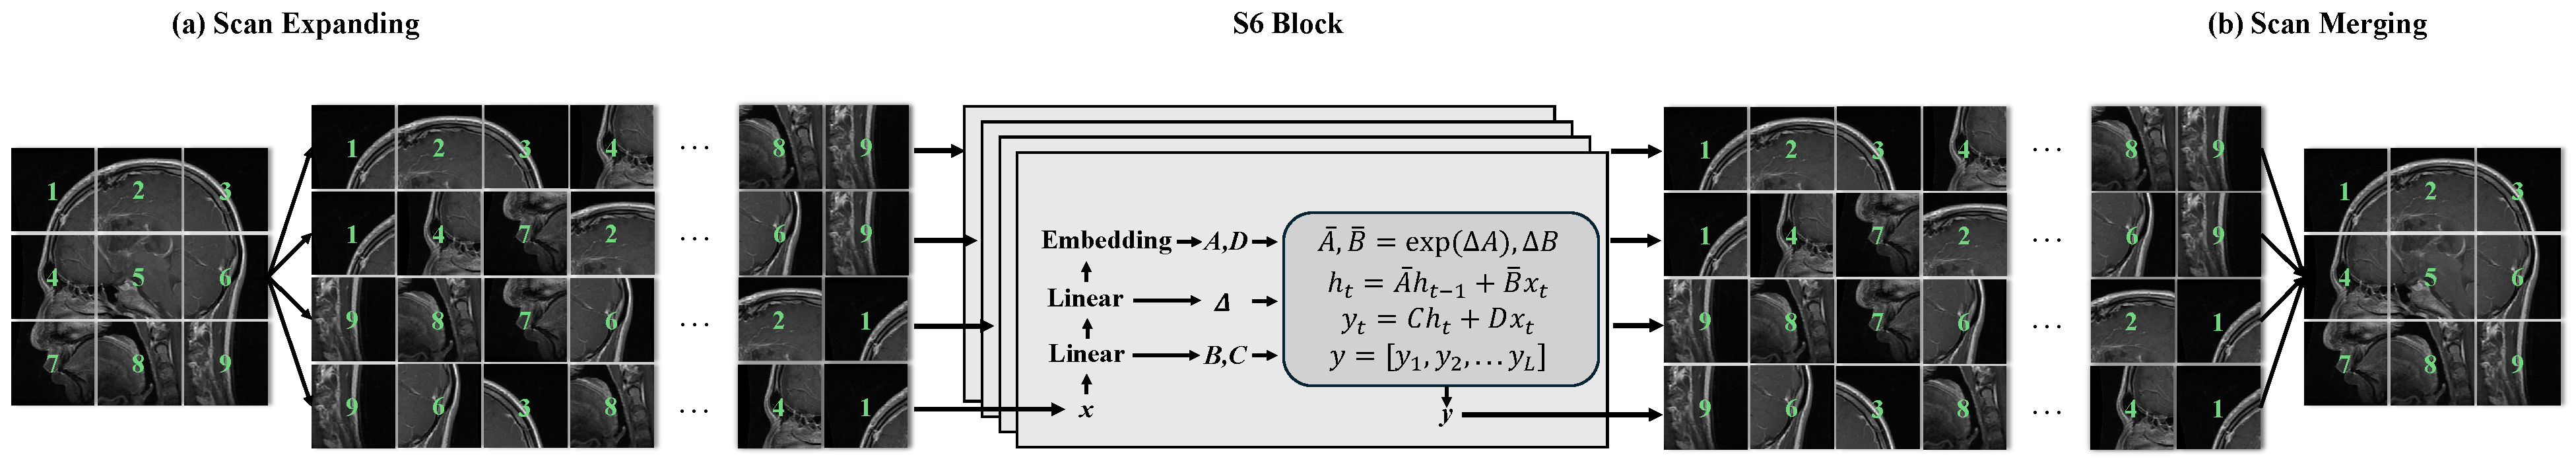
3.4. SS2D Module
| Algorithm 1: Pseudo-code for S6 block in SS2D |
, the feature with shape [B, L, D] (batch size, token length, dimension) A, the nn.Parameter; D, the nn.Parameter Linear(.), the linear projection layer , the feature with shape [B, L, D] 1: Linear,Linear,Linear 2: 3: 4: 5: 6: 7: y |
4. Experiments and Results
4.1. Datasets
4.2. Evaluation Metrics
4.3. Compare Models
4.4. Implementation Details
4.5. Quantitative Results Analysis
4.6. Ablation Studies
5. Conclusions
Author Contributions
Funding
Data Availability Statement
Conflicts of Interest
References
- Wang, W.; Liang, D.; Chen, Q.; Iwamoto, Y.; Han, X.H.; Zhang, Q.; Hu, H.; Lin, L.; Chen, Y.W. Medical image classification using deep learning. In Deep Learning in Healthcare: Paradigms and Applications; Springer: Berlin/Heidelberg, Germany, 2020; pp. 33–51. [Google Scholar]
- Afshar, P.; Heidarian, S.; Enshaei, N.; Naderkhani, F.; Rafiee, M.J.; Oikonomou, A.; Fard, F.B.; Samimi, K.; Plataniotis, K.N.; Mohammadi, A. COVID-CT-MD, COVID-19 computed tomography scan dataset applicable in machine learning and deep learning. Sci. Data 2021, 8, 121. [Google Scholar] [CrossRef] [PubMed]
- Serena Low, W.C.; Chuah, J.H.; Tee, C.A.T.; Anis, S.; Shoaib, M.A.; Faisal, A.; Khalil, A.; Lai, K.W. An Overview of Deep Learning Techniques on Chest X-Ray and CT Scan Identification of COVID-19. Comput. Math. Methods Med. 2021, 2021, 5528144. [Google Scholar] [CrossRef] [PubMed]
- Zhang, D.; Huang, G.; Zhang, Q.; Han, J.; Han, J.; Wang, Y.; Yu, Y. Exploring task structure for brain tumor segmentation from multi-modality MR images. IEEE Trans. Image Process. 2020, 29, 9032–9043. [Google Scholar] [CrossRef] [PubMed]
- Zhang, D.; Huang, G.; Zhang, Q.; Han, J.; Han, J.; Yu, Y. Cross-modality deep feature learning for brain tumor segmentation. Pattern Recognit. 2021, 110, 107562. [Google Scholar] [CrossRef]
- Hu, R.; Li, M.; Xu, H.; Zhao, H.M. Research and application of key technologies for medical image intelligence knowledge discovery and data processing. Int. J. Pattern Recognit. Artif. Intell. 2020, 34, 2057005. [Google Scholar] [CrossRef]
- Guan, X.; Ni, B.; Zhang, J.; Zhu, D.; Cai, Z.; Meng, W.; Shi, L.; Ross-Degnan, D. Association between physicians’ workload and prescribing quality in one tertiary hospital in China. J. Patient Saf. 2021, 17, e1860–e1865. [Google Scholar] [CrossRef]
- Tan, T.; Platel, B.; Huisman, H.; Sánchez, C.I.; Mus, R.; Karssemeijer, N. Computer-aided lesion diagnosis in automated 3-D breast ultrasound using coronal spiculation. IEEE Trans. Med. Imaging 2012, 31, 1034–1042. [Google Scholar] [CrossRef]
- Song, Y.; Cai, W.; Zhou, Y.; Feng, D.D. Feature-based image patch approximation for lung tissue classification. IEEE Trans. Med. Imaging 2013, 32, 797–808. [Google Scholar] [CrossRef] [PubMed]
- Zhang, F.; Song, Y.; Cai, W.; Lee, M.Z.; Zhou, Y.; Huang, H.; Shan, S.; Fulham, M.J.; Feng, D.D. Lung nodule classification with multilevel patch-based context analysis. IEEE Trans. Biomed. Eng. 2013, 61, 1155–1166. [Google Scholar] [CrossRef] [PubMed]
- Lowe, D.G. Distinctive image features from scale-invariant keypoints. Int. J. Comput. Vis. 2004, 60, 91–110. [Google Scholar] [CrossRef]
- Ojala, T.; Pietikainen, M.; Maenpaa, T. Multiresolution gray-scale and rotation invariant texture classification with local binary patterns. IEEE Trans. Pattern Anal. Mach. Intell. 2002, 24, 971–987. [Google Scholar] [CrossRef]
- Nanni, L.; Lumini, A.; Brahnam, S. Local binary patterns variants as texture descriptors for medical image analysis. Artif. Intell. Med. 2010, 49, 117–125. [Google Scholar] [CrossRef] [PubMed]
- Chen, X.; Wang, X.; Zhang, K.; Fung, K.M.; Thai, T.C.; Moore, K.; Mannel, R.S.; Liu, H.; Zheng, B.; Qiu, Y. Recent advances and clinical applications of deep learning in medical image analysis. Med. Image Anal. 2022, 79, 102444. [Google Scholar] [CrossRef] [PubMed]
- Gu, Y.; Chi, J.; Liu, J.; Yang, L.; Zhang, B.; Yu, D.; Zhao, Y.; Lu, X. A survey of computer-aided diagnosis of lung nodules from CT scans using deep learning. Comput. Biol. Med. 2021, 137, 104806. [Google Scholar] [CrossRef] [PubMed]
- Aljuaid, H.; Alturki, N.; Alsubaie, N.; Cavallaro, L.; Liotta, A. Computer-aided diagnosis for breast cancer classification using deep neural networks and transfer learning. Comput. Methods Programs Biomed. 2022, 223, 106951. [Google Scholar] [CrossRef] [PubMed]
- Khalil, M.; Khalil, A.; Ngom, A. A Comprehensive Study of Vision Transformers in Image Classification Tasks. arXiv 2023, arXiv:2312.01232. [Google Scholar]
- Barzekar, H.; Yu, Z. C-Net: A reliable convolutional neural network for biomedical image classification. Expert Syst. Appl. 2022, 187, 116003. [Google Scholar] [CrossRef]
- Kumar, K.A.; Prasad, A.; Metan, J. A hybrid deep CNN-Cov-19-Res-Net Transfer learning architype for an enhanced Brain tumor Detection and Classification scheme in medical image processing. Biomed. Signal Process. Control. 2022, 76, 103631. [Google Scholar]
- Salehi, A.W.; Khan, S.; Gupta, G.; Alabduallah, B.I.; Almjally, A.; Alsolai, H.; Siddiqui, T.; Mellit, A. A study of CNN and transfer learning in medical imaging: Advantages, challenges, future scope. Sustainability 2023, 15, 5930. [Google Scholar] [CrossRef]
- Manzari, O.N.; Ahmadabadi, H.; Kashiani, H.; Shokouhi, S.B.; Ayatollahi, A. MedViT: A robust vision transformer for generalized medical image classification. Comput. Biol. Med. 2023, 157, 106791. [Google Scholar] [CrossRef]
- Wu, X.; Feng, Y.; Xu, H.; Lin, Z.; Chen, T.; Li, S.; Qiu, S.; Liu, Q.; Ma, Y.; Zhang, S. CTransCNN: Combining transformer and CNN in multilabel medical image classification. Knowl.-Based Syst. 2023, 281, 111030. [Google Scholar] [CrossRef]
- Gu, A.; Goel, K.; Ré, C. Efficiently modeling long sequences with structured state spaces. arXiv 2021, arXiv:2111.00396. [Google Scholar]
- Gu, A.; Johnson, I.; Goel, K.; Saab, K.; Dao, T.; Rudra, A.; Ré, C. Combining recurrent, convolutional, and continuous-time models with linear state space layers. Adv. Neural Inf. Process. Syst. 2021, 34, 572–585. [Google Scholar]
- Gu, A.; Dao, T. Mamba: Linear-time sequence modeling with selective state spaces. arXiv 2023, arXiv:2312.00752. [Google Scholar]
- Ma, J.; Li, F.; Wang, B. U-mamba: Enhancing long-range dependency for biomedical image segmentation. arXiv 2024, arXiv:2401.04722. [Google Scholar]
- Yue, Y.; Li, Z. MedMamba: Vision Mamba for Medical Image Classification. arXiv 2024, arXiv:2403.03849. [Google Scholar]
- Liu, Y.; Tian, Y.; Zhao, Y.; Yu, H.; Xie, L.; Wang, Y.; Ye, Q.; Liu, Y. Vmamba: Visual state space model. arXiv 2024, arXiv:2401.10166. [Google Scholar]
- Howard, A.G.; Zhu, M.; Chen, B.; Kalenichenko, D.; Wang, W.; Weyand, T.; Andreetto, M.; Adam, H. Mobilenets: Efficient convolutional neural networks for mobile vision applications. arXiv 2017, arXiv:1704.04861. [Google Scholar]
- Zhang, X.; Zhou, X.; Lin, M.; Sun, J. Shufflenet: An extremely efficient convolutional neural network for mobile devices. In Proceedings of the IEEE Conference on Computer Vision and Pattern Recognition, Salt Lake City, UT, USA, 18–23 June 2018; pp. 6848–6856. [Google Scholar]
- Koonce, B.; Koonce, B.E. Convolutional Neural Networks with Swift for Tensorflow: Image Recognition and Dataset Categorization; Springer: Berlin/Heidelberg, Germany, 2021. [Google Scholar]
- Zhu, Y.; Newsam, S. Densenet for dense flow. In Proceedings of the 2017 IEEE International Conference on Image Processing (ICIP), Beijing, China, 17–20 September 2017; pp. 790–794. [Google Scholar]
- Woo, S.; Debnath, S.; Hu, R.; Chen, X.; Liu, Z.; Kweon, I.S.; Xie, S. Convnext v2: Co-designing and scaling convnets with masked autoencoders. In Proceedings of the IEEE/CVF Conference on Computer Vision and Pattern Recognition, Vancouver, BC, Canada, 17–24 June 2023; pp. 16133–16142. [Google Scholar]
- Ashwath, V.; Sikha, O.; Benitez, R. TS-CNN: A three-tier self-interpretable CNN for multi-region medical image classification. IEEE Access 2023, 11, 78402–78418. [Google Scholar] [CrossRef]
- Han, K.; Xiao, A.; Wu, E.; Guo, J.; Xu, C.; Wang, Y. Transformer in transformer. Adv. Neural Inf. Process. Syst. 2021, 34, 15908–15919. [Google Scholar]
- Han, K.; Wang, Y.; Chen, H.; Chen, X.; Guo, J.; Liu, Z.; Tang, Y.; Xiao, A.; Xu, C.; Xu, Y.; et al. A survey on vision transformer. IEEE Trans. Pattern Anal. Mach. Intell. 2022, 45, 87–110. [Google Scholar] [CrossRef] [PubMed]
- Yuan, L.; Chen, Y.; Wang, T.; Yu, W.; Shi, Y.; Jiang, Z.H.; Tay, F.E.; Feng, J.; Yan, S. Tokens-to-token vit: Training vision transformers from scratch on imagenet. In Proceedings of the IEEE/CVF International Conference on Computer Vision, Montreal, BC, Canada, 11–17 October 2021; pp. 558–567. [Google Scholar]
- Liu, Z.; Lin, Y.; Cao, Y.; Hu, H.; Wei, Y.; Zhang, Z.; Lin, S.; Guo, B. Swin transformer: Hierarchical vision transformer using shifted windows. In Proceedings of the IEEE/CVF International Conference on Computer Vision, Montreal, BC, Canada, 11–17 October 2021; pp. 10012–10022. [Google Scholar]
- Gu, A.; Dao, T.; Ermon, S.; Rudra, A.; Ré, C. Hippo: Recurrent memory with optimal polynomial projections. Adv. Neural Inf. Process. Syst. 2020, 33, 1474–1487. [Google Scholar]
- Nguyen, E.; Goel, K.; Gu, A.; Downs, G.; Shah, P.; Dao, T.; Baccus, S.; Ré, C. S4nd: Modeling images and videos as multidimensional signals with state spaces. Adv. Neural Inf. Process. Syst. 2022, 35, 2846–2861. [Google Scholar]
- Xing, Z.; Ye, T.; Yang, Y.; Liu, G.; Zhu, L. Segmamba: Long-range sequential modeling mamba for 3d medical image segmentation. arXiv 2024, arXiv:2401.13560. [Google Scholar]
- Ruan, J.; Xiang, S. Vm-unet: Vision mamba unet for medical image segmentation. arXiv 2024, arXiv:2402.02491. [Google Scholar]
- Codella, N.; Rotemberg, V.; Tschandl, P.; Celebi, M.E.; Dusza, S.; Gutman, D.; Helba, B.; Kalloo, A.; Liopyris, K.; Marchetti, M.; et al. Skin lesion analysis toward melanoma detection 2018: A challenge hosted by the international skin imaging collaboration (isic). arXiv 2019, arXiv:1902.03368. [Google Scholar]
- Pogorelov, K.; Randel, K.R.; Griwodz, C.; Eskeland, S.L.; de Lange, T.; Johansen, D.; Spampinato, C.; Dang-Nguyen, D.T.; Lux, M.; Schmidt, P.T.; et al. Kvasir: A multi-class image dataset for computer aided gastrointestinal disease detection. In Proceedings of the 8th ACM on Multimedia Systems Conference, Taipei, Taiwan, 20–23 June 2017; pp. 164–169. [Google Scholar]
- Bhuvaji, S.; Kadam, A.; Bhumkar, P.; Dedge, S.; Kanchan, S. Brain Tumor Classification (MRI) Dataset. 2020. Available online: https://www.kaggle.com/sartajbhuvaji/brain-tumor-classification-mri (accessed on 28 July 2024).
- Wen, L.; Li, X.; Li, X.; Gao, L. A new transfer learning based on VGG-19 network for fault diagnosis. In Proceedings of the 2019 IEEE 23rd International Conference on Computer Supported Cooperative Work in Design (CSCWD), Porto, Portugal, 6–8 May 2019; pp. 205–209. [Google Scholar]


| Hyperparameter | Value | Remark |
|---|---|---|
| Learning rate | 0.001 | Controls the step size of each parameter update |
| 0.9 | First-order exponential decay factor used to calculate the gradient | |
| 0.999 | Two-order exponential decay factor used to calculate the gradient | |
| Weight decay | Control the amplitude of the parameters to prevent overfitting |
| Methods | Acc(%) ↑ | Fl(%) ↑ | Prec(%) ↑ | Recall(%) ↑ |
|---|---|---|---|---|
| ResNet | 93.46 | 93.51 | 93.78 | 93.25 |
| ConvNeXt | 94.06 | 93.94 | 94.09 | 93.79 |
| VGG19 | 94.12 | 94.05 | 94.22 | 93.89 |
| ViTB | 94.36 | 94.39 | 94.53 | 94.26 |
| Swin-T | 95.02 | 95.61 | 95.44 | 95.79 |
| Ours | 97.38 | 97.05 | 96.98 | 97.12 |
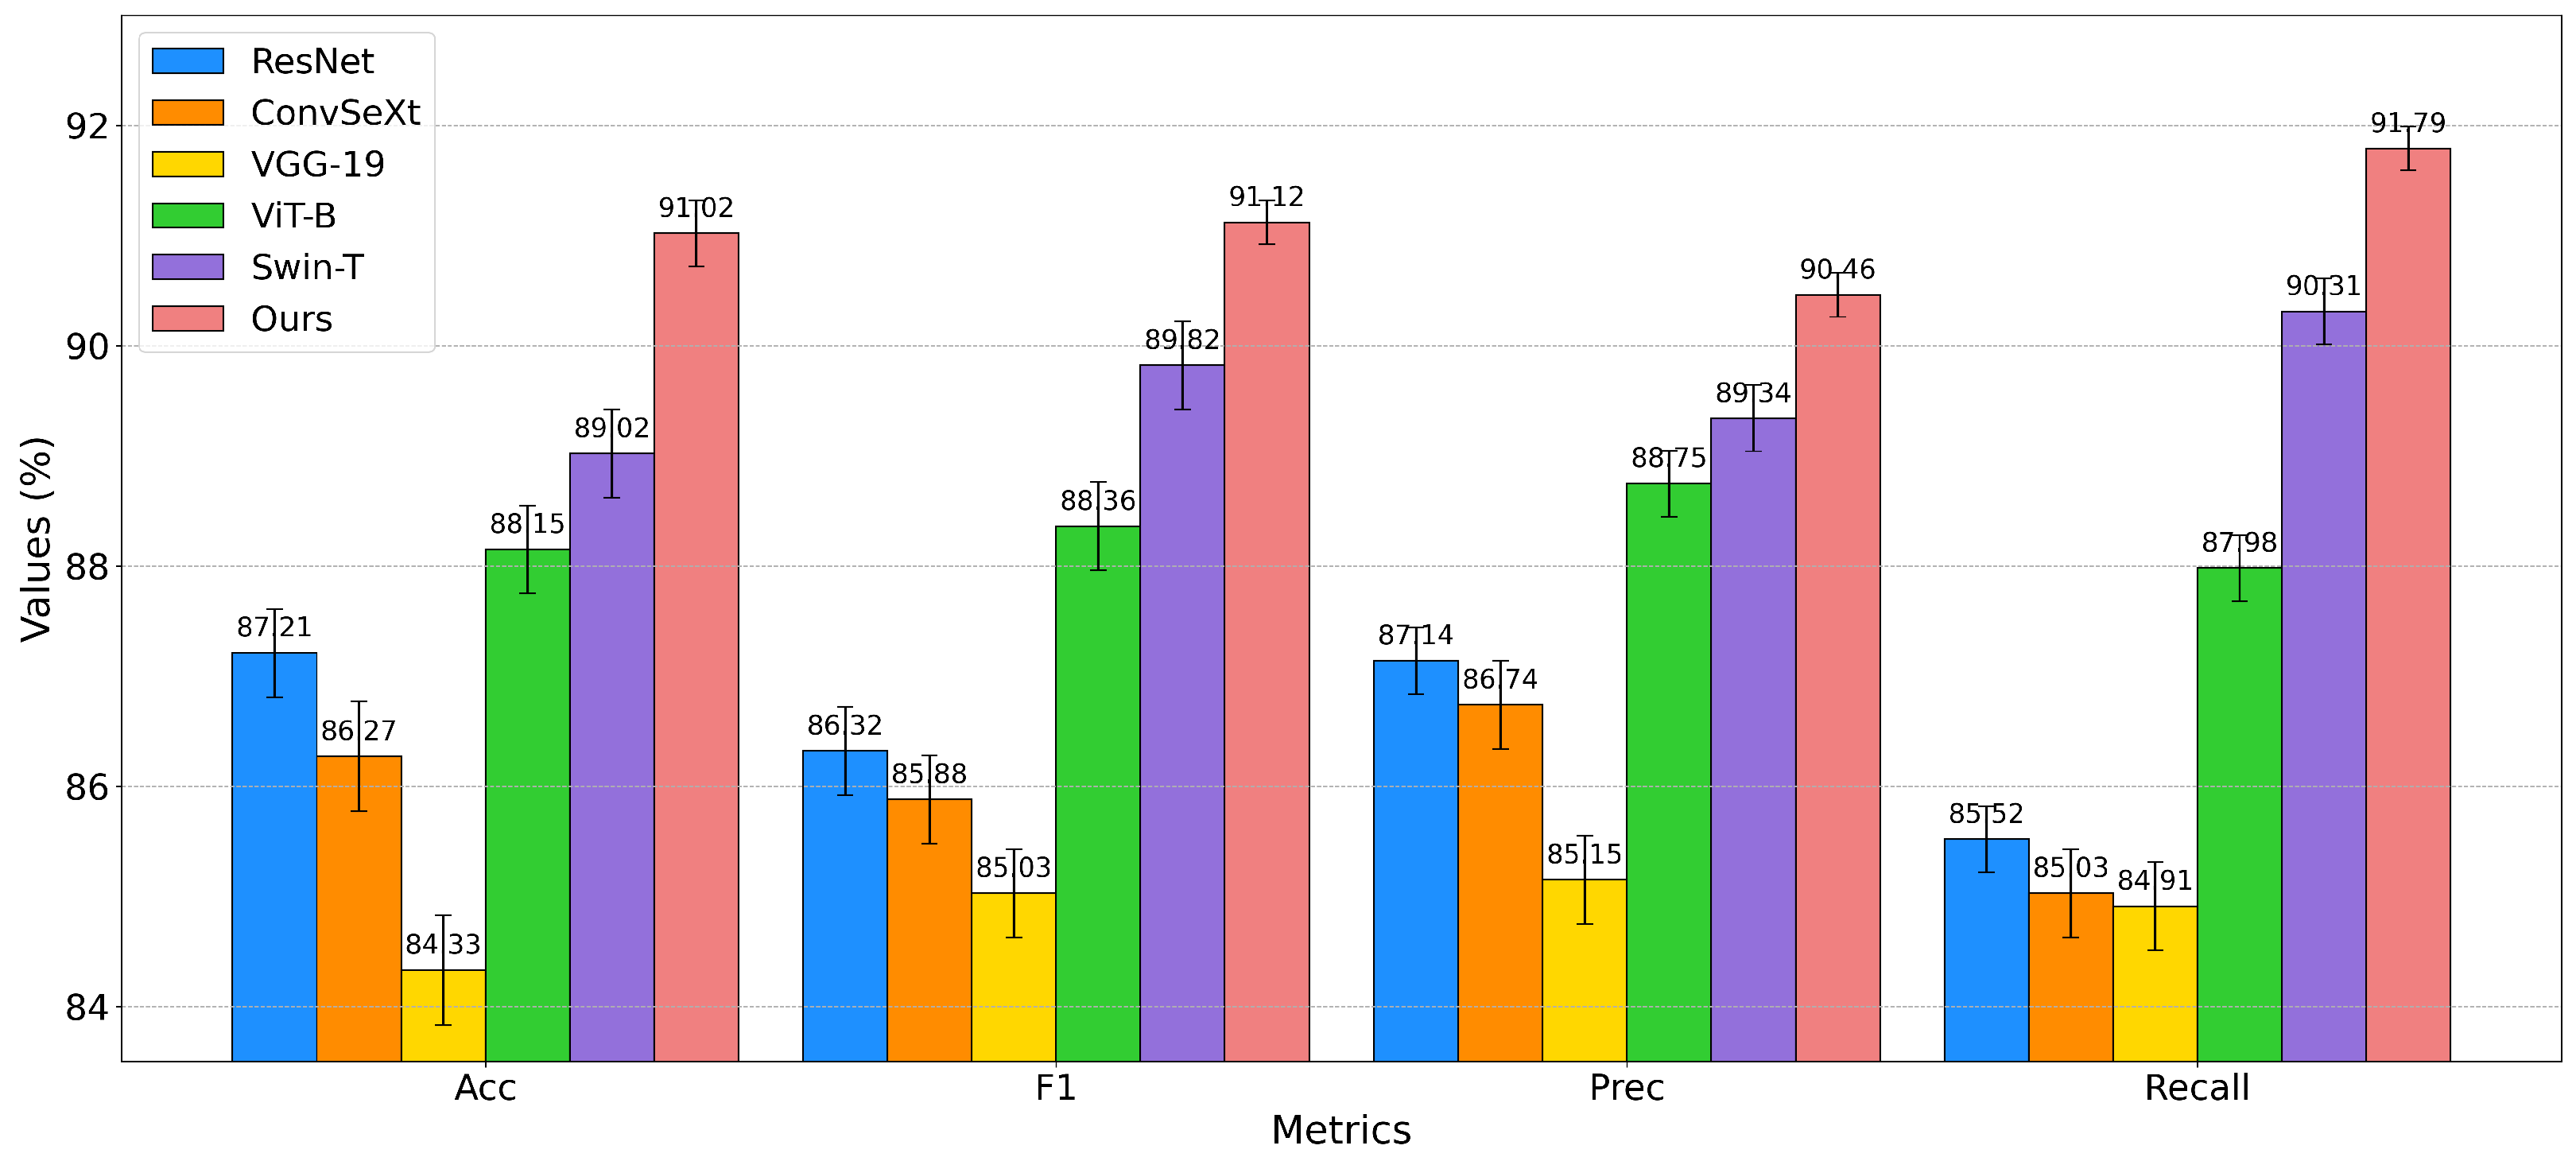
| Methods | Acc(%) ↑ | Fl(%) ↑ | Prec(%) ↑ | Recall(%) ↑ |
|---|---|---|---|---|
| ResNet | 87.21 | 86.32 | 87.14 | 85.52 |
| ConvNeXt | 86.27 | 85.88 | 86.74 | 85.03 |
| VGG-19 | 84.33 | 85.03 | 85.15 | 84.91 |
| ViT-B | 88.15 | 88.36 | 88.75 | 87.98 |
| Swin-T | 89.02 | 89.82 | 89.34 | 90.31 |
| Ours | 91.02 | 91.12 | 90.46 | 91.79 |
| Methods | Acc(%) ↑ | Fl(%) ↑ | Prec(%) ↑ | Recall(%) ↑ |
|---|---|---|---|---|
| ResNet | 79.76 | 78.06 | 78.03 | 78.10 |
| ConvNeXt | 77.34 | 76.01 | 76.14 | 75.88 |
| VGG-19 | 78.76 | 76.37 | 76.49 | 76.26 |
| ViT-B | 79.64 | 77.53 | 77.86 | 77.20 |
| Swin-T | 80.41 | 79.30 | 79.36 | 79.24 |
| Ours | 82.00 | 80.32 | 80.15 | 79.51 |
| Methods | Acc(%) ↑ | Fl(%) ↑ | Prec(%) ↑ | Recall(%) ↑ |
|---|---|---|---|---|
| ResNet | 76.90 | 76.54 | 76.91 | 76.18 |
| ConvSeXt | 74.54 | 74.63 | 74.62 | 74.63 |
| VGG-19 | 77.75 | 77.78 | 77.82 | 77.74 |
| ViT-B | 76.03 | 76.09 | 76.23 | 75.96 |
| Swin-T | 77.32 | 77.25 | 77.24 | 77.26 |
| Ours | 79.21 | 78.73 | 78.84 | 78.62 |
| Methods | Acc(%) ↑ | Fl(%) ↑ | Prec(%) ↑ | Recall(%) ↑ |
|---|---|---|---|---|
| ResNef | 89.99 | 88.74 | 89.03 | 88.45 |
| ComvNeXt | 88.14 | 88.43 | 88.48 | 88.39 |
| VGG-19 | 86.18 | 86.05 | 86.31 | 85.79 |
| ViT-B | 90.18 | 89.91 | 89.69 | 90.13 |
| Swin-T | 91.33 | 91.03 | 90.48 | 91.59 |
| Ous | 93.26 | 92.36 | 91.29 | 93.46 |
| Methods | Acc(%) ↑ | Fl(%) ↑ | Prec(%) ↑ | Recall(%) ↑ |
|---|---|---|---|---|
| ResNet | 87.01 | 86.50 | 86.23 | 86.77 |
| ConvNeXt | 86.03 | 85.28 | 85.14 | 85.42 |
| VGG-19 | 83.11 | 83.76 | 83.64 | 83.88 |
| ViT-B | 88.32 | 88.39 | 88.02 | 88.77 |
| Swin-T | 88.56 | 89.10 | 88.87 | 89.33 |
| Ours | 90.38 | 90.29 | 90.13 | 90.45 |
Disclaimer/Publisher’s Note: The statements, opinions and data contained in all publications are solely those of the individual author(s) and contributor(s) and not of MDPI and/or the editor(s). MDPI and/or the editor(s) disclaim responsibility for any injury to people or property resulting from any ideas, methods, instructions or products referred to in the content. |
© 2024 by the authors. Licensee MDPI, Basel, Switzerland. This article is an open access article distributed under the terms and conditions of the Creative Commons Attribution (CC BY) license (https://creativecommons.org/licenses/by/4.0/).
Share and Cite
Hu, C.; Cao, N.; Zhou, H.; Guo, B. Medical Image Classification with a Hybrid SSM Model Based on CNN and Transformer. Electronics 2024, 13, 3094. https://doi.org/10.3390/electronics13153094
Hu C, Cao N, Zhou H, Guo B. Medical Image Classification with a Hybrid SSM Model Based on CNN and Transformer. Electronics. 2024; 13(15):3094. https://doi.org/10.3390/electronics13153094
Chicago/Turabian StyleHu, Can, Ning Cao, Han Zhou, and Bin Guo. 2024. "Medical Image Classification with a Hybrid SSM Model Based on CNN and Transformer" Electronics 13, no. 15: 3094. https://doi.org/10.3390/electronics13153094
APA StyleHu, C., Cao, N., Zhou, H., & Guo, B. (2024). Medical Image Classification with a Hybrid SSM Model Based on CNN and Transformer. Electronics, 13(15), 3094. https://doi.org/10.3390/electronics13153094