Abstract
The accurate segmentation of lung nodules in computed tomography (CT) images is crucial for the early screening and diagnosis of lung cancer. However, the heterogeneity of lung nodules and their similarity to other lung tissue features make this task more challenging. By using large receptive fields from large convolutional kernels, convolutional neural networks (CNNs) can achieve higher segmentation accuracies with fewer parameters. However, due to the fixed size of the convolutional kernel, CNNs still struggle to extract multi-scale features for lung nodules of varying sizes. In this study, we propose a novel network to improve the segmentation accuracy of lung nodules. The network integrates adaptive large kernel attention (ALK) blocks, employing multiple convolutional layers with variously sized convolutional kernels and expansion rates to extract multi-scale features. A dynamic selection mechanism is also introduced to aggregate the multi-scale features obtained from variously sized convolutional kernels based on selection weights. Based on this, we propose a lightweight convolutional neural network with large convolutional kernels, called ALKU-Net, which integrates the ALKA module in a hierarchical encoder and adopts a U-shaped decoder to form a novel architecture. ALKU-Net efficiently utilizes the multi-scale large receptive field and enhances the model perception capability through spatial attention and channel attention. Extensive experiments demonstrate that our method outperforms other state-of-the-art models on the public dataset LUNA-16, exhibiting considerable accuracy in the lung nodule segmentation task.
1. Introduction
According to the latest global cancer data report released by the International Agency for Research on Cancer (IARC) under the World Health Organization (WHO), lung cancer has emerged as the most lethal cancer worldwide [1]. By 2024, lung cancer is projected to have the third highest incidence rate, following breast cancer and prostate cancer, while maintaining the highest mortality rate, posing a significant threat to human health and social development [2]. Lung cancer often remains asymptomatic in its early stages, causing patients to frequently miss the optimal treatment window. The timely identification and prompt implementation of interventions have the potential to substantially enhance the five-year survival outcome among individuals diagnosed with lung cancer. The appearance of lung nodules is a key indicator for the early diagnosis of lung cancer. Therefore, accurately identifying and analyzing lung nodules using chest computed tomography (CT) images is an effective method for achieving early diagnosis [3]. In this process, the precise segmentation of lung nodules is crucial, as it directly determines the final diagnostic results. Traditional manual film reading methods require radiologists to analyze chest CT scans layer by layer. This high-intensity work and continuous reading fatigue can lead to misdiagnosis or missed diagnosis, and it demands a high level of professional expertise from the radiologists [4]. Given the diversity in size and shape of lung nodules, and their similarity to surrounding tissues, this significantly challenges the performance of segmentation models. As shown in the figure, various lung nodules in CT images exhibit different visual characteristics, making the accurate segmentation of these nodules a challenging task [5]. As shown in the figure, various lung nodules in CT images exhibit different visual characteristics, making the accurate segmentation of these nodules a challenging task.
U-Net [6] is a widely used model in the field of deep learning. The proposed “decoder–encoder” structure is widely utilized in medical image segmentation tasks. Recent studies have improved its performance through innovative modifications to the U-Net encoder structure. However, most variants of U-Net still have some deficiencies. The fixed size of the convolutional kernels results in a fixed receptive field size. Using convolutional kernels of varying sizes to extract multi-scale features can effectively enhance the model’s feature extraction capability. We developed a novel three-dimensional convolutional neural network (CNN) that includes a hierarchical encoder and a U-shaped CNN-based decoder. The primary contributions of this study are summarized below:
- We developed an adaptive large kernel attention module based on a spatial selection mechanism and LKA, which utilizes multiple large convolutional kernels to extract multi-scale features. This module employs a dynamic selection mechanism and integrates spatial and channel attention strategies to enhance the model’s ability to efficiently extract multi-scale features.
- Based on the aforementioned techniques, we propose a novel medical image segmentation architecture for lung nodule segmentation. By introducing an adaptive module, we have modified the encoder component to enhance the feature extraction capabilities.
- Compared to the current state-of-the-art 3D segmentation methods based on CNN and Transformer technologies, our method demonstrates superior performance on the LUNA-16 dataset evaluation metrics.
2. Related Work
In recent years, a multitude of scholars have undertaken comprehensive investigations into methodologies for segmenting lung nodules, which can be broadly categorized into two types: traditional methods based on image processing techniques and segmentation methods based on deep learning. Traditional methods segment lung nodules based on features such as shape, grayscale, texture, and gradient. The region growing method starts from a selected seed point and gradually aggregates neighboring pixels based on certain similarity criteria, such as grayscale value, color, and texture. Jamshid et al. [7] proposed a region growing method for lung nodule segmentation, which employs an adaptive thresholding technique to dynamically adjust the criteria, demonstrating good segmentation performance. Morphological methods separate lung nodules from the lung background tissue through morphological operations. Rendon et al. [8] utilized morphological methods to segment lung nodules using the shape, texture, and grayscale features of the image. The segmented nodules were classified using a support vector machine (SVM). Lavanya et al. [9] implemented a fuzzy local information clustering mean algorithm for lung nodule segmentation in CT images. The sensitivity of this method was enhanced compared with other fuzzy clustering-based methods. Although traditional algorithms can effectively segment lung nodules, they have several shortcomings. These methods are cumbersome and inefficient in design, and their segmentation results rely heavily on manually selected features. This process is time-consuming and subject to the experimenter’s influence, and the selection of inappropriate features can lead to the failure of subsequent processing.
In fact, convolutional neural network-based approaches show excellent performance in medical image segmentation tasks, and CT images of the lungs are composed of multiple two-dimensional slices. Therefore, lung nodule segmentation networks can be categorized into two types: 2D CNNs and 3D CNNs. Two-dimensional (2D) CNN methods use individual slices as input to obtain the two-dimensional segmentation results for each slice. Three-dimensional (3D) CNN methods, on the other hand, process CT images as a whole. The U-Net architecture was proposed for medical image segmentation tasks [6], making the “U”-shaped structure, consisting of an encoder and decoder, one of the most common segmentation network architectures used by scholars. Su et al. [10] proposed Msu-net, which captures and integrates features at different scales to improve segmentation accuracy and robustness. Wang et al. [11] proposed a model named Center Focused Convolutional Neural Network (CFCNN), which enhances the learning of the central region of lung nodules in the convolutional layers. It also employs a multi-layer feature fusion technique, combining features from different levels to improve segmentation accuracy. Zhou et al. [12] developed UNet++, based on U-Net, introducing densely connected skip pathways in the traditional U-Net structure to improve feature fusion and outperform U-Net. Huang et al. [13] proposed UNet3+, which innovatively designed full-scale skip connections and classification-guided modules, achieving better results. Yue et al. [14] designed a novel boundary refinement network (BRNet) for polyp segmentation, which fused low-level spatial details and high-level features through a boundary generation module and refined perceptual features using a boundary-guided refinement module. This approach yielded excellent segmentation results on all five datasets. In exploring 3D CNNs, Cicek et al. [15] developed the 3D U-Net by replacing 2D convolutions with 3D convolutions and adding more convolutional layers and feature channels. Liu et al. [16] proposed a method based on a cascaded dual-path residual network, which processes local detail information and global context information through two separate paths, significantly improving segmentation performance. Agnes et al. [17] proposed a multi-scale fully convolutional U-Net utilizing a multi-scale convolutional kernel to extract basic features and applying Maxout aggregation to optimize nodule segmentation results. The experimental results demonstrated that an 83% Dice score was obtained on the LIDC-IDRI dataset. Tyagi et al. [18] proposed a lung nodule segmentation method based on a 3D conditional generative adversarial network to optimize segmentation results through data distribution. Additionally, the concurrent squeezing and excitation module combined with a U-Net architecture is used as the generator, while a simple network with spatial squeezing and channel excitation modules serves as the classifier. A Dice similarity coefficient of 80.74% was achieved on the LUNA-16 test set.
The exceptional performance of Transformers in computer vision challenges the dominance of traditional CNNs, overcoming the shortcomings of CNNs in global feature extraction and effectively capturing global dependencies. TransUNet [19] utilizes a hybrid CNN–Transformer architecture as an encoder, balancing the Transformer’s capacity to capture global information with the CNN’s ability to extract local information. SwinUNETR [20] introduces the Swin Transformer module into the encoder, computing self-attention to enhance the accuracy of 3D MRI image brain tumor segmentation. However, Transformer-based segmentation networks still require long training times and are accompanied by high computational complexity. Therefore, exploring how to simulate the behavior of Transformers through convolutional neural networks for efficient feature extraction has become a new research direction. Li et al. [21] combined LK convolution with self-attention and applied it to the decoder of a 3D MRI image segmentation network. Han et al. [22] used ConvNeXt as an encoder backbone and simulated it by designing, among other things, a deep convolution of 7 × 7 size to leverage the Transformer’s advantages for medical image segmentation tasks. Three-dimensional (3D) UX-Net [23] improves the hierarchical Transformer encoder based on ConvNeXt, employing 7 × 7 × 7 large convolutional kernels to simulate the characteristics of a hierarchical Transformer, achieving excellent results in 3D segmentation tasks.
3. Method
3.1. Adaptive Large Kernel Attention(ALKA)
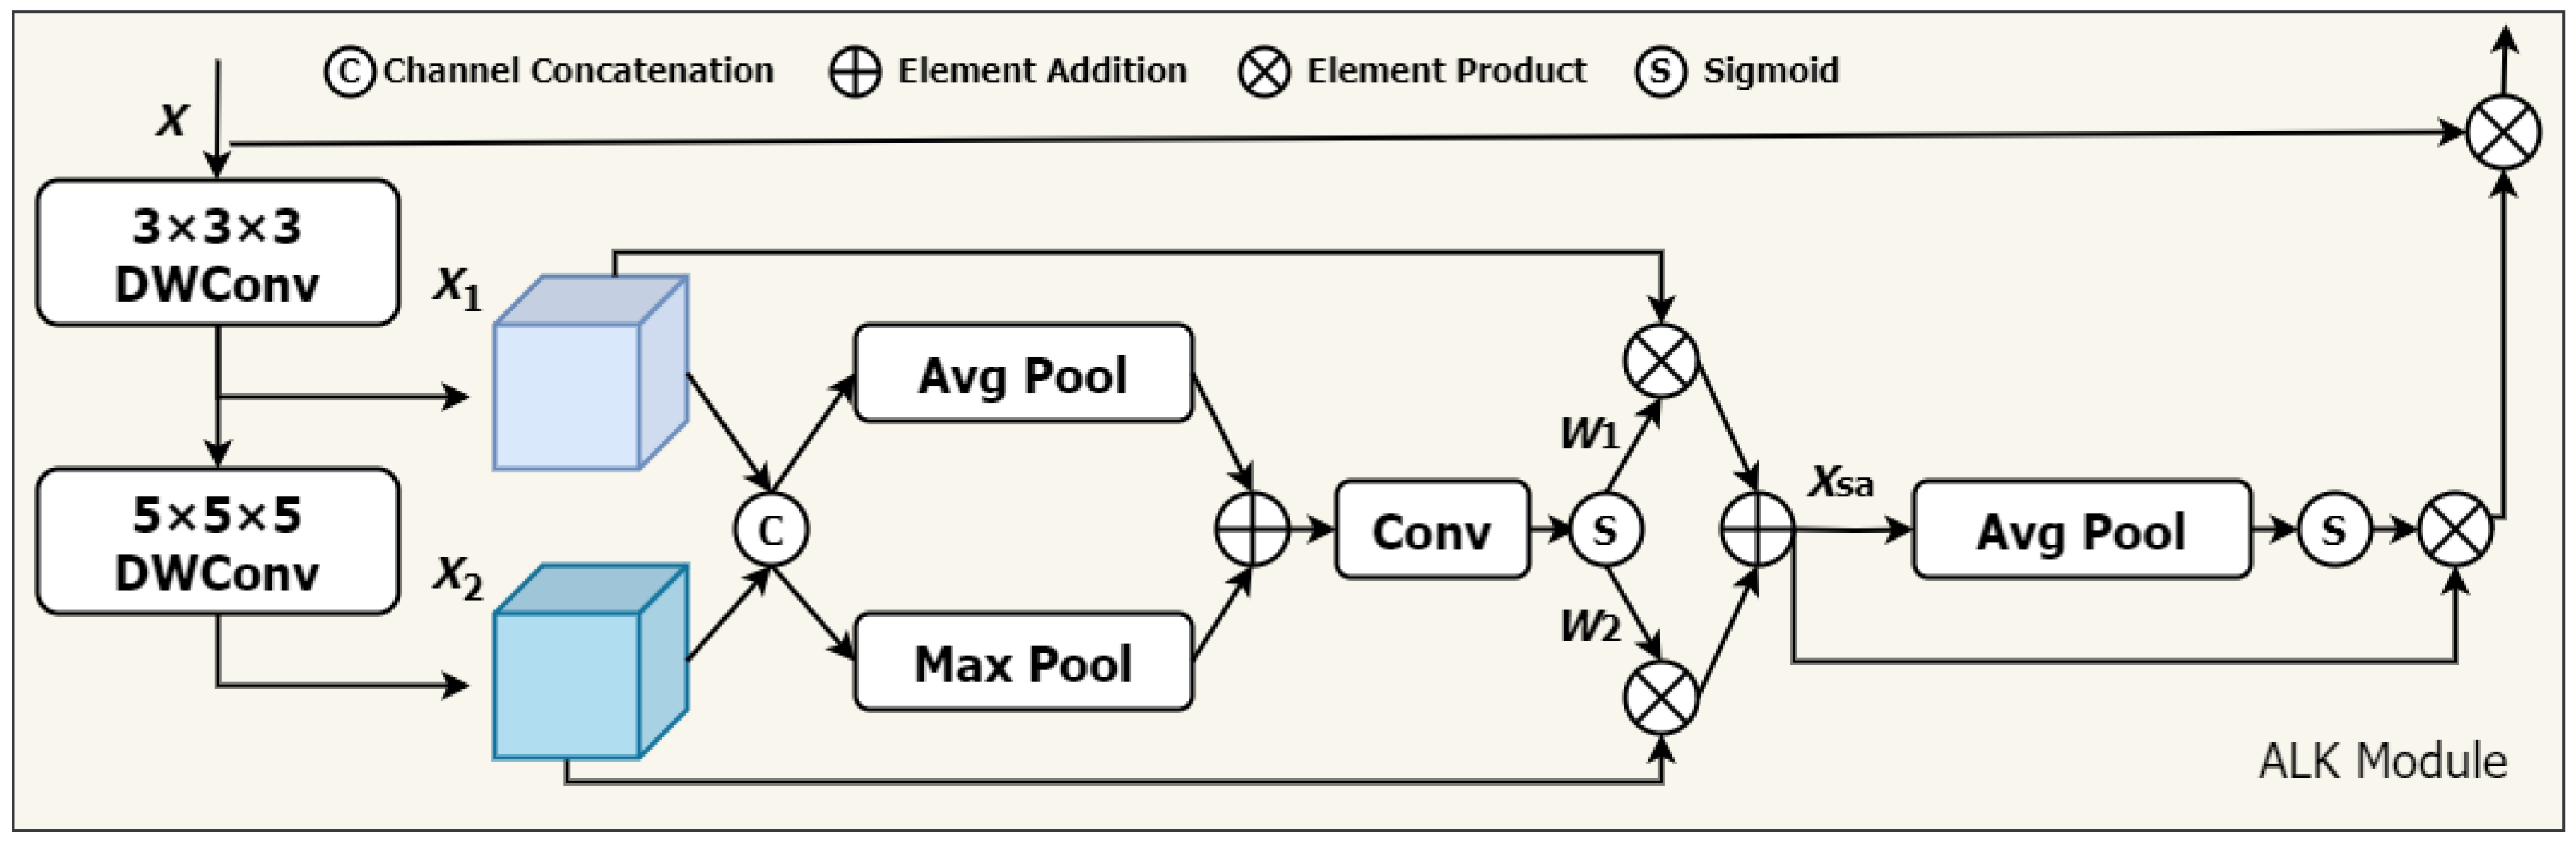
We propose a novel approach that adaptively adjusts the receptive field of convolutional operations according to various needs, utilizing spatial and channel contextual information more efficiently, The network architecture is illustrated in Figure 1. Specifically, inspired by VAN, we integrate two primary components: (1) deep convolution, utilizing convolution kernels of different sizes , and (2) deep inflationary convolution, utilizing convolution kernels of size with an inflation rate of d. The combination is based on the idea that a convolution kernel of size can serve as an alternative to a traditional convolution kernel. This combination simulates the effect of large convolutional kernels (size K) on the receptive field.
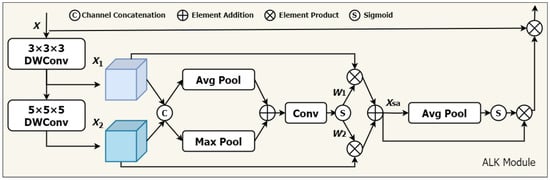
Figure 1.
The architecture of the ALKA. Feature maps and are extracted by 3 × 3 × 3 DWConv and 5 × 5 × 5 DWConv from input features X, respectively. The dynamic selection values and are generated to calibrate features and .
In addition, a spatial selection mechanism is introduced to dynamically adjust the weights of features extracted by convolution kernels of varying depths, considering spatial adaptivity. This enables the model to select appropriate convolution kernels according to actual needs and effectively extract key information from different locations. Furthermore, to enhance model performance in the channel dimension, we incorporate a channel attention module to improve the feature representation of each channel. Our proposed ALKA module offers two primary advantages. (1) It can generate multiple feature maps with varying sized receptive fields and effectively extract feature information from lung nodules of different sizes. (2) The combination of spatial selection mechanism and channel attention helps overcome limitations in handling lung nodules of varying sizes, shapes, and grayscale information, thereby improving the model’s perceptual ability. In this study, we utilize two primary convolutional layer designs: (1) a deep convolutional layer, with a convolutional kernel size of 3 × 3 × 3, padding of 1, and expansion rate of 1; and a (2) deep expansion convolutional layer, with a convolutional kernel size of 5 × 5 × 5, padding of 4, and expansion rate of 2. For the input feature X, it is as follows:
where DWConv denotes a depthwise convolutional layer with a convolutional kernel size of k and a dilation rate of d.
By stacking these deep convolutional layers, our ALK module can simulate the receptive field of a 7 × 7 × 7 convolutional kernel, extracting long-distance relationships efficiently with low computational cost. Next, we introduce a spatial selection mechanism to compute the weights of the feature maps generated by various convolutional kernels. The steps are as follows. First, global maximum pooling and global average pooling operations are performed on each channel. This step aims to obtain the attention weights for each spatial location (i.e., each pixel).
Subsequently, a convolutional layer is employed to produce an attention weight map that matches the dimensions of the feature map with a convolutional kernel size of 7 and padding of 3. The dynamic weights and are obtained through a sigmoid function.
denotes the nth channel of the convolutional output feature map processed by the sigmoid function.
After obtaining the attention weights, they are multiplied by the original feature maps in a weighted manner, which is the process of adaptively selecting features from different convolutional kernels.
Next, we employ one-dimensional convolution to facilitate local cross-channel interactions, capturing inter-channel dependencies. The specific steps are detailed as follows: first, global average pooling is applied to the input feature map, which is followed by a one-dimensional convolution with a kernel size of 3. The channel weights W are obtained using a sigmoid function and then multiplied by the corresponding elements of the input feature map. Finally, the resulting feature map is applied with a residual connection, as shown in the following formula:
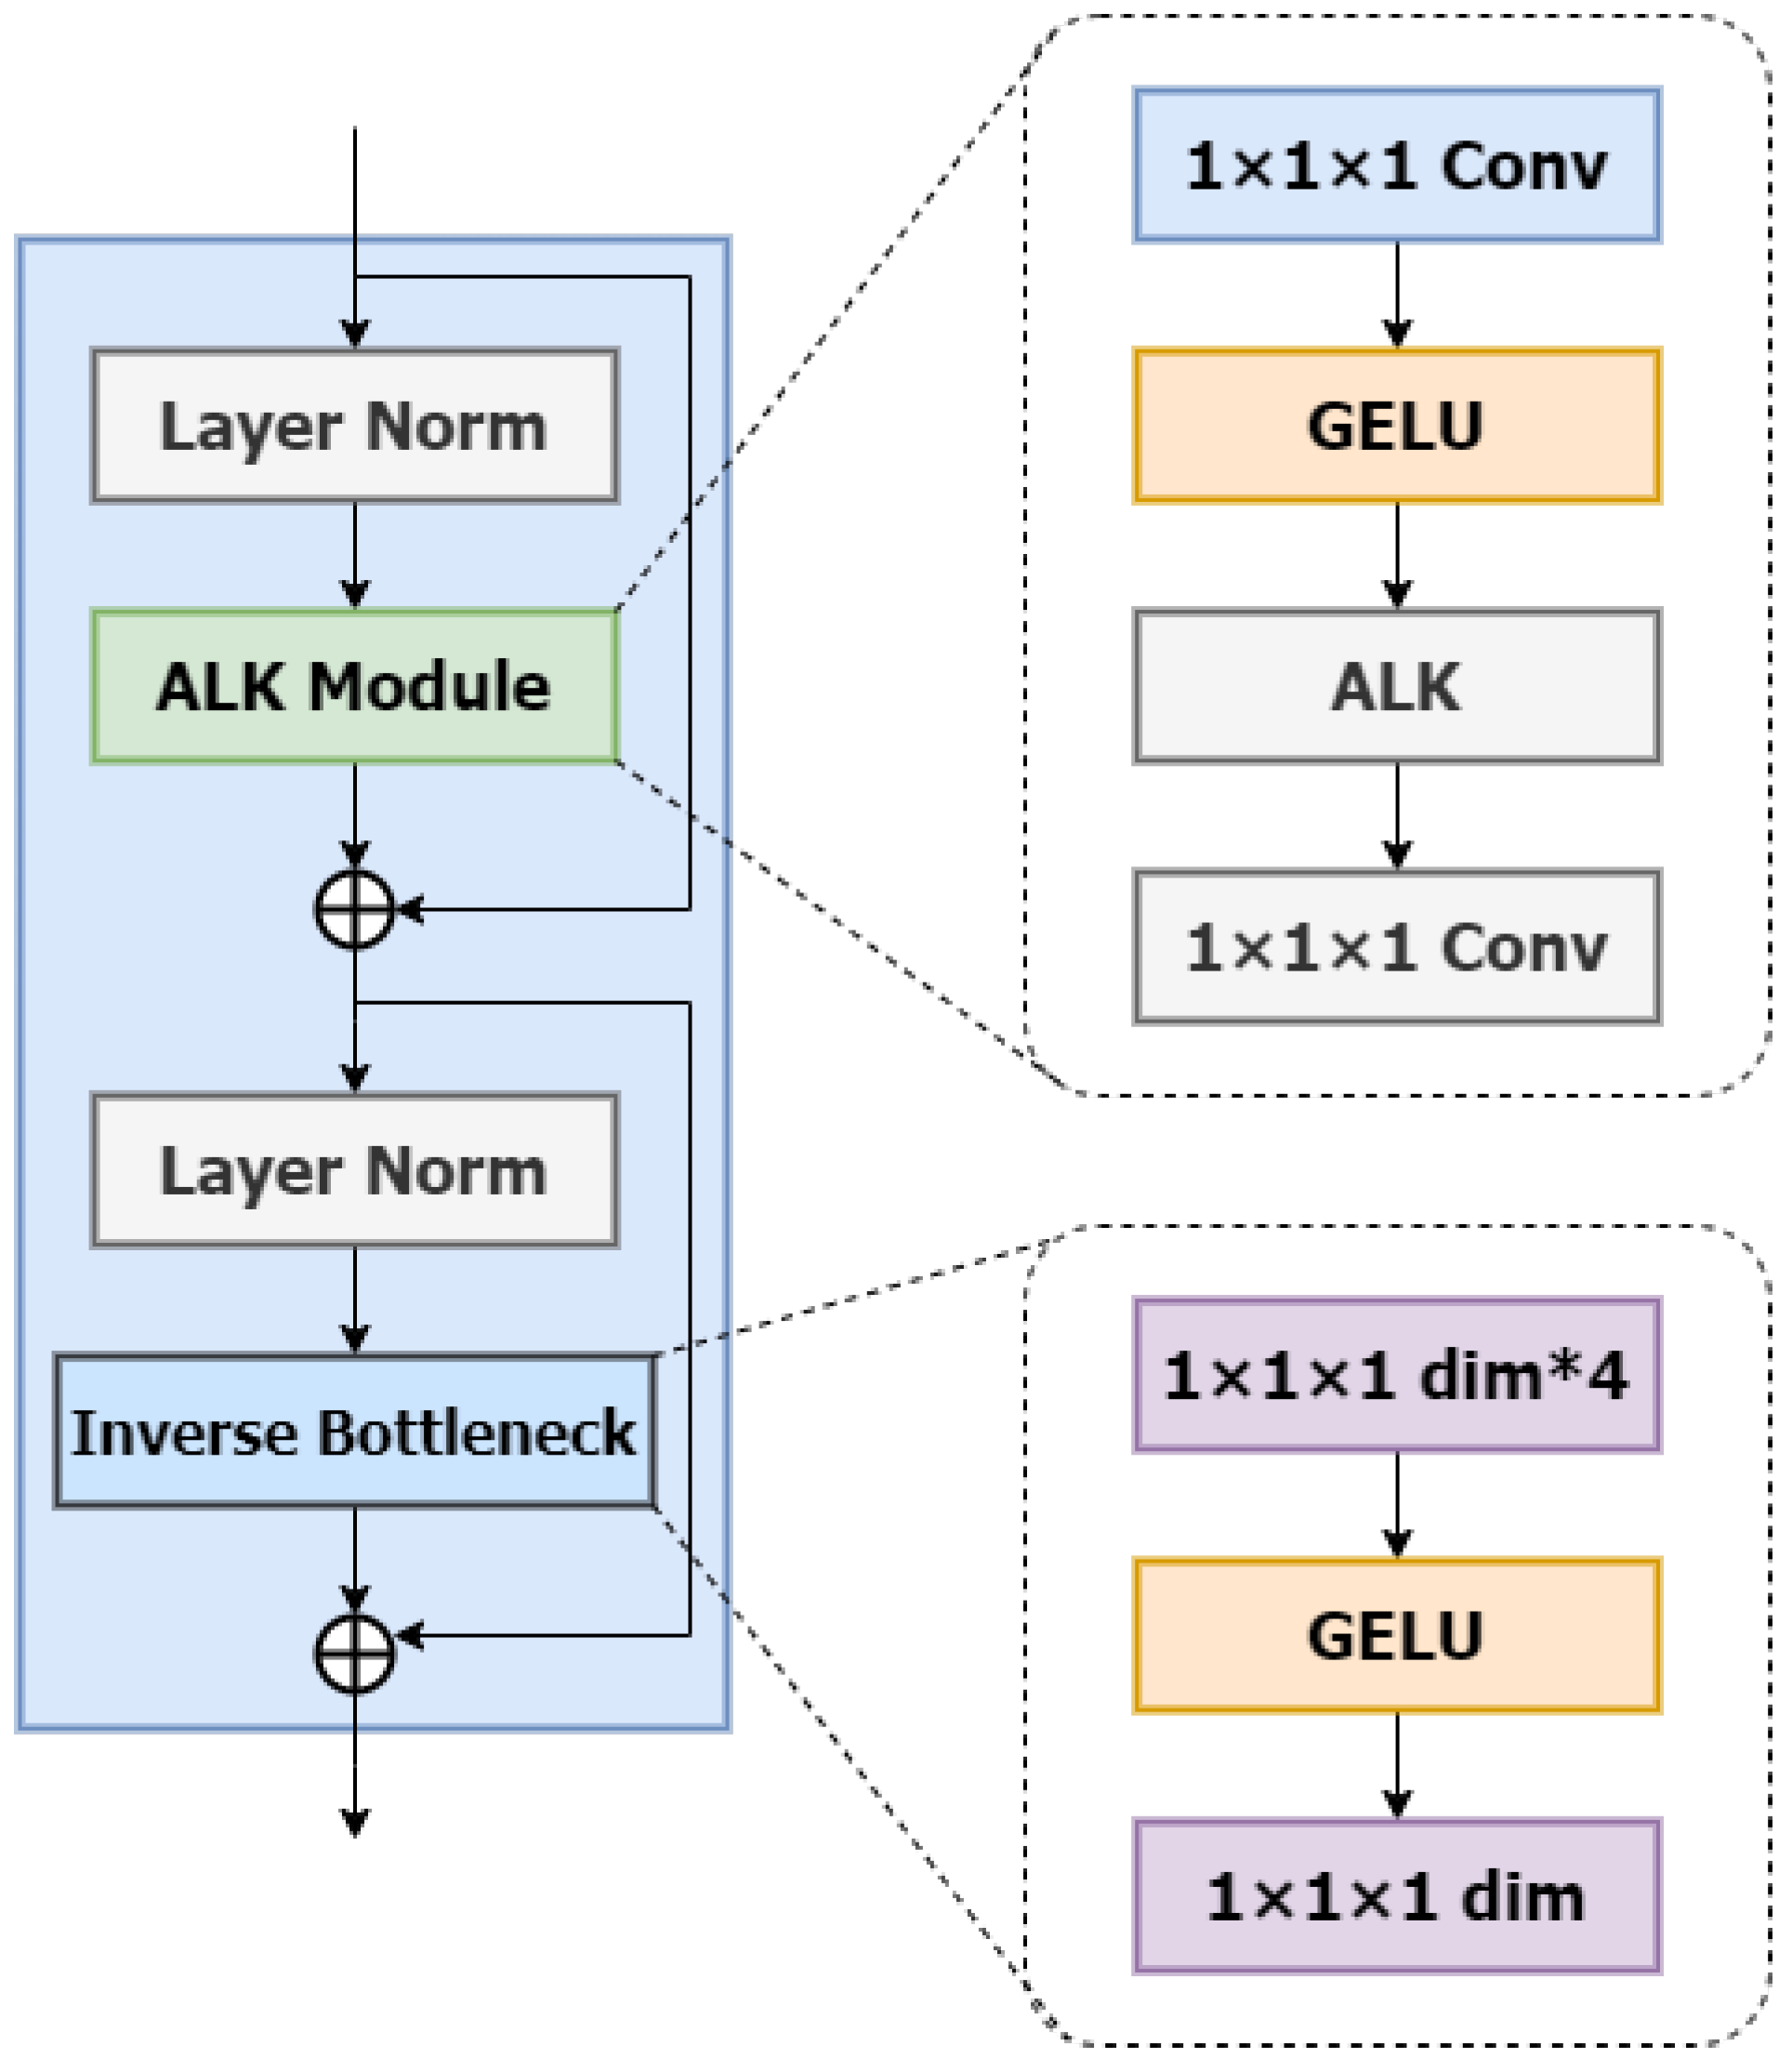
ALKA Blocks: In this section, we will introduce the detailed design of ALKA blocks with the specific structure shown in Figure 2. Inspired by VAN [24] and ConvNext V2 [25], the ALKA module comprises a layer normalization layer and two point-by-point convolutional layers (PCLs) with a kernel size of 1 × 1 × 1. It is integrated between these two PCL layers and employs a GELU activation function. In addition, the module incorporates residual connectivity to enhance performance.
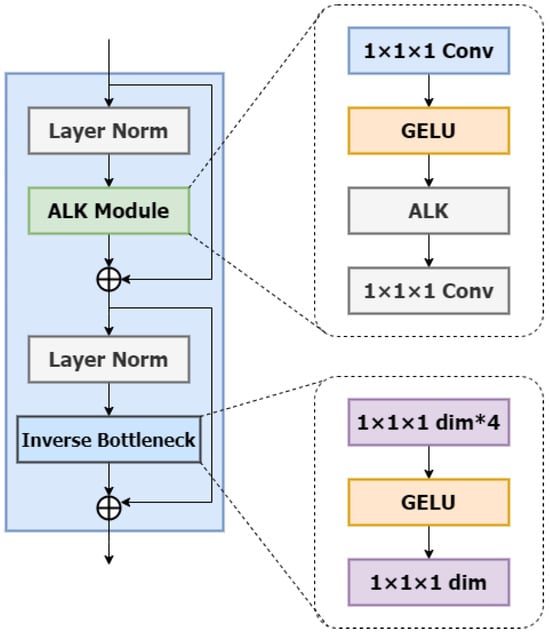
Figure 2.
The architecture of the ALKA block. The symbol * denotes the multiplication operation.
Beyond the ALKA module, the structure of the ALKA block includes an Inverted Bottleneck layer. This Inverted Bottleneck layer also employs a point-by-point convolutional layer (PCL) with a kernel size of 1 × 1 × 1 with the hidden dimension designed to be four times the input size. This design enriches feature representation by expanding and compressing each channel.
Compared to network architectures utilizing multi-layer perceptron (MLP), our approach achieves comparable performance with fewer parameters. A layer normalization is similarly applied before the Inverted Bottleneck layer, and a residual connection is implemented after the module for correction.
Among them, and are inputs and outputs from different depth levels; denotes layer normalization; and represent the ALKA module and inverse residual bottleneck block, respectively; and denotes pointwise convolution.
3.2. Network Architecture
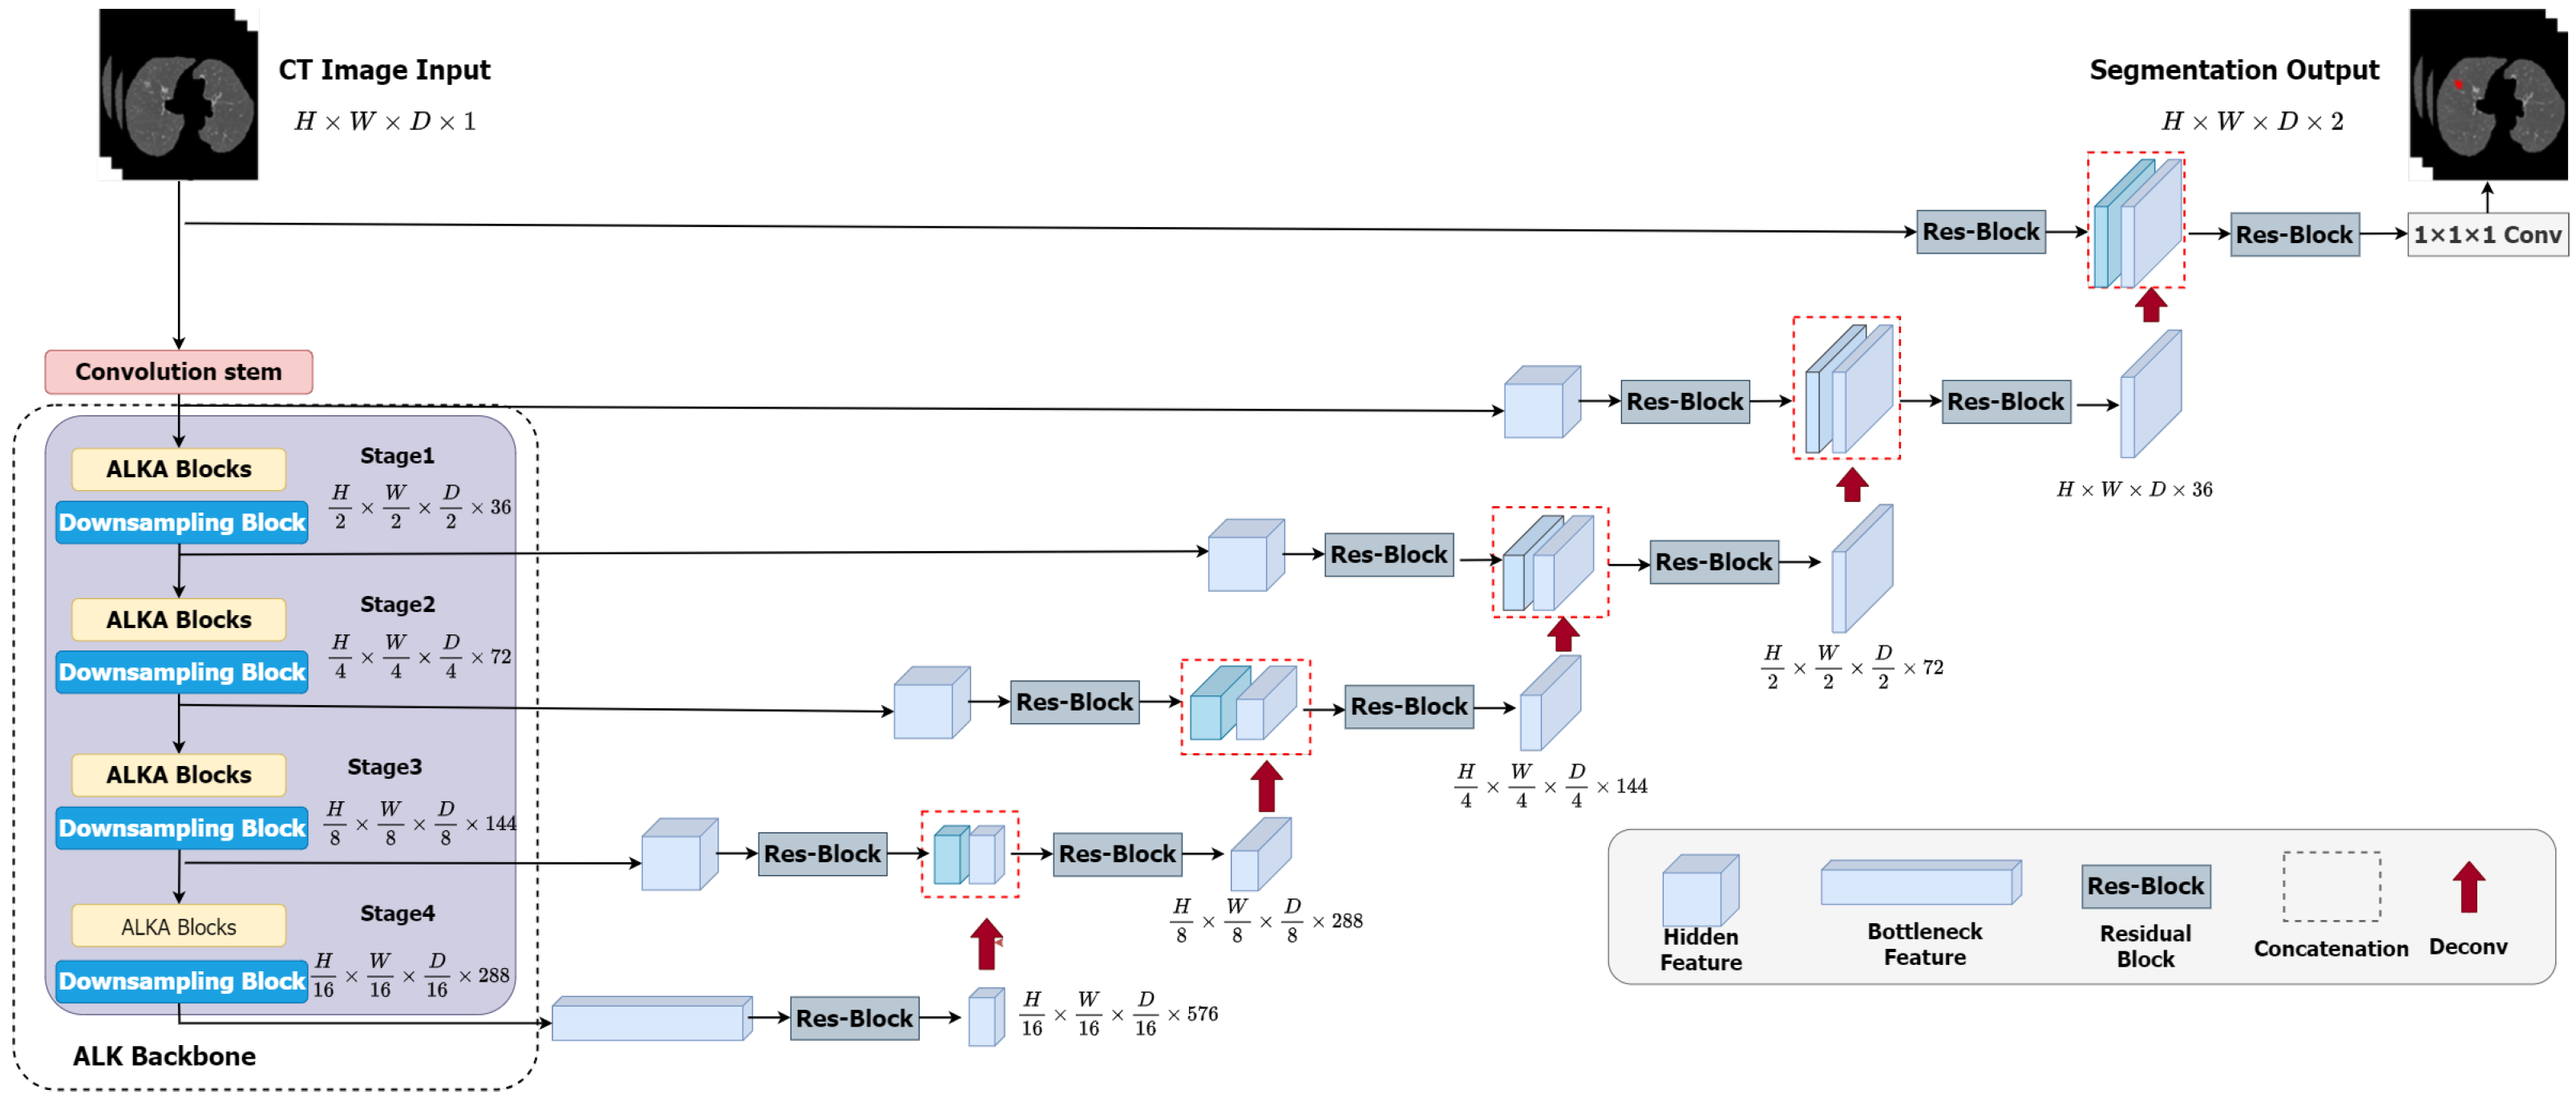
The overall framework of the ALKU-Net network is shown in Figure 3. The proposed network includes a Convolutional Stem, hierarchical encoder, and decoder. The ALKA module is employed in the encoder path at each stage of the network, aiming to extract local and global context as well as spatial and channel-aware information. Features are input into the ConvNet-based decoder through skip connections. The details of the encoder and decoder will be further explained in this subsection.
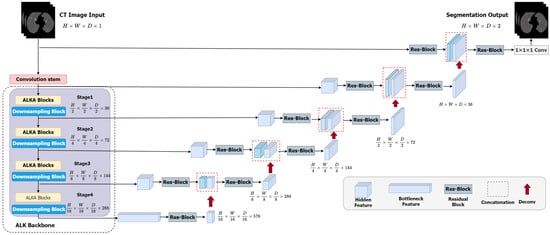
Figure 3.
Overview of the proposed ALKU-Net.
3.2.1. Convolutional Stem
As shown in Figure 3, in ALKU-Net, the input is initially processed through a convolutional stem. This convolutional stem has a kernel size of 4 and a stride of 2, and it is used in conjunction with a layer normalization module. Through this convolution operation, we downsample the original volumetric image (size to . This downsampling process aids in extracting local and spatial information across channels.
3.2.2. Hierarchical Encoder and Decoder
The encoder structure proposed in this paper comprises four stages, each consisting of two consecutive ALKA blocks followed by a downsampling block. In each stage, the feature map is initially processed by the ALKA block and subsequently passed to the downsampling block. The downsampling block reduces the size of the feature map by half while doubling the number of channels. The feature map resolutions obtained at the four stages are , , and ; these features are then fed into the decoder. The size of the feature maps in each decoder layer matches that of the corresponding encoder layer. The output feature maps are initially passed through an instance normalization layer and then fed into a residual block comprising two 3 × 3 × 3 convolutional layers to enhance feature perception at different levels. Next, we upsample the output features by transposing the convolutional layers and concatenate them with the feature maps from the corresponding encoder layer to serve as input for the next layer. The concatenated feature maps are then processed through another residual block to ensure the number of channels meets the requirements. This process is repeated until the resolution of the feature maps matches that of the original image. Finally, the segmentation result is obtained after a 1 × 1 × 1 convolutional layer and a softmax activation function.
4. Experiment
4.1. Datasets and Preprocessing
We evaluated our proposed 3D medical image semantic segmentation method for lung nodule segmentation in CT images using the LUNA-16 dataset [26], which is a chest imaging dataset. LUNA-16, released in 2016, consists of nodules with slices with a thickness of no more than 2.5 mm and a diameter of at least 3 mm, which was extracted from the LIDC-IDRI (Lung Image Database Consortium image collection) dataset [27]. In addition, lung nodules that were too close to each other were merged, resulting in 888 CT images containing 1084 lung nodules. Each CT scan in the LUNA-16 dataset is independently annotated by four seasoned radiologists, who provide ground truth segmentation masks for the lung nodules.
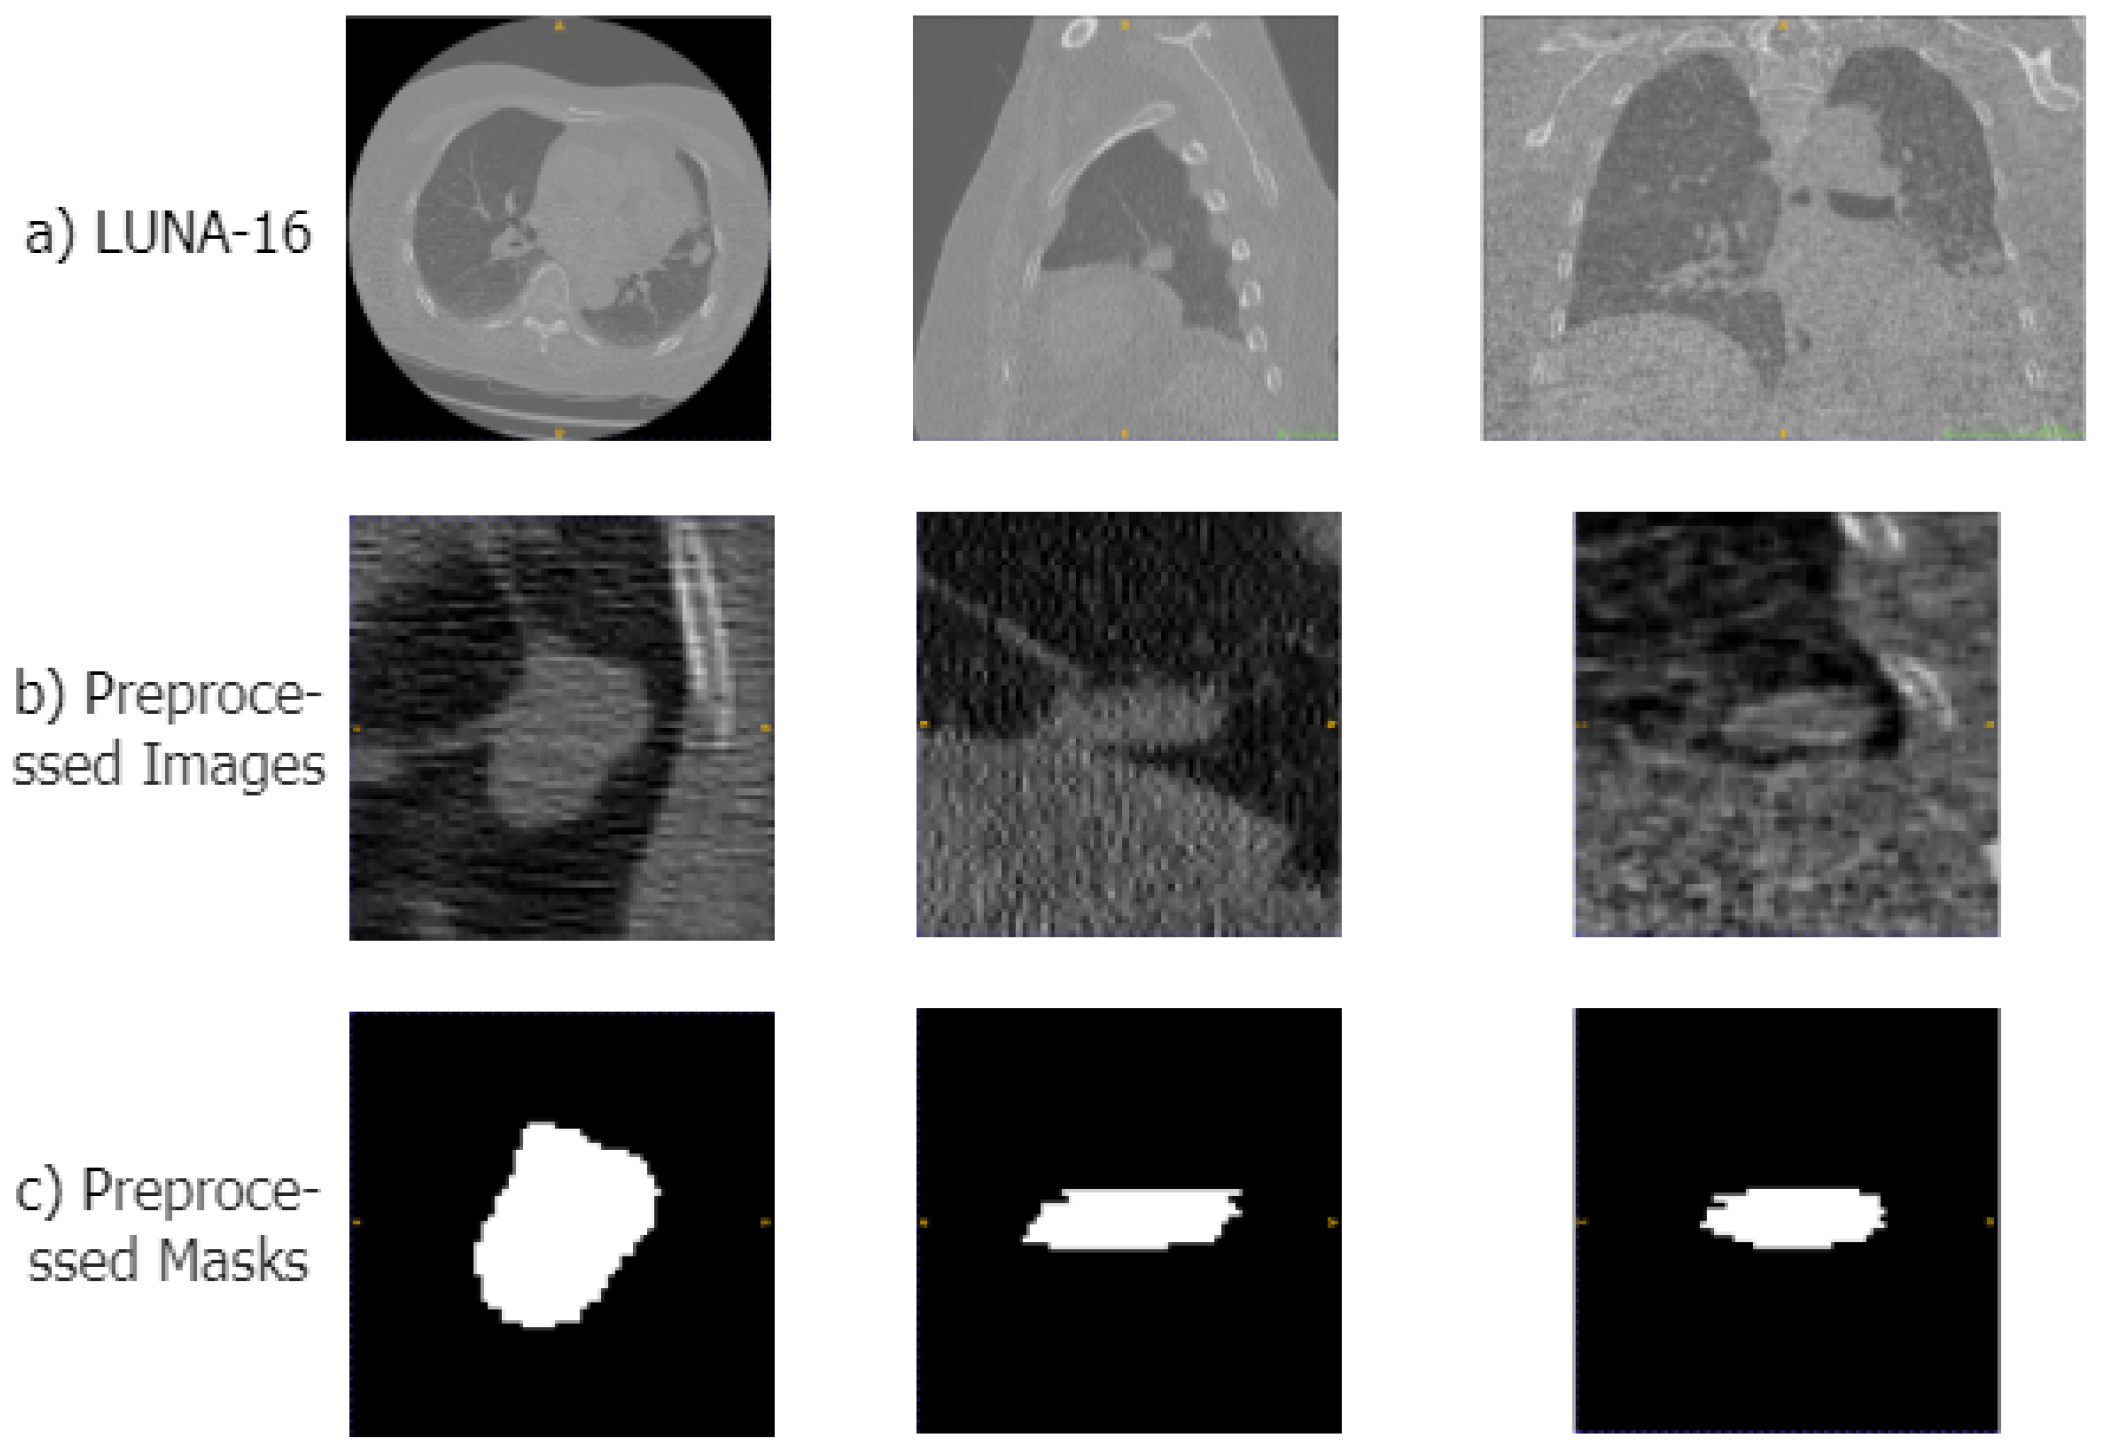
To make the data suitable for our segmentation algorithm, we preprocessed the original CT images in four steps: First, we normalized the CT images, clipping the Hounsfield units (HUs) to the range of [−1200, 600] to remove irrelevant information such as air or water. Second, we performed a resampling operation, resampling the CT images and their masks to a voxel size of 1 × 1 × 1 mm. Then, using the mask data provided in the dataset, we segmented the lung parenchyma region from the CT images. Therefore, based on the location information of the lung nodules in the annotation files, we cropped the lung parenchyma and mask images into 64 × 64 × 64 cubes. Examples of the original CT scans, preprocessed areas of the lungs, and corresponding mask images are displayed in Figure 4.
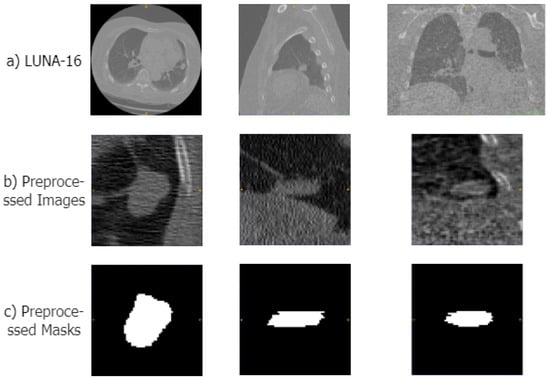
Figure 4.
Examples of the preprocessed images in LUNA-16 datasets. (a–c) show samples of the original CT image, the preprocessed lung region, and the mask image, respectively.
4.2. Evaluation Metrics
To validate the performance and superiority of the model proposed in this paper, we used three evaluation metrics to assess the degree of overlap: the Dice Similarity Coefficient (DSC), Positive Predictive Value (PPV), and Sensitivity (SEN). The DSC quantifies the overlap between the ground truth mask and the estimated mask and is described as follows:
PPV is a metric that represents the ratio of correctly identified positive samples to all samples predicted as positive, and it is defined as follows:
Sen denotes the proportion of actual positive samples correctly identified as predicted positive samples, which is defined as follows:
In the formula, P represents the model’s prediction, and G represents the ground truth. , , and denote true positive, false positive, and false negative, respectively, in the confusion matrix. The range of all evaluation metrics is [0,1], and the closer the value is to 1, the better the segmentation performance of the network model.
4.3. Implementation Details
The hardware environment used in this experiment includes an Intel(R) Xeon(R) Silver 4208 CPU @ 2.10 GHz, an NVIDIA GeForce RTX 3090 GPU with 24 GB of video memory, and 64 GB of RAM. The software environment includes Ubuntu 22.04 as the operating system, Anaconda 3 as the development environment, Python 3.8.16 as the programming language, Pytorch 2.0.1 as the deep learning framework, and CUDA 12.1 as the GPU driver version.
In our experiments, we divided the dataset into five parts using a five-fold cross-validation method. Our proposed model was trained for 100 epochs in each experiment. The loss function used was a combination of Dice loss and cross-entropy loss. The optimizer used was AdamW (Adaptive Moment Estimation with Weight Decay). The batch size was set to 4, the initial learning rate was , and the regularization weights are set to , and the learning rate adjustment strategy employs cosine annealing to dynamically adjust the learning rate. The scheduler increases the learning rate during the initial “warm-up” phase and then reduces it according to the cosine curve with the number of warm-up steps set to 10.
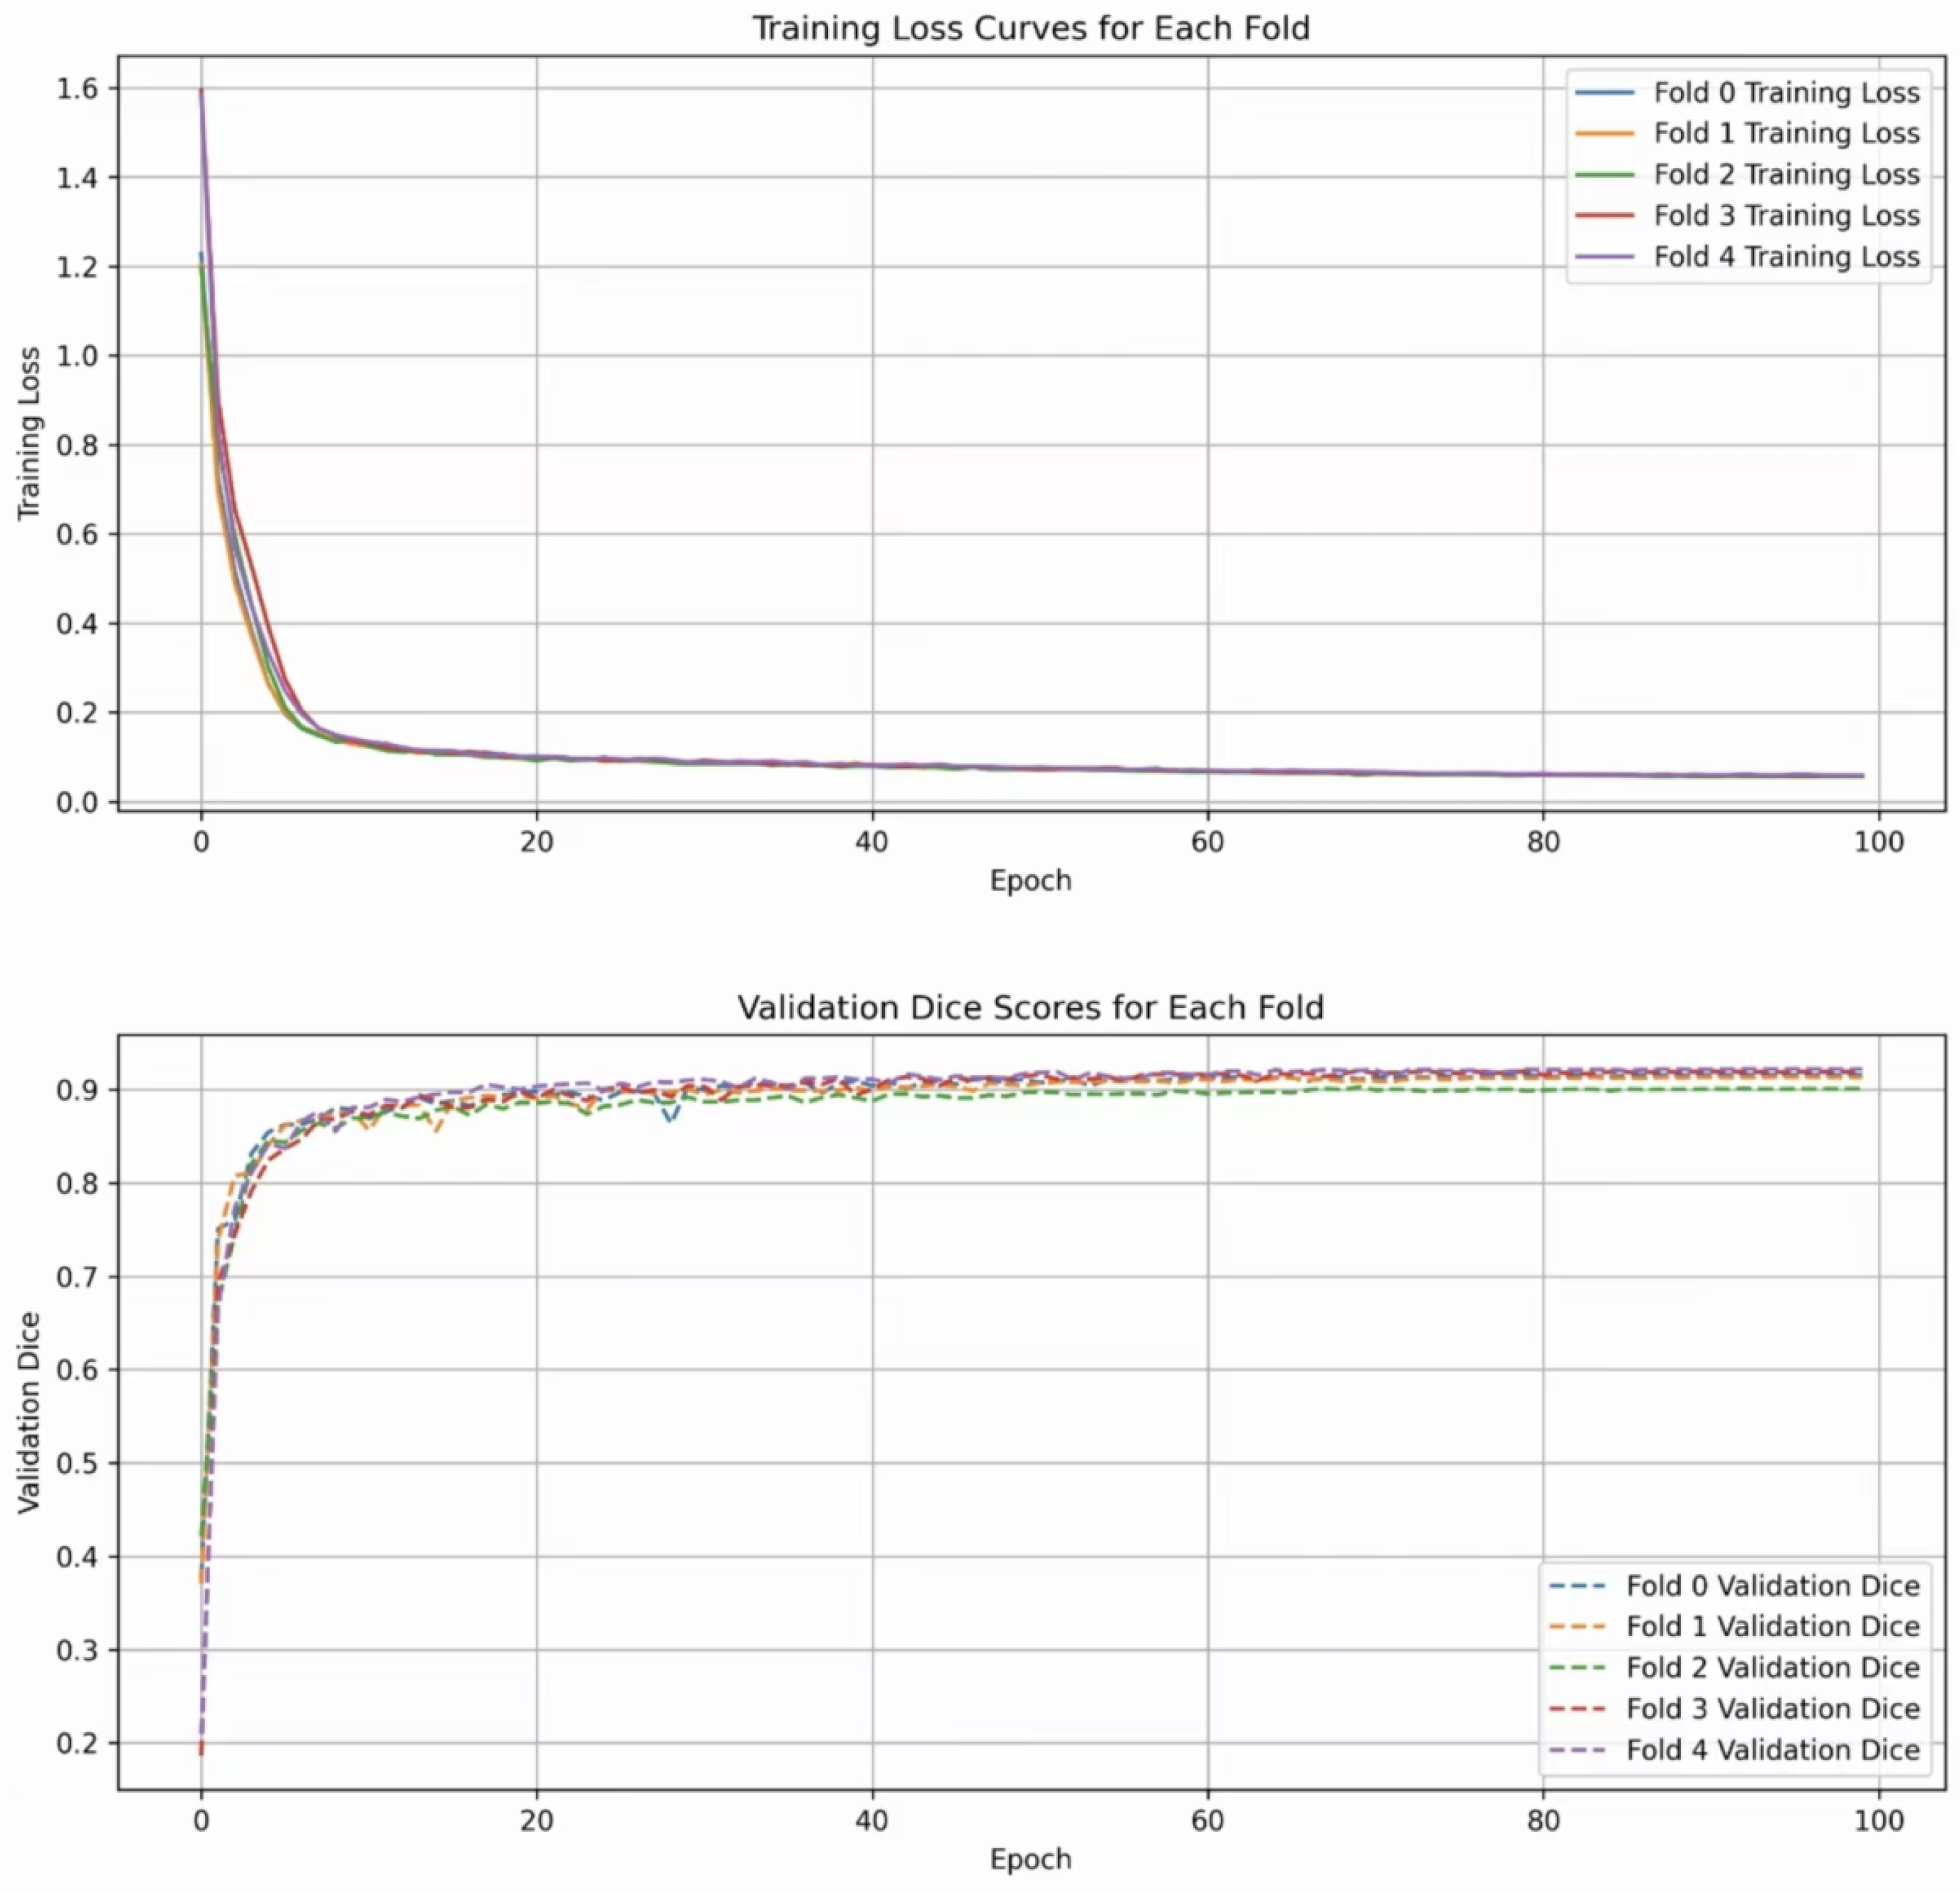
The entire training process is depicted in Figure 5. The two subfigures show the trend of the DSC index and the validation loss value during the training cycles, respectively. It can be seen that ALKU-Net starts to converge after 20 training epochs.
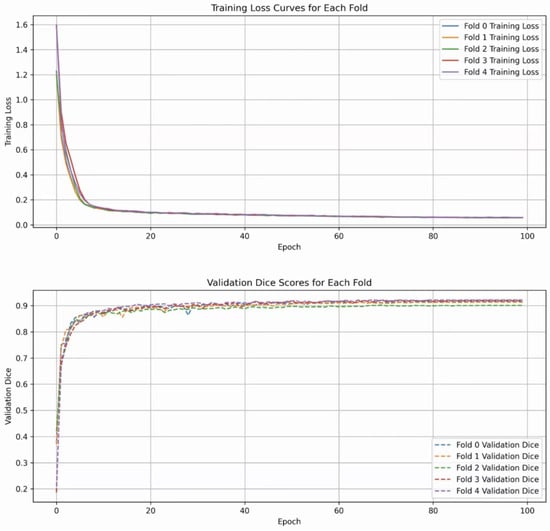
Figure 5.
Loss curves and Dice scores of ALKU-Net during training on the LUNA-16 dataset.
5. Result
5.1. Quantitative Analysis
Based on the experimental setup described in Section 4.3, we compared the performance of our model with that of different methods. We used 3D U-Net [15] as a baseline model for comparison. For comparison, we chose three state-of-the-art Transformer-based models: nnFormer [28], UNETR [29], and SwinUNETR [20]. nnFormer utilizes interleaved convolution and self-attention operations, and it introduces local and global volume-based self-attention mechanisms to learn feature representations; UNETR utilizes Transformers as encoders to learn sequential representations of input features and capture global multi-scale information. Swin UNETR combines the Swin Transformer and U-Net architectures to achieve excellent performance on 3D medical segmentation tasks. We also compared our model with other ConvNet-based segmentation models, namely STU-Net [30] and 3D UX-Net [23]. STU-Net is based on the nn-UNet framework, which automatically configures hyperparameters to achieve advanced performance on various tasks. Three-dimensional (3D) UX-Net tunes the Transformer encoder with the ConvNeXt module to achieve excellent 3D segmentation performance. We restored the original setups from the respective papers for training as much as possible. Table 1 presents the evaluation metrics obtained in the lung nodule segmentation task for all compared methods.

Table 1.
The comparison of segmentation methods was based on the DSC, Sen, and PPV metrics.
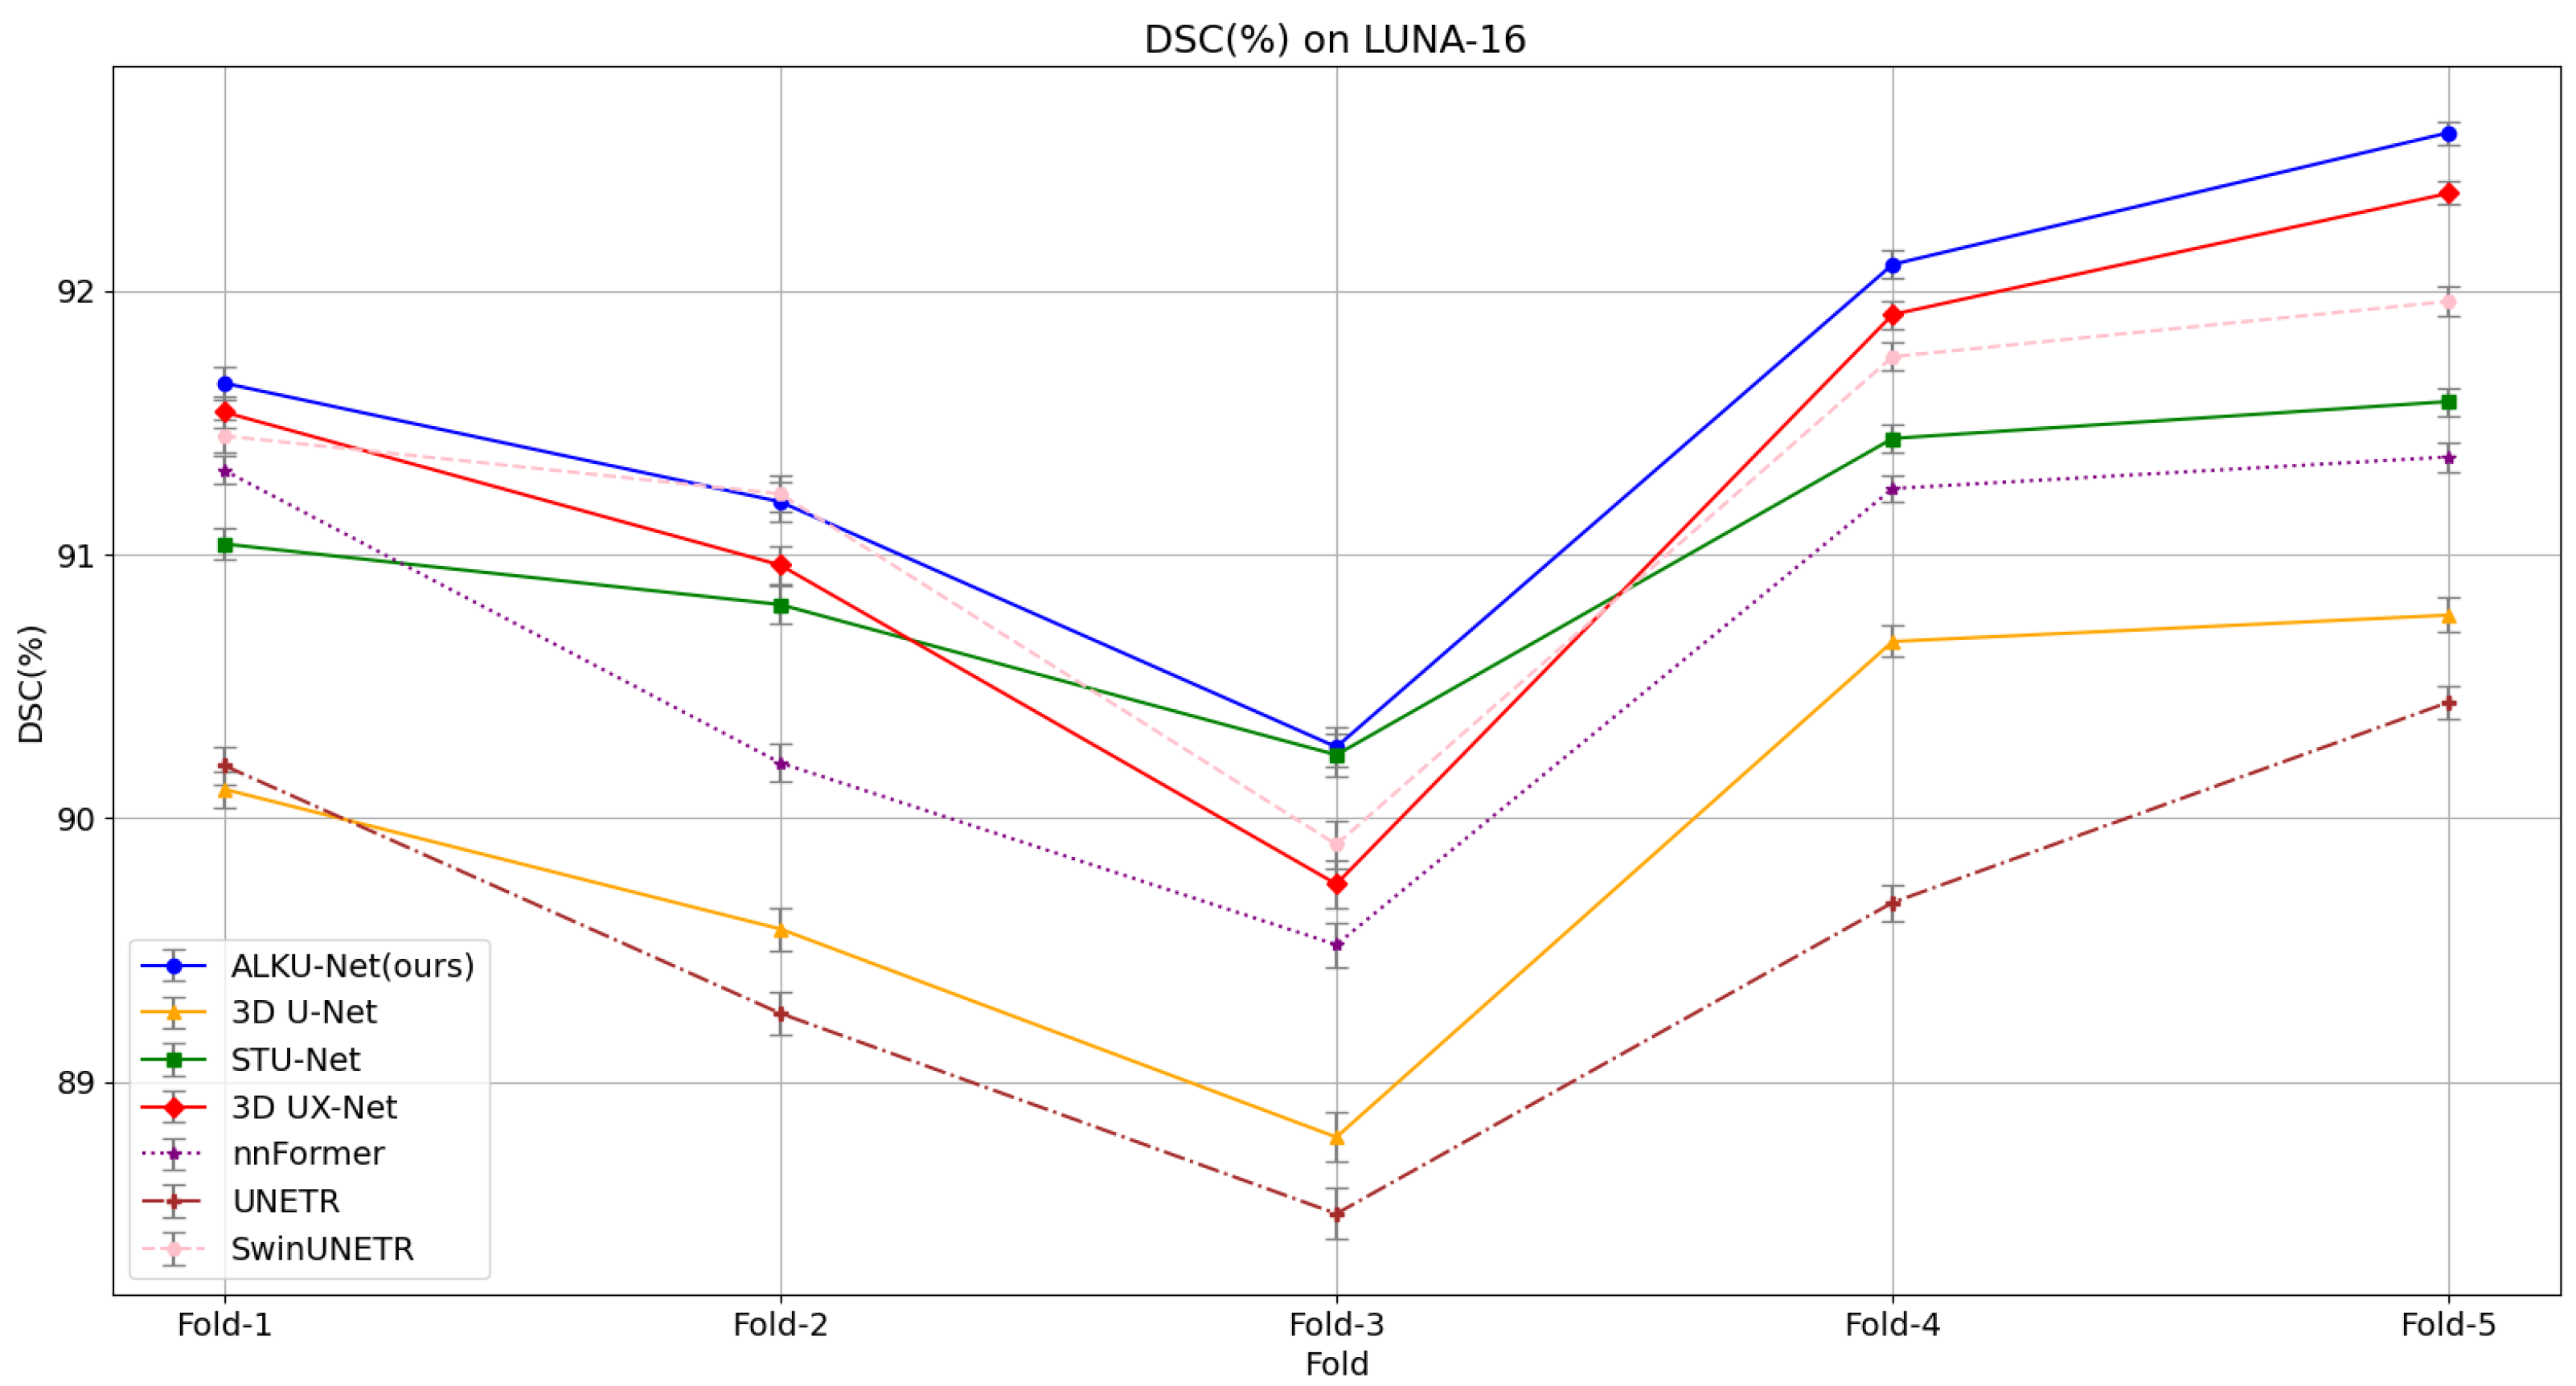
Our proposed method yields superior segmentation results due to the adaptive large kernel attention mechanism that extracts spatial and channel features at multiple scales. It can be seen that on the evaluation metrics DSC, SEN, and PPV proposed in this paper, our model scores the highest on the LUNA-16 dataset, which is 1.59%, 1.82%, and 1.16% higher than the baseline model; 0.26%, 0.65%, and 0.25% higher than the state-of-the-art CNN method 3D UX-Net; and 0.31%, 0.46%, and 0.41% higher than the advanced Transformer method SwinUNETR. This fully illustrates the comprehensive performance of the model proposed in this paper. The results validate the effectiveness of the proposed ALK module and ALKU-Net. Due to the lightweight network architecture design, the number of parameters and computational overhead are reduced by 19.9 M and 372.5 G, respectively, compared to 3D UX-Net, and by 29.1 M and 62.4 G, respectively, compared to SwinUNETR. Additionally, we provide detailed results obtained using the five-fold cross-validation method for all models, as shown in Figure 6. The results indicate that the proposed ALKU-Net achieved consistently high DSC scores in each experiment.
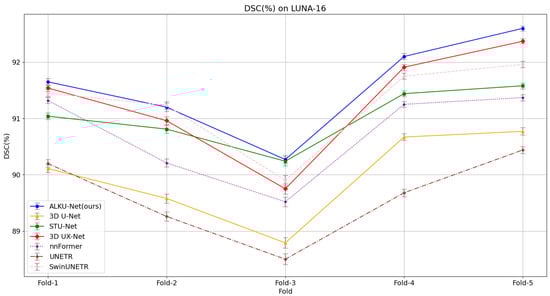
Figure 6.
Five-fold cross-validation results on the LUNA-16 dataset, comparing models based on the Dice Similarity Coefficient (DSC).
Furthermore, we evaluated the segmentation performance of the proposed model on lung nodules exhibiting various characteristics. In the LUNA-16 dataset, each nodule was annotated with nine characteristics by four experienced radiologists, who graded these characteristics at different levels. Table 2 presents the DSC scores achieved by our method across various levels of the nine characteristics. Statistical analysis indicates that our method achieved relatively stable performance across various levels of the nine characteristics. The impact of different characteristics and their respective levels on segmentation performance is significant. For instance, the segmentation accuracy improves with higher levels of Sphericity and Margin. However, even at level 1, which includes non-spherical or poorly defined nodules, the proposed method achieved favorable segmentation results. This demonstrates the robustness of our method, as it effectively segments nodules with diverse characteristics.
Table 2.
Segmentation results of the proposed method on the LUNA-16 dataset of different characterized lung nodules. The numbers in parentheses indicate the number of lung nodules.
5.2. Qualitative Analysis
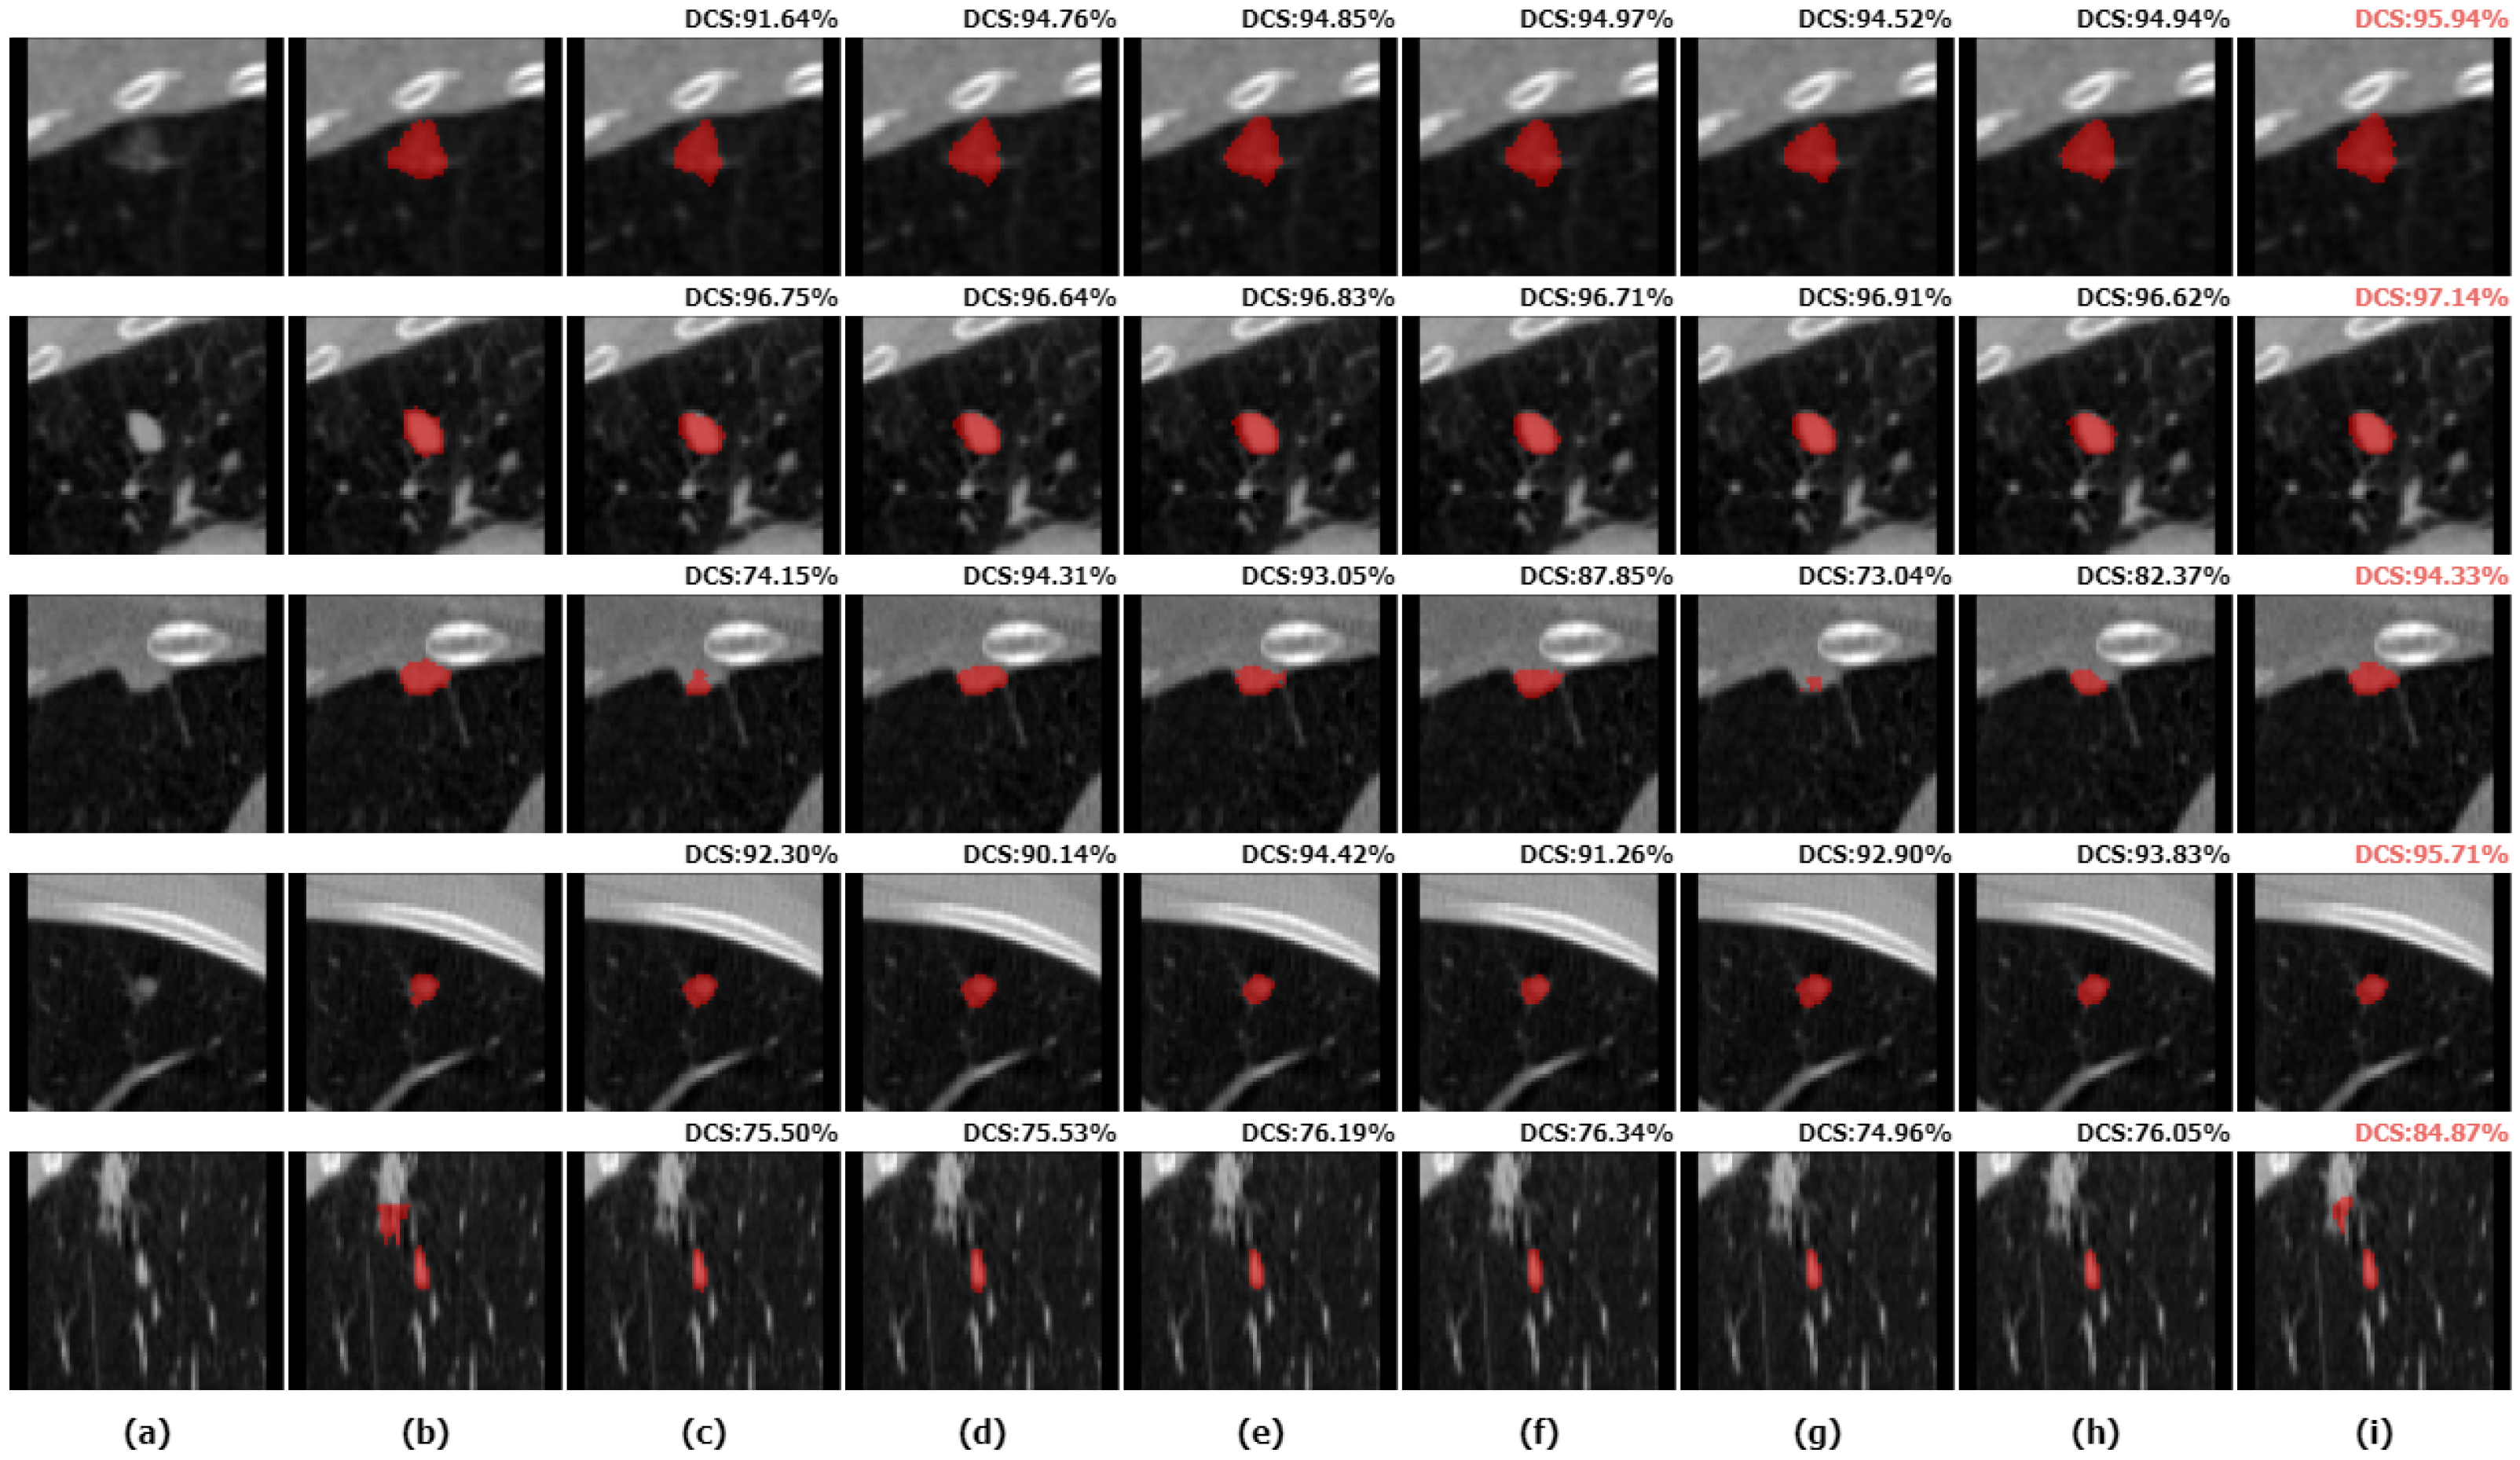
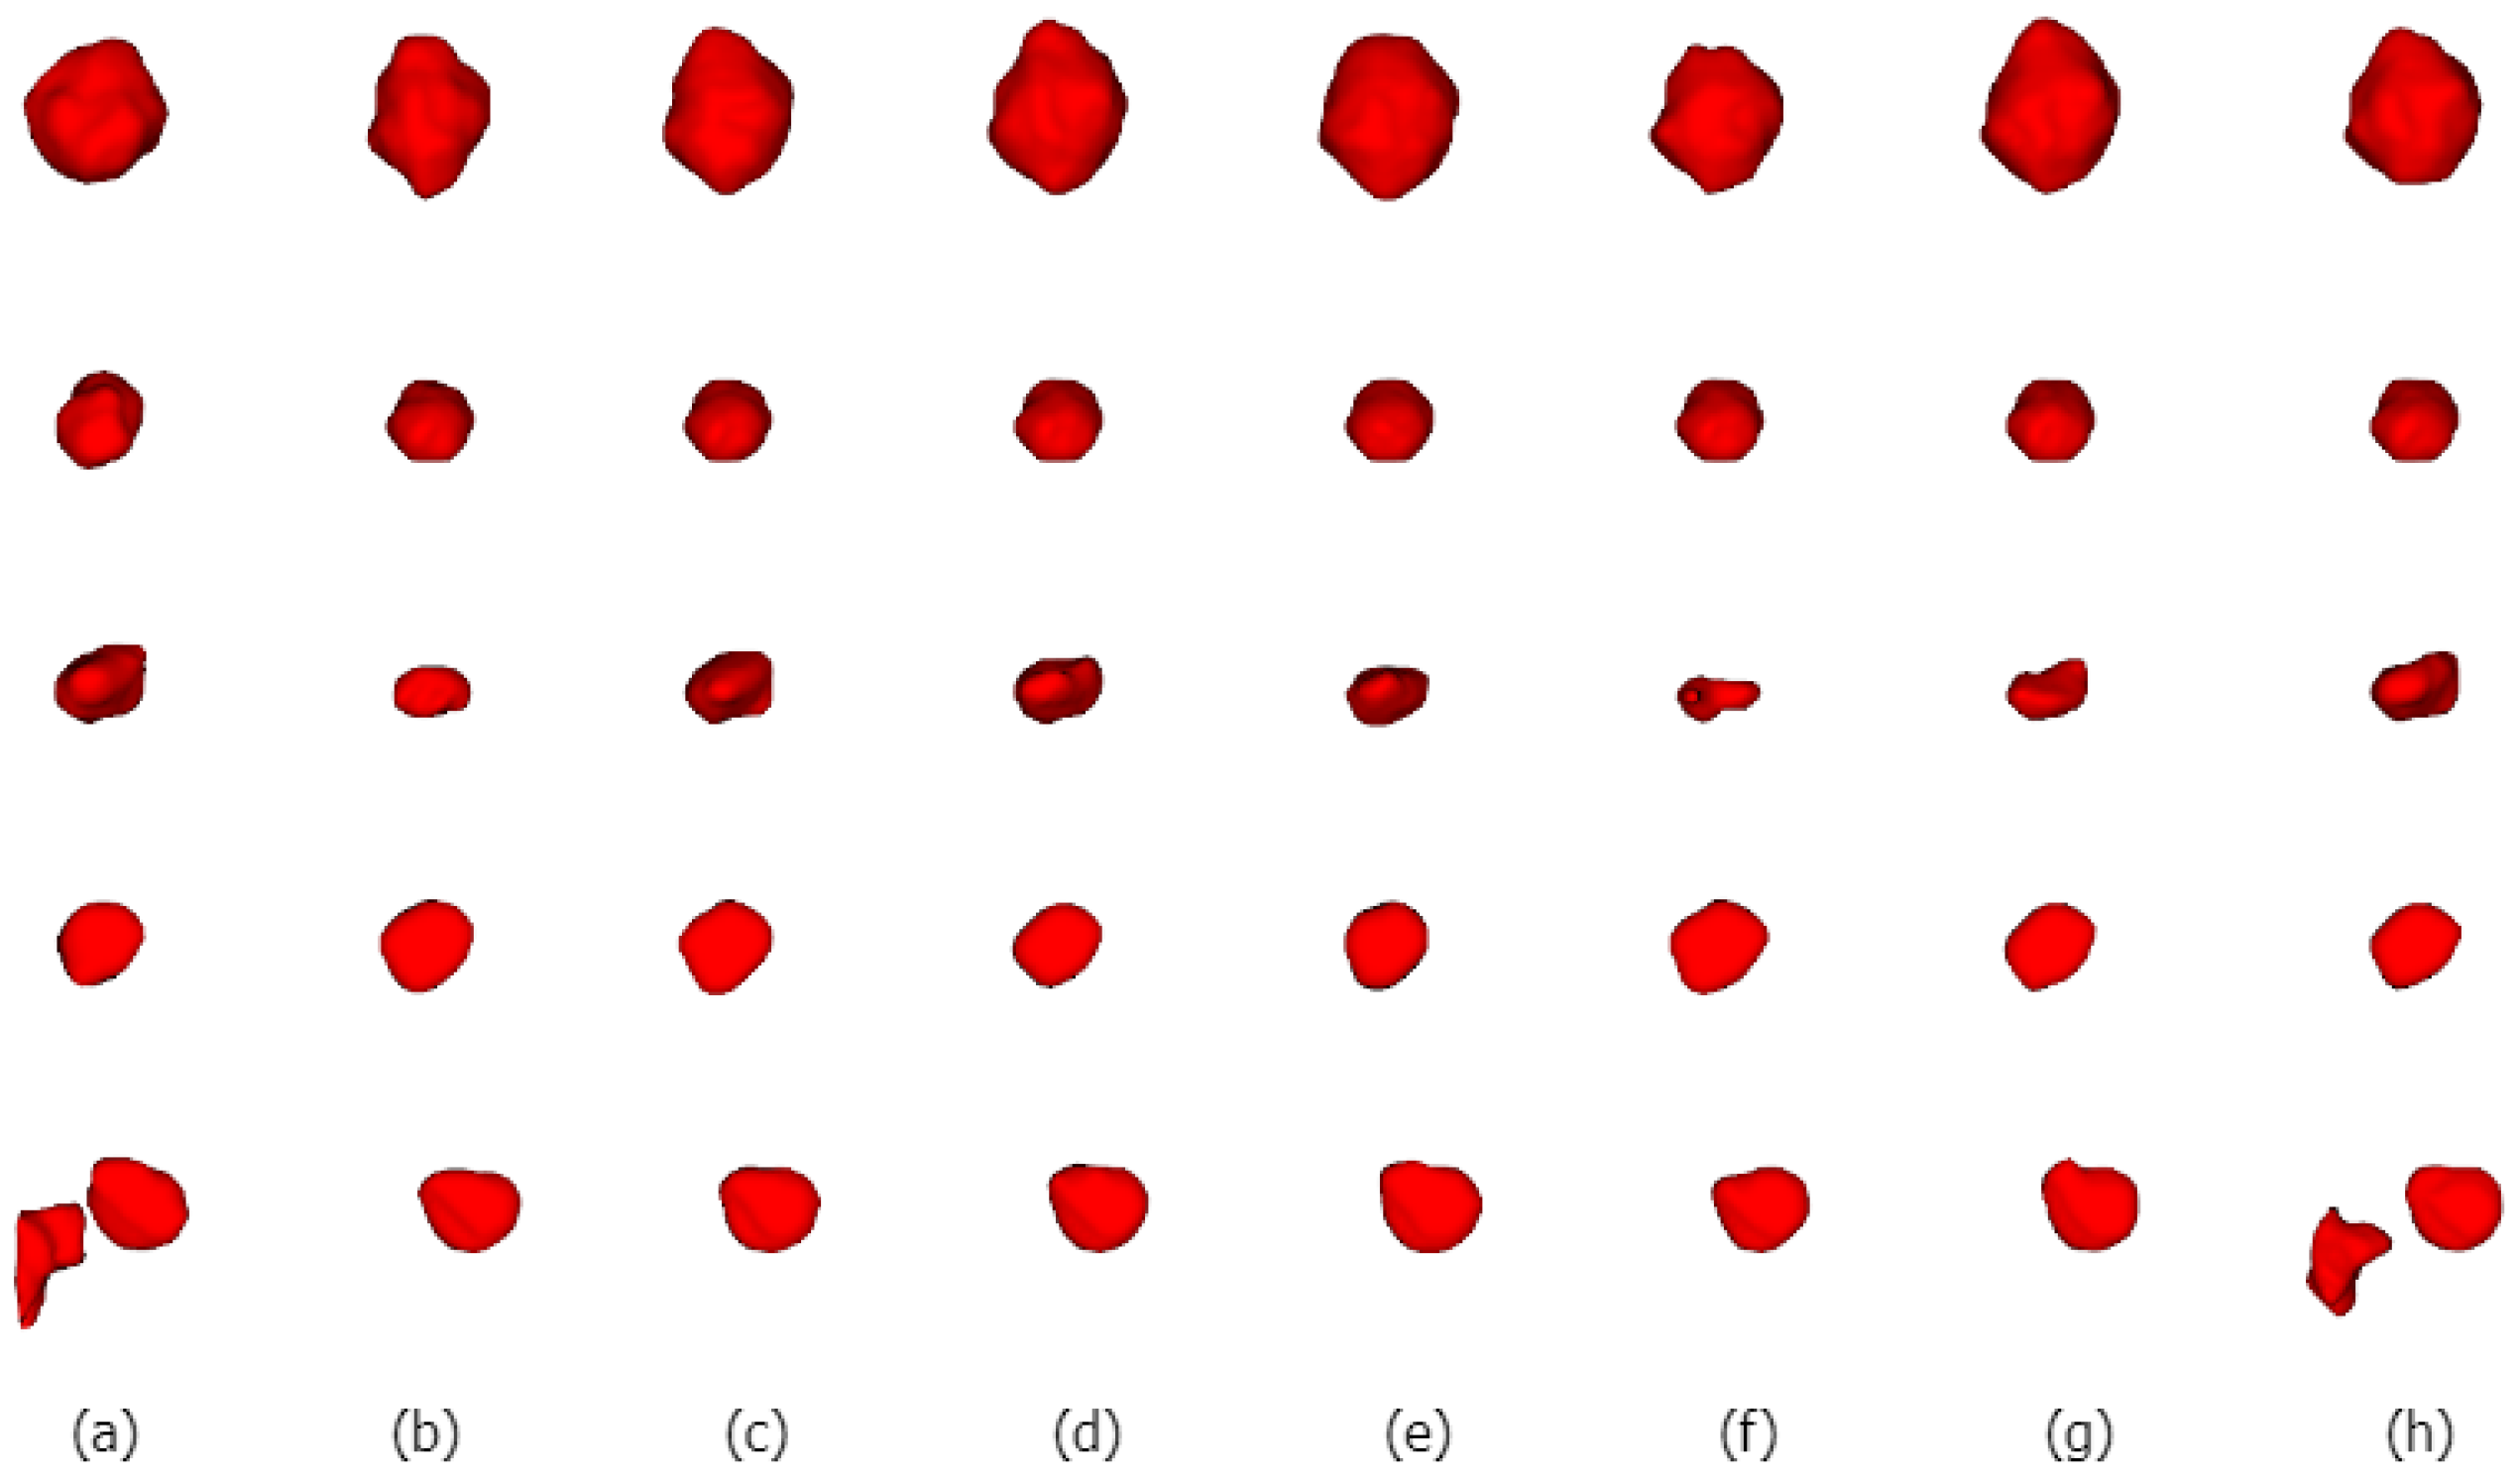
We selected five nodules with different characteristics for qualitative comparison to evaluate the segmentation results of various methods in detail and to demonstrate the superiority of the proposed method. We visualized the segmentation results of ALKU-Net alongside other baseline models in Figure 7. The figure shows the 2D results of the center slice of the lung nodule. Subsequently, we used ITK-SNAP to perform a 3D reconstruction of the segmentation results. The visual comparison of their 3D structures is shown in Figure 8. Through a left-to-right comparison, we find that the proposed ALKU-Net accurately segments nodules close to the ground truth, showing clear advantages in nodule localization and edge detail preservation. For common isolated nodules (e.g., lines 2 and 4), the Subtlety and Margin feature ratings are predominantly 4 or 5, representing the majority of the nodules. The segmentation results are relatively consistent across the networks and closely match the ground truth. For nodules with complex contours (e.g., line 1), the Margin and Sphericity feature ratings are lower, indicating nodules with blurred edges and irregular shapes. Nevertheless, our model produces more precise boundaries. For complex nodules adjacent to the pleura (e.g., line 3), which are morphologically regular and uniform in density but possess textural features similar to pleural tissue, distinguishing the boundary between the pleura and the nodule presents a significant challenge. Our method surpasses other models in boundary determination and accurately segments the nodule. The burr sign nodule (e.g., line 5) exemplifies this improvement, as it is largely overlooked by other methods with poor segmentation, while our network successfully identifies the nodule and predicts parts of the burr sign edges, achieving a DSC of 84.87%, demonstrating a strong feature extraction capability.
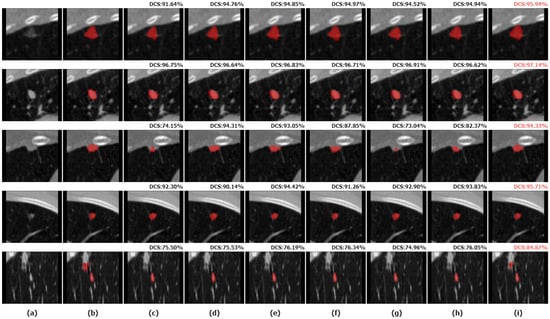
Figure 7.
Two-dimensional (2D) visual comparison of different lung nodule segmentations. From left to right are the original image (a), ground truths (b), and the segmentation results of 3D U-Net (c), STU-Net (d), 3D UX-Net (e), nnFormer (f), UNETR (g), SwinUNETR (h), and our ALKU-Net (i).

Figure 8.
Three-dimensional (3D) visual comparison of different lung nodule segmentations. From left to right are ground truths (a), and the segmentation results of 3D U-Net (b), STU-Net (c), 3D UX-Net (d), nnFormer (e), UNETR (f), SwinUNETR (g), and our ALKU-Net (h).
All in all, our proposed method performs excellently in the task of segmenting various types of lung nodules, particularly in preserving nodule boundaries and reducing over-segmentation. This demonstrates its capability for reliable and rapid nodule analysis in real-world scenarios.
5.3. Ablation Studies
To assess the impact of different components of the proposed network architecture on segmentation performance, we conducted experiments using standard five-fold cross-validation with four different sets of components.
Downsampling Kernel Sizes: We investigated the impact of different convolution kernel sizes in the downsampling layer on segmentation accuracy. As shown in Table 3, when the convolution kernel size increased from 2 to 4, the model parameters and floating-point operations increased, but the segmentation accuracy improved significantly. This improvement is likely due to the larger convolution kernel providing a greater receptive field, enhancing the ability to distinguish different lung tissue characteristics. However, when the convolution kernel size increased from 4 to 6, the segmentation performance decreased, which was possibly because the excessively large receptive field makes it difficult to extract features of small nodules. Considering both model complexity and segmentation performance, we ultimately decided to use a downsampling layer with a convolutional kernel size of 4, a stride of 2, and padding of 1.
Table 3.
Ablation studies of different architecture.
Large Kernel Decomposition: Large kernel decomposition uses a series of deep convolutions instead of a single large convolution kernel. We explored three cases of large kernel decomposition. A convolution with a kernel size of 7 and a dilation rate of 2 is realized from deep convolutions with kernel sizes of 3 and 5, respectively; a convolution with a kernel size of 21 and a dilation rate of 3 is realized from deep convolutions with kernel sizes of 5 and 7; and a convolution with a kernel size of 35 and a dilation rate of 4 is realized from deep convolutions with kernel sizes of 7 and 9, respectively. Experiments show that both overly large and overly small receptive fields affect feature extraction and degrade segmentation performance.
Feature Scaling Method: As shown in Table 3, the model achieved a DSC score of 91.32% when using a multi-layer perceptron (MLP). However, by applying inverse bottleneck linear scaling, the model’s DSC score increased by 0.25%. At the same time, the number of model parameters and floating-point operations significantly decreased with parameters reduced from 34.9 to 33.1 M.
Effectiveness of Spatial and Channel Attention: Our experiments show that for the lung nodule segmentation task, the proposed hybrid approach using both spatial and channel attention is more effective than using either attention alone. The sequence of attention also affects model performance, with the configuration of using spatial attention first and channel attention later proving to be more effective. Experiments demonstrate that utilizing both spatial and channel information in a segmentation task can help improve performance.
6. Conclusions
In this study, we present a lightweight 3D adaptive large kernel CNN for lung nodule segmentation, employing advanced multi-scale feature extraction techniques. At each stage of the network encoder, we use an adaptive large kernel attention mechanism to dynamically adjust the receptive field size, capturing the detailed features of various nodule images. Additionally, a channel attention mechanism is introduced to enhance feature map quality and optimize cross-channel feature extraction. Moreover, inverse bottleneck linear scaling is utilized to reduce redundant cross-channel contexts, enhancing model segmentation performance with lower computational cost. Experimental results demonstrate that our method achieves significant accuracy on the LUNA-16 dataset. Visualization results further illustrate our method’s robust performance in complex situations, such as handling small, adjacent nodules. Ablation studies of these components have highlighted their key role in improving segmentation performance. Future research will focus on designing more powerful skip connections and decoder modules to enhance the framework’s performance in nodule segmentation and validating its effectiveness on larger datasets. Meanwhile, given the limited number of large-scale public datasets for lung nodules, we aim to extend the application scenarios of the model to include more 3D medical image segmentation tasks to validate its generalization ability.
Author Contributions
Conceptualization, J.C. and S.L.; methodology, J.C.; software, J.C.; validation, J.C. and Y.L.; formal analysis, J.C.; investigation, J.C.; resources, J.C.; data curation, J.C.; writing—original draft preparation, J.C.; writing—review and editing, J.C.; visualization, J.C.; supervision, S.L.; project administration, S.L.; and funding acquisition, S.L. All authors have read and agreed to the published version of the manuscript.
Funding
This research received no external funding.
Institutional Review Board Statement
Not applicable.
Informed Consent Statement
Not applicable.
Data Availability Statement
The data used in this study are a public dataset from the LUng Nodule Analysis 2016, which can be accessed from https://luna16.grand-challenge.org/Download/ accessed on 13 October 2023. The data in this study are available on request from the corresponding author.
Acknowledgments
The authors would like to thank the anonymous reviewers for their valuable comments and suggestions, which helped improve this paper greatly.
Conflicts of Interest
The authors declare no conflicts of interest.
References
- Dizon, D.S.; Kamal, A.H. Cancer statistics 2024: All hands on deck. CA A Cancer J. Clin. 2024, 74, 8–9. [Google Scholar] [CrossRef] [PubMed]
- Zheng, R.; Zhang, S.; Zeng, H.; Wang, S.; Sun, K.; Chen, R.; Li, L.; Wei, W.; He, J. Cancer incidence and mortality in China, 2016. J. Natl. Cancer Cent. 2022, 2, 1–9. [Google Scholar] [CrossRef] [PubMed]
- Infante, M.; Cavuto, S.; Lutman, F.R.; Brambilla, G.; Chiesa, G.; Ceresoli, G.; Passera, E.; Angeli, E.; Chiarenza, M.; Aranzulla, G.; et al. A randomized study of lung cancer screening with spiral computed tomography: Three-year results from the DANTE trial. Am. J. Respir. Crit. Care Med. 2009, 180, 445–453. [Google Scholar] [CrossRef] [PubMed]
- MacMahon, H.; Austin, J.H.; Gamsu, G.; Herold, C.J.; Jett, J.R.; Naidich, D.P.; Patz, E.F., Jr.; Swensen, S.J. Guidelines for management of small pulmonary nodules detected on CT scans: A statement from the Fleischner Society. Radiology 2005, 237, 395–400. [Google Scholar] [CrossRef] [PubMed]
- Li, R.; Xiao, C.; Huang, Y.; Hassan, H.; Huang, B. Deep learning applications in computed tomography images for pulmonary nodule detection and diagnosis: A review. Diagnostics 2022, 12, 298. [Google Scholar] [CrossRef] [PubMed]
- Ronneberger, O.; Fischer, P.; Brox, T. U-net: Convolutional networks for biomedical image segmentation. In Proceedings of the Medical Image Computing and Computer-Assisted Intervention–MICCAI 2015: 18th International Conference, Munich, Germany, 5–9 October 2015; Proceedings, Part III 18. Springer: Berlin/Heidelberg, Germany, 2015; pp. 234–241. [Google Scholar]
- Dehmeshki, J.; Amin, H.; Valdivieso, M.; Ye, X. Segmentation of pulmonary nodules in thoracic CT scans: A region growing approach. IEEE Trans. Med. Imaging 2008, 27, 467–480. [Google Scholar] [CrossRef] [PubMed]
- Rendon-Gonzalez, E.; Ponomaryov, V. Automatic Lung nodule segmentation and classification in CT images based on SVM. In Proceedings of the 2016 9th International Kharkiv Symposium on Physics and Engineering of Microwaves, Millimeter and Submillimeter Waves (MSMW), Kharkiv, Ukraine, 20–24 June 2016; IEEE: Piscataway, NJ, USA, 2016; pp. 1–4. [Google Scholar]
- Lavanya, M.; Kannan, P.M. Lung lesion detection in CT scan images using the fuzzy local information cluster means (FLICM) automatic segmentation algorithm and back propagation network classification. Asian Pac. J. Cancer Prev. APJCP 2017, 18, 3395. [Google Scholar] [PubMed]
- Su, R.; Zhang, D.; Liu, J.; Cheng, C. Msu-net: Multi-scale u-net for 2d medical image segmentation. Front. Genet. 2021, 12, 639930. [Google Scholar] [CrossRef] [PubMed]
- Wang, S.; Zhou, M.; Liu, Z.; Liu, Z.; Gu, D.; Zang, Y.; Dong, D.; Gevaert, O.; Tian, J. Central focused convolutional neural networks: Developing a data-driven model for lung nodule segmentation. Med. Image Anal. 2017, 40, 172–183. [Google Scholar] [CrossRef] [PubMed]
- Zhou, Z.; Rahman Siddiquee, M.M.; Tajbakhsh, N.; Liang, J. Unet++: A nested u-net architecture for medical image segmentation. In Proceedings of the Deep Learning in Medical Image Analysis and Multimodal Learning for Clinical Decision Support: 4th International Workshop, DLMIA 2018, and 8th International Workshop, ML-CDS 2018, Held in Conjunction with MICCAI 2018, Granada, Spain, 20 September 2018; Proceedings 4. Springer: Berlin/Heidelberg, Germany, 2018; pp. 3–11. [Google Scholar]
- Huang, H.; Lin, L.; Tong, R.; Hu, H.; Zhang, Q.; Iwamoto, Y.; Han, X.; Chen, Y.W.; Wu, J. Unet 3+: A full-scale connected unet for medical image segmentation. In Proceedings of the ICASSP 2020–2020 IEEE International Conference on Acoustics, Speech and Signal Processing (ICASSP), Barcelona, Spain, 4–8 May 2020; IEEE: Piscataway, NJ, USA, 2020; pp. 1055–1059. [Google Scholar]
- Yue, G.; Li, Y.; Jiang, W.; Zhou, W.; Zhou, T. Boundary refinement network for colorectal polyp segmentation in colonoscopy images. IEEE Signal Process. Lett. 2024, 31, 954–958. [Google Scholar] [CrossRef]
- Çiçek, Ö.; Abdulkadir, A.; Lienkamp, S.S.; Brox, T.; Ronneberger, O. 3D U-Net: Learning dense volumetric segmentation from sparse annotation. In Proceedings of the Medical Image Computing and Computer-Assisted Intervention–MICCAI 2016: 19th International Conference, Athens, Greece, 17–21 October 2016; Proceedings, Part II 19. Springer: Berlin/Heidelberg, Germany, 2016; pp. 424–432. [Google Scholar]
- Liu, H.; Cao, H.; Song, E.; Ma, G.; Xu, X.; Jin, R.; Jin, Y.; Hung, C.C. A cascaded dual-pathway residual network for lung nodule segmentation in CT images. Phys. Medica 2019, 63, 112–121. [Google Scholar] [CrossRef] [PubMed]
- Agnes, S.A.; Anitha, J. Efficient multiscale fully convolutional UNet model for segmentation of 3D lung nodule from CT image. J. Med. Imaging 2022, 9, 052402. [Google Scholar] [CrossRef] [PubMed]
- Tyagi, S.; Talbar, S.N. CSE-GAN: A 3D conditional generative adversarial network with concurrent squeeze-and-excitation blocks for lung nodule segmentation. Comput. Biol. Med. 2022, 147, 105781. [Google Scholar] [CrossRef] [PubMed]
- Chen, J.; Lu, Y.; Yu, Q.; Luo, X.; Adeli, E.; Wang, Y.; Lu, L.; Yuille, A.L.; Zhou, Y. Transunet: Transformers make strong encoders for medical image segmentation. arXiv 2021, arXiv:2102.04306. [Google Scholar]
- Hatamizadeh, A.; Nath, V.; Tang, Y.; Yang, D.; Roth, H.R.; Xu, D. Swin unetr: Swin transformers for semantic segmentation of brain tumors in mri images. In Proceedings of the International MICCAI Brainlesion Workshop, Virtual Event, 27 September 2021; Springer: Berlin/Heidelberg, Germany, 2021; pp. 272–284. [Google Scholar]
- Li, H.; Nan, Y.; Yang, G. LKAU-Net: 3D large-kernel attention-based u-net for automatic MRI brain tumor segmentation. In Proceedings of the Annual Conference on Medical Image Understanding and Analysis, Cambridge, UK, 27–29 July 2022; Springer: Berlin/Heidelberg, Germany, 2022; pp. 313–327. [Google Scholar]
- Han, Z.; Jian, M.; Wang, G.G. ConvUNeXt: An efficient convolution neural network for medical image segmentation. Knowl.-Based Syst. 2022, 253, 109512. [Google Scholar] [CrossRef]
- Lee, H.H.; Bao, S.; Huo, Y.; Landman, B.A. 3D ux-net: A large kernel volumetric convnet modernizing hierarchical transformer for medical image segmentation. arXiv 2022, arXiv:2209.15076. [Google Scholar]
- Guo, M.H.; Lu, C.Z.; Liu, Z.N.; Cheng, M.M.; Hu, S.M. Visual attention network. Comput. Vis. Media 2023, 9, 733–752. [Google Scholar] [CrossRef]
- Woo, S.; Debnath, S.; Hu, R.; Chen, X.; Liu, Z.; Kweon, I.S.; Xie, S. Convnext v2: Co-designing and scaling convnets with masked autoencoders. In Proceedings of the IEEE/CVF Conference on Computer Vision and Pattern Recognition, Vancouver, BC, Canada, 17–24 June 2023; pp. 16133–16142. [Google Scholar]
- Setio, A.A.A.; Traverso, A.; De Bel, T.; Berens, M.S.; Van Den Bogaard, C.; Cerello, P.; Chen, H.; Dou, Q.; Fantacci, M.E.; Geurts, B.; et al. Validation, comparison, and combination of algorithms for automatic detection of pulmonary nodules in computed tomography images: The LUNA16 challenge. Med. Image Anal. 2017, 42, 1–13. [Google Scholar] [CrossRef] [PubMed]
- Armato, S.G., III; McLennan, G.; Bidaut, L.; McNitt-Gray, M.F.; Meyer, C.R.; Reeves, A.P.; Zhao, B.; Aberle, D.R.; Henschke, C.I.; Hoffman, E.A.; et al. The lung image database consortium (LIDC) and image database resource initiative (IDRI): A completed reference database of lung nodules on CT scans. Med. Phys. 2011, 38, 915–931. [Google Scholar] [CrossRef] [PubMed]
- Zhou, H.Y.; Guo, J.; Zhang, Y.; Yu, L.; Wang, L.; Yu, Y. nnformer: Interleaved transformer for volumetric segmentation. arXiv 2021, arXiv:2109.03201. [Google Scholar]
- Hatamizadeh, A.; Tang, Y.; Nath, V.; Yang, D.; Myronenko, A.; Landman, B.; Roth, H.R.; Xu, D. Unetr: Transformers for 3d medical image segmentation. In Proceedings of the IEEE/CVF Winter Conference on Applications of Computer Vision, Waikoloa, HI, USA, 3–8 January 2022; pp. 574–584. [Google Scholar]
- Huang, Z.; Wang, H.; Deng, Z.; Ye, J.; Su, Y.; Sun, H.; He, J.; Gu, Y.; Gu, L.; Zhang, S.; et al. Stu-net: Scalable and transferable medical image segmentation models empowered by large-scale supervised pre-training. arXiv 2023, arXiv:2304.06716. [Google Scholar]
Disclaimer/Publisher’s Note: The statements, opinions and data contained in all publications are solely those of the individual author(s) and contributor(s) and not of MDPI and/or the editor(s). MDPI and/or the editor(s) disclaim responsibility for any injury to people or property resulting from any ideas, methods, instructions or products referred to in the content. |
© 2024 by the authors. Licensee MDPI, Basel, Switzerland. This article is an open access article distributed under the terms and conditions of the Creative Commons Attribution (CC BY) license (https://creativecommons.org/licenses/by/4.0/).