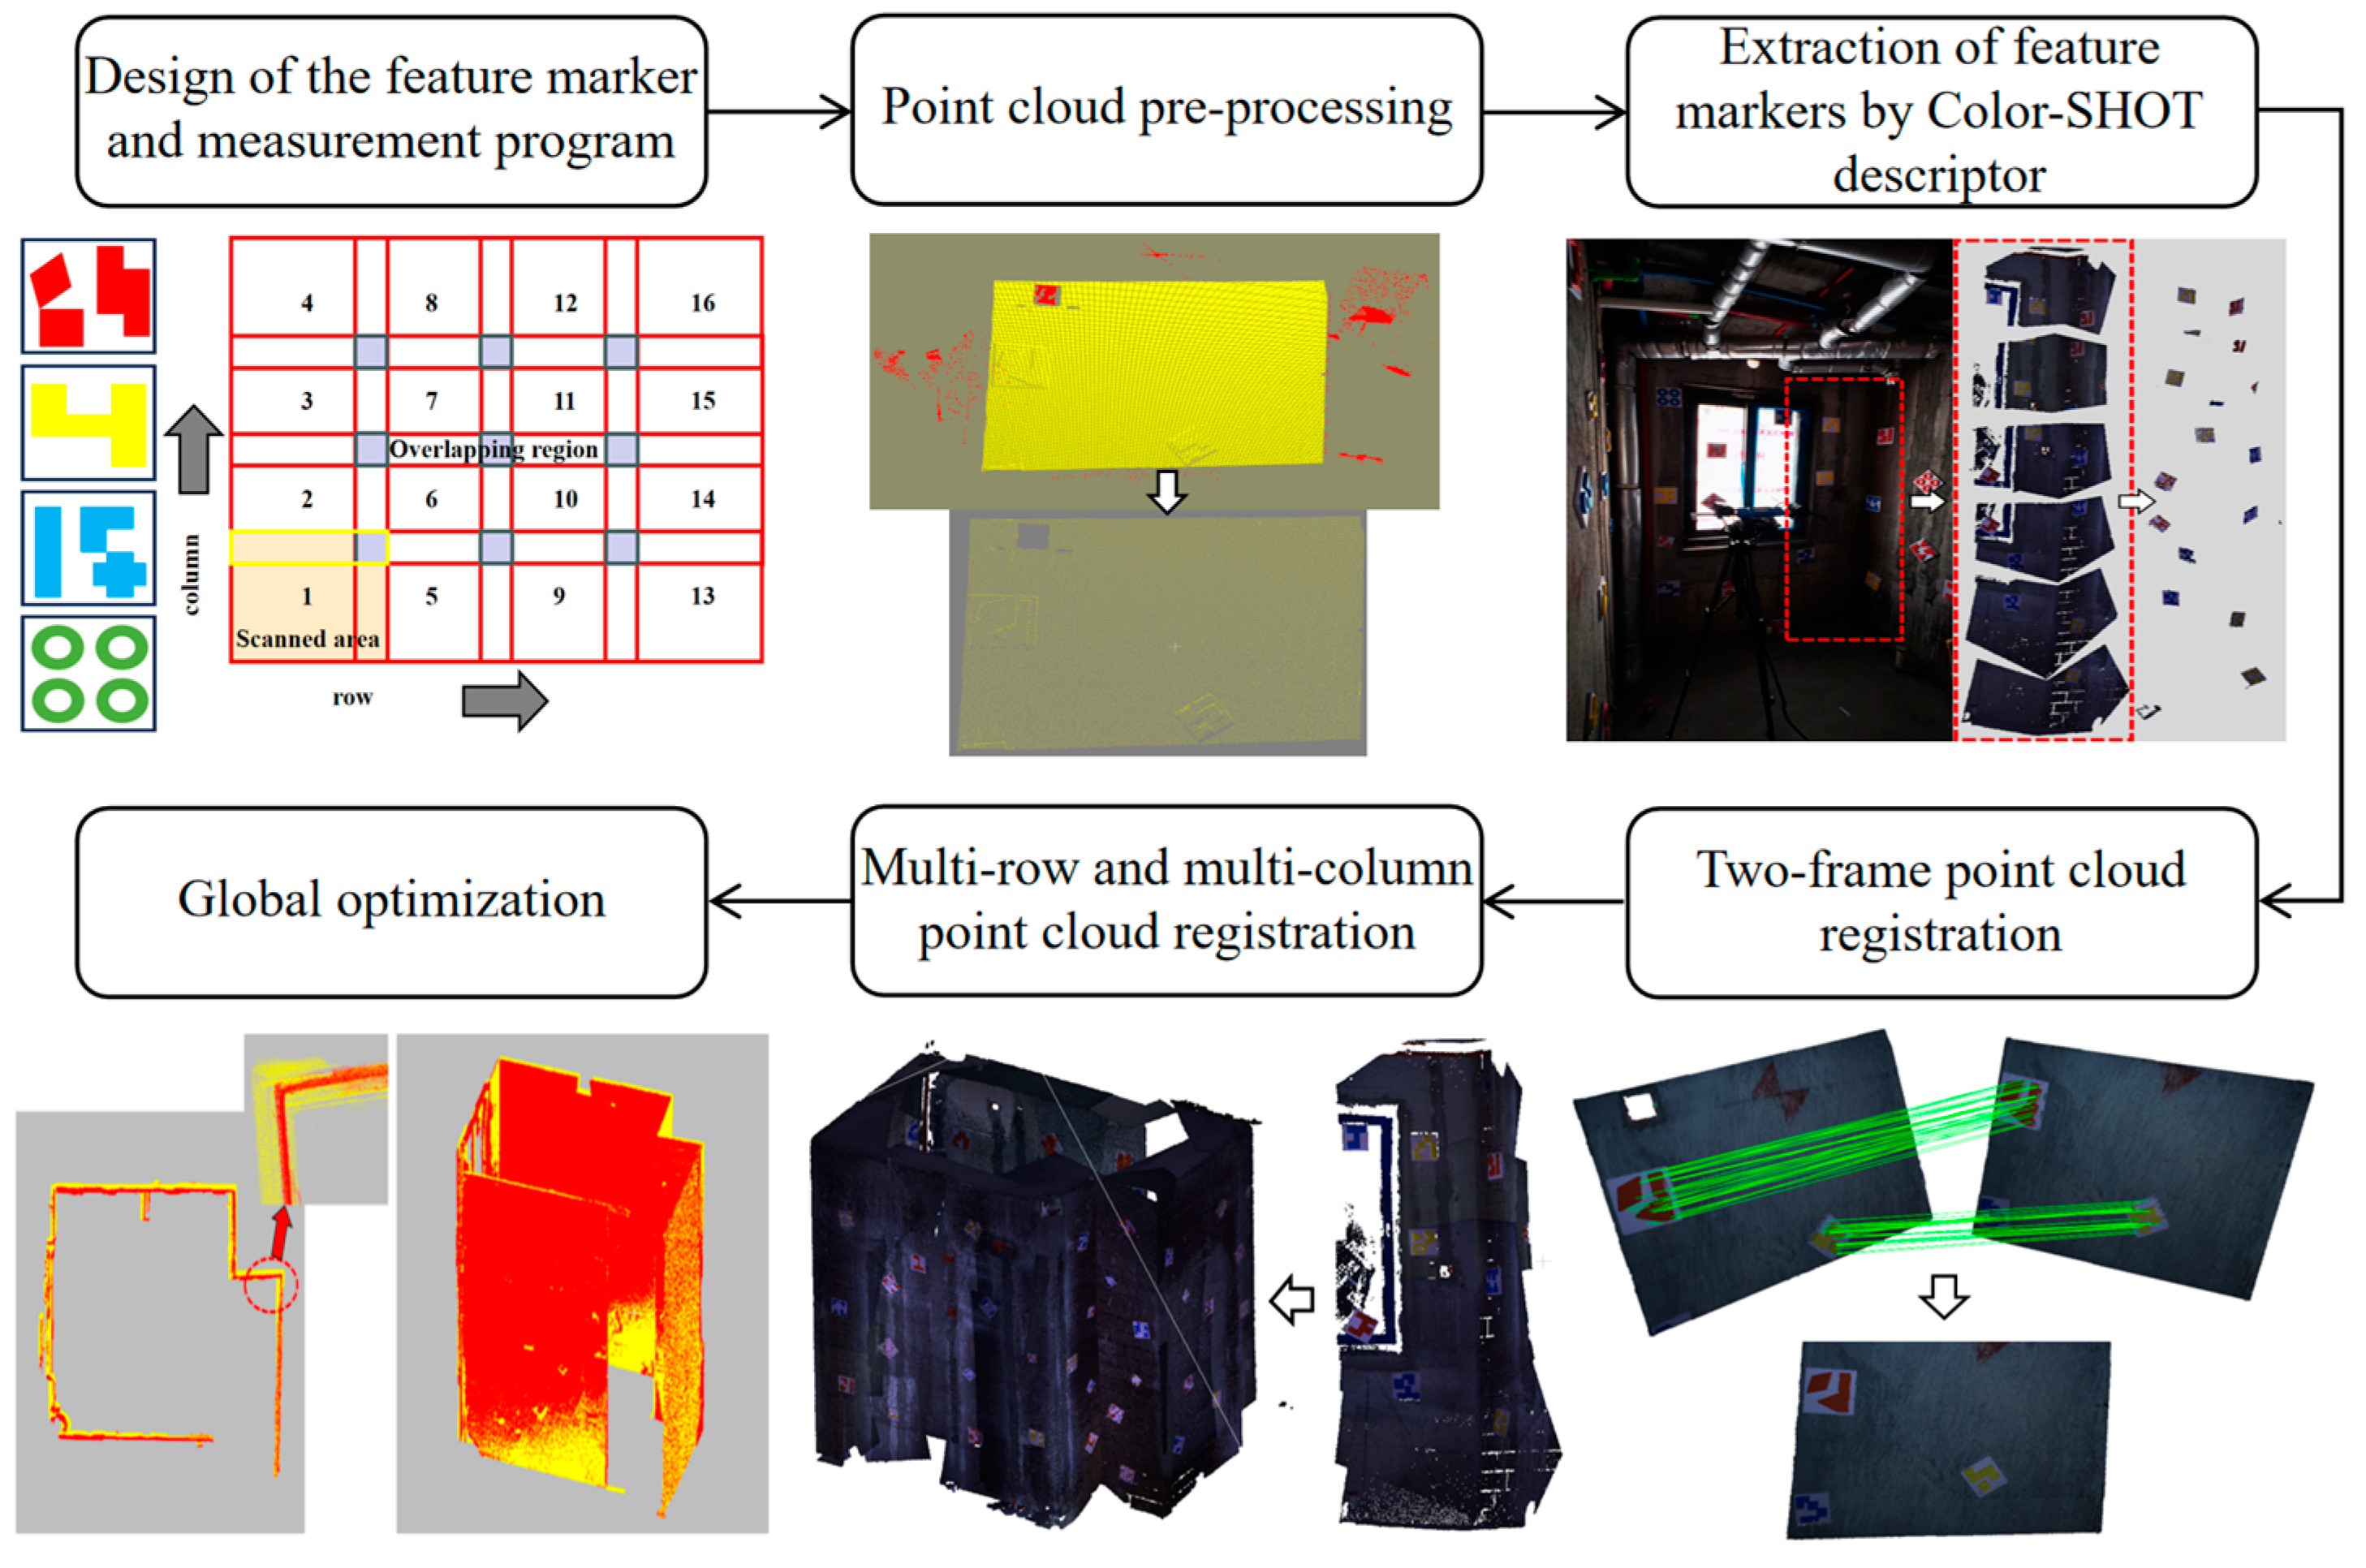
Article

A Globally Consistent Merging Method for House Point Clouds Based on Artificially Enhanced Features

1
College of Chemistry and Chemical Engineering, Qingdao University, Qingdao 266071, China
2
Academia Sinica, Zhejiang United Science & Technology Co., Ltd., Hangzhou 310000, China
3
Polytechnic Institute, Zhejiang University, Hangzhou 310000, China
4
Ningbo Innovation Center, Zhejiang University, Ningbo 315000, China
*
Authors to whom correspondence should be addressed.
Electronics 2024, 13(16), 3179; https://doi.org/10.3390/electronics13163179 (registering DOI)
Submission received: 5 June 2024 / Revised: 28 July 2024 / Accepted: 9 August 2024 / Published: 11 August 2024
(This article belongs to the Special Issue Point Cloud Data Processing and Applications)

Abstract

:
In the process of using structured light technology to obtain indoor point clouds, due to the limited field of view of the device, it is necessary to obtain multiple point clouds of different wall surfaces. Therefore, merging the point cloud is necessary to acquire a complete point cloud. However, due to issues such as the sparse geometric features of the wall point clouds and the high similarity of multiple point clouds, the merging effect of point clouds is poor. In this paper, we leverage artificially enhanced features to improve the accuracy of registration in this scenario. Firstly, we design feature markers and present their layout criteria. Then, the feature information of the marker is extracted based on the Color Signature of Histograms of OrienTations (Color-SHOT) descriptor, and coarse registration is realized through the second-order similarity measure matrix. After that, precise registration is achieved using the Iterative Closest Point (ICP) method based on markers and overlapping areas. Finally, the global error of the point cloud registration is optimized by loop error averaging. Our method enables the high-precision reconstruction of integrated home design scenes lacking significant features at a low cost. The accuracy and validity of the method were verified through comparative experiments.

1. Introduction

The construction industry [1,2] plays an important role in the national economy. Integrated home design [3,4,5] is a necessary part of the construction industry. Home design requires access to highly accurate data on the interior scenes of a house. However, the traditional way of obtaining indoor data for houses relies on manual measurements, and the reliability of the measurement results mainly depends on the ability and experience of the workers. This method has serious problems such as leakage, mismeasurement, the low accuracy of remeasurement, and poor measurement efficiency.
In recent years, with the rapid development of three-dimensional (3D) scanning technology [6,7] and computer vision technology [8,9], indoor scene data acquisition based on point cloud processing technology [10] has gradually become a hotspot of research. Point cloud is a collection of data consisting of a large number of discrete 3D points. These points correspond to the surfaces of various objects inside and outside the house in the real world. After obtaining the point cloud data through 3D scanning equipment, the point cloud is processed and analyzed to restore the structure of the house, the position of doors and windows, and other details. A 3D point cloud model of the interior of a real-world house is finally created [11]. The disadvantages of manual measurement can be effectively avoided by measuring the point cloud model.
In the process of obtaining point clouds, the choice of scanning equipment determines whether an accurate single-frame point cloud can be obtained. Structured light scanning devices work by projecting a specific pattern of light onto the surface of an object. The device accurately measures the shape of a surface through the deformation of light. Structured light devices are good at capturing small bump changes in surfaces and are suitable for capturing data on walls with sparse features. At the same time, structured light scanning is neither as expensive as laser scanning nor more accurate than multi-camera vision. Structured light devices are relatively easy to set up and operate and are suitable for non-specialists.
However, structured light devices can only capture point cloud data in a limited area due to a restricted field of view. Therefore, it is necessary to extract the feature points in the overlapping areas of the point cloud to achieve the merging of point cloud data from different viewpoints. Through the above process, the 3D reconstruction of a wide range of indoor scenes is finally achieved. The above process is known as point cloud registration. That is, for multiple point clouds with overlapping information, by solving the transformation matrix, the point clouds are transformed into the same unified coordinate system. This usually includes both coarse and precise registration processes.
The random sample consensus (RANSAC) method is the classic method for coarse registration, which was proposed by Fischler in 1981 [12]. It substitutes the remaining sample points into the model. If the error for a large number of samples is within a predetermined range, the model is considered optimal. Otherwise, the process is repeated until the optimal model is found. In 1998, Chen [13] and others applied RANSAC to the field of point cloud registration. In 2008, Aiger [14] et al. proposed the 4-Point Congruent Sets (4PCS) algorithm. Unlike the RANSAC algorithm, 4PCS selects four points that converge on the same plane. It searches for similar sets of points in the point cloud to be aligned based on the distances and ratios between these four points. The transformation matrix is finally solved iteratively to complete the registration.
Registration algorithms based on feature-selected correspondences are also the dominant coarse registration schemes. Rusu [15] et al. proposed the Point Feature Histograms (PFH) descriptor. It statistically analyses the geometric distribution of the query point and all neighboring points within the radius of its neighborhood and parameterizes it as a multi-dimensional histogram. The PFH descriptors are relatively computationally intensive, and the point cloud registration is time-consuming. Salti et al. proposed the Signature of Histograms of OrienTations (SHOT) [16]. The SHOT spatialization of localized spherical regions calculates the offset angle statistics of the normal vectors within each sub-region from the normal to the key point and concatenates them into a single vector. SHOT combines the structure of signatures and histograms, balancing descriptiveness and robustness. It is also able to incorporate texture features, which improves feature differentiation.
Coarse registration produces results that often do not meet the required accuracy. Therefore, further research on precise registration is carried out based on coarse registration. A classical method in point cloud precise registration is the Iterative Closest Point (ICP) algorithm, developed by Besl et al. [17]. The algorithm significantly speeds up convergence when receiving better initial values for coarse registration. Hao Men et al. [18] proposed an improved ICP algorithm for fusing RGB information. The method improves the accuracy of the registration by introducing one-dimensional color information into the traditional three-dimensional spatial information. However, the algorithm is slow to compute. Wang Lin et al. [19] proposed an improved ICP-based non-rigid body registration algorithm for 3D point clouds. The algorithm extracts color information to construct point-pair relationships and combines it with the registration results of 3D point cloud coordinates. However, there are still problems of low efficiency.
In the integrated home design stage, doors and walls do not have distinctive convex and concave features. At the same time, the interior lacks structural features such as furniture and decorations. Traditional point cloud registration algorithms often rely on feature matching between the point clouds in order to align. It is difficult for them to perform effective inter-frame point cloud registration in indoor scenes with sparse features. Meanwhile, as the point cloud registration process proceeds, the errors gradually accumulate. Eventually, there are clearly visible traces of deviation in the closed loop.
To address the above issues, the main work of this paper is as follows:
  • We designed feature markers with high contrast in shape and color. We developed a deployment program for indoor feature markers and an overall measurement program.
  • Addressing the problem that the feature extraction area is too large and inaccurate, we explored the segmentation of feature markers and wall backgrounds. We used the Color-SHOT descriptor for feature computation and the extraction of shape and color information of feature markers.
  • We propose a multi-frame, multi-column globally consistent merging method based on a hierarchical strategy. The second-order similarity measure matrix is used to construct matched point pairs for coarse registration. After that, precise registration is achieved using ICP based on markers and overlapping areas.
  • To address the problem of point cloud non-closure due to error accumulation, we propose a global optimization method for the point cloud. The method averages the errors accumulated in the closed loop to the column point cloud. Finally, this paper’s registration algorithm is compared with common algorithms, and the experiment proves the accuracy and efficiency of our method.
The flowchart of the proposed method is illustrated in Figure 1.

2. Measurement Scheme Design

The integrated home design focuses on semi-finished houses. A semi-finished house is a newly built house that has not undergone any renovation work at the time of delivery to the buyer. Semi-finished houses have basic structures such as walls, roofs, plumbing, electrics, windows, and doors. Its walls are usually unpainted, and the floor is only a concrete base with no flooring or other materials.
Semi-finished house interior scenes lack texture and geometric features. Multi-camera vision techniques that rely on texture features for surface detail reconstruction are unable to accurately reconstruct single-frame point cloud data. In point cloud registration, feature points are not obvious and matching point pairs from source and target point clouds may be constructed incorrectly. This eventually leads to misregistration and makes it difficult to achieve the reconstruction of interior point clouds for a wide range of houses.

2.1. Measurement Program Design

Due to the feature sparsity characteristics of a semi-finished house, this study uses a structured light device developed by the group to obtain the point cloud. This equipment consists mainly of a digital projector and a camera, as shown in Figure 2. We chose the DLP4500 digital projector from Texas Instruments in the United States and the MV-CS023-10GC industrial camera from Hikvision in Hangzhou, China.
Figure 3 depicts the scanning process for obtaining data. Start by selecting a starting point in the corner of one of the walls of the room, such as the lower left corner in Figure 3. Then, gradually move up the vertical direction to capture the reconstructed single-frame point cloud, until the point cloud is completely recorded from the bottom to the top of the column. Once this is complete, the device moves right to the next column and repeats the same process. At the same time, there needs to be an overlapping area between two adjacent frames of the point cloud to allow for registration. The process continues until all walls in the room are covered.

2.2. Feature Marking Design and Deployment Scheme

Walls in semi-finished houses lack color and textural character. To address this problem, feature markers are designed in this section to artificially enhance features.
As is shown in Figure 4, we designed two-dimensional characteristics for markers. On the basis of a white background color, we designed a combination of rectangles, triangles, circles, and other basic shapes for markers. At the same time, the four highly distinguishable colors, i.e., red, blue, yellow, and green, were selected.
However, it is difficult for 2D features to achieve the accurate registration of point clouds. So, we used a double-layer design. We used white as the base plate to occupy a layer, and colored shapes with colors were used as the second layer on the base plate.
White baseboards provide significant contrast against the backdrop of the grey semi-finished house walls. This reduces the interference of wall color and texture on the feature marker while highlighting the colored pattern of the upper layer. Compared with 2D labels, 3D structure design enriches the normal vector features in point cloud data. During the point cloud registration process, the normal vector directly affects the accuracy and robustness of the registration. This design includes two sizes of feature markers, specifically 150   m m × 150   m m and 75   m m × 75   m m . The feature marker is shown in Figure 5.
In order to guarantee smooth registration, an overlapping area is required for each scan to register the feature marker.
The length of the wall is x and the height is y . The device scanning range is l in the length direction and h in the height direction. The length of the overlap area needs to be satisfied as n n < l and the height of the overlap area as m m < h .
When x > l , the actual height and number of scans per new scan in the horizontal direction are as follows:
Q x = l n
N x = c e i l x n l n
where c e i l ( ) means upward rounding to ensure that the number of scans is enough.
When y > h , the actual height and scanning times of each new scan in the vertical direction are as follows:
Q y = h m
N y = c e i l y m h m
The total number of scans can be calculated as follows:
N t o t a l = c e i l x n l n × c e i l y m h m
Each overlapping area is shared by neighboring scanned areas in both the length and height directions, and the number of overlapping areas is:
N o = N x 1 N y 1
Figure 6 shows the deployment scheme of feature markers. The wall shown in Figure 6 needs to be divided into four rows and four columns to capture a total of sixteen frames. The orange area represents the scanning start area, and the size of the area is scanned by the device in a single frame. The purple area is the overlapping area of the horizontal and vertical scans, which must be labelled with a feature marker. Take the point cloud of frames 1 and 2 as an example, the yellow rectangular area in the orange area is the overlapping area of two adjacent frame point clouds and can also be used for feature marker posting. The increase in the number of feature marker postings increases the number of matching point pairs between the source and target point clouds. However, too many feature markers may lead to excessive computation and inefficiency. A single feature marker may lead to localized registration. In this study, one to four feature markers were typically placed between two frames of the point cloud. At the same time, it was necessary to ensure that the feature markers in the overlapping area were different; otherwise, it could cause misjudgments.

3. Feature Extraction Method

3.1. Point Cloud Pre-Processing

The point cloud obtained by the structured light has a large amount of noise in the case of strong illumination. The surface of the point cloud has a large number of isolated points and locally clustered discrete points. It is difficult for a single filtering method to remove both isolated points and locally clustered discrete points at the same time. We combine radius filtering and statistical filtering algorithms for point cloud pre-processing.
Take the single frame point cloud obtained in Figure 7 as an example. The yellow part is the main point cloud, and the red part is the noise. It can be seen that the original point cloud has isolated points and locally clustered discrete points.
Radius filtering is first used to remove isolated points on the surface of the point cloud. The point cloud after radius filtering is shown in Figure 8. The isolated points are effectively removed, but there are still three locally clustered discrete points.
Statistical filtering is subsequently applied, and the results are shown in Figure 9. Compared with Figure 7, it can be seen that our method achieves a good filtering effect.
Point cloud downsampling is the process of reducing the number of points in a point cloud. It aims to reduce the amount of computation and increase the efficiency of data processing while maintaining the geometric characteristics of the point cloud. We improved the traditional voxel downsampling method. The idea is as follows:
Firstly, for determining the retention points within voxels, we use the nearest neighbor principle to search for the actual point closest to the voxel’s center of gravity. This point replaces the computed center of gravity as the downsampling point. In cases where most of the edge voxels are outliers, we introduce a minimum point threshold. If the number of points within a voxel is less than the minimum point threshold m , the voxel is ignored.
By following this approach, we can preserve the surface features and edge contours of the point cloud more comprehensively, while also reducing the influence of outliers on the edge contour downsampling points. From Figure 10a, it can be seen that there are still a few noise spots at the edges. We use the nearest-neighbor downsampling algorithm based on edge optimization for single-frame point clouds. This allows for downsampling while filtering out the edge noise points. The downsampling process has a voxel side length L = 10 and a minimum number of points m = 10 . The results after downsampling are shown in Figure 10b.

3.2. Marker Feature Extraction Method

The color image segmentation algorithm based on region growing [20] is an image segmentation technique for processing 3D point cloud data. It combines color information and 3D spatial information to effectively segment feature markers from the background.
As shown in Figure 11, we used the color image segmentation algorithm based on region growing to extract the point cloud part of the feature markers from the single frame point cloud for subsequent registration. The numbers indicate the different regions extracted by the algorithm.
The Color Signature of Histograms of OrienTations (Color-SHOT) descriptor [16] used in this study is a variant of the SHOT descriptor. It not only takes into account the geometric feature information but also the color information. Color-SHOT adds dimension to the descriptor by calculating color intervals in the texture histogram.
As shown in Figure 12a,b, the yellow area is the wall and the orange area is the marker. We extracted the feature information of shape and color in 1433 dimensions from a pair of key points corresponding to the point cloud in the first frame and the point cloud in the second frame using the Color-SHOT descriptor and represented the feature information in the form of histograms after normalization.
In the histogram of Figure 12, the two frames of point cloud data show some correlation in the feature response. The peak value of the feature histogram roughly corresponds to the same histogram dimension in the two frames of data, indicating that there are similar local structure and color features in the neighborhood of the selected feature points. The two feature histograms also show some differences, which are mainly caused by the non-overlapping parts near feature points and noise. Point pair matching is performed through the Color-SHOT descriptor of the key points between two frame point clouds. As can be seen in Figure 13, matching points are generally accurate.
In comparison with the matched point pairs based on the Fast Point Feature Histograms (FPFH) descriptor in Figure 14, the Color-SHOT descriptor is more accurate in extracting the color information and geometric information of the feature markers.

4. Point Cloud Merging Method

4.1. Registration Method

The Second Order Spatial Compatibility Point Cloud Registration (SC2-PCR) algorithm [21] employs FPFH feature descriptors to extract local features. Then, a nearest-neighbor search is performed for each point in the original point cloud to construct the correspondence of point pairs. The FPFH descriptor of the SC2-PCR algorithm does not adequately compute and extract the geometric and textural information of the feature markers. It makes the matching point pair construction inaccurate and ultimately affects the registration accuracy.
Although the key point matching accuracy of the combination of SC2 and FPFH feature descriptors is much higher than the result in Figure 14, there are still errors. As shown in Figure 15, some feature points in the yellow marker in the left point cloud are incorrectly matched with some points in the blue marker in the right point cloud.
As can be seen in Figure 13, there are also errors in the results of key-point matching only by relying on the Color-SHOT feature descriptor. Therefore, we integrate the Color-SHOT descriptor with the second-order similarity measure SC2. From this, the coarse registration of the feature markers is realized, and the variation matrix [ R , T ] is calculated and used to realize the coarse registration of the two-frame point cloud.
Figure 16 shows the matched point pairs combining the second-order similarity measure SC2 with the Color-SHOT descriptor. It can be seen that this approach more accurately extracts the color and geometric information of the feature markers, thus achieving a more accurate registration.
Subsequently, we realized the coarse registration of the two-frame point cloud according to the key point matching results above.
Figure 17a shows the coarse registration results combining FPFH feature descriptors and SC2. Figure 17b shows the coarse registration results of the combination of Color-SHOT feature descriptors and SC2. As can be seen from the figures, the registration result in Figure 17b is better than that in Figure 17a. For example, the yellow marker in Figure 17a has overlapping shadows, while the yellow marker in Figure 17b is more complete. In order to better evaluate the registration results of the two methods, we evaluated the registration effect by calculating the root mean square error (RMSE), rotation error (RE), and translation error (TE) parameters with the ideal registration.
It can be concluded from Table 1 that the registration algorithms based on SC2 and Color-SHOT feature descriptors have better registration accuracy. So, we used it as our coarse registration method.
Through the above process, we completed the coarse registration of the point cloud. The subsequent precise registration was mainly divided into two steps. ICP registration was performed on the feature marker point cloud to calculate the rotation matrix and translation matrix of the feature marker. These matrices were then applied to the remaining part of the point cloud to achieve the initial ICP registration based on the marker. The overlapping areas of the two point cloud frames were extracted using an octree algorithm. Subsequently, we computed the rotation and translation matrices of the overlapping regions and applied them to the transformation of the entire point cloud to achieve precise registration.
Before precise registration, we needed to confirm that ICP registration could achieve excellent registration accuracy, but it has high requirements for the initial attitude of the point cloud. If the initial attitude difference between the two frames is too large, it is difficult to achieve good registration effect.
As shown in Figure 18, the registration effect of using marker-based ICP directly without coarse registration is poor. Therefore, it was necessary to use the method mentioned above for the coarse registration of point clouds and provide a good initial attitude for precise registration.
After the coarse registration, the precise registration of the point cloud was carried out. In Figure 19, Figure 19a shows the result of the marker-based ICP registration, with the red part of the figure being the markers. Figure 19b shows the result of the ICP registration applied to the overlapping areas following the initial marker-based ICP registration. The red part of Figure 19b is the overlap area between the two frames.

4.2. Global Optimization Method of Point Cloud Based on Loop Error Average

The point cloud of an indoor scene forms an error-free closed loop under ideal registration. However, the accumulation of errors during the registration process leads to a non-overlapping and non-closed loop of the first and last point clouds. The error between the first point cloud P 1 and the last point cloud P n after successive registration can be considered as an error of the whole closed loop. Through the registration of P 1 and P n , the Euler angles and translation vectors between them can be obtained. This transformation matrix represents the mathematical expression of the cumulative error between P 1 and P n , denoted as X .
In this paper, we propose a global optimization algorithm based on loopback error averaging. Firstly, the Euler angles and translation vectors of the column point cloud at the closed loop were calculated and considered cumulative errors. Afterwards, the cumulative error was distributed equally among the point clouds. The flowchart of the algorithm is depicted in Figure 20.
As shown in Figure 21, we adopted an undirected graph to represent the closed-loop structure of the point cloud, where A is the starting point of the loop and H is the end point. The curve connecting the vertices A and H represents the cumulative error ∆X.
In the process of continuous multi-frame point cloud registration, we set the coordinates of the first frame point cloud to the world coordinate system. Then, the coordinate transformations of the other point clouds were transferred to the coordinate system of the first frame point cloud. After the registration is complete, the transformation was performed according to the set weights for the cumulative error ∆X that occurred in the registration. The weights for each vertex were assigned in the manner described below:
w i = d m s , m i d m s , m e
In the context of the formula: m s and m e represent the start vertex and end vertex of the loopback. m i refers to any intermediate vertex within the loop. The respective weights assigned for the pose adjustments of these vertices are detailed in Table 2.
After global optimization, the multi-frame point cloud was registered into a smooth and complete point cloud model.

5. Case Study

In order to verify the feasibility of the proposed method, we conducted experimental validation in a realistic semi-finished house. Figure 22 shows the indoor scene diagram of the case study, and Figure 23 shows the overall outline of the indoor scene. The numbers represent different wall numbers.
The first wall was approximately 2.75 m long and 2.85 m high. The scanning area of the device was 1 m long and 0.8 m wide. The setup overlap area was 0.3 m long and 0.3 m wide. According to the feature marker deployment scheme, 24 scans were required and at least 15 feature markers needed to be posted. In summary, 24 frames of point cloud data were obtained. The second wall was about 1.8 m long and 2.85 m high. It needed to be scanned 18 times and at least 10 feature markers needed to be posted. Thus, a total of 84 acquisitions were needed to obtain the 84 frames of the point cloud and at least 50 feature markers were posted.
As shown in Figure 24g, we used the rightmost column of the fourth wall of the room as an example for the experiment. A total of six frames of point cloud were obtained for this column, as shown in Figure 24a–f. Firstly, the registration between two frames of the point cloud was performed; before that, the feature markers needed to be segmented from the background by the color image segmentation algorithm based on region growing. Characterization was performed using Color-SHOT descriptor and coarse registration was performed in combination with SC2-PCR. After that, precise registration was achieved using ICP based on markers and overlapping areas. Taking the two frames of the point cloud in Figure 24d,e as examples, the registration process is shown in Figure 25.
The above registration process is performed step-by-step for the six frames of the point cloud in Figure 24a–f. The final point cloud of the column with the completed registration is obtained, as shown in Figure 26.
After many instances of row point cloud registration between the two frames, a total of 13 copies of the column point cloud were obtained. After that, the above registration process was repeated for the column point cloud and global optimization was performed. The final indoor scene point cloud model is shown in Figure 27. This model already provides a clear and complete representation of the information in the interior scene of a semi-finished house.

6. Discussion

In order to verify the effectiveness of our method, relevant verification experiments are outlined in this section.

6.1. Precision Analysis of Interframe Registration

The real scene lacks the standard reference of indoor scene point clouds, so we used manual labeling combined with the ICP method to approximate the optimal transformation matrix for point cloud registration. Figure 28a shows the initial position of the two frames of the point cloud obtained from the structured light acquisition. Figure 28b shows the ideal registration point cloud obtained through manual labeling combined with the ICP method.
Manual labeling combined with the optimal transformation matrix computed by the ICP method:
R , T = 0.99994 0.01067 0.00101 2.01359 0.01072 0.99715 0.07466 10.31968 0.00021 0.07467 0.99721 10.75119 0 0 0 1
For the point clouds awaiting registration, the transformation matrices R , T obtained from different registration methods were compared with the ideal transformation matrix R , T . From this, root mean square error (RMSE), rotation error (RE), and translation error (TE) were calculated. The RE is in deg and the TE is in mm. This section validates the accuracy of our method by comparing it with common registration algorithms. The methods involved in the comparison include Fast Global Registration (FGR) [22], 4-Point Congruent Sets For Robust Pairwise Surface Registration (4PCS) [14], Random Sample Congruent Initial Alignment (SAC-IA), SC2-PCR, a coarse registration algorithm based on Color-SHOT and second-order similarity measure in this paper, and a precise registration method based on feature-sparse scenarios with feature markers. In Figure 29, the source point cloud is shown in blue, the target point cloud in yellow, and the transformed source point cloud in red.
For the registration of two adjacent point clouds, a comparison of the errors and running time of several registration algorithms is shown in Table 3. It can be seen that the accuracy of the registration algorithm in this paper is the highest. The coarse registration algorithm in this paper has similar accuracy to FGR but functions four times faster than FGR. The coarse registration algorithm in this paper is an improvement on the SC^2-PCR algorithm, and the coarse registration algorithm in this paper has higher accuracy compared to the SC2-PCR algorithm.
In Figure 30, we used a line chart to further visualize the data from Table 3. The horizontal coordinates of the line chart are the six different registration algorithms given in Table 3. The left vertical axis represents RMSE and RE, and the right vertical axis represents TE and runtime.
The algorithmic accuracy can be visualized as follows: Our registration algorithm > Our coarse registration algorithm ≈ Fast Global Registration > SC2-PCR > SAC-IA > 4PCS. The algorithm runtime can be seen as follwos: Fast Global Registration > Our registration algorithm > SAC-IA > Our coarse registration algorithm > SC2-PCR > 4PCS.
The target point cloud transformed by several registration algorithms is compared with the target point cloud transformed by ideal registration, and the shortest distance from each point in the actual point cloud to the corresponding point in the ideal target point cloud is calculated to quantify the error. We use a gradient color scale, with a color bar next to each image indicating the range of error values. The color bars usually go from low to high, with blue representing the lowest error value and red representing the highest error value. The error distribution is shown in Figure 31.
The Fast Global Registration (FGR) method exhibits an error range from 0.006 to 2.398, with the majority of errors falling between 0.5 and 1.5. The 4-Point Congruent Sets (4PCS) algorithm displays a broader error range from 0.045 to 13.235, predominantly between 1 and 8. For the Sample Consensus Initial Registration (SAC-IA) algorithm, errors range from 0.051 to 11.021, typically clustering between 1 and 5. The SC2-PCR algorithm shows errors ranging from 0.044 to 8.411, with a concentration between 1 and 2. The initial registration algorithm presented in this study has an error span from 0.663 to 2.000, mainly between 0.5 and 1.5. The refined registration algorithm developed in this study ranges from 0.044 to 0.516, with the majority of errors from 0.1 to 0.5. In Figure 31, it can be seen that the overall error of the alignment algorithm in this paper is much smaller.

6.2. Accuracy Analysis of Globally Optimized Point Clouds

In this section, the accuracy and advancement of the point cloud global optimization method based on loopback error averaging was verified by comparing the measurement data before and after the global optimization of the indoor scene of a house. Table 4 shows the dimensions of rooms, doors, and windows before and after optimization. It can be seen that after global optimization, the length, width, and height of the room are more accurate, while the local dimensions of the doors and windows have little effect, and the error was kept within 1 mm.
Then, we measured the dimensions of multiple feature markers on four walls and calculate the average value. In Table 5, the feature markers for wall 4 accumulated errors due to being in part at the closed loop between wall 4 and wall 1. This situation resulted in the final measurements being obtained with lower dimensional accuracy than the rest of the wall, with an error greater than 1 mm. Other wall surfaces were aligned using the algorithm designed in this paper, and the local registration was accurate. After the global optimization, the error was averaged to each wall, and the feature marker error values were all less than 1 mm.
Finally, we measured the angle of the wall. Initially, the angular errors were [0.28, 1.64], while the post-optimization errors were reduced to [0.11, 0.97], which is a tolerance of less than 1 deg, as shown in Table 6. The point cloud of the indoor house scene before and after optimization is shown in Figure 32. Yellow is the point cloud before optimization, and red is the point cloud after optimization. Significant errors in the point cloud at the closed loop before optimization. Afterwards, by averaging the errors, the overall dimensional and angular accuracy is improved while the local accuracy is ensured and the accuracy of the overall model is improved.

7. Summary and Prospects

In this paper, we proposed a point cloud merging method for sparse features in integrated home design scenarios. Firstly, we designed a two-layer structural feature marker to artificially enhance features. It has many normal vector features and rich color information. At the same time, we designed the feature marker deployment as well as the measurement program. After obtaining the point cloud data, we used the hybrid filtering based point cloud denoising method and edge optimization based nearest neighbor downsampling method to pre-process the point cloud. We used a color image segmentation algorithm based on region growing to extract feature markers. We proposed a point cloud registration algorithm based on Color-SHOT and second-order similarity measures as well as an ICP point cloud registration algorithm based on feature markers and overlapping areas to realize the multi-frame and multi-column merging of indoor point cloud data. The problem of error accumulation during multi-column point cloud registration is solved by a global optimization algorithm with loopback error averaging. Our proposed method addresses the challenge of merging integrated home design scenes that lack significant features, effectively filling a gap in this area. Compared to established industry scanning solutions, our approach significantly reduces costs while achieving house reconstruction with an accuracy of 1 mm. This method was successfully applied and validated in a house design project for the Fotile Borcci Company.

Author Contributions

Conceptualization, G.S. and S.L.; methodology, G.S. and S.L.; software, S.L. and Y.C.; validation, S.L. and Y.C.; formal analysis, S.L. and Y.C.; writing—original draft preparation, Y.C. and S.L.; writing—review and editing, D.L. and G.S.; visualization, S.L. and Y.C.; supervision, Z.W.; project administration, G.S.; funding acquisition, G.S. All authors have read and agreed to the published version of the manuscript.

Funding

This work was funded by the National Natural Science Foundation of China (no. 52105279), the Zhejiang Provincial Natural Science Foundation of China (no. LQ22E050015), and the Ningbo Key Research and Development Program (no. 2023Z134).

Data Availability Statement

The data used to support the findings of this study are available from the corresponding author upon request.

Acknowledgments

The authors thank Fotile Co., Ltd., for their support during the experiments.

Conflicts of Interest

Authors Guodong Sa and Dandan Liu were employed by the company Zhejiang United Science & Technology Co., Ltd. The remaining authors declare that the research was conducted in the absence of any commercial or financial relationships that could be construed as a potential conflict of interest.

References

  1. Garriga, C.; Hedlund, A.; Tang, Y.; Wang, P. Rural-urban migration, structural transformation, and housing markets in China. Am. Econ. J. Macroecon. 2023, 15, 413–440. [Google Scholar] [CrossRef]
  2. Liu, X.; Xue, C.Q. Exploring the challenges to housing design quality in China: An empirical study. Habitat Int. 2016, 57, 242–249. [Google Scholar] [CrossRef]
  3. Chardon, S.; Brangeon, B.; Bozonnet, E.; Inard, C. Construction cost and energy performance of single family houses: From integrated design to automated optimization. Autom. Constr. 2016, 70, 1–13. [Google Scholar] [CrossRef]
  4. Zamora-Izquierdo, M.A.; Santa, J.; Gómez-Skarmeta, A.F. An integral and networked home automation solution for indoor ambient intelligence. IEEE Pervasive Comput. 2018, 9, 66–77. [Google Scholar] [CrossRef]
  5. Joy, E.; Raja, C. Digital 3D modeling for preconstruction real-time visualization of home interior design through virtual reality. Constr. Innov. 2024, 24, 643–653. [Google Scholar] [CrossRef]
  6. Zang, H. Precision calibration of industrial 3d scanners: An ai-enhanced approach for improved measurement accuracy. Glob. Acad. Front. 2024, 2, 27–37. [Google Scholar]
  7. Shih, N.J.; Lee, C.Y.; Jhan, S.W.; Wang, G.S.; Jhao, Y.F. Digital preservation of a historical building–the 3D as-built scan of don Nan-Kuan house. Comput.-Aided Des. Appl. 2009, 6, 493–499. [Google Scholar] [CrossRef]
  8. Wiley, V.; Lucas, T. Computer vision and image processing: A paper review. Int. J. Artif. Intell. Res. 2018, 2, 29–36. [Google Scholar] [CrossRef]
  9. Szeliski, R. Computer Vision: Algorithms and Applications; Springer Nature: New York, NY, USA, 2022. [Google Scholar]
  10. Qu, T.; Coco, J.; Rönnäng, M.; Sun, W. Challenges and trends of implementation of 3D point cloud technologies in building information modeling (BIM): Case studies. In Computing in Civil and Building Engineering (2014); American Society of Civil Engineers: New York, NY, USA, 2014; pp. 809–816. [Google Scholar]
  11. Wang, Q.; Tan, Y.; Mei, Z. Computational methods of acquisition and processing of 3D point cloud data for construction applications. Arch. Comput. Methods Eng. 2020, 27, 479–499. [Google Scholar] [CrossRef]
  12. Fischler, M.A.; Bolles, R.C. Random sample consensus: A paradigm for model fitting with applications to image analysis and automated cartography. Commun. ACM 1981, 24, 381–395. [Google Scholar] [CrossRef]
  13. Chen, C.-S.; Hung, Y.-P.; Cheng, J.-B. A fast automatic method for registration of partially-overlapping range images. In Proceedings of the Sixth International Conference on Computer Vision (IEEE Cat. No. 98CH36271), Bombay, India, 7 January 1998; pp. 242–248. [Google Scholar]
  14. Aiger, D.; Mitra, N.J.; Cohen-Or, D. 4-points congruent sets for robust pairwise surface registration. ACM Trans. Graph. (TOG) 2008, 27, 1–10. [Google Scholar] [CrossRef]
  15. Rusu, R.B.; Blodow, N.; Marton, Z.C.; Beetz, M. Aligning point cloud views using persistent feature histograms. In Proceedings of the 2008 IEEE/RSJ International Conference on Intelligent Robots and Systems, Nice, France, 22–26 September 2008; pp. 3384–3391. [Google Scholar]
  16. Salti, S.; Tombari, F.; Di Stefano, L. SHOT: Unique signatures of histograms for surface and texture description. Comput. Vis. Image Underst. 2014, 125, 251–264. [Google Scholar] [CrossRef]
  17. Besl, P.J.; McKay, N.D. Method for registration of 3-D shapes. In Sensor Fusion IV: Control Paradigms and Data Structures; SPIE Proceedings: San Diego, CA, USA, 1992; pp. 586–606. [Google Scholar]
  18. Men, H.; Gebre, B.; Pochiraju, K. Color point cloud registration with 4D ICP algorithm. In Proceedings of the 2011 IEEE International Conference on Robotics and Automation, Shanghai, China, 9–13 May 2011; pp. 1511–1516. [Google Scholar]
  19. Wang, L.; Guo, J.; Zhang, P.; Teng, W.; Cheng, L.; Shaoyi, D. Rigid registration method of 3D point cloud based on improved ICP algorithm. J. Northwest Univ. (Nat. Sci. Ed.) 2021, 51, 183–190. [Google Scholar] [CrossRef]
  20. Tang, J. A color image segmentation algorithm based on region growing. In Proceedings of the 2010 2nd International Conference on Computer Engineering and Technology, Chengdu, China, 16–18 April 2010; pp. V6-634–V6-637. [Google Scholar]
  21. Chen, Z.; Sun, K.; Yang, F.; Tao, W. Sc2-pcr: A second order spatial compatibility for efficient and robust point cloud registration. In Proceedings of the IEEE/CVF Conference on Computer Vision and Pattern Recognition, New Orleans, LA, USA, 18–24 June 2022; pp. 13221–13231. [Google Scholar]
  22. Zhou, Q.-Y.; Park, J.; Koltun, V. Fast global registration. In Proceedings of the Computer Vision–ECCV 2016: 14th European Conference, Amsterdam, The Netherlands, 11–14 October 2016; Proceedings, Part II 14. pp. 766–782. [Google Scholar]
Figure 1. Flowchart of our method.
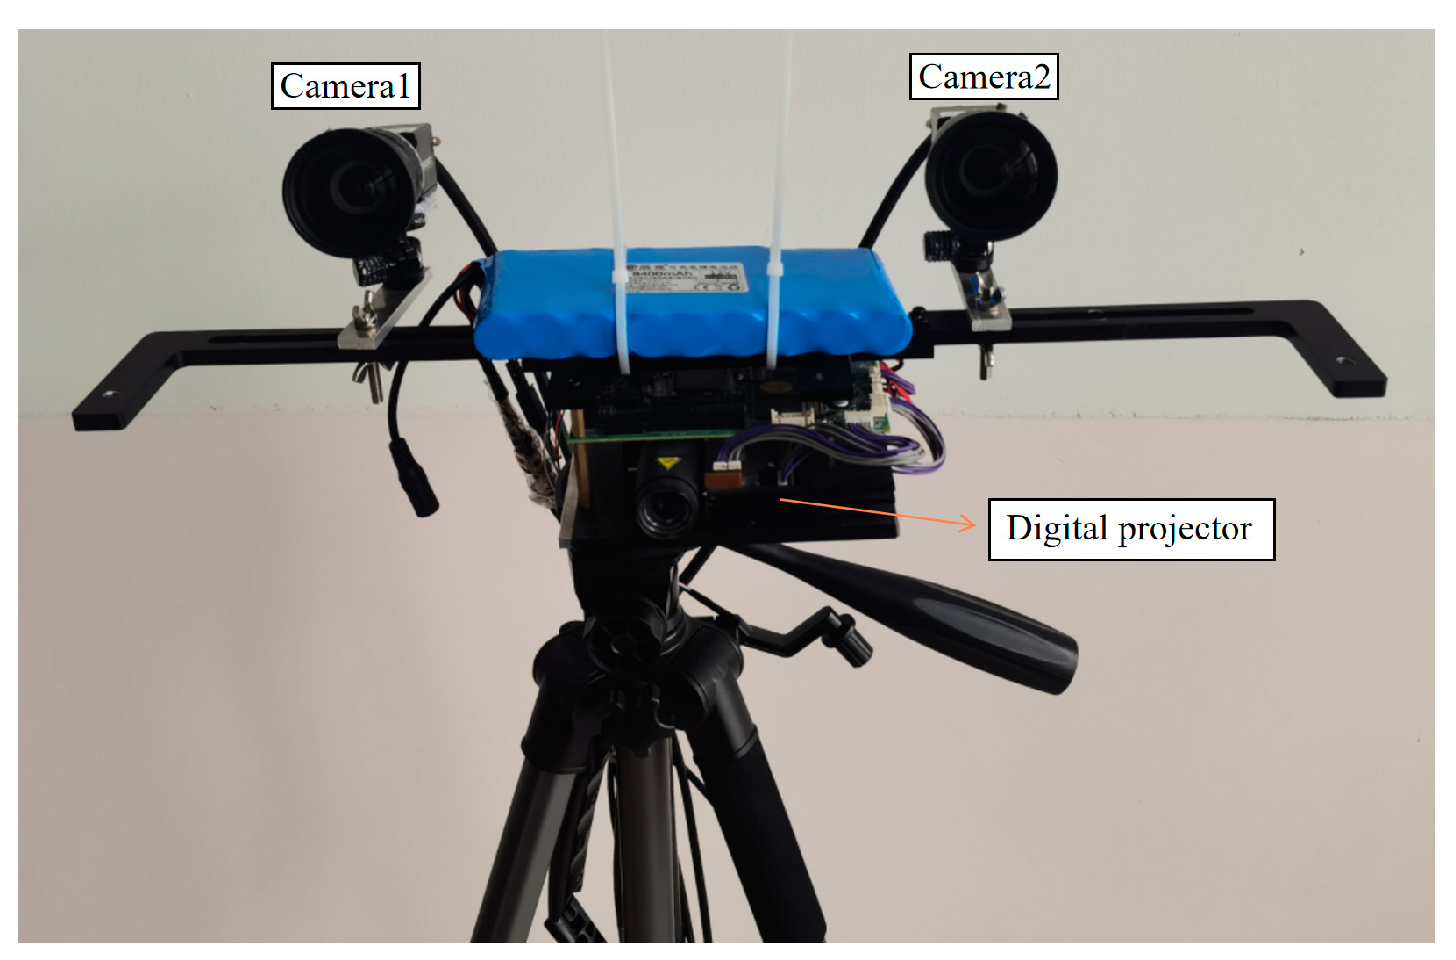
Electronics 13 03179 g001
Figure 2. Measuring equipment structure diagram.
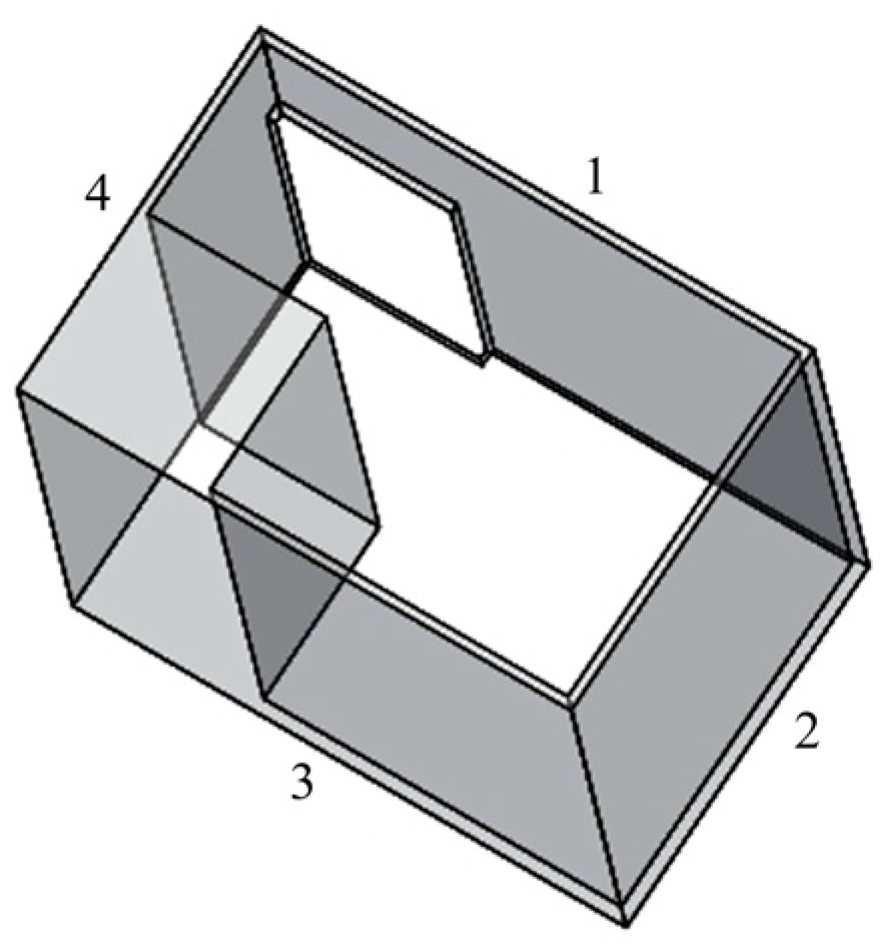
Electronics 13 03179 g002
Figure 3. Scanning process for our structured light device to obtain a single wall point cloud.
Electronics 13 03179 g003
Figure 4. Two-dimensional graphic design of feature markers. (a) Red marker. (b) Blue marker. (c) Yellow marker. (d) Green marker.
Electronics 13 03179 g004
Figure 5. Photo of the feature marker of the designed double-layer structure.
Electronics 13 03179 g005
Figure 6. Deployment diagram of feature markers.
Electronics 13 03179 g006
Figure 7. Original point cloud without filtering.
Electronics 13 03179 g007
Figure 8. The result of the first radius filtering.
Electronics 13 03179 g008
Figure 9. The final filtering result.
Electronics 13 03179 g009
Figure 10. Results of nearest neighbor downsampling based on edge optimization: (a) point cloud before downsampling; (b) downsampling point cloud.
Electronics 13 03179 g010
Figure 11. The extraction result of the feature marker.
Electronics 13 03179 g011
Figure 12. A Color-SHOT descriptor histogram of a pair of key points in the feature marker: (a) point cloud of markers in the first frame; (b) point cloud of markers in the second frame.
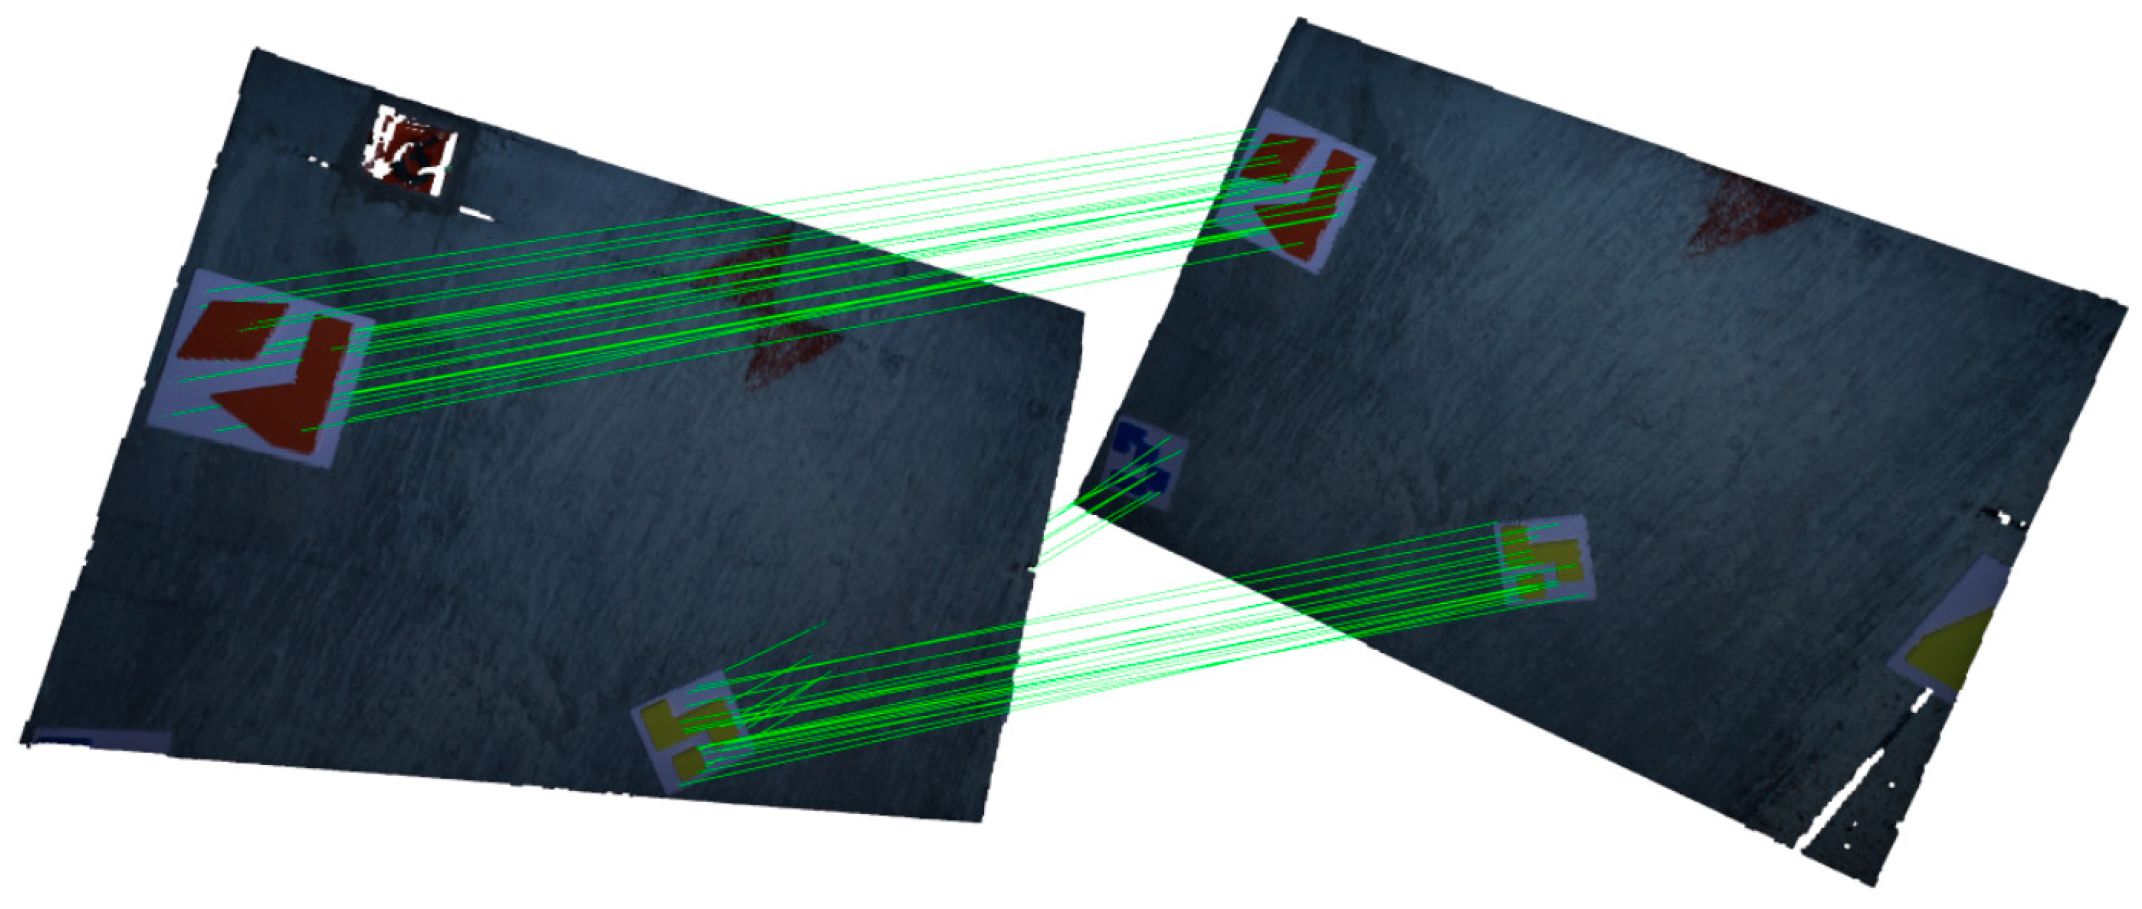
Electronics 13 03179 g012
Figure 13. Point pair matching based on Color-SHOT.
Electronics 13 03179 g013
Figure 14. Point pair matching based on FPFH.
Electronics 13 03179 g014
Figure 15. Matching point pairs based on SC2 and FPFH.
Electronics 13 03179 g015
Figure 16. Matching point pairs based on SC2 and Color-SHOT.
Electronics 13 03179 g016
Figure 17. Coarse registration results: (a) based on SC2 and FPFH; (b) based on SC2 and Color-SHOT.
Electronics 13 03179 g017
Figure 18. The registration results were obtained by using marker-based ICP without coarse registration.
Electronics 13 03179 g018
Figure 19. Precise registration results: (a) marker-based ICP registration; (b) overlapping areas ICP registration.
Electronics 13 03179 g019
Figure 20. Flowchart of the global optimization algorithm.
Electronics 13 03179 g020
Figure 21. Point cloud loop error structure.
Electronics 13 03179 g021
Figure 22. Experimental scene diagram.
Electronics 13 03179 g022
Figure 23. Interior scene overall outline model.
Electronics 13 03179 g023
Figure 24. Schematic representation of the point cloud of the column to be registered: (af) single-frame point cloud to be registered; (g) practical scenarios for columns to be registered.
Electronics 13 03179 g024
Figure 25. Point cloud registration process for two nearby frames.
Electronics 13 03179 g025
Figure 26. Column point cloud after registration: (a) point cloud without color information; (b) point cloud with color information.
Electronics 13 03179 g026
Figure 27. Globally optimized point cloud model of indoor scene: (a) top view; (b) isometric view.
Electronics 13 03179 g027
Figure 28. The reference standard of registration results is obtained by combining the manual labeling and the ICP method: (a) initial location of the point cloud; (b) ideal point cloud registration.
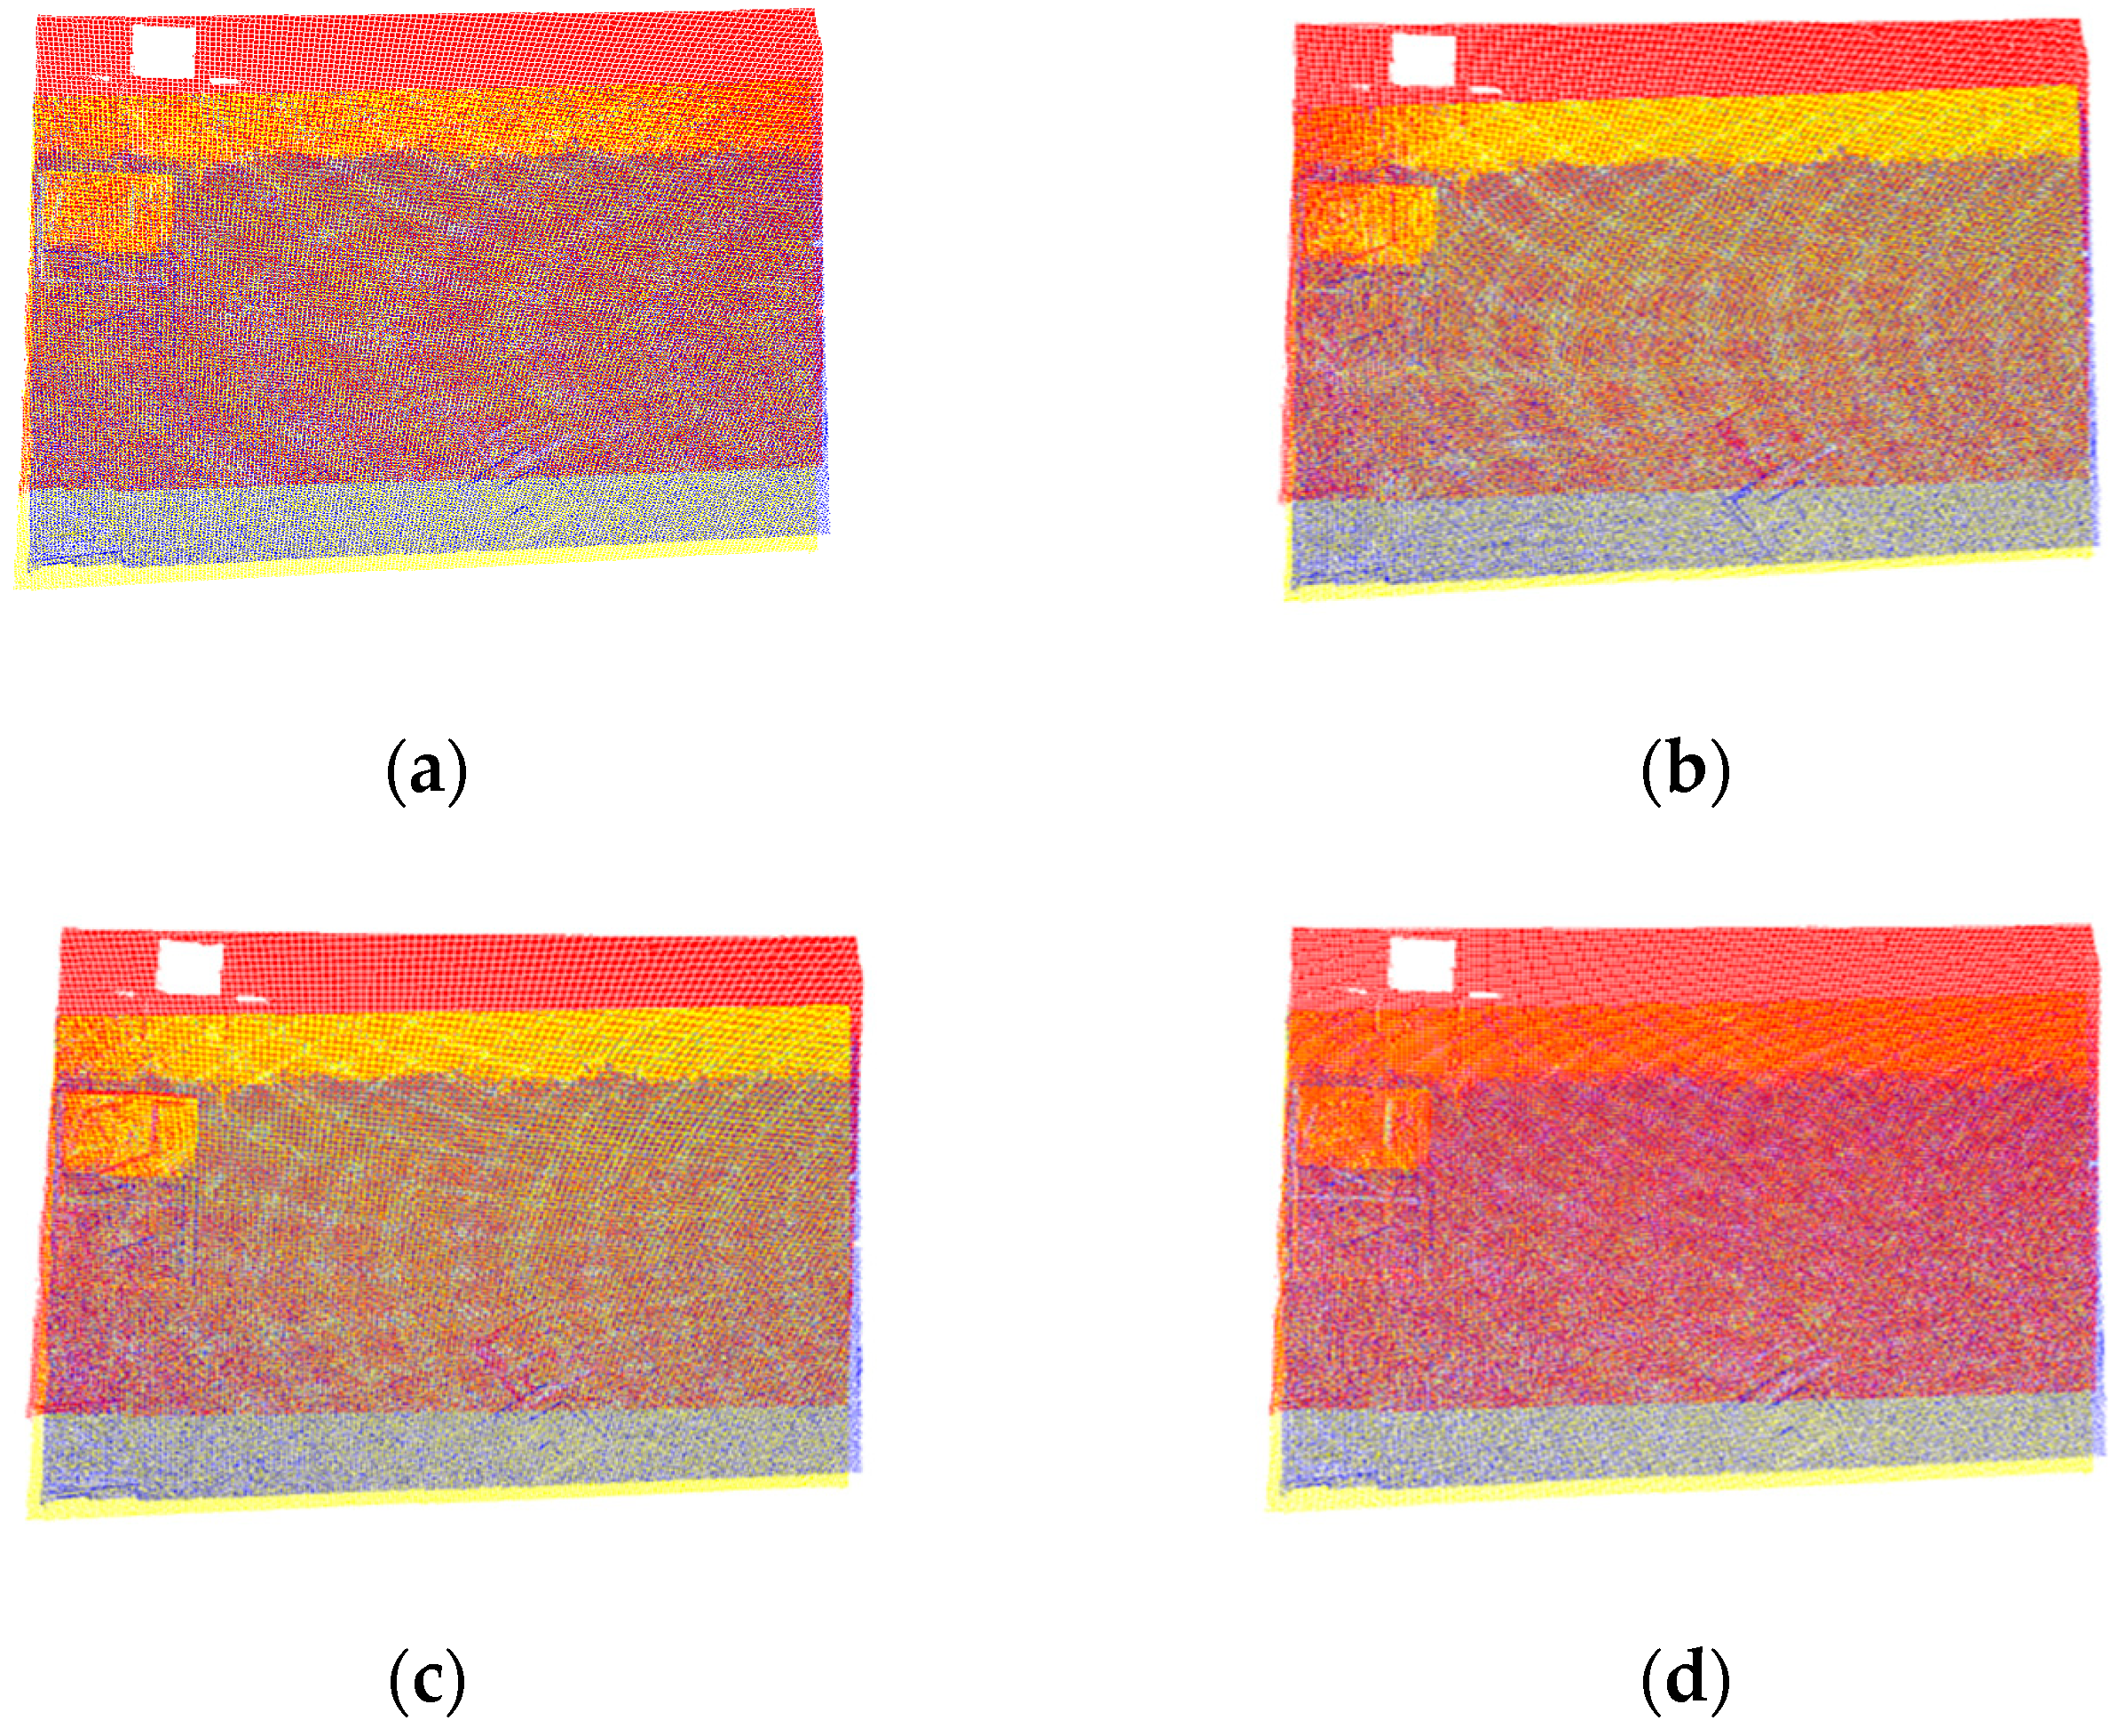
Electronics 13 03179 g028
Figure 29. Comparison of registration algorithm results: (a) FGR; (b) 4PCS; (c) SAC-IA; (d) SC2-PCR; (e) our coarse registration algorithm; (f) our registration algorithm.
Electronics 13 03179 g029aElectronics 13 03179 g029b
Figure 30. Error and runtime of several point cloud registration algorithms.
Electronics 13 03179 g030
Figure 31. Error distribution of several point cloud registration algorithms: (a) FGR; (b) 4PCS; (c) SAC-IA; (d) SC2-PCR; (e) our coarse registration algorithm; (f) our registration algorithm.
Electronics 13 03179 g031aElectronics 13 03179 g031b
Figure 32. The point cloud comparison diagram of the house indoor field before and after optimization: (a) top view; (b) isometric view.
Electronics 13 03179 g032
Table 1. Precision comparison of two registration algorithms based on SC2 and FPFH and SC2 and Color-SHOT.
AlgorithmRMSERE (deg)TE (mm)
Based on SC2 and FPFH0.84450.87627.231
Based on SC2 and Color-SHOT0.096860.14542.158
Table 2. Pose adjustment weights.
VertexABCDEFGH
Weight01/82/83/84/85/86/87/8
Table 3. Comparison of error and runtime of several registration algorithms.
AlgorithmRMSERE (deg)TE (mm)Time (s)
FGR0.099240.17691.95513.83
4PCS0.84370.929512.051.31
SAC-IA0.84380.93178.9783.74
SC2-PCR0.84450.87627.2312.28
Our coarse registration algorithm0.096860.14542.1583.16
Our registration algorithm0.086430.088470.56758.57
Table 4. Size before and after optimization.
ParametersRealistic DataBefore OptimizationAfter Optimization
Room length (mm)2765.002767.482765.86
Room width (mm)1790.001792.421790.72
Room height (mm)2845.002845.982845.60
Gate width (mm)820.00820.83820.94
Gate height (mm)2450.002449.282449.81
Window width (mm)975.00974.95975.21
Window height (mm)1480.001479.301479.20
Table 5. Markers size before and after optimization.
ParametersRealistic DataBefore OptimizationAfter Optimization
Wall 1 marker length and width (mm2)150.00 × 150.00149.37 × 149.78150.78 × 150.18
Wall 2 marker length and width (mm2)150.00 × 150.00150.34 × 150.02150.84 × 150.92
Wall 3 marker length and width (mm2)150.00 × 150.00149.65 × 150.73149.36 × 149.64
Wall 4 marker length and width (mm2)150.00 × 150.00148.89 × 148.67149.54 × 149.33
Table 6. Wall angles before and after optimization.
ParametersRealistic DataPre-Optimization MeanOptimized Mean
Angle between wall 1 and wall 2 (deg)90.0088.5989.25
Angle between wall 1 and wall 2 (deg)90.0089.7289.89
Angle between wall 1 and wall 2 (deg)90.0089.4689.57
Angle between wall 1 and wall 2 (deg)90.0088.3489.03
Disclaimer/Publisher’s Note: The statements, opinions and data contained in all publications are solely those of the individual author(s) and contributor(s) and not of MDPI and/or the editor(s). MDPI and/or the editor(s) disclaim responsibility for any injury to people or property resulting from any ideas, methods, instructions or products referred to in the content.

