Article

Inflection Point Effect of Interturn Insulation for Transformer under Preload Stress

1
Electric Power Research Institute of State Grid Ningxia Electric Power Co., Ltd., Yinchuan 750002, China
2
State Grid Ningxia Electric Power Co., Ltd., Yinchuan 750001, China
3
Ultra-High Voltage Company of State Grid Ningxia Electric Power Co., Ltd., Yinchuan 750011, China
4
School of Electrical Engineering and Information Engineering, Lanzhou University of Technology, Lanzhou 730050, China
*
Author to whom correspondence should be addressed.
Electronics 2024, 13(16), 3185; https://doi.org/10.3390/electronics13163185
Submission received: 4 June 2024 / Revised: 23 July 2024 / Accepted: 26 July 2024 / Published: 12 August 2024

Abstract

:
The current research mainly focuses on the influence of different voltage forms on partial discharge for the interturn insulation of a transformer, and the discharge characteristics and its mechanism of interturn insulation under the action of preload are unclear. Therefore, a partial discharge test platform under the synergistic action of preloading force and electrical stress is constructed based on the actual operation conditions of the interturn insulation of a 750 kV transformer. Then, the partial discharge characteristics and its mechanism is explored by using (OM, SEM, FTIR, XRD, EDS, FEA). It is found that the statistical parameters and damage degree of interturn insulation decrease first and then increase with the increase in preload. Moreover, there is an inflection point at 1000 N. The reason is that the preload causes the deformation of the holes and air gaps between the layers of insulating paper and in the insulating paper. As a result, the contact area and volume of partial discharge are changed, which further changes the characteristics of partial discharge for interturn insulation. This study can provide a reference for the maintenance and structural optimization of 750 kV transformers.

1. Introduction

The 750 kV transformers that are crucial electrical equipment in the Yinchuan East converter station directly impact the safe and stable operation of Ultra-High-Voltage Power Grids in Northwest and North China. Many researchers have carried out a statistical analysis of transformer faults and found winding short-circuit faults are a common type of fault for transformers [1]. The breakdown and surface discharge of interturn insulation are the main causes of short-circuit faults [2]. Interturn insulation refers to the insulation material used in the coils of a motor or transformer to isolate adjacent coils. Its main function is to prevent direct short circuits or arc breakdown between coils or between coils and iron cores. For example, insulating paper is commonly used for coil insulation in motors, and insulating film is commonly used for insulation in high-temperature and high-frequency electrical equipment. When the short-circuit current in the running 750 kV transformer windings is increased by over 10%, the short-circuit-withstanding capability of the transformer shows a significant inadequacy based on the analysis report of the Ningxia Power Company in 2022. As a result, the deformation of winding turn insulation for a transformer appears and the axial pre-tightening force decreases. Under the further action of electrical stress and pre-tightening stress, the mechanical and insulation properties of transformer windings decline, resulting in a decrease in the short-circuit-withstanding capability [3]. Therefore, it is essential to investigate the partial discharge characteristics of interturn insulation in 750 kV transformers under the synergistic effect of electrical stress and pre-tightening stress.
Thus far, many researchers have studied the partial discharge characteristics of turn-to-turn insulation in transformers under various voltage conditions and factors. In References [4,5], the stepwise boosting method was employed to carry out partial discharge tests on the interturn insulation of 500 kV transformers. The tests were aimed at investigating the changing trends of the statistical parameters of partial discharge under various boosting durations, as well as the phase distribution patterns in two-dimensional spectra. Subsequently, the inverse power model of interturn insulation for a transformer between the aging life and the maximum field strength was obtained based on the maximum likelihood method. In Reference [6], the evolution of carbonization channels in oil paper insulation under accelerated electrical aging was studied by using the constant voltage method. It was observed that the development of carbonization channels in degraded insulation paper can be divided into three stages: growth, stagnation, and breakdown. Moreover, the development of carbonization channels is consistent with the variation in the pulse repetition rate and total discharge within 1 s. In References [7,8], the non-uniform electric field conditions of interturn insulation were simulated and breakdown and surface discharge tests under high-frequency voltage were conducted for different insulation materials of a transformer. It was found that the breakdown voltage significantly decreases with increasing frequency and decreased to 67.63~79.42% of the original value. The high-frequency thermal effect is the main cause of the decrease in breakdown voltage. In Reference [9], the influence of sulfur corrosion in oil on the partial discharge in windings’ interturn insulation was investigated. It was observed that as the concentration of corrosive sulfides in oil increases, the winding corrosion intensifies, leading to an increase in partial discharge, a widening of the partial discharge phase, and a reduction in the initial discharge voltage. In Reference [10], the influence of oscillating surge voltages on the partial discharge of interturn insulation was studied. It was observed that the number of partial discharges increases with increases in applied voltages, and partial discharges predominantly occur at the peak of the oscillating voltage. In Reference [11], the influence of interturn insulation on temperature distribution was analyzed. It was found that the interturn insulation results in a stepped edge profile of the wire cake, which in turn alters its fluid and temperature distribution. In Reference [12], the effect of the preloading force on the thermal aging performance of oil paper insulation for a transformer was investigated, and it was found that the preloading force can slow down the aging of a transformer. At the same aging time, as the pre-tension increases, the trend of increasing the amorphous region of cellulose slows down, and the phenomenon of cellulose fracture in the structure weakens. In Reference [13], the influence of different aging factors on the thermal aging performance of insulation pads for a transformer was researched. After accelerated thermal aging at 135 °C for 336 h, the modulus of elasticity of the insulation pad under a 0 N preload decreased to 79.935% of that of the new pad. It was found that mechanical aging and high temperatures accelerate the failure of the insulation medium, which further verifies that the preload can slow down the aging of the insulating pad for a transformer.
In summary, the existing research mainly focuses on the influence of different voltage forms and factors on the partial discharge characteristics of interturn insulation in transformers. Moreover, there is a lack of research on the effect of preload stress on the partial discharge characteristics of interturn insulation under actual working conditions. The discharge characteristics and influence mechanism of interturn insulation under preload stress are unclear and further research is needed to make the research results closer to actual working conditions. Therefore, based on the actual operating conditions of interturn insulation in a 750 kV transformer, a partial discharge test platform under preload stress and electrical stress is designed. Then, the statistical parameters of partial discharge and the microstructure of the insulation paper are investigated. Combined with the method of finite element simulation, the influence mechanism of pre-compression stress and electrical stress on interturn insulation is elucidated. The research results have certain reference and practical application value for the aging of insulation pad paper and transformer design.

2. Experimental Methods

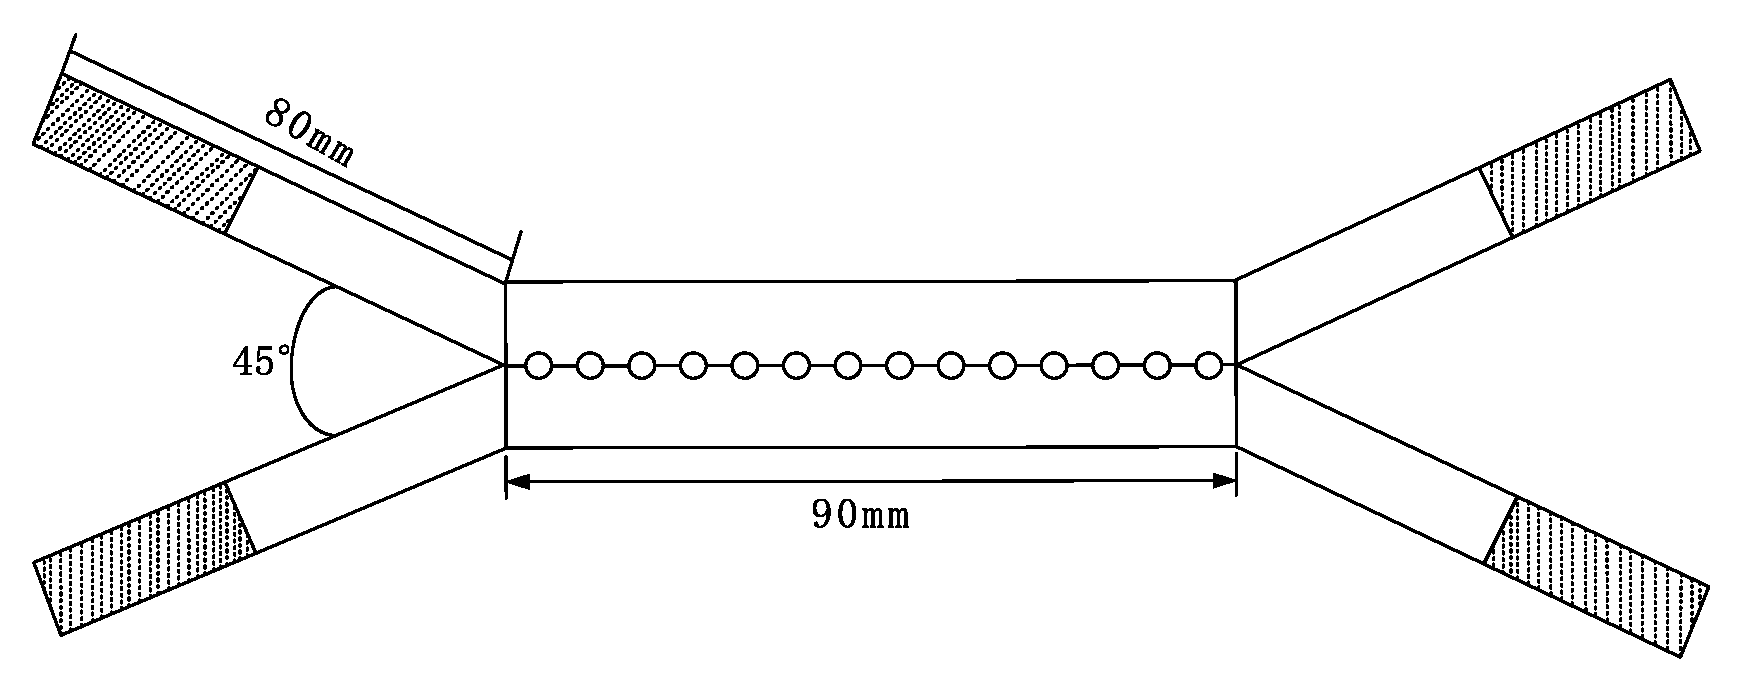
2.1. Experimental Platform

To simulate the combined effects of pre-compression stress and electrical stress on the partial discharge characteristics of the interturn insulation in 750 kV transformers, the interturn insulation testing model and partial discharge experimental platform were constructed, as shown in Figure 1a,c. The test model mainly consists of a pre-tensioning force application device, oil tank and interturn insulation. The pre-tightening force application device consists of the epoxy resin plate, epoxy screws, nuts, and a base, as shown in Figure 1a. By adjusting the position of the nuts, different pre-compression forces are applied to interturn insulation. Then, the pressure sensor is removed and the distance between the upper and lower epoxy resin plates is unchanged. In Figure 1a, one end of the interturn insulation model is connected to the high-voltage supply, and the other end is grounded. In Figure 1c, the partial discharge experimental platform mainly consists of an AC power supply, a current limiting resistor, voltage divider, coupling capacitor, interturn insulation testing model, and partial discharge instrument. The AC power supply was provided by Yangzhou Yude Electric Co., Ltd. of China, with a voltage of 50 kV and a capacity of 5 kVA. The partial discharge instrument (TWPD-2E-4CH) was provided by Baoding Tianwei Xinyu Technology Development Co., Ltd. of China, with a sampling rate of 80 MHz. Before the experiment, a background noise test was conducted.

2.2. Experimental Materials

The selected experimental materials for conducting partial discharge experiments under the synergistic effect of pre-tension and electrical stress are shown in Table 1.

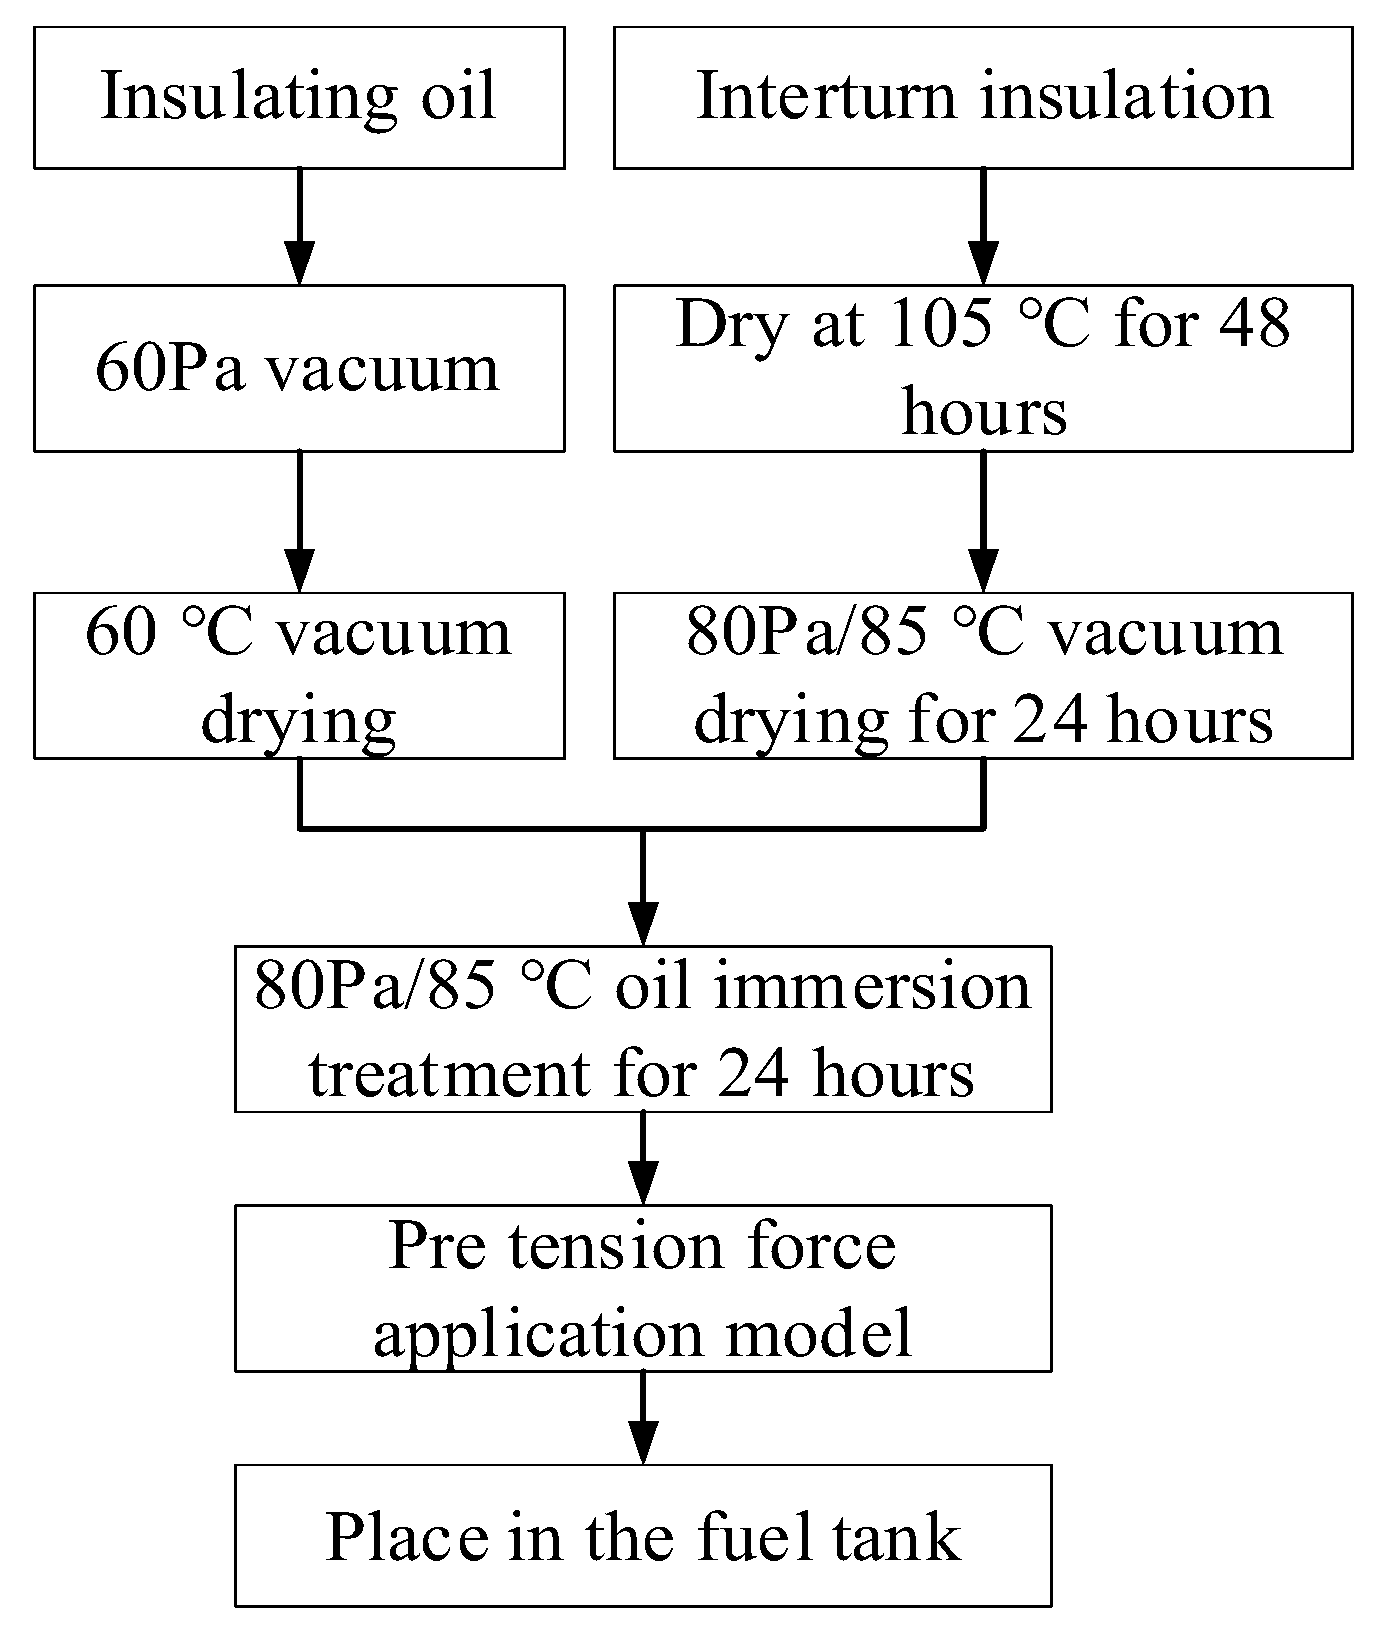
2.3. Experimental Preprocessing

To ensure the accuracy of the experiment, it is necessary to preprocess the interturn insulation model and transformer oil before partial discharge tests. The preprocessing process is shown in Figure 2 Among them, different pre-tightening forces are applied to the interturn insulation, which are divided into 5 groups: 0 N, 500 N, 1000 N, 1500 N, and 2000 N, respectively (pre-tightening pressure 2.5 MPa).

2.4. Pressurization Method

Based on relevant standards [14], the step boosting method is adopted and the corresponding pressurization method is shown in Table 2.

2.5. Post-Experimental Processing

Upon completion of the experiments, the samples were analyzed on an optical microscope, scanning electron microscope, Fourier infrared spectral analyzer, X-ray diffraction analyzer, and energy dispersive spectrometer, and combined with finite element simulations.
The breakdown sections of 5 groups (preload of 0 N, 500 N, 1000 N, 1500 N, 2000 N) were cut and put into an optical microscope and scanning electron microscope for microscopic morphology analysis to observe the carbonization traces and fiber bifurcation degree.
To set up a control group, the unexperimented samples were cropped. The cropped samples from 4 groups (unexperimented, 0 N, 1000 N, 2000 N) of experiments were taken and analyzed by infrared spectroscopy, X-ray diffraction, and energy dispersive spectroscopy. The deterioration of insulating paper under electrical stress, the preload, and the degree of damage to the insulating paper were observed.

3. Experimental Result

3.1. Statistical Parameters of Partial Discharge for Interturn Insulation under Preload and Electrical Stress

The experiment focused on partial discharge for interturn insulation under the synergic action of preload and electrical stress was carried out. The obtained initial voltage and breakdown voltage of partial discharge, maximum discharge quantity, discharge times, and single-cycle discharge times are shown in Figure 3.
It can be seen from Figure 3a that the initial voltage and breakdown voltage of partial discharge show a trend of first decreasing and then increasing with the increase in preload force. Moreover, there is a turning point at 1000 N, and the overall trend slightly decreases.
It can be seen from Figure 3b that the maximum discharge quantity, discharge times, and single-cycle discharge times show a trend of first increasing and then decreasing with the increase in applied voltage. According to this variation pattern, the discharge stage is divided into three stages: early discharge (I), stable discharge (II), and late discharge (III). In the first stage of discharge, the maximum discharge quantity, discharge times, and single-cycle discharge times increase with the increase in applied voltage, and the rate of increase is fast. As the preload force increases, the maximum discharge quantity increases. The larger the preload force, the faster the increase rate. However, discharge times and single-cycle discharge times do not change much at this stage.
In the second stage of discharge, the maximum discharge quantity, discharge times, and single-cycle discharge times show an overall increasing trend with the increase in applied voltage, gradually increasing and slowing down. As the preloading force increases, the maximum discharge quantity shows a trend of first decreasing and then increasing, while discharge times and single-cycle discharge times present the opposite trend at this stage. When the applied preload force is higher than 1000 N, the discharge times are slightly lower than the result without preloading force applied. In the third stage of discharge, the maximum discharge quantity, discharge times, and single-cycle discharge times slightly decrease as the applied voltage increases. As the preloading force increases, the maximum discharge quantity shows a trend of first decreasing and then increasing, while discharge times and single-cycle discharge times do not change significantly at this stage. When the applied preload force is higher than 1000 N, the discharge times are slightly lower than the result without preloading force applied.
In summary, there is a turning point in the influence of preloading force on the partial discharge parameters of interturn insulation for a transformer. In other words, there is a turning point at 1000 N. This is inconsistent with the conclusion of the literature [12,13,15] that preload can slow down the degradation of insulation pads in a transformer. It may be that preload causes deformation of the holes and air gaps between the insulation paper layers and in the insulation paper. As a result, the moisture content and partial discharge area of the defect are changed, and the partial discharge characteristics are further altered.

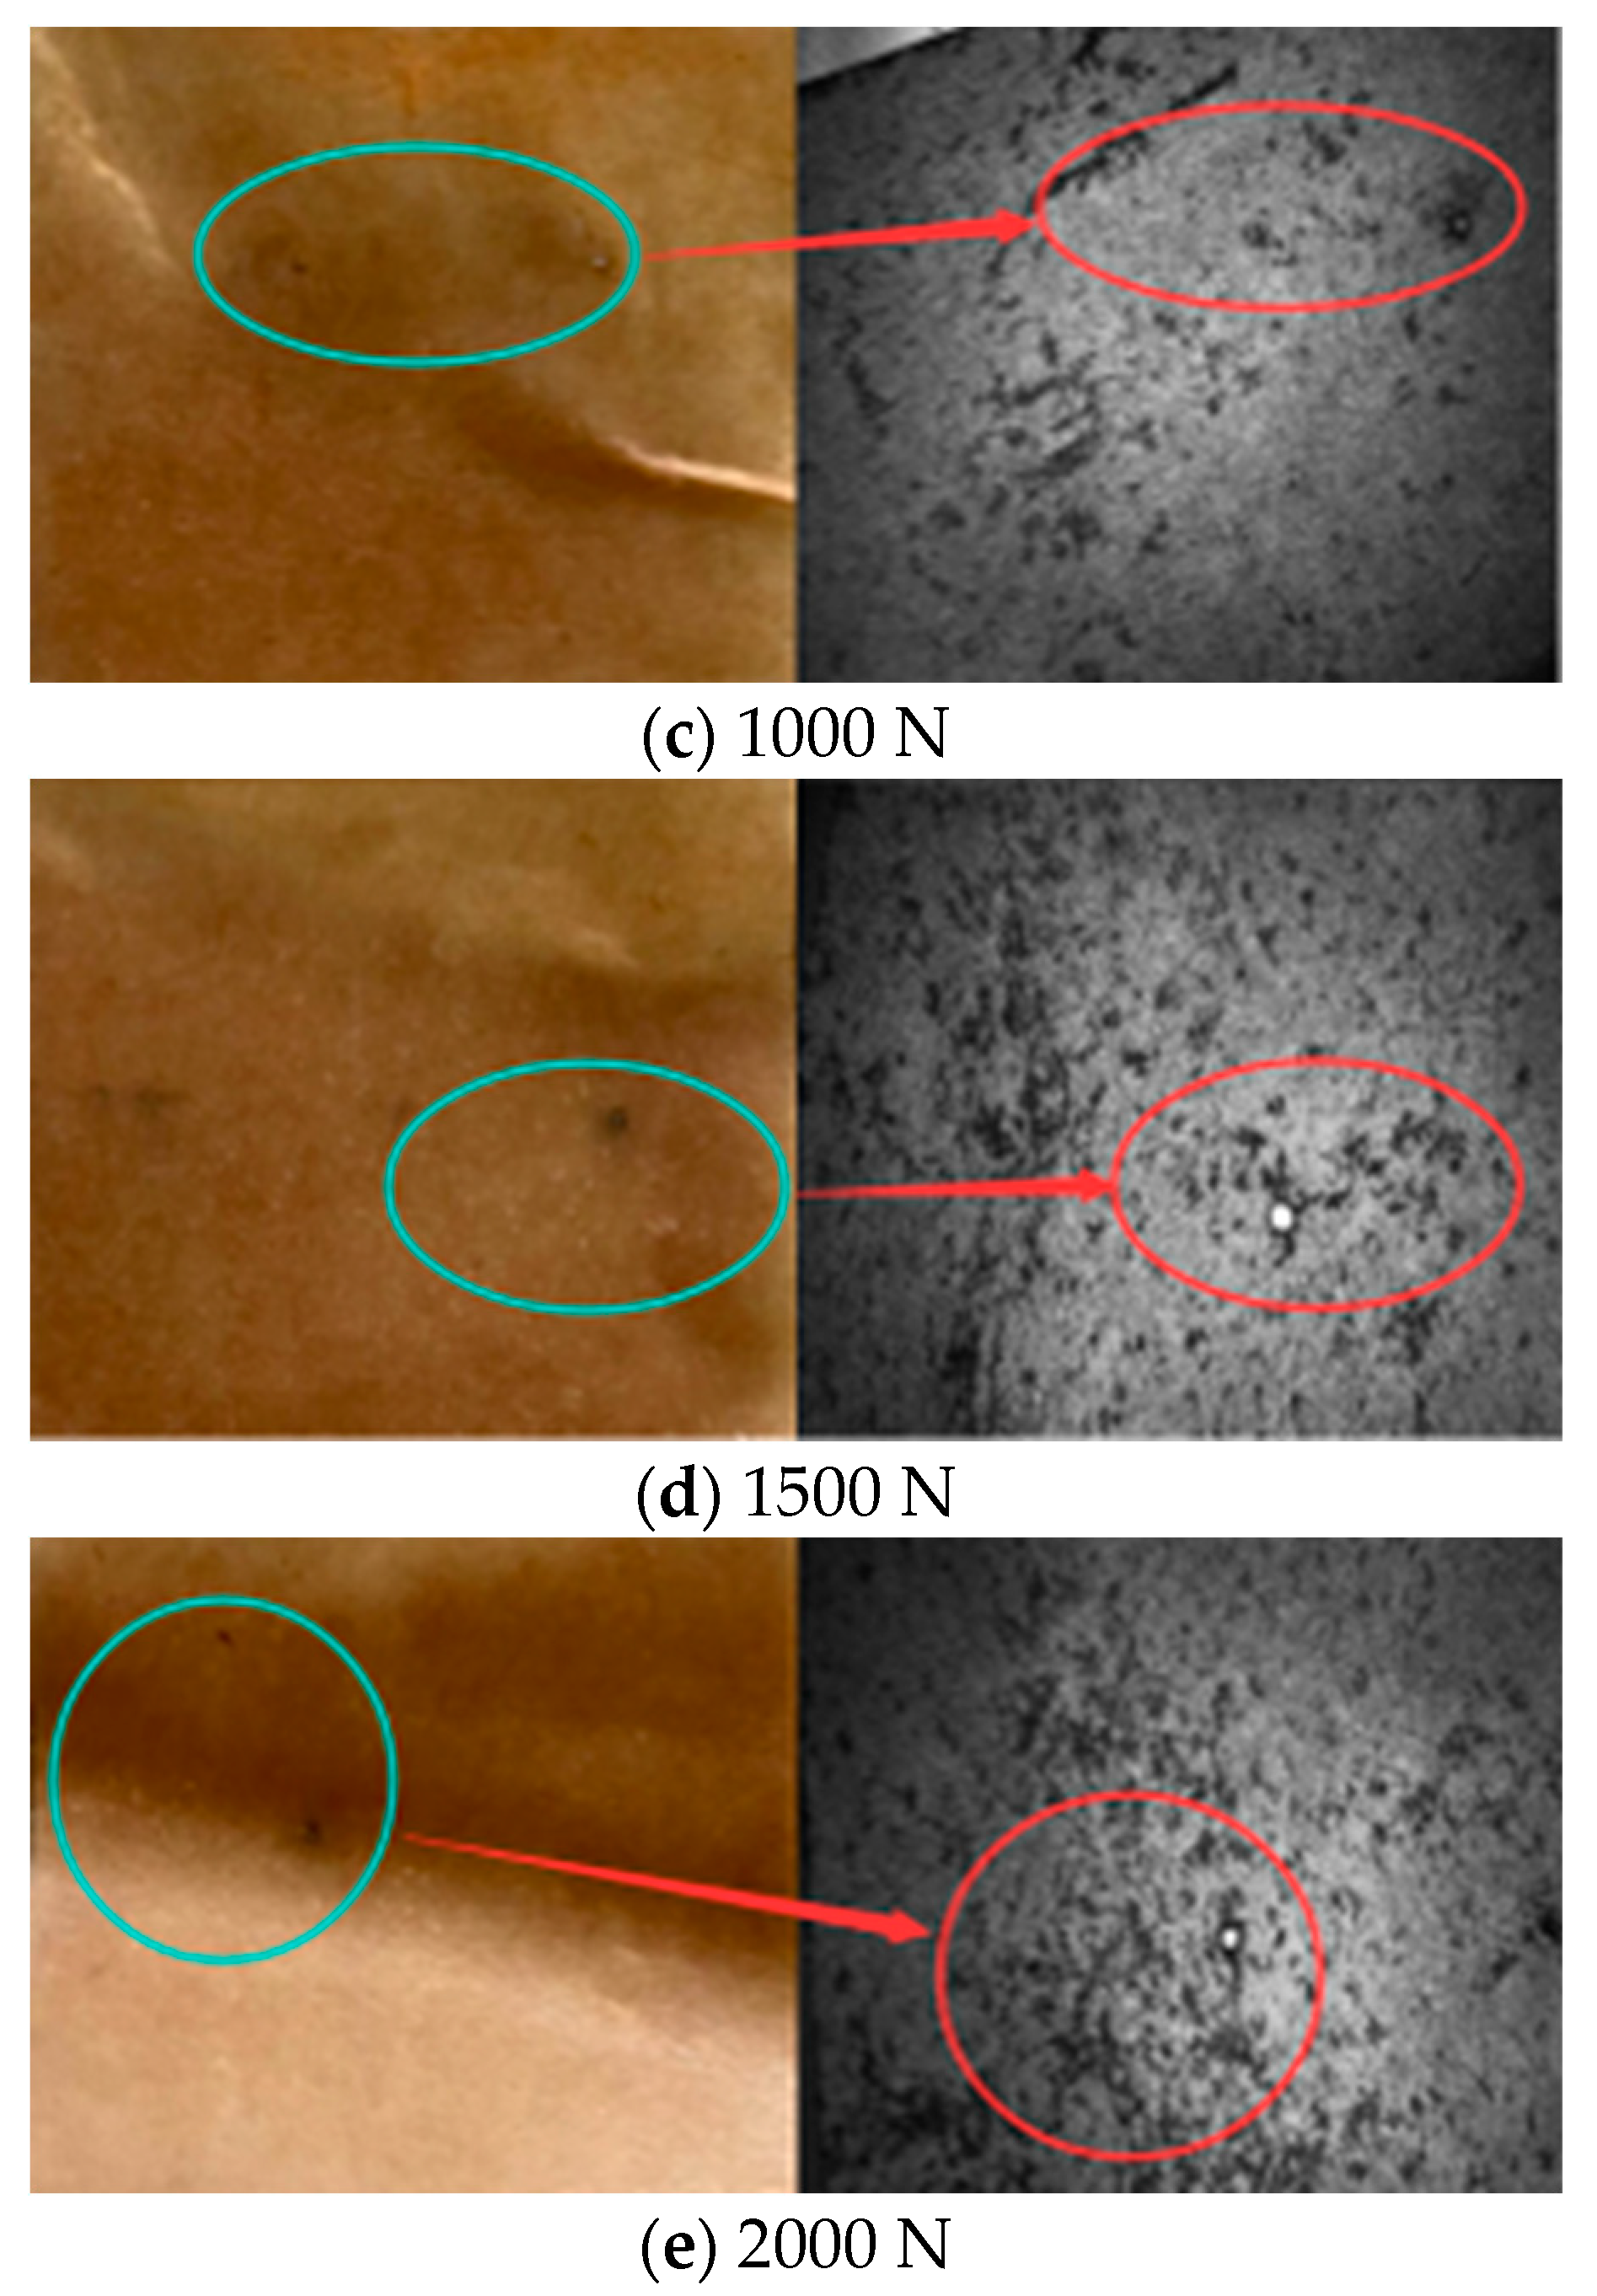
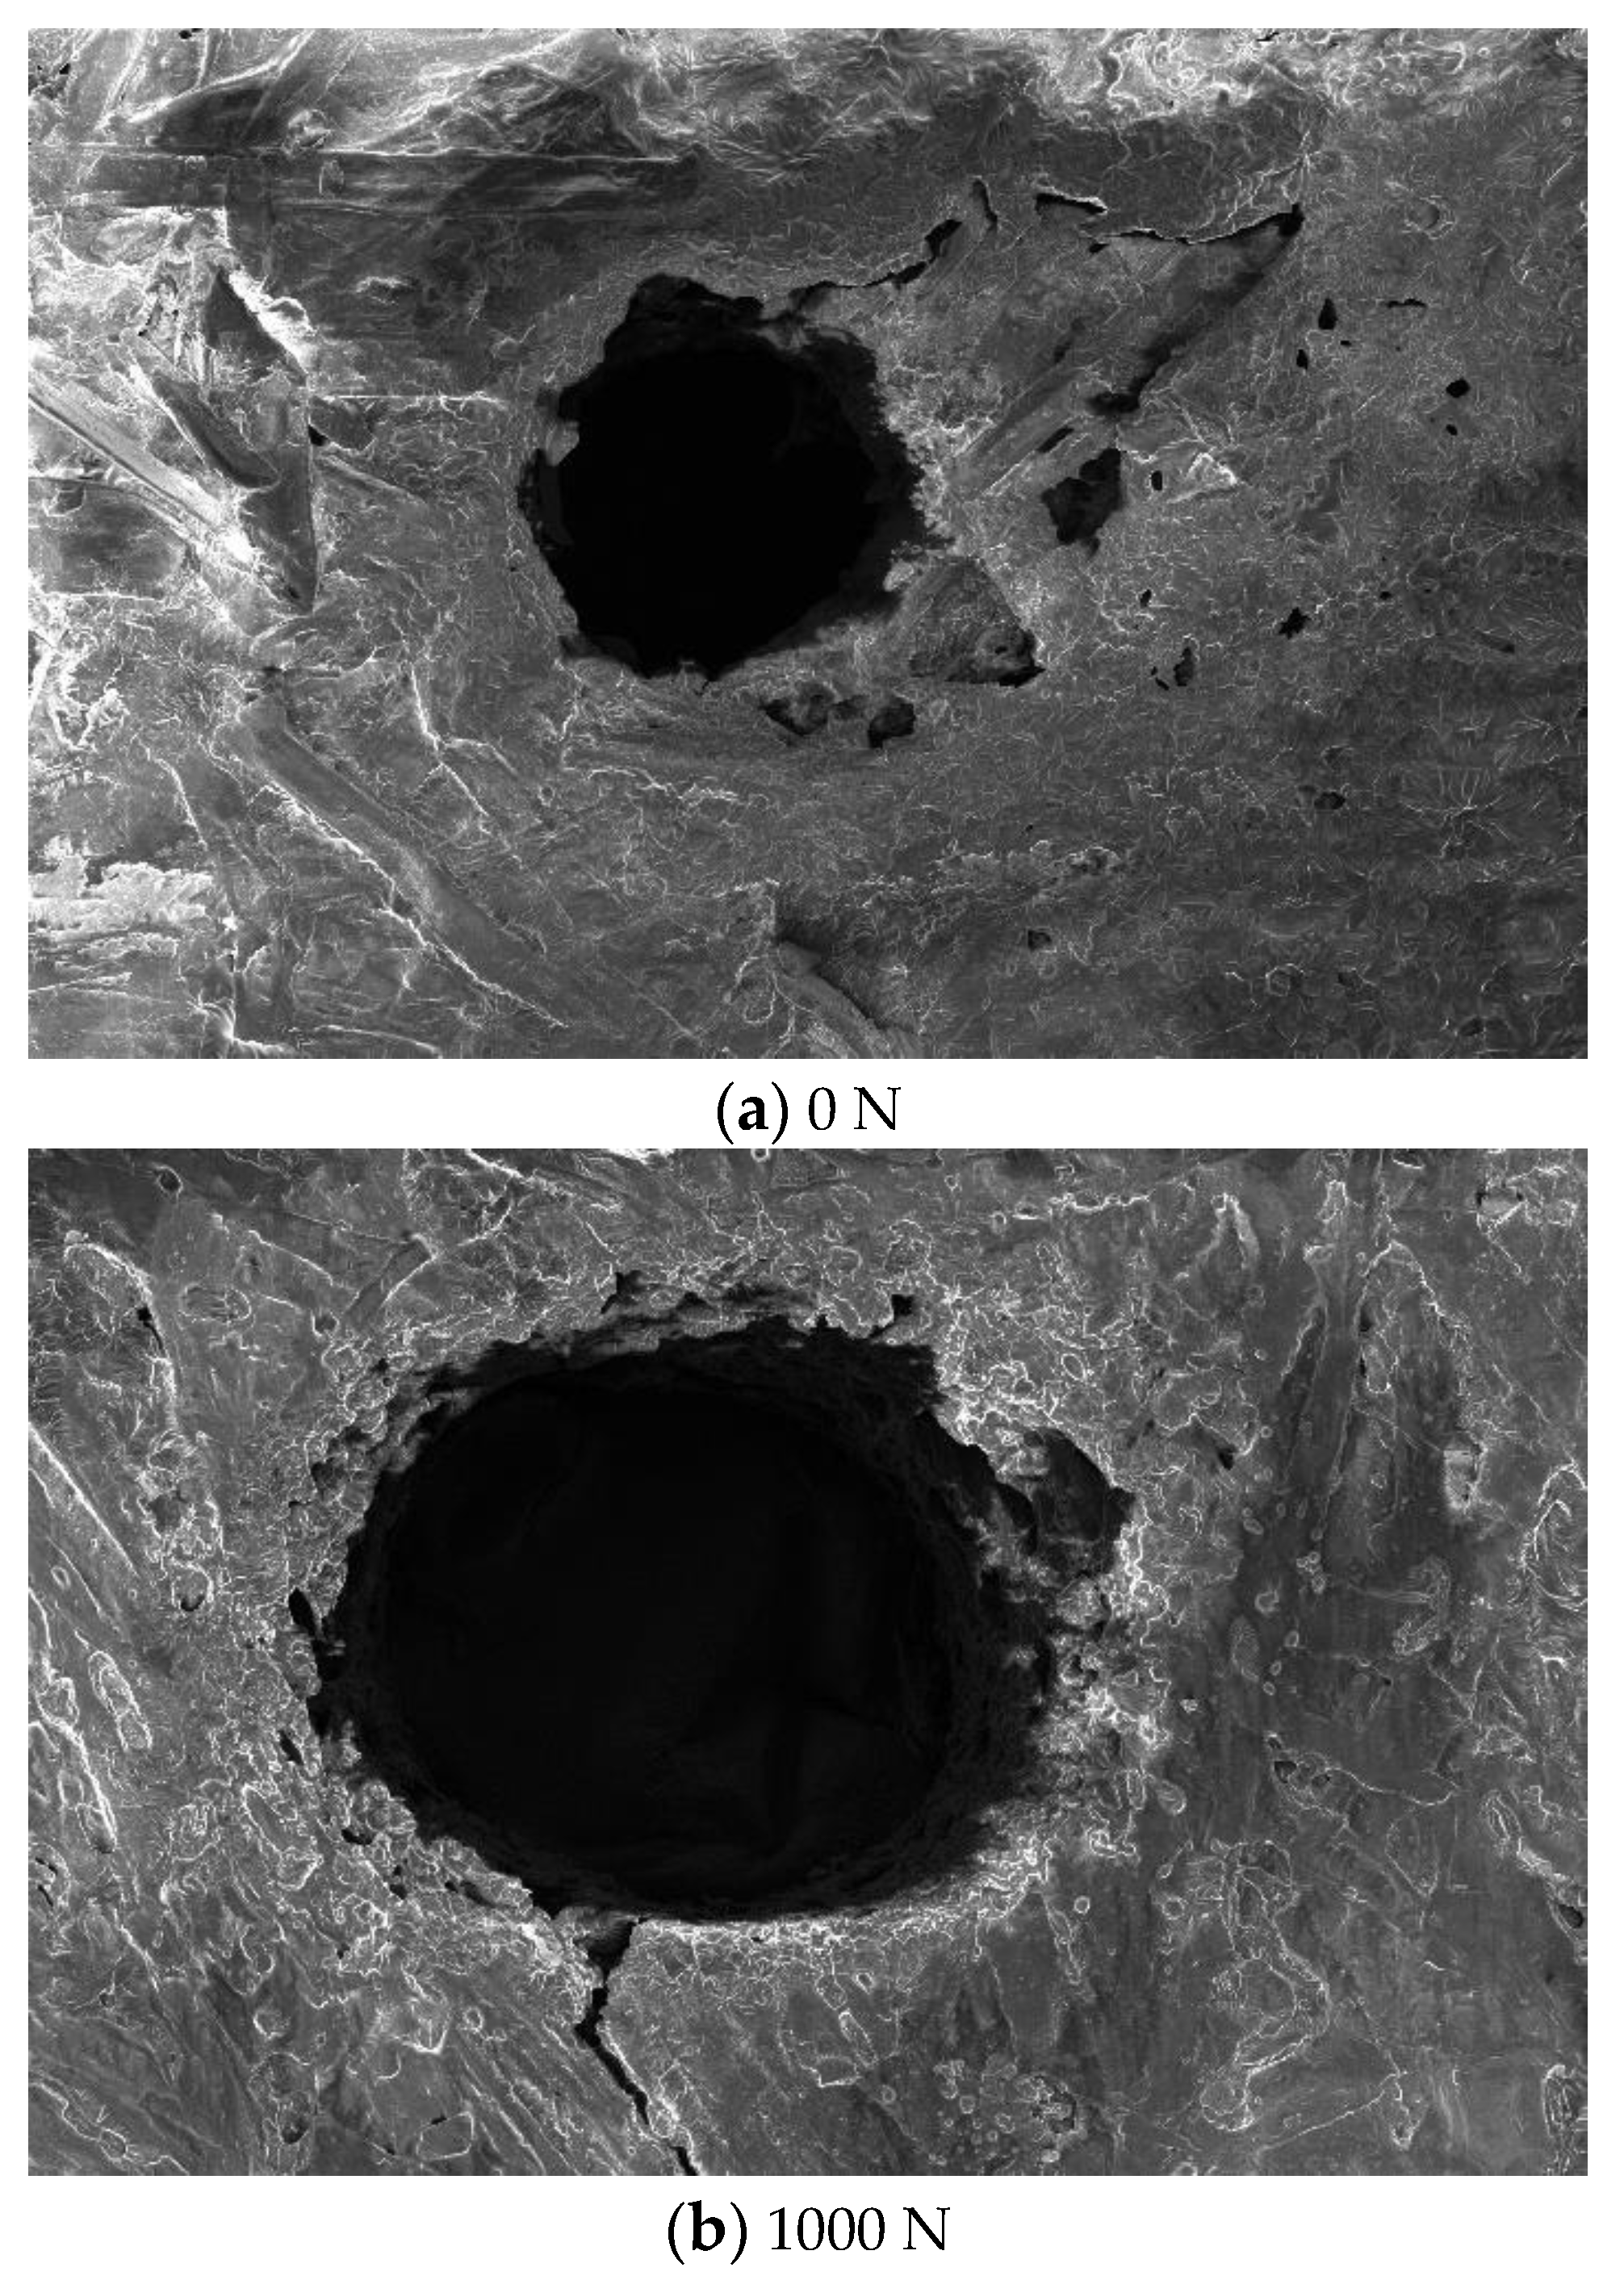
3.2. Changes in Microstructure of Interturn Insulation Paper after Breakdown

3.2.1. Microscopic Morphology Analysis

The experiment focused on partial discharge for interturn insulation under the synergic action of preload and electrical stress was carried out. The obtained optical microscope (OM) photos and scanning electron microscopy (SEM) are shown in Figure 4 and Figure 5.
It can be observed that there are obvious carbonization marks and breakdown holes on the interturn insulation paper without preloading force applied. After applying pre-tightening force, there are no obvious carbonization marks, only breakdown holes appear. The breakdown holes show a trend of first decreasing and then increasing with the increase in pre-tightening force, with a turning point at 1000 N. In addition, the majority of the breakdown points of interturn insulation occur at the joints after the insulation paper is stacked and wound.

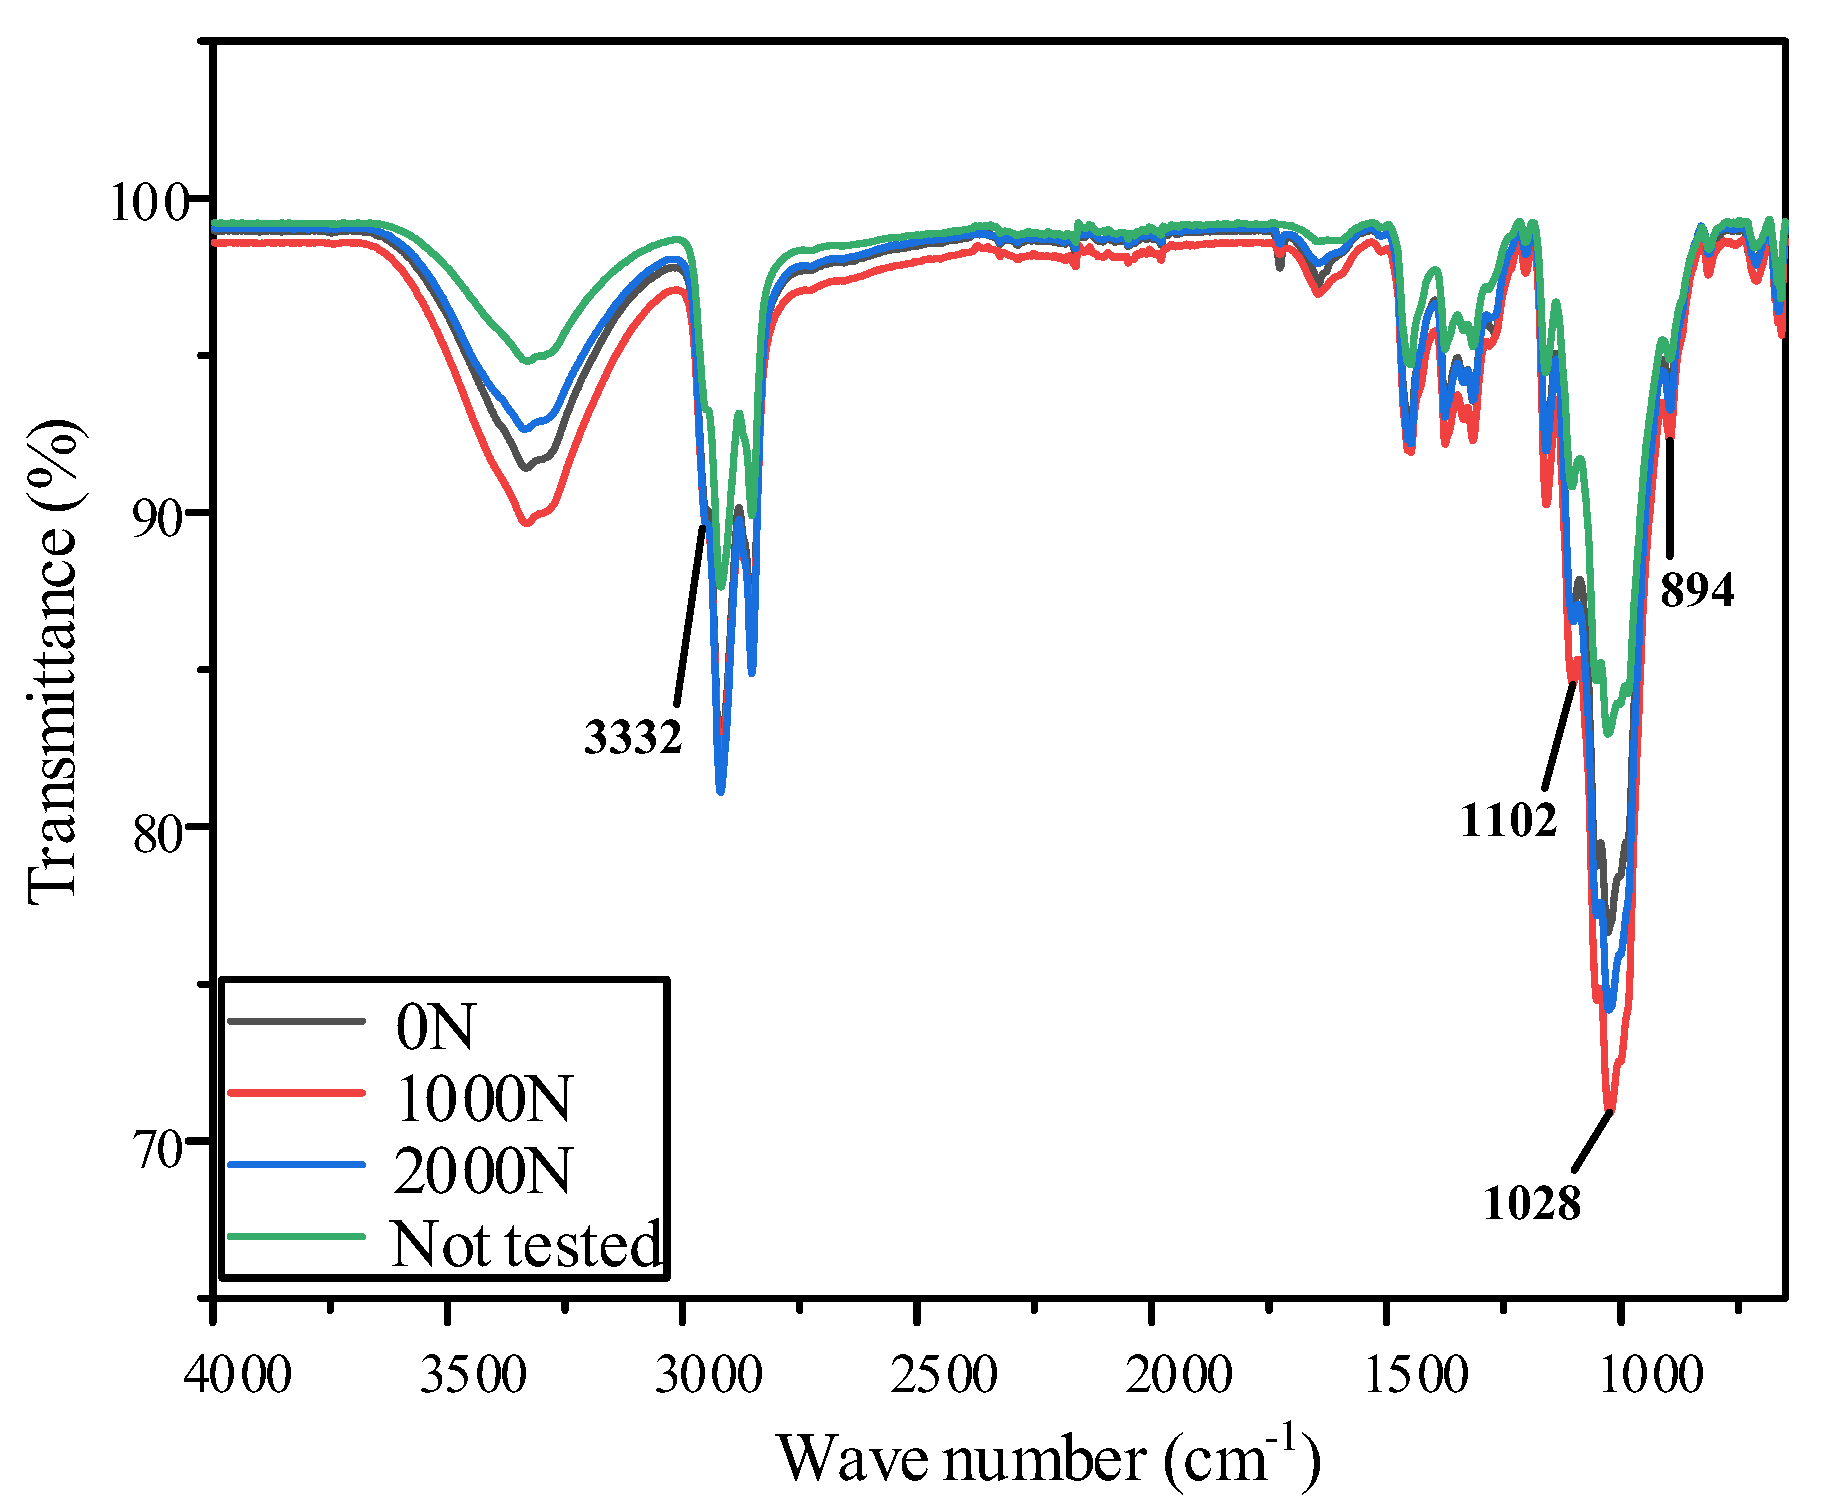
3.2.2. Fourier Transform Infrared (FTIR) Spectroscopy Analysis

The experiment focused on partial discharge for interturn insulation under the synergic action of preload and electrical stress was carried out. The obtained infrared spectra of insulation paper with 0 N, 1000 N, and 2000 N after breakdown are illustrated in Figure 6. According to Reference [16], the main absorption peaks of the insulating paper are attributed as listed in Table 3.
It can be seen that the peak shapes and positions of the interturn insulation paper are essentially the same under different pre-tension forces. Only the peaks of transmittance are different and no new characteristic absorption peaks appear. The transmittance of the insulation paper at 1102 cm−1 (glycosidic bond) shows a trend of first decreasing and then increasing with the increase in preload force, and there is a turning point at 1000 N.
The characteristic peak at 1102 cm−1 corresponds to the stretching vibration of C-O-C bonds in cellulose molecules, including glycosidic bonds. When the applied preload force is 1000 N, the transmittance on insulation paper is 84.5%, while the transmittance of samples not tested, without pre-tightening force, and with 2000 N are 90.8%, 86.6%, and 86.5%, respectively. Since transmittance is inversely proportional to absorbance [17,18], it indicates that the absorption intensity of insulation paper with 1000 N is highest. This is the reason that the glycosidic bonds in cellulose break under the pre-tension and electrical stress, the number decreases, and the molecular chains of the insulation paper break. However, the degree of damage on the insulation paper at 1000 N is relatively small, further verifying the conclusions in Figure 3a,b, Figure 4, and Figure 5. In addition, at 1102 cm−1, the difference in transmittance between no stress and electrical stress is 4.2%, while the difference between 0 N, 1000 N, and 2000 N is 2.1% and 0.1%, respectively. These results indicate that the breakage of the glucoside bond in cellulose is mainly caused by electrical stress at 1102 cm−1.
At 3332 cm−1 (hydroxyl groups) and 1028 cm−1 (hydroxyl groups on glucose), the transmittance of the insulating paper shows a trend of first decreasing and then increasing with the increase in preload, and there is a turning point at 1000 N. The transmittance of samples with 1000 N at 3332 cm−1 is 89.6%, while the transmittance values for samples not tested, at 0 N, and 2000 N are 94.8%, 91.4%, and 92.6%, respectively. At 1028 cm−1, the transmittance on insulation paper with 1000 N is 71%, while the transmittance for samples not tested, at 0 N, and 2000 N are 82.9%, 76.6%, and 74.2%, respectively. This indicates that the absorption intensity of the insulating paper is highest at 1000 N, and the characteristic peak at 3332 cm−1 is formed by the stretching vibration of O-H. It is mainly formed by three free hydroxyl groups on the glucose monomer and nearby oxygen atoms with high electronegativity. At 1028 cm−1, the characteristic peak corresponds to the bending vibration of two secondary alcohol hydroxyl groups O-H on the glucose monomer.
At 1028 cm−1 and 3332 cm−1, the weakening of the absorption peak intensity indicates that the hydrogen bonds between the cellulose molecules in insulating paper are broken due to the synergistic effect of pre-tension and electrical stress. As a result, the number of hydrogen bonds decreases, H+ increases, the interchain force of cellulose is weakened, the crystalline region is destroyed, and the mechanical properties of cellulose are decreased. Moreover, the difference in transmittance between no stress and electrical stress at 3332 cm−1 is 3.4%, while the difference between 0 N, 1000 N, and 2000 N is 1.8% and 1.2%, respectively. At 1028 cm−1, the difference in transmittance between no stress and electrical stress is 6.3%, while the difference between 0 N, 1000 N, and 2000 N is 5.6% and 2.4%, respectively. These results indicate that the breaking of hydrogen bonds between cellulose molecules is mainly caused by electrical stress at 1028 cm−1 and 3332 cm−1.
At 894 cm−1, the characteristic peak corresponds to the glycosidic bond vibration between glucose units. When the applied preload force is 1000 N, the transmittance of the characteristic peak on insulation paper is 92.4%, while the transmittance of samples not tested, with 0 N, and with 2000 N are 94.9%, 93.9%, and 93.2%, respectively. This indicates that the absorption strength of samples with 1000 N is highest. The reason is that the glycosidic bonds in cellulose break under the synergistic effect of pre-tension and electrical stress, resulting in a decrease in the quantity of glycosidic bonds. In addition, the difference in transmittance between no stress and electrical stress is 1%, while the difference between 0 N, 1000 N, and 2000 N is 1.5% and 0.8%, respectively. These results indicate that the breaking of glycosidic bonds in fibroin at 894 cm−1 is mainly caused by the pre-tension effect.
In summary, the hydroxyl and glycosidic bonds of cellulose molecules break under the synergistic effect of pre-tension and electrical stress. At the same time, chain alkanes such as CH2, H+, and OH-, and small molecule free radicals, are generated. These chain alkanes and small free radicals undergo chemical reactions to generate H2O, CO2, and H2, further exacerbating the aging of insulation paper and causing the changes in the molecular structure of cellulose. As a result, fiber breakage, thinning, and bubble generation begin to occur, and the mechanical properties of insulation paper decrease, as shown in Figure 3a,b, Figure 4, and Figure 5 in Section 3.1.

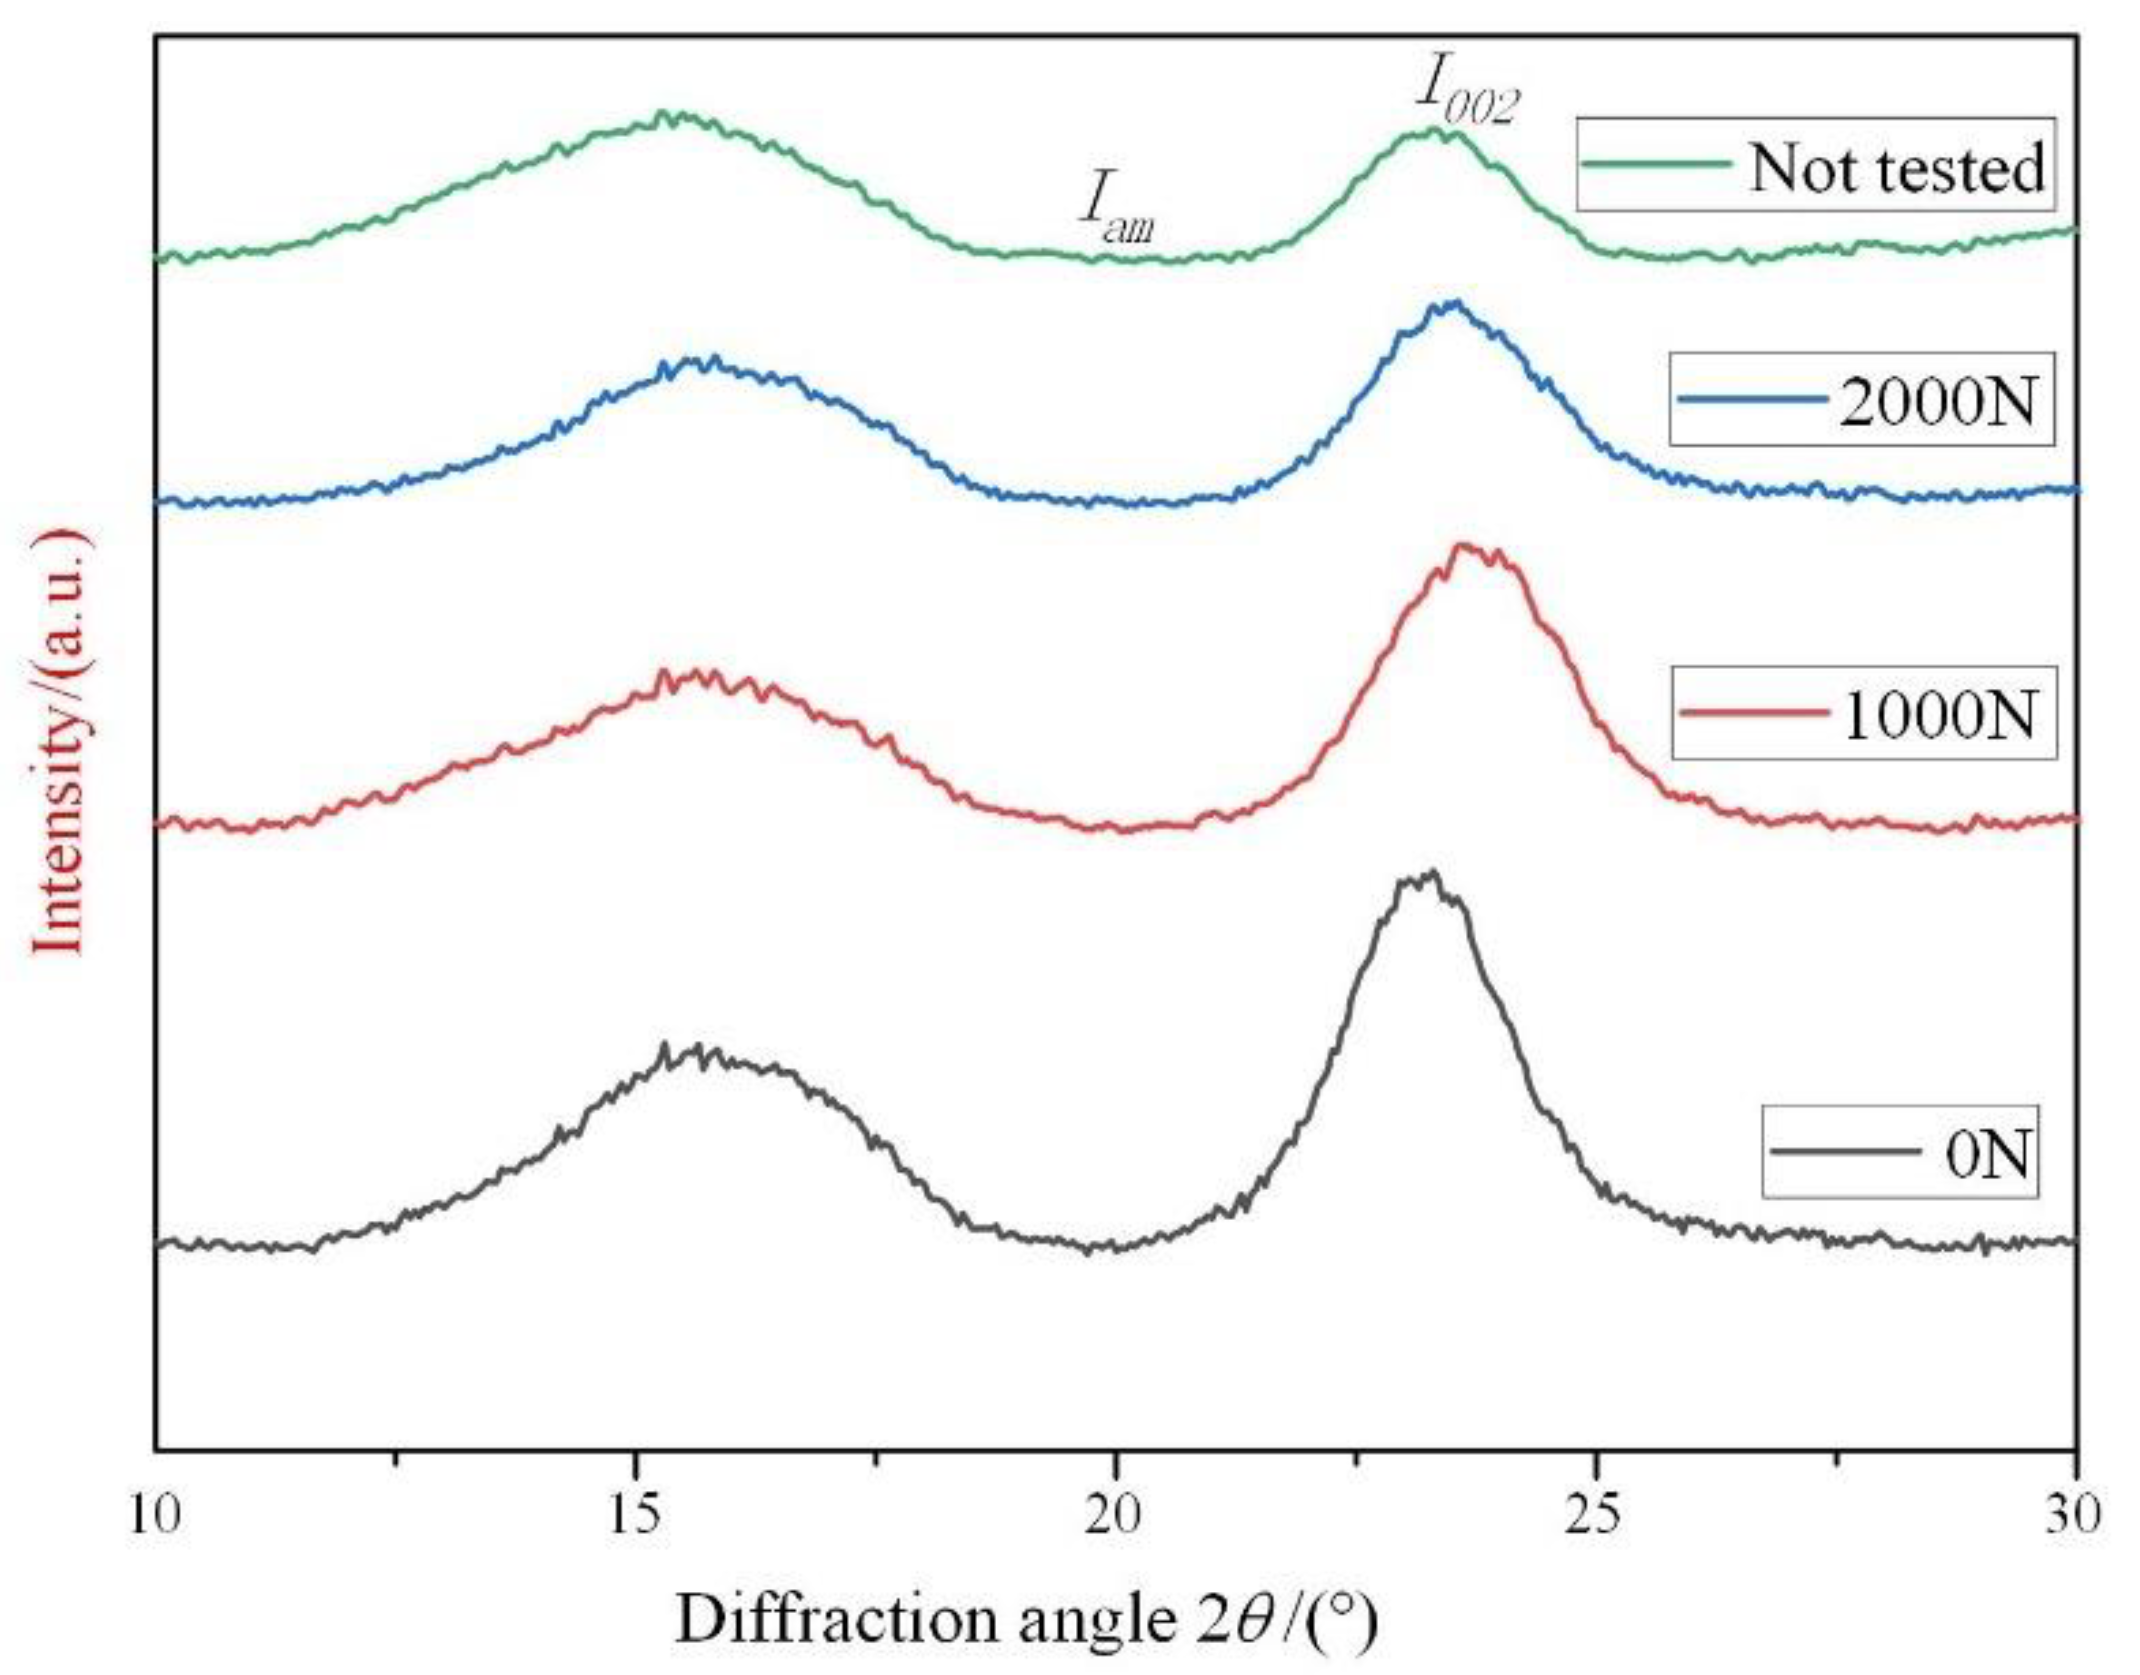
3.2.3. X-ray Diffraction (XRD) Analysis

The experiment focused on partial discharge for interturn insulation under the synergic action of preload and electrical stress was carried out. After partial discharge, the samples not tested, with 0 N, 1000 N, and 2000 N were selected to conduct aggregate state analysis. The obtained XRD spectra of the insulation paper and diffraction parameters are shown in Figure 7 and Table 4.
It can be observed that the diffraction peaks of the insulation paper are mainly concentrated at around 23°. Under the same aging condition, the diffraction peak positions and peak shape characteristics of the insulation paper under different preloading forces remain basically unchanged. Only diffraction peak intensity and half width change, and the crystal type of the insulation paper remains unchanged. With the increase in preload force, the diffraction peak value shows an upward and then downward trend, and the crystallinity shows the same trend, with a turning point at 1000 N.
In Table 4, Iam is the diffraction intensity of the amorphous region. I002 is the intensity of diffraction peaks on the crystal plane of cellulose 002. 2θ002 represents the position of the diffraction peak. FWHM002 represents the half width. Dhkl is the microcrystalline size of insulating paper cellulose and is determined by Formula (1). CrI is the relative crystallinity of insulating paper and is determined by Formula (2).
D h k l = K λ / ( F W H M 002 × cos θ )
C r I = [ ( I 002 I a m ) / I 002 ] × 100 %
where K is the shape factor of microcrystals and is usually taken as 0.94. λ is the wave number of the incident wave and is taken as 1.5416 × 10⁻¹⁰ m (Cu target). θ is the threshold angle.
After applying a preload force with 0 N, 1000 N, and 2000 N, FWHM002 increases from 0.0331 rad to 0.0389 rad, and then decreases to 0.0387 rad. Moreover, the relative crystallinities of the samples not tested, 0 N, 1000 N, and 2000 N are 98.34%, 99.25%, 99.34%, and 99.24%, respectively, with little change. It means that the insulating paper is always composed of crystalline with high crystallinity and amorphous regions in the process of partial discharge. The degradation rate in the amorphous region is greater than that in the crystalline region. One reason is that the probability of molecules or atoms in the amorphous region becoming free radicals is high under electrical stress. Another reason is that the entry of water and oxygen also accelerates the degradation of the amorphous region. In addition, it is observed that the grain size decreases from 44.700 nm to 38.056 nm and then increases to 38.250 nm as the preloading force increases, while the width of the diffraction peak first widens and then narrows. It can be inferred that the geometric shape (i.e., lattice) of the atoms in cellulose undergoes dislocation or distortion under the preloading force, leading to the decrease in grain size. It means that the cellulose crystal zone of the insulating paper under preload stress is constantly damaged, and the grain size reaches the minimum at 1000 N, where an inflection point occurs. In summary, the width of the diffraction peak with the increase in preload first widens and then narrows, the crystallinity decreases, and the grain size first decreases and then increases. The results show that the preload reduces the microcrystalline size of the insulating paper and accelerates the movement of the molecular chain in the crystallization zone. However, the effect of electrical stress changes the molecular structure of the insulating paper, accelerating the movement of the molecular chain in the non-crystalline zone. As a result, the cracking and deterioration rate of insulating paper is accelerated, which is consistent with the conclusion in Section 3.2.1.

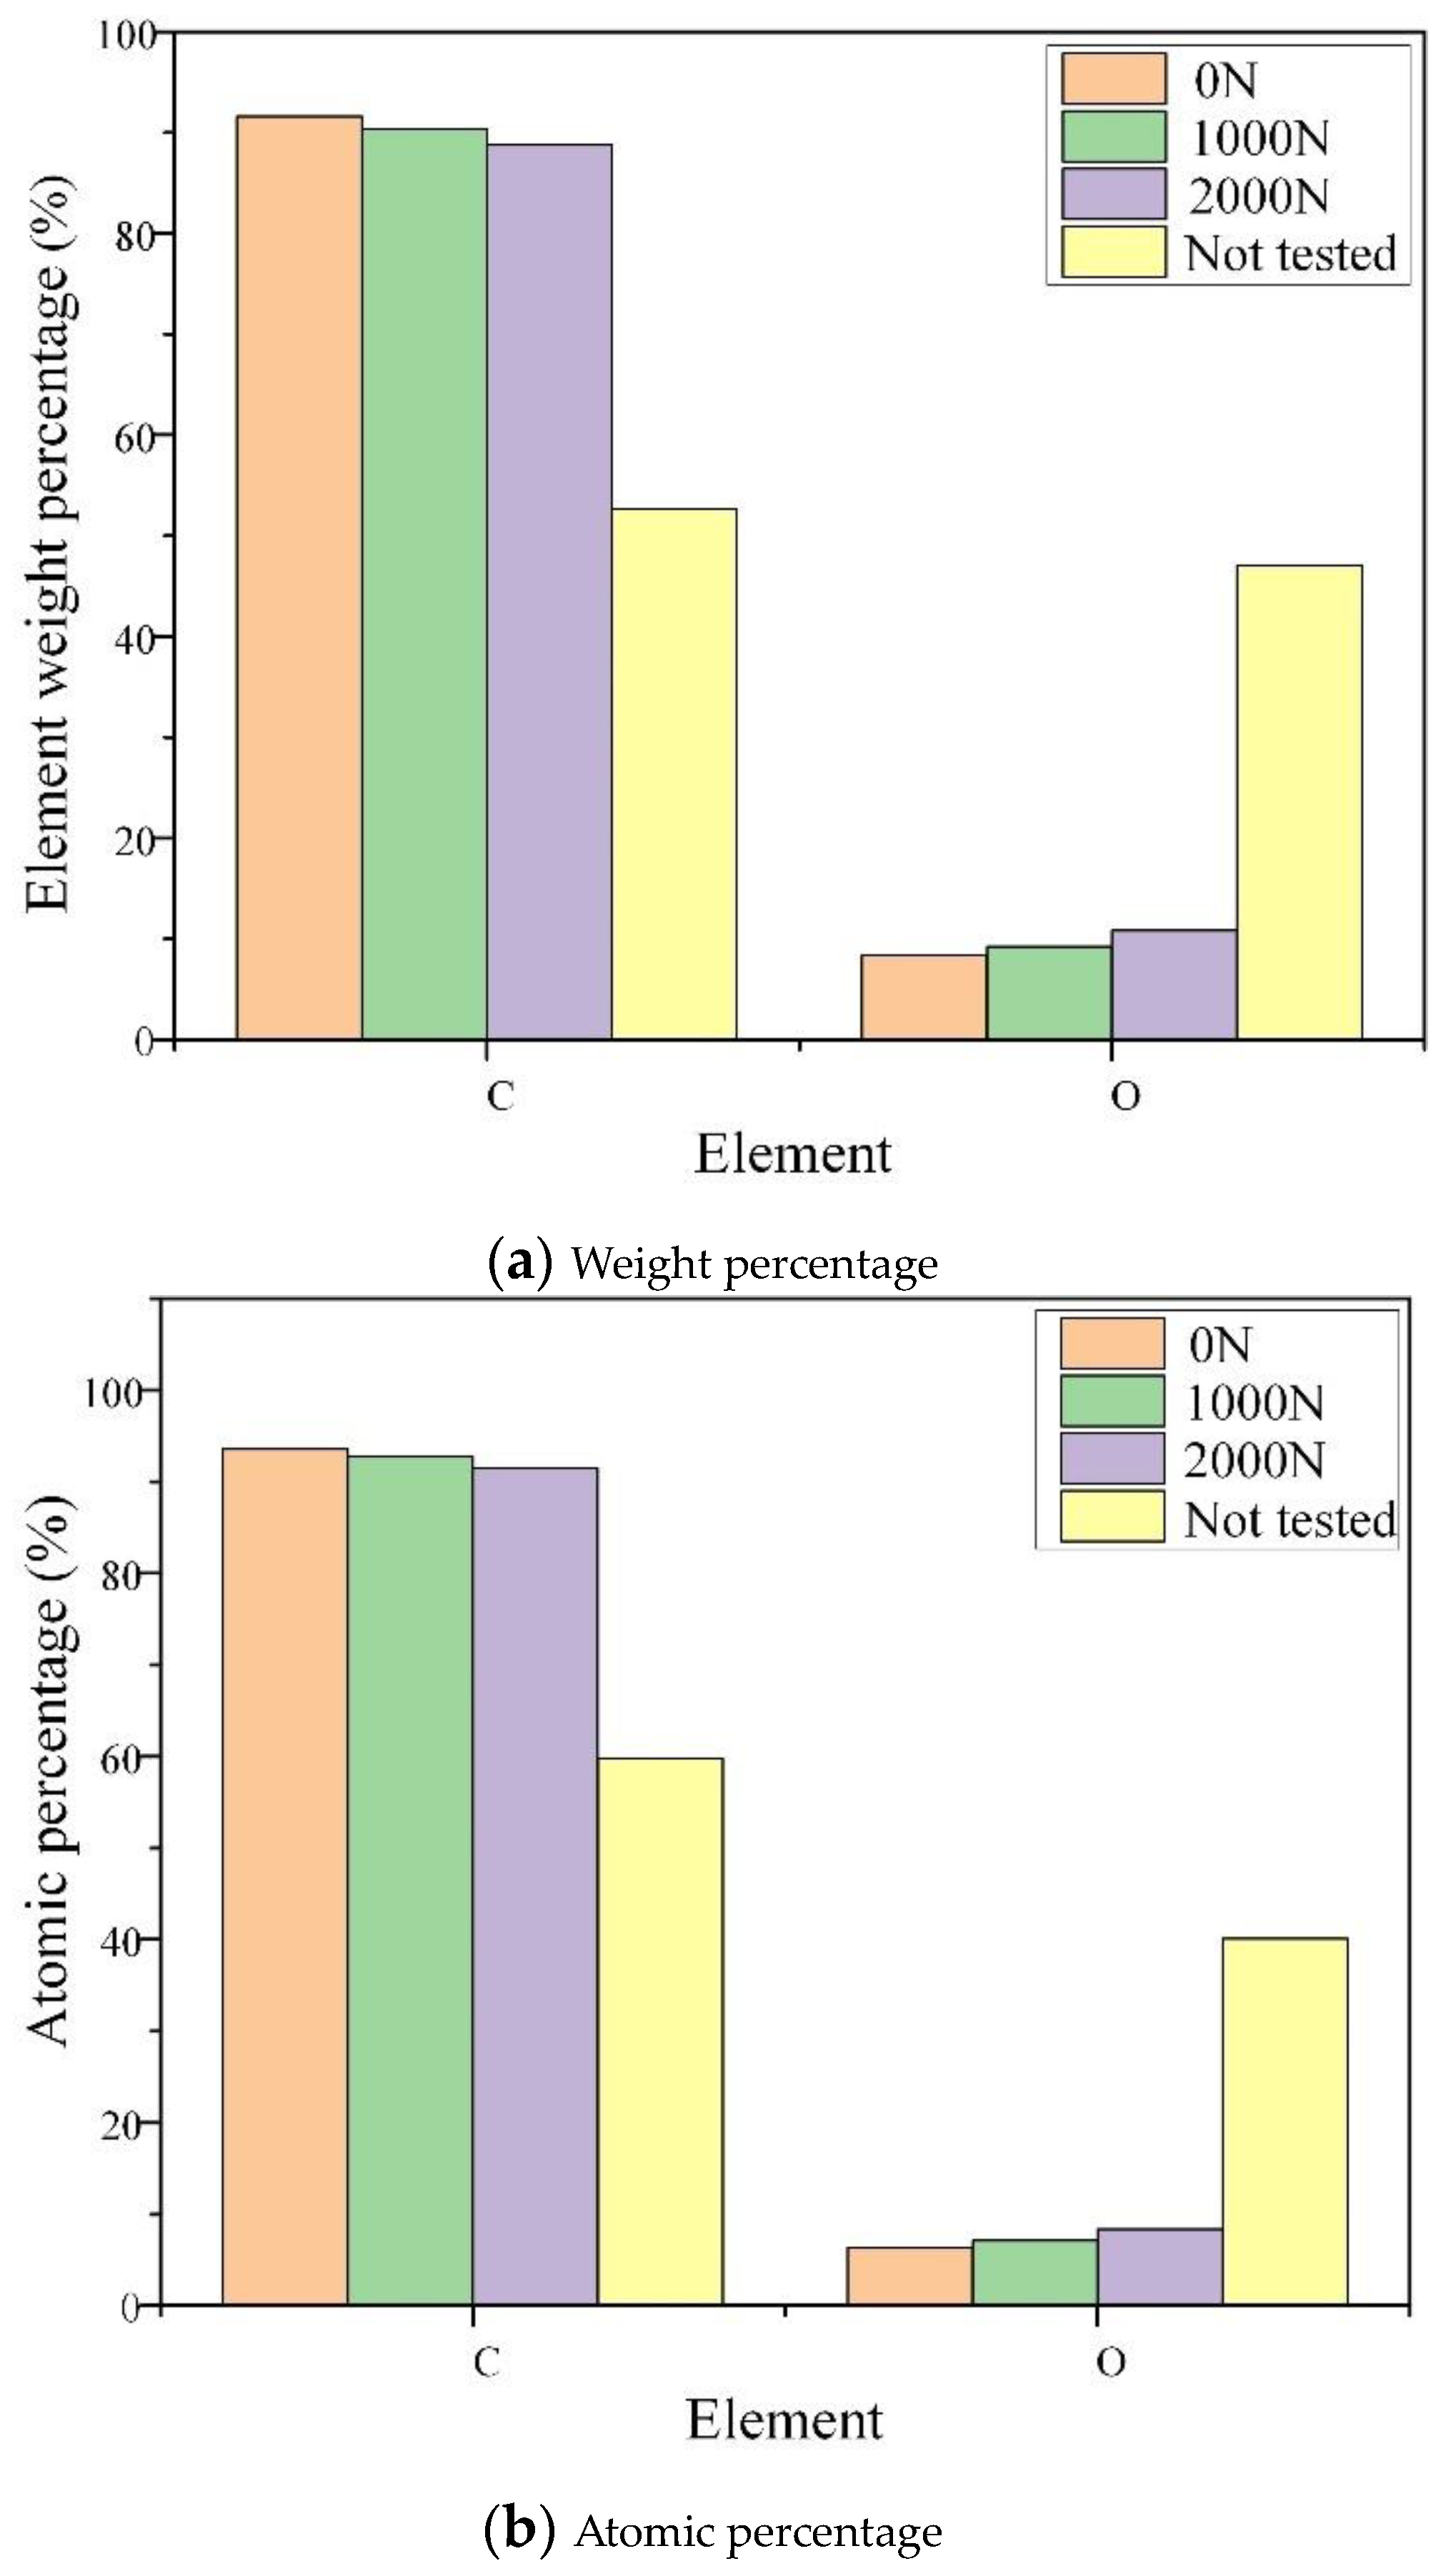
3.2.4. Energy-Dispersive Spectroscopy Analysis

The experiment focused on partial discharge for interturn insulation under the synergic action of preload and electrical stress was carried out. After partial discharge, the samples not tested, with 0 N, 1000 N, and 2000 N were selected to conduct the energy dispersive spectroscopy (EDS) analysis. The percentage contents of the main elements on the surface of the insulation paper obtained are shown in Figure 8.
It can be seen that the weight percentage and atomic percentage of the carbon element (C) on the surface of the insulation paper after partial discharge show a trend of first increasing and then decreasing with the increase in preload force. However, the weight percentage and atomic percentage of the oxygen element (O) show a trend of first decreasing and then increasing. The glycosidic bond is broken more by the action of electric stress, and the glycosidic bond is also broken by the action of pre-stress, but relatively little. It can also be observed that there is a turning point at 1000 N. After partial discharge, the surface of the insulation paper carbonizes and the C content increases. Under preloading force, the degree of damage in the insulation paper is minimal, further verifying the conclusions in Figure 4 and Figure 5.

4. Effect Mechanism of Preload and Electrical Stress Synergism on Interturn Insulation Discharge

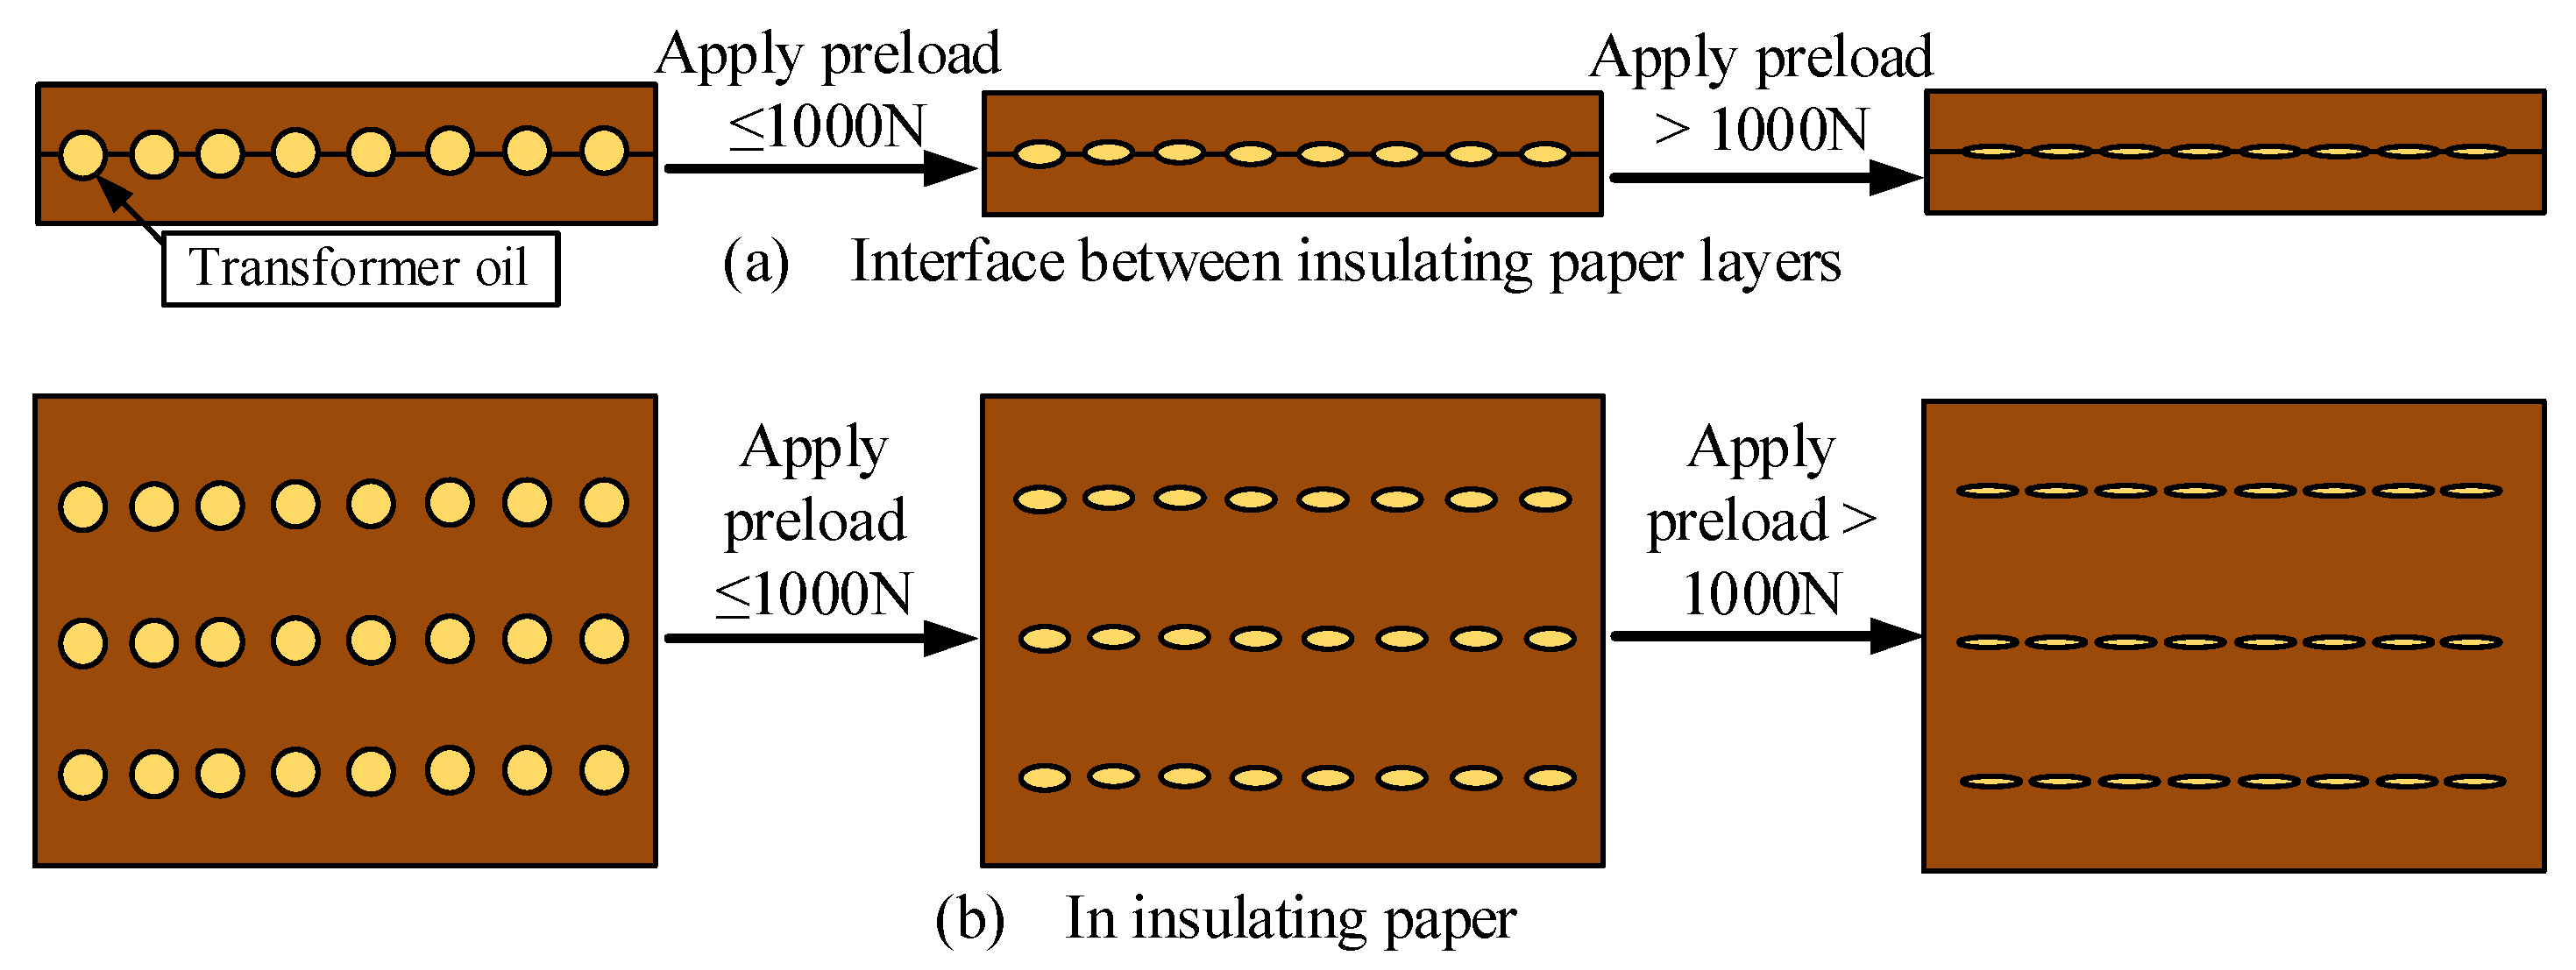
4.1. Influence Mechanism of Preload on Turn Insulation Discharge

To simulate the effect of pre-tightening force on the hole of interturn insulation, a finite element (FEA) simulation method was used to build an experimental model. The geometric model is shown in Figure 9, and the circular hole in the middle is an interturn hole. The material setting of the software is insulating paper and the mesh profile size is extremely fine. Add a solid mechanical field and set it to an elastic material with fixed constraints at the bottom and boundary loads at the top. Apply a 500 N, 1000 N, 1500 N, and 2000 N preload in the vertical direction (z-axis negative direction). The solver was chosen as a steady state solver. The results are plotted using three-dimensional stress deformation cloud maps and the deformation is magnified by a factor of 10 to obtain Figure 10. The obtained lengths of the hole in the horizontal direction (x-axis) and vertical direction (z-axis) are shown in Figure 11.
It can be observed that the preload causes deformation of the holes between the layers and in the insulating paper and the holes are elliptically reduced. The length of holes in the horizontal direction (x-axis) increases by 0.75%, 1.5%, 3%, and 4.5% when applying pre-tension values of 500 N, 1000 N, 1500 N, and 2000 N. In the vertical direction (z-axis), the vertical height of holes decreases by 10%, 20.75%, 30.25%, and 39.75%, respectively, and the area of holes decreases by 9.31%, 19.56%, 28.19%, and 37.06%, respectively. The vertical deformation is greater than the horizontal because the applied force is from the vertical direction with a fixed constraint at the bottom but no fixed constraint in the horizontal direction. The simulation software should also confirm this. Moreover, the shape of holes changes from a round to an elliptical shape. The amount of decomposition of H+ and hydroxyl groups in the water is reduced, which in turn slows down the hydrolysis reaction in the pores. As a result, the effective contact discharge area increases and the number of charged particles in the discharge channel increases. On the one hand, the increase in the number of particles leads to the decrease in the initial voltage (UIV) of partial discharge and the increase in the maximum discharge. On the other hand, the increase in the number of particles leads to the decrease in the breakdown voltage (UBV) [19] (Figure 3a,b) and the decrease in the damage degree of the insulating paper (Figure 4 and Figure 5).
As the preload continues to increase, the size of the holes in the vertical direction (z-axis) decreases and the volume of the discharge area decreases. As a result, the number of electrons in the discharge channel decreases, leading to the rise in the initial voltage of partial discharge and the reduction in the maximum discharge quantity. On the other hand, the area of the hole further decreases and the water in the insulating paper is squeezed out, slowing down the process of the hydrolysis reaction. The above two factors cause the breakdown voltage of partial discharge to rise and the damage degree of the insulating paper increases (the corresponding influence mechanism is shown in Figure 12 and Figure 13).

4.2. Influence Mechanism of Electrical Stress on Interturn Insulation Discharge

There is an air gap between the molecules of insulating paper fibers, which forms an oil gap after immersion in oil [20]. Due to the inverse ratio between the electric field strength and the dielectric constant in cellulose insulation paper and the oil gap, the relative dielectric constant of insulation paper is higher than that of insulation oil [21,22,23]. When the applied electric field reaches the critical electric field, partial discharge first occurs at the oil gap defect. The charged particles generated by the discharge continuously impact the oil molecules in the oil gap under the action of the applied electric field, causing them to crack and decompose to produce more gas, further exacerbating the discharge phenomenon in the oil gap. The high temperature generated by the discharge and the continuous effect of the electric field cause the cellulose interior at the interlayer interface of the insulating paper to gradually crack, and the crystalline area of cellulose continues to be damaged. The C, H, and O atoms in the cellulose are affected by stress such as heat, oxygen, and water, causing the geometric shape (i.e., lattice) of the atoms originally arranged in the space to be misaligned or distorted. As a results, the grain size decreases, and small molecules in some molecular chains gradually break, leading to defects such as pores.
As the applied electric field continues to increase, partial discharge strengthens, and the macromolecular chains inside the cellulose at the interlayer interface of the insulation paper gradually crack. As a result, the pores at the defect increase and gradually develop from the interface to the inside of the insulation paper until the insulation paper breaks down. The corresponding impact mechanism is shown in Figure 14.

5. Conclusions

Based on the actual operating conditions of the interturn insulation of 750 kV transformers, the applied pre-tensioning forces are designed as 0 N, 500 N, 1000 N, 1500 N, and 2000 N. Then, a stepwise boosting method was used to conduct partial discharge tests of interturn insulation under a preloading force and electrical stress. At that point, the statistical parameters of partial discharge, the microstructure of insulation paper, and the deformation law of pores in insulation paper are studied. Moreover, the influence mechanism of pre-tension and electrical stress on partial discharge of interturn insulation was explored, and the conclusions obtained are as follows.
(1) The initial voltage, breakdown voltage, and maximum discharge quantity of partial discharge show a trend of first decreasing and then increasing with the increase in preloading force. Moreover, there is a turning point at 1000 N, which is inconsistent with the existing research results that preloading force can slow down the degradation of transformer insulation pads.
(2) The damage degree of insulation paper shows a trend of first decreasing and then increasing with the increase in preload force, and there is a turning point at 1000 N. This conclusion is further verified by FTIR, XRD, and EDS.
(3) There is a turning point in the partial discharge characteristics of interturn insulation under the action of a preloading force. The reason is that the preloading force causes the deformation of the holes and air gaps between the layers of the insulating paper and in the insulating paper. As a result, the contact area and volume of partial discharge are changed, which further changes the characteristics of partial discharge for interturn insulation.

Author Contributions

Methodology, X.Z. (Xiu Zhou) and J.B.; formal analysis, L.Z. and T.T.; investigation, X.Z. (Xinyang Zhao); writing—original draft preparation, Y.W. and X.L. All authors have read and agreed to the published version of the manuscript.

Funding

This work was supported in part by Science and Technology Project of State Grid Ningxia Electric Power Co., LTD. (5229DK23000M).

Data Availability Statement

The raw data required to reproduce these findings cannot be shared at this time as the data also form part of an ongoing study.

Acknowledgments

We thank the Foundation of the Electric Power Research Institute of State Grid Ningxia Electric Power Company.

Conflicts of Interest

Authors Xiu Zhou, Jin Bai and Tian Tian were employed by the company Electric Power Research Institute of State Grid Ningxia Electric Power Co., Ltd. Author Lin Zhu was employed by the company State Grid Ningxia Electric Power Co., Ltd. Author Xinyang Zhao was employed by the company Ultra-High Voltage Company of State Grid Ningxia Electric Power Co., Ltd. The remaining authors declare that the research was conducted in the absence of any commercial or financial relationships that could be construed as a potential conflict of interest.

References

  1. Zheng, H.; Zhai, J.; Li, Z.; Chen, X.; Pu, B. An assessment of ability to withstand radial short circuit of large power transformer inner windings. Power Syst. Prot. Control 2016, 44, 154–158. [Google Scholar]
  2. Zhang, K.; Zhan, R.; Du, D.; Zhan, Z.; Liu, H. Internal short circuit current calculation and dynamic simulation of converter transformer. High Volt. Eng. 2024, 50, 1621–1630. [Google Scholar]
  3. Ding, H.; Zhao, W.; Diao, C.; Li, M. Electromagnetic Vibration Characteristics of Interturn Short Circuits in High Frequency Transformer. Electronics 2023, 12, 1884. [Google Scholar] [CrossRef]
  4. Wei, X.; Pei, Z.; Nie, H.; Li, L.; Wang, Y.; Chen, Q. Partial discharge tests and researches in power transformer interturn insulation under step-stress. Electr. Mach. Control 2017, 21, 49–57. [Google Scholar]
  5. Wei, X.; Li, L.; Nie, H.; Pei, Z.; Wang, Y. Electrical aging characteristic of 500 kV power transformer turn-to-turn insulation model coils. Electr. Mach. Control 2017, 21, 17–24. [Google Scholar]
  6. Cheng, Y.C.; Wei, J.Q.; Li, C.R.; Rong, Z.H.; Wang, G.Z.; Ma, Z.L. Development Rules of Accelerated Degradation of Oil-Paper Insulation between Turns in Transformer Windings Induced by Partial Discharge. Trans. China Electrotech. Soc. 2015, 30, 203–212. [Google Scholar]
  7. Zhao, Y.K.; Zhang, G.Q.; Guo, R.R. Study on discharge characteristics of heat resistant interturn insulation materials in power transformers. Adv. Technol. Electr. Eng. Energy 2019, 38, 1–9. [Google Scholar]
  8. Zhao, Y.; Zhang, G.; Guo, R.; Yang, F. The breakdown characteristics of thermostable insulation materials under high-frequency square waveform. IEEE Trans. Dielectr. Electr. Insul. 2019, 26, 1073–1080. [Google Scholar] [CrossRef]
  9. Hu, E.; Zhao, W.; Xu, T.; Xu, J.; Liang, S. Effect of sulfur corrosion on the characteristic of partial discharge in turn-to-turn winding insulation in power transformer. High Volt. Appar. 2020, 56, 216–223. [Google Scholar]
  10. Guo, R.; Sun, Y.; Zhang, X.; Wu, J.; Li, J. Discharge characteristics of actual winding turn-to-turn structure inside transformers under oscillating switching impulse voltage. In Proceedings of the International Symposium on High Voltage Engineering, Xi’an, China, 21–26 November 2021; pp. 666–669. [Google Scholar]
  11. Liu, Y.; Liu, G.; Li, L.; Wu, W. Simulation and analysis of turn-insulation on temperature rise and hot spots of transformer windings. J. North China Electr. Power Univ. 2020, 47, 64–73. [Google Scholar]
  12. Liu, J.; Wang, F. Study on the influence of preload on the thermal aging of transformer oil-paper insulation. Electr. Mach. Control 2020, 24, 127–134. [Google Scholar]
  13. Liu, Y.; Yan, C.; Wang, B.; Zhou, X. Influence of different factors on thermal ageing characteristics of transformer insulating pads. Insul. Mater. 2023, 56, 52–59. [Google Scholar]
  14. GB/T 1408.1-2016; Test Methods for Electrical Strength of Insulating Materials—Part 1: Power Frequency Test. Standardization Administration of China. China Standards Press: Beijing, China, 2016.
  15. Zhang, F.; Li, X.; Zhu, X.; Zhuang, Z.; Shi, Y. Assessment of the withstand ability to short circuit of inner-windings in power transformers considering the degreeof thermal aging. Proc. CSEE 2022, 42, 3836–3845. [Google Scholar]
  16. Munajad, A.; Subroto, C.; Suwarno. Fourier Transform Infrared (FTIR) Spectroscopy Analysis of Transformer Paper in Mineral Oil-Paper Composite Insulation under Accelerated Thermal Aging. Energies 2018, 11, 364. [Google Scholar] [CrossRef]
  17. Li, X.; Wu, G.; Yang, Y.; Wang, Z.; Xu, P.; Li, Y.; Gao, B. Partial discharge characteristics of oil-paper insulation for on-board traction transformers under superposed inter-harmonic AC voltages. IEEE Trans. Dielectr. Electr. Insul. 2020, 27, 240–248. [Google Scholar] [CrossRef]
  18. Li, X.; Zhang, W.; Wang, H.; Ma, X.; Zhang, H.; Li, K.; Qin, T.; Liu, K.; Yang, Y.; Wu, G. Surface degradation of oil-Immersed nomex paper caused by partial discharge of high-frequency voltage. J. Electron. Mater. 2023, 52, 1094–1103. [Google Scholar] [CrossRef]
  19. Zhang, Q.; Han, X.; Zhang, Z.; Pang, P.; Sun, Z. Influences of Internal Void Defect Dimension and Position on Partial Discharge Characteristics in the Solid Insulation. High Volt. Eng. 2019, 45, 1313–1322. [Google Scholar]
  20. Tang, C.; Liao, R.; Huang, F.; Yang, L.; Zhu, M. The breakdown voltage of power transformer insulation paper after thermal aging. Trans. China Electrotech. Soc. 2010, 25, 1–8. [Google Scholar]
  21. Li, X.; Li, J.; Sun, C.; Dang, J.; Li, Y. Study on electrical aging lifetime of vegetable oil-paper insulation. Proc. CSEE 2007, 27, 18–22. [Google Scholar]
  22. Prevost, T.A.; Oommen, T.V. Cellulose insulation in oil-filled power transformers:Part I-history and development. IEEE Electr. Insul. Mag. 2006, 22, 28–35. [Google Scholar] [CrossRef]
  23. Xiang, B.; Liao, R.; Zhang, Y.; He, L.; Zhou, T. AgingMicro-mechanism of Oil-paper Insulation in Power Transformers by XRD Analysis. High Volt. Appar. 2012, 48, 40–45. [Google Scholar]
Figure 1. Interturn insulation model and experimental platform.
Electronics 13 03185 g001
Figure 2. Experimental pre-treatment process of interturn insulation under preload and electric stress.
Electronics 13 03185 g002
Figure 3. Chart of statistical parameters of partial discharge.
Electronics 13 03185 g003
Figure 4. Optical microscope image after breakdown.
Electronics 13 03185 g004aElectronics 13 03185 g004b
Figure 5. Scanning microscope image after breakdown.
Electronics 13 03185 g005aElectronics 13 03185 g005b
Figure 6. Infrared spectrogram of insulating paper after partial discharge under preload and electric stress.
Electronics 13 03185 g006
Figure 7. XRD pattern of insulating paper after partial discharge under preload and electric stress.
Electronics 13 03185 g007
Figure 8. Percentage of main elements on the surface of insulating paper after PD degradation.
Electronics 13 03185 g008
Figure 9. Geometric model diagram.
Electronics 13 03185 g009
Figure 10. Enlarge the hole deformation diagram by 10 times by applying different preload forces.
Electronics 13 03185 g010
Figure 11. Variation parameters of holes.
Electronics 13 03185 g011
Figure 12. Effect of preload on air gap between interturn insulation.
Electronics 13 03185 g012
Figure 13. Influence mechanism of preload on interturn insulation discharge.
Electronics 13 03185 g013
Figure 14. The influence of electrical stress on partial discharge of interturn insulation.
Electronics 13 03185 g014
Table 1. Experimental materials.
Experimental MaterialsMaterial TypeSet Size
Flat copper stripcopper250 × 20 × 2 mm
Insulating paperKraft paper0.13 mm
Insulating oil25# transformer oil/
Table 2. Step-up criteria.
Applying VoltageInterstage IncrementDuration
U ≤ 5 kV0.2 kV2 min
5 kV < U ≤ 15 kV2 kV
U > 15 kV1 kV
Table 3. The main absorption peak of the kraft paper.
Absorption Peak Wave Number/cm−1Corresponding Chemical Bonds
3550~3200
1100~1000
hydroxyl
1200~1100
Around 895
Glycosidic bond
Table 4. Diffraction parameters of insulating paper with different preload forces.
Preload Force/NIam/(points · s−1)I002/(points · s−1)2θ002/(°)FWHM002/radDhkl/10−10 m
Not tested0.533223.30.032345.808
00.79323.30.033144.700
10000.467023.60.038938.056
20000.385023.560.038738.250
Disclaimer/Publisher’s Note: The statements, opinions and data contained in all publications are solely those of the individual author(s) and contributor(s) and not of MDPI and/or the editor(s). MDPI and/or the editor(s) disclaim responsibility for any injury to people or property resulting from any ideas, methods, instructions or products referred to in the content.

