Article

Neuromarketing and Big Data Analysis of Banking Firms’ Website Interfaces and Performance

by
Nikolaos T. Giannakopoulos
1,*,
Damianos P. Sakas
1 and
Stavros P. Migkos
2
1
BICTEVAC Laboratory—Business Information and Communication Technologies in Value Chains Laboratory, Department of Agribusiness and Supply Chain Management, School of Applied Economics and Social Sciences, Agricultural University of Athens, 118 55 Athens, Greece
2
Department of Accounting & Finance, School of Economic Sciences, University of Western Macedonia, 501 00 Kozani, Greece
*
Author to whom correspondence should be addressed.
Electronics 2024, 13(16), 3256; https://doi.org/10.3390/electronics13163256
Submission received: 24 July 2024 / Revised: 8 August 2024 / Accepted: 14 August 2024 / Published: 16 August 2024

Abstract

:
In today’s competitive digital landscape, banking firms must leverage qualitative and quantitative analysis to enhance their website interfaces, ensuring they meet user needs and expectations. By combining detailed user feedback with data-driven insights, banks can create more intuitive and engaging online experiences, ultimately driving customer satisfaction and loyalty. Thus, the need for website customer behavior analysis to evaluate its interface is critical. This study focused on the five biggest banking firms and collected big data from their websites. Statistical analysis was followed to validate findings and ensure the reliability of the results. At the same time, agent-based modeling (ABM) and System Dynamics (SD) were utilized to simulate user behavior, thereby allowing for the prediction of responses to interface changes and the optimization of their website, and to obtain a comprehensive understanding of user behavior, thereby enabling banking firms to create more intuitive and user-friendly website interfaces. This interdisciplinary approach found that various website analytical metrics, such as organic and paid traffic costs, referral domains, and email sources, tend to impact banking firms’ purchase conversion, display ads, organic traffic, and bounce rate. Moreover, these insights into banking firms’ website visibility, combined with the behavioral data of the neuromarketing study, indicate specific areas for their website interface and performance improvement.

1. Introduction

Advancements in communication and information technology have equipped consumers with an array of online channels to gather, exchange, and share information about services, products, and personal brand experiences [1]. The onset of the digital age has caused a substantial paradigm shift across industries, compelling organizations to rethink their strategies and adopt digital transformation [2]. This shift has been especially profound in the banking sector, revolutionizing traditional practices and ushering in a new era focused on customer centricity and innovation [3].
Highly engaged customers tend to shop more, recommend more, and demonstrate stronger loyalty. A critical aspect of customer engagement strategies is maintaining a high-quality customer experience [4]. Interactive social media activities, leveraging information and communication technology, can enhance customer engagement and support the customer experience [5]. Consumer interaction and engagement are vital for marketers to sustain long-term customer relationships. Digital marketing creates participation opportunities that build trust, goodwill, and commitment between individuals and brands [6]. Lee et al. [7] found that incorporating humor and emotion can significantly boost consumer engagement in the banking sector. Fans of brand pages can view posts and interact by liking, sharing, and commenting [8], resulting in high levels of online activity due to the interactivity of the content.
Operational elements on a webpage are crucial in web design. Each element is considered an object in the program script, with unique methods and attributes controlling its behavior [7]. To gain consumer trust and build a high-quality brand, some construction companies actively seek quality inspection certifications to prove the quality of their projects. Faghih et al. [9] noted that the user interface (UI) is the point of interaction between the user and computer software. The success of a software application heavily depends on user interface design (UID), which significantly impacts ease of use and learning time. UI should prioritize maximizing usability and user experience [10].
User experience (UX) reflects the satisfaction of users, measuring their impressions when using or planning to use an application [11]. Additionally, UX and UI are connected to user emotions and satisfaction during software interaction, regardless of functional or non-functional requirements [11]. The user interface (UI), which communicates system functionality, usability, and satisfaction, is often closely linked with UX [12].
The implications of integrating website customer big data and neuromarketing for banking firm websites are profound. Leveraging big data analytics allows banks to gain deep insights into customer behaviors, preferences, and interactions on their websites [13]. By analyzing patterns and trends, banks can tailor their website content, design, and functionalities to better meet customer needs and enhance user experience. Neuromarketing techniques, such as eye-tracking and brain imaging, provide additional layers of understanding by revealing subconscious responses to various website elements [14]. This combined approach can lead to the more effective personalization of services, improved customer satisfaction, and increased engagement. For example, banks can optimize website layouts to highlight key information and offers, use data-driven insights to craft compelling messaging, and design intuitive navigation paths that align with natural user behaviors [15]. Ultimately, the integration of customer big data and neuromarketing enables banking firms to create more efficient, user-centric websites that can drive higher conversion rates, foster customer loyalty, and maintain a competitive edge in the digital landscape.
Therefore, our paper aims to study the website behavior of banking firms’ customers, through big data and neuromarketing analyses, and discern potential factors that impact their website interface and performance. From the above analysis, the main research questions (RQs) for the present study are presented below:
RQ1: Does the analytical customer behavior of banking firm websites impact their visibility and engagement?
RQ2: Does the customer behavior of banking firm websites enhance their interface?
These research questions address critical aspects of the interplay between customer behavior on banking firm websites and the resulting impact on visibility, engagement, and interface enhancement. RQ1 explores whether analytical insights into customer behavior directly influence the visibility and engagement levels of banking websites. This question is motivated by the growing importance of user-centric design and personalized experiences in the digital banking landscape, suggesting that a deep understanding of customer interactions can lead to more effective marketing strategies and higher user retention. RQ2 investigates the extent to which customer behavior data informs and improves the website interface, highlighting the role of iterative design based on real user feedback. This research fills a gap in the existing literature by integrating behavioral analytics with interface design, an area often overlooked in traditional banking studies, which tend to focus more on security and functionality rather than user experience. Addressing these questions can provide banking firms with actionable insights to refine their digital strategies, ultimately leading to more engaging and user-friendly websites that cater to the evolving needs and preferences of their customers. This research not only contributes to academic discourse by bridging behavioral analytics and interface design but also offers practical implications for enhancing digital engagement in the banking sector.
The stages of this paper are as follows: the second part outlines the theoretical frameworks and research hypotheses; the third part details the methodology; the fourth part presents the study’s results, including statistical and modeling analyses; and the fifth part covers the discussion and conclusions. This structure facilitates a comprehensive analysis of how banking firms can leverage marketing analytics and customer website behavior to improve their webpage interfaces.

2. Literature Background

2.1. Banking Firms, Digital Marketing, and User Engagement

As banks navigate an ever-evolving landscape, integrating social media applications has become a crucial factor in this sector [16]. The digital transformation of banks involves a wide range of changes, from adopting advanced technologies to restructuring internal processes and reimagining customer experiences [17]. This transformation is fundamentally driven by the need to adapt to changing customer expectations, stay ahead of disruptive market forces, and seize the opportunities presented by the digital revolution [18]. Essentially, a key assumption of our model is that for a bank to engage customers effectively, it must achieve a high-efficiency grade in traditional CRM. This means that banks need to satisfy their customers, earn their trust, and ensure that their customers feel and act with loyalty under any circumstances [19].
The strategic use of digital marketing focuses on building personalized relationships with consumers [20]. Banks leverage the value of social media to provide direct and real-time marketing, thereby enabling them to offer customized responses to clients regardless of geographic location. CRM, as a digital marketing strategy, has been discerned as an important factor in improving customer engagement [21], especially in the banking sector. Banks leverage social media platforms for personnel selection, crowdsourcing, and promoting their corporate values [21]. Additionally, they focus on gathering customer data and enhancing financial education [22]. However, there is a marked difference in the importance placed on building image and reputation compared to marketing and business development.
Trust in service providers and economic stability significantly enhance customer emotional, cognitive, and behavioral engagement with banking firms [23]. To adapt successfully, banks must prioritize organizational culture, customer engagement, financial innovation, and proactive responses to fintech disruptions [24]. The implication of video and affiliate marketing strategies, in the wider aspect of digital marketing, tends to increase the engagement of banking firms with their brand [25,26].
The primary factors influencing customer experience in digital banking include service quality, functional quality, perceived value, employee–customer engagement, perceived usability, and perceived risk [27]. There is a strong connection between customer experience, satisfaction, and loyalty, which in turn impact financial performance [27]. Digital tools have enabled companies to better target their markets by tracking customer preferences, offering more personalized solutions, and facilitating value co-creation in the financial services sector [28]. The findings indicate that key website attributes such as visualization, interactivity, aesthetics, customization, ease of use, and telepresence positively influence customer experience. Additionally, the results highlight positive relationships between customer experience, customer trust, and customer retention [29]. Therefore, more light should be shed on the role of website customer behavioral data on website interface and the performance of firms in the banking sector.

2.2. Metrics and KPIs of Friendly Website User Interface (UI)

Lestari et al. [30] found that responsive web design effectively maintains the user experience by ensuring content readability and enhancing the enjoyment of using websites. It also reduces the need for excessive scrolling when reading content. Almeida and Monteiro [31] noted that creating user experiences requires a range of multidisciplinary skills, including a knowledge of tools, processes, and business intricacies. Walsh et al. [32] highlighted that responsive web design is a modern approach allowing developers to create webpages that offer a consistent user experience across different device sizes.
Usability is defined as the ease with which users can interact with an interface [33]. According to ISO standard 9241–11 [34], usability is “the extent to which a system, product, or service can be used by specified users to achieve specified goals with effectiveness, efficiency, and satisfaction in a specified context of use”. Efficiency, as per this standard, refers to “resources used for the results achieved”. Additionally, customizing a menu can reduce user input time on application interfaces [35].
Kim and Cho [36] describe user experience (UX) as the overall experience related to a user’s perceptions and thoughts when interacting with a system, product, content, or service. User interface (UI), on the other hand, involves the visual elements and commands used to operate the system, input data, and use content [37]. Von Saucken et al. [38] stated that UX enhances UI by incorporating emotional aspects. A banking firm’s website with a user-friendly interface is closely linked to its performance [9]. Therefore, some of the website performance metrics related to the indication of a website’s friendliness are its increased website traffic through various sources (visibility), page views per visit, conversion rates (i.e., purchase conversion), and decreased bounce rates [39].

2.3. Neuromarketing and Big Data Analysis Implications on Website Interface and Performance

Neuromarketing proposes that emotional and rational thinking coexist and are interdependent [40]. Emotions capture a subject’s attention, allowing the rational brain to engage with the presented situation. Gabriel et al. [41] demonstrated that affective neuroscience, when applied to marketing, accurately predicts customer reactions to products. Neuromarketing, which integrates neuroscience and marketing, aims to understand customers’ impulses, feelings, and emotions, thereby influencing purchase decisions and facilitating interaction between consumers and companies [42].
Neuromarketing combines neuroimaging with marketing science to better understand consumer behavior and brand loyalty, offering a wider perspective on marketing science [43]. It has advanced over the last 5 years, with EEG and physiological response measuring techniques being preferred over fMRI for consumer response prediction and classification [44]. It has also become popular due to its potential to provide hidden consumer experience insights and faster marketing methods, but its affordability remains uncertain [45]. Neuromarketing and big data analytics offer strategic consumer engagement by integrating neuroscience, biometrics, multimedia technology, marketing strategy, and big data management [46]. Moreover, it can enhance people’s motivation and learning performance in online classrooms using visual material, virtual boards, and class activities [47].
Berčík et al. [48] found that monitoring visual attention indicates the need for larger text fonts and copywriting adjustments to reduce text volume, reorganize content, or replace complex texts with animations and infographics. These modifications primarily enhance the user interface (UI) and overall user experience (UX). EEG data analysis can accurately predict consumer decision-making and distinguish between “Like” and “Dislike” preferences in advertisements, with frontal and centro-parietal locations being the most discriminative channels [49].
On the other hand, quantitative analyses and cross-country comparisons can provide a broader understanding of strategies, outcomes, diverse contexts, market dynamics, and organizational factors within the banking sector [24]. Uygun et al. [50] stated that the utilization of big data analysis from websites could lead to enhanced webpage usability (for users/visitors) and overall website performance. Moreover, Li and Zhang [51] highlighted the role of website big data analysis in improving the performance of enterprises’ e-commerce platforms and their webpage display. Big data analysis based on social media platforms has been discerned as an important factor in enhancing the engagement of decentralized finance firm customers and their websites’ performance [52].
Therefore, from the aforementioned literature review, a gap has been spotted that concerns the implication of website users’ quantitative and qualitative data on a website’s interface and performance. Moreover, this gap is extended to the specific utilization of website customer big data (as a method of quantitative analysis) and neuromarketing applications (as a form of qualitative analysis), as well as to these analyses’ impact on the banking sector.

2.4. Hypotheses Development

Following the settlement of this study’s RQs, the authors moved to the deployment of four research hypotheses to further analyze the aims of this paper. The four hypotheses (H1–H4) mainly refer to banking firms’ website analytical consumer behavioral data to answer RQ1. RQ2 can be answered by utilizing an eye-tracking and heatmap analysis tool.
The first research hypothesis (H1) posits that there is a strong connection between banking firms’ digital marketing analytics and their customers’ purchasing conversion [53]. This hypothesis is explored through the first research question (RQ1), which investigates whether the analytical understanding of customer behavior on banking firm websites affects their visibility and engagement [54]. The underlying premise is that by effectively analyzing customer interactions and behaviors on their digital platforms, banking firms can enhance their visibility and engagement metrics. This, in turn, is expected to drive higher conversion rates as firms tailor their marketing strategies to meet customer needs and preferences more accurately. Therefore, if this hypothesis is confirmed, it would suggest that robust digital marketing analytics are a critical component for banking firms in optimizing their online presence and achieving better customer conversion outcomes.
Hypothesis 1 (H1).
Banking firms’ digital marketing analytics are strongly connected with their customers’ purchasing conversion.
Hypothesis 2 (H2) suggests that the extent to which banking firms utilize display ads on their webpages is heavily influenced by their digital marketing analytics [55]. This hypothesis aligns with the first research question (RQ1), which examines whether the analytical insights into customer behavior on banking firm websites impact their visibility and engagement. The connection implied is that digital marketing analytics provide critical data on customer preferences, behaviors, and interactions, thereby enabling firms to strategically deploy display ads to maximize visibility and engagement [56]. By leveraging analytics, banking firms can optimize the placement, frequency, and content of display ads to better attract and engage customers, thereby enhancing their online presence and potentially improving conversion rates. Thus, if H2 holds true, it underscores the importance of integrating comprehensive digital marketing analytics into advertising strategies to effectively target and retain customers.
Hypothesis 2 (H2).
The amount of display ads that banking firms use on their webpages is strongly dependent on their digital marketing analytics.
Hypothesis 3 (H3) posits that a banking firm’s organic visibility is negatively impacted by its digital marketing analytics [57]. This hypothesis stems from the first research question (RQ1), which investigates whether the analytical insights into customer behavior on banking firm websites affect their visibility and engagement. The premise here is that an over-reliance on digital marketing analytics might lead to strategies that prioritize short-term gains through paid or targeted advertising at the expense of long-term organic visibility. For example, banking firms might focus more on personalized ads and sponsored content driven by analytics, potentially neglecting best SEO practices and organic content development [58]. If H3 is validated, it would suggest that while digital marketing analytics can boost engagement through targeted efforts, they might inadvertently reduce the firm’s visibility in organic search results, highlighting the need for a balanced approach that integrates both analytics-driven strategies and organic growth initiatives.
Hypothesis 3 (H3).
A banking firm’s organic visibility is negatively impacted by its digital marketing analytics.
Hypothesis 4 (H4) posits that the digital marketing analytics of banking firms tend to increase the bounce rate of their websites [59]. This hypothesis is examined through the lens of the first research question (RQ1), which explores whether the analytical understanding of customer behavior on banking firm websites influences their visibility and engagement. This hypothesis suggests that while digital marketing analytics aim to optimize user experience and engagement, they may inadvertently lead to higher bounce rates if the insights are not properly implemented. For instance, over-targeting or irrelevant content driven by misinterpreted analytics might cause users to leave the site quickly. If H4 is supported, it indicates that despite the potential benefits of analytics in crafting tailored marketing strategies, there is a risk of increased bounce rates if the data are not effectively utilized to enhance user experience [60]. This underscores the importance of not only gathering and analyzing data but also translating them into meaningful, user-friendly website improvements.
Hypothesis 4 (H4).
The digital marketing analytics of banking firms tend to increase the bounce rate of their website.

3. Materials and Methods

3.1. Methodological Concept

To explore the study’s research, both quantitative and qualitative analyses were employed to investigate the link between banking firms’ website customer data and their webpage interface enhancement. This study utilized a four-stage methodological framework to achieve this. Within this framework, valuable insights into customer behavior on banking firm websites were gathered, which helped establish a framework to discern digital marketing strategies that can enhance the efficiency of their website interface.
  • The research started with the collection of data on website customers and digital marketing activities from banking firm websites. A website’s user behavioral data (pages per visit, bounce rate, time on site, etc.) were sourced from the website platform Semrush [61], which enables the extraction of big data from corporate webpages.
  • The next step involved statistical analysis using methods such as descriptive statistics, correlation, and linear regression. By analyzing the coefficients obtained, researchers can determine the impact of banking firms’ website customer data on their digital marketing and interface performance metrics, including purchase conversion, display ads, organic traffic, and bounce rate.
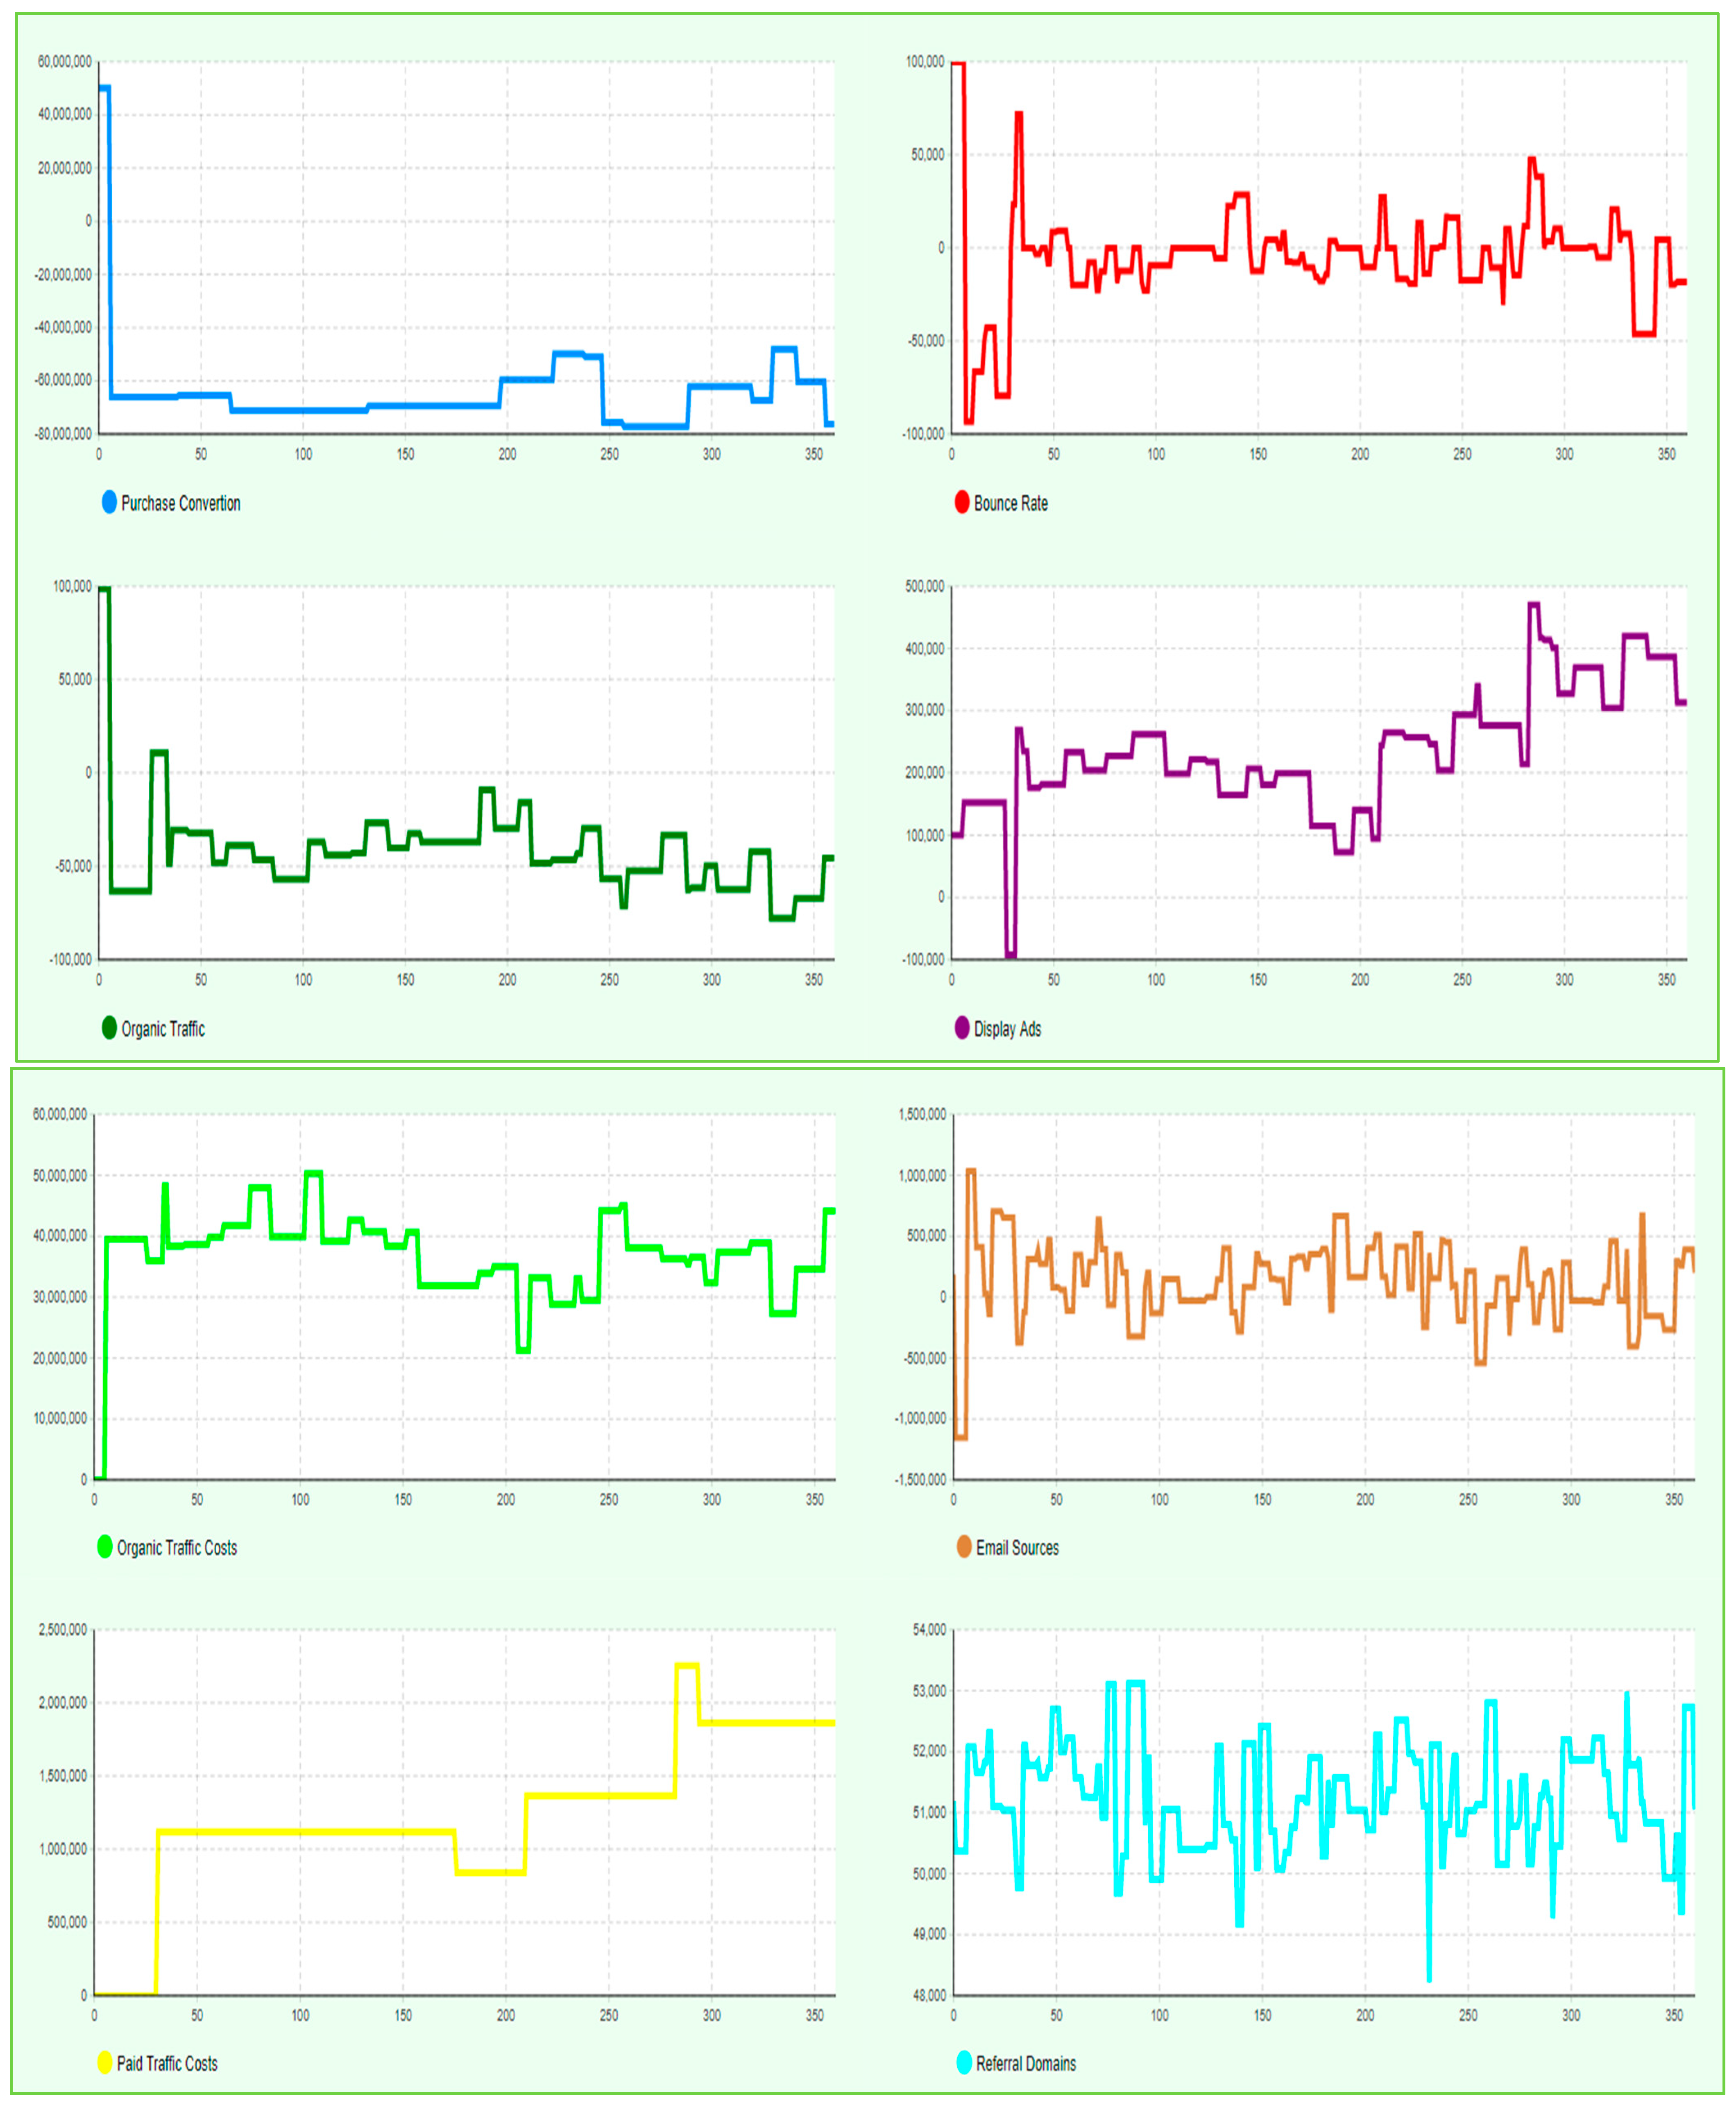
  • After statistical analysis, a hybrid model (HM) incorporating agent-based models (ABMs) and System Dynamics (SD) was used for the simulation. The software AnyLogic (version 8.9.1) [62] was employed to create a hybrid model that simulates the relationships between the study’s dependent and independent variables over 360 days. This model aims to represent the dynamic interaction between banking firms’ website interface metrics and key metrics of their digital marketing strategies.
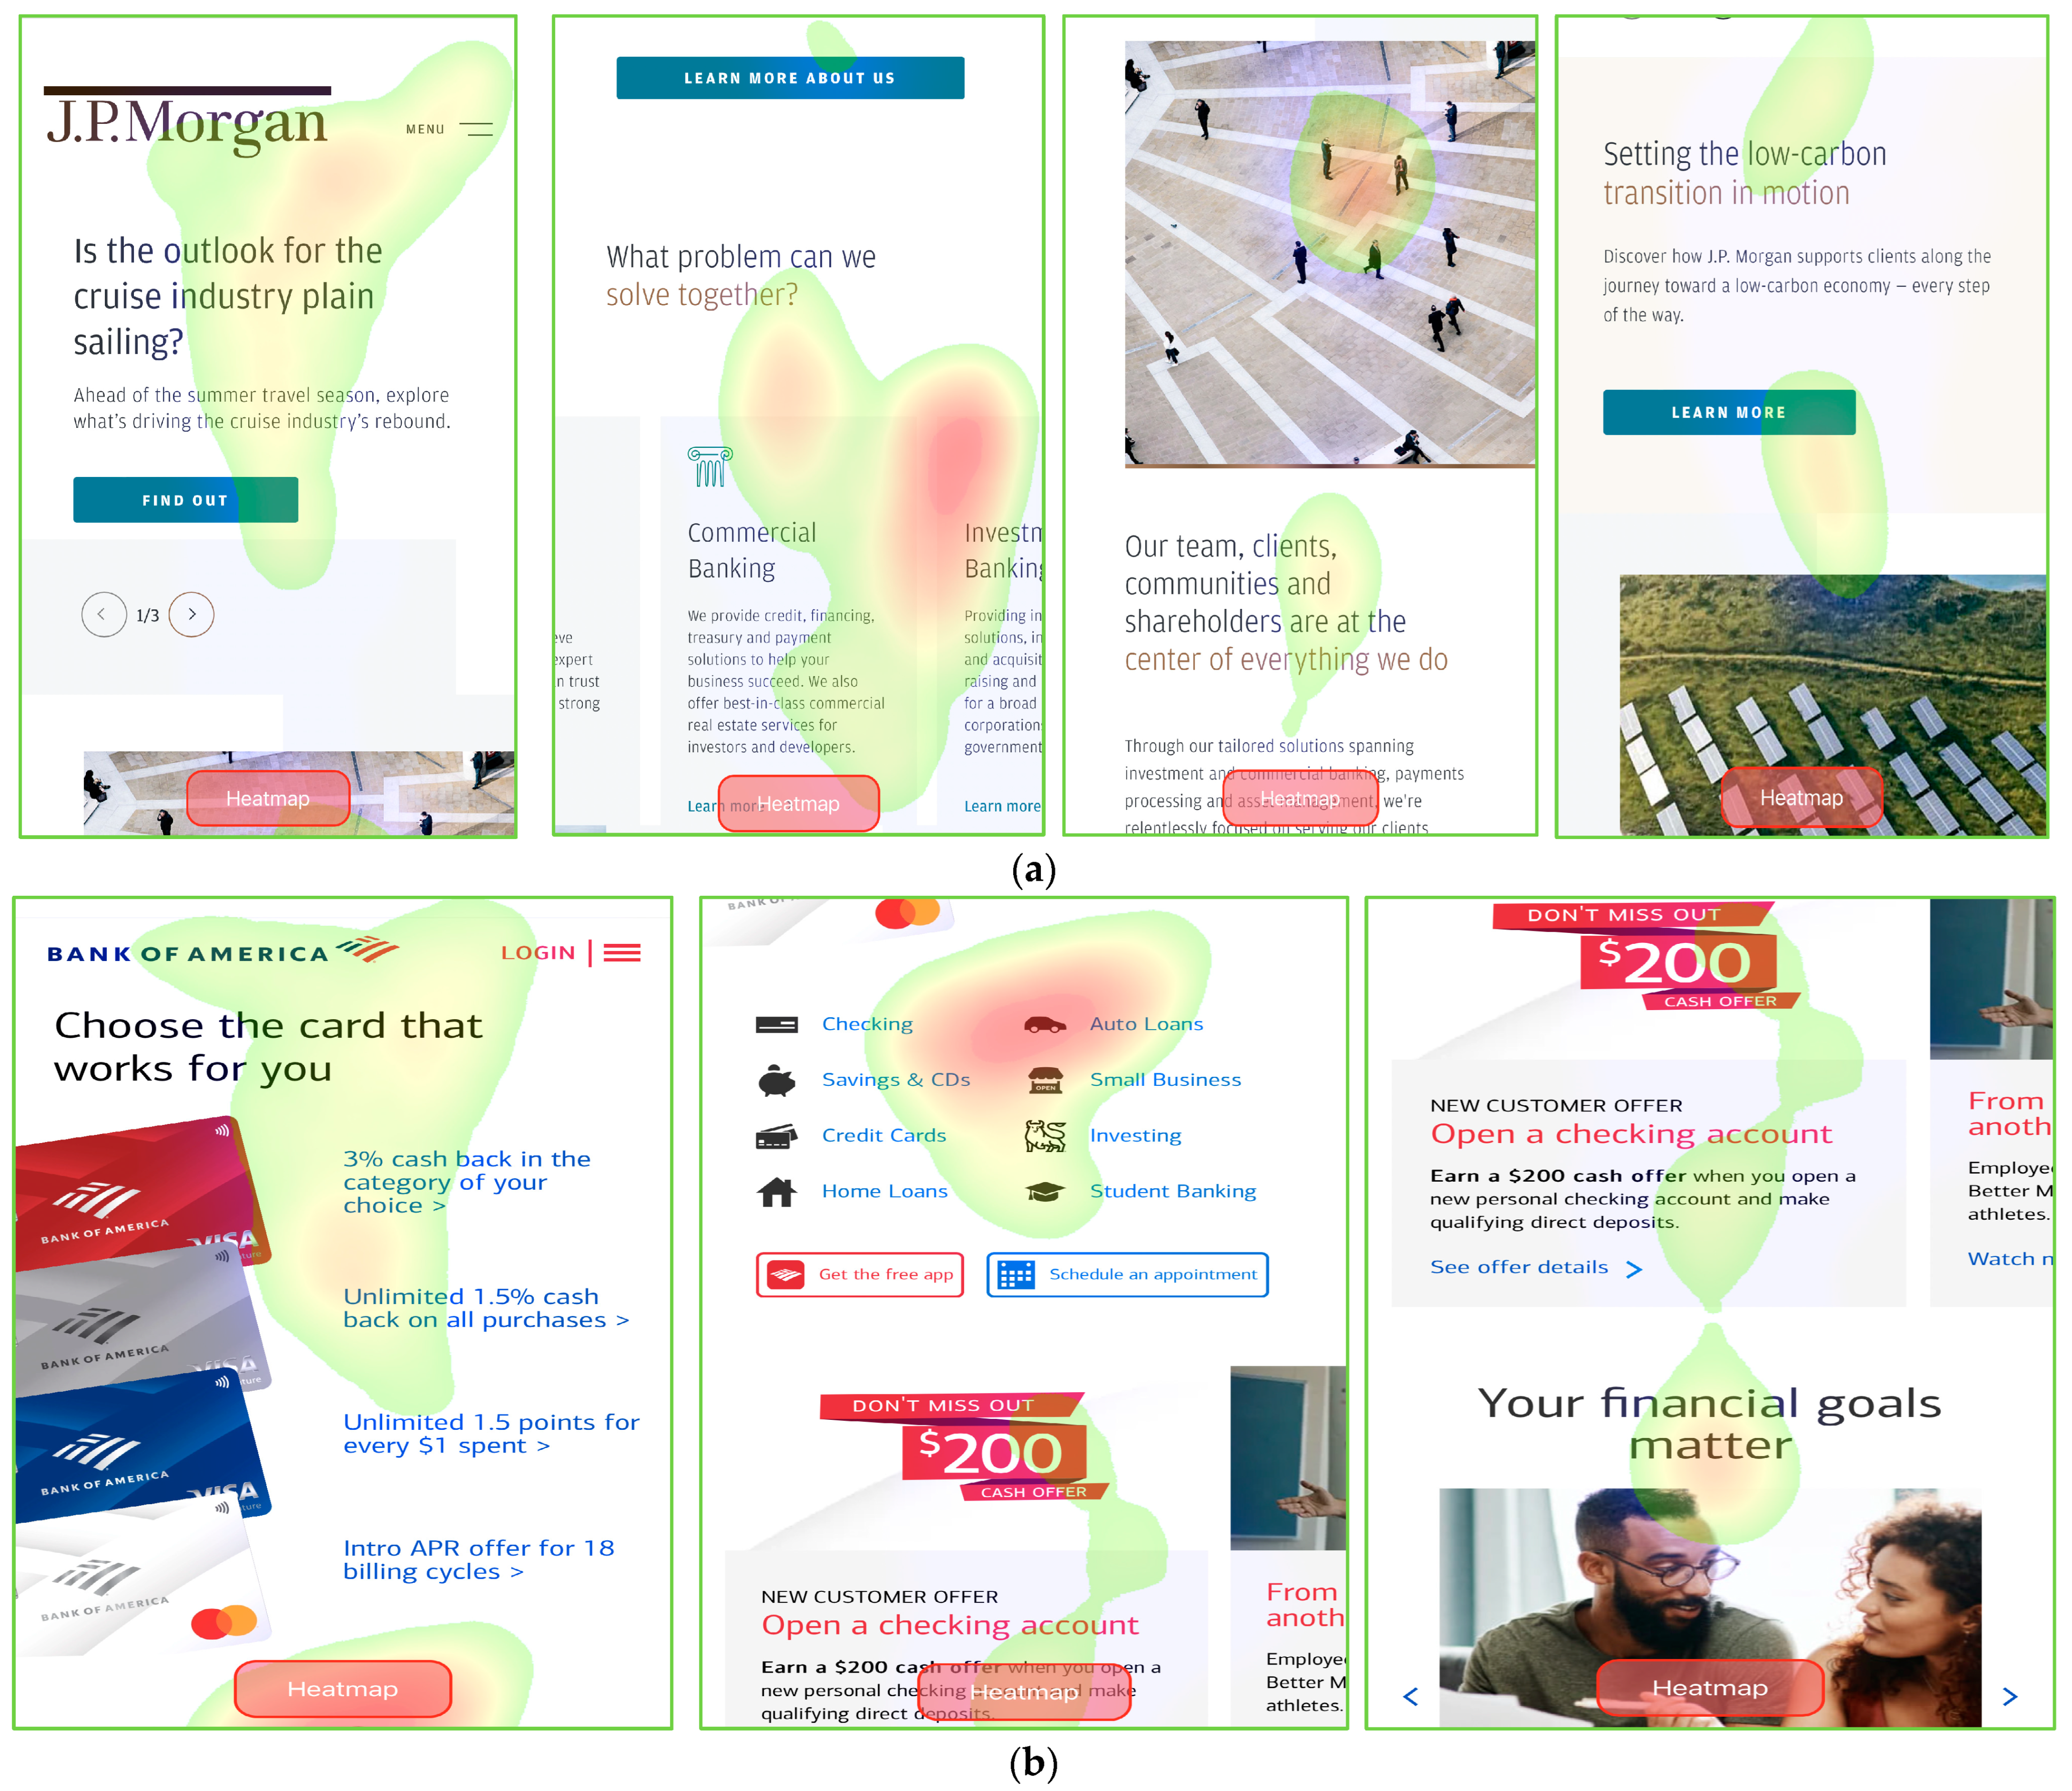
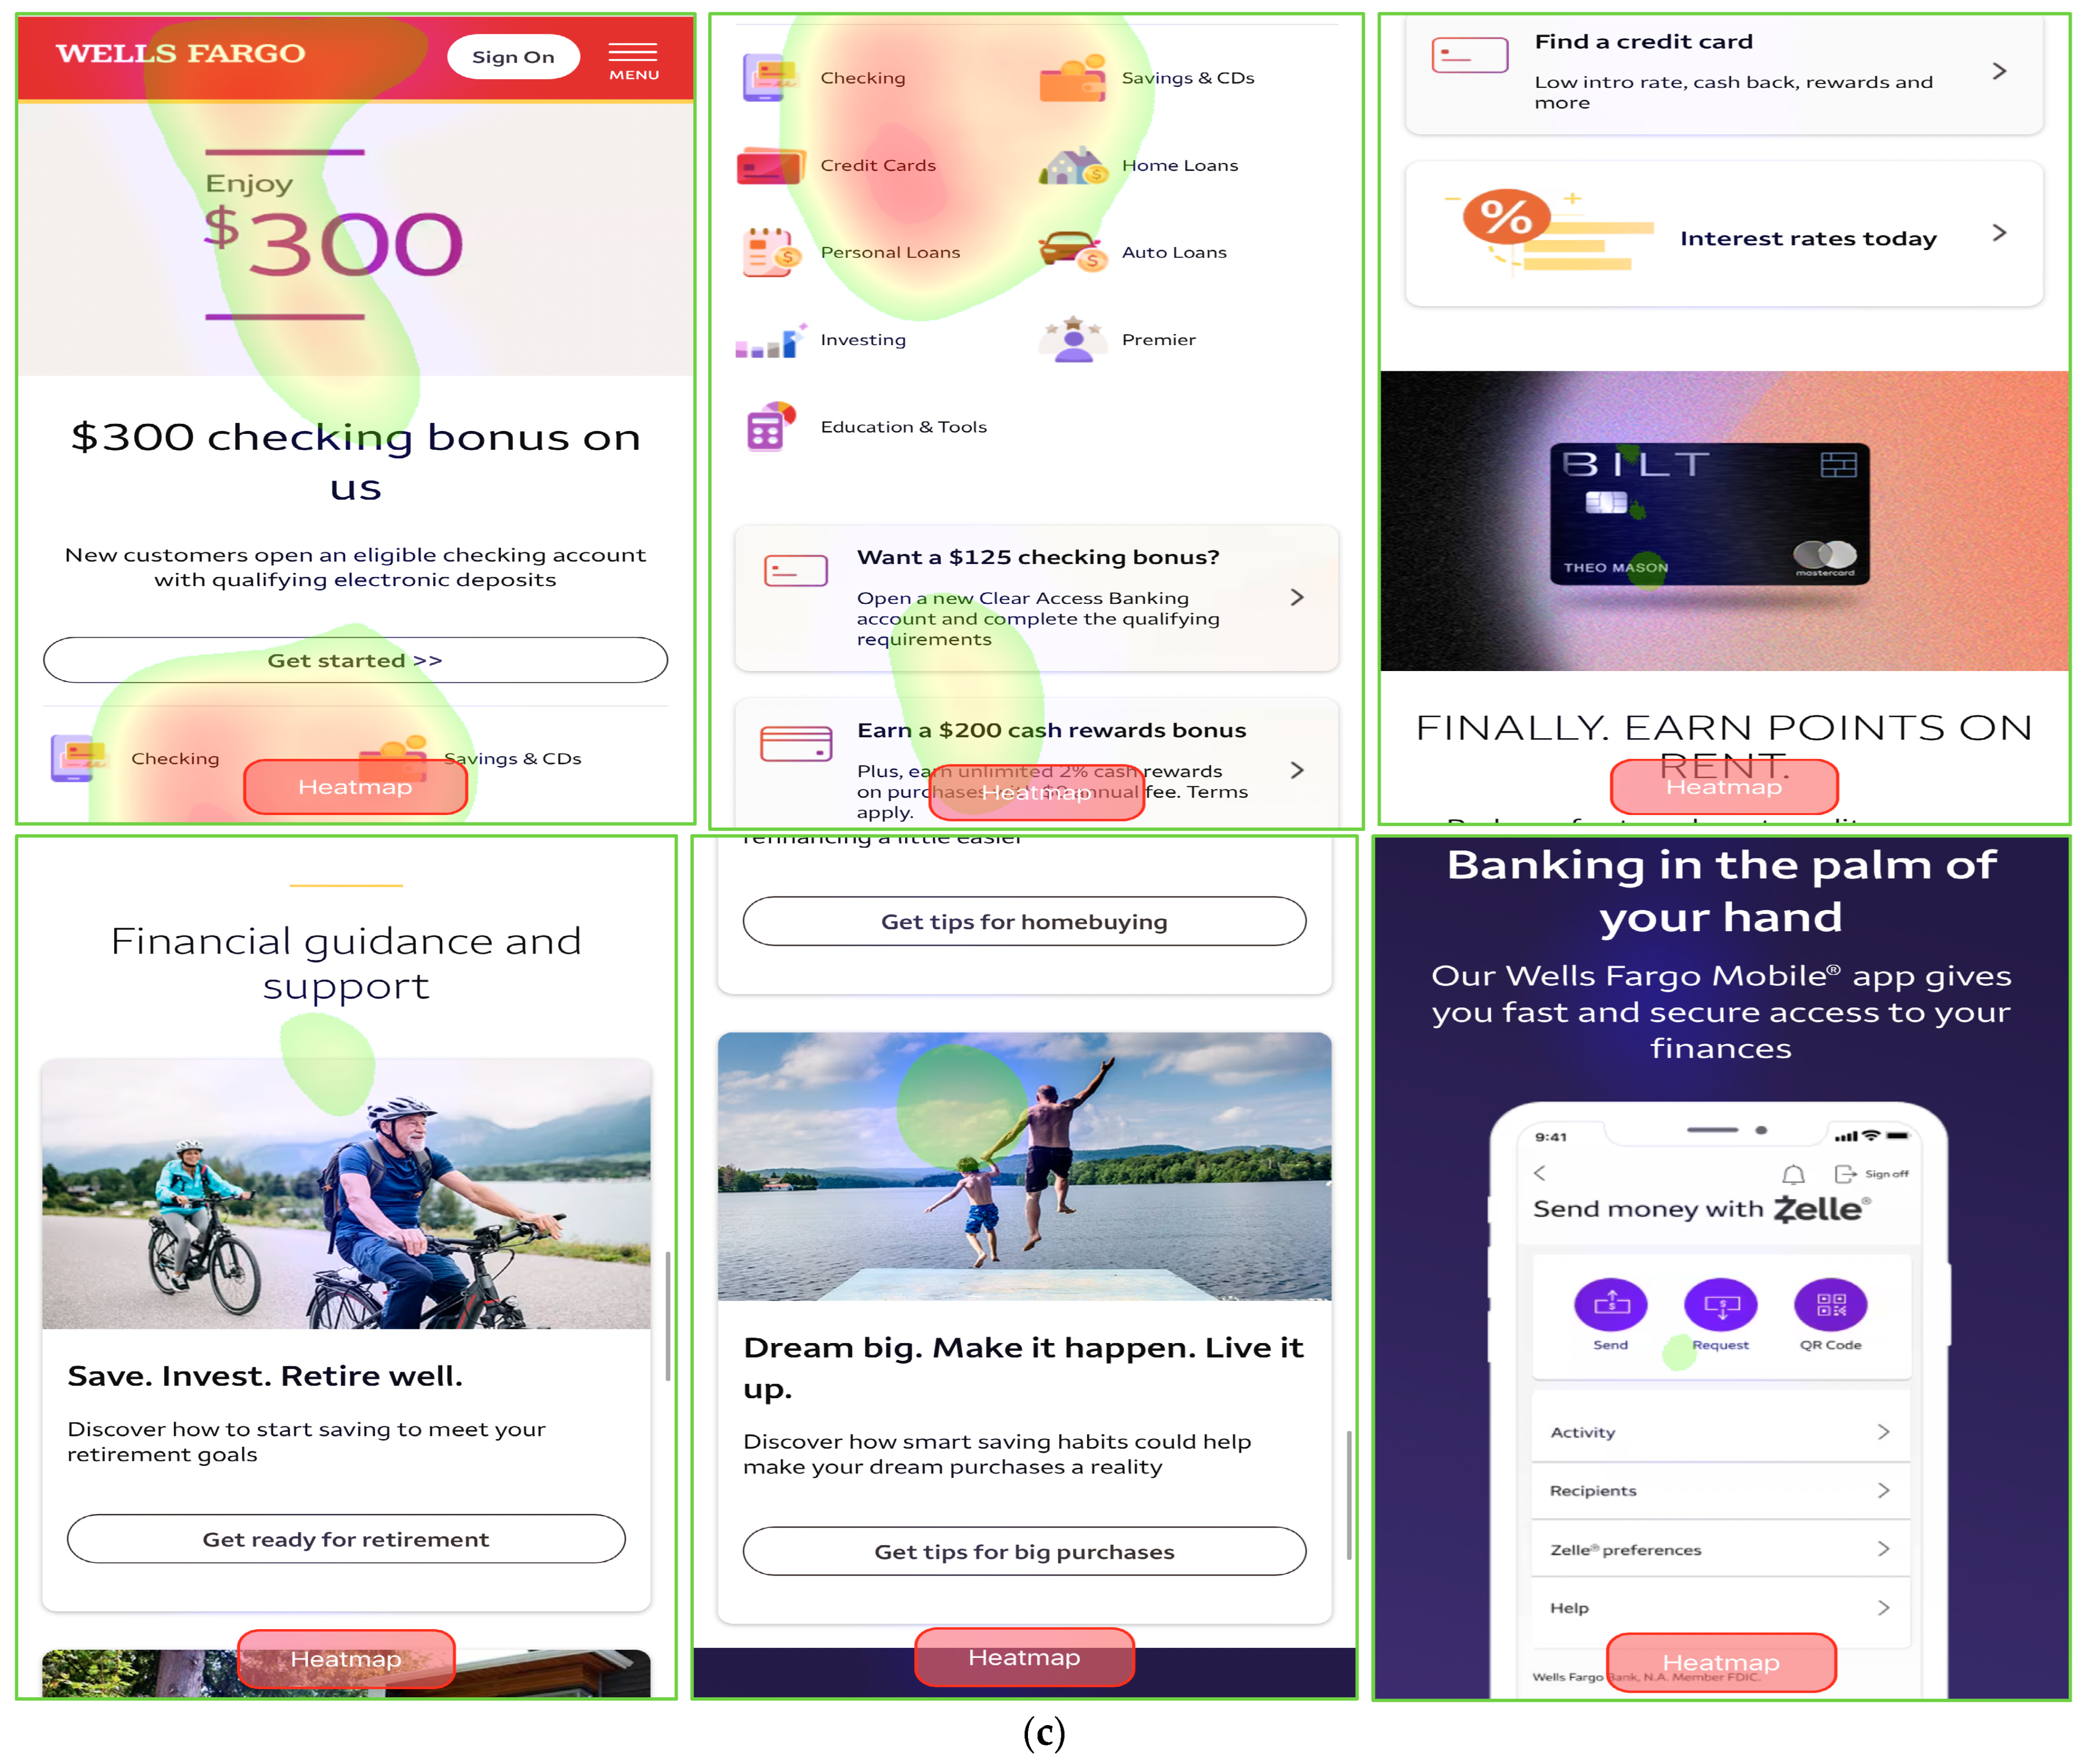
  • The final stage included a neuromarketing approach to gain deeper insights from 26 participants who viewed the websites of the selected banking firms. They were instructed to search and observe, in 20 s, the selected banking firm websites and their provided financial products and services. Eye-tracking and heatmap analysis were conducted using the SeeSo Web Analysis platform (Eyedid SDK) [63]. This method seeks to extract additional information about the onsite activity and engagement of the participants from the qualitative methodological concept.

3.2. Fuzzy Cognitive Mapping (FCM) Framework

In this section, the authors illustrate the relationships among the study’s variables using Fuzzy Cognitive Mapping (FCM). This method is highlighted for its effectiveness in demonstrating these connections. A clearer understanding is achieved by presenting the relationships between the variables, particularly regarding the link between banking firms’ website interface efficiency variables and their customer behavioral analytical data. The authors employed MentalModeler [64] to develop a conceptual model of the paper’s variables, as shown in Figure 1. This FCM model helps extract key insights from the relationships between variables. FCM effectively represents the static relationships and interconnections of the model’s variables [65]. Additionally, FCM has been successfully applied in solving various decision-making problems across different fields [66].

3.3. Research Sample

The development of the present study was based on the exploitation of big data analytics from the websites of the sample firms, as well as the qualitative data obtained from the 26 participants who observed these webpages. As referred to in the Methodological Concept Section, this study focuses on analyzing banking firms’ website interfaces, and thus, the 5 biggest and most established bank institutes were selected, based on their market capitalization (as of January 2024) [67]. Therefore, the biggest banking firms included in this research are (a) JPMorgan Chase, (b) the Bank of America, (c) the Industrial and Commercial Bank of China Limited, (d) Wells Fargo, and (e) the Agricultural Bank of China. The gathered data consist of various website analytical data originating from the visitors’ and customers’ onsite behaviors, while the collection period ran from 1 August 2023 to 29 February 2024. The Decision Support System (DSS) utilized to extract these data was the Semrush platform [61].
Concerning the qualitative part of the study, the authors selected 26 participants who were related to banking services provided through websites to perform the neuromarketing test. The authors selected 26 participants who were well aware of the financial services in the banking sector, and they were instructed to observe, for 1 min, the main webpage of the above banking firms. This test aimed to examine whether banking firm website customer behaviors can provide valuable insights into the performance and interface of the webpage by indicating potential areas of focus (on the webpage) or parts that do not create any engagement with the observer/visitor. For this test, the SeeSo Web Analysis platform (Eyedid SDK) [63] was utilized, and the combined heatmaps and gaze data were compiled into consolidated figures, as illustrated in Section 4.3.

4. Results

4.1. Statistical Analysis

A crucial part of the study’s research is the extraction of the variables’ relationships; thus, the authors began by performing a descriptive statistical analysis (Table 1). The statistical measures of mean, max, min, std. deviation, skewness, and kurtosis were selected. The latter two measures (skewness and kurtosis) are some of the variables’ normality indicators when their values are between −2, and 2. Then, the variables’ correlations, based on Pearson’s statistic, were produced to explore the variables’ connection, as shown in Table 2 below.
In this stage, the simple linear regressions (SLRs) of the dependent variables of the study (purchase conversion, display ads, organic traffic, and bounce rate) were developed to estimate the impact of the independent variables (organic keywords, organic traffic costs, paid keywords, paid traffic costs, email sources, visit duration, pages per visit, and new and returning visitors) of banking firms’ website visitor data. The first SLR model (Table 3) with purchase conversion as a dependent variable was verified overall, with a p-value < a = 0.01 level of significance and an R2 = 1.000. The independent variables with the most significant impact were organic traffic costs, paid traffic costs, referral domains, and email sources (p-values < a = 0.01 level of significance). For every 1% of the increase in organic traffic costs, paid traffic costs, referral domains, and email sources, banking firms’ purchase conversions vary by −167.0%, −136.9%, 169.6%, and 16.7%, respectively.
In Table 4, where the SLR model of banking firms’ display ads is presented, this is verified overall with a p-value < a = 0.01 level of significance and an R2 = 1.000. The independent variables with the most significant impact (p-values < a = 0.01 level of significance) on display ads were the paid traffic costs, referral domains, and email sources. When paid traffic costs, referral domains, and email sources increase by 1%, banking firms’ organic traffic variates by 19.8%, −6.5%, and −13.5%, respectively. Moving on to the SLR model of banking firms’ organic traffic (Table 5), this regression is verified overall with a p-value < a = 0.01 level of significance and an R2 = 1.000. The independent variables with the most significant impact (p-values < a = 0.01 level of significance) on organic traffic were also the paid traffic costs, referral domains, email sources, and display ads. For every 1% increase in paid traffic costs, referral domains, and email sources, organic traffic varied by −2.4%, −31.9%, and 4.1%, respectively.
Finally, in Table 6, the SLR model of banking firms’ bounce rate is presented. This model was also verified overall with a p-value < a = 0.01 level of significance and an R2 = 1.000. The independent variables with the most significant impact (p-values < a = 0.01 level of significance) on bounce rate were the same as for the purchase conversion model (organic traffic costs, paid traffic costs, referral domains, and email sources). For every 1% increase in organic traffic costs, paid traffic costs, referral domains, and email sources, the bounce rate varied by 104.5%, 2.5%, 33.4%, and −4.3%, respectively.

4.2. Simulation Model

To further study the connection between key website performance metrics and the behavior of banking firms’ digital customers, the utilization of a hybrid model (HM) was discerned. This model extends to the agent-based modeling (ABM) and the System Dynamics (SD). The use of ABM and SD models to investigate social and ecological issues and improve decision-making has been explored by Nugroho and Uehara [68]. McGarraghy et al. [69] applied these models to assess the impact of policies on decision-making in food value chains. Similarly, Wang et al. [70] utilized ABM and SD analyses to study the reduction in carbon dioxide emissions from urban transportation. Additionally, Nguyen et al. [71] employed a hybrid conceptual model combining ABM and SD to examine the control of COVID-19 spread in care homes.
The execution of the hybrid model simulation, which refers to a 360-day model time, starts from the statechart of potential banking customers (Figure 2). Then, based on the statistical results from the collected data, the agents move either to the new visitor statechart or the returning visitor one. The bounce rate statechart leads the visitors/agents back to the first one or to either the organic or paid traffic statechart, based on their means of entering the banking firm website the first time (organic or paid search/keywords). From there, the remaining agents move to the display ads statechart or head back to the initial statechart (potential banking firms’ customers). Finally, these agents move to the purchase conversion statechart, after this has been affected by the banking firms’ display advertising. Throughout each of the 10,000 agents mobilized, the values of the dynamic variables of email sources, referral domains, and organic and paid costs are calculated using the normal distribution of the sample’s variables. During the simulation process, the behavioral data of customers (including bounce rate, pages per visit, and time spent on site) are calculated for each of the 10,000 agents, using the normal distribution. The main commands and the Java route are outlined in Table A1 (Appendix A).
Through the development of the hybrid model simulation, the course of the banking firms’ digital marketing performance metrics (organic traffic, purchase conversion, bounce rate, and display ads) is presented, across the trajectory of their website visitor/agent behavioral metrics. From the simulation, as seen in Figure 3, the following variables relationships arose: (a) banking firms’ purchase conversion is positively impacted by email sources, paid costs, and referral domains but negatively affected by organic costs; (b) website bounce rate is positively impacted by email sources, paid costs, and referral domains but negatively affected by organic costs; (c) organic traffic is positively impacted by organic costs, email sources, and referral domains but negatively affected by paid costs; and (d) display ads are positively impacted by organic costs, paid costs, and referral domains but negatively affected by email sources.

4.3. Neuromarketing Applications

After having analyzed the variation in the study’s variables through the hybrid modeling process, the need for a differentiated method arises. Since quantitative analysis offers valuable insights into customer behavior by identifying patterns, trends, and correlations, it alone is often deemed insufficient for a thorough understanding. It may not sufficiently explore the motivations, emotions, or underlying reasons behind customer actions. Qualitative methods are better equipped to delve into these aspects. To achieve a more comprehensive and actionable comprehension of customer behavior, many researchers and marketers advocate combining both quantitative and qualitative approaches. This fusion enables a more nuanced interpretation of data, a deeper grasp of the customer’s viewpoint, and a more effective means of addressing the complexities of human behavior.
Much neuromarketing research has been deployed to examine the implications of customer behavior on various products and services, with remarkable outcomes. Ezquerra et al. [72] studied student emotions, engagement, and attention in science activities using Facial Emotion Recognition (FER) tools by iMotions; meanwhile, Chen et al. [73] capitalized on both Galvanic Skin Response (GSR) and VR products to examine pupil responses to analyze the emotional and attentional activity of humans. Moreover, to extract valuable insights regarding people’s arithmetic and memory evaluation, Muke et al. [74] used iMotions biometric platform and eye-tracking equipment. This same eye-tracking tool was utilized by Amiri et al. [75] to gather gazes and facial expressions of clients to assess the feedback on and evaluations of the purchased goods and services.
Therefore, by utilizing these neuromarketing tools (eye-tracking, heatmaps, and scan paths) of the SeeSo Web Analysis platform (Eyedid SDK) [63], several insights regarding banking firms’ website interfaces and their visitor/customer behavior arise. From Figure 4, it can be discerned that banking firm websites with longer webpages, which need more time for visitors to scroll and observe all the data, had less continuous fixations and shorter fixation times (during the 20 s of observation), than those with a shorter webpage (and a longer fixation time). Moreover, the websites with a longer webpage had a greater number of fixations (fixations count) and a greater number of gazes (gazes count) on average. From the heatmap analysis of the banking firm websites (Figure 5), we can see that the participants, in all the included websites, intensely observed (increased heatmap intensity) their menus, the information that refers to their financial products/services (loans, savings, cards, etc.), their logos (brands), while also observing and interacting with their display ads. Finally, from the scan-path analysis (Figure 6), we can discern that the results of the heatmap analysis are also confirmed from the participants’ scan path, and on average, their path began with observing the banking firm’s brand (logo) followed by their menu options, information regarding their financial products and services, and their display ads, and then attention faded through the last parts of the webpage.

5. Discussion

The purpose of this study has been to examine the impact of website visitors’ behaviors on banking firms’ website interfaces and the firms’ overall digital marketing performance. To achieve this objective, the variables of purchase conversion, bounce rate, organic traffic, and display ads as website interfaces and digital marketing performance metrics. The selected website behavioral metrics were the email source traffic, organic and paid costs, and referral domains. Statistical analyses (correlation and SLR models), hybrid model simulations (ABM and SD), and neuromarketing tests (eye-tracking) were deployed to extract the required insights.
From the produced simple linear regression models (SLR) executed in Section 4.1, it was discerned that all of the applied models were found to be verified overall (p-values < a = 0.01 level of significance). Therefore, hypotheses H1 to H4 were verified, meaning that the digital marketing analytics of banking firms significantly impact their website customers’ purchase conversion, as well as the amount of display ads, organic visibility, and bounce rates on their websites. More specifically, the digital marketing analytics that were found to have a strong effect on the dependent variables (purchase conversion, display ads, organic visibility, and bounce rate) were the website organic traffic costs, paid traffic costs, referral domains, and email sources. It was discerned that purchase conversion was negatively connected with banking firms’ website organic traffic costs and paid traffic costs while positively connected with their referral domains and email sources. The amount of referral domains was also negatively connected with banking firms’ paid traffic costs and referral domains and positively connected with the bounce rate. Paid traffic costs were found to be positively connected with display ads and bounce rates and negatively connected with organic traffic. Email sources appear to negatively impact banking firms’ website display ads and bounce rates and positively impact their organic traffic.
Regarding the simulation of the hybrid (ABM and SD) model, its outputs verify the results of SLR models and, therefore, the research hypotheses H1–H4. More specifically, through the 360-day simulation and the usage of 10,000 agents/website visitors, banking firms’ email source traffic increases purchase conversion, bounce rate, and organic traffic [76] and decreases their display ads while the number of referral domains increases all of the above (conversion rate, bounce rate, organic traffic, and display ads) [77]. Organic traffic costs appear to decrease banking firms’ purchase conversion and bounce rate and to increase organic traffic and display ads while paid traffic costs increase conversion rate, bounce rate, and display ads and decrease organic traffic [78].
Our research outputs mainly align with present studies in the field of digital banking and customer behavior and engagement. Mbama and Ezepue [27] identified service quality, functional quality, perceived value, employee–customer engagement, perceived usability, and perceived risk as the primary factors influencing customer experience in digital banking. They found a significant relationship between customer experience, satisfaction, loyalty, and financial performance. According to Islam et al. [29], key website attributes such as interactivity, aesthetics, customization, ease of use, and telepresence positively impact customer engagement. Their findings also indicate that customer engagement is positively associated with customer trust and retention. Hari et al. [79] found that interactivity, particularly through chatbots, enhances customer brand engagement, which in turn boosts satisfaction with the brand experience and increases customer intentions to use the brand.
When it comes to the neuromarketing model, the 26 participants who are related to banking firms’ services/products showed valuable insights. The application of neuromarketing tools, including eye-tracking, heatmaps, and scan-path analysis, provided critical insights into how visitors interact with banking firm websites, offering substantial implications for interface and performance enhancement. The study revealed that websites with longer pages, requiring more time for visitors to scroll, resulted in fewer continuous fixations and shorter fixation times compared to shorter pages, which held visitor attention longer. Despite this, longer pages had a higher number of total fixations and gazes, suggesting a more fragmented but extensive interaction with the content. Heatmap analysis demonstrated that participants consistently focused on menus, product information, logos, and display ads, indicating these elements are crucial for user engagement. Scan-path analysis confirmed these findings, showing that users typically begin their navigation with the brand logo, followed by menu options, product information, and display ads, with attention diminishing towards the end of the page. These insights directly address the second research question (RQ2), by highlighting that customer behavior can indeed enhance the website interface. By understanding these behavioral patterns, banking firms can optimize their website design to improve user engagement, satisfaction, and overall performance, confirming that customer behavior analysis is vital for enhancing website interfaces.

6. Conclusions

6.1. Theoretical, Practical, and Managerial Implications

In this part of the study, the main theoretical and practical implications for the research findings are presented and analyzed. This paper examined the implication of big data analysis (website analytic metrics) and neuromarketing models in improving banking firms’ website interfaces and performance. The results of the research extend to customer engagement and digital marketing analytic metrics since website visitor behavior is depicted by specific onsite behavioral KPIs. Moreover, the utilization of both quantitative (big data) and qualitative (neuromarketing test) analyses tends to provide a strong approach to the research by ensuring the transparency and reproducibility of the results and attempting to cover a major part of the banking firms’ website customer behavior.
The integration of neuromarketing and big data analysis offers significant theoretical implications for enhancing banking firms’ website interfaces and overall performance. The application of simple linear regression models (SLR) demonstrates that digital marketing analytics profoundly impact customer behaviors, such as the purchase of conversion rates, the display of ad interactions, organic visibility, and bounce rates. Specifically, factors like organic traffic costs, paid traffic costs, referral domains, and email sources were identified as critical determinants [80]. These findings underscore the need for a theoretical framework that encompasses both traditional marketing metrics and cognitive–behavioral insights from neuromarketing to better understand and predict consumer behavior on banking websites.
From a practical standpoint, the insights derived from neuromarketing tools like eye-tracking, heatmaps, and scan-path analysis can significantly improve website design and functionality. For instance, the study revealed that websites with shorter pages had longer fixation times, indicating that concise and focused content is more engaging for users. Additionally, heatmap analysis highlighted areas of intense user interest, such as menus, product information, and brand logos. By strategically placing critical information and interactive elements in these high-engagement zones, banking firms can enhance user experience, reduce bounce rates, and potentially increase conversion rates [81]. These practical adjustments, informed by empirical data, can lead to more effective and user-friendly website designs.
Neuromarketing insights also offer valuable strategies for boosting customer engagement. The study’s findings suggest that email source traffic and referral domains play pivotal roles in increasing purchase conversion and organic traffic [82]. By leveraging these channels more effectively, banking firms can create more personalized and targeted marketing campaigns that resonate with their audience. Moreover, the use of neuromarketing tools to track eye movements and fixation patterns can help identify which elements of a webpage capture the most attention. This information can be used to optimize content placement and design features, ensuring that users engage more deeply with the site and its offerings, thus fostering greater customer loyalty and trust.
The integration of neuromarketing and big data analytics presents substantial managerial implications for banking firms aiming to enhance their website interfaces and overall digital performance. The study’s findings suggest that strategically utilizing digital marketing analytics, such as organic and paid traffic costs, referral domains, and email sources, can significantly influence key metrics like purchase conversion rates, display ad interactions, organic visibility, and bounce rates. By applying insights from neuromarketing tools, such as eye-tracking and heatmap analysis, banks can optimize website design to maintain user attention, strategically place critical information in high-engagement zones, and create more personalized marketing campaigns. This dual approach not only enhances user experience and reduces bounce rates but also increases customer loyalty and trust, ultimately driving higher conversion rates and improving overall performance.
Our study’s findings are aligned with present research in the field of banking firms’ website performance and interface enhancement. As referenced by Müller et al. [83], a firm’s performance in technology-intensive sectors is strongly connected to the utilization of big data analysis. By analyzing big data from a website’s user activity, banking firms can have multiple benefits, such as stock market prediction, etc. [84]. Furthermore, big data can also assist the digital marketing efforts of firms and increase their knowledge of the market [85]; meanwhile, Ravi and Kamaruddin [86] stated that big data could aid in solving multiple banking firms’ problems to enhance their overall performance.
For the utilization of neuromarketing applications, this study is aligned with other relevant research in the field. More specifically, Berčík et al. [48] noted that the implications of neuromarketing models tend to reveal detailed information about customers’ behavior that can be used in digital marketing management and communication promotion. In accordance with Tichindelean et al.’s [87] study, we showed that the design of the webpages of banking firms has a great impact on webpage usability, customer engagement, and, thus, the website interface. Customers’ behaviors are linked to their reaction to advertising processes [88] and show ways of enhancing their engagement. Since neuromarketing tools help marketers understand their customer’s behavior [89], banking firms’ customers were found to have a greater engagement with the brand if they were familiar with their services/products [90].

6.2. Future Work and Limitations

Future research should consider expanding the scope beyond YouTube metrics to include a broader range of digital marketing channels and qualitative methods. Longitudinal studies and experimental designs could provide deeper insights into the long-term effects of specific marketing strategies and the impact of demographic factors on user engagement. Additionally, exploring the synergies between different digital marketing activities, such as social media marketing and influencer partnerships, could offer a more holistic understanding of digital marketing effectiveness. By continuously refining methodologies and utilizing new tools and technologies, researchers and practitioners can better navigate the evolving landscape of digital marketing in the DeFi sector and beyond.
The study’s focus on specific YouTube metrics and web analytics may limit the generalizability of its findings to other contexts or platforms within the DeFi ecosystem. Variations in platform features, user demographics, and market dynamics could affect the relevance of the insights. Additionally, the reliance on quantitative methods might overlook qualitative aspects of digital marketing effectiveness that cannot be captured solely through numerical data. The exclusive focus on YouTube metrics may ignore the impact of other digital marketing channels or strategies on the performance of DeFi platforms. Moreover, the study’s methodology might not fully account for the continuous improvements in Google’s algorithms, which could influence website and YouTube rankings over time.

Author Contributions

Conceptualization, N.T.G., D.P.S. and S.P.M.; methodology, N.T.G., D.P.S. and S.P.M.; software, N.T.G., D.P.S. and S.P.M.; validation, N.T.G., D.P.S. and S.P.M.; formal analysis, N.T.G., D.P.S. and S.P.M.; investigation, N.T.G., D.P.S. and S.P.M.; resources, N.T.G., D.P.S. and S.P.M.; data curation, N.T.G., D.P.S. and S.P.M.; writing—original draft preparation, N.T.G., D.P.S. and S.P.M.; writing—review and editing, N.T.G., D.P.S. and S.P.M.; visualization, N.T.G., D.P.S. and S.P.M.; supervision, N.T.G., D.P.S. and S.P.M.; project administration, N.T.G., D.P.S. and S.P.M.; funding acquisition, N.T.G., D.P.S. and S.P.M. All authors have read and agreed to the published version of the manuscript.

Funding

This research received no external funding.

Data Availability Statement

The original contributions presented in the study are included in the article, further inquiries can be directed to the corresponding author.

Conflicts of Interest

The authors declare no conflicts of interest.

Appendix A

Table A1. Java code for banking firms’ modeling simulation.
Java Code of AnyLogic Simulation
@AnyLogicInternalCodegenAPI
 private void enterState(statechart_state self, boolean_destination) {
  switch( self ) {
   case Potential_Bank_Customers:
     logToDBEnterState(statechart, self);
    // (Simple state (not composite))
    statechart.setActiveState_xjal(Potential_Bank_Customers);
    transition1.start();
    transition2.start();
    return;
   case Return_Visitors:
     logToDBEnterState(statechart, self);
    // (Simple state (not composite))
    statechart.setActiveState_xjal(Return_Visitors);
    {
return_Visitors++;

pages_per_Visit = normal(0.97, 3.43);

visit_Duration = normal(128.25/60, 519.40/60);

referral_Domains = normal(794.22, 51,181.91);

email_Sources = normal(300,170.77, 184,876.14)
;}
    transition3.start();
    transition5.start();
    return;
   case Bounce_Rate:
     logToDBEnterState(statechart, self);
    // (Simple state (not composite))
    statechart.setActiveState_xjal(Bounce_Rate);
    {
bounce_Rate = organic_Traffic*(1.045) + paid_Costs*(0.025) + referral_Domains*(0.334) + email_Sources*(−0.043)
;}
    transition.start();
    return;
   case Visitors_To_Traffic:
     logToDBEnterState(statechart, self);
    // (Simple state (not composite))
    statechart.setActiveState_xjal(Visitors_To_Traffic);
    transition7.start();
    transition8.start();
    return;
   case Organic_Traffic:
     logToDBEnterState(statechart, self);
    // (Simple state (not composite))
    statechart.setActiveState_xjal(Organic_Traffic);
    {
organic_Costs = normal(5,822,486.64, 37,155,781.98);

organic_Traffic = paid_Costs*(−0.024) + referral_Domains*(−0.319) + email_Sources*(0.041)
;}
    transition13.start();
    return;
   case Display_Ads:
     logToDBEnterState(statechart, self);
    // (Simple state (not composite))
    statechart.setActiveState_xjal(Display_Ads);
    {
display_Ads = paid_Costs*(0.198) + referral_Domains*(−0.065) + email_Sources*(−0.135)
;}
    transition10.start();
    transition11.start();
    return;
   case Purchase_Convertion:
     logToDBEnterState(statechart, self);
    // (Simple state (not composite))
    statechart.setActiveState_xjal(Purchase_Convertion);
    {
purchase_Convertion = organic_Costs*(−1.670) + paid_Costs*(−1.369) + referral_Domains*(1.696) + email_Sources*(0.167)
;}
    transition9.start();
    return;
   case Paid_Traffic:
     logToDBEnterState(statechart, self);
    // (Simple state (not composite))
    statechart.setActiveState_xjal(Paid_Traffic);
    {
paid_Costs = normal(406,005.96, 1,514,463.27);

paid_Traffic = normal(666.9666, 3378.9857)
;}
    transition14.start();
    return;
   case New_Visitors:
     logToDBEnterState(statechart, self);
    // (Simple state (not composite))
    statechart.setActiveState_xjal(New_Visitors);
    {
new_Visitors++;

pages_per_Visit = normal(0.97, 3.43);

visit_Duration = normal(128.25/60, 519.40/60);

referral_Domains = normal(794.22, 51,181.91);

email_Sources = normal(300,170.77, 184,876.14)
;}
    transition4.start();
    transition6.start();
    return;
   default:
    return;
  }
 }

References

  1. Hennig-Thurau, T.; Malthouse, E.C.; Friege, C.; Gensler, S.; Lobschat, L.; Rangaswamy, A.; Skiera, B. The impact of new media on customer relationships. J. Serv. Res. 2010, 13, 311–330. [Google Scholar] [CrossRef]
  2. Broby, D. Financial technology and the future of banking. Financ. Innov. 2021, 7, 1–19. [Google Scholar] [CrossRef]
  3. Ding, Q.; He, W. Digital transformation, monetary policy and risk-taking of banks. Financ. Res. Lett. 2023, 55, 103986. [Google Scholar] [CrossRef]
  4. Shukla, S. Analyzing customer engagement through e-CRM: The role of relationship marketing in the era of digital banking in Varanasi banks. J. Commer. Econ. Comput. Sci. 2021, 7, 57–65. [Google Scholar]
  5. Hendriyani, C.; Raharja, S.J. Analysis building customer engagement through eCRM in the era of digital banking in Indonesia. Int. J. Econ. Policy Emerg. Econ. 2018, 11, 479–486. [Google Scholar]
  6. Vivek, S.D.; Beatty, S.E.; Morgan, R.M. Customer engagement: Exploring customer relationships beyond purchase. J. Mark. Theory Pract. 2012, 20, 122–146. [Google Scholar] [CrossRef]
  7. Lee, D.; Hosanagar, K.; Nair, H.S. Advertising content and consumer engagement on social media: Evidence from Facebook. Manag. Sci. 2018, 64, 5105–5131. [Google Scholar] [CrossRef]
  8. Lin, K.-Y.; Lu, H.-P. Why people use social networking sites: An empirical study integrating network externalities and motivation theory. Comput. Hum. Behav. 2011, 27, 1152–1161. [Google Scholar] [CrossRef]
  9. Lee, M.; Wang, Y.R.; Huang, C.F. Design and development of a friendly user interface for building construction traceability system. Microsyst. Technol. 2021, 27, 1773–1785. [Google Scholar] [CrossRef]
  10. Faghih, B.; Azadehfar, M.; Katebi, S. User interface design for E-learning software. Int. J. Soft Comput. Softw. Eng. 2014, 3, 786–794. [Google Scholar] [CrossRef]
  11. Cheng, S.; Yang, Y.; Xiu, L.; Yu, G. Effects of prior experience on the user experience of news aggregation app’s features—Evidence from a behavioral experiment. Int. J. Hum.-Comput. Interact. 2022, 39, 1271–1279. [Google Scholar] [CrossRef]
  12. Nielsen, J.; Norman, D. The Definition of User Experience (UX); Nielsen Norman Group N N/g.: Fremont, CA, USA, 2018; Available online: https://www.nngroup.com/articles/definition-user-experience/ (accessed on 20 June 2024).
  13. He, W.; Hung, J.-L.; Liu, L. Impact of big data analytics on banking: A case study. J. Enterp. Inf. Manag. 2023, 36, 459–479. [Google Scholar] [CrossRef]
  14. Kalaganis, F.P.; Georgiadis, K.; Oikonomou, V.P.; Laskaris, N.A.; Nikolopoulos, S.; Kompatsiaris, I. Unlocking the Subconscious Consumer Bias: A Survey on the Past, Present, and Future of Hybrid EEG Schemes in Neuromarketing. Front. Neuroergonomics 2021, 2, 672982. [Google Scholar] [CrossRef]
  15. Walker, P.R. How Does Website Design in the e-Banking Sector Affect Customer Attitudes and Behaviour? Ph.D. Thesis, University of Northumbria, Newcastle upon Tyne, UK, 2021. Available online: https://nrl.northumbria.ac.uk/id/eprint/5849/7/walker.philip_phd_(VOLUME_1of2).pdf (accessed on 12 June 2024).
  16. Manser Payne, E.H.; Peltier, J.; Barger, V.A. Enhancing the value co-creation process: Artificial intelligence and mobile banking service platforms. J. Res. Interact. Mark. 2021, 15, 68–85. [Google Scholar] [CrossRef]
  17. Diener, F.; Špacek, M. Digital transformation in banking: A managerial perspective on barriers to change. Sustainability 2021, 13, 2032. [Google Scholar] [CrossRef]
  18. Khattak, M.A.; Ali, M.; Azmi, W.; Rizvi, S.A.R. Digital transformation, diversification and stability: What do we know about banks? Econ. Anal. Policy 2023, 78, 122–132. [Google Scholar] [CrossRef]
  19. Giannakis-Bompolis, C.; Boutsouki, C. Customer Relationship Management in the Era of Social Web and Social Customer: An Investigation of Customer Engagement in the Greek Retail Banking Sector. Procedia Soc. Behav. Sci. 2014, 148, 67–78. [Google Scholar] [CrossRef]
  20. Mogaji, E. Redefining banks in the digital era: A typology of banks and their research, managerial and policy implications. Int. J. Bank Mark. 2023, 41, 1899–1918. [Google Scholar] [CrossRef]
  21. Salvi, A.; Petruzzella, F.; Raimo, N.; Vitolla, F. Transparency in the digitalization choices and the cost of equity capital. Qual. Res. Financ. Mark. 2023, 15, 630–646. [Google Scholar] [CrossRef]
  22. Carmona, J.; Cruz, C. Banks’ social media goals and strategies. J. Bus. Res. 2018, 91, 31–41. [Google Scholar] [CrossRef]
  23. Kosiba, J.P.; Boateng, H.; Okoe, A.F.; Hinson, R. Trust and customer engagement in the banking sector in Ghana. Serv. Ind. J. 2018, 40, 960–973. [Google Scholar] [CrossRef]
  24. Del Sarto, N.; Bocchialini, E.; Gai, L.; Ielasi, F. Digital banking: How social media is shaping the game. Qual. Res. Financ. Mark. 2024. ahead of print. [Google Scholar] [CrossRef]
  25. Sakas, D.P.; Giannakopoulos, N.T.; Trivellas, P. Exploring affiliate marketing’s impact on customers’ brand engagement and vulnerability in the online banking service sector. Int. J. Bank Mark. 2023, 42, 1282–1312. [Google Scholar] [CrossRef]
  26. Sakas, D.P.; Giannakopoulos, N.T.; Terzi, M.C.; Kamperos, I.D.G.; Kanellos, N. What is the connection between Fintechs’ video marketing and their vulnerable customers’ brand engagement during crises? Int. J. Bank Mark. 2023, 42, 1313–1347. [Google Scholar] [CrossRef]
  27. Mbama, C.I.; Ezepue, P.O. Digital banking, customer experience and bank financial performance: UK customers’ perceptions. Int. J. Bank Mark. 2018, 36, 230–255. [Google Scholar] [CrossRef]
  28. Khandelwal, R.; Kapoor, D. The Use of Digital Tools for Customer Engagement in the Financial Services Sector. In Revolutionizing Customer-Centric Banking through ICT; IGI Global: Hershey, PA, USA, 2024; pp. 29–55. [Google Scholar]
  29. Islam, J.U.; Shahid, S.; Rasool, A.; Rahman, Z.; Khan, I.; Rather, R.A. Impact of website attributes on customer engagement in banking: A solicitation of stimulus-organism-response theory. Int. J. Bank Mark. 2020, 38, 1279–1303. [Google Scholar] [CrossRef]
  30. Lestari, D.M.; Hardianto, D.; Hidayanto, A.N. Analysis of user experience quality on responsive web design from its informative perspective. Int. J. Softw. Eng. Appl. 2014, 8, 53–62. [Google Scholar] [CrossRef]
  31. Almeida, F.; Monteiro, J. Approaches and principles for UX web experiences: A case study approach. Int. J. Inf. Technol. Web Eng. 2017, 12, 49–65. [Google Scholar] [CrossRef]
  32. Walsh, T.A.; Kapfhammer, G.M.; McMinn, P. Automated layout failure detection for responsive web pages without an explicit oracle. In Proceedings of the 26th ACM SIGSOFT International Symposium on Software Testing and Analysis, Santa Barbara, CA, USA, 10–14 July 2017. [Google Scholar] [CrossRef]
  33. Rogers, Y.; Sharp, H.; Preece, J. Interaction Design: Beyond Human-Computer Interaction, 6th ed.; John Wiley & Sons Ltd.: New York, NY, USA, 2023. [Google Scholar]
  34. ISO9241-11; Ergonomics of Human-System Interaction–Part 11: Usability for Definition and Concept. ISO: Geneva, Switzerland, 2018.
  35. Hussain, I.; Khan, I.A.; Jadoon, W.; Jadoon, R.N.; Khan, A.N.; Shafi, M. Touch or click friendly: Towards adaptive user interfaces for complex applications. PLoS ONE 2024, 19, e0297056. [Google Scholar] [CrossRef] [PubMed]
  36. Kim, S.; Cho, D. Technology Trends for UX/UI of Smart Contents. Korea Contents Assoc. Rev. 2016, 14, 29–33. [Google Scholar] [CrossRef]
  37. Joo, H.S. A Study on UI/UX and Understanding of Computer Major Students. Int. J. Adv. Smart Converg. 2017, 6, 26–32. [Google Scholar]
  38. Von Saucken, C.; Michailidou, I.; Lindemann, U. How to Design Experiences: Macro UX versus Micro UX Approach. Lect. Notes Comuter Sci. 2013, 8015, 130–139. [Google Scholar]
  39. Instatus. Our Comprehensive List of Website Performance Metrics to Monitor. 2024. Available online: https://instatus.com/blog/website-performance-metrics (accessed on 20 June 2024).
  40. Levrini, G.R.; Jeffman dos Santos, M. The influence of Price on purchase intentions: Comparative study between cognitive, sensory, and neurophysiological experiments. Behav. Sci. 2021, 11, 16. [Google Scholar] [CrossRef] [PubMed]
  41. Gabriel, D.; Merat, E.; Jeudy, A.; Cambos, S.; Chabin, T.; Giustiniani, J.; Haffen, E. Emotional effects induced by the application of a cosmetic product: A real-time electrophysiological evaluation. Appl. Sci. 2021, 11, 4766. [Google Scholar] [CrossRef]
  42. Filipović, F.; Baljak, L.; Naumović, T.; Labus, A.; Bogdanović, Z. Developing a web application for recognizing emotions in neuromarketing. In Marketing and Smart Technologies; Springer: Berlin/Heidelberg, Germany, 2020; pp. 297–308. [Google Scholar]
  43. Lee, Ν.; Broderick, A.J.; Chamberlain, L. What is ‘neuromarketing’? A discussion and agenda for future research. Int. J. Psychophysiol. 2007, 63, 199–204. [Google Scholar] [CrossRef] [PubMed]
  44. Rawnaque, F.; Rahman, K.; Anwar, S.; Vaidyanathan, R.; Chau, T.; Sarker, F.; Mamun, K. Technological advancements and opportunities in Neuromarketing: A systematic review. Brain Inform. 2020, 7, 10. [Google Scholar] [CrossRef] [PubMed]
  45. Ariely, D.; Berns, G. Neuromarketing: The hope and hype of neuroimaging in business. Nat. Rev. Neurosci. 2010, 11, 284–292. [Google Scholar] [CrossRef]
  46. Sousa, J. Neuromarketing and Big Data Analytics for Strategic Consumer Engagement: Emerging Research and Opportunities; IGI Global: Hershey, PA, USA, 2017. [Google Scholar] [CrossRef]
  47. Šola, H.M.; Qureshi, F.H.; Khawaja, S. Exploring the Untapped Potential of Neuromarketing in Online Learning: Implications and Challenges for the Higher Education Sector in Europe. Behav. Sci. 2024, 14, 80. [Google Scholar] [CrossRef]
  48. Berčík, J.; Neomániová, K.; Gálová, J. Using neuromarketing to understand user experience with the website (UX) and interface (UI) of a selected company. In The Poprad Economic and Management Forum 2021, Conference Proceedings from International Scientific Conference, Poprad, Slovak Republic, 14 October 2021; Madzík, P., Janošková, M., Eds.; VERBUM: Ružomberok, Slovakia, 2021; pp. 246–254. [Google Scholar]
  49. Golnar-Nik, P.; Farashi, S.; Safari, M. The application of EEG power for the prediction and interpretation of consumer decision-making: A neuromarketing study. Physiol. Behav. 2019, 207, 90–98. [Google Scholar] [CrossRef]
  50. Uygun, Y.; Oguz, R.F.; Olmezogullari, E.; Aktas, M.S. On the Large-scale Graph Data Processing for User Interface Testing in Big Data Science Projects. In Proceedings of the 2020 IEEE International Conference on Big Data (Big Data), Atlanta, GA, USA, 10–13 December 2020; pp. 2049–2056. [Google Scholar] [CrossRef]
  51. Li, L.; Zhang, J. Research and Analysis of an Enterprise E-Commerce Marketing System under the Big Data Environment. J. Organ. End User Comput. 2021, 33, 1–19. [Google Scholar] [CrossRef]
  52. Sakas, D.P.; Giannakopoulos, N.T.; Terzi, M.C.; Kanellos, N.; Liontakis, A. Digital Transformation Management of Supply Chain Firms Based on Big Data from DeFi Social Media Profiles. Electronics 2023, 12, 4219. [Google Scholar] [CrossRef]
  53. Bala, M.; Verma, D. A Critical Review of Digital Marketing. Int. J. Manag. IT Eng. 2018, 8, 321–339. Available online: https://ssrn.com/abstract=3545505 (accessed on 20 July 2024).
  54. Pongpaew, W.; Speece, M.; Tiangsoongnern, L. Social presence and customer brand engagement on Facebook brand pages. J. Prod. Brand Manag. 2017, 26, 262–281. [Google Scholar] [CrossRef]
  55. Chaffey, D.; Ellis-Chadwick, F. Digital Marketing; Pearson: London, UK, 2019. [Google Scholar]
  56. Dodson, I. The Art of Digital Marketing: The Definitive Guide to Creating Strategic, Targeted, and Measurable Online Campaigns; John Wiley & Sons: New York, NY, USA, 2016. [Google Scholar]
  57. Chawla, Y.; Chodak, G. Social media marketing for businesses: Organic promotions of web-links on Facebook. J. Bus. Res. 2021, 135, 49–65. [Google Scholar] [CrossRef]
  58. McIlwain, C.D. Algorithmic Discrimination: A Framework and Approach to Auditing & Measuring the Impact of Race-Targeted Digital Advertising. PolicyLink Rep. 2023, 1–50. [Google Scholar] [CrossRef]
  59. Mladenović, D.; Rajapakse, A.; Kožuljević, N.; Shukla, Y. Search engine optimization (SEO) for digital marketers: Exploring determinants of online search visibility for blood bank service. Online Inf. Rev. 2023, 47, 661–679. [Google Scholar] [CrossRef]
  60. Wedel, M.; Kannan, P.K. Marketing analytics for data-rich environments. J. Mark. 2016, 80, 97–121. [Google Scholar] [CrossRef]
  61. Semrush. 2024. Available online: https://www.semrush.com/ (accessed on 12 April 2024).
  62. Anylogic. 2024. Available online: https://www.anylogic.com/ (accessed on 12 April 2024).
  63. SeeSo Web Analysis (Eyedid SDK). 2024. Available online: https://sdk.eyedid.ai/ (accessed on 20 April 2024).
  64. MentalModeler. 2024. Available online: https://dev.mentalmodeler.com/ (accessed on 10 April 2024).
  65. Migkos, S.P.; Sakas, D.P.; Giannakopoulos, N.T.; Konteos, G.; Metsiou, A. Analyzing Greece 2010 Memorandum’s Impact on Macroeconomic and Financial Figures through FCM. Economies 2022, 10, 178. [Google Scholar] [CrossRef]
  66. Mpelogianni, V.; Groumpos, P.P. Re-approaching fuzzy cognitive maps to increase the knowledge of a system. AI Soc. 2018, 33, 175–188. [Google Scholar] [CrossRef]
  67. Forbes India. The 10 Largest Banks in the World in 2024. 2024. Available online: https://www.forbesindia.com/article/explainers/the-10-largest-banks-in-the-world/86967/1 (accessed on 6 January 2024).
  68. Nugroho, S.; Uehara, T. Systematic Review of Agent-Based and System Dynamics Models for Social-Ecological System Case Studies. Systems 2023, 11, 530. [Google Scholar] [CrossRef]
  69. McGarraghy, S.; Olafsdottir, G.; Kazakov, R.; Huber, É.; Loveluck, W.; Gudbrandsdottir, I.Y.; Čechura, L.; Esposito, G.; Samoggia, A.; Aubert, P.-M.; et al. Conceptual System Dynamics and Agent-Based Modelling Simulation of Interorganisational Fairness in Food Value Chains: Research Agenda and Case Studies. Agriculture 2022, 12, 280. [Google Scholar] [CrossRef]
  70. Wang, H.; Shi, W.; He, W.; Xue, H.; Zeng, W. Simulation of urban transport carbon dioxide emission reduction environment economic policy in China: An integrated approach using agent-based modelling and system dynamics. J. Clean. Prod. 2023, 392, 136221. [Google Scholar] [CrossRef]
  71. Nguyen, L.K.N.; Howick, S.; Megiddo, I. A framework for conceptualising hybrid system dynamics and agent-based simulation model. Eur. J. Oper. Res. 2024, 315, 1153–1166. [Google Scholar] [CrossRef]
  72. Ezquerra, A.; Agen, F.; Bogdan Toma, R.; Ezquerra-Romano, I. Using facial emotion recognition to research emotional phases in an inquiry-based science activity. Res. Sci. Technol. Educ. 2023, 1–24. [Google Scholar] [CrossRef]
  73. Chen, Y.; Qin, X.; Xu, X. Visual Analysis and Recognition of Virtual Reality Resolution Based on Pupil Response and Galvanic Skin Response. In Proceedings of the 4th International Conference on Intelligent Computing and Human-Computer Interaction (ICHCI) 2023, Guangzhou, China, 4–6 August 2023; pp. 74–83. [Google Scholar] [CrossRef]
  74. Muke, P.Z.; Kozierkiewicz, A.; Pietranik, M. Investigation and Prediction of Cognitive Load During Memory and Arithmetic Tasks. In Computational Collective Intelligence. ICCCI 2023. Lecture Notes in Computer Science; Nguyen, N.T., Botzheim, J., Gulyás, L., Núñez, M., Treur, J., Vossen, G., Kozierkiewicz, A., Eds.; Springer: Cham, Switzerland, 2023; Volume 14162. [Google Scholar] [CrossRef]
  75. Amiri, S.S.; Masoudi, M.; Asadi, S.; Karan, E.P. A Quantitative Way for Measuring the Building User Design Feedback and Evaluation. In Proceedings of the 16th International Conference on Computing in Civil and Building Engineering (ICCCBE2016), Osaka, Japan, 6–8 July 2016; pp. 1–7. [Google Scholar]
  76. Wilson, L. 30-Minute Conversion Rate Optimisation Actions. In 30-Minute Website Marketing; Emerald Publishing Limited: Leeds, UK, 2019; pp. 131–141. [Google Scholar] [CrossRef]
  77. Sood, S. Leveraging Web Analytics for Optimizing Digital Marketing Strategies. In Big Data Analytics; Chaudhary, K., Alam, M., Eds.; CRC Press (Auerbach Publications): Boca Raton, FL, USA, 2022; pp. 173–188. [Google Scholar]
  78. Drivas, I.C.; Sakas, D.P.; Giannakopoulos, G.A. Display Advertising and Brand Awareness in Search Engines: Predicting the Engagement of Branded Search Traffic Visitors. In Business Intelligence and Modelling. IC-BIM 2019. Springer Proceedings in Business and Economics; Sakas, D.P., Nasiopoulos, D.K., Taratuhina, Y., Eds.; Springer: Cham, Switzerland, 2021. [Google Scholar] [CrossRef]
  79. Hari, H.; Iyer, R.; Sampat, B. Customer Brand Engagement through Chatbots on Bank Websites–Examining the Antecedents and Consequences. Int. J. Hum. Comput. Interact. 2023, 38, 1212–1227. [Google Scholar] [CrossRef]
  80. Makrydakis, N. SEO mix 6 O’s model and categorization of search engine marketing factors for websites ranking on search engine result pages. Int. J. Res. Mark. Manag. Sales 2024, 6, 18–32. [Google Scholar] [CrossRef]
  81. Shankar, B. Strategies for Deep Customer Engagement. In Nuanced Account Management; Palgrave Macmillan: Singapore, 2018; pp. 53–99. [Google Scholar] [CrossRef]
  82. Chakrabortty, K.; Jose, E. Relationship Analysis between Website Traffic, Domain Age and Google Indexed Pages of E-commerce Websites. IIM Kozhikode Soc. Manag. Rev. 2018, 7, 171–177. [Google Scholar] [CrossRef]
  83. Müller, O.; Fay, M.; vom Brocke, J. The Effect of Big Data and Analytics on Firm Performance: An Econometric Analysis Considering Industry Characteristics. J. Manag. Inf. Syst. 2018, 35, 488–509. [Google Scholar] [CrossRef]
  84. Pejić Bach, M.; Krstić, Ž.; Seljan, S.; Turulja, L. Text Mining for Big Data Analysis in Financial Sector: A Literature Review. Sustainability 2019, 11, 1277. [Google Scholar] [CrossRef]
  85. Gupta, S.; Justy, T.; Kamboj, S.; Kumar, A.; Kristoffersen, E. Big data and firm marketing performance: Findings from knowledge-based view. Technol. Forecast. Soc. Change 2021, 171, 120986. [Google Scholar] [CrossRef]
  86. Ravi, V.; Kamaruddin, S. Big Data Analytics Enabled Smart Financial Services: Opportunities and Challenges. In Big Data Analytics. BDA 2017. Lecture Notes in Computer Science; Reddy, P., Sureka, A., Chakravarthy, S., Bhalla, S., Eds.; Springer: Cham, Switzerland, 2017; Volume 10721, pp. 15–39. [Google Scholar] [CrossRef]
  87. Tichindelean, M.T.; Cetină, I.; Orzan, G. A Comparative Eye Tracking Study of Usability—Towards Sustainable Web Design. Sustainability 2021, 13, 10415. [Google Scholar] [CrossRef]
  88. Bajaj, R.; Syed, A.A.; Singh, S. Analysing applications of neuromarketing in efficacy of programmatic advertising. J. Consum. Behav. 2023, 23, 939–958. [Google Scholar] [CrossRef]
  89. Tirandazi, P.; Bamakan, S.M.H.; Toghroljerdi, A. A review of studies on internet of everything as an enabler of neuromarketing methods and techniques. J. Supercomput. 2022, 79, 7835–7876. [Google Scholar] [CrossRef]
  90. Slijepčević, M.; Popović Šević, N.; Radojević, I.; Šević, A. Relative Importance of Neuromarketing in Support of Banking Service Users. Marketing 2022, 53, 131–142. [Google Scholar] [CrossRef]
Figure 1. FCM Conceptual Framework of Banking Firm Websites. Blue and red arrows signify positive and negative correlations between variables, respectively. The symbols “+” and “–” represent the positive and negative per-centage changes, respectively.
Electronics 13 03256 g001
Figure 2. Hybrid Model (HM) Development.
Electronics 13 03256 g002
Figure 3. Simulation outputs of the hybrid model simulation in a period of 360 days.
Electronics 13 03256 g003
Figure 4. Gaze and fixation analysis of banking firm websites. (a) JP Morgan, (b) Bank of America, (c) Wells Fargo, (d) Agricultural Bank of China, and (e) Industrial and Commercial Bank of China Limited.
Electronics 13 03256 g004aElectronics 13 03256 g004b
Figure 5. Heatmap analysis of banking firm websites. (a) JP Morgan, (b) Bank of America, (c) Wells Fargo, (d) Agricultural Bank of China, and (e) Industrial and Commercial Bank of China Limited. The intensity of the color (redder) indicates increased fixations and engagement of the participants (greener color shows reduced fixations/engagement).
Electronics 13 03256 g005aElectronics 13 03256 g005bElectronics 13 03256 g005c
Figure 6. Scan-path analysis of banking firm websites. (a) JP Morgan, (b) Bank of America, (c) Wells Fargo, (d) Agricultural Bank of China, and (e) Industrial and Commercial Bank of China Limited. The numbers indicate the sequence of the participants observation, while the size of the circles shows the amount of observation time spent in each spot (the bigger the circle the more time is spent).
Electronics 13 03256 g006aElectronics 13 03256 g006bElectronics 13 03256 g006c
Table 1. Descriptive statistics of the five banking firms during the past six months.
MeanMinMaxStd. DeviationSkewnessKurtosis
Organic Traffic9,868,004.179,486,121.0010,700,067.60351,366.561.3421.651
Organic Keywords987,820.46889,059.201,193,079.6076,418.521.5921.851
Organic Traffic Costs37,155,781.9828,929,891.4044,660,727.205,822,486.64−0.188−1.627
Paid Traffic337,898.57232,588.80487,373.4066,696.660.3961.333
Paid Keywords6510.471815.209700.602624.74−0.757−0.580
Paid Traffic Costs1,514,463.27992,316.602,491,839.60406,005.960.9981.667
Email Sources184,876.140.00720,314.00300,170.771.3790.219
Display Ads4199.570.0020,892.007636.021.9821.927
Purchase Conversion7.717.008.000.49−1.230−0.840
Referral Domains51,181.9149,694.4052,457.40794.22−0.360−0.317
Visit Duration519.40368.00737.00128.250.658−0.174
Bounce Rate0.450.420.490.020.606−1.361
Pages per Visit3.432.005.000.970.2770.042
New Visitors15,149,188.4014,150,098.0016,212,804.00801,388.140.025−1.625
Returning Visitors47,056,175.8944,705,979.0051,410,725.002,301,015.961.1031.599
N = 180 observation days for the five selected banking firms.
Table 2. Correlation analysis matrix.
Organic TrafficOrganic Traffic CostsPaid KeywordsPaid Traffic CostsEmail SourcesDisplay AdsPurchase ConversionReferral DomainsVisit DurationBounce RatePages per VisitNew VisitorsReturn Visitors
Organic Traffic10.604 *0.2640.0370.174−0.0130.6190.5450.5290.905**0.0680.796*0.469
Organic Traffic Costs0.604 *10.0370.0000.6070.4130.2060.830 **0.1240.2420.6570.4890.628
Paid Traffic−0.122−0.0520.5330.889 **−0.220−0.304−0.5210.249−0.705−0.298−0.022−0.587−0.539
Paid Traffic Costs0.0370.0000.3791−0.371−0.315−0.5470.241−0.549−0.193−0.070−0.458−0.524
Email Sources0.1740.607−0.257−0.37110.5900.3440.4240.1450.0020.7090.3560.698
Display Ads−0.0130.413−0.456−0.3150.59010.1600.2990.635−0.3160.843 *0.5540.857 *
Purchase
Conversion
0.6190.206−0.555−0.5470.3440.16010.1750.2240.6000.3000.5390.485
Referral Domains0.5450.830 **0.2490.2410.4240.2990.1751−0.2230.1790.737 *0.2690.394
Visit Duration0.5290.124−0.748−0.5490.1450.6350.224−0.22310.1630.3090.804 *0.717
Bounce Rate0.905 **0.242−0.542−0.1930.002−0.3160.6000.1790.1631−0.0510.5810.192
Pages per Visit0.0680.657−0.410−0.0700.7090.843 *0.3000.737 *0.309−0.05110.5580.830 *
New Visitors0.796 *0.489−0.904 **−0.4580.3560.5540.5390.2690.804 *0.5810.55810.856 *
Returning Visitors0.4690.628−0.773 *−0.5240.6980.857 *0.4850.3940.7170.1920.830 *0.856 *1
* and ** indicate statistical significance at the 95% and 99% levels, respectively.
Table 3. Impact of banking firms’ marketing analytics on their website purchase conversion.
VariablesStandardized CoefficientR2Fp-Value
Organic Traffic Costs−1.6701.000-0.000 **
Paid Traffic Costs−1.3690.000 **
Referral Domains1.6960.000 **
Email Sources0.1670.000 **
** Indicates statistical significance at the 99% level.
Table 4. Impact of banking firms’ marketing analytics on their website display ads.
VariablesStandardized CoefficientR2Fp-Value
Paid Traffic Costs0.1981.000-0.000 **
Referral Domains−0.0650.000 **
Email Sources−0.1350.000 **
** Indicates statistical significance at the 99% level.
Table 5. Impact of banking firms’ marketing analytics on their website organic traffic.
VariablesStandardized CoefficientR2Fp-Value
Paid Traffic Costs−0.0241.000-0.000 **
Referral Domains−0.3190.000 **
Email Sources0.0410.000 **
** Indicates statistical significance at the 99% level.
Table 6. Impact of banking firms’ marketing analytics on their website bounce rate.
VariablesStandardized CoefficientR2Fp-Value
Paid Traffic Costs0.025 0.000 **
Referral Domains0.3340.000 **
Email Sources−0.0430.000 **
** Indicates statistical significance at the 95% level.
Disclaimer/Publisher’s Note: The statements, opinions and data contained in all publications are solely those of the individual author(s) and contributor(s) and not of MDPI and/or the editor(s). MDPI and/or the editor(s) disclaim responsibility for any injury to people or property resulting from any ideas, methods, instructions or products referred to in the content.

