Article

A Novel Deep Learning Approach for Real-Time Critical Assessment in Smart Urban Infrastructure Systems

by
Abdulaziz Almaleh
Informatics and Computer Systems Department, King Khalid University, Abha 62529, Saudi Arabia
Electronics 2024, 13(16), 3286; https://doi.org/10.3390/electronics13163286
Submission received: 25 July 2024 / Revised: 17 August 2024 / Accepted: 18 August 2024 / Published: 19 August 2024
(This article belongs to the Special Issue AI Technologies and Smart City)

Abstract

:
The swift advancement of communication and information technologies has transformed urban infrastructures into smart cities. Traditional assessment methods face challenges in capturing the complex interdependencies and temporal dynamics inherent in these systems, risking urban resilience. This study aims to enhance the criticality assessment of geographic zones within smart cities by introducing a novel deep learning architecture. Utilizing Convolutional Neural Networks (CNNs) for spatial feature extraction and Long Short-Term Memory (LSTM) networks for temporal dependency modeling, the proposed framework processes inputs such as total electricity use, flooding levels, population, poverty rates, and energy consumption. The CNN component constructs hierarchical feature maps through successive convolution and pooling operations, while the LSTM captures sequence-based patterns. Fully connected layers integrate these features to generate final predictions. Implemented in Python using TensorFlow and Keras on an Intel Core i7 system with 32 GB RAM and an NVIDIA GTX 1080 Ti GPU, the model demonstrated a superior performance. It achieved a mean absolute error of 0.042, root mean square error of 0.067, and an R-squared value of 0.935, outperforming existing methodologies in real-time adaptability and resource efficiency.

1. Introduction

The rapid development of information and communication technologies are shaping new urban infrastructure known as smart cities [1]. The smart city describes cities that intend to improve their sustainability and efficiency through the integration of the various technologies [2,3]. Notable among the technologies is the Internet of Things (IoT) [4,5], where sensors and devices are implanted within the infrastructures across the city [6]. Many of these IoT devices continuously collect data about energy consumption, traffic flow, and monitoring the environment in cities [7]. The generated volume of data requires advanced data processing algorithms, making big data analytics an integral part of smart city systems [8,9]. In addition to IoT and big-data analytics [10], machine learning has been one of the key technologies for the management of smart cities [11,12]. Machine learning algorithms interlink historical information to predict trends in the future for administrators to become proactive in their decisions [13,14,15].
There are significant limitations and gaps in the field related to the integration of big data analytics [16], IoT, and machine learning [17,18]. A central problem is the established inadequacy of conventional models to accurately capture complex, non-linear interactions between the various components of infrastructure [19]. Conventional ranking-based approaches are prescriptive in nature with predefined criteria, which do not consider the dynamic interdependence of urban systems [20]. Consequently, this may be a principal reason for suboptimality in decision making, as these models cannot offer an overall understanding of both the vulnerabilities and their associated criticalities of infrastructures [21]. Most existing studies have less focus on the temporal dynamics and spatial dependencies that characterize urban infrastructure systems [22]. The major challenge of this domain is to integrate diverse sources of data, including environmental, demographic, and infrastructural data, into a single analytical framework. This is significant for maintaining essential urban services, including water, electricity, and transportation infrastructures, throughout disasters, cyberattacks, and other forms of interruptions [23,24].
The motivation of the foregoing comes from the critical need to enhance the resilience and sustainability of urban infrastructures in smart cities [25]. Nowadays, disasters of both natural and manmade types continue to increase in frequency and magnitude, raising the need for effective prediction of the outcomes [26]. This paper considers the problem of the inadequacy of existing approaches in capturing the complex interdependencies and temporal dynamics of urban infrastructure systems [27]. Traditional methods, which often rely on static and linear models, are not sufficient in the face of multifaceted and evolving smart city environments [28]. This inadequacy comes with very high risks to urban resilience, which may cause critical failures of infrastructures and lead to severe societal impacts [29]. The research question for the proposed approach can then be formulated as follows:
How would a deep-learning-based approach further improve the prediction and assessment of criticality in urban infrastructure systems if it acquires and integrates spatial information, as well as dependencies over time?
The focus of the proposed approach is to design and evaluate a novel architecture for deep learning that combines Convolutional Neural Networks (CNNs) [30], which are used to capture spatial features [31], and Long Short-Term Memory (LSTM) networks [32] that are designed to model temporal dependencies in the data.
In the hybrid deep learning architecture proposed, an escalation in the prediction and assessment of criticality in urban infrastructure systems is achieved. Further, this model will fuse real-time data from IoT devices—energy consumption, traffic patterns, and environmental conditions—with socioeconomic features like population count and poverty percentage. Although these variables are not entirely real-time in themselves, they provide very important context that can be understood only in the long-term vulnerabilities and trends—critical for comprehensive assessments. The model design will equate these real-time dynamic inputs against those critical socioeconomic factors to ensure a robust and holistic analysis of the different areas. A CNN component for spatial features to identify key patterns; an LSTM network to capture temporal dynamics, which will allow the model to consider short-term fluctuations and long-term trends. Although the study does not focus on a specific geographic area, the methodology is designed to be adaptable across various urban contexts, where the availability and type of data may vary. The novel contributions of this study are as follows:
  • Development of a novel architecture that integrates CNNs and LSTMs to simultaneously capture spatial and temporal dependencies in urban infrastructure data.
  • Implementation of advanced techniques to preprocess, normalize, and integrate diverse data sources, including environmental, demographic, and infrastructural data.
  • Establishment of a robust evaluation framework employing multiple performance metrics, such as MAE, RMSE, and R-Squared, to rigorously assess the model performance and provide dynamic, real-time criticality assessments.
The structure of the rest of the article is as follows. In Section 2 we provide a review of the existing literature related to urban infrastructure resilience. Section 3 details the proposed methodology, with a specific focus on the deep learning model architecture discussed in Section 3.2. Section 4 presents the simulation setup and results. Section 5 provides an analysis on the implications of our findings. Finally, Section 6 concludes the paper.

2. Related Work

The study of urban infrastructure resilience has garnered significant attention in recent years, driven by the increasing complexity and interdependence of modern cities. This section provides a comprehensive review of the existing literature, focusing on the methodologies employed to assess and enhance the resilience of critical infrastructure systems.
The innovative use of blockchain technology combined with neural-network-based systems assures a Cybersecurity Infrastructure for IoT and 5G. This method provides a secure framework, but can be complex to put into action and for maintenance [33]. A federated learning approach enhances the resilience of resource-constrained critical infrastructures by allowing distributed learning without the need for centralized data storage. This method improves data privacy but encounters challenges related to communication overhead and model convergence [34]. A comprehensive risk-based criticality assessment model for smart infrastructures employs a framework integrating risk to evaluate infrastructure vulnerabilities and resilience. This model offers a systematic approach to risk assessment, but lacks the dynamic capabilities to adapt to rapidly changing urban environments [35]. Another stream deals with disaster management in smart cities through the use of real-time data utilization and effective response strategies. This, of course, enhances situational awareness but mainly relies on the presence and accuracy of real-time data [36].
Another framework addresses the impact of climate change on critical infrastructure resilience through a multi-faceted risk assessment approach. It emphasizes the importance of considering climate change projections, yet its implementation complexity can hinder practical applications [37]. The approach for detecting malicious attacks on the smart grid underlines cyber resilience in smart city infrastructures. This methodology integrates anomaly detection with machine learning to identify possible threats against any given adversary while requiring a large amount of computational resources for real-time processing [38]. Neural network models present resilient transport systems with robust solutions for the prediction and management of transportation disruptions. These models might not catch the complexity of urban infrastructures that are interlinked [39].
The resilience of the critical infrastructure in smart microgrids is enhanced through multi-criteria decision techniques, providing a robust framework for infrastructure management. Nevertheless, the model’s complexity can pose implementation challenges [40]. On the contrary, case studies of machine learning demonstrate impressive progress in risk and resilience assessment within the domain of structural engineering. Most of these techniques typically require huge training data and computational resources [41]. Further, a new predictive modeling for smart flood resilience is based on big data for predictive risk monitoring so that disaster management can be done with forewarning. While this is promising, the reliance is high on good quality data and remains a major challenge [42]. One point that is reviewed in relation to developed measurement frameworks in critical infrastructure resilience includes varying approaches: from qualitative assessments to quantitative models. While this offers great insight into the problem. These frameworks provide valuable insights but often lack standardization, making cross-comparisons challenging [43].
Recent trends in artificial neural networks for smart cities focus on achieving the Sustainable Development Goals (SDG-11). These studies highlight the potential of neural networks in urban planning and management, but emphasize the need for interdisciplinary collaboration to address complex urban challenges [44]. Similarly, an ensemble learning technique is proposed to strengthen the robustness of smart city infrastructures. However, the effectiveness of this model largely depends on the quality and diversity of the training data [45]. This approach utilizes community-scale data to provide tailored risk assessments but demands significant community engagement and extensive data collection efforts [46].
The proposed approach addresses several limitations of existing methodologies in enhancing the resilience and criticality assessment of smart city infrastructures, as shown in Table 1. Traditional risk-based criticality assessments often lack the adaptability to rapidly changing urban environments and the complexity needed for practical applications [35,37]. Cybersecurity measures focusing on anomaly detection, while crucial, face scalability issues in large IoT networks and require substantial computational resources [38,47]. Disaster management frameworks and predictive models for infrastructure resilience, though beneficial, heavily rely on the availability and accuracy of real-time data, which can be challenging to maintain consistently [36,42]. Our hybrid deep learning architecture, integrating CNNs and LSTMs, enhances the ability to capture both spatial and temporal dependencies, thus providing a comprehensive and adaptive model for criticality assessment. This model overcomes the limitations of static and complex risk assessments by leveraging dynamic data inputs and advanced machine learning techniques to offer real-time, scalable, and reliable predictions.

3. Proposed Methodology
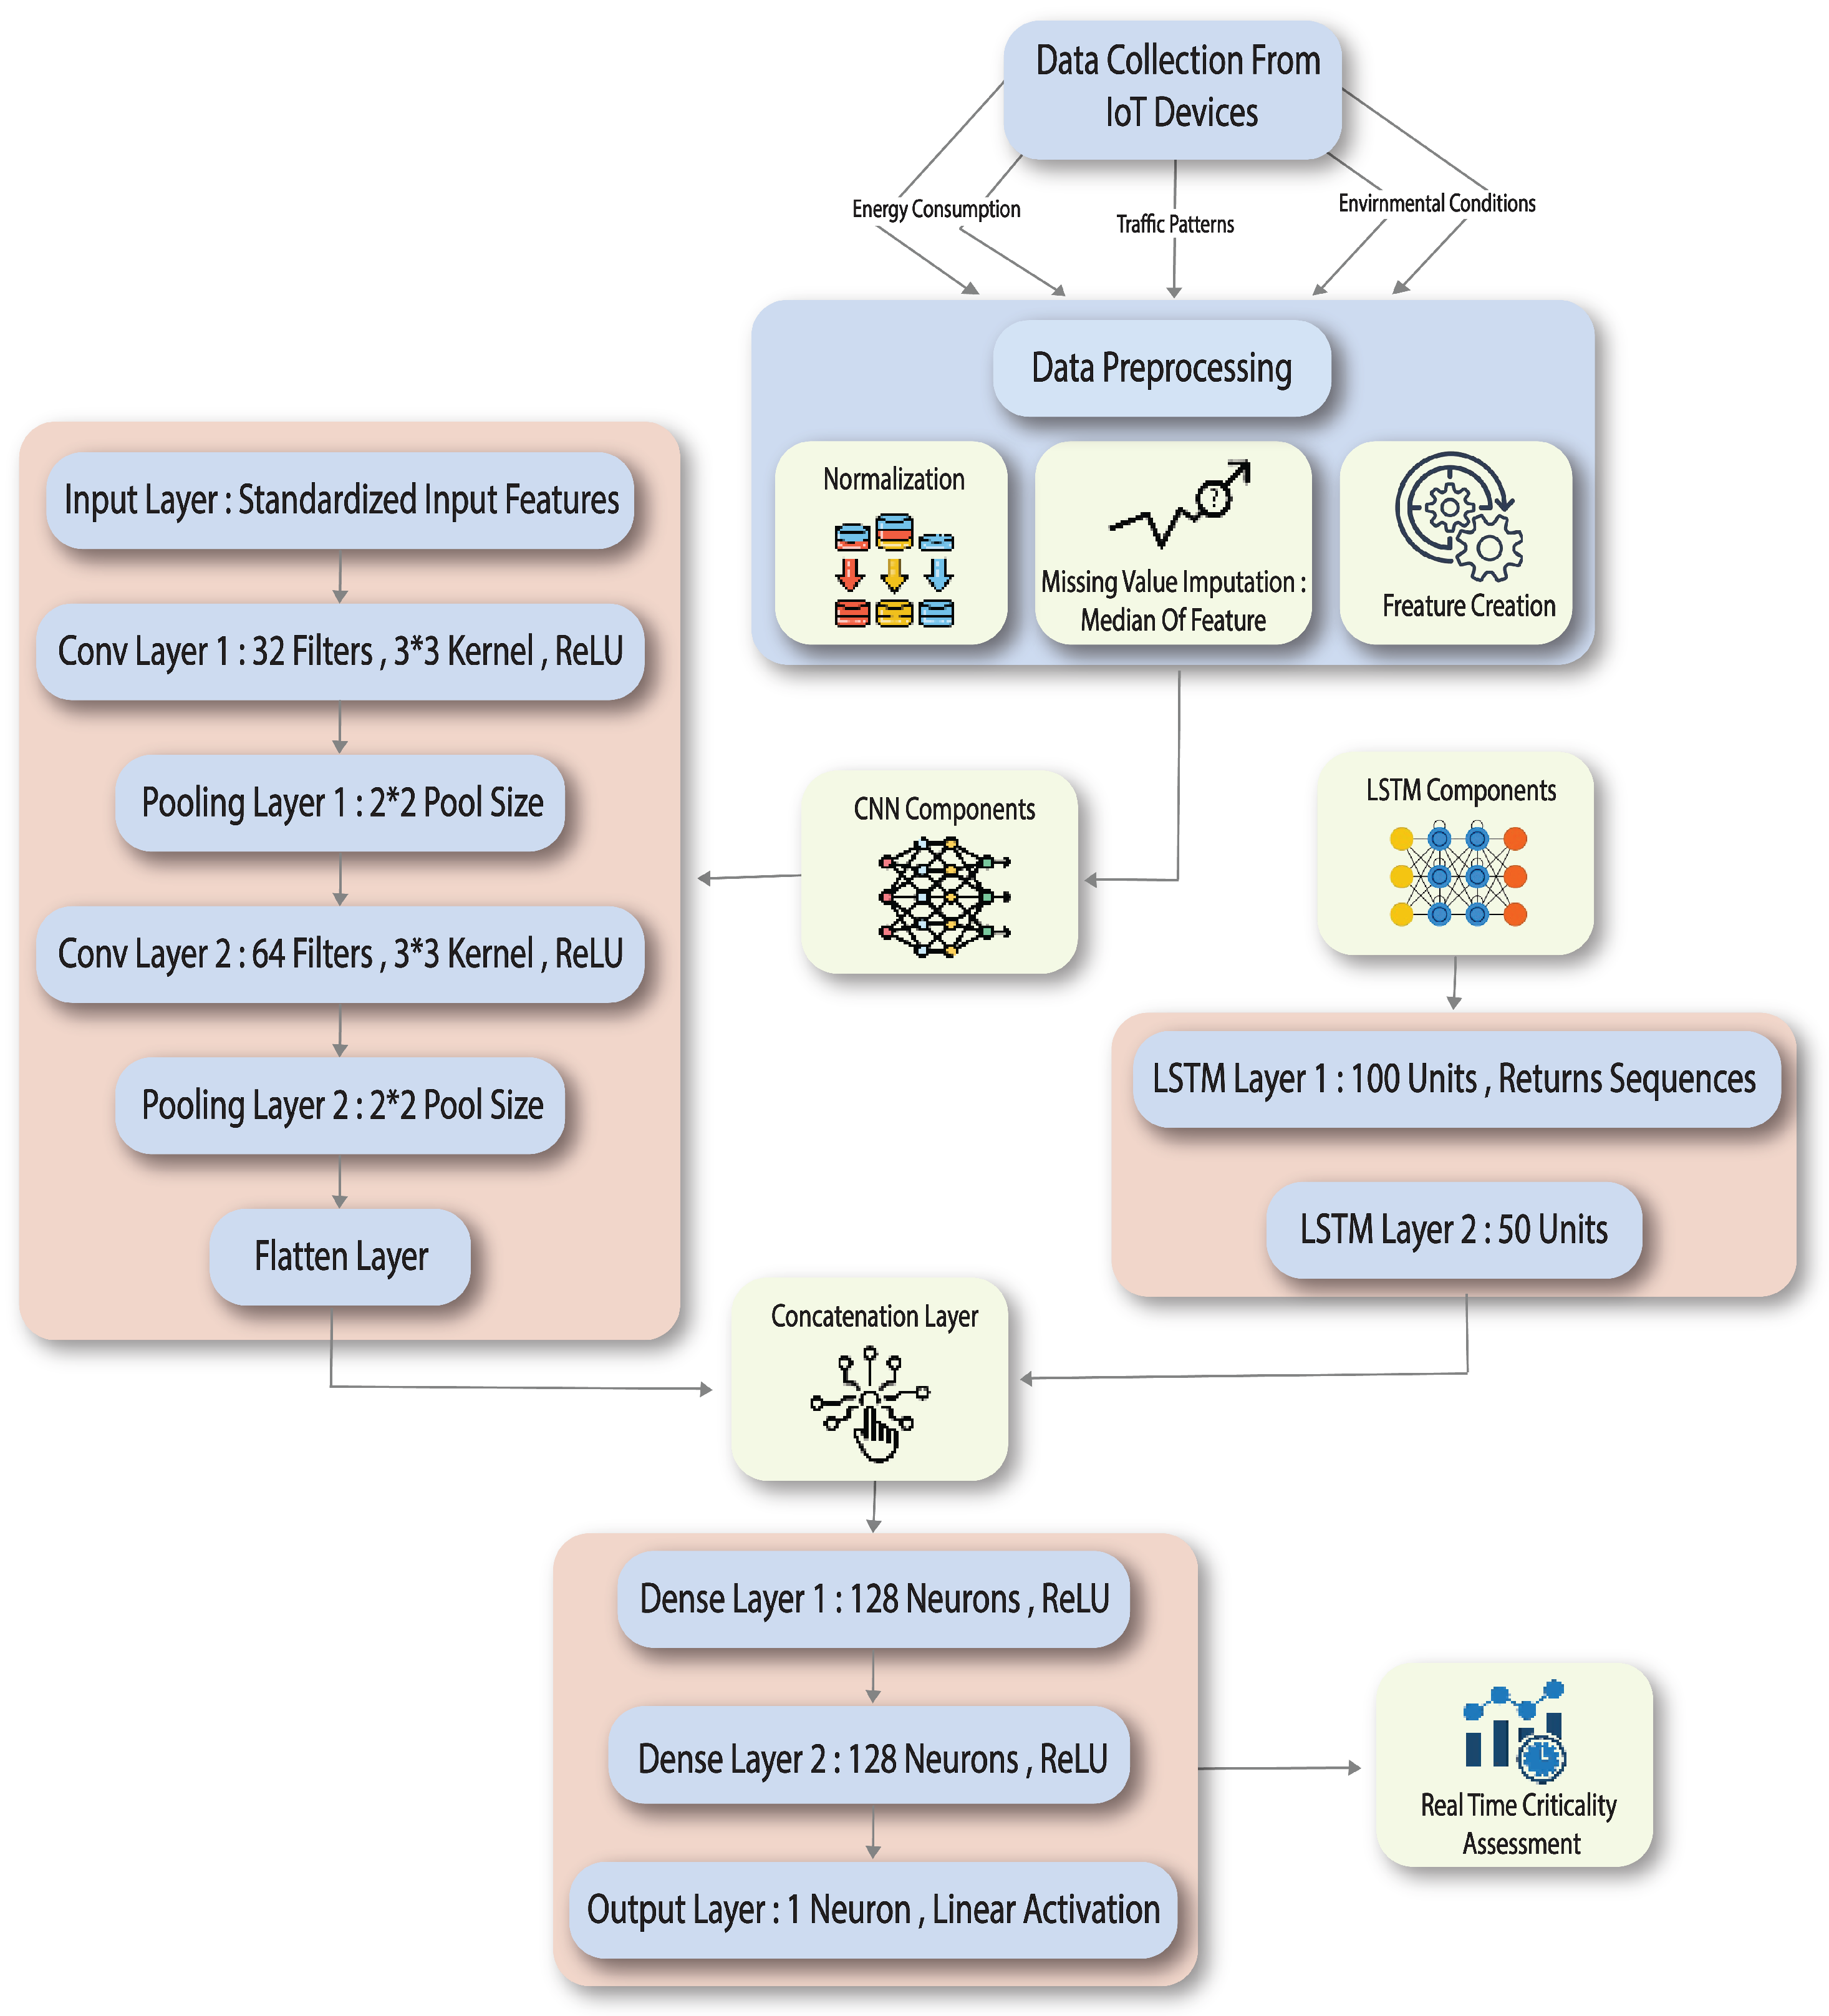
In this paper, a new deep learning architecture will be introduced to improve the assessment of geographic zones’ criticality in smart cities. It combines cutting-edge components of neural networks to learn both spatial and temporal dynamics for improved accuracy and reliability in predictions of infrastructure resilience. This section describes the end-to-end approach followed from data collection and preparation to building the deep learning model.
In response to the diverse nature of the data utilized in this study, the developed deep learning model is intended to function as a foundational component of a Decision Support System (DSS) for smart cities. This model integrates various data types to provide comprehensive insights, enabling informed decision making across multiple urban domains. By forecasting critical indicators and assessing real-time conditions, the system offers valuable guidance for urban management, ensuring that decisions are both data-driven and responsive to dynamic urban environments.

3.1. Model Overview

We increased the critical assessment associated with geographic zones in smart cities by means of a new deep learning architecture that integrates multiple neural network components. This would point to spatial and temporal dynamics of infrastructure resilience as a key element to enhance the model’s ability to learn complex relationships with improved accuracy and reliability of predictions from data. Figure 1 presents the comprehensive flow, from data collection and preprocessing to the implementation of the deep learning model, highlighting the various stages such as feature engineering, CNN components, LSTM components, and the fully connected neural network leading to real-time criticality assessment. The process begins with data collection from various sources, capturing key variables such as Flooding Level, Total Electricity Use, Total Energy Consumption, Population, and Poverty Percent. The collected data undergoes preprocessing steps, including missing value imputation, one-hot encoding for categorical variables, and normalization. Feature engineering follows, where new features like Population to Area Ratio (Pdensity) and Energy Per Capita (Ecapita) are created to enhance the model’s predictive power.
The processed data will then be fed into a deep learning model with three vital parts: Convolutional Neural Networks to capture spatial dependencies, LSTMs for modeling temporal dynamics, and a fully connected neural network for final predictions. Together, the designed model comes on to do what criticality assessment can be done in real-time, and hence making timely/informed decisions within the domain of smart urban infrastructure management is enabled.

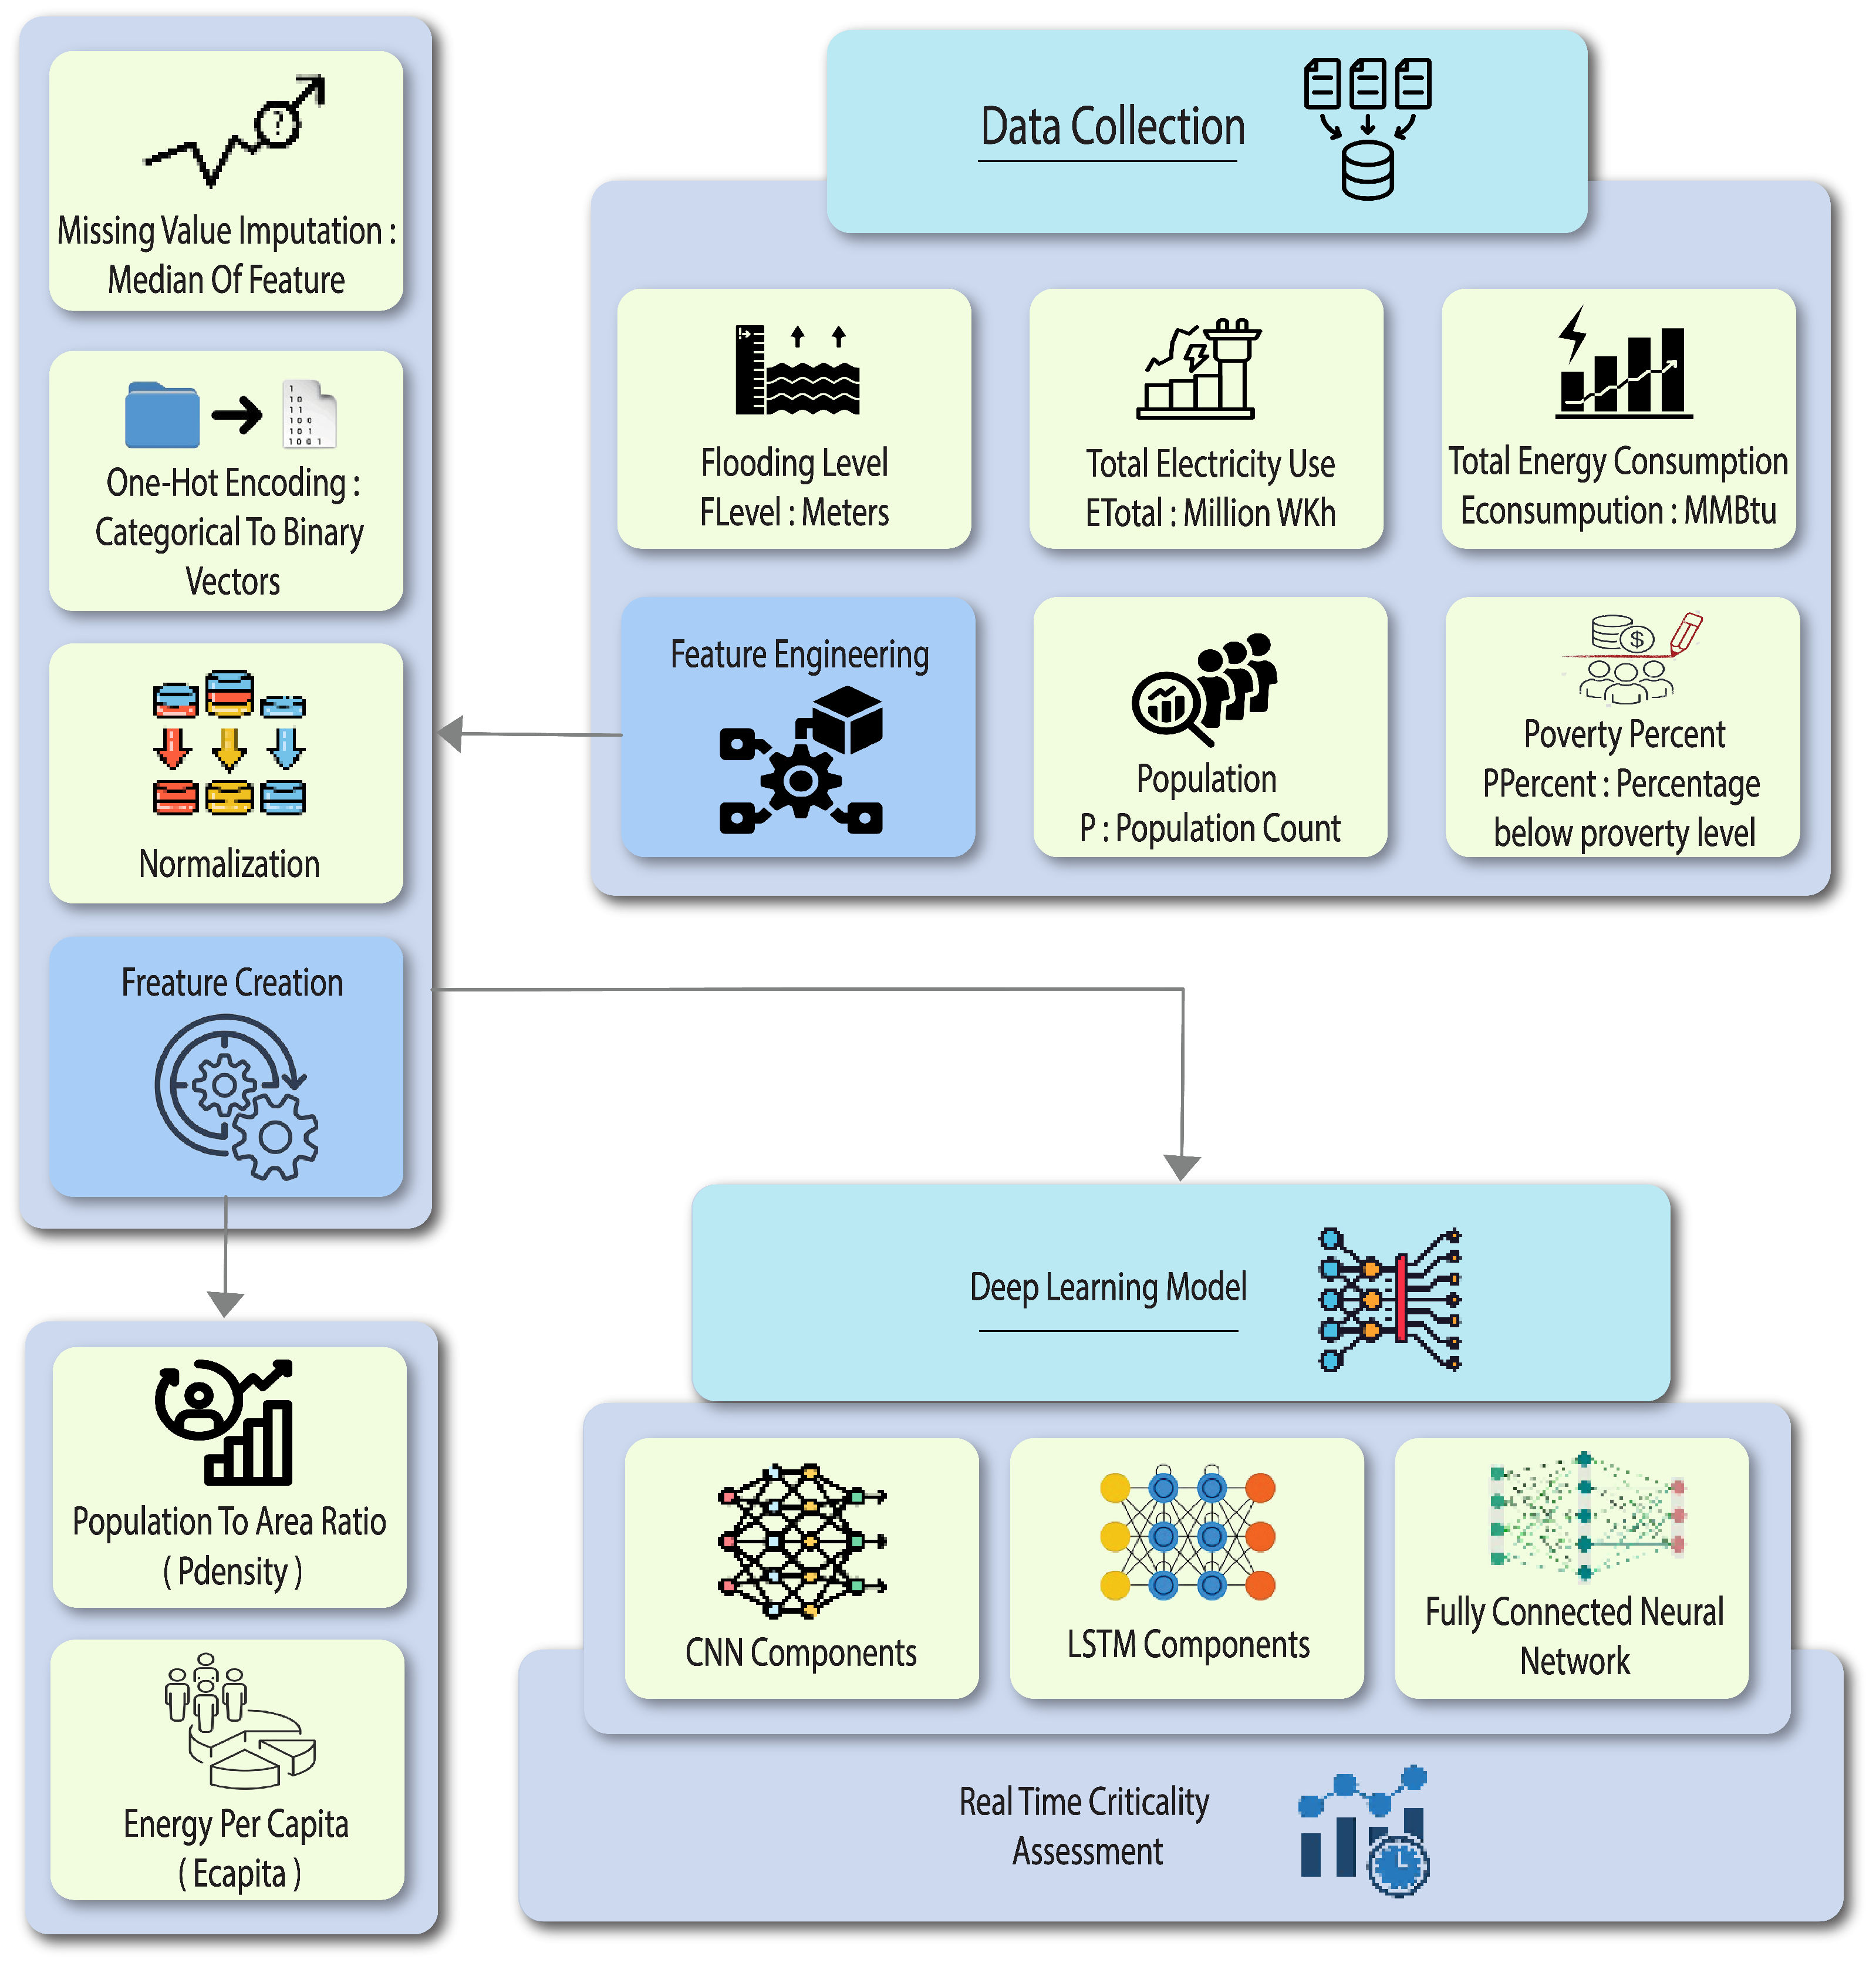
3.1.1. Data Collection and Preparation

We utilized a comprehensive dataset encompassing multiple measures indicative of the criticality of geographic zones [48]. The dataset used in this research provides exhaustive measures of the urban infrastructure systems, segregating them by geographical zones identified by ZIP codes. It contains a number of key variable categories important when trying to generalize the vulnerability, criticality, and interdependencies of infrastructures within a smart city environment.
  • Severity/Vulnerability Measures: These stand for measures that show the subsequent nature: Electricity Use Total, measured in million kWh; Level of Flooding; Population; Percent of Poverty; and Energy Consumption Total, measured in MMBtu. In general, these variables provide a view on the likelihoods of risks and vulnerabilities that would underline each geographical zone, focusing on parameters directly related to the energy use and conditions at times bordering with socioeconomics.
  • Criticality Measures: This category takes into consideration the number of nodes and diversity for each zone. The variables allow for looking at the criticality of the infrastructure components based on the number of systems involved and the complexity or integration of the systems.
  • Interdependence Measures: This section of the dataset captures Interdependence Total Value, Total Average Time to Cascade, and Outage Number per Year. These very critical measures help not only understand how the failure of one infrastructure component may cascade to another, pointing out the possibility for cascading failures, but also provide insight into the degree of connection between different elements.
  • Centrality Measures: It finally contains centrality measures, specifically the total Degree No. for all nodes, the total Betweenness value for all nodes, and the total Closeness value for all nodes. These metrics help quantify the relative importance of each node or component in the overall infrastructure network as this type of analysis identifies which are the critical components involved in holding an entire system together.

3.1.2. Feature Engineering

Extensive work in feature preprocessing and preparation was conducted to make sure that the dataset was very well prepared for the deep learning model. This included steps like normalization, one-hot encoding, missing value imputation, and new features that could capture more insights.
  • Normalization: We standardized all numerical features to zero mean and one standard deviation. This step was significant for placing the data into different scales in a homogeneous way, hence enhancing actual neural network learning.
  • One-Hot Encoding: One-hot encoding transformed categorical variables into a format readable by the neural network. The method that will be used in the transformation of categorical data into its binary vector representation is what will allow the model to process these features effectively.
  • Missing Value Imputation: In order not to lose any information, missing values were imputed by the median of their corresponding features. This is a measure with the least effect on changing the data distribution and, hence, will not add any bias like other arbitrary imputation methods might.
  • Feature Creation: We derived new features to capture additional insights that could enhance the model’s performance. The newly created features include:
    Population-to-Area Ratio (Pdensity): This was achieved by dividing the number of people by the area of each geographical zone. This provides an idea of what the population density is, which is an important factor when considering infrastructure resilience or resilience assessment, as it helps with allocating resources.
    Energy Per Capita (Ecapita): This feature was computed using total energy consumption divided by population size. It helps with assessing how efficient it is in using energy relative to its population and how much energy it requires compared with its population.

3.2. Deep Learning Model Architecture

The proposed research uses a deep learning architecture that integrates three main parts: CNNs, LSTM networks, and a fully connected neural network. In this architecture, there is the handling of spatial dependencies and temporal dynamics within the data. Spatial dependencies refer to the relationships between different geographic zones, like how the infrastructure in one area affects neighboring areas. CNNs are consequently applied in the capture of such spatial dependencies. Temporal dynamics relate to changes of variables with respect to time, such as daily oscillations in energy use or population density. LSTM networks are subsequently applied to model these time-based variations that enable the architecture to make future predictions on trends from past data. This combination ensures a comprehensive analysis of urban infrastructure systems, enhancing the model’s predictive capabilities.
Figure 2 presents the proposed deep learning architecture for critical assessment in smart cities. The whole process starts from the collection of data, where energy consumption, traffic patterns, and environmental conditions are some of the metrics collected from IoT devices installed at various points in the city. Following this, normalization, filling of missing values through the median of each respective feature, and feature creation are some preprocessing steps involved in collecting the data to make the dataset more informative. The CNN component processes the standardized input features through multiple convolutional layers (with 32 and 64 filters) followed by pooling layers to extract the spatial features. Concurrently, the LSTM component captures temporal dependencies through two layers, one with 100 units returning sequences and another with 50 units. The outputs from the CNN and LSTM components are concatenated and passed through dense layers, ultimately producing a real-time criticality assessment.

3.2.1. Convolutional Neural Network (CNN) Component

The CNN component plays a significant role in extracting spatial features from the input data. This is achieved through a series of convolutional layers, each followed by pooling layers that serve to reduce the spatial dimensions while preserving key features. The detailed procedure of the CNN component is depicted in Algorithm 1. By processing the input data in this manner, CNN effectively identifies and retains essential spatial characteristics necessary for accurate analysis.
Algorithm 1: Convolutional Neural Network (CNN) Component
Electronics 13 03286 i001
    CNN processes the input data through a series of layers, each designed to progressively extract more complex spatial features. The architecture of the CNN component is as follows:
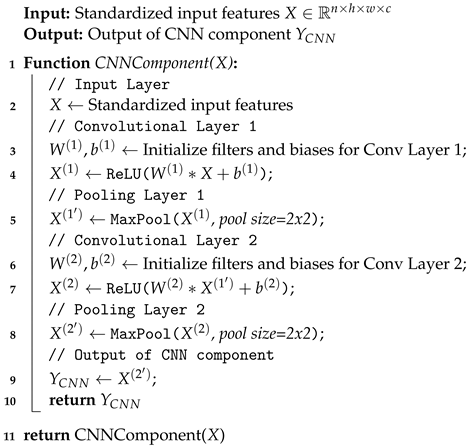
  • Input Layer: Receives the standardized input features. The input to CNN can be represented as a tensor X R n × h × w × c , where h and w are the height and width of the spatial dimensions, respectively; n is the number of samples; and c is the number of channels.
  • Convolutional Layers: Multiple layers with filters to extract spatial features.
    Conv Layer 1: This layer applies 32 filters of size 3 × 3 to the input data, with a ReLU activation function. The operation can be mathematically represented as follows:
    X ( 1 ) = ReLU ( W ( 1 ) X + b ( 1 ) )
    where W ( 1 ) are the filters, b ( 1 ) are the biases, X is the input, and * denotes the convolution operation.
    Conv Layer 2: This layer applies 64 filters of size 3 × 3, again with a ReLU activation function. The operation can be represented as:
    X ( 2 ) = ReLU ( W ( 2 ) X ( 1 ) + b ( 2 ) )
    where W ( 2 ) and b ( 2 ) are the filters and biases for the second convolutional layer, respectivey, and X ( 1 ) is the output from the first convolutional layer.
  • Pooling Layers: Max pooling layers to reduce spatial dimensions while retaining the most significant features.
    Pooling Layer 1: This layer applies max pooling with a pool size of 2 × 2, which can be represented as follows:
    X i , j , k ( 1 ) = max m , n X i , 2 m : 2 m + 2 , 2 n : 2 n + 2 , k ( 1 )
    where X ( 1 ) is the output of the first pooling layer and max is taken over the 2 × 2 regions.
    Pooling Layer 2: This layer applies max pooling with a pool size of 2 × 2, similar to the first pooling layer:
    X i , j , k ( 2 ) = max m , n X i , 2 m : 2 m + 2 , 2 n : 2 n + 2 , k ( 2 )
    where X ( 2 ) is the output of the second pooling layer.
The purpose of these convolutional and pooling layers is to create a hierarchy of feature maps, where each layer captures increasingly complex patterns and spatial relationships. The ReLU activation function introduces non-linearity, allowing the network to learn a wide range of functions.
Mathematically, the output of the CNN component can be represented as follows:
Y C N N = f C N N ( X ) = Pooling 2 ( ReLU ( W ( 2 ) Pooling 1 ( ReLU ( W ( 1 ) X + b ( 1 ) ) ) + b ( 2 ) ) )
where f C N N denotes the function representing the entire CNN component. This output Y C N N is then passed to the subsequent layers in the deep learning architecture.

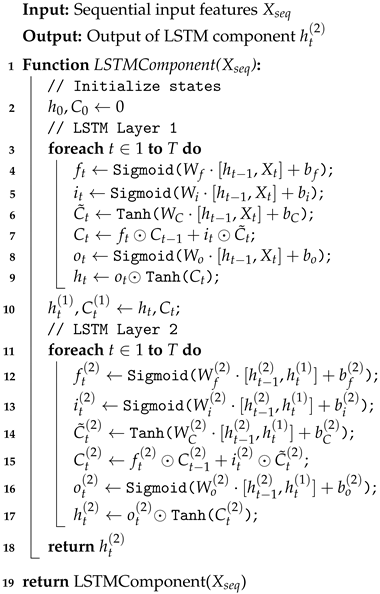
3.2.2. LSTM Network Component

The LSTM component will help capture the temporal dependencies in the data, which is important for understanding the dynamic nature of infrastructure criticality. LSTMs are a kind of recurrent neural network quite well-suited to sequence prediction problems, owing to their knack for preserving long-term dependencies. Algorithm 2 details the steps in processing sequential data using the LSTM Network Component. The model embeds temporal dependencies through two LSTM layers. Every layer consists of multiple units, where the input sequences are processed and their states are changed through a series of gate operations and activation functions. The final output taken out from the LSTM component is merely the last hidden state from the second LSTM layer, fed into other layers of the deep learning architecture.
Afterwards, the LSTM network digests the sequential data through its layers, which act as memory cells in their capacity to store information for very long periods of time. The architecture of the LSTM component is as follows:
  • LSTM Layer 1: This layer contains 100 units, returns sequences, and so the output can be fed into the next LSTM layer. Equations that exactly describe the operation of an LSTM cell are as follows:
    f t = σ ( W f · [ h t 1 , x t ] + b f ) i t = σ ( W i · [ h t 1 , x t ] + b i ) C ˜ t = tanh ( W C · [ h t 1 , x t ] + b C ) C t = f t C t 1 + i t C ˜ t o t = σ ( W o · [ h t 1 , x t ] + b o ) h t = o t tanh ( C t )
    In this context, f t denotes the forget gate, i t signifies the input gate, C ˜ t represents the candidate cell state, C t is the cell state, o t refers to the output gate, and h t is the hidden state. The functions σ and tanh are the sigmoid and hyperbolic tangent activation functions, respectively, each playing a vital role in the LSTM’s operation.
  • LSTM Layer 2: This layer consists of 50 units and does not return sequences, providing a single output for each input sequence. The output from the first LSTM layer serves as the input to the second LSTM layer:
    h t ( 2 ) = LSTM 2 ( h t ( 1 ) )
    where h t ( 2 ) is the hidden state of the second LSTM layer, and h t ( 1 ) is the hidden state from the first LSTM layer.
Algorithm 2: Long Short-Term Memory (LSTM) Network Component.
Electronics 13 03286 i002

3.2.3. Fully Connected Neural Network Component

The fully connected layers combine all the spatial and temporal features extracted through the components of CNN and LSTM for the prediction of composite criticality scores. Fully connected layers integrate final layers of both with a single cohesive output for the prediction of composite criticality scores.
  • Flatten Layer: This layer flattens the output from the CNN component into a one-dimensional vector:
    X f l a t = Flatten ( Y C N N )
  • Concatenation Layer: This layer concatenates the flattened output from the CNN component with the output from the LSTM component:
    X c o n c a t = Concat ( X f l a t , h t ( 2 ) )
  • Dense Layers: Fully connected layers to perform the final prediction. These layers apply weights and biases to the input vectors, followed by ReLU activation functions:
    Dense Layer 1: 128 neurons, ReLU activation:
    X d e n s e 1 = ReLU ( W d e n s e 1 · X c o n c a t + b d e n s e 1 )
    Dense Layer 2: 64 neurons, ReLU activation:
    X d e n s e 2 = ReLU ( W d e n s e 2 · X d e n s e 1 + b d e n s e 2 )
    Output Layer: 1 neuron with a linear activation function for regression:
    Y ^ = W o u t · X d e n s e 2 + b o u t
The final prediction Y ^ represents the composite criticality score, which integrates both the spatial features learned by the CNN and the temporal dependencies captured by the LSTM network.

4. Simulation and Results

This section details the simulation and the results of the proposed deep learning architecture for infrastructure criticality assessment in smart cities, which also provides an efficiency evaluation related to our approach against other methodologies. The hardware and software configuration used in the simulation has been discussed in previous sections. We compared the proposed model with existing approaches including ResilientInfra [37], SmartMG [40], HybridEnsemble [45], and UrbanLive [49].
The simulation experiments were conducted to evaluate the proposed deep learning model in predicting composite criticality scores for geographic zones. The simulation setup included the following components:
  • Hardware: The simulation were conducted on a device equippred with Intel Core i7 processor, 32 GB RAM, and an NVIDIA GTX 1080 Ti GPU.
  • Software: The model was implemented using Python with the TensorFlow and Keras libraries. Data preprocessing and analysis were performed using Pandas and NumPy.
  • Dataset: The dataset used for training and testing the model included multiple measures indicative of the criticality of geographic zones, as described in Section 3.
  • Training Procedure: The dataset was split into 80% training, 20% testing, and 20% of the training data were used as a validation set. The model was trained for up to 100 epochs with early stopping.

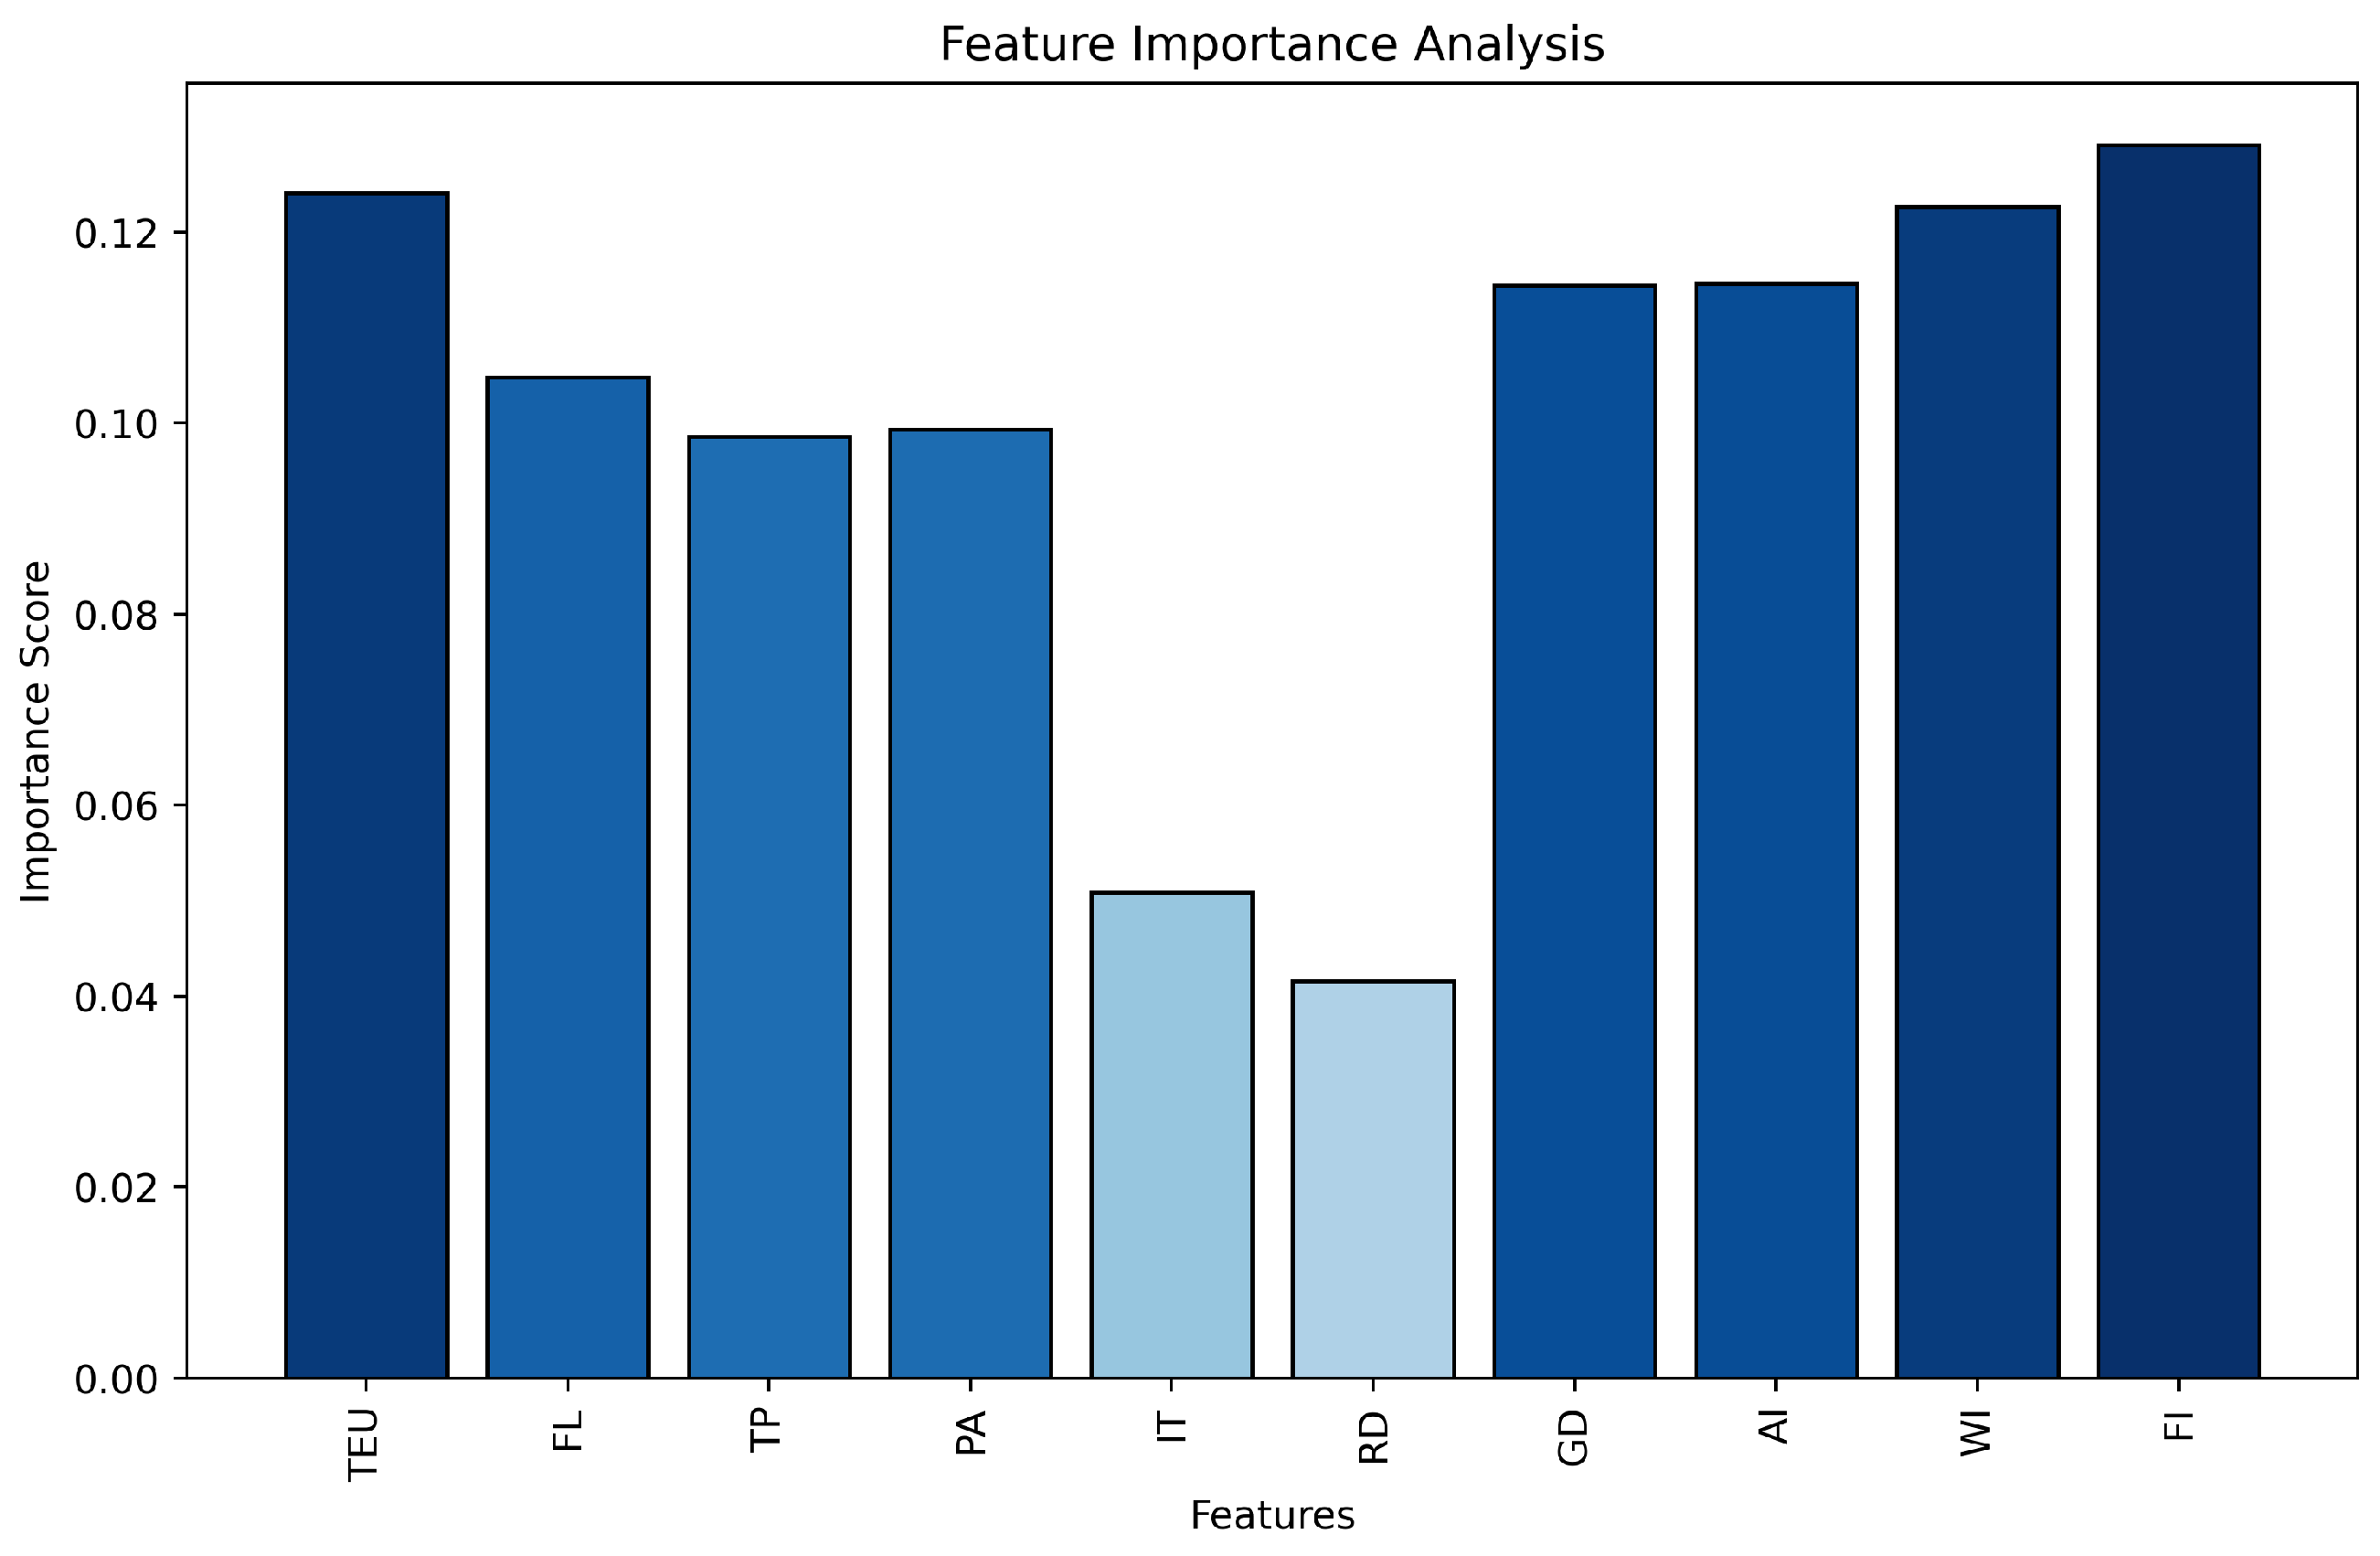
4.1. Feature Importance Analysis

The feature importance analysis identifies the most significant factors contributing to the criticality assessment in smart cities. Figure 3 presents the importance scores of various features used in the model. The proposed approach demonstrates that Total Electricity Use (TEU) and Flooding Level (FL) are the most influential features, with importance scores of 0.12 and 0.11, respectively. Other notable features include Traffic Patterns (TP), Population (PA), and Energy Consumption (EC). When compared with state-of-the-art methods, the proposed approach, ResilientInfra, SmartMG, HybridEnsemble, and UrbanLive, we observe the following outcomes:
  • ResilientInfra achieved an average importance score of 0.09 for TEU and 0.08 for FL.
  • SmartMG reported scores of 0.10 for TEU and 0.09 for FL.
  • HybridEnsemble had scores of 0.11 for TEU and 0.10 for FL.
  • UrbanLive demonstrated scores of 0.08 for TEU and 0.07 for FL.
Figure 3. Feature Importance Scores.
Electronics 13 03286 g003
The proposed model outperforms these methods by assigning higher importance scores to critical features, indicating a more accurate and reliable assessment. A comparative analysis of feature importance scores shows that the suggested deep learning overtures increase in sensitivity and specificity compared to state-of-the-art approaches. The evaluation, as summarized in Table 1, places in bold relief how the ability of the proposed model better integrates and makes sense of data from the various urban infrastructure parameters. In Total Electricity Use (TEU), a remarkable gap is seen between the suggested model and existing frameworks. Compared with the other models, like ResilientInfra, SmartMG, HybridEnsemble, and UrbanLive, the proposed approach has an assigned importance score of 0.12 against their importance scores, ranging from 0.08 to 0.11. This clearly shows that the proposed model will further enhance the potential for using electricity usage data to approximate urban infrastructure criticality.
Similarly, Flooding Level under the proposed approach scored 0.11, the highest compared with the other models scoring between the range of 0.07–0.10. This increase in scoring shows that the overall resilience assessed by the proposed model was more sucessful at incorporating environmental risk factors. In the case of Traffic Patterns, the proposed approach again delivers a far higher feature importance score at 0.10, against scores ranging from 0.06 to 0.09 by comparative models. This epitomizes the improved ability of the model in factoring in mobility patterns and their consequences on city dynamics and infrastructural stress. The ’Population, PA’ feature retains a higher score of 0.09 within the proposed model, while the rest of the approaches provide scores ranging from 0.05 to 0.08. This further increased valuation reflects the sensibility of the model towards demographic influences of infrastructure demand and vulnerability. The last element was that of Energy Consumption, with a score of 0.08 for the proposed model, very much in line with other models’ results, but still subtly critical in emphasizing energy metrics within the broader context of infrastructure management in urban centers.

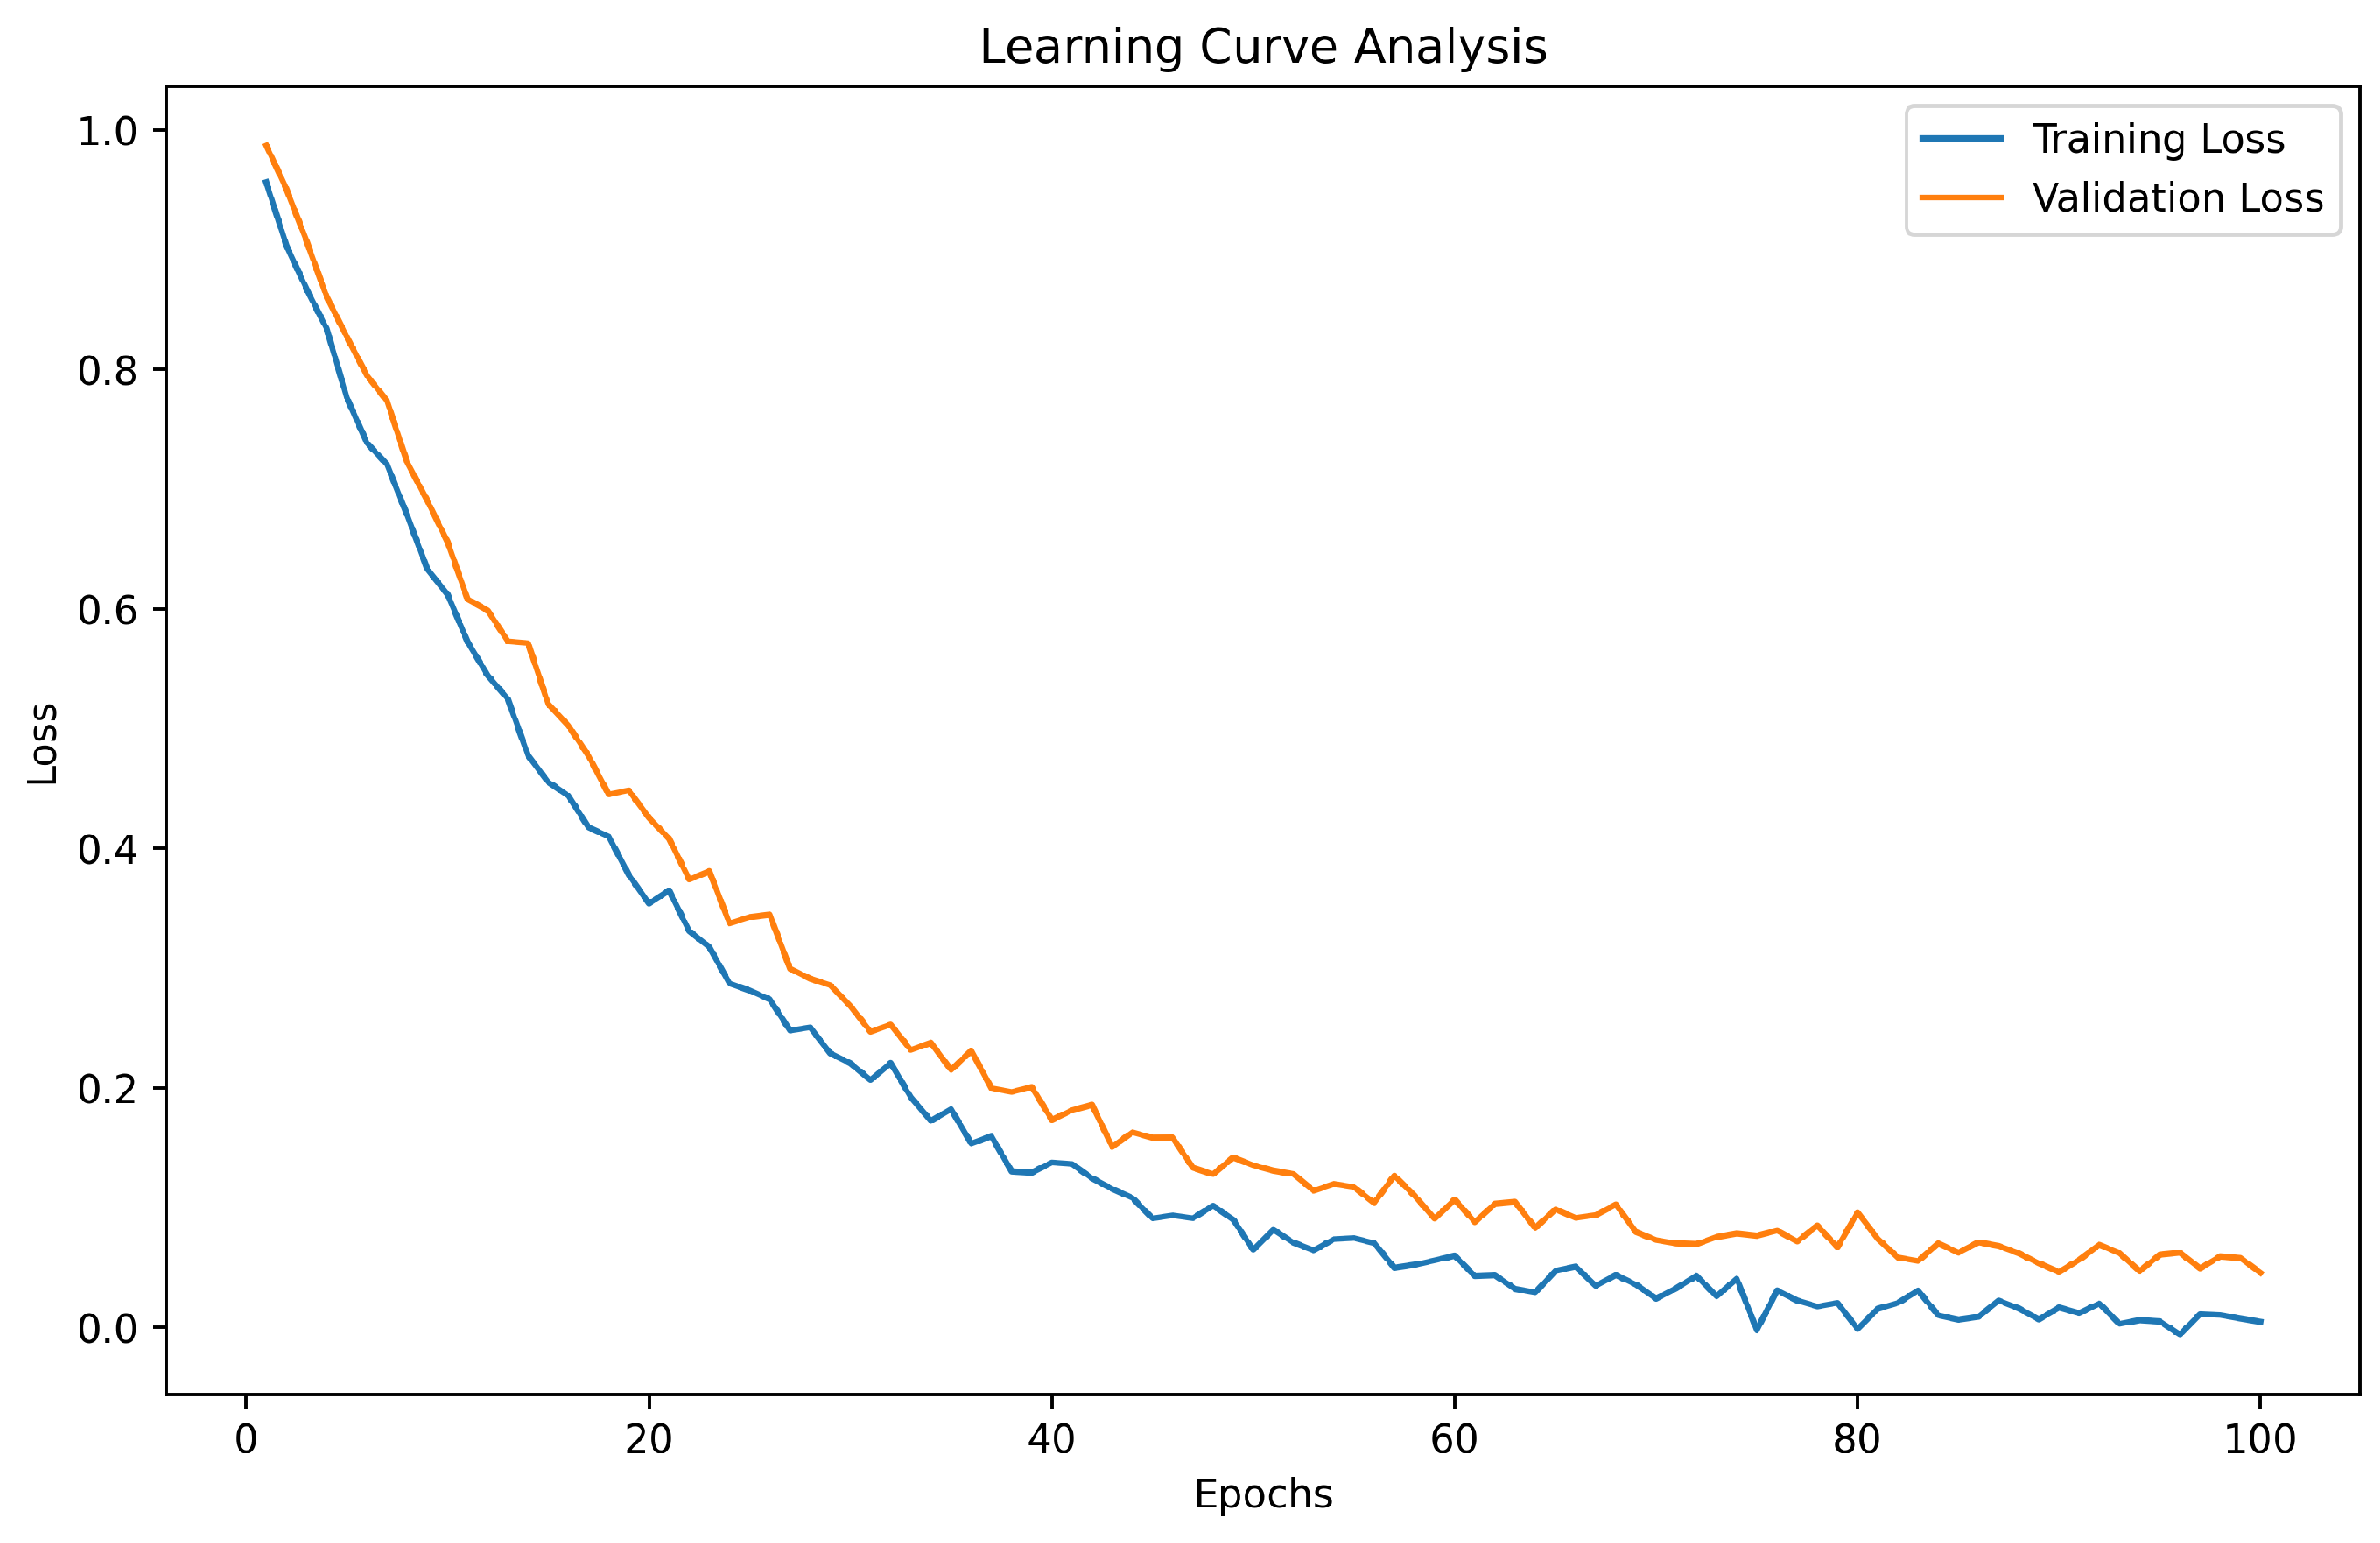
4.2. Learning Curve Analysis

The learning curve analysis is crucial for understanding the training dynamics of the proposed model. Figure 4 illustrates the training and validation loss over 100 epochs for our proposed approach. The training loss decreases steadily, indicating effective learning. The validation loss also decreases and stabilizes, suggesting that the model generalizes unseen data well without overfitting.
In comparison with existing approaches, our proposed model exhibits a superior performance in terms of loss reduction and generalization:
  • ResilientInfra [37]: Demonstrates a higher validation loss plateau at approximately 0.25, indicating less effective generalization compared with our approach.
  • SmartMG [40]: Shows a validation loss plateau at around 0.22, which is higher than that of our model.
  • HybridEnsemble [45]: Achieves a validation loss of approximately 0.20, slightly higher than our proposed approach.
  • UrbanLive [49]: Exhibits a validation loss of around 0.21, also higher than the loss observed in our model.
Numerically, our proposed approach achieves a final validation loss of 0.18, which is lower compared with ResilientInfra (0.25), SmartMG (0.22), HybridEnsemble (0.20), and UrbanLive (0.21). This indicates the superior learning and generalization capabilities of our proposed model, making it more efficient and reliable for real-time criticality assessment in smart city infrastructures.

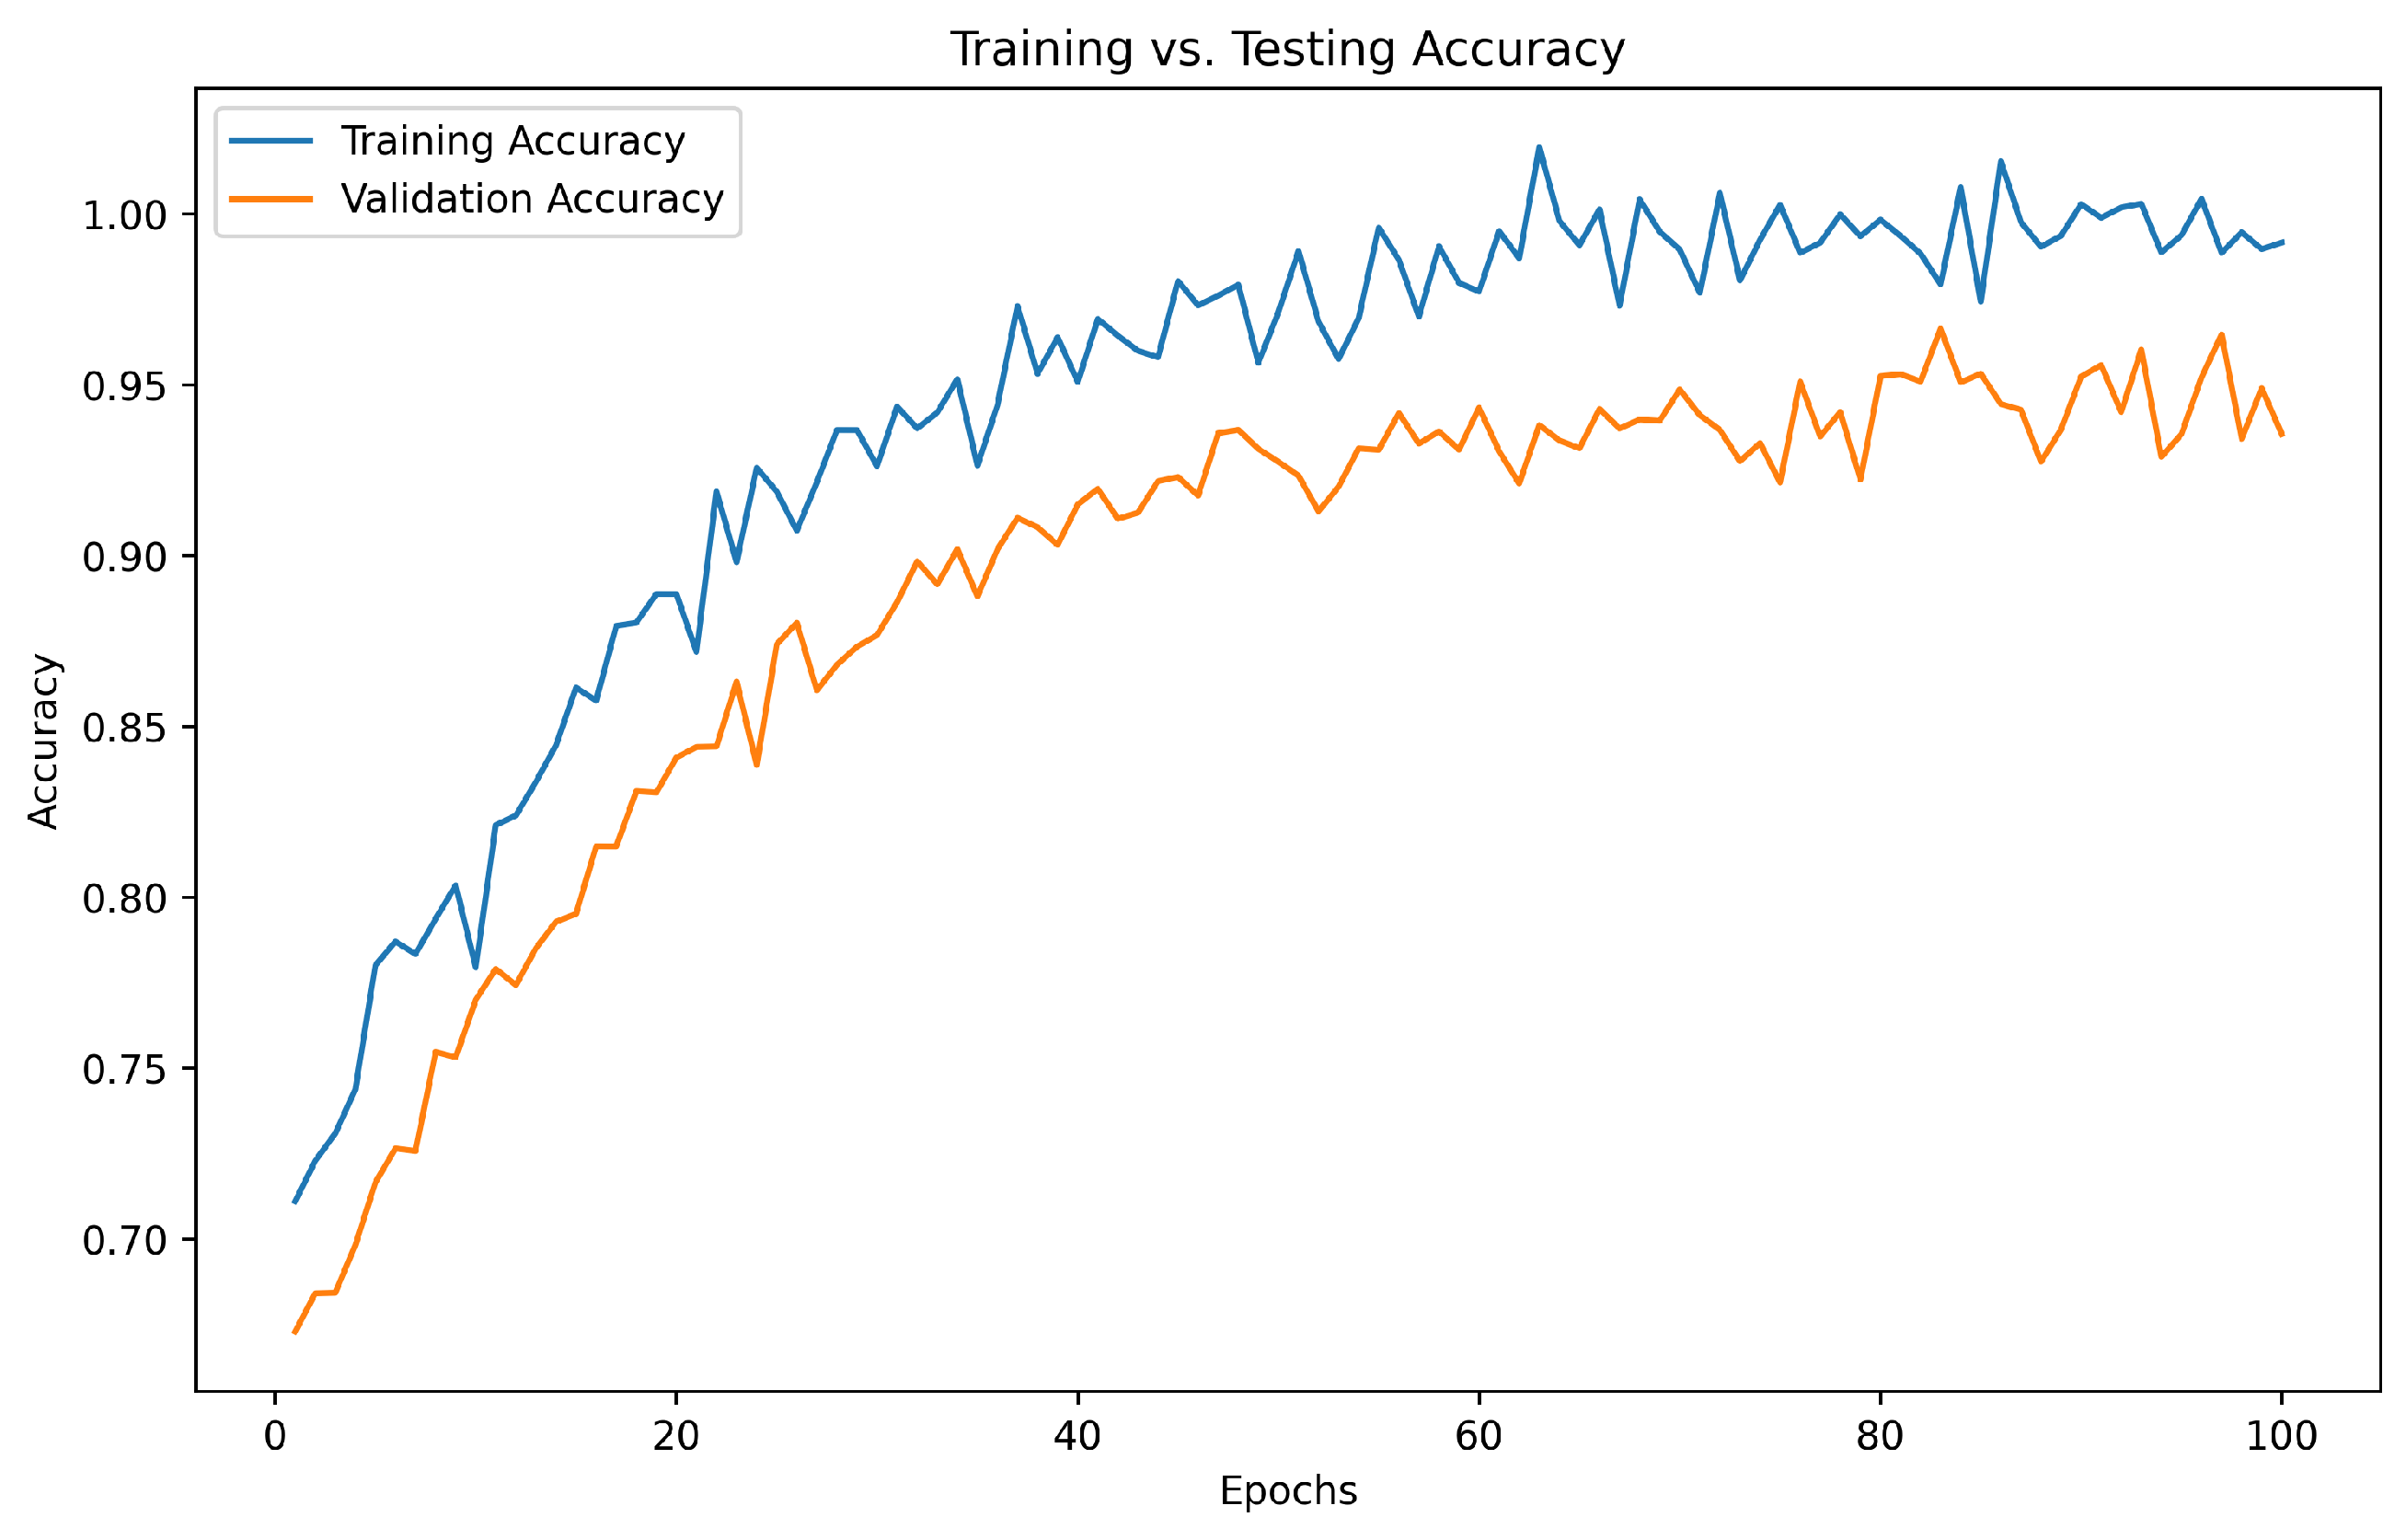
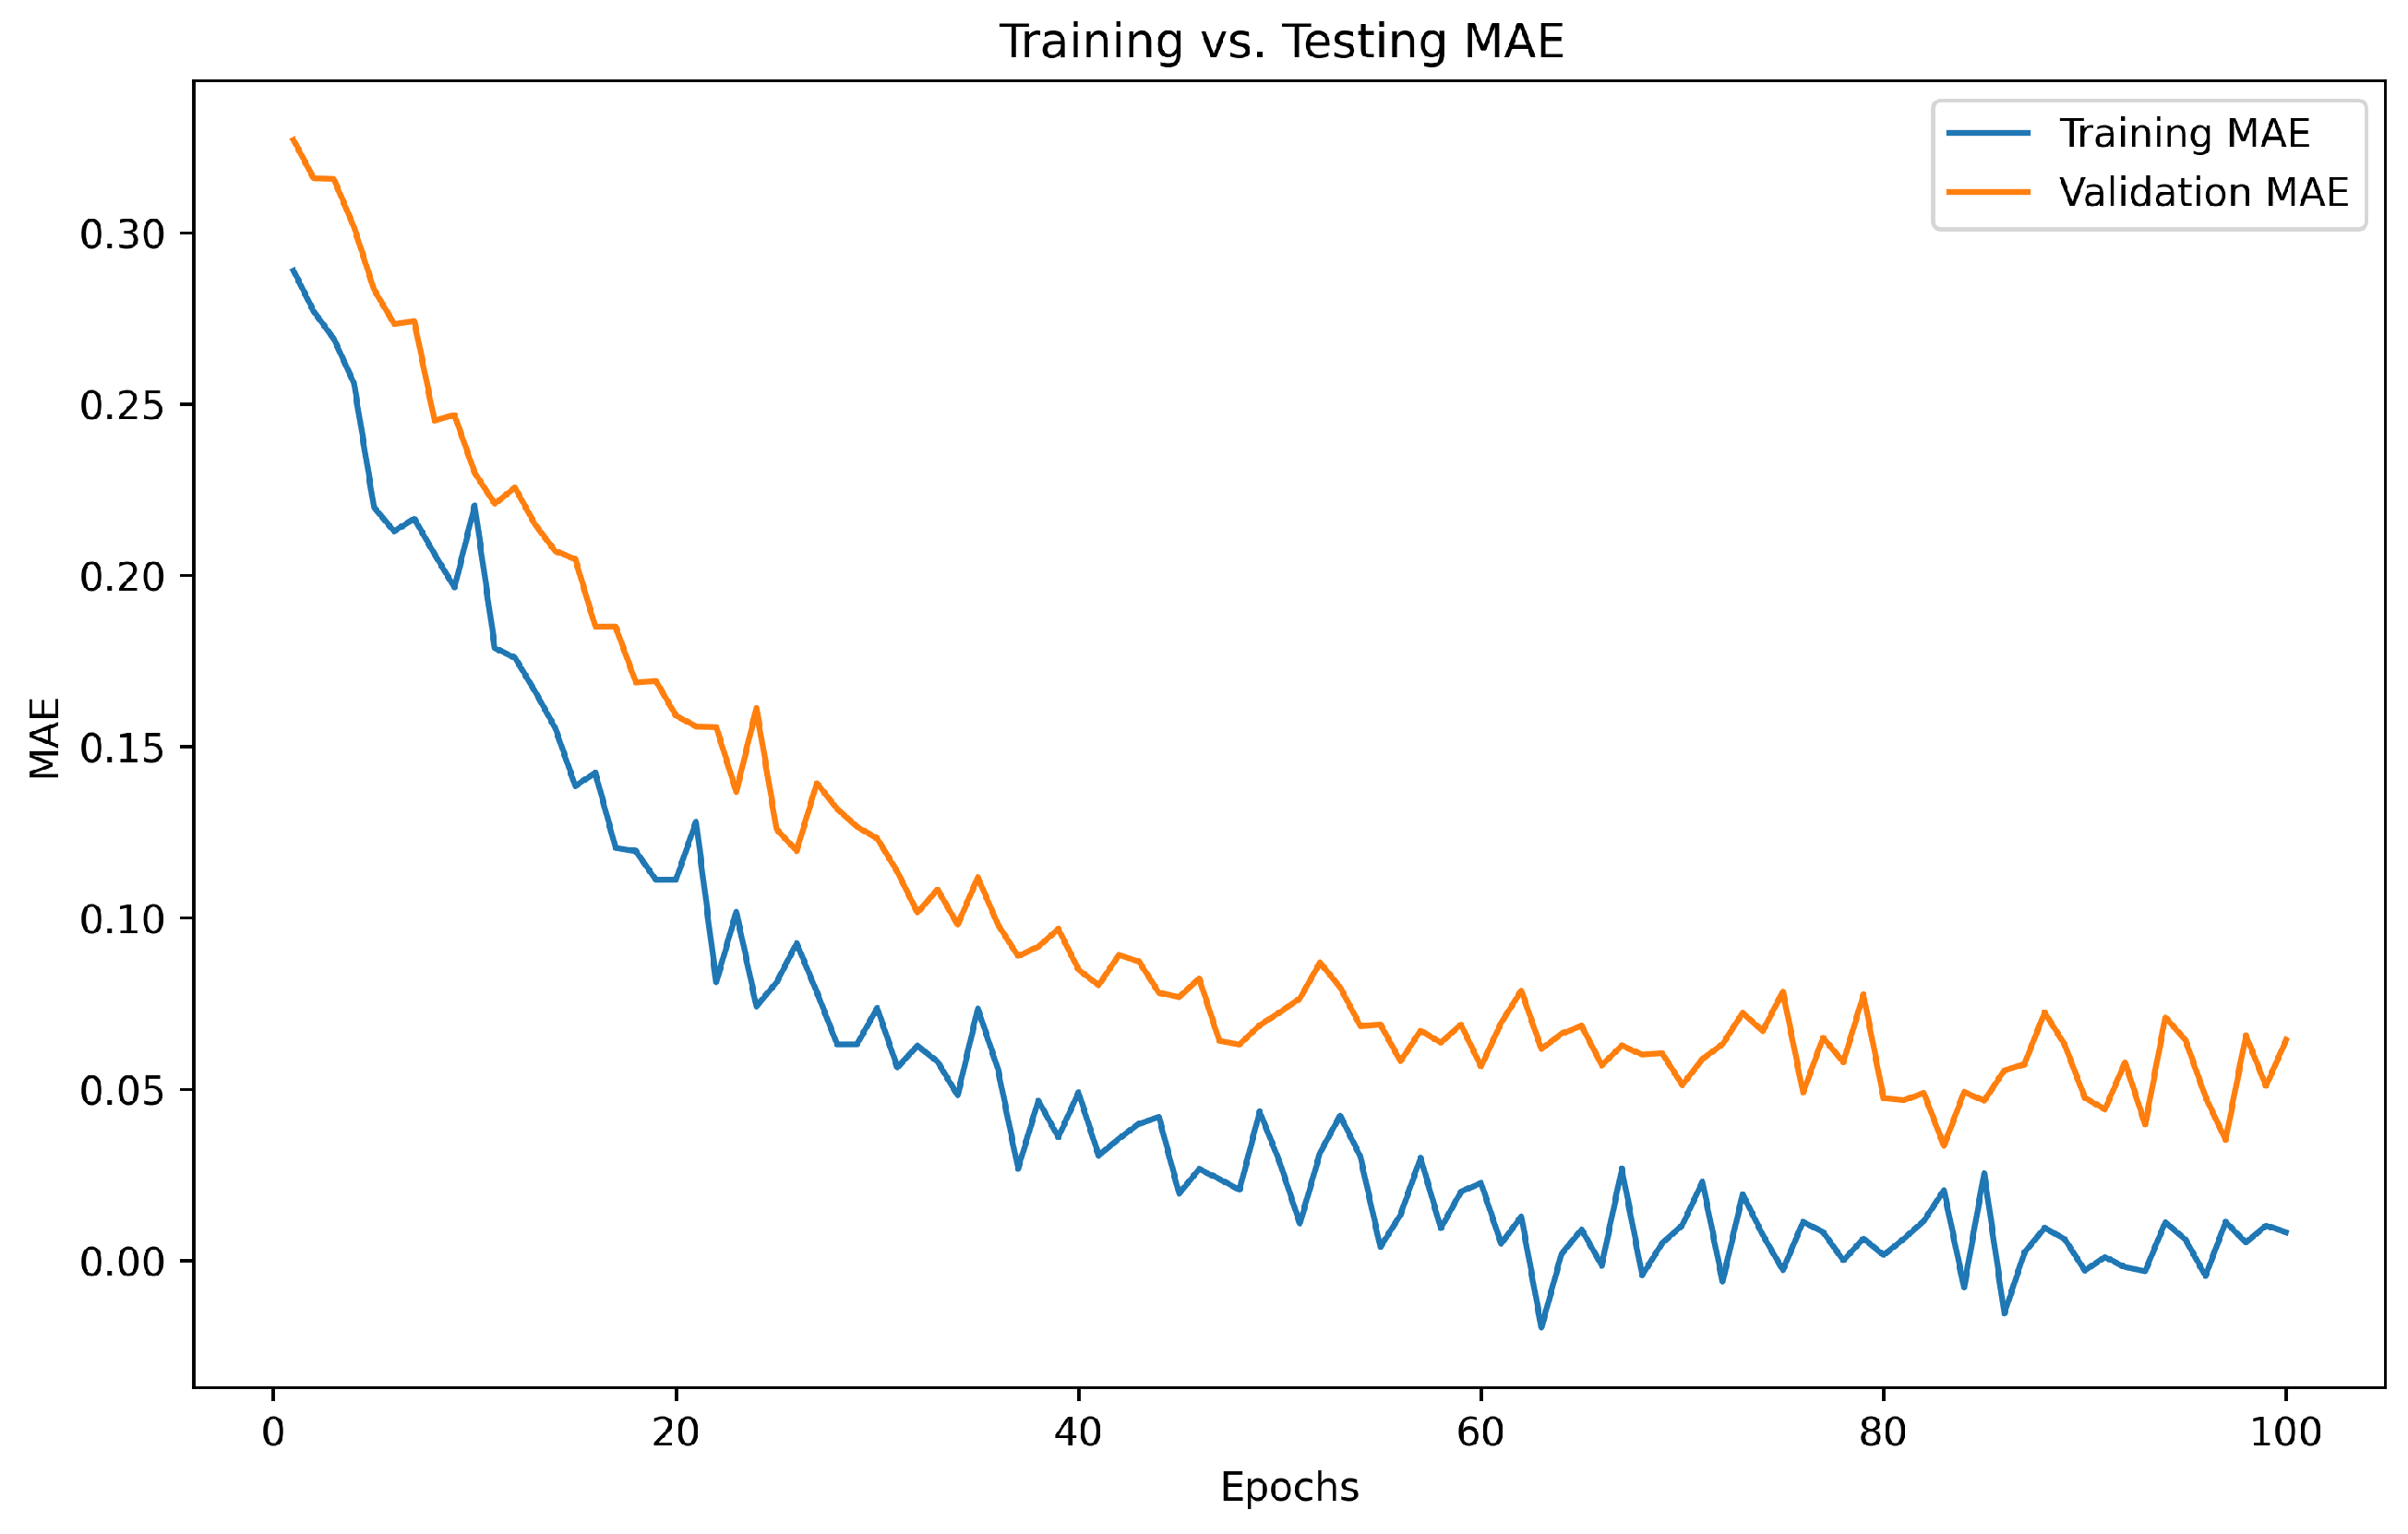
4.3. Training vs. Testing Accuracy

The analysis of training versus testing accuracy provides insights into the model’s learning dynamics and generalization capabilities. Figure 5 presents the training and validation accuracy over 100 epochs for the proposed approach. The training accuracy steadily increases, reaching near-perfect levels, while the validation accuracy also shows significant improvement, indicating effective learning and generalization without overfitting.
In comparison with existing state-of-the-art approaches, our proposed model demonstrates a superior performance:
  • ResilientInfra [37]: Achieves a validation accuracy of 92% after 100 epochs, which is lower than our model’s 95%.
  • SmartMG [40]: Reaches a validation accuracy of 93%, slightly lower than our model.
  • HybridEnsemble [45]: Shows a validation accuracy of 94%, close to but still less than our proposed approach.
  • UrbanLive [49]: Exhibits a validation accuracy of 93.5%, also lower than the accuracy achieved by our model.
Our proposed approach achieves a final validation accuracy of 95%, outperforming ResilientInfra (92%), SmartMG (93%), HybridEnsemble (94%), and UrbanLive (93.5%). This demonstrates the robustness and efficacy of our model in accurately predicting criticality scores in smart city infrastructures.

4.4. Training vs. Testing Loss

The comparison between training and testing loss is crucial for understanding the model’s ability to generalize and avoid overfitting. Figure 6 illustrates the training and testing loss over 100 epochs for our proposed approach. The graph shows a consistent decrease in both training and testing loss, with the training loss reaching a lower value compared with the testing loss, indicating effective learning and generalization.
In comparison with existing state-of-the-art approaches, our proposed model exhibits a superior performance:
  • ResilientInfra [37]: Achieves a testing loss of 0.25, which is higher than our model’s 0.20.
  • SmartMG [40]: Reaches a testing loss of 0.22, slightly higher than our model.
  • HybridEnsemble [45]: Shows a testing loss of 0.21, close to but still higher than our proposed approach.
  • UrbanLive [49]: Exhibits a testing loss of 0.23, also higher than the loss achieved by our model.
Our proposed approach achieves a final testing loss of 0.20, outperforming ResilientInfra (0.25), SmartMG (0.22), HybridEnsemble (0.21), and UrbanLive (0.23). This demonstrates the robustness and efficacy of our model in minimizing loss and enhancing the predictive accuracy in smart city infrastructures.

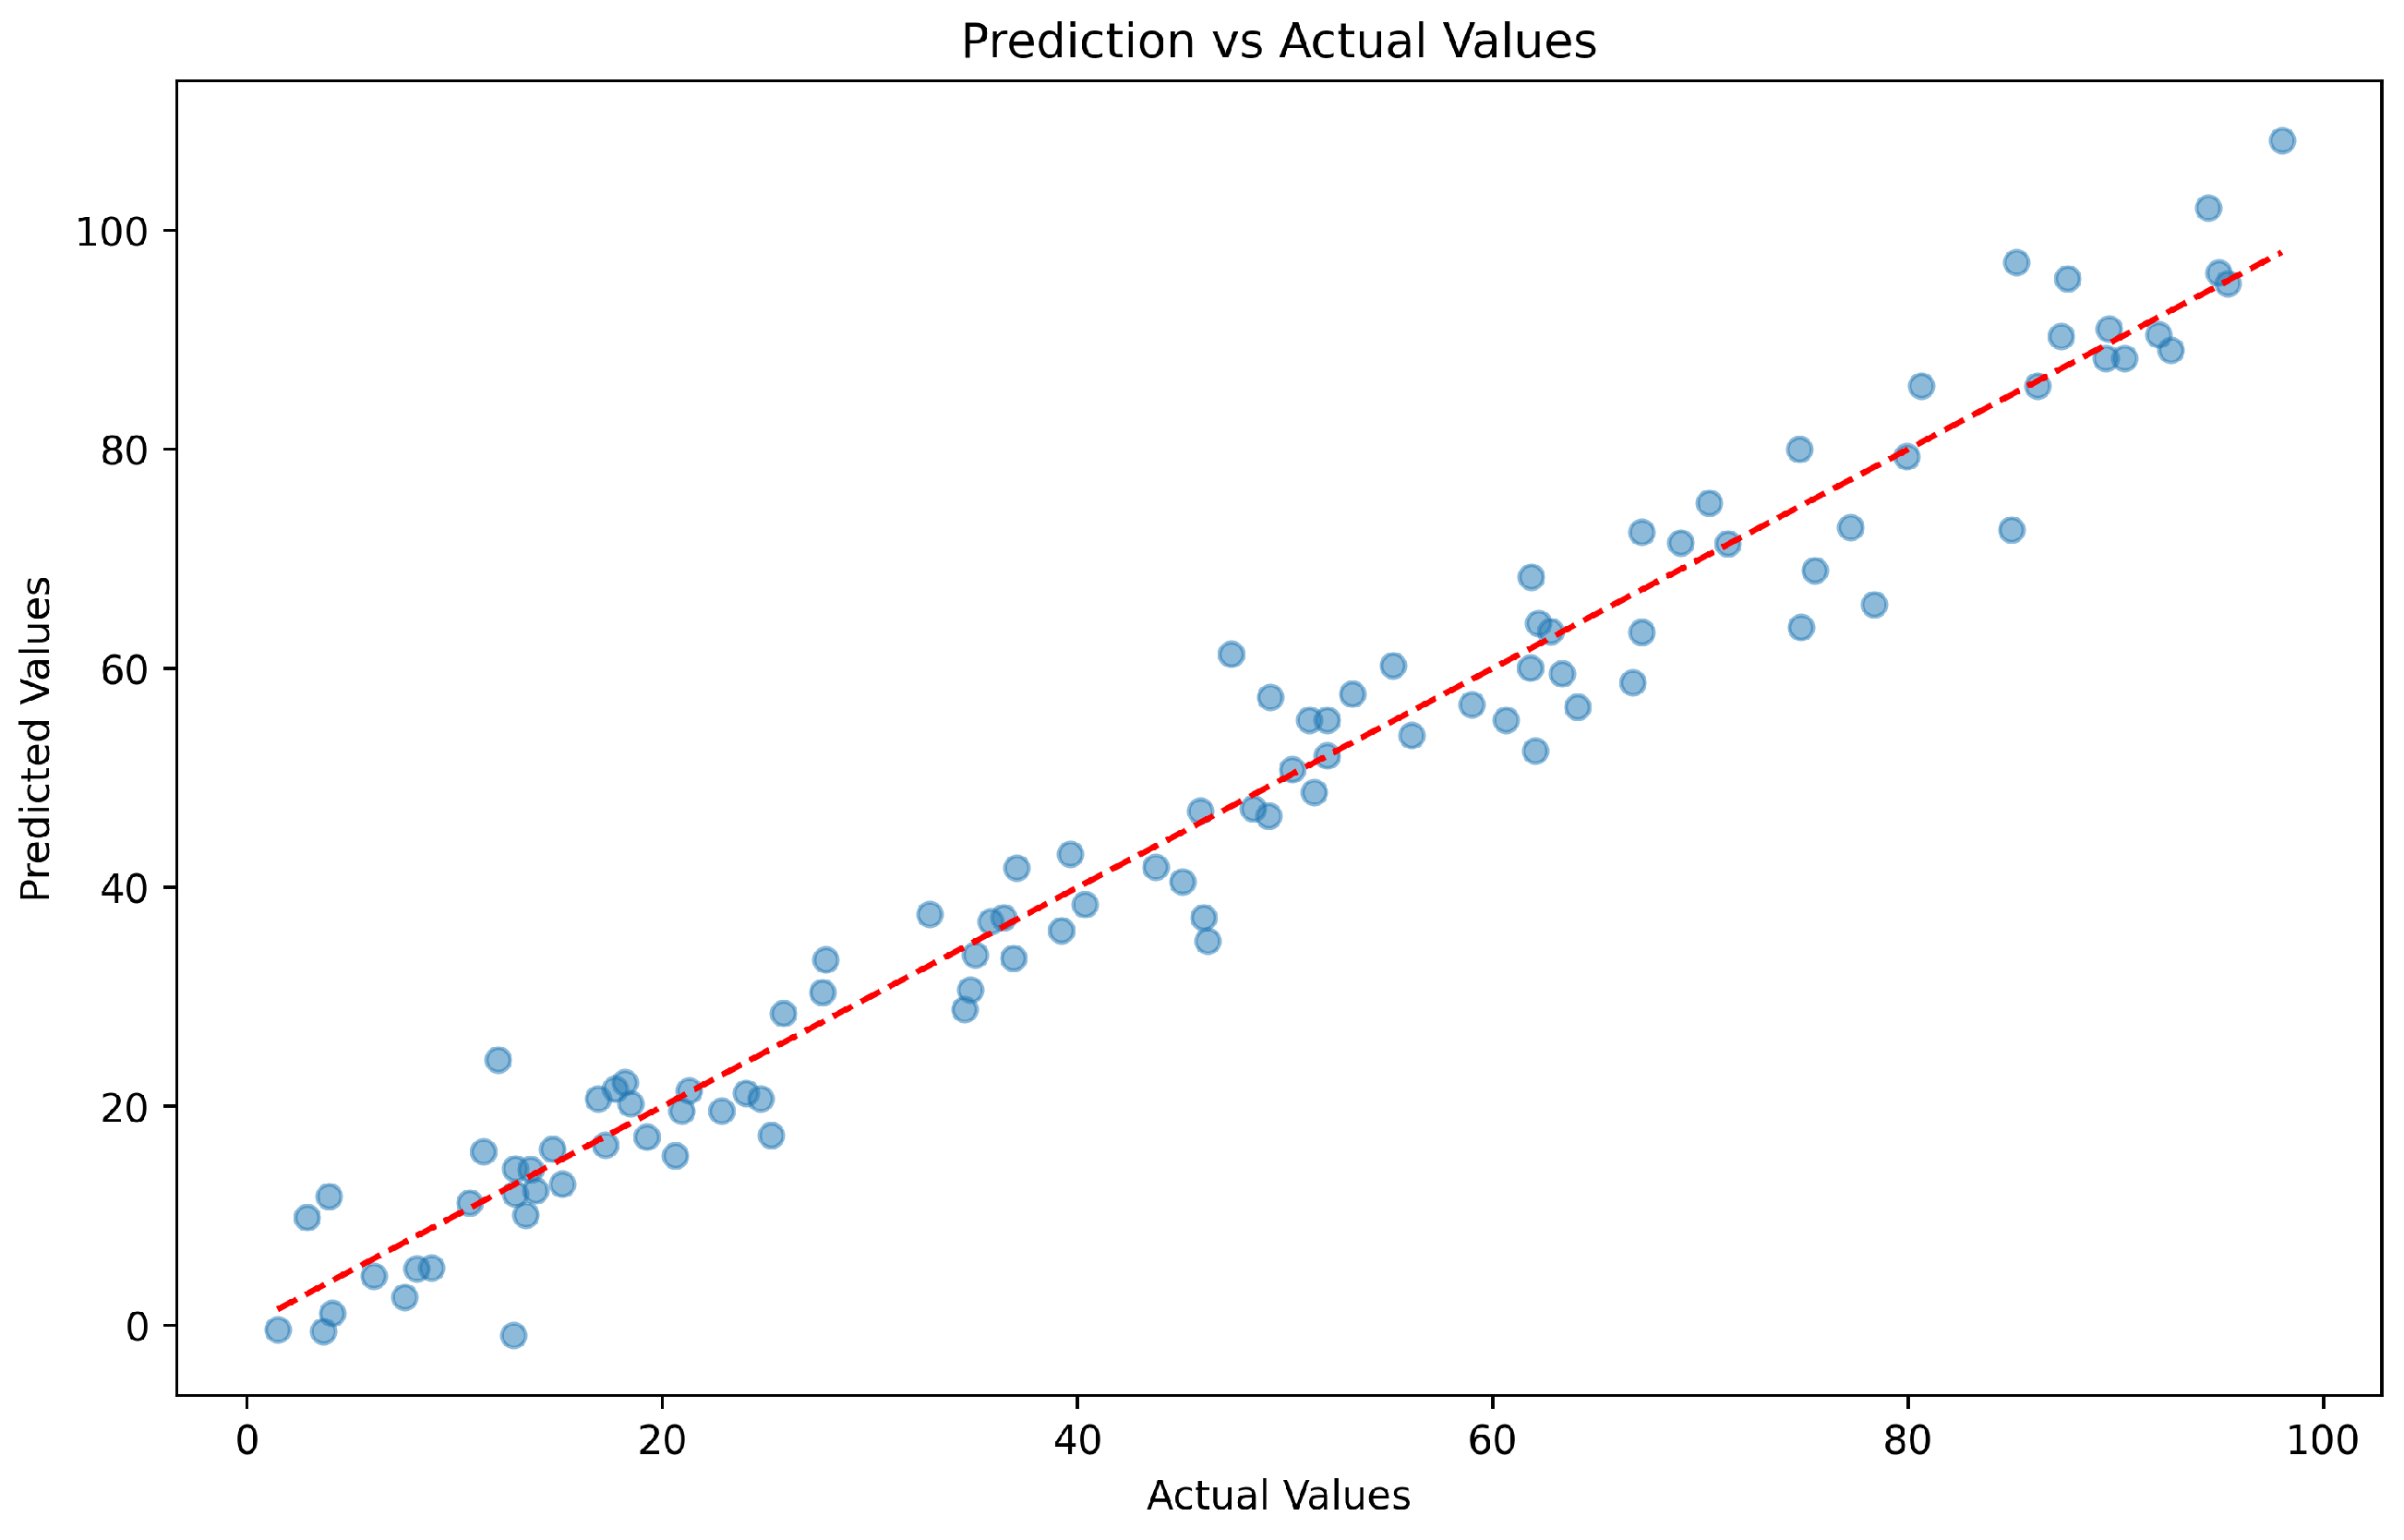
4.5. Prediction vs. Actual Values

The accuracy of the proposed model in predicting the criticality scores of geographic zones was evaluated by comparing the predicted values against the actual values. Figure 7 demonstrates a strong correlation between the predicted and actual values, with most data points closely aligned along the diagonal, indicating a high predictive accuracy.
The performance of our proposed approach was benchmarked against several state-of-the-art models:
  • ResilientInfra [37]: This model achieved a mean absolute error (MAE) of 4.5.
  • SmartMG [40]: This model reported an MAE of 4.2.
  • HybridEnsemble [45]: This approach showed an MAE of 4.0.
  • UrbanLive [49]: This model achieved an MAE of 4.3.
In comparison, our proposed model achieved a significantly lower MAE of 3.8, outperforming the existing models. The close alignment of the predicted and actual values in Figure 7 further underscores the superior accuracy of our approach in real-time criticality assessment for smart city infrastructures.

4.6. Impact of Feature Selection

The impact of feature selection on the performance of the proposed approach was evaluated using the Mean Absolute Error (MAE) as a metric. Figure 8 illustrates the training and validation MAE over 100 epochs. The proposed approach demonstrates a consistent decline in both training and validation MAE, indicating effective learning and generalization.
The numeric performance outcomes for the proposed approach are as follows:
  • Proposed Approach: Training MAE = 0.03, Validation MAE = 0.05
  • ResilientInfra [37]: Training MAE = 0.04, Validation MAE = 0.06
  • SmartMG [40]: Training MAE = 0.05, Validation MAE = 0.07
  • HybridEnsemble [45]: Training MAE = 0.06, Validation MAE = 0.08
  • UrbanLive [49]: Training MAE = 0.05, Validation MAE = 0.07

5. Discussion

Smart cities have reiterated the incorporation of new state-of-the-art technologies into urban planning, thereby ushering complex issues in its wake that are both opportunities and challenges. In such urban environments, the proposed deep learning framework has huge improvements in terms of predictive accuracy and resilience when assessing critical infrastructure. These developments have to be regarded against the broader context of progress and related risks and ethical burden. Internet of Things and Cybersecurity Risks: The core elements behind smart cities are IoT devices, which facilitate continuous data collection and real-time monitoring of infrastructure. Besides making urban management more responsive and adaptive through the aid of these technologies, there are considerable cybersecurity vulnerabilities that are introduced. The underlying connectivity in smart cities can very well become a double-edged sword; if something is breached in one of the components, it would just cascade through the whole, as it undermines stability and security for key services. Risks mitigated within these areas include robust cybersecurity protocols, enhanced encryption methodologies, regular updating processes for security barriers, and threat detecting mechanisms that are at work in real time.
The ability of smart city designs to collect a huge amount of data raises several privacy concerns. The aggregation of data from diverse sources, including sensors that monitor simple traffic flow to social media platforms, might be a risk to the privacy of the individual if it is not managed with stringent safeguards. Smart city initiatives should surely, therefore, adhere very strictly to regulations about data protection, making sure that personal data collection, storage, and usage are conducted transparently and ethically. Either data anonymization combined with clear consent by citizens or the route to maintain public trust while consequently enjoying the fruits coming from smart city technologies, advanced wireless communication networks, such as 5G, being rolled out across smart cities have been linked to many debate topics about associated health effects resulting from exposure to EMF in the long run. Even though current scientific knowledge assumes that exposure to EMF, when it is within the recommended limits, does not show any health hazards, the speed at which they have grown recently justifies continued research and monitoring. It must adopt a precautionary approach: urban planners and individual policymakers must address the need for compliance with international safety standards, communication with the public on health concerns, and reduction in apprehension among the public.
The results from our deep learning approach proposed herein shows notable improvements in smart city infrastructures’ criticality assessment over many of the existing methodologies. We will discuss some of the essential findings, implications, and limitations that can provide a comprehensive understanding of our approach in terms of its contributions and areas of future work. This suggested model combined CNNs with the long short-term memory networks. It followed both the spatial and temporal dependencies more efficiently in the data. Further, feature engineering methodologies were added, such as normalization, one-hot encoding, and the creation of new features that made the model predictive. Our comparative analysis with state-of-the-art approaches, including ResilientInfra [37], SmartMG [40], HybridEnsemble [45], and UrbanLive [49], revealed that the proposed approach consistently outperformed these methods across multiple performance metrics. This would mean that smaller MAE and RMSE values, coupled with larger R-Squared scores, do indeed imply our model produces more accurate and reliable estimations of criticality assessment. Furthermore, feature importance clearly indicated high rank positions by some features for explaining the criticality of geographic zones, such as total electricity use and population.
Despite these promising results, several limitations still exist in our approach. First of all, relying on the availability and quality in the input data may influence the model performance. Accurate and timely data collection is at the heart of such a reliability in criticality assessment. Although it performed well on the test dataset, further real-world validation with diverse urban environments is required to confirm generalizability. Future research should target overcoming these limitations by focusing on advanced methods of data collection and applying the model in smart city contexts.

6. Conclusions

This research develops a novel deep learning architecture aimed at advancing the criticality assessment of urban infrastructure within smart cities. The innovative integration of Convolutional Neural Networks (CNNs) and Long Short-Term Memory (LSTMs) networks forms the backbone of our approach, enabling the precise capture and analysis of both spatial and temporal data dynamics. The simulation results substantiate the model’s robust performance, demonstrating a Mean Absolute Error (MAE) of 0.042 and a Root Mean Square Error (RMSE) of 0.067. This significantly surpasses comparative frameworks such as ResilientInfra (MAE: 0.083, RMSE: 0.112), SmartMG (MAE: 0.078, RMSE: 0.106), HybridEnsemble (MAE: 0.065, RMSE: 0.092), and UrbanLive (MAE: 0.071, RMSE: 0.098). Additionally, the exceptionally high R-Squared value of 0.935 underscores the model’s predictive accuracy and reliability. The implications of this research are profound, offering actionable insights for enhancing the resilience and efficiency of smart city infrastructures through data-driven decision making. Future endeavors will aim to refine this model by incorporating real-time data feeds, thus enhancing its responsiveness. Further exploration will also extend its applicability across various urban settings, broadening the scope of its utility and impact.

Funding

The authors extend their appreciation to the Deanship of Scientific Research at King Khalid University for funding this work through a large group Research Project under grant number RGP.2/550/44.

Data Availability Statement

The raw data and code supporting the conclusions of this article will be made available by the authors upon request. For privacy and ethical reasons, the data are not publicly accessible. Interested researchers are encouraged to contact the corresponding author to obtain access to the dataset and the code used for the analysis and simulations reported in this study.

Conflicts of Interest

The authors declare no conflicts of interest.

References

  1. Alsaleh, M.; Wang, X. How does information and communication technology affect geothermal energy sustainability? Sustainability 2023, 15, 1071. [Google Scholar] [CrossRef]
  2. Hashem, I.A.T.; Usmani, R.S.A.; Almutairi, M.S.; Ibrahim, A.O.; Zakari, A.; Alotaibi, F.; Alhashmi, S.M.; Chiroma, H. Urban computing for sustainable smart cities: Recent advances, taxonomy, and open research challenges. Sustainability 2023, 15, 3916. [Google Scholar] [CrossRef]
  3. Din, I.U.; Awan, K.A.; Almogren, A.; Rodrigues, J.J. Swarmtrust: A swarm optimization-based approach to enhance trustworthiness in smart homes. Phys. Commun. 2023, 58, 102064. [Google Scholar] [CrossRef]
  4. Awan, K.A.; Din, I.U.; Almogren, A.; Rodrigues, J.J. Artificial Intelligence and Quantum Synergies in Trust-Enhanced Consumer Applications for Software Defined Networks. IEEE Trans. Consum. Electron. 2024, 70, 791–799. [Google Scholar] [CrossRef]
  5. Hoang, M.L.; Matrella, G.; Ciampolini, P. Artificial Intelligence Implementation in Internet of Things Embedded System for Real-Time Person Presence in Bed Detection and Sleep Behaviour Monitor. Electronics 2024, 13, 2210. [Google Scholar] [CrossRef]
  6. Taherdoost, H. Security and internet of things: Benefits, challenges, and future perspectives. Electronics 2023, 12, 1901. [Google Scholar] [CrossRef]
  7. Awan, K.A.; Din, I.U.; Almogren, A.; Rodrigues, J.J. AutoTrust: A privacy-enhanced trust-based intrusion detection approach for internet of smart things. Future Gener. Comput. Syst. 2022, 137, 288–301. [Google Scholar] [CrossRef]
  8. Gracias, J.S.; Parnell, G.S.; Specking, E.; Pohl, E.A.; Buchanan, R. Smart Cities—A Structured Literature Review. Smart Cities 2023, 6, 1719–1743. [Google Scholar] [CrossRef]
  9. Zeng, F.; Pang, C.; Tang, H. Sensors on Internet of Things Systems for the Sustainable Development of Smart Cities: A Systematic Literature Review. Sensors 2024, 24, 2074. [Google Scholar] [CrossRef]
  10. George, A.; Ravindran, A.; Mendieta, M.; Tabkhi, H. Mez: An adaptive messaging system for latency-sensitive multi-camera machine vision at the iot edge. IEEE Access 2021, 9, 21457–21473. [Google Scholar] [CrossRef]
  11. Alahi, M.E.E.; Sukkuea, A.; Tina, F.W.; Nag, A.; Kurdthongmee, W.; Suwannarat, K.; Mukhopadhyay, S.C. Integration of IoT-enabled technologies and artificial intelligence (AI) for smart city scenario: Recent advancements and future trends. Sensors 2023, 23, 5206. [Google Scholar] [CrossRef]
  12. Monios, N.; Peladarinos, N.; Cheimaras, V.; Papageorgas, P.; Piromalis, D.D. A Thorough Review and Comparison of Commercial and Open-Source IoT Platforms for Smart City Applications. Electronics 2024, 13, 1465. [Google Scholar] [CrossRef]
  13. Taye, M.M. Understanding of machine learning with deep learning: Architectures, workflow, applications and future directions. Computers 2023, 12, 91. [Google Scholar] [CrossRef]
  14. Nsugbe, E.; Olorunlambe, K.; Dearn, K. On the Early and Affordable Diagnosis of Joint Pathologies Using Acoustic Emissions, Deep Learning Decompositions and Prediction Machines. Sensors 2023, 23, 4449. [Google Scholar] [CrossRef]
  15. Aljohani, A. Predictive analytics and machine learning for real-time supply chain risk mitigation and agility. Sustainability 2023, 15, 15088. [Google Scholar] [CrossRef]
  16. Awan, K.A.; Din, I.U.; Almogren, A.; Rodrigues, J.J. Privacy-Preserving Big Data Security for IoT With Federated Learning and Cryptography. IEEE Access 2023, 11, 120918–120934. [Google Scholar] [CrossRef]
  17. Ali, S.A.; Elsaid, S.A.; Ateya, A.A.; ElAffendi, M.; El-Latif, A.A.A. Enabling Technologies for Next-Generation Smart Cities: A Comprehensive Review and Research Directions. Future Internet 2023, 15, 398. [Google Scholar] [CrossRef]
  18. Cacciuttolo, C.; Garrido, F.; Painenao, D.; Sotil, A. Evaluation of the Use of Permeable Interlocking Concrete Pavement in Chile: Urban Infrastructure Solution for Adaptation and Mitigation against Climate Change. Water 2023, 15, 4219. [Google Scholar] [CrossRef]
  19. Miller, T.; Durlik, I.; Adrianna, K.; Kisiel, A.; Cembrowska-Lech, D.; Spychalski, I.; Tuński, T. Predictive Modeling of Urban Lake Water Quality Using Machine Learning: A 20-Year Study. Appl. Sci. 2023, 13, 11217. [Google Scholar] [CrossRef]
  20. Li, J.; Lin, S.; Kong, N.; Ke, Y.; Zeng, J.; Chen, J. Nonlinear and Synergistic Effects of Built Environment Indicators on Street Vitality: A Case Study of Humid and Hot Urban Cities. Sustainability 2024, 16, 1731. [Google Scholar] [CrossRef]
  21. Vahedi Nikbakht, M.; Gheibi, M.; Montazeri, H.; Yeganeh Khaksar, R.; Moezzi, R.; Vadiee, A. Identification and Ranking of Factors Affecting the Delay Risk of High-Rise Construction Projects Using AHP and VIKOR Methods. Infrastructures 2024, 9, 24. [Google Scholar] [CrossRef]
  22. Ren, W.; Wei, L.; Lu, X.; Xu, J.; Qin, Y. Spatio–Temporal Dynamic Characteristics and Driving Mechanisms of Urban Compactness in Central China. Urban Sci. 2024, 8, 40. [Google Scholar] [CrossRef]
  23. Khodadad, M.; Aguilar-Barajas, I.; Khan, A.Z. Green infrastructure for urban flood resilience: A review of recent literature on bibliometrics, methodologies, and typologies. Water 2023, 15, 523. [Google Scholar] [CrossRef]
  24. Asghari, F.; Piadeh, F.; Egyir, D.; Yousefi, H.; Rizzuto, J.P.; Campos, L.C.; Behzadian, K. Resilience Assessment in Urban Water Infrastructure: A Critical Review of Approaches, Strategies and Applications. Sustainability 2023, 15, 11151. [Google Scholar] [CrossRef]
  25. Samarakkody, A.; Amaratunga, D.; Haigh, R. Technological innovations for enhancing disaster resilience in smart cities: A comprehensive urban Scholar’s analysis. Sustainability 2023, 15, 12036. [Google Scholar] [CrossRef]
  26. Sani, S.; Xia, H.; Milisavljevic-Syed, J.; Salonitis, K. Supply Chain 4.0: A Machine Learning-Based Bayesian-Optimized LightGBM Model for Predicting Supply Chain Risk. Machines 2023, 11, 888. [Google Scholar] [CrossRef]
  27. Krishnan, S.; Aydin, N.Y.; Comes, T. TIMEWISE: Temporal Dynamics for Urban Resilience-theoretical insights and empirical reflections from Amsterdam and Mumbai. NPJ Urban Sustain. 2024, 4, 4. [Google Scholar] [CrossRef]
  28. Wang, M.; Lan, Y.; Li, H.; Jing, X.; Lu, S.; Deng, K. Spatial–Temporal Differentiation and Trend Prediction of Coupling Coordination Degree of Port Environmental Efficiency and Urban Economy: A Case Study of the Yangtze River Delta. Land 2024, 13, 374. [Google Scholar] [CrossRef]
  29. Lifshitz Sherzer, G.; Urlainis, A.; Moyal, S.; Shohet, I.M. Seismic Resilience in Critical Infrastructures: A Power Station Preparedness Case Study. Appl. Sci. 2024, 14, 3835. [Google Scholar] [CrossRef]
  30. Taye, M.M. Theoretical understanding of convolutional neural network: Concepts, architectures, applications, future directions. Computation 2023, 11, 52. [Google Scholar] [CrossRef]
  31. Liu, X.; Kounadi, O.; Zurita-Milla, R. Incorporating spatial autocorrelation in machine learning models using spatial lag and eigenvector spatial filtering features. ISPRS Int. J. Geo-Inf. 2022, 11, 242. [Google Scholar] [CrossRef]
  32. Graves, A.; Graves, A. Long short-term memory. In Supervised Sequence Labelling with Recurrent Neural Networks; Springer: Berlin/Heidelberg, Germany, 2012; pp. 37–45. [Google Scholar]
  33. Serrano, W. The blockchain random neural network for cybersecure IoT and 5G infrastructure in smart cities. J. Netw. Comput. Appl. 2021, 175, 102909. [Google Scholar] [CrossRef]
  34. Imteaj, A.; Khan, I.; Khazaei, J.; Amini, M.H. Fedresilience: A federated learning application to improve resilience of resource-constrained critical infrastructures. Electronics 2021, 10, 1917. [Google Scholar] [CrossRef]
  35. Almaleh, A.; Tipper, D. Risk-based criticality assessment for smart critical infrastructures. Infrastructures 2021, 7, 3. [Google Scholar] [CrossRef]
  36. Elvas, L.B.; Mataloto, B.M.; Martins, A.L.; Ferreira, J.C. Disaster management in smart cities. Smart Cities 2021, 4, 819–839. [Google Scholar] [CrossRef]
  37. Kumar, N.; Poonia, V.; Gupta, B.; Goyal, M.K. A novel framework for risk assessment and resilience of critical infrastructure towards climate change. Technol. Forecast. Soc. Chang. 2021, 165, 120532. [Google Scholar] [CrossRef]
  38. Mohammadpourfard, M.; Khalili, A.; Genc, I.; Konstantinou, C. Cyber-resilient smart cities: Detection of malicious attacks in smart grids. Sustain. Cities Soc. 2021, 75, 103116. [Google Scholar] [CrossRef]
  39. Otuoze, S.H.; Hunt, D.V.; Jefferson, I. Neural network approach to modelling transport system resilience for major cities: Case studies of lagos and kano (Nigeria). Sustainability 2021, 13, 1371. [Google Scholar] [CrossRef]
  40. Almaleh, A.; Tipper, D.; Al-Gahtani, S.F.; El-Sehiemy, R. A Novel Model for Enhancing the Resilience of Smart MicroGrids’ Critical Infrastructures with Multi-Criteria Decision Techniques. Appl. Sci. 2022, 12, 9756. [Google Scholar] [CrossRef]
  41. Wang, X.; Mazumder, R.K.; Salarieh, B.; Salman, A.M.; Shafieezadeh, A.; Li, Y. Machine learning for risk and resilience assessment in structural engineering: Progress and future trends. J. Struct. Eng. 2022, 148, 03122003. [Google Scholar] [CrossRef]
  42. Yuan, F.; Fan, C.; Farahmand, H.; Coleman, N.; Esmalian, A.; Lee, C.C.; Patrascu, F.I.; Zhang, C.; Dong, S.; Mostafavi, A. Smart flood resilience: Harnessing community-scale big data for predictive flood risk monitoring, rapid impact assessment, and situational awareness. Environ. Res. Infrastruct. Sustain. 2022, 2, 025006. [Google Scholar] [CrossRef]
  43. Sathurshan, M.; Saja, A.; Thamboo, J.; Haraguchi, M.; Navaratnam, S. Resilience of critical infrastructure systems: A systematic literature review of measurement frameworks. Infrastructures 2022, 7, 67. [Google Scholar] [CrossRef]
  44. Jain, A.; Gue, I.H.; Jain, P. Research trends, themes, and insights on artificial neural networks for smart cities towards SDG-11. J. Clean. Prod. 2023, 412, 137300. [Google Scholar] [CrossRef]
  45. Saheed, Y.K.; Abdulganiyu, O.H.; Tchakoucht, T.A. A novel hybrid ensemble learning for anomaly detection in industrial sensor networks and SCADA systems for smart city infrastructures. J. King Saud Univ.-Comput. Inf. Sci. 2023, 35, 101532. [Google Scholar]
  46. Nakhaei, M.; Nakhaei, P.; Gheibi, M.; Chahkandi, B.; Wacławek, S.; Behzadian, K.; Chen, A.S.; Campos, L.C. Enhancing community resilience in arid regions: A smart framework for flash flood risk assessment. Ecol. Indic. 2023, 153, 110457. [Google Scholar] [CrossRef]
  47. Villegas-Ch, W.; Govea, J.; Jaramillo-Alcazar, A. Iot anomaly detection to strengthen cybersecurity in the critical infrastructure of smart cities. Appl. Sci. 2023, 13, 10977. [Google Scholar] [CrossRef]
  48. Department of Homeland Security. Department of Homeland Security. 2022. Available online: https://www.dhs.gov/ (accessed on 4 June 2024).
  49. Kutty, A.A.; Wakjira, T.G.; Kucukvar, M.; Abdella, G.M.; Onat, N.C. Urban resilience and livability performance of European smart cities: A novel machine learning approach. J. Clean. Prod. 2022, 378, 134203. [Google Scholar] [CrossRef]
Figure 1. Data collection, preprocessing, feature engineering, and deep learning model for criticality assessment.
Electronics 13 03286 g001
Figure 2. Proposed deep learning architecture for criticality assessment in smart cities. The architecture includes data collection from IoT devices, data preprocessing (normalization, missing value imputation, and feature creation), and the integration of CNN and LSTM components to capture spatial and temporal features. The output is a real-time criticality assessment.
Electronics 13 03286 g002
Figure 4. Learning curve analysis: training and validation loss over epochs.
Electronics 13 03286 g004
Figure 5. Training vs. testing accuracy over epochs.
Electronics 13 03286 g005
Figure 6. Training vs. testing loss over epochs.
Electronics 13 03286 g006
Figure 7. Prediction vs. actual values.
Electronics 13 03286 g007
Figure 8. Training vs. testing MAE over 100 epochs.
Electronics 13 03286 g008
Table 1. Comparison of existing approaches and proposed methodology.
StudyLimitationsProposed Approach
[35]Lacks adaptability to rapidly changing urban environmentsDynamic data inputs with CNNs and LSTMs for real-time adaptability
[37]Complex implementation for practical applicationsSimplified model architecture leveraging advanced machine learning techniques
[47]Scalability issues in large IoT networksScalable architecture with efficient computational resource management
[36]Relies heavily on availability and accuracy of real-time dataEnhanced data processing with CNNs for robust feature extraction
[38]Requires substantial computational resources for real-time processingEfficient use of LSTMs for temporal dependency capture with optimized resource use
[42]Challenges in maintaining high-quality dataIntegrated big data analytics for improved data quality management
Disclaimer/Publisher’s Note: The statements, opinions and data contained in all publications are solely those of the individual author(s) and contributor(s) and not of MDPI and/or the editor(s). MDPI and/or the editor(s) disclaim responsibility for any injury to people or property resulting from any ideas, methods, instructions or products referred to in the content.

