Article

Research on DC Electric Shock Protection Method Based on Sliding Curvature Accumulation Quantity

1
State Key Laboratory of Disaster Prevention & Reduction for Power Grid, Changsha University of Science and Technology, Changsha 410114, China
2
Hengyang Power Supply Branch, State Grid Hunan Electric Power Company Limited, Hengyang 421600, China
*
Authors to whom correspondence should be addressed.
Electronics 2024, 13(16), 3336; https://doi.org/10.3390/electronics13163336
Submission received: 26 June 2024 / Revised: 17 August 2024 / Accepted: 20 August 2024 / Published: 22 August 2024
(This article belongs to the Section Power Electronics)

Abstract

:
To address the limitations of current DC residual current protection methods, which primarily rely on the amplitude of DC residual current for fault detection and fail to safeguard against electric shocks at two points on the same side in DC Isolated Terra (IT) System systems, this paper introduces a novel protection method based on DC electric shock features. This paper first analyzes the sliding curvature accumulation and peak rise time features of DC basic residual current, load mutation current, and animal body electric shock current under multi-factor conditions. The analysis shows that sliding curvature accumulation in the range of 0.1 ≤ K ≤ 1 and a peak rise time of Δt ≥ 20 ms can effectively distinguish animal body electric shock. Then, based on this electric shock’s distinctive characteristics, an approach for identifying types of electric shock is developed. Finally, a DC residual current protective device (DC-RCD) is designed. The prototype test results demonstrate that the DC-RCD has an action time of ts < 70 ms. The proposed method accurately provides protection against electric shocks and effectively addresses the issue of inadequate protection when two fault points occur on the same side within an IT system. This approach holds significant reference value for the development of next-generation DC-RCDs.

1. Introduction

In recent years, with the implementation of national green energy and energy saving and emission reduction strategies, a large amount of distributed photovoltaic power generation, battery energy storage, and electric vehicle DC charging piles have become common, safety issues in low voltage DC power supply systems have become increasingly prominent, with several personal electric shock fatalities occurring in recent years [1,2,3]. Low-voltage DC systems (LVDC) predominantly employ Insulated Terra (IT) systems, where a single-point fault results in minimal residual current, thus maintaining high safety levels. If a single-point fault is not promptly eliminated, leading to a two-point fault, it can result in personal electric shock and fatalities [4,5,6]. At present, DC residual current detection technology is difficult to detect when two faults occur on the same side of the IT system. There is a detection blind spot and protection cannot be performed, which seriously threatens human life and safety [7,8]. Therefore, there is an urgent need to develop improved protection methods for low-voltage DC systems against electric shocks.
Extensive research has been conducted both domestically and internationally on the topic of electric shock protection in low-voltage DC systems. These studies predominantly focus on two areas: the analysis of electric shock protection under varying grounding methods [9,10,11,12,13,14], and the operational analysis of DC residual current devices (DC-RCDs) [15,16,17,18,19,20,21,22]. Regarding electric shock protection with different grounding techniques, refs. [9,10] compared the touch voltage thresholds of low-voltage DC systems and assessed their safety performance under grounding fault conditions. Refs. [11,12] further examined the protective efficacy of DC systems with diverse grounding methods while also considering the physiological effects of DC currents on the human body to assess the risks of typical electric shock incidents. Ref. [13] specifically addressed the protection against electric shock in DC distribution networks, evaluating human safety under different grounding scenarios, and proposed a method to enhance safety by increasing grounding resistance. In terms of the operation of DC-RCDs, ref. [15] investigated the specific disconnection time requirements for DC-RCDs under various voltage levels and grounding methods in low-voltage DC systems. Ref. [16] demonstrated the feasibility of utilizing DC-RCDs and insulation monitoring devices (IMDs) to safeguard against electric shocks and grounding faults in single-pole DC systems. Ref. [17] explored the configuration of action thresholds for DC-RCDs in DC systems. Ref. [18] introduced an enhanced residual current protection scheme that incorporates a communication system for the protection of low-voltage DC systems in residential buildings. Ref. [19] provided guidelines for DC-RCD configuration, considering the impact of line impedance on residual current detection. While these studies offer valuable insights into DC electric shock protection in IT systems, they primarily base their assessments on DC residual current magnitude, which is insufficient for addressing electric shock faults occurring at two points on the same side of an IT system.
To address the issue of inadequate protection against electric shock faults occurring at two points on the same side of IT systems, this paper proposes a novel identification method based on DC electric shock features. This paper provides a detailed introduction to the extraction methods for the sliding curvature accumulation and peak rise time features of direct current electric shock, analyzes the influence of various factors on the quantities of direct current electric shock features, and verifies its effectiveness by constructing a prototype based on the proposed identification method. The following is the arrangement of the remainder of this paper. The second section introduces the low-voltage direct current electric shock simulation test to obtain typical current waveforms. The third section analyzes the features of direct current electric shock current, extracts the sliding curvature accumulation and peak rise time electric shock features, and analyzes the impact of multiple factors on the quantities of the electric shock features. The fourth section proposes a DC electric shock identification model based on electric shock features. The fifth section validates the experiment of the DC-RCD prototype. The sixth section presents the conclusion.

2. LVDC Electric Shock Simulation Test

In order to simulate the LVDC IT system electric shock conditions, the group built a low-voltage DC electric shock simulation test platform, as shown in Figure 1, which is mainly composed of a three-phase voltage regulator, DC charging piles, voltage/current data acquisition system, organism electric shock branch circuit, and battery BMS (Battery Energy Management System) simulation loads, etc. The voltage is adjustable from 200 V to 750 V, and the rated current is 250 A.
The electric shock features of live pigs and human beings are similar, and researchers have selected live pigs as the object of electric shock tests when conducting simulated human electric shock tests [23]. The size of the electric shock current is related to the electric shock mode, path of electric shock, animal mass, electric shock voltage, and other factors, the multi-factor arrangement and combination to obtain the same voltage level and the same quality of 16 groups of experimental conditions, as shown in Table 1. Since the live pigs selected in this paper are 40 kg/90 kg, and the DC electric shock voltage is 250 V/500 V/650 V, 96 groups of tests are carried out considering different voltages and different qualities, and each is repeated 3 times, totaling 288 tests. During the test, both positive and negative levels were used to touch the live pigs simultaneously to simulate DC electric shock, and the electric shock current data were recorded in real-time during the test.
The typical current waveform obtained from the electric shock experiment platform is shown in Figure 2. From Figure 2a, it can be seen that the electric shock current waveform of the live pig is a slowly rising nonlinear current signal. From Figure 2b, the battery load burst current is a rapidly rising step signal. From Figure 2c, the basic residual current is a rapidly rising step signal.

3. Analysis of the Feature Quantities of DC Electric Shock Currents

The principle of DC residual current detection is to determine whether the sum of incoming and outgoing line currents is zero [7]. In the DC IT system, the two-point fault is divided into two cases of same-side and opposite-side faults, as shown in Figure 3, in which RH is high impedance. When the fault point is located in the two-point opposite-side fault in Figure 3a, DC-RCD can be realized according to the detection principle. When the fault point is located on the same side of the DC-RCD as in Figure 3b, the DC-RCD inlet and outlet line currents are completely canceled out, and only the line current can be detected, and the DC residual current cannot be detected. Therefore, the current detected when a two-point fault occurs in the DC IT system is the residual current or line current. In order to distinguish between personal electric shock and non-personal electric shock, effectively solve the two-point electric shock fault, and realize accurate personal electric shock protection, two-point same-side faults need to distinguish the difference between the load burst current and the personal electric shock current, in which DC loads are mainly resistive-capacitive loads. When two-point faults occur on opposite sides, it is necessary to distinguish between the basic residual current and the personal electric shock current, among which the basic residual current is the current to ground fault caused by line insulation damage.

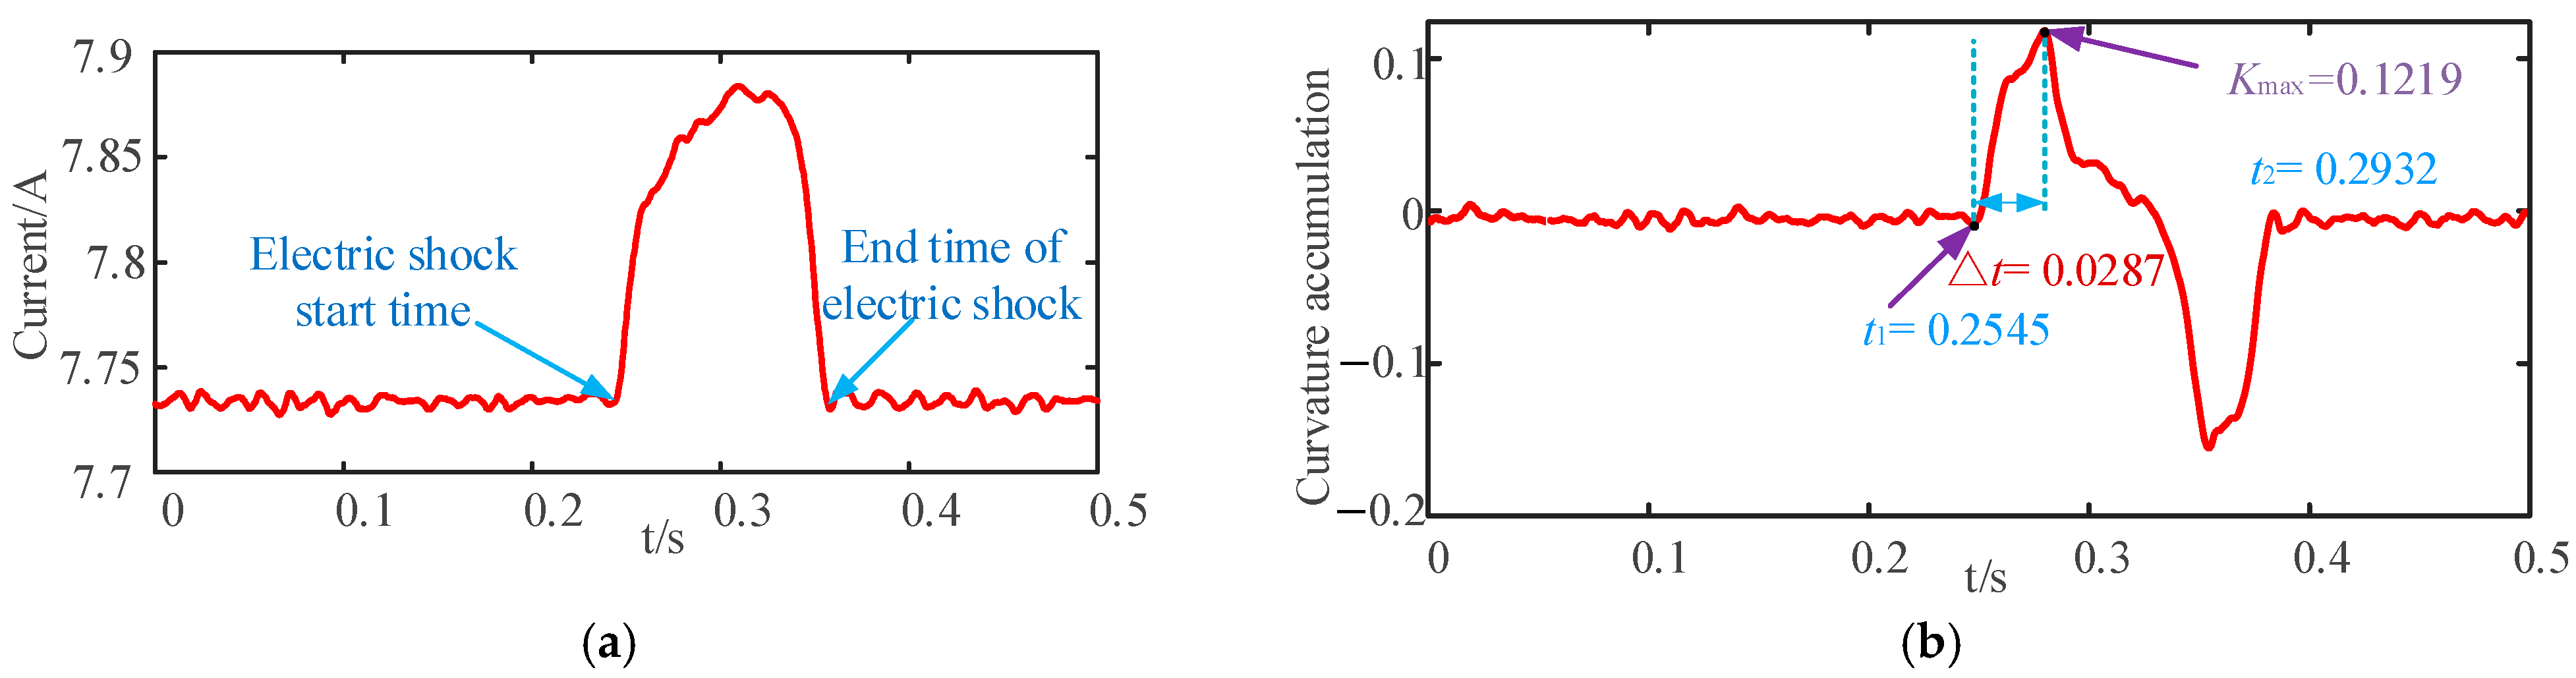
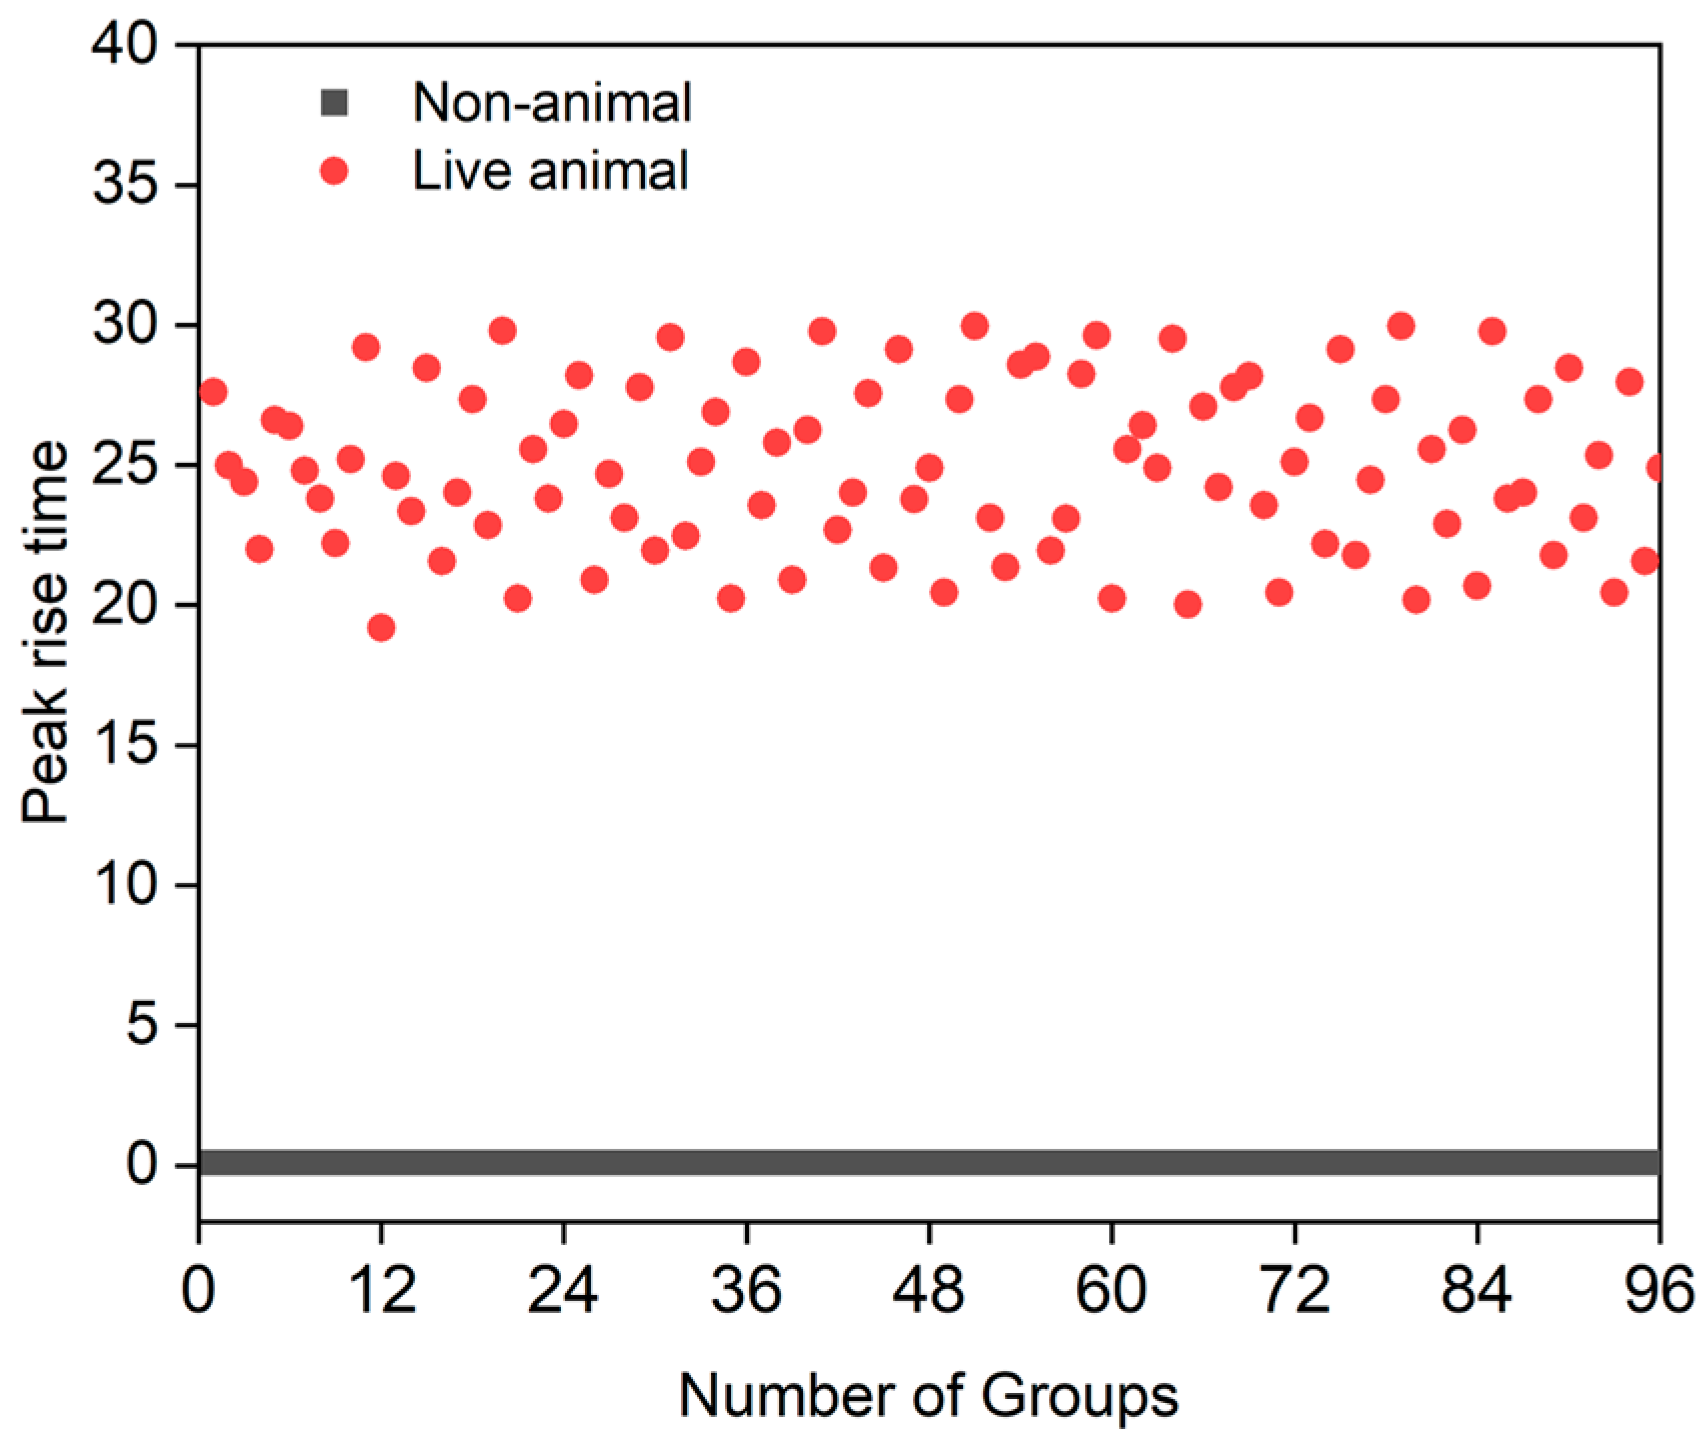
3.1. Characterization of Sliding Curvature Accumulation and Peak Rise Time

Curvature is a physical quantity that measures the degree of curvature of a curve at a specific point and is applicable to various DC current fault characterizations [24]. Since the battery load burst current, basic residual current, and touchdown current waveforms have different rise features, there are differences in their curvature changes. For this reason, this paper proposes a sliding curvature accumulation feature extraction method.
The curvature is defined as follows: the point N0 is selected on the curve C as the base point of the metric arc s, the arc at another point N on the curve is s, the angle of the tangent line at the point N1 is α, the point N1 corresponds to the arc length s + Δs, and the angle of the tangent line at the point N1 is α + Δα, as shown in Figure 4.
The arc length of NN1 is |Δs|, and the angle at which the tangent line turns at the moving point as it moves from N to N1 is denoted as |Δα|. This turned angle is divided by the arc length to define the mean curvature of a segment, |Δα/Δs|.
When Δs tends to 0, the limit of the mean curvature is obtained, which is the curvature K of the curve C at point N.
K = lim Δ S 0 | Δ a / Δ S |
When lim Δ S 0 Δ a Δ S = d a   d S ,
K = | d a / d S |
Assume that the equation of the curve is y = f(t) in rectangular coordinates and has second-order derivatives. Since y′ = tan a , then
d a = y 1 + y d t
Since the arc length differential d S = 1 + y 2 d t , the curvature is obtained as:
K = y ( 1 + y 2 ) 3 / 2
Assuming that the sampled current signal Ig(t) contains N sampling points (Ig(t), Ig(t + Δt), Ig(t + 2Δt), …, Ig(t + NΔt)), and the length of the sampling interval is Δt, the specific steps of the sliding current curvature accumulation feature extraction are:
(1)
Data preprocessing. There are clutter interference signals in the sampled DC current signal Ig, the wavelet soft-threshold filtering algorithm [25] is the wavelet detail coefficients on each scale to establish the corresponding threshold, according to the coefficients exceed the threshold with or without it to take different processing methods, applicable to the filtering of DC current signals, the filtering algorithm is:
H = s g n ( H ) ( H α G s ) , H > G s 0 H < G s
where H is the wavelet decomposition detail coefficients, Gs is the threshold value, the scale factor α is: 0 α 1 , sgn() is the sign function.
The wavelet coefficients of small values obtained after wavelet transform of the interference signal are rejected, and then wavelet reconstruction is carried out to obtain the filtered DC current signal y = Ih(t).
(2)
Determine the sliding window size. The window size should be determined according to the sampling frequency of the DC current data and the frequency of current change, and select the appropriate window length L. In this paper, the sliding window size is 100.
(3)
Calculate the curvature of the current within the sliding window. In the DC current signal Ih(t) to build L points Ih(t), Ih(t + Δt), …, I[t + (L − 1)Δt] in the sliding window current data, according to the Formula (5) to calculate the curvature of the current, where y′ and y″ can be expressed by the following equation:
y = f ( t ) = I h ( t + Δ t ) I h ( t Δ t ) 2 Δ t y = f ( t ) = I h ( t + Δ t ) 2 I h ( t ) + I h ( t Δ t ) Δ t 2
The curvature accumulation is obtained by taking the sum of the curvatures at each point in the window and accumulating the curvature from the curvature at the current point at time t and all the curvature calculations for the next L points:
K ( t ) = i = t t + L 1 k ( i )
The curvature accumulation amplifies the current burst features of a single sampling moment and improves the fault identification accuracy.
In this paper, the sampling frequency of the current is 10 kHz, and the sampling step Δt (0.0001 s) is categorized as 1 for 1 A in order to facilitate the calculation.
(4)
The window is moved, and the window is moved forward by a distance of one step, and then the calculation of the previous step is repeated to calculate the amount of curvature accumulation within this window.
In this paper, the Wavelet Transform Modulus Maximum method (WTMM) is used to determine the peak rise time. The feature extraction results of different types of currents extracted according to the sliding current curvature accumulation and WTMM are shown in Figure 5, Figure 6 and Figure 7.
From Figure 5b, it can be seen that the curvature accumulation tends to 0 when no electric shock occurs under normal conditions, and the curvature accumulation rises slowly after the occurrence of pig electric shock, with a peak curvature accumulation of 0.1219 and a peak rise time Δt of 28.7 ms. From Figure 6b, it can be seen that at the instant of the battery load access, the curvature accumulation peaks at 0.05424, and the peak rise time Δt of 0.18 ms. From Figure 7b, it can be seen that at the moment of the sudden change of the base residual current, the peak rise time Δt of 0.18 ms is determined. It can be seen that at the instant of sudden change of base residual current, the peak value of curvature accumulation is 0.1357, and the peak rise time of curvature accumulation arriving at the peak Δt is 0.2 ms. There are great differences in the current curvature accumulation and peak rise time under different types of currents, and therefore, the curvature accumulation and peak rise time can be adopted as the feature quantities of electric shock.

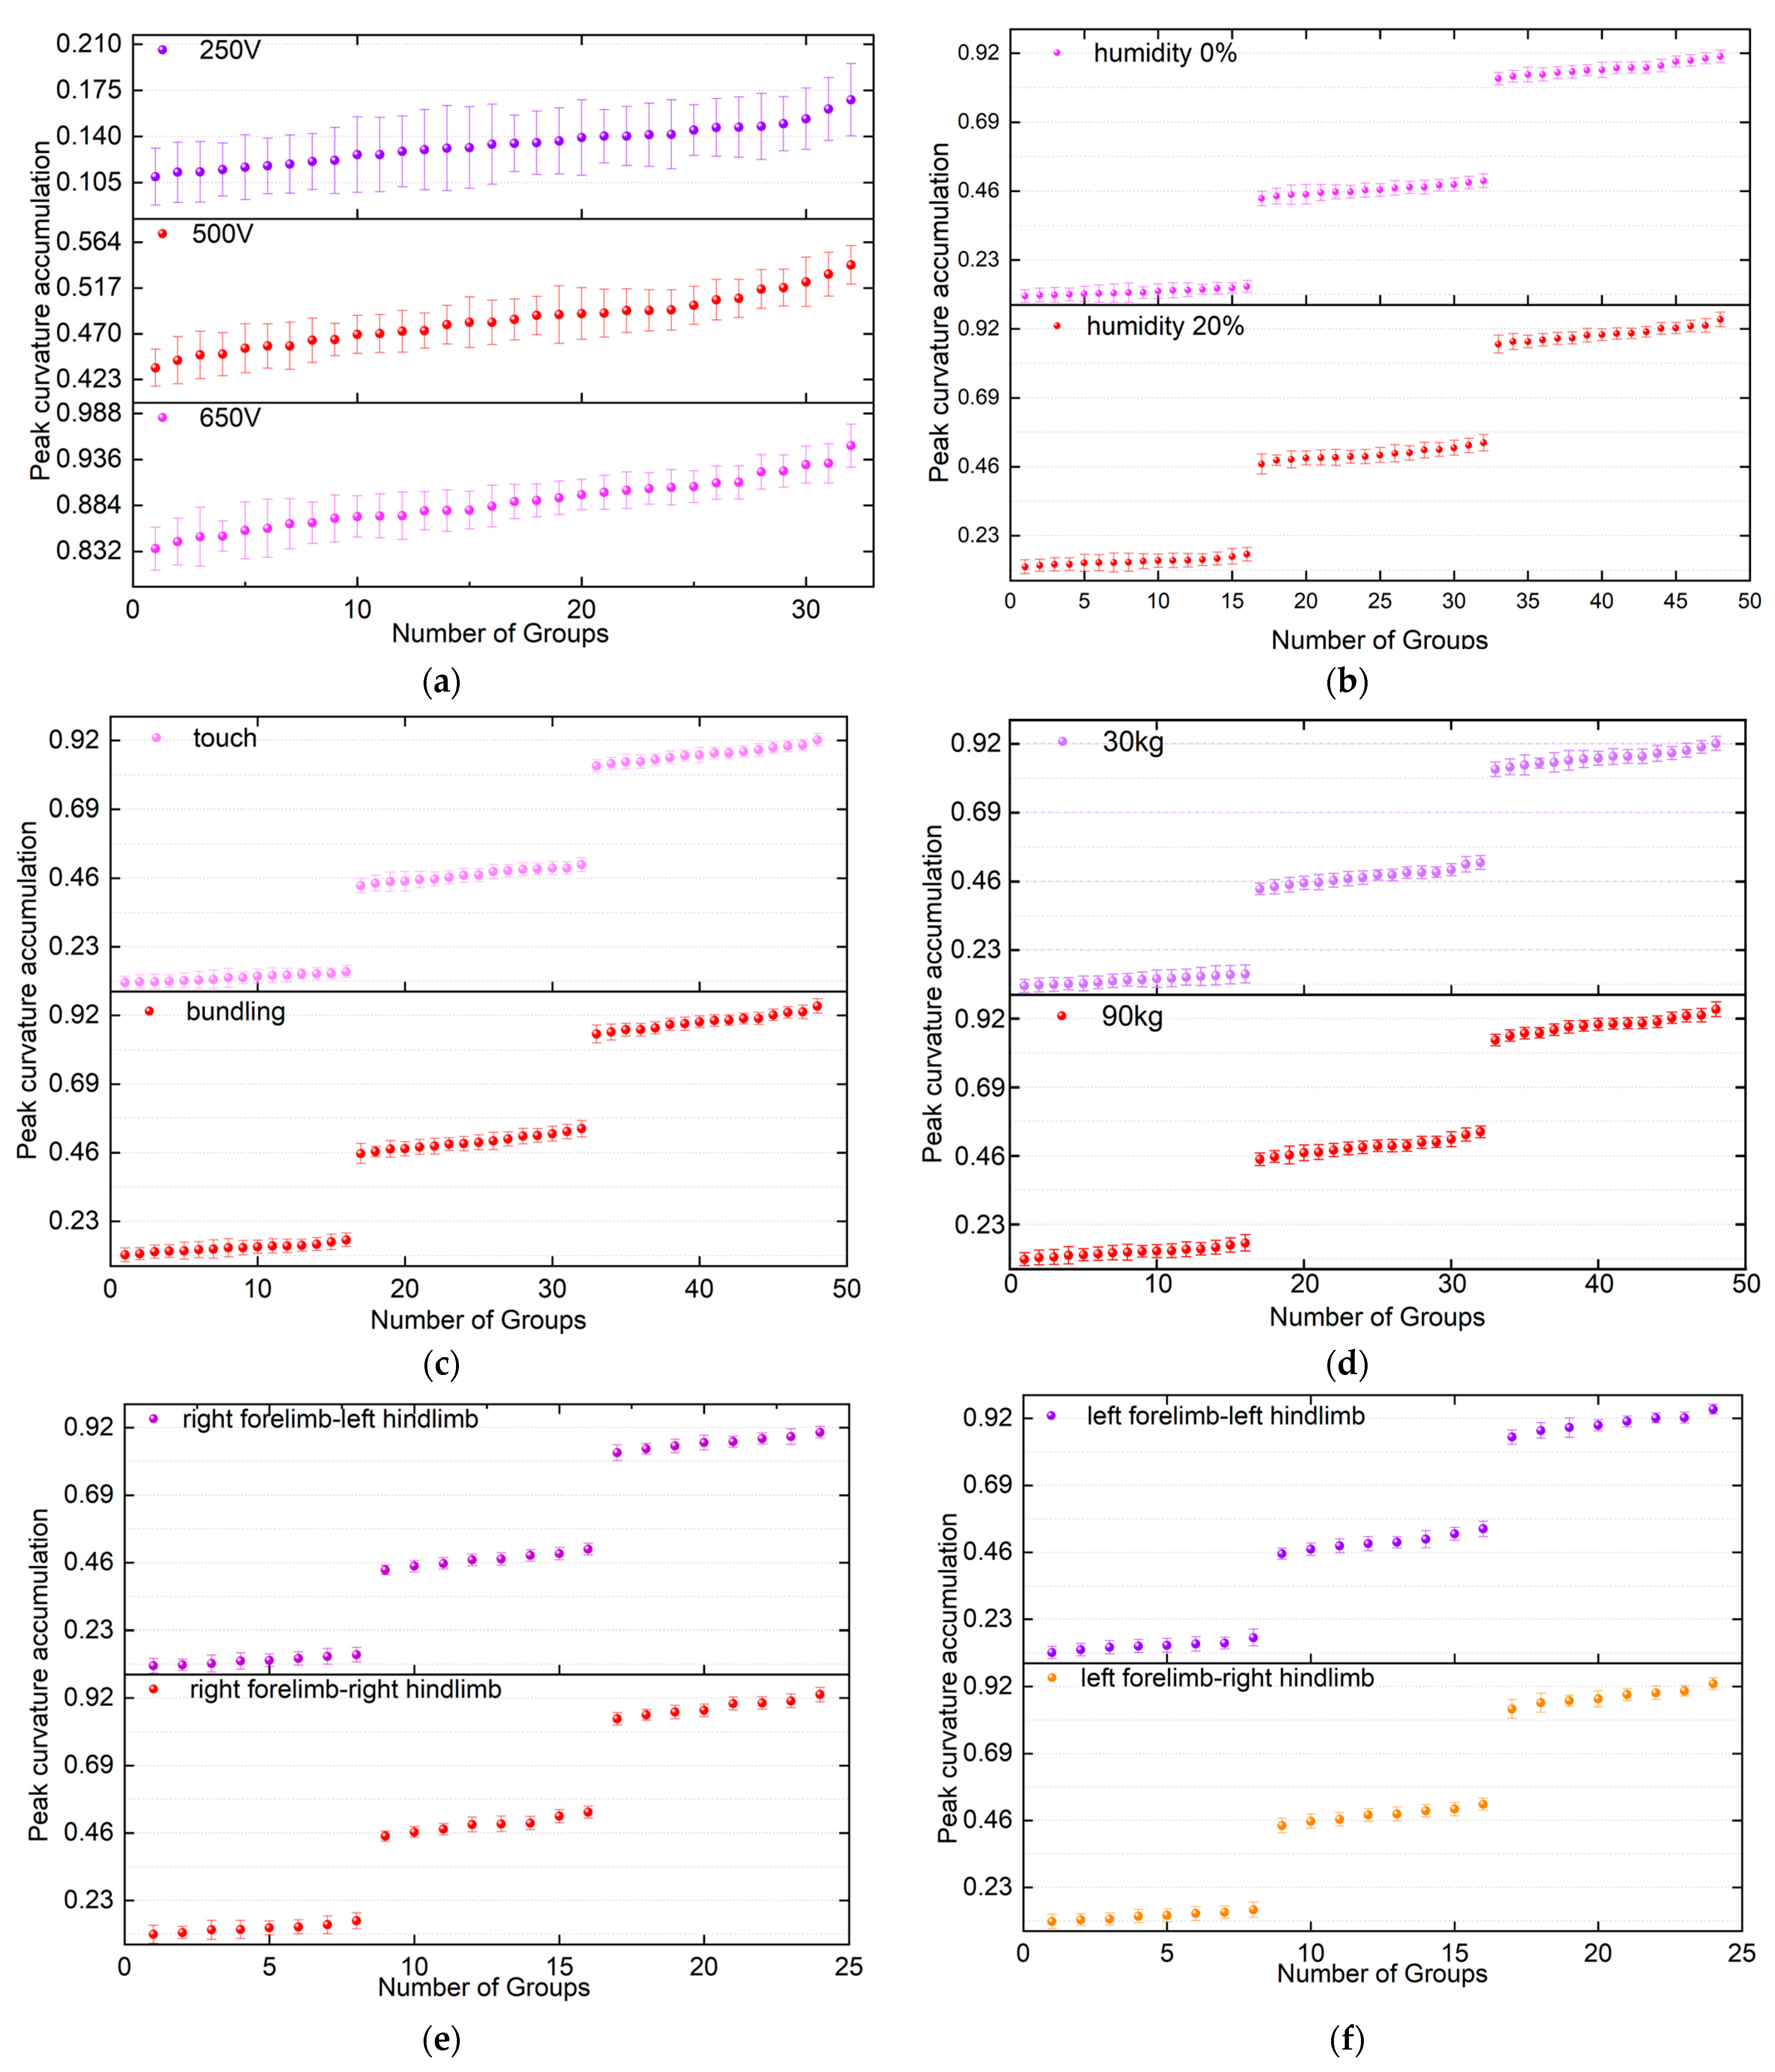
3.2. Analysis of the Effects of Various Factors on the Features of DC Electric Shock

Under the condition that other working conditions are the same, according to the touching working conditions in Table 1 obtained by each factor DC touching current calculation curvature accumulation amount peak change rule is shown in Figure 8. According to Figure 8a, it can be seen that the peak curvature accumulation under 250 V voltage ranges from 0.1167 to 0.1609, the peak curvature accumulation under 500 V voltage ranges from 0.4451 to 0.5538, and the peak curvature accumulation under 650 V voltage ranges from 0.8556 to 0.9315, with an error of about 9%, therefore, with the rise of the voltage, the animal electric shock current increases, and the peak curvature accumulation increases, showing a nonlinear change. Therefore, as the voltage increases, the curvature accumulation peak value increases, which is a nonlinear change. Since the animal electric shock current is a nonlinear time-varying signal, the peak curvature accumulation calculated according to Equations (4) and (6) also increases when the electric shock current increases.
The change rule of the peak curvature accumulation amount of different skin surface dryness and humidity is shown in Figure 8b. The value of curvature accumulation amount in wet condition is 0.1393~0.93151, and the value of curvature accumulation amount in dry condition is 0.1168~0.90306, and the curvature accumulation amount is higher than that in dry condition in wet condition. As the moisture on the skin surface acts as a conductive medium, the impedance of the skin is greatly reduced, resulting in an increase in the electric shock current, which leads to an increase in the peak value of electric shock curvature accumulation.
Different electric shock conditions under the peak rule of the law of accumulation are shown in Figure 8c. The curvature accumulation value is 0.1168~0.9012 under the point-touch condition, the curvature accumulation value is 0.1353~0.93151 under the bundle condition, and the curvature accumulation is higher than that under the point-touch condition. As the contact area between the wire and the animal body increases significantly under the bundling condition, the corresponding contact impedance decreases, the current in the animal body is subsequently larger, and the peak curvature accumulation is also larger.
The change rule of peak curvature accumulation under different animal mass conditions is shown in Figure 8d. The curvature accumulation value of a 30 kg live pig is 0.1168~0.9101, and the curvature accumulation value of 90 kg is 0.1264~0.93151, and the curvature accumulation is higher than that under the point-touching condition. Since R = ρ L / S ( ρ is the conductivity, L and S are the length and cylindrical area of the live pig, respectively), the larger the mass of the animal, the smaller the impedance, the larger the electric shock current, and the larger the peak value of the curvature accumulation.
Different electric shock path conditions under the peak rule of change of accumulation amount are shown in Figure 8e,f. The ordering of peak curvature accumulation is left forelimb-left hindlimb, right forelimb-left hindlimb, left forelimb-right hindlimb, and right forelimb-right hindlimb.
According to 5 A~202 A load current and 10 m A~1 A, the peak curvature accumulation of 96 groups is shown in Figure 9, the peak curvature accumulation of load burst current is 0.0071~0.0154, and the peak curvature accumulation of base residual current is 0.1345~1.2132. Since the base residual current and load burst current signals are step functions, the curvature accumulation is analyzed according to Equations (4) and (6) to show that the curvature accumulation decreases as the current increases.
The peak rise times of animal live and non-animal body are shown in Figure 10, and the peak rise time of animal body electric shock current is distributed from 21 to 30 ms, which is not affected by the factors. The non-animal body’s current peak rise time is between 0.14 and 0.22 ms.
Combining the above analysis, 0.1 ≤ K ≤ 1 can be selected to distinguish the load burst and live pig electric shock current, and the peak rise time Δt ≥ 20 ms can distinguish the base residual current and live pig electric shock.

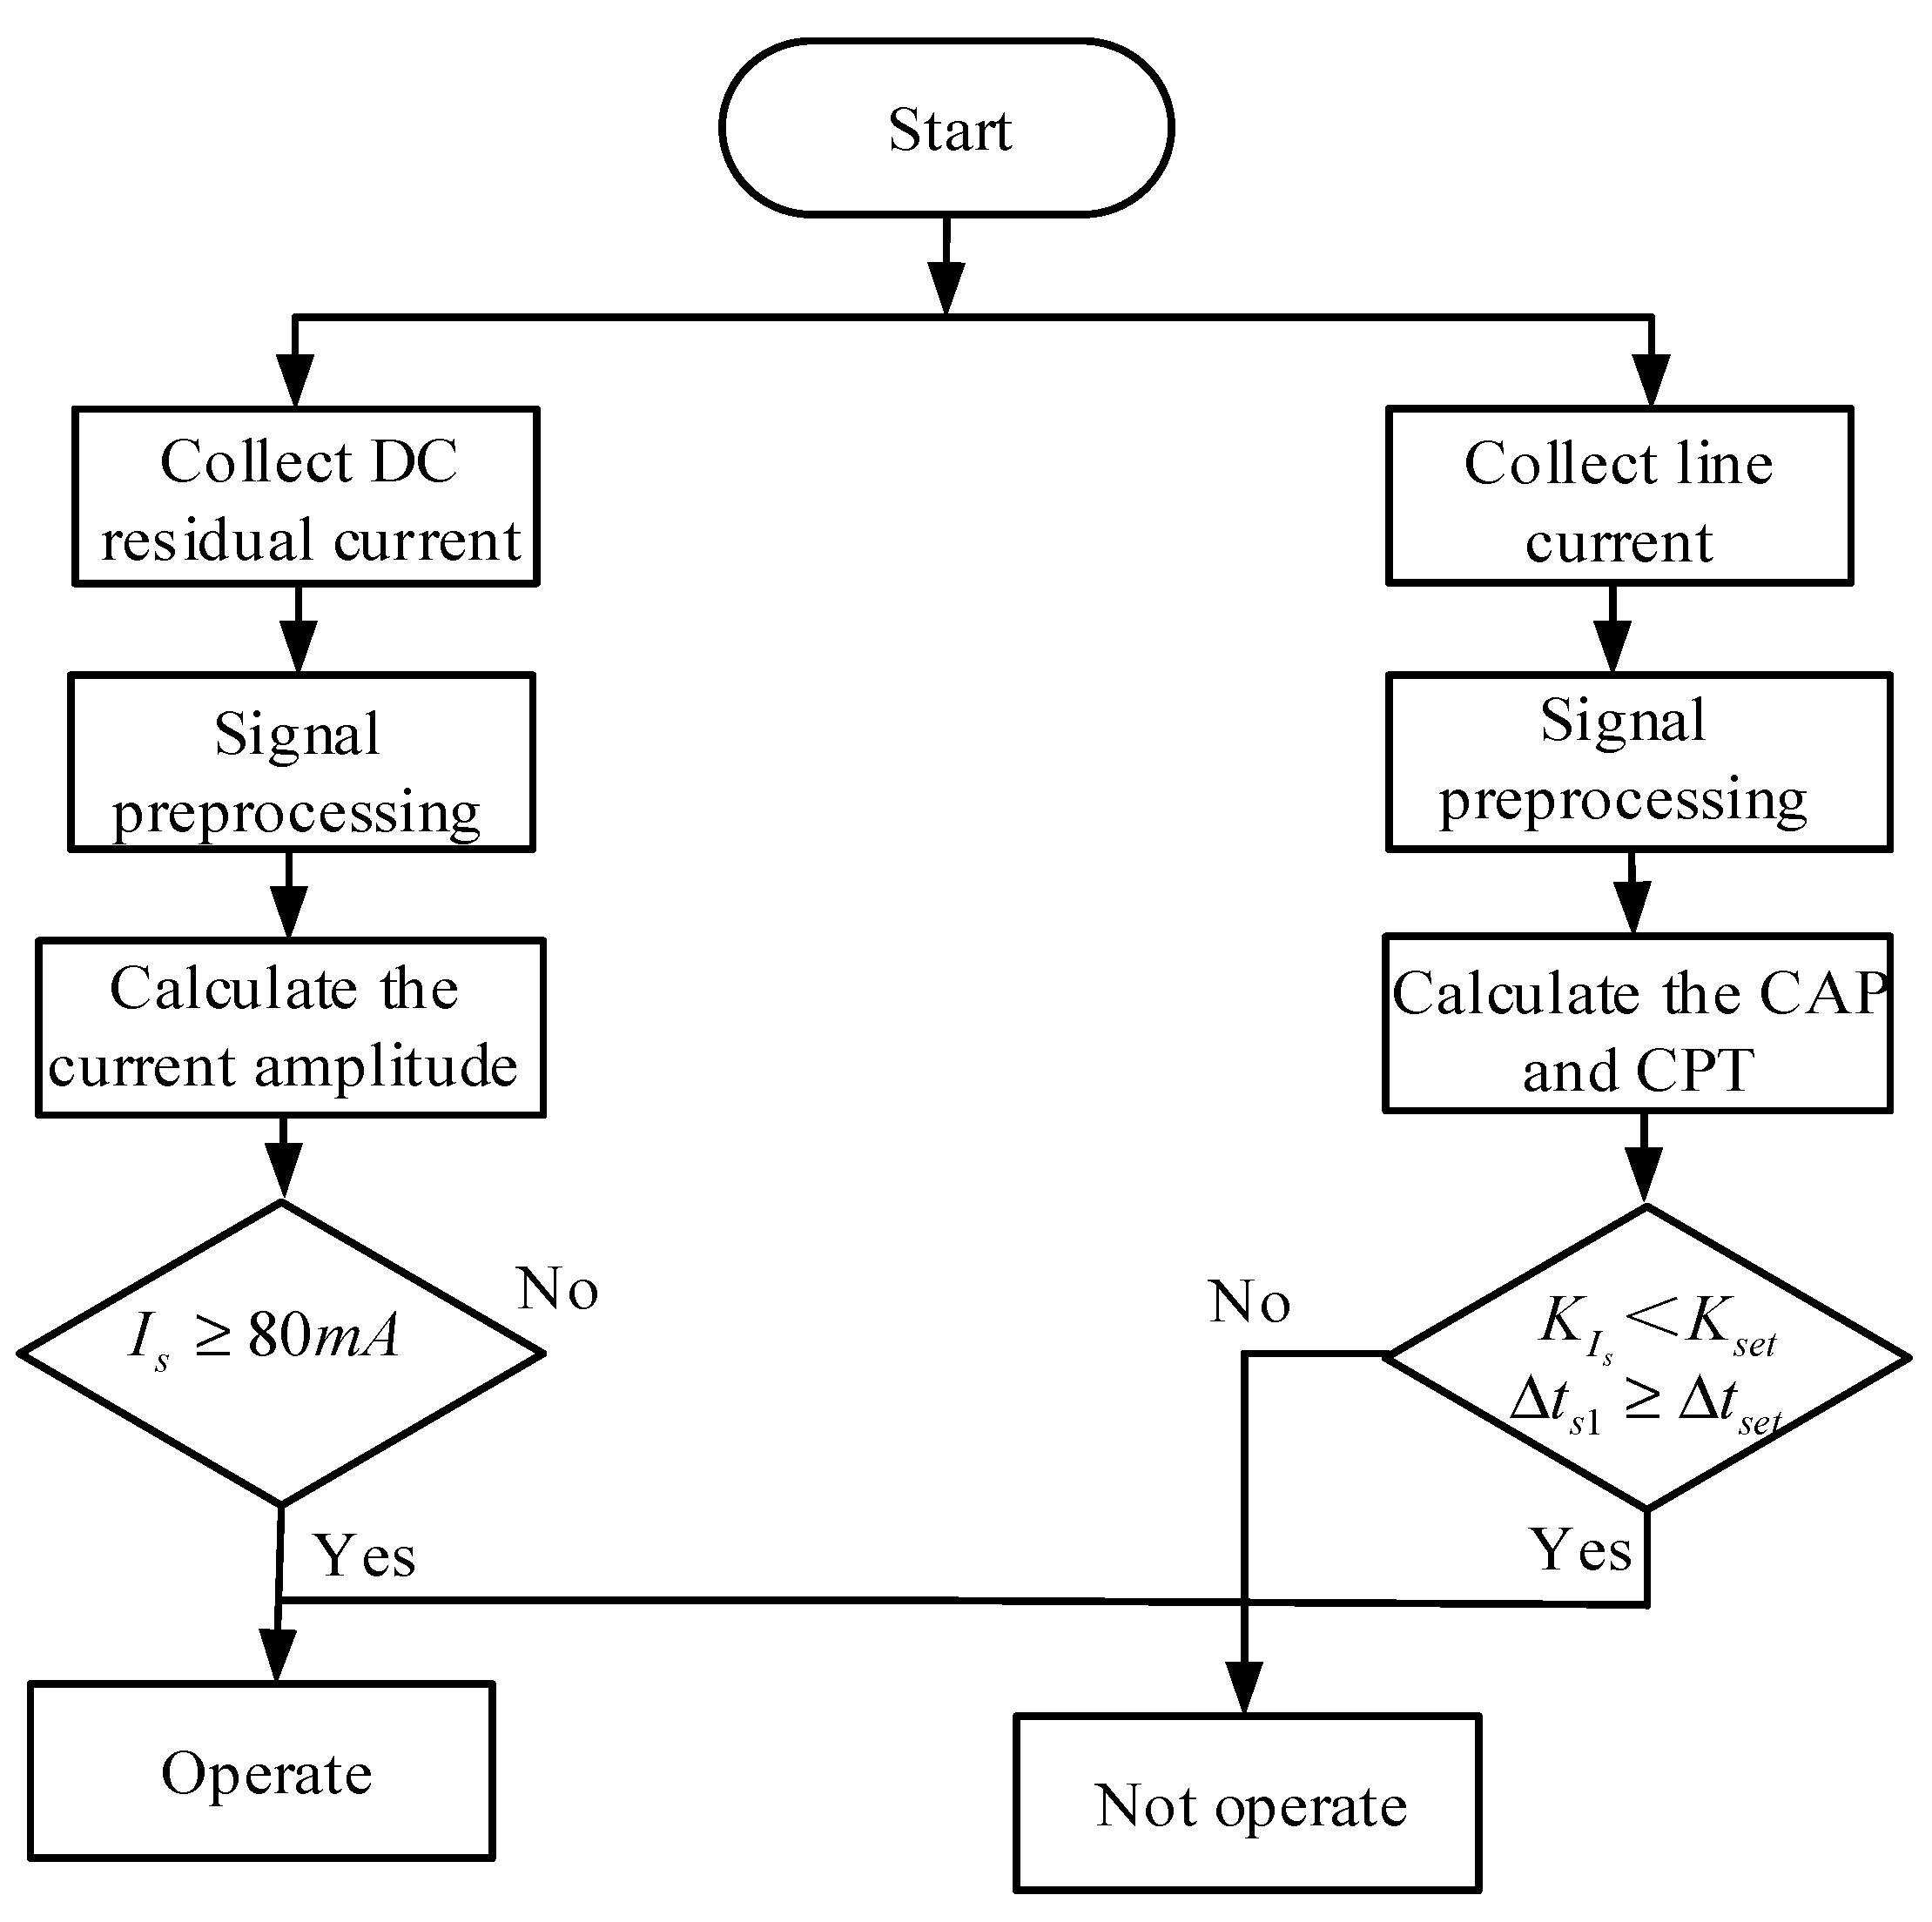
4. Recognition Model Based on DC Electric Shock Current Features

The existing DC protection technology uses DC residual current amplitude to distinguish, but cannot achieve the problem of two-point same-side fault protection in IT systems. This paper proposes a judgment method based on the characteristics of human electric shock by obtaining the sliding curvature accumulation and peak rise time characteristics. This method can achieve grounding faults without electric shock protection by monitoring the basic residual current and comparing it with the set threshold. By real-time monitoring of the curvature accumulation and peak rise time of the current and comparing them with the set threshold, the DC IT system can be protected against electric shock. The method does not need to extract the DC electric shock current. Only through the sampled DC residual current and line current signals can DC electric shock features be extracted so as to realize the protection; the flow chart of the algorithm is shown in Figure 11, and its protection algorithm is as follows:
S 1 : I s I r e f S 2 : K I g < K s e t Δ t s 1 Δ t s e t
sgn ( I s ) = 1 ,   fulfil   S 1   o r   S 2 0 ,   failure   to   fulfil   S 1   o r   S 2
where Iref is the DC basic residual current threshold, and the recommended value is 80 mA; Is is the DC residual current value, KIg is the line current curvature accumulation, Δts1 is the line current peak time, Kset is the curvature accumulation threshold, and 0.1 ≤ Kset ≤ 1 is recommended. Δtset is the peak time threshold, and Δtset ≥ 20 ms is recommended. If S1 is satisfied, the DC residual current exceeds the threshold. To prevent the basic residual current from being too high, the DC-RCD will operate to achieve grounding fault protection without electric shock. If S2 is satisfied, it is judged that the animal is electrically shocked, and the DC-RCD will operate to solve the two-point electric shock fault. If neither S1 nor S2 is satisfied, it is considered that no fault has occurred, and the DC-RCD will not operate.

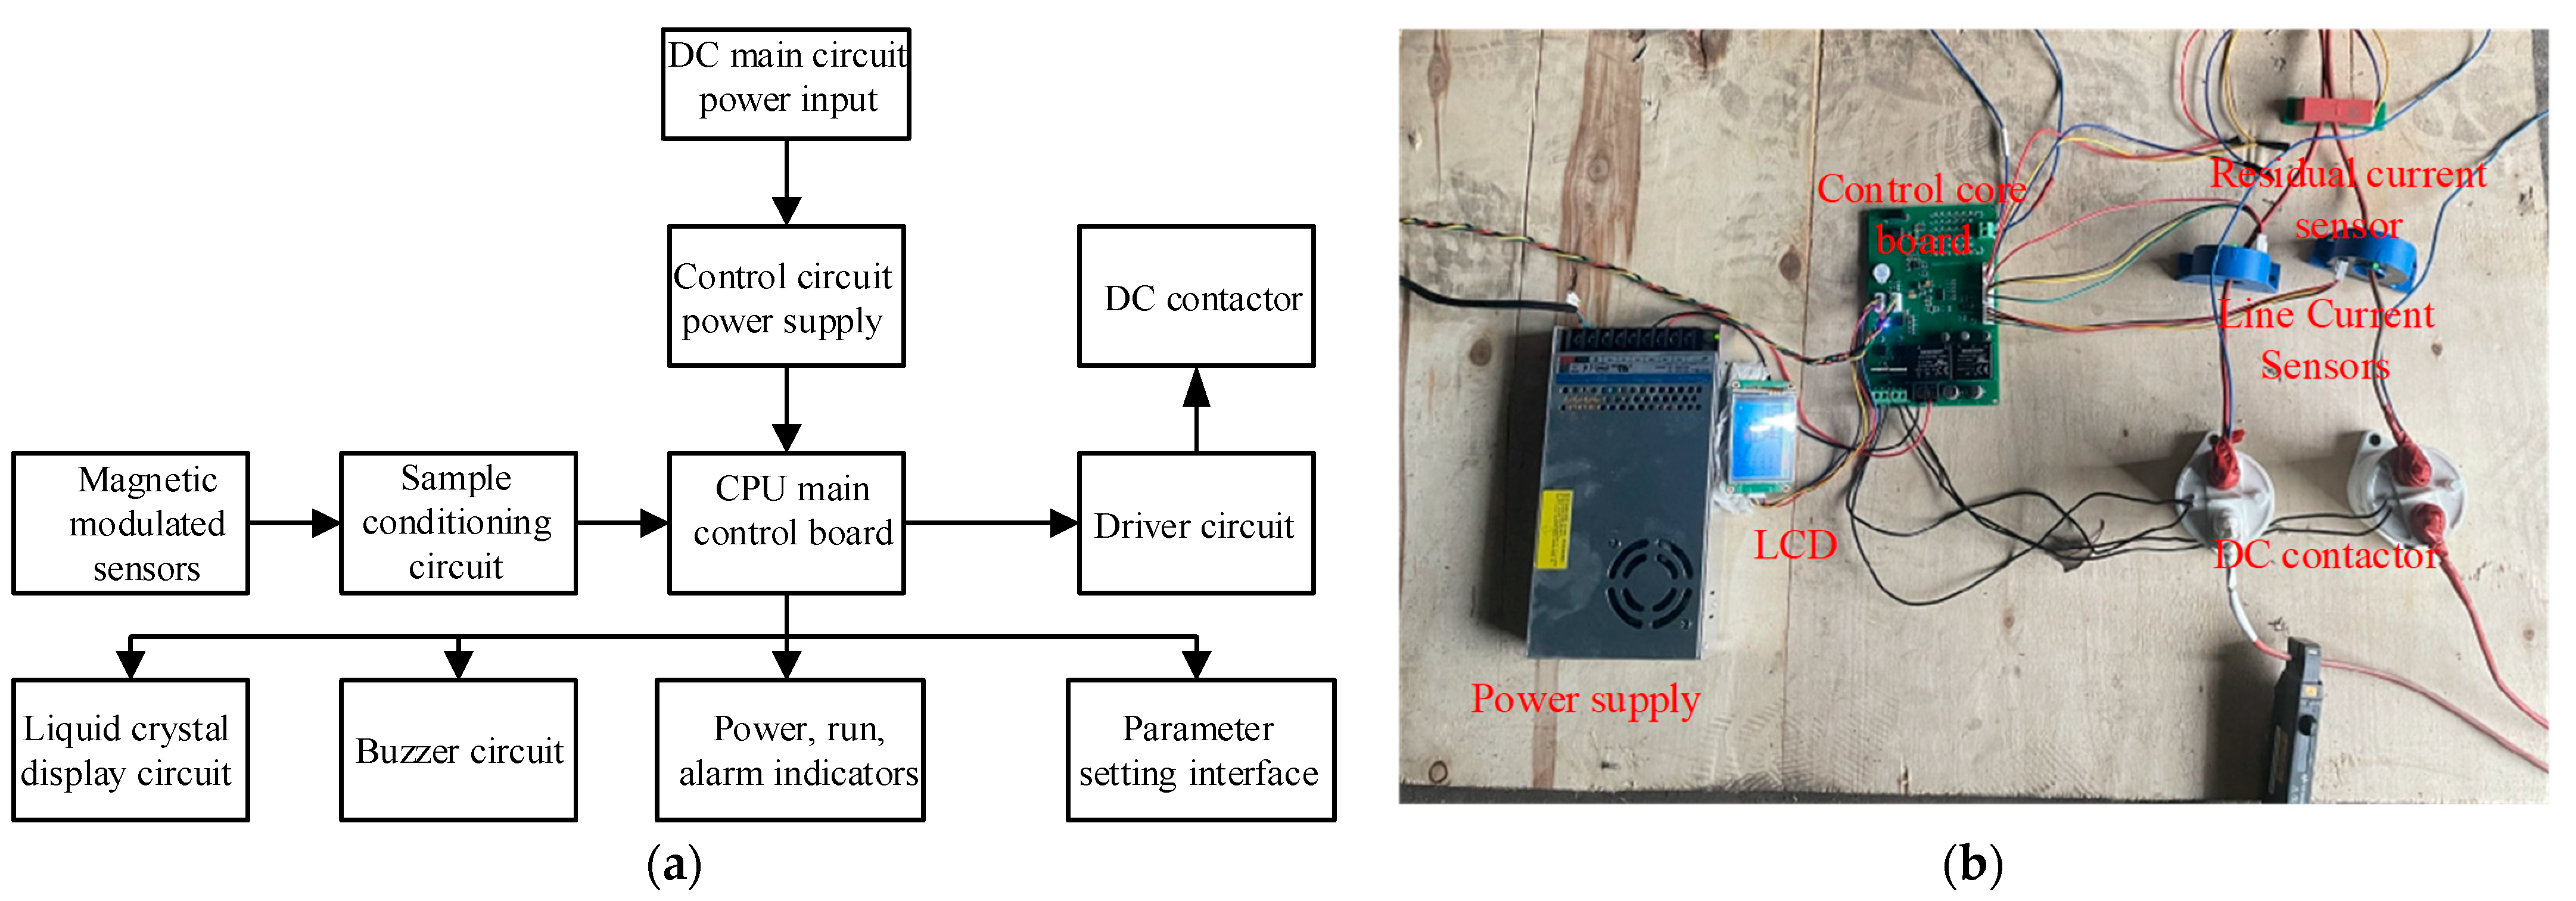
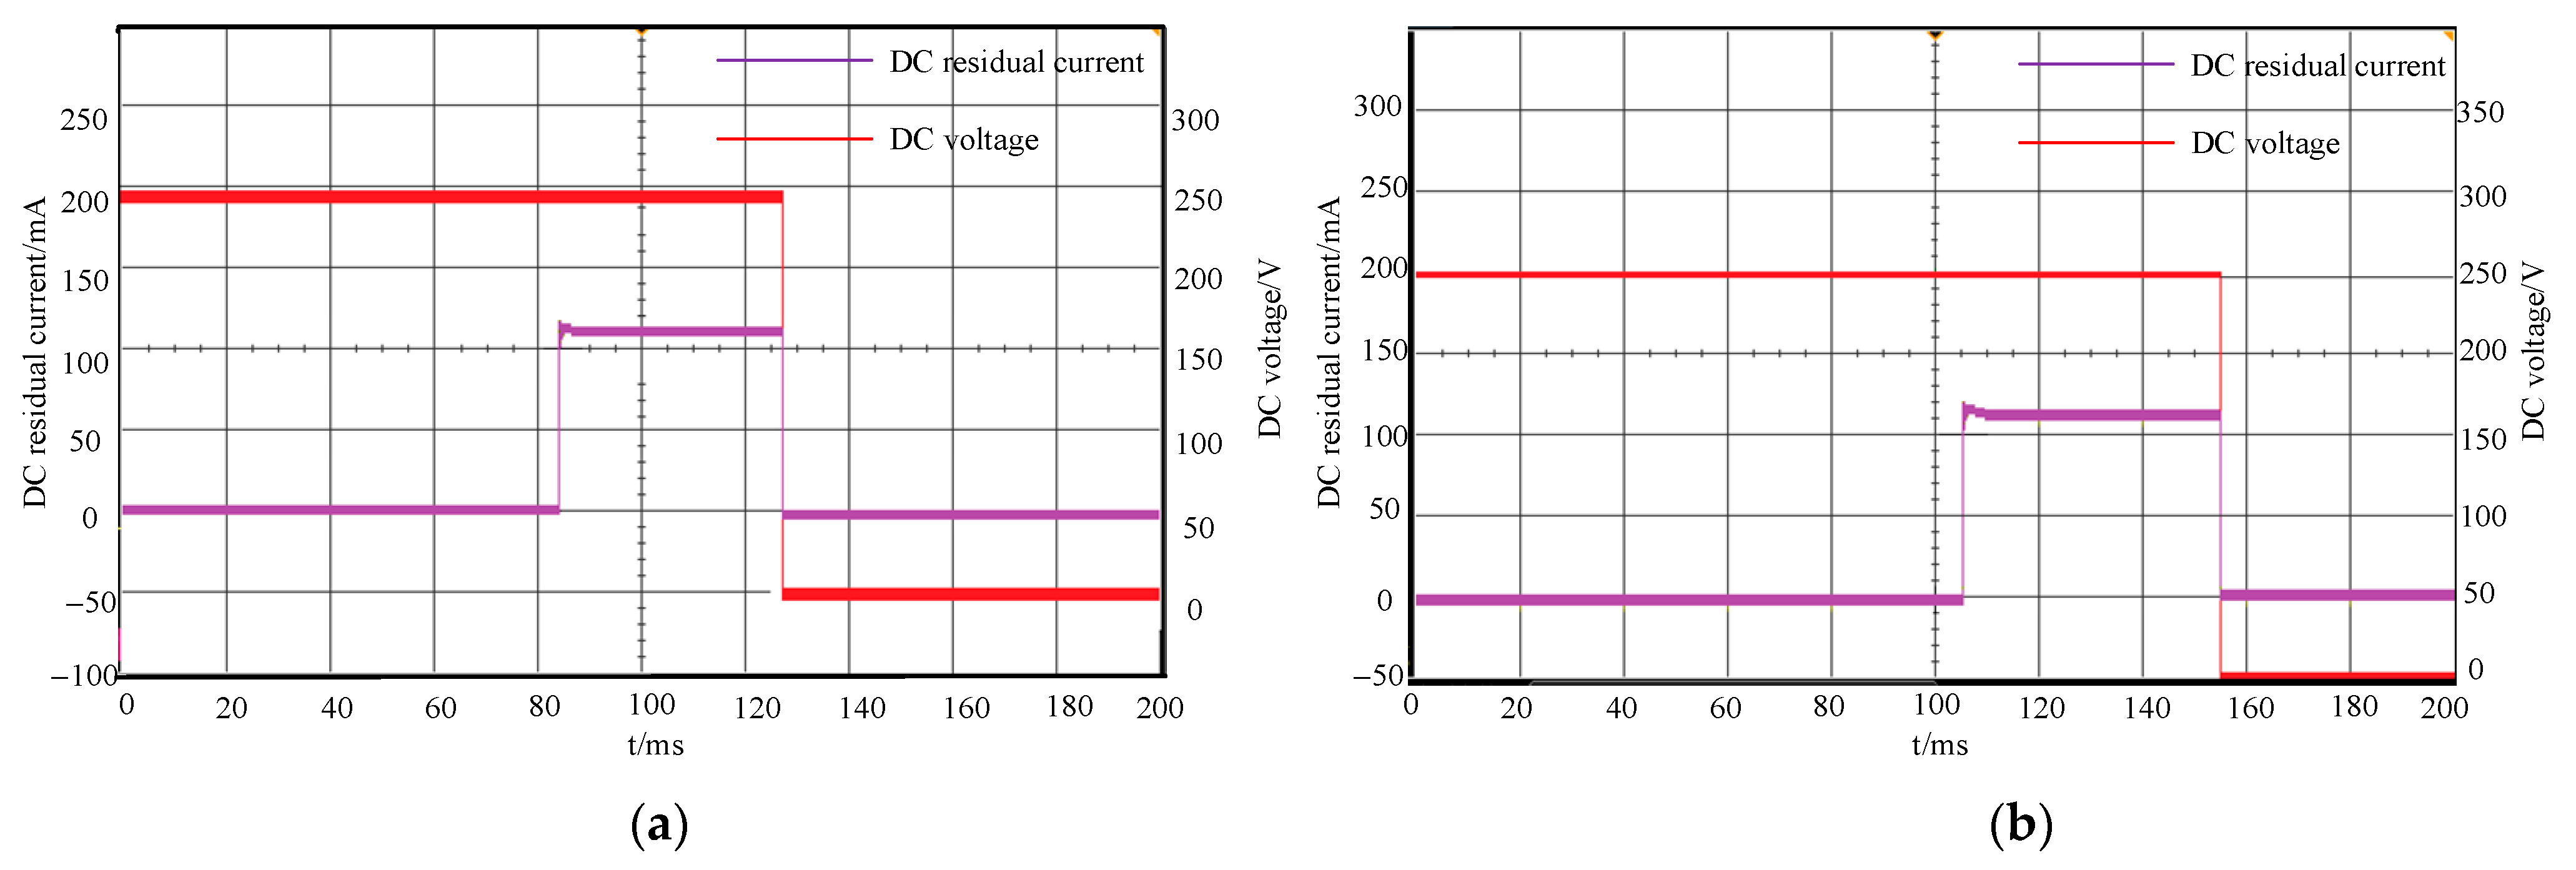
5. Experimental Verification of DC-RCD Prototype

This paper designs a DC-RCD with a rated voltage of 750 V, a rated current of 250 A, and three-stage overcurrent protection (long delay for overload, short delay for short circuit, and instantaneous protection for short circuit), residual current protection, and biological electric shock protection. Its design principle is shown in Figure 12a, which mainly includes the microprocessor STC32G12K128 microcontroller, ±15 V and 5 V power modules, ADC sampling circuit, signal conditioning circuit, LCD display, DC contactor drive circuit, etc. The DC ±15 V power supply is used to power the amplifier chip, and the 5 V power supply is used to power the MCU main control board minimum system and other devices; the voltage/current signals collected by the DC line transformer, residual current transformer, and voltage transformer are processed by high-performance operational amplifiers and filtering elements and sent to the AD sampling port of the STC32G12K128 microcontroller; the ADC sampling converts the analog signal into a digital signal that can be processed inside the microcontroller. After the digital signal is filtered and identified by the protection algorithm, a protection judgment is made. If there is an electric shock to the human body and the basic residual current is too high, the DC contactor is driven to operate, thereby realizing the protection of the human body and equipment. The actual picture of the DC-RCD is shown in Figure 12b.
In order to verify the accuracy and superiority of the proposed identification algorithm, a DC IT system test platform was built to conduct comparative tests between the residual current amplitude identification and the algorithm proposed in this paper. The test conditions mainly include grounding faults without electric shock and live pig electric shock protection.
The DC residual current is 0 mV from 0 to 0.11 s. When a ground fault without electric shock occurs at 0.11 s, the detected residual current value is 110 mA. When it exceeds the set protection threshold of 80 mA, the real-time sampled residual current dynamic waveform is shown in Figure 13. The dynamic waveform of the residual current sampled by the method proposed in this paper is shown in Figure 13a. When the residual current exceeds the set threshold of 80 mA, the DC-RCD is operated, and the action time ts is 53 ms. The dynamic waveform of the residual current sampled by the residual current amplitude identification method is shown in Figure 13b. When the residual current exceeds the set threshold of 80 mA, the DC-RCD is operated, and the action time ts is 48 ms. Both the residual current amplitude identification and the method in this paper can realize ground fault without electric shock protection.
The real-time collected dynamic oscilloscope waveform of the electric shock current when a live pig has a two-point opposite-side fault under a voltage of 205 V is shown in Figure 14. According to Figure 14a, the value of the DC electric shock current is 158 mA, at which time the DC-RCD is operated, and the action time ts is 60 ms. The method proposed in this paper can achieve two-point opposite-side electric shock fault protection. According to Figure 14b, the value of the DC electric shock current is 131 mA, which exceeds the set threshold of 80 mA. The amplitude discrimination method can also achieve two-point opposite-side electric shock fault protection, and the action time ts is 62 ms.
The real-time collected dynamic oscilloscope waveform of the electric shock current when a live pig has a two-point opposite-side fault under 205 V conditions is shown in Figure 15. According to Figure 15a, the electric shock current value is 186 mA, at which time the DC-RCD is operated, and the action time ts is 61 ms. The method proposed in this paper can achieve two-point same-side electric shock fault protection. According to Figure 15b, when a two-point same-side electric shock fault occurs, the DC-RCD does not operate, so the amplitude discrimination method cannot achieve two-point opposite-side electric shock fault protection.
According to the requirements of IEC 60755-1: 2022-10 [26] and IEC TS 63053: 2017-06 for DC-RCDs [27] without time delay, if the residual current Iref is set to 80 mA, the maximum action time tsmax is 0.3 s when the residual current is Iref, and the maximum action time tsmax is 0.15 s when the residual current is 2Iref. Combined with the action time ts of the algorithm proposed in this paper in Table 2, it can be seen that the action time ts of the algorithm proposed in this paper meets the requirements of IEC 60755-1: 2022-10 and IEC TS 63053: 2017-06.

6. Conclusions

In response to the existing LVDC IT system’s problem of personal electric shock protection, this article constructs a physical experiment platform for DC electric shock under the IT grounding method, obtains typical DC current data under various conditions, and analyzes the effects of various factors on the sliding curvature accumulation and peak rise time. It proposes a recognition method based on the features of DC electric shock current and develops a DC-RCD prototype. The following conclusions are drawn:
(1)
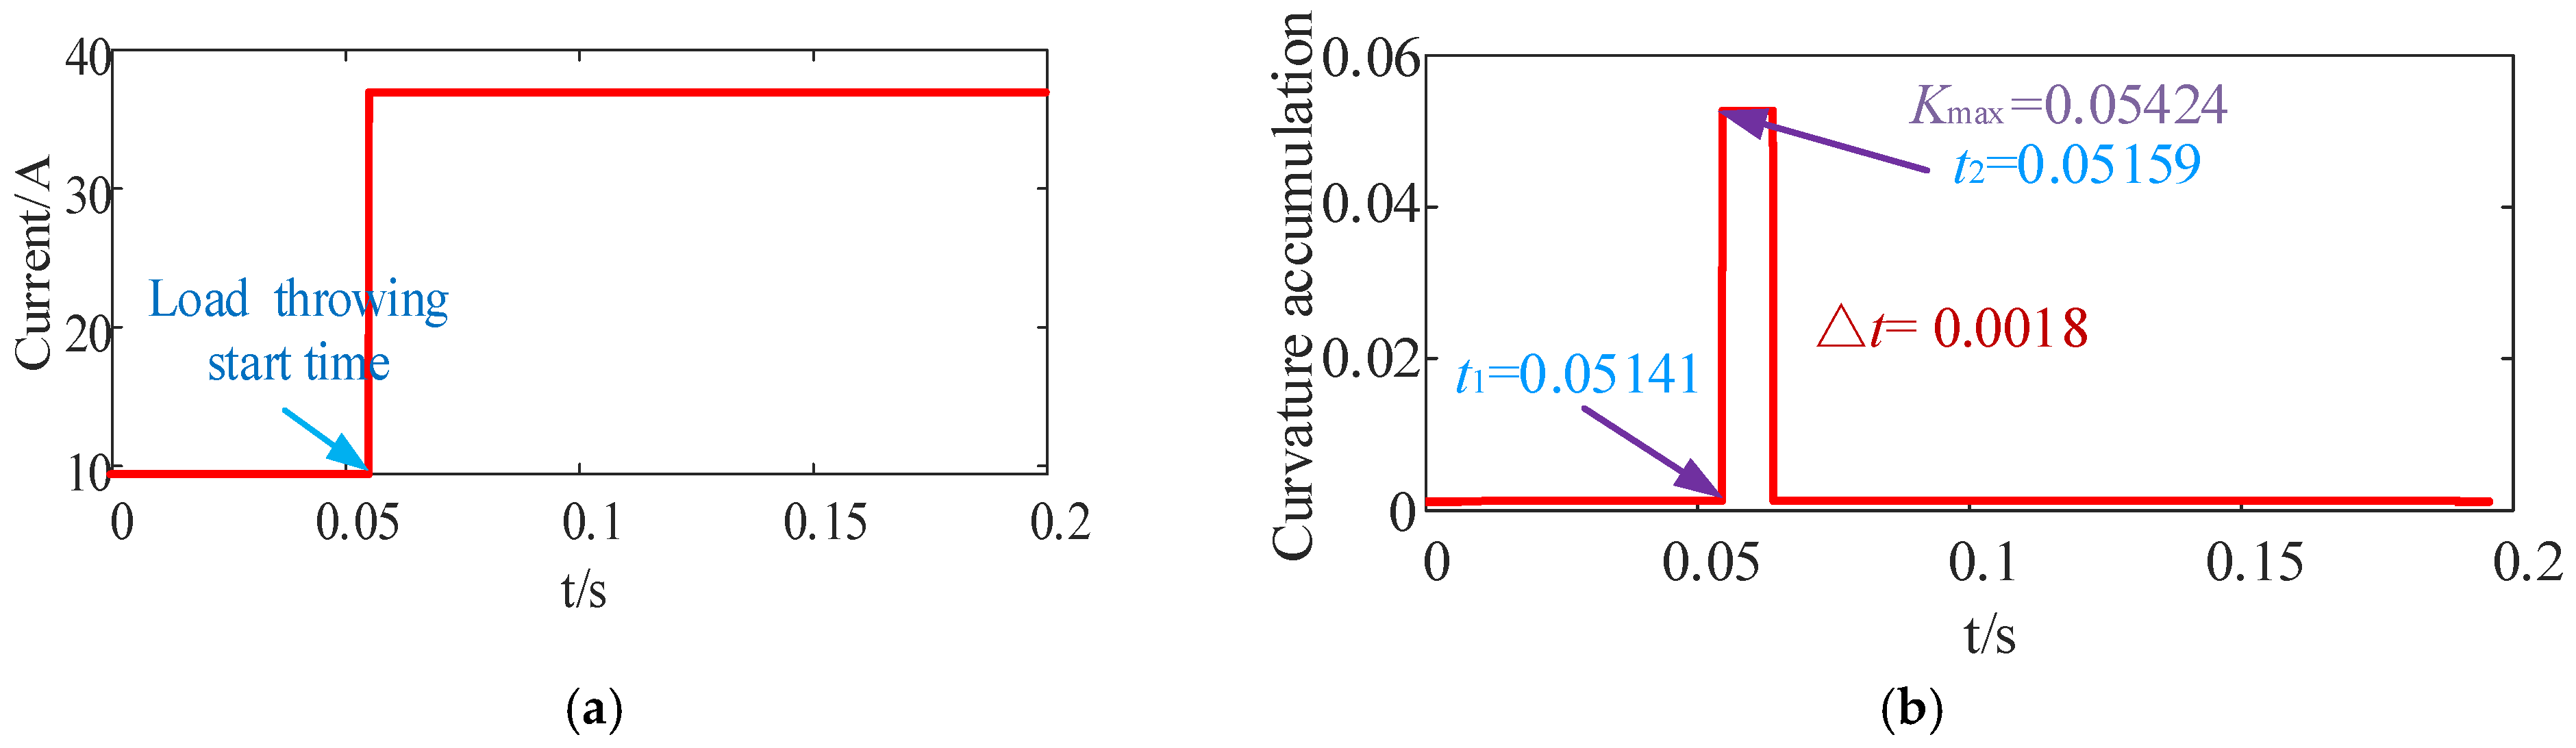
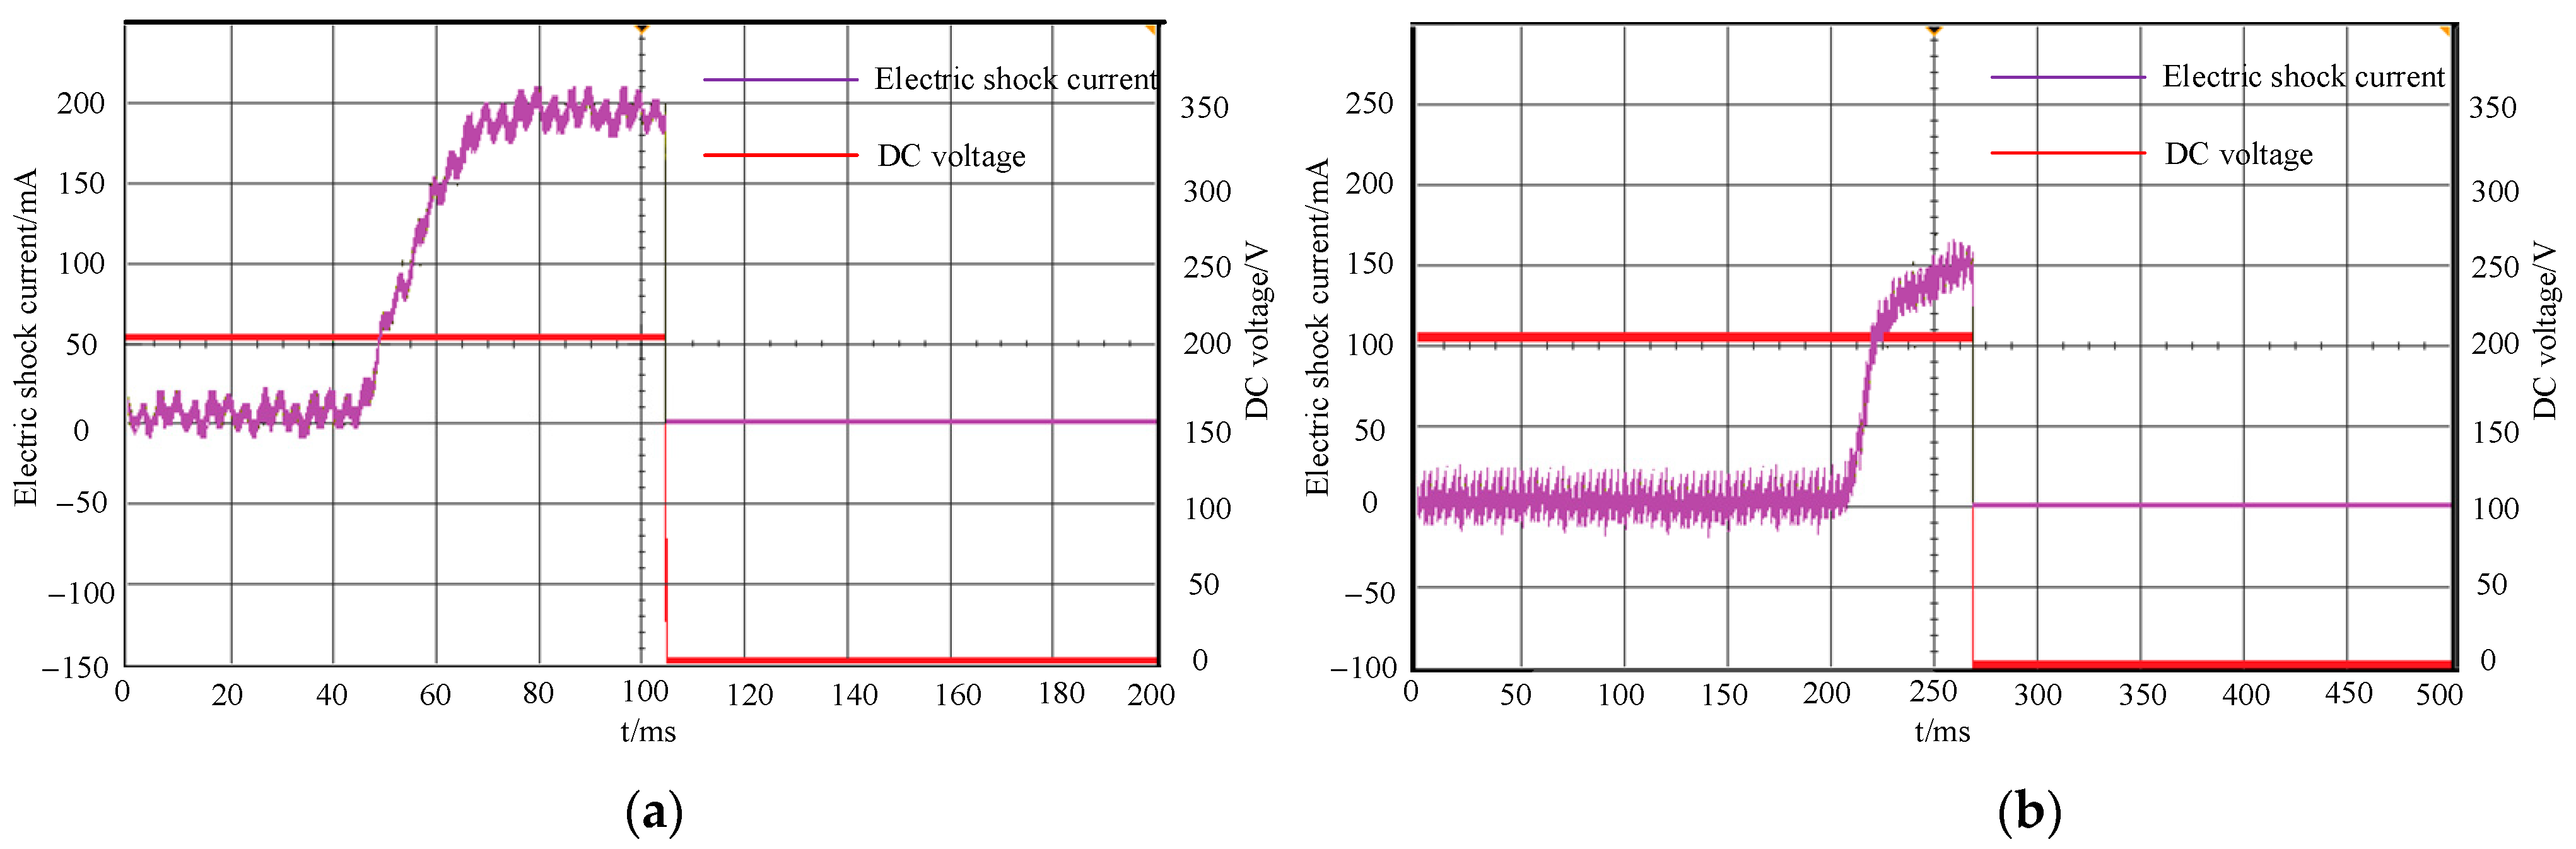
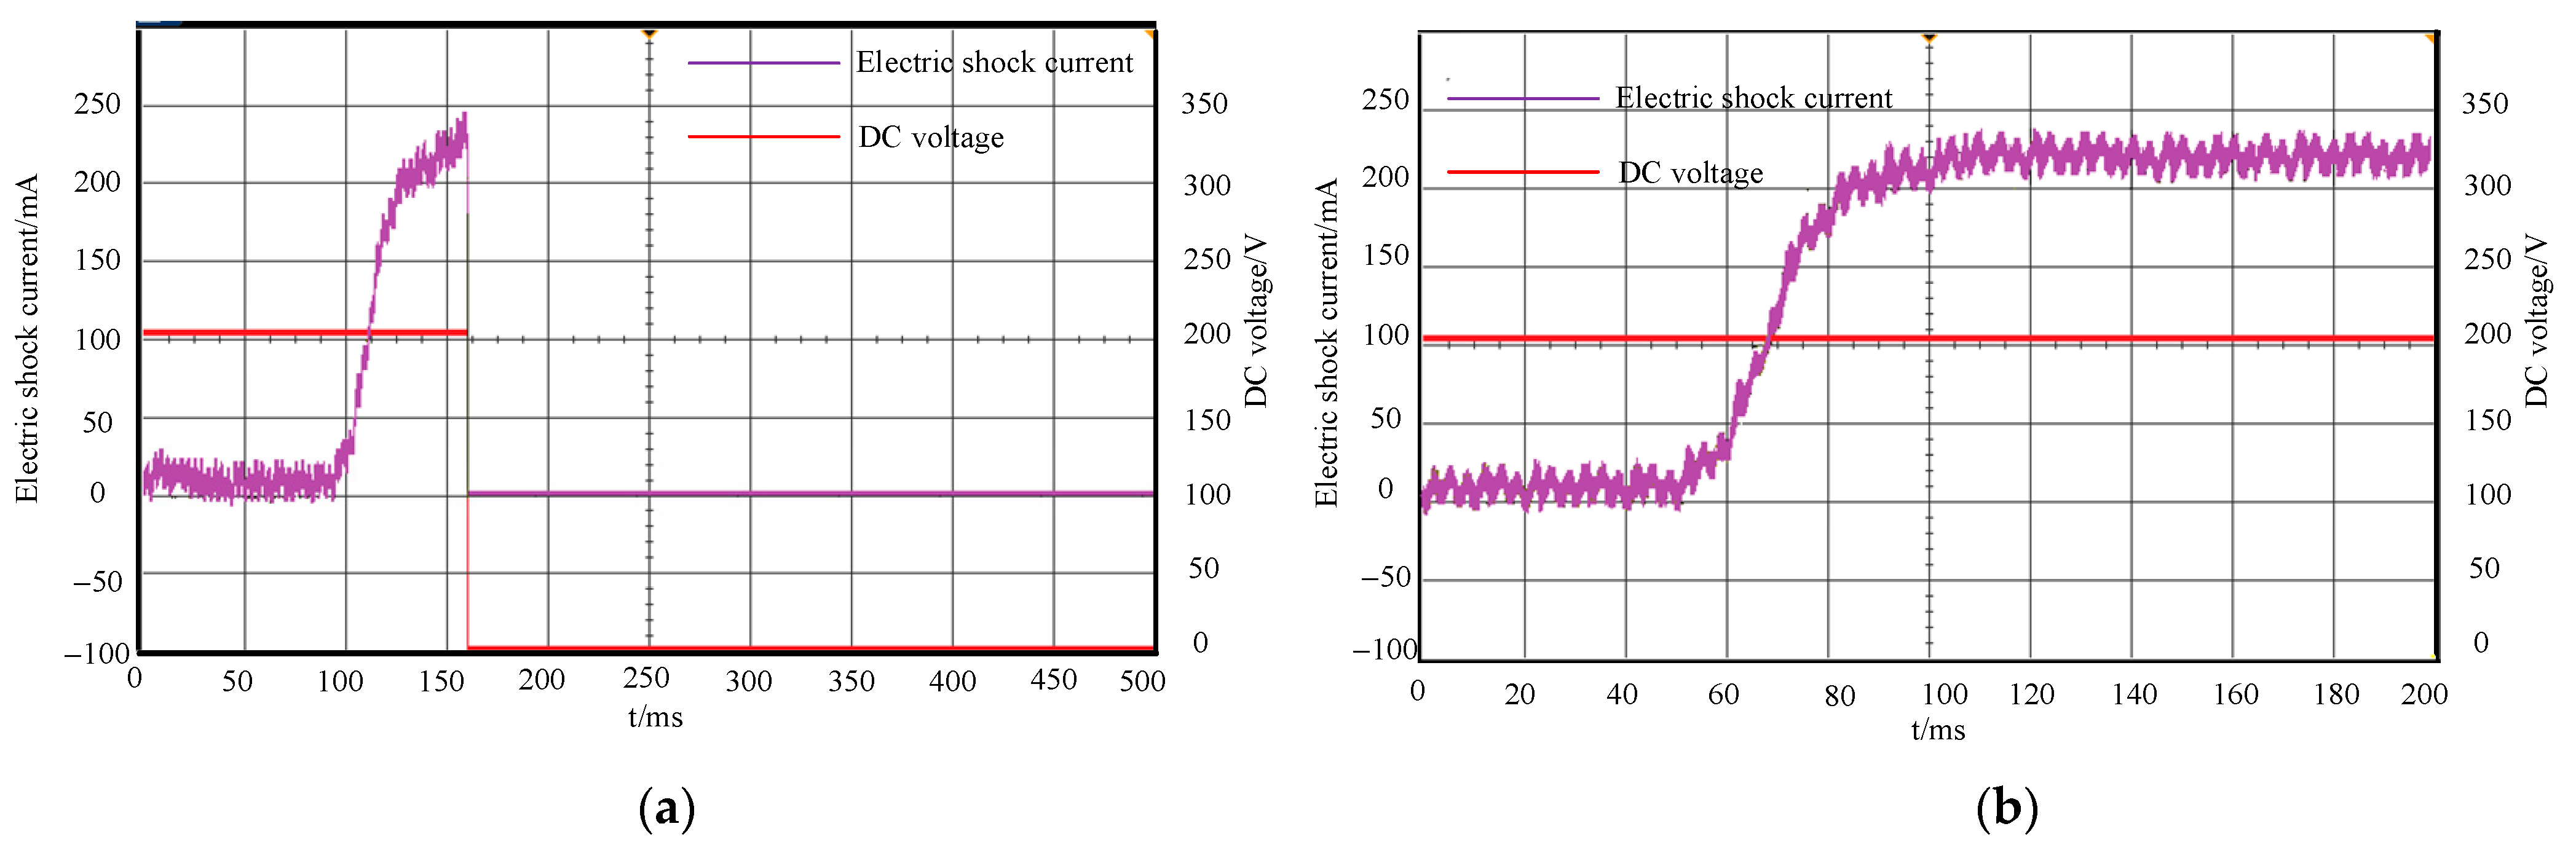
The electric shock current of the animal body is a slowly rising nonlinear current signal. The current from battery load burst current and basic residual current are rapid rising step signals.
(2)
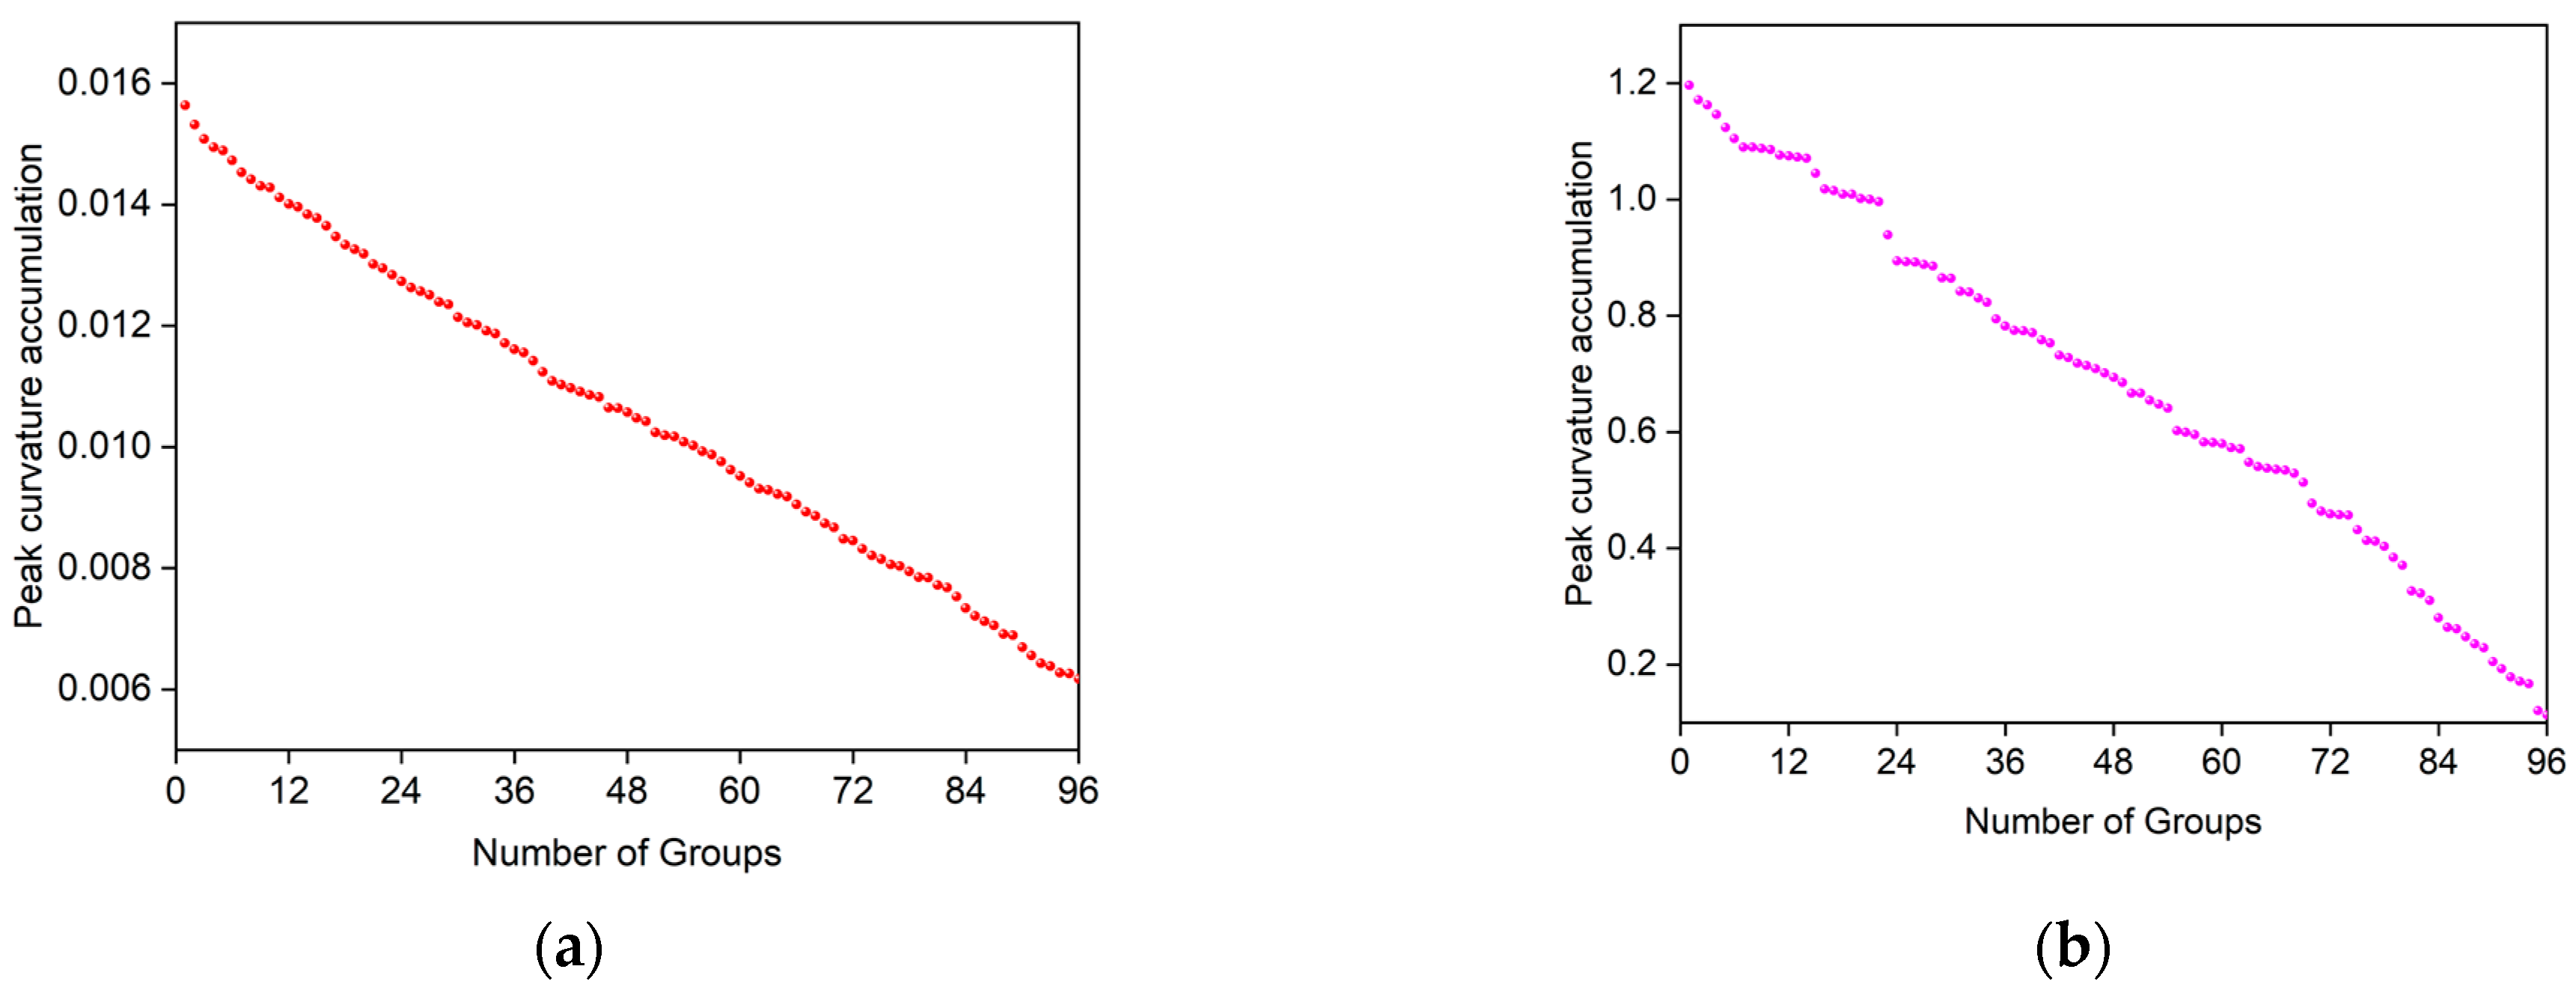
As the current increases, the curvature accumulation of the animal body’s electric shock current increases, while the sliding curvature accumulation of the non-animal body’s current decreases.
(3)
The method proposed in this paper is based on the features of DC electric shock. It effectively solves the problem of the inability to protect when there are two-point side faults in the IT system. The DC-RCD action time is ts < 70 ms.

Author Contributions

Conceptualization, H.Z. and Y.X.; methodology, H.Z.; software, H.Z.; validation, H.Z., Y.X. and C.W.; formal analysis, H.Z.; investigation, Y.X.; resources, X.L.; data curation, Y.Z.; writing—original draft preparation, H.Z.; writing—review and editing, Y.Z.; visualization, J.L.; supervision, C.W.; project administration, C.W. All authors have read and agreed to the published version of the manuscript.

Funding

This work was supported by the Scientific Research Foundation of Hunan Provincial Education Department under Grant 23B0297.

Data Availability Statement

The original contributions presented in the study are included in the article; further inquiries can be directed to the corresponding authors.

Conflicts of Interest

Author is currently studying at Changsha University of Science and Technology. The remaining authors declare that the research was conducted in the absence of any commercial or financial relationships that could be construed as a potential conflict of interest.

References

  1. Deng, W.; Dai, C.; Chen, W. Application of PV generation in AC/DC traction power supply system and the key problem analysis under the background of rail transit energy internet. Proc. CSEE 2019, 39, 5692–5702. [Google Scholar]
  2. Huang, S.; Xiong, L.; Zhou, Y.; Gao, F.; Jia, Q.; Li, X.; Li, X.; Wang, Z.; Khan, M.W. Distributed predefined-time control for power system with time delay and input saturation. IEEE Trans. Power Syst. 2024. [Google Scholar] [CrossRef]
  3. Tong, M.; Ming, C.; Xu, Z. Key issues and solutions of integrated on-board chargers for electric vehicles. Trans. China Electrotech. Soc. 2021, 36, 5125–5142. [Google Scholar]
  4. Sarangi, S.; Sahu, B.K.; Rout, P.K. A comprehensive review of distribution generation integrated DC microgrid protection: Issues, strategies, and future direction. Int. J. Energy Res. 2021, 45, 5006–5031. [Google Scholar] [CrossRef]
  5. Li, L.; Ying, J.; Liang, S. A review of civil low voltage DC distribution system protection. Trans. China Electrotech. Soc. 2015, 30, 139–149. [Google Scholar]
  6. Wang, Y.; Li, K.; Ren, B.; Zou, X.; Ge, L.; Ye, H. Study of fluxgate current detecting method for AC-DC earth leakage current based on apFFT. Trans. China Electrotech. Soc. 2015, 30, 254–260. [Google Scholar]
  7. Xie, Z.; Li, X.; Wang, J.; Chen, S. Study of measurement and detection algorithm of LVDC residual current. In Proceedings of the 2020 IEEE 66th Holm Conference on Electrical Contacts and Intensive Course (HLM), San Antonio, TX, USA, 30 September–7 October 2020; pp. 1–5. [Google Scholar]
  8. Wang, S.; Li, H.; Liu, Q.; Huang, Q.; Liu, Y. Design of a DC residual current sensor based on the improved DC component method. In Proceedings of the 2020 IEEE Power & Energy Society General Meeting (PESGM), Montreal, QC, Canada, 2–6 August 2020; pp. 1–5. [Google Scholar]
  9. Li, L.; Yong, J.; Zeng, L.; Wang, X. Investigation on the system grounding types for low voltage direct current systems. In Proceedings of the 2013 IEEE Electrical Power & Energy Conference, Halifax, NS, Canada, 21–23 August 2013; pp. 1–5. [Google Scholar]
  10. Wang, T.; Monti, A.; Goldbeck, R.; De Doncker, R.W. Voltage selection and personal safety in low voltage direct current networks at customer end. In Proceedings of the 2018 IEEE PES Innovative Smart Grid Technologies Conference Europe (ISGT-Europe), Sarajevo, Bosnia and Herzegovina, 21–25 October 2018; pp. 1–6. [Google Scholar]
  11. Yong, J.; Xu, X.; Zeng, L. A review of low voltage DC power distribution system. Proc. CSEE 2013, 33, 42–52. [Google Scholar]
  12. Li, T.; Guo, F. Electric shock protection technology and its development of low-voltage distribution. Distrib. Utiliz. 2019, 36, 2–8. [Google Scholar]
  13. Lai, C.; Zhong, Q.; Zhao, Y.; Qiu, Y.; Liu, G. Risk assessment method for electric shock of electrical equipment in low-voltage DC power supply system. Autom. Electr. Power Syst. 2021, 45, 141–147. [Google Scholar]
  14. Yu, D.; Yang, C.; Jiang, L.; Li, T.; Yan, G.; Gao, F.; Liu, H. Review on safety protection of electric vehicle charging. Proc. Chin. Soc. Elect. Eng. 2022, 42, 2145–2164. [Google Scholar]
  15. Wang, S.; Li, H.; Liu, Q.; Su, W.; Wang, C. Research on the requirements for the break time of DC-RCD under different voltage levels and grounding modes in LVDC system. In Proceedings of the 2020 IEEE 4th Conference on Energy Internet and Energy System Integration (EI2), Wuhan, China, 30 October–1 November 2020; pp. 3675–3680. [Google Scholar]
  16. Lim, S.T.; Lee, K.Y.; Chae, D.J.; Oh, C.-H.; Lim, S.-H. Resistors and capacitors in series mid-point grounding for protection application in unipolar low voltage DC system. IEEE Access 2024, 12, 1461–1469. [Google Scholar] [CrossRef]
  17. Cheng, D.; Zhang, B.; Xiong, S.; Xie, Z.; Xue, Z. Residual current detection prototype and simulation method in low voltage DC system. IEEE Access 2022, 10, 51100–51109. [Google Scholar] [CrossRef]
  18. Liao, J.; Guo, C.; Zeng, L.; Kang, W.; Zhou, N.; Wang, Q. Analysis of residual current in low-voltage bipolar DC system and improved residual current protection scheme. IEEE Trans. Instrum. Meas. 2022, 71, 1–13. [Google Scholar] [CrossRef]
  19. Xue, Z.; Chen, S.; Wang, J.; Li, X.; Ge, S. The influence of line impedance on leakage current detection in low voltage DC systems. In Proceedings of the 2022 IEEE 67th Holm Conference on Electrical Contacts (HLM), Tampa, FL, USA, 23–26 October 2022; pp. 1–5. [Google Scholar]
  20. Lim, S.T.; Lee, K.Y.; Chae, D.J.; Lim, S.H. Design of mid-point ground with resistors and capacitors in mono-polar LVDC system. Energies 2022, 15, 8653. [Google Scholar] [CrossRef]
  21. Ding, K.; Cheng, K.W.E.; Wang, D.H.; Ye, Y.M.; Wang, X.L.; Liu, J.F.; Cheung, N.C. Low voltage DC distribution system. Energy 2014, 40, 5. [Google Scholar]
  22. Oliveira, T.R. Design of a low-cost residual current sensor for LVDC power distribution application. In Proceedings of the 2018 13th IEEE International Conference on Industry Applications (INDUSCON), Sao Paulo, Brazi, 12–14 November 2018; pp. 1313–1319. [Google Scholar]
  23. Zhu, H.; Wu, C.; Zhou, Y.; Xie, Y.; Zhou, T. Electric shock feature extraction method based on adaptive variational mode decomposition and singular value decomposition. IET Sci. Meas. Technol. 2023, 17, 361–372. [Google Scholar] [CrossRef]
  24. Xie, F.; Hao, Z.; Ye, D.; Yang, S.; Li, C.; Dai, G.; Zhang, B.; Wang, T. A non-unit line protection method for MMC-HVDC grids based on the currents of backward traveling waves. Int. J. Electr. Power Energy Syst. 2023, 153, 109373. [Google Scholar] [CrossRef]
  25. Liu, C.; Zhang, L. A novel denoising algorithm based on wavelet and non-local moment mean filtering. Electronics 2023, 12, 1461. [Google Scholar] [CrossRef]
  26. IEC Standard 60755-1; General Safety Requirements for Residual Current Operated Protective Devices—Part 1: Residual Current Operated Protective Devices for DC Systems. IEC: Geneva, Switzerland, 2022.
  27. IEC Technical Specification 63053; General Requirements for Residual Current Operated Protective Devices for DC Systems. IEC: Geneva, Switzerland, 2017.
Figure 1. Experimental platform for LVDC electric shock.
Electronics 13 03336 g001
Figure 2. Current waveforms of animal and non-animal bodies. (a) Live pig electric shock, (b) Load burst, (c) Basic residual current.
Electronics 13 03336 g002
Figure 3. Schematic diagram of a two-point fault in a DC IT grounding system. (a) Two-point opposite-side faults. (b) Two-point same-side faults.
Electronics 13 03336 g003
Figure 4. Schematic diagram of curve curvature calculation principle.
Electronics 13 03336 g004
Figure 5. Pig electric shock current feature. (a) Waveform after filtering, (b) Sliding curvature accumulation.
Electronics 13 03336 g005
Figure 6. Load burst current feature. (a) Waveform after filtering, (b) Sliding curvature accumulation.
Electronics 13 03336 g006
Figure 7. Basic residual current feature. (a) Waveform after filtering, (b) Sliding curvature accumulation.
Electronics 13 03336 g007
Figure 8. Peak value of sliding current accumulation under different conditions. (a) Different voltage levels, (b) Different skin surface humidity levels, (c) Different ways of electric shock, (d) Different weights, (e) Electric shock path: right forelimb-left hindlimb and right forelimb-right hindlimb, (f) Electric shock path: left forelimb-left hindlimb, left forelimb-right hindlimb.
Electronics 13 03336 g008
Figure 9. Peak value of sliding current accumulation at different currents. (a) Load burst, (b) Basic residual current.
Electronics 13 03336 g009
Figure 10. Rise time of animal and non-animal bodies.
Electronics 13 03336 g010
Figure 11. Algorithm for electric shock type recognition.
Electronics 13 03336 g011
Figure 12. DC-RCD prototype design scheme. (a) DC-RCD system schematic design, (b) Physical drawing of DC-RCD prototype.
Electronics 13 03336 g012
Figure 13. Dynamic waveform of DC voltage/fault current test under no-electric-shock ground fault condition. (a) The method proposed in this paper, (b) Amplitude identification method.
Electronics 13 03336 g013
Figure 14. Dynamic waveform of DC voltage/electric shock current test under two-point opposite-side fault conditions. (a) The method proposed in this paper, (b) Amplitude identification method.
Electronics 13 03336 g014
Figure 15. Dynamic waveform of DC voltage/electric shock current test under two-point same-side fault conditions. (a) The method proposed in this paper, (b) Amplitude identification method.
Electronics 13 03336 g015
Table 1. Living pig DC electric shock experimental conditions.
Test GroupsElectric Shock PathsSkin Surface Humidity LevelsElectric Shock Methods
1left forelimb-left hindlimbhumidity 0%touch
2left forelimb-left hindlimbhumidity 0%bundling
3left forelimb-left hindlimbhumidity 20%touch
4left forelimb-left hindlimbhumidity 20%bundling
5left forelimb-right hindlimbhumidity 0%touch
6left forelimb-right hindlimbhumidity 0%bundling
7left forelimb-right hindlimbhumidity 20%touch
8left forelimb-right hindlimbhumidity 20%bundling
9right forelimb-left hindlimbhumidity 0%touch
10right forelimb-left hindlimbhumidity 0%bundling
11right forelimb-left hindlimbhumidity 20%touch
12right forelimb-left hindlimbhumidity 20%bundling
13right forelimb-right hindlimbhumidity 0%touch
14right forelimb-right hindlimbhumidity 0%bundling
15right forelimb-right hindlimbhumidity 20%touch
16right forelimb-right hindlimbhumidity 20%bundling
Table 2. The action time of the DC-RCD designed in this paper under three working conditions.
Non-Animal Grounding FaultsTwo-Point Electric Shock Fault on the Same SideTwo-Point Electric Shock Fault on the Opposite Sides
Electric shock current valueAction timeIEC StandardsElectric shock current valueAction timeIEC StandardsElectric shock current valueAction timeIEC Standards
110 mA0.053 s<0.3 s158 mA0.06 s<0.15 s186 mA0.061 s<0.15 s
Disclaimer/Publisher’s Note: The statements, opinions and data contained in all publications are solely those of the individual author(s) and contributor(s) and not of MDPI and/or the editor(s). MDPI and/or the editor(s) disclaim responsibility for any injury to people or property resulting from any ideas, methods, instructions or products referred to in the content.

