Article

Research on an Indoor Light Environment Comfort Evaluation Index Based on Electroencephalogram and Pupil Signals

1
School of Mechanical Engineering, Xi’an Jiaotong University, Xi’an 710049, China
2
State Key Laboratory for Manufacturing Systems Engineering, Xi’an Jiaotong University, Xi’an 710054, China
3
The First Affiliated Hospital of Xi’an Jiaotong University, Xi’an 710061, China
*
Author to whom correspondence should be addressed.
Electronics 2024, 13(17), 3411; https://doi.org/10.3390/electronics13173411
Submission received: 22 July 2024 / Revised: 20 August 2024 / Accepted: 23 August 2024 / Published: 27 August 2024
(This article belongs to the Special Issue New Advances of Brain-Computer and Human-Robot Interaction)

Abstract

:
With the development of modern technology, many people work for a long time around various artificial light sources and electronic equipment, causing them to feel discomfort in their eyes and even eye diseases. The industry currently lacks an objective quantitative environmental–visual comfort index that combines subjective and objective indicators. For this experiment, objective eye movement and electroencephalogram (EEG) signals were collected in combination with a subjective questionnaire survey and a preference inquiry for comprehensive data mining. Finally, the results on a Likert scale show that high screen brightness can reduce the visual fatigue of subjects under high illuminance and high correlated color temperature (CCT). Pupil data show that, under medium and high ambient illuminance, visual perception sensitivity is more likely to be stimulated, and visual fatigue is more likely to deepen. EEG data show that visual fatigue is related to illuminance and screen brightness. On this basis, this study proposes a new evaluation index, the visual comfort level (0.6404 average at a low screen brightness, 0.4218 average at a medium screen brightness, and 0.5139 average at a high screen brightness), where a higher score for the visual comfort level represents a better visual experience. The visual comfort level provides a useful reference for enhancing the processing of multi-dimensional and biomedical signals and protecting the eyes.

1. Introduction

In fast-paced daily life, people necessarily use various lights and electronic equipment, whether during work at home or in an office. Research has shown that the subjective feelings, work comfort, and efficiency of users are closely related to the combination of lights in the working environment and adjustable electronic screen brightness [1,2,3]. Satisfaction with the light environment is related to a person’s cultural background, personal habits, mentality at the time, and surrounding decor [4,5,6]. Similarly, different screen brightnesses also affect user satisfaction [7]. Satisfaction here is mainly reflected in eye comfort and visual fatigue. If the combination of an indoor office light environment and screen brightness makes users uncomfortable, it may have a negative impact and affect the relevant building evaluation indicators [8]. Therefore, it is particularly important to quantitatively evaluate visual fatigue. In the early stages of this field of research, subjective scales were used to evaluate visual fatigue, but there was a lack of confidence due to individual differences. Many recent studies have used pupil data and EEG signals to evaluate visual fatigue both qualitatively and quantitatively. However, there is a lack of correlation between these studies, and there is also a lack of methods to promote the combination of the subjective and objective quantitative evaluation of visual fatigue. Therefore, the industry urgently needs a combination of subjective and objective methods to evaluate the subjective and objective visual perception of users, in order to reflect the advantages and disadvantages of different light environments and screen brightness parameters, which not only can guide industry-related design, but also helps to identify the most comfortable working environment for users. The following section provides relevant background information and a research introduction.
First, the relationship between light environment illuminance and CCT and visual perception is explored. In the field of light environments, many design standards and lighting specifications have clear indicators for the required lighting levels of specific environments inside buildings: according to China’s standard for the lighting design of buildings (GB50034-2013), the standard illuminance value of ordinary offices and conference rooms should be 300 lx [9]. Manav found that users working with 2000 lx have a better visual experience than those working with 500 lx, which means people’s eyes prefer a brighter light environment; additionally, participants working under 4000 K CCT have better ‘comfort and spaciousness’ than those working under 2700 K [10]. Gou indicated that although subjects were most comfortable at 401–500 lx, subjects scored the highest and had the best visual perception under higher illuminance (900 lx) when completing visual tasks [11]. Leccese found a high relationship between the personal perception of students and the lighting quality of the classroom [12]. Fakhari proposed a new model including 12 indicators that influence visual comfort in the classroom, conducted quantitative evaluations, and concluded that the lighting level was the most important indicator [13]. Li et al. studied the emotional perception of subjects under specific illuminance (100 lx and 1000 lx) and CCT (2700 K and 6500 K). They demonstrated that lower CCT significantly reduced negative emotion bias in a face-judgment task. In contrast, illuminance or CCT had no significant effect on negative emotion in an emotional oddball task [14].
Second, the relationship between screen brightness and visual perception has been assessed. In the field of screen brightness, Xie found that lower screen brightness will induce severe visual fatigue in a non-dark environment; they also learned that relatively high text-screen brightness will lead to a better user experience when reading electronic text [15]. Tian et al. explored the specific settings of different screen brightness modes [16], and the screen brightness in this article is also set according to this standard. Zeng et al. detected that visual physiological changes with a variety of screen brightness levels are dramatically lower than those with stable screen brightness, indicating that the visual fatigue caused by dynamic brightness is lower [17], and the idea of how dynamic screen brightness trends could lead to fewer visual fatigue changes was also helpful for the design of this experiment.
Third, the definition of visual fatigue and the existing evaluation methods are introduced. Visual fatigue is a complex phenomenon that manifests as a decline in visual function, overall psychological state, and physiological state. Relevant evaluations have been collected through a questionnaire survey based on the subjective feelings of the audience, in order to evaluate the subjective aspects of visual fatigue [18]. The questionnaire simply and intuitively reflects psychological changes but is easily affected by individual differences and psychological factors [19]. Pupil parameters and EEG were used to evaluate the objective aspects of visual fatigue [20,21]. Visual fatigue is closely related to visual neuroscience. Pupil dynamics are controlled by autonomic nerves, and changes in pupil diameter may affect the regulation of the eyes, reflect brain activity, and indicate visual discomfort [22,23]. De Zeeuw confirmed that the pupil light response is a non-invasive physiological marker of the daytime ambient light exposure effect, indicating that pupil data can be used to evaluate the light environment [24]. Chanjuan revealed the relationships between illuminance, illuminance uniformity, color temperature, and productivity. The higher the productivity, the more concentrated the attention and the lower the fatigue [25].
Fourth, an academic evaluation of the existing evaluation methods is conducted. With the deepening of research, visual fatigue is defined as physiological tension or pressure caused by the fatigue of the visual system [26]. Scholars [27] believe that various determinants and symptoms lead to various indicators to measure visual fatigue, such as the relationship between vergence insufficiency and the medial ocular muscles, ciliary body, and tear glands. Therefore, visual fatigue cannot be evaluated using only one objective index. In other words, from the perspective of optic neuroscience, it is necessary to combine various objective and subjective measurement methods to determine the degree of visual fatigue and discomfort in a sensitive, accurate, reliable, and effective way [26].
Fifth, one of our evaluation tools—the brain–computer interface (BCI)—is explained. The BCI has been used as a popular communication method in recent years. It is an external device that can connect the human brain and is independent of the normal peripheral nerve and muscle system. The BCI measures brain activity and converts the encoded human intention into signals for the control of computers, wheelchairs, and robots [28,29,30]. Brain–computer interfaces can be divided into two categories: invasive and non-invasive. At present, non-invasive methods are widely used and have a wide market range [31]. Compared with other types of BCIs, the BCI based on steady-state visual evoked potential (SSVEP) has the superiorities of a high information transmission rate (ITR), fewer electrodes, and a short training time [32]. The objective EEG data reflecting visual fatigue collected in this study are based on SSVEP.
To explore and promote the quantitative evaluation and index fusion of visual fatigue, we simulated the combination mode of three illuminances (75 lx, 200 lx, and 500 lx), two CCTs (3500 K and 6800 K), and three screen brightnesses (0%, 50%, and 100%). Against the background of the combination mode, the visual fatigue differences of the subjects were quantitatively evaluated so as to rank the anti-fatigue advantages and disadvantages of different parameters. The screen brightness was controlled at 52.4 cd/m2 (0% mode), 287.6 cd/m2 (50% mode), and 422.6 cd/m2 (100% mode). In the rest of the paper, the second part elaborates on the specific design of the experiment, the third part illustrates the experimental data analysis, the fourth part expounds the data results, and the fifth part provides the conclusion.

2. Materials and Methods

2.1. Experimental Chamber

This experiment was executed in an enclosed laboratory with white walls without an external light source in pure darkness, used to simulate an ordinary office without natural light interference. Above the experimental area was a bulb with adjustable illuminance and CCT. The light parameters of the light shining on the eye area of the subject were tracked and confirmed using a spectrometer throughout the whole process in order to ensure uniform exposure. The computer screen was 55 cm away from the subjects. A head brace was used to fix the head of subjects, ensuring that their eye height and screen distance remained unchanged during the experiment. The schematic diagram of the experimental design and lamps are shown in Figure 1 and Figure 2.

2.2. Subjects

The whole experimental process is shown in Figure 3. Twenty subjects (15 males and 5 females) participated in this experiment. All subjects were between 23 and 29 years old. Their visual acuity or corrected visual acuity was above 1.0. All subjects had no eye diseases and did not wear contact lenses during the experiment. All subjects were given informed consent according to the Helsinki Declaration and approved by the institutional review committee of Xi’an Jiaotong University (No. 2023-1552).

2.3. Data Acquisition

As this study was aimed at the visual area, the electrodes were arranged in the occipital region of the brain like PO3, PO4, POz, O1, O2, and Oz, respectively, according to the relative literature, to store the corresponding data [16]. The grounding electrode FPz was located at the forehead, and the reference electrode A1 was located at the left earlobe [33]. The data acquisition was conducted with a 1200 Hz sampling rate 8-channel EEG acquisition system (g.tec, Schiedlberg, Austria) and a 120 Hz sampling rate eye tracker (Tobii, Stockholm, Sweden). In addition, a 2–100 Hz bandwidth band-pass filter and a 48–52 Hz bandwidth notch filter were added to remove artifacts and power line interference, respectively.

2.4. Stimulus Designs

The purpose of our experiment was to explore the difference in the degree of fatigue after the same number of experimental tasks under the combination of three different variables of different ambient light intensity, ambient light color temperature, and screen brightness. For this reason, we defined five experimental indicators (two subjective and three objective indicators) to process and analyze the obtained data. Finally, in order to consider all the indicators, we used the Criteria Importance Through Intercriteria Correlation (CRITIC) weight method to unify the five indicators. We also proposed a new indicator (the visual comfort level) to measure visual fatigue under different combinations of variables, thus paving the way for related research.
During this experiment, a 60 Hz refresh rate display with 4 K high definition was utilized. The screen brightness, illuminance, and CCT of the controllable table lamp irradiation area were scaled using the HOPOO spectral brightness analyzer. During the trials, the monitor was placed 55 cm away from the subjects, and the eyes of the subjects looked straight at the center of the screen. The head of the subject was fixed using a head brace with adjustable height in order to ensure that the subject did not disturb the measurement of EEG and eye movement data in the experiment. The visual angle of paradigm scintillation was 4°, and its diameter was 148 pixels, which were set by referring to the relevant literature [34,35]. The eye tracker was pasted at the bottom of the screen. The stimulus paradigms were presented by MATLAB 2016b with the Psychophysics Toolbox [36]. The international SSVEP stimulation paradigm—light scintillation paradigm—was used in this experiment to help others reproduce the experiment. The stimulation mode of the paradigm was the brightness, which changed from black to white. The paradigm was modulated by a sine wave, and the stimulation frequency was 7.5 Hz.

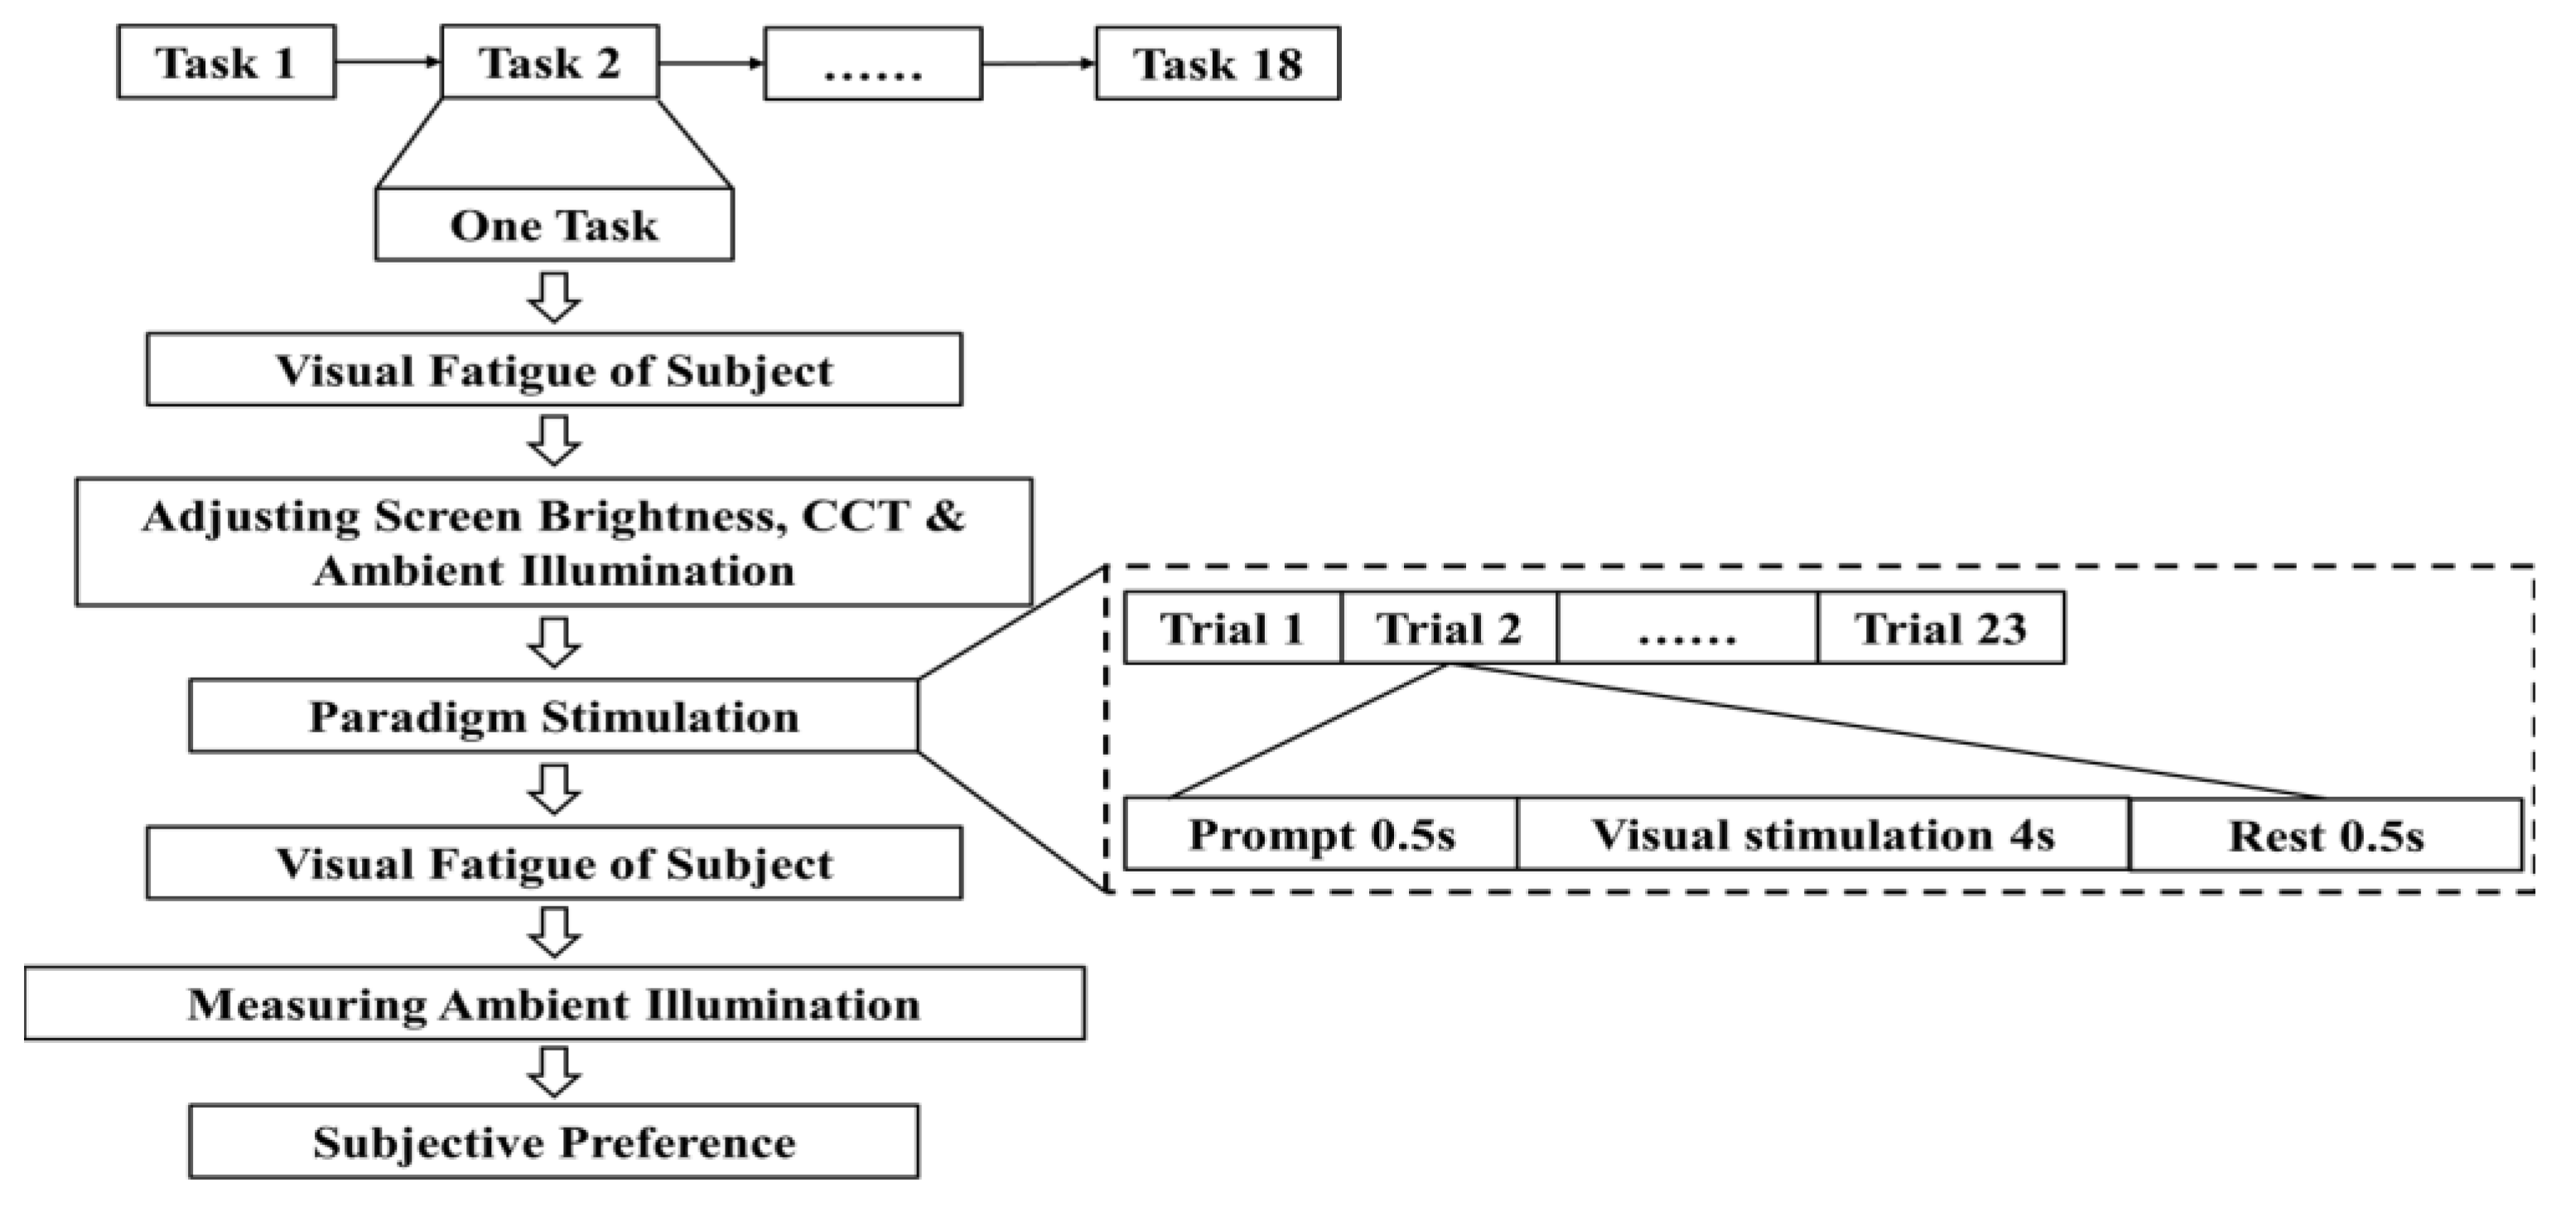
2.5. Experimental Procedure

To avoid the influence of the order of 18 conditions on the experimental results, as shown in Table 1, the experiment was conducted using the order of Latin Squares with a total of 18 working conditions and 20 test subjects. The second subject started from condition 2, followed by condition 3 to 18, and then condition 1, and so on. The eighteenth subject started from condition 18, followed by conditions 1 to 17. The experimental process of the nineteenth subject was consistent with that of the first subject, and the experimental process of the twentieth subject was consistent with that of the second subject.
Each experiment corresponded to a different indoor light condition, and the subjects needed to experience all 18 environments. Each experiment included 23 trials, and each stimulation trial was 4.5 s; the rest between trials was 0.5 s, meaning that a complete trial took 5.0 s.
As shown in Figure 3, there were 18 tasks in total. The following is an example of the specific process of one task. First, the HOPOO spectral brightness analyzer (OHSP-350L, Hangzhou HOPOO Optical Color Technology Co., Ltd., Hangzhou, China) was used to measure the illuminance at the midpoint of the human eyes to ensure that the experimental conditions were met. Second, the visual feeling of subjects was recorded using the Likert scale before each round of the experiment. Then, the eye tracker began to record the pupil diameter data in the experiment. Third, the brightness of the screen, the illuminance, and the CCT of the light environment were adjusted around the eyes of participants. Fourth, the subjects stared at the white static “x” mark on the black background during pre-experimental trials. It has been proved that there was no interference between the light reflection of the pupil and the ambient light [37]. An “X”-shaped white mark that helps fix the line of sight appears in the center of the paradigm [34]. Multiple sensors (EEG acquisition system and eye tracker) synchronously record all data. Fifth, the formal experiment of light-flicker stimulation was conducted. Sixth, subjective feelings and preferences for the whole combination were questioned using the Likert scale at the end of the trials. Seventh, the light environment data around the eyes were measured to ensure that the light environment parameters of the whole experiment were unchanged.
Whenever one of the 18 experiments was completed, the subjects were allowed a good rest until the next experiment, and the rest time was controlled by the subjects themselves. To avoid the influence of natural light, the experiment was set to start after dark at 8 pm each day, but the end time was slightly different due to the different rest times of each subject between each round of experiments. In summary, the per capita experiment time of 20 subjects was about 2 h, which means that the experiment was controlled between 8 pm and 10 pm every night to avoid the possible influence of the circadian rhythm on the experiment.
The visual fatigue was aggravated with the increase in experimental time. Therefore, the formal trials in each round are divided into four levels: level 1 (4–8 trials), level 2 (9–13 trials), level 3 (14–18 trials), and level 4 (19–23 trials) [38]. Level 1 represents the lowest fatigue state at the beginning, and level 4 denotes the greatest fatigue state at the end [38,39].

2.6. Experimental Index

The setting of experimental indicators is considered from a systematic perspective, in which subjective visual fatigue and subjective preference are set to reflect the subjective quantification of visual fatigue users, and pupil data acquisition and EEG activity acquisition are set to reflect the objective quantification of visual fatigue of participants from the perspective of the optic nerve and cerebral cortex, respectively [20,21]. In the subsequent analysis, there will be a unified comfort index to quantify the overall visual experience of subjects in the entire light environment.

2.6.1. Likert Scale of Subjective Visual Fatigue (SVF) and Subjective Preference (SP)

It is meaningless to look at the score of a certain item on the Likert scale alone, which is a summation scale. In the subjective visual fatigue part of the questionnaire, the subjects gave a score of 1, very disagreeing, to 10, very agreeing. The subjective fatigue score is the score summation of six questions, which can show the subjective visual perception of the subjects.
The questionnaire was modified according to that designed by Professor Xie [15] and the experimental environment. The summation of the first six scores of questions gives the subjective visual fatigue (SVF) indicator, while the answer to the seventh question gives the subjective preference (SP) index.

2.6.2. EEG Signal-to-Noise Ratio (ES) and EEG Amplitude (EA)

In this study, canonical correlation analysis (CCA) was used to process EEG data. Compared with traditional EEG signal-processing methods such as component analysis, CCA uses channel covariance information with a high signal-to-noise ratio to process data [40,41]. At the same time, CCA is widely used because of its high efficiency, robustness, and simple implementation [42,43]. After filtering and data screening, the CCA signal-to-noise ratio (SNR) is calculated.
S N R = z ( f ) 2 1 n k = 1 n 2 [ z f + c k 2 + z ( f c k ) 2 ]
where n is set to 10, f is 7.5 Hz, z ( f ) is the CCA coefficient of the stimulus frequency f on the CCA spectrum, and c is set to 0.1 as the scale value of the abscissa on the CCA spectrum.
The obtained data are the EEG SNR (ES) of this experiment. Moreover, as the stimulating frequency of the paradigm was 7.5 Hz, the CCA coefficient of relevant frequency was also extracted, which is called the EEG amplitude (EA) in this experiment. ES and EA data were normalized before the next step.

2.6.3. Pupil Diameter (PD)

The size of the pupil can be used to reflect the degree of visual fatigue, which is also closely related to visual diseases [44]. The pupil size is generally 2–5 mm, with an average size of about 4 mm. In different situations, the maximum pupil size can be 8 mm, and the minimum pupil size can be 1.5 mm. The size difference between the two eyes is less than 0.25 mm. This design objectively quantifies the visual fatigue of the subjects from the perspective of visual intuitive experience.

2.7. Fatigue Quantitative Evaluation Model

According to the previous literature, the subjective fatigue scale is widely used as the gold standard to quantify fatigue [15,39,45], and subjective preferences can also quantify fatigue [16]. Similarly, the signal-to-noise ratio of the CCA spectrum, EEG response amplitude, and pupil diameter [16,39] can quantify fatigue in the SSVEP experiment. In this study, the same stimulation time as in other works in the literature [16,38,39] was used to achieve the objective quantification of fatigue. The above theoretical basis and all the subjective and objective indicators were used for modeling. The process was as follows:
  • The data are divided into n groups according to the category. Categories are mainly distinguished by specific data source types. The subjective part is divided into pre-experiment and post-experiment. The objective part divides the first 1/4 into the least fatigued state and the last 1/4 into the most fatigued state according to the number of experiments.
  • In the subjective part, the value of the post-experiment minus the value of the pre-experiment is the original subjective fatigue value. In the objective part, the difference between the least fatigued state and the most fatigued state is taken as the original objective fatigue value according to the specific type of data.
  • The obtained objective data are standardized, and the ratio of the original objective fatigue value to the initial objective calibration value is the standardized objective fatigue value.
  • Data are mapped forward or backward (according to the characteristics of the data) to the [0,1] interval;
  • The CRITIC algorithm (Supplementary Materials) is used to calculate the corresponding weights of n sets of data: w1, w2, ..., wn;
  • The obtained CRITIC weight is multiplied by the corresponding n sets of data quantization values and added to obtain the final fatigue quantization score.

2.8. Statistical Analysis

The SPSS 22.0 software was utilized for statistical analysis, and one-way and two-way repeated-measures analysis of variance (ANOVA) with a significance of <0.05 were used to analyze the above five indicators (SVF, SP, ES, EA, and PD) in the 18 conditions at level 1 and level 4. The Kolmogorov–Smirnov (KS) normal distribution test was used to pre-process the data. The abnormal data that may be caused by human factors, such as excessive blinking, and environmental factors, such as friction dislocation between scalp and collector during the experiment, were discarded (less than 0.05 in the KS test), and then follow-up analysis was conducted.

3. Results

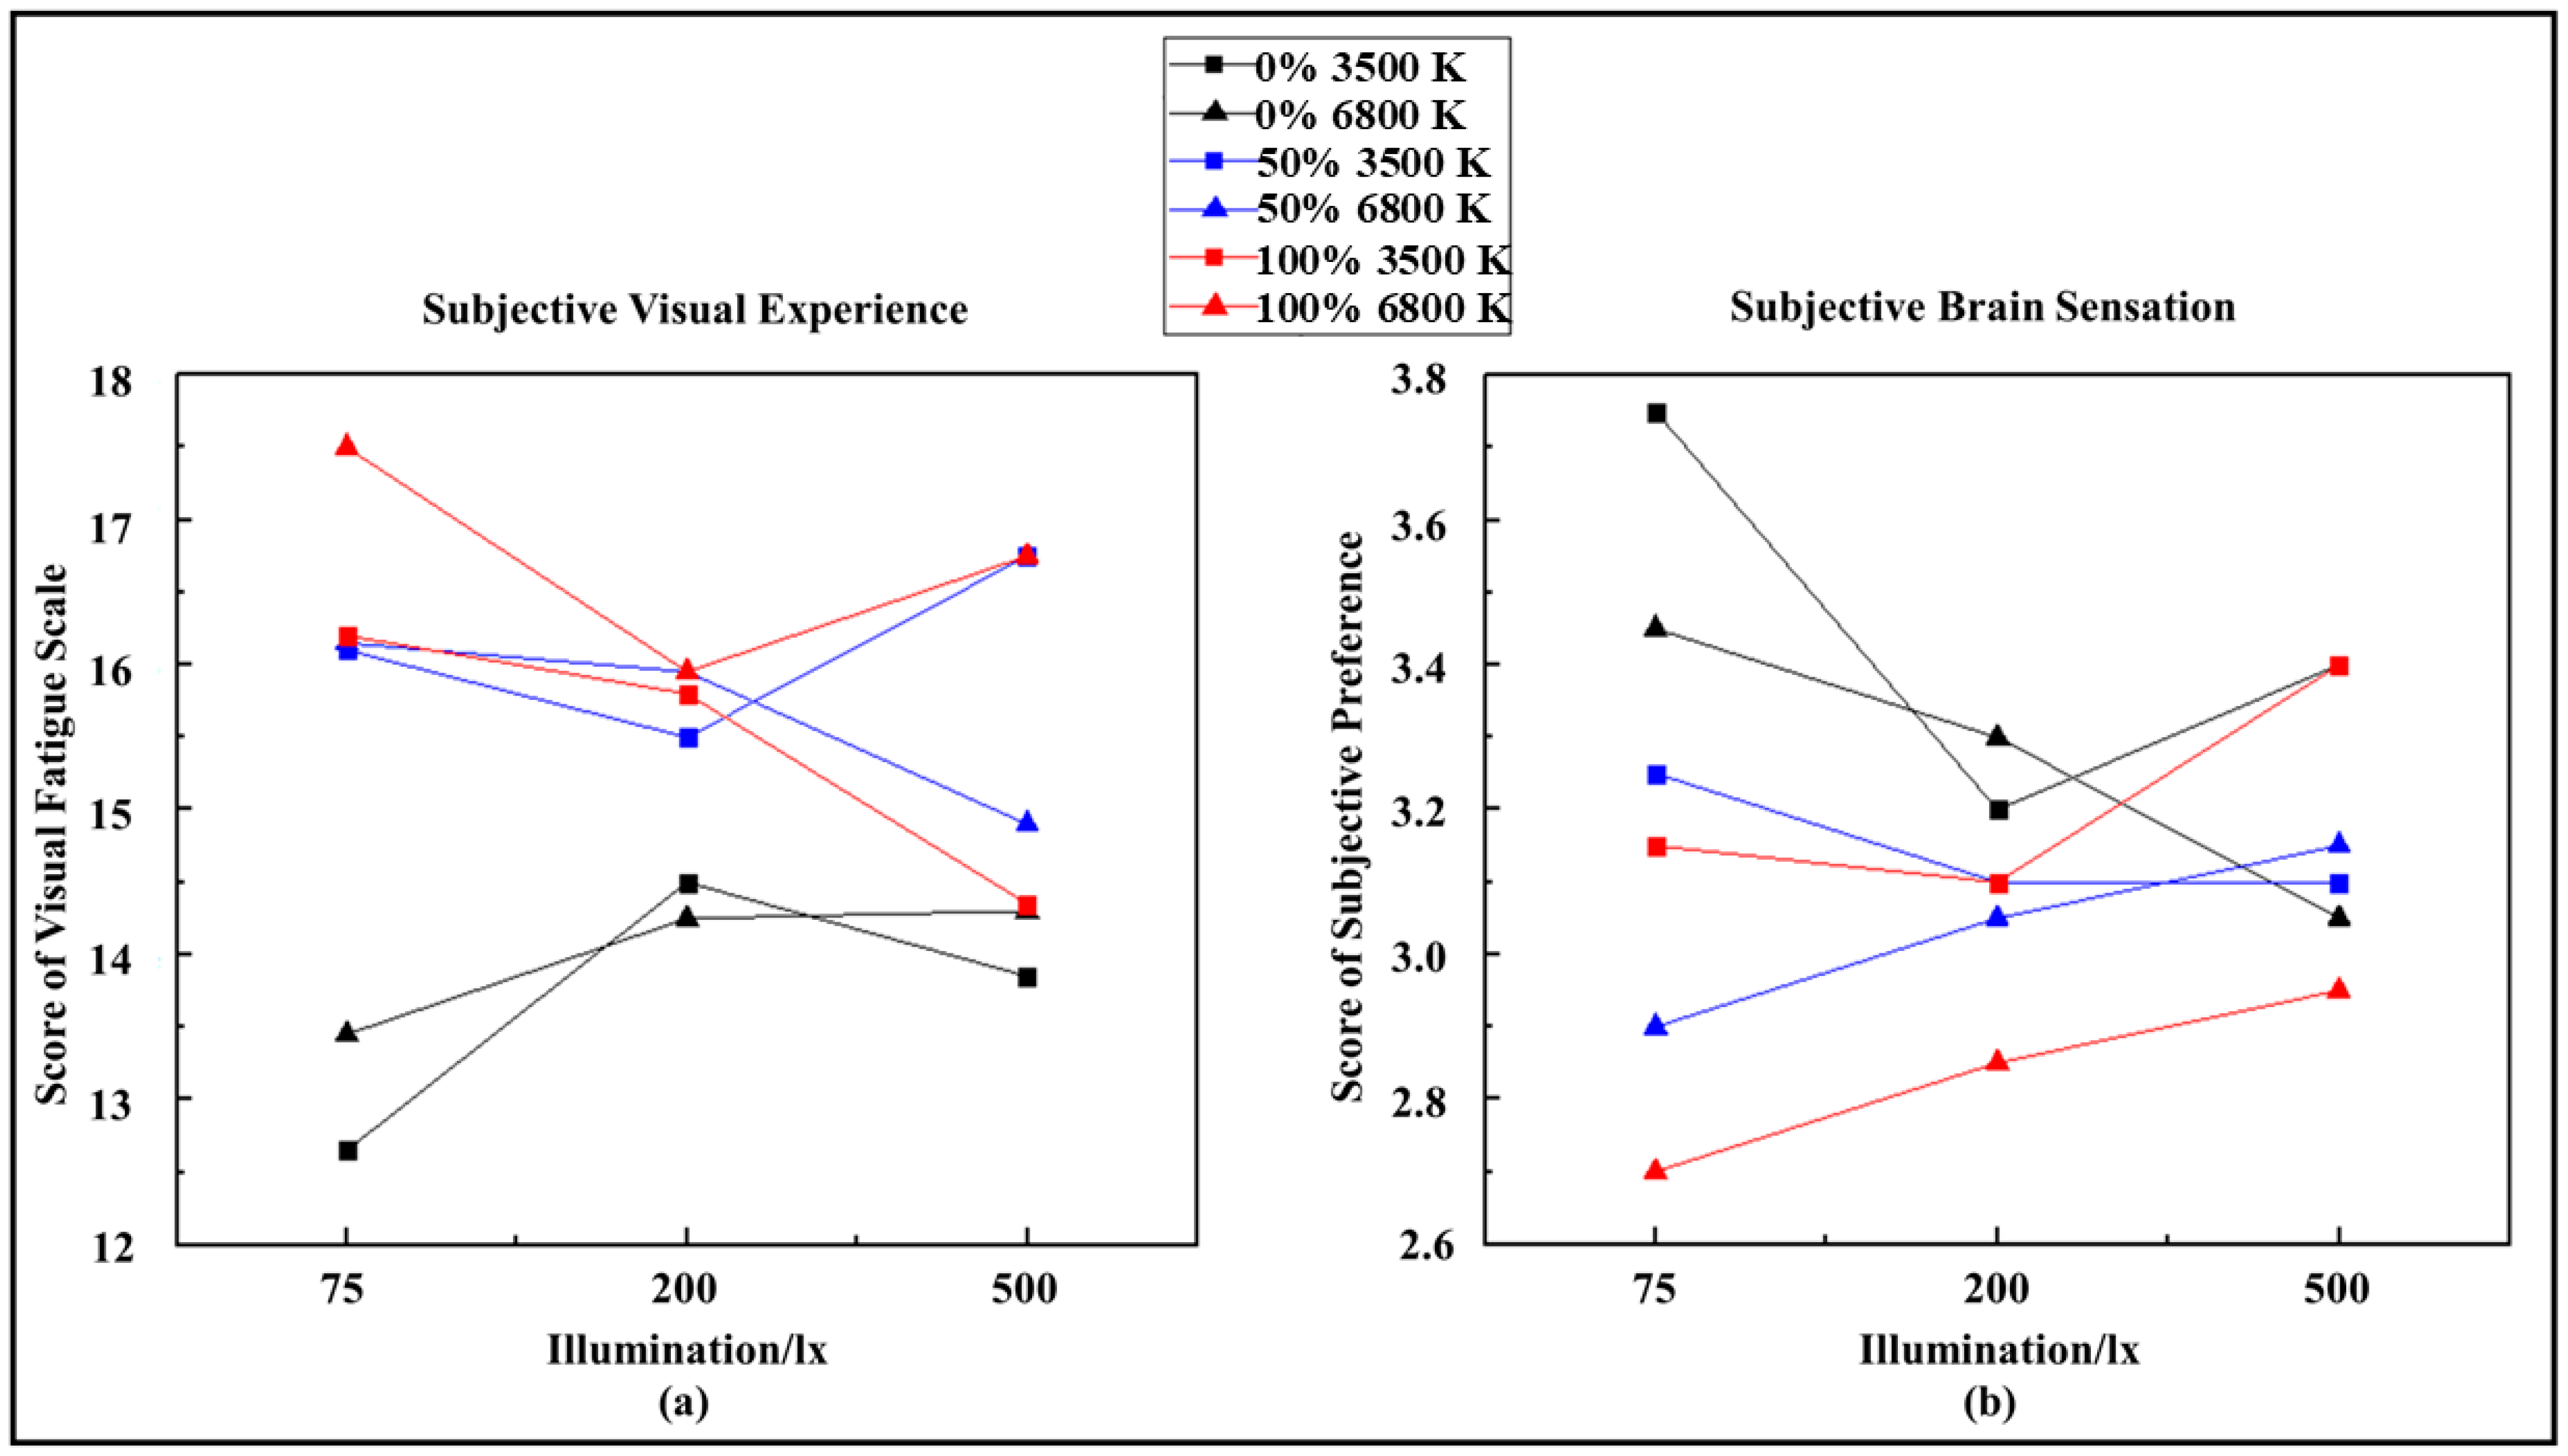
3.1. Subjective Analysis

The larger SVF value accounts for the higher subjective fatigue and the worse visual experience. Figure 4a can be analyzed as follows: from the perspective of screen brightness, the subjective visual experience is the best at low screen brightness; on the contrary, the average SVF of subjects being the highest at high screen brightness means the experience is the worst in this case, which may be related to the usual eye care habits of participants; from the perspective of CCT, the SVF at 3500 K is slightly less than 6800 K, which shows that subjects feel more comfortable under a light environment of warm color; from the perspective of illuminance, the subjective visual fatigue under medium brightness–warm light and high brightness–cold light decreases first and then increases with the increase in illuminance. The trend under low brightness–warm light is the opposite. At the same time, fatigue is directly proportional to illuminance under low brightness–cold light but inversely proportional to illuminance under medium brightness–cold light and high brightness–warm light, which indicates that greater environmental illuminance does not always lead to a better visual experience.
The larger the SP value, the more comfortable the subject is under its corresponding experimental parameter settings, and the better the visual experience. As Figure 4b shows, low screen brightness can still obtain the best user visual experience. The performance of low illuminance combined with warm-color light is better than that with cold-color light under the conditions of medium brightness and high brightness. With the increase in illuminance, the difference in SP between 3500 K and 6800 K becomes smaller at first and then bigger, which shows that under the medium-brightness light environment, the SP difference is the smallest between two CCT modes, indicating that users can often obtain a similar visual experience at this condition.
The one-way ANOVA analysis of the two subjective evaluation indices shows that brightness is a very significant factor. At the same time, CCT also has a certain impact on subjective preference, while the influence of illuminance on the two indexes is not obvious.

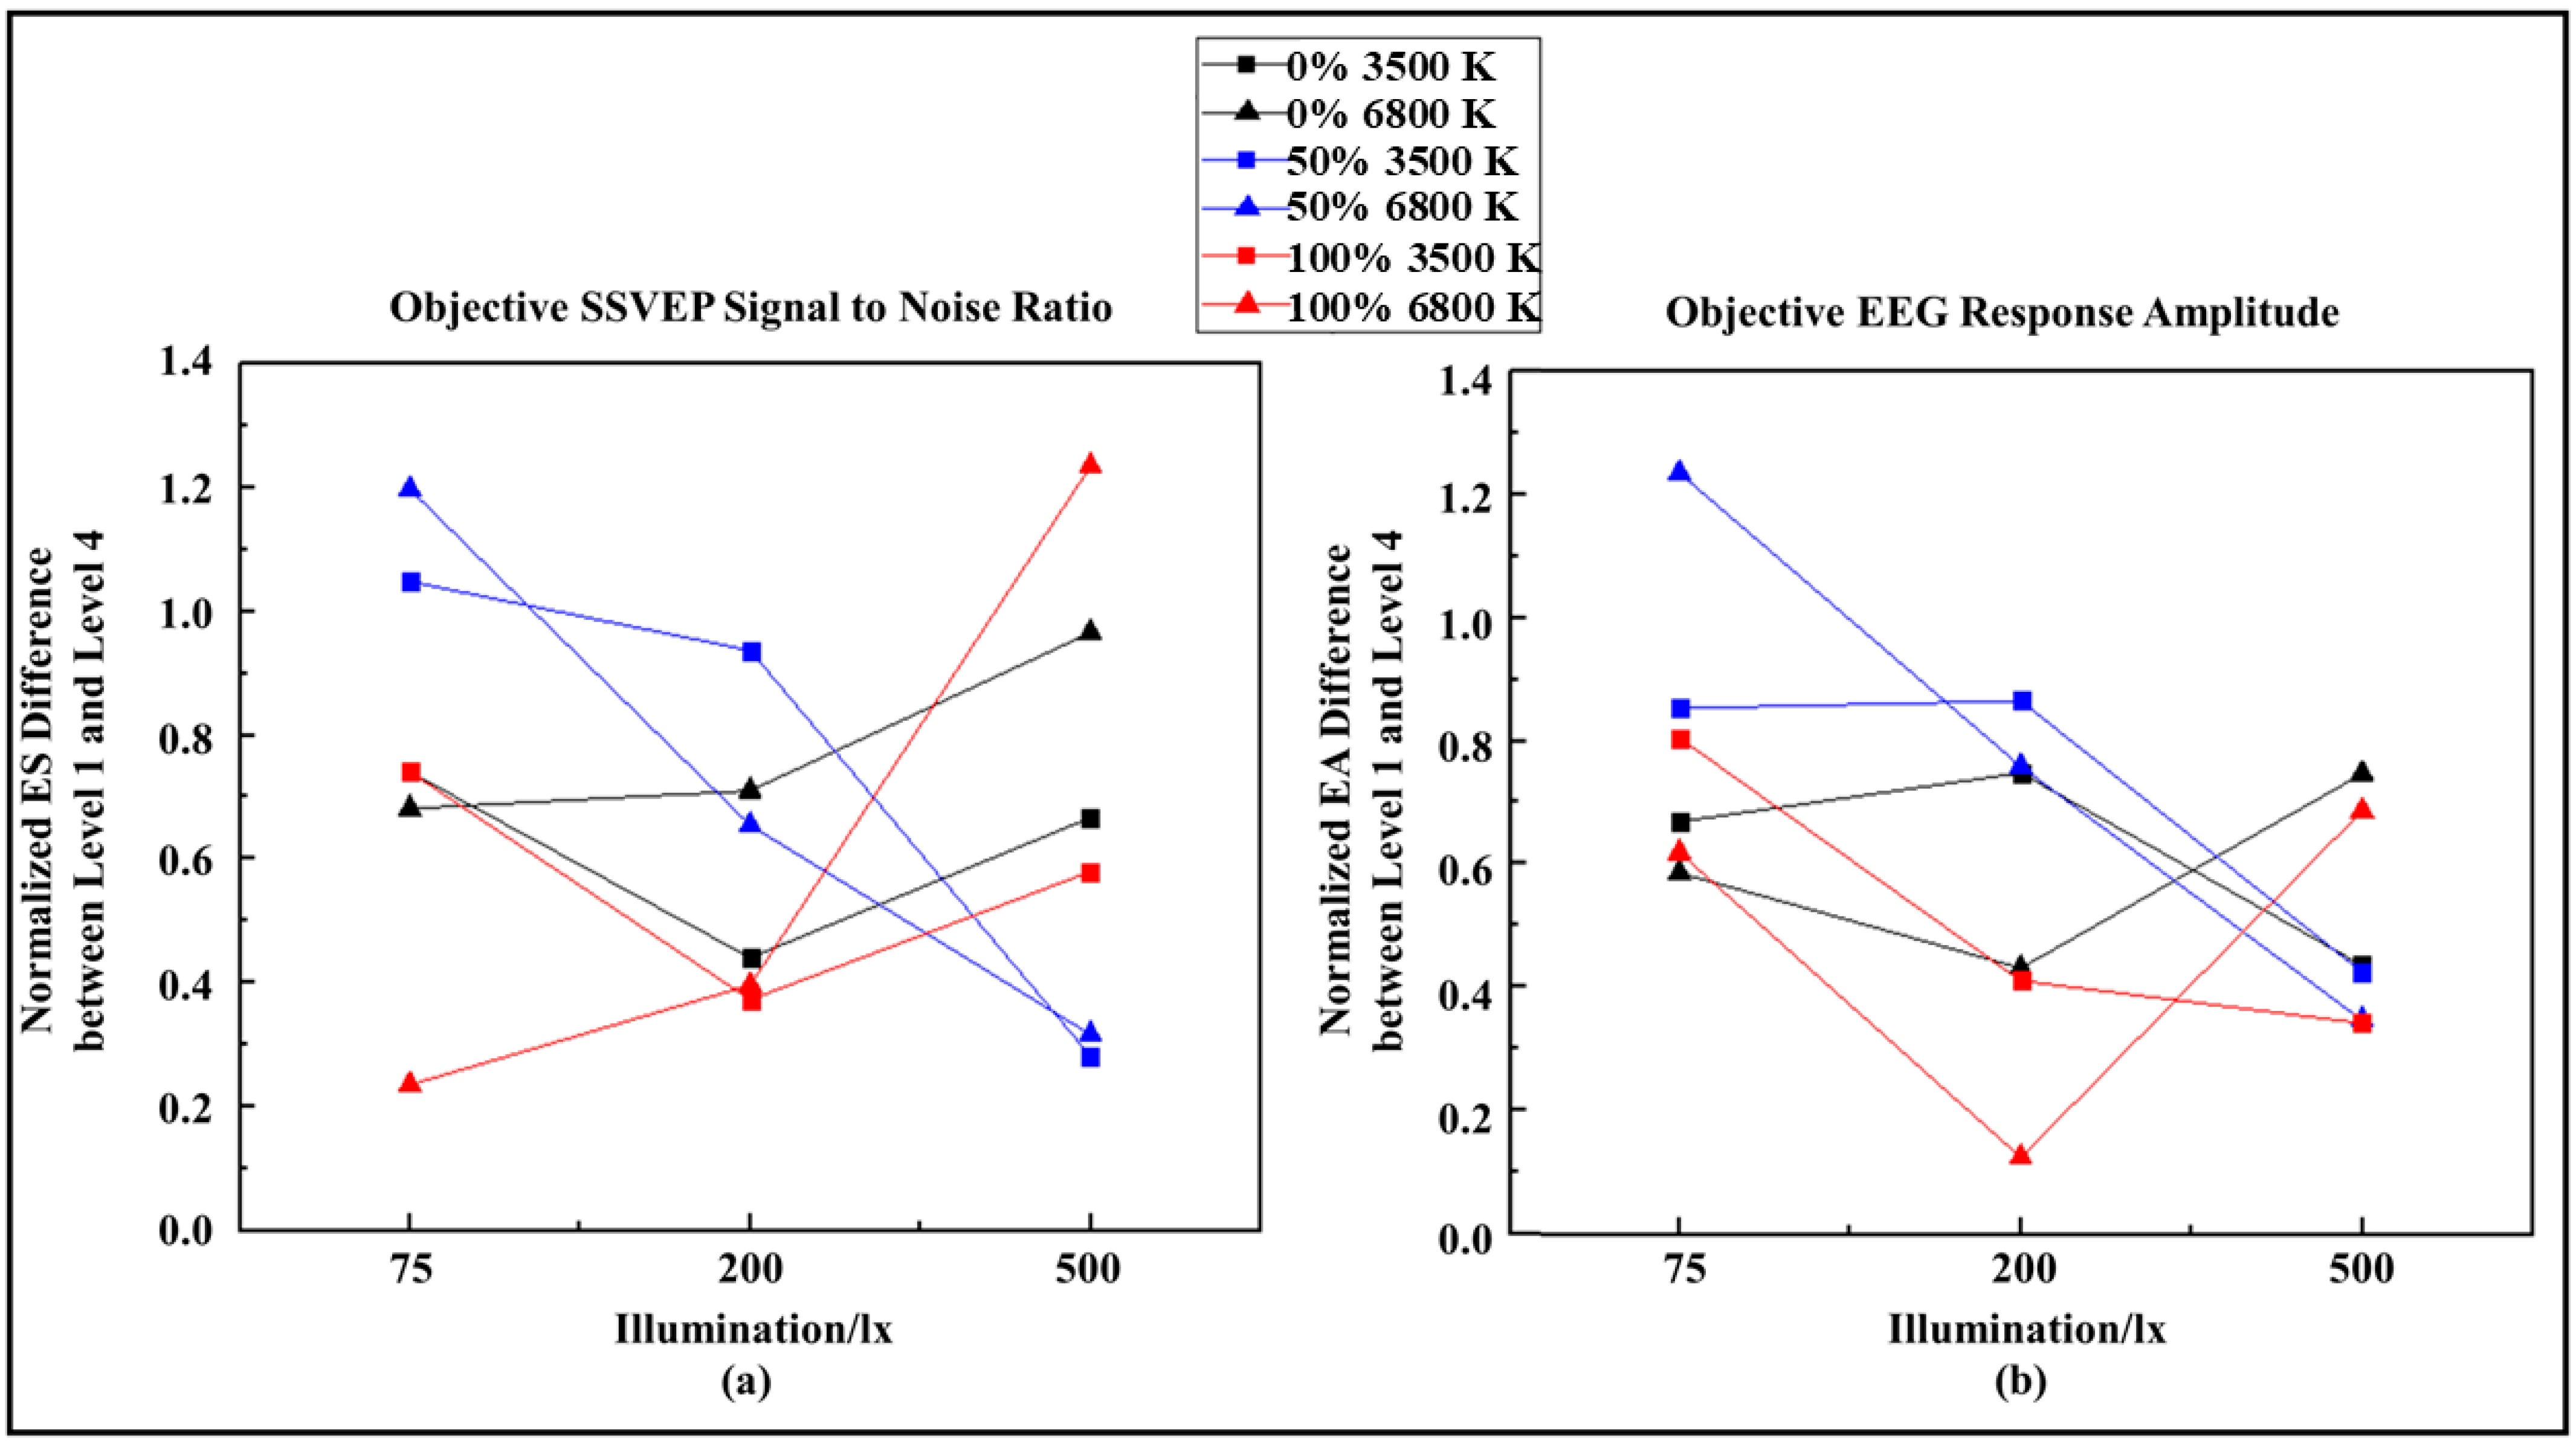
3.2. Objective Analysis

The greater the value of ES, the more visual fatigue the subjects produce in this process and the worse the environmental experience. As Figure 5a and Figure 6 show, a lower brightness does not mean a better visual experience, which indicates that EEG is not sensitive to screen brightness. Regardless of the brightness, the best visual experience is achieved at 500 lx under warm color light. This shows that when the illuminance is high, and the CCT is low while using computers in the indoor office environment, regardless of what screen brightness is used, it can provide the best visual experience effect for users.
The greater the EA (also called the CCA coefficient value), the more fatigue the subjects experience in the process and the worse their overall feeling. Figure 5b and Figure 7 show that, at high brightness, the visual fatigue under 200 lx is the lowest, and the visual effect is the best. When the illuminance is not low, the higher the brightness is, the less likely the subject is to be tired at low CCT. On the contrary, when the illuminance is low, the lower the brightness is, the less likely it is to be tired at high CCT. This shows that when the indoor environmental illuminance is medium or high, the CCT set inversely proportional to the screen brightness can provide better visual comfort for users.
The greater the value of the difference in PD, the more fatigue the subjects produce in this process and the worse their comfort. As Figure 8 and Figure 9 show, fatigue is the lowest at low brightness, which shows that the pupil diameter is affected by the screen’s brightness. Eyes clearly prefer a darker screen. Fatigue increases with the increase in illuminance at low brightness and high CCT. On the contrary, the increase in illuminance has little effect on fatigue at high brightness. The objective pupil data show that the screen brightness has a direct relationship with human visual fatigue, and this effect is greater than that of illuminance on human visual fatigue. When designing an indoor light environment, a designer should not only consider the illuminance and CCT. The guiding suggestions for the brightness settings of the screen also play an important role in avoiding greater visual fatigue.

3.3. Light Environment Comfort Evaluation

3.3.1. CRITIC Weight

In the analysis of the first two sections, some relationships could be determined between two subjective indicators (SVF and SP) as well as three objective indicators (ES, EA, and PD) and visual comfort. To more intuitively and clearly determine the relationship between the five indicators and visual comfort, the CRITIC weight method was introduced to unify these indicators so as to calculate a clearer environmental–visual comfort index. All the data were forward- or reverse-processed. The Pearson correlation test was performed, in which the significance between SVF and SP was 0.004, and that between ES and EA was 0.002. Meanwhile, the Pearson correlation between SVF and SP was 0.648 **, and that between ES and EA was 0.688 **, which shows that these two pairs of indicators have a moderate correlation strength.
Through calculation, the corresponding weights of five indicators (SVF, SP, EEG SNR, EEG amplitude, and PD) were obtained: 0.1716, 0.1683, 0.2614, 0.1724, and 0.2263, respectively. This paves the way for the comprehensive measurement indicators proposed in the next section.

3.3.2. Visual Comfort Level

For the public to better understand the relationship between the indoor light environment of buildings, the screen brightness of electronic equipment, and the visual fatigue of human eyes, we propose a new index: the visual comfort level (VCL). This index integrates the five indices proposed earlier in this paper and then uses the CRITIC weight to evaluate the combination of 18 groups of different light environments and screen brightness so as to obtain the most intuitive comprehensive quantitative evaluation system. The formula is as follows:
V i s u a l   C o m f o r t   L e v e l = 0.1716 × S V F + 0.1683 × S P + 0.2614 × E S + 0.1724 × E A + 0.2263 × P D
In this equation, SVF denotes the average score of the visual fatigue scale (subjective), SP denotes the average score of subjects’ preference (subjective), ES denotes the average SNR of EEG (objective), EA denotes the average CCA coefficient value of EEG at a 7.5 Hz stimulation frequency (objective), and PD denotes the average pupil diameter (objective). All variables here represent the values processed by CRITIC.
Figure 10 shows that in most of the light environments with the same illuminance and CCT, adjusting the screen brightness to 0% can obtain the highest visual comfort value and provide the best visual experience for users. Moreover, a higher screen brightness can provide users with better visual comfort than a medium screen brightness under most conditions. The visual effect of medium screen brightness is only the best under the condition of cold-color light and the highest illumination. In summary, when working in an indoor light environment in modern buildings, it is best to set the screen brightness of electronic equipment to a low brightness.

3.3.3. Reliability Demonstration

As the academic community still lacks a recognized gold standard for the quantitative evaluation of visual fatigue at present, in order to verify the reliability of this evaluation algorithm and evaluation indicators, we refer to an article that also combines subjective and objective indicators to quantify visual fatigue [16]. This article uses the visual anti-fatigue index (VAI) to quantitatively evaluate the visual fatigue of different paradigm colors and screen brightness combinations. The conclusion of this article shows that the anti-fatigue performance of the low-screen-brightness mode is better than the other two modes. According to the explanations, the lower the VAI, the better the anti-fatigue effect; the VAIs of low screen brightness (1.802 ± 0.766), medium screen brightness (2.140 ± 0.792), and high screen brightness (2.233 ± 0.881) mean low brightness > high brightness > medium brightness.
Under the quantitative index VCL of the manuscript, screen brightness has also been analyzed. According to the formula of this manuscript, the higher the VCL value, the better the anti-fatigue effect. The VCLs of low screen brightness (0.640 ± 0.107), medium screen brightness (0.422 ± 0.154), and high screen brightness (0.514 ± 0.130) mean low brightness > high brightness > medium brightness, which is highly consistent with the conclusion of the screen brightness part of the reference article [16], proving its reliability.

4. Discussion

4.1. Significance Analysis

The inspiration for this manuscript comes from the research performed by Mingli et al., who confirmed the effects of different illuminances and different CCTs on human fatigue [46] but lacked a unified evaluation index of organic integration. Similarly, some researchers have analyzed the influence of ambient light from three perspectives: eye movement, electrocardiogram (ECG), and EEG. However, their experimental environment settings had limitations, and there was also a lack of a comprehensive analysis [47]. As shown in Table 2, the quantitative evaluation of visual fatigue in the academic community is still exploratory. Some believe that subjective scoring is divided into gold standards [48], and some believe there is a lack of gold standards [16]. Due to the great individual differences in subjective scoring subjects, scholars have adopted certain subjective or objective methods to qualitatively and quantitatively analyze visual fatigue and then discuss each index separately [18,49,50,51,52]. The advantage of the method proposed in this manuscript is that it not only contains more indicators from an objective perspective but also takes the lead in exploring the direction of quantitative evaluation of visual fatigue. The method of subjective and objective index fusion is proposed for academic reproduction and discussion so as to promote the formulation of the quantitative evaluation gold standard for visual fatigue.
This study innovatively proposes a comprehensive index: the visual comfort level (VCL). The results of the VCL index show that not only illuminance and CCT are important factors affecting the light environment quality of the office, but that the screen brightness of electronic equipment is also an important factor affecting the overall work quality. Moreover, with the development of science and technology and the popularization of electronic office equipment, the proportion of screen brightness is also increasing [55], which is becoming increasingly important in the quality evaluation of the overall working environment of the office.
The VCL is the highest at a 0% screen brightness under most conditions, which also means that users obtain the best appearance, regardless of the combination of illuminance and CCT at the time. This is consistent with the general view of people in real life, which also reflects the reliability of the new index from the side [56].
In addition to a 0% screen brightness, when the indoor illuminance is high, a 100% screen brightness is also a good choice. This illustrates that, in daily use, higher screen brightness can enable more users to obtain a better visual experience. However, Lan revealed that continuously high indoor illuminance also causes a burden on the eyes of users [57]. How to balance the relationship between high visual fatigue caused by continuous high indoor illuminance and better visual experience under the combination of high illuminance and high screen brightness still needs to be studied. At the same time, Chanjuan et al. have also defined a new index—the performance index (PI)—to reflect the relationship between the accuracy of a test project and the reaction time. However, the parameters are independent, and the weight factor of PI requires further study [25]. In this manuscript, the index modeling of the CRITIC algorithm is a very innovative idea.
At present, people generally use electronic equipment for more than eight hours a day. Unfortunately, this fatigue-detection and -evaluation experiment was controlled for only a short time (usually two hours) in order to avoid causing large and irreversible fatigue stimulation in the eyes of the subjects. Therefore, the team believes that if the experimental time is prolonged as much as possible to ensure eye safety, it may expose a greater correlation between light environmental parameters and comfort.

4.2. Limitations of This Research

The conducted experiment only considered the influence of the illuminance and correlated color temperature of an artificial light source on the screen brightness. In real life, people often experience the superposition of natural light in the office, which poses a new challenge to our indicators. Therefore, the best combination of brightness, illuminance, and CCT should be selected according to the actual lighting conditions.
In this experiment, only the CCT and average illuminance of the dimming bulb on the horizontal plane of the human eye are considered, but other parameters are not considered. In addition to natural light, researchers have also studied the effects of other parameters of the indoor light environment on the visual experience and comfort evaluation, such as spectral power, light flash frequency, and indoor decoration [58,59,60]. When studying the influence of the overall light environment parameters on human eye comfort in the future and constructing the environmental comfort index, these factors should be considered. The new index (VCL) proposed in this study has only five dimensions, which is slightly insufficient. More indicators mean a more comprehensive consideration and more scientific and improved indicators.
When analyzing the EEG data, which can objectively reflect the degree of fatigue of users, only CCA was used to analyze the data in this study, which may lead to ignoring some other details in the EEG data. Therefore, information entropy and other methods can be considered to evaluate the brain state and obtain more comprehensive information [61,62]. At the same time, in addition to the analysis of pupil diameter, other visual data from the eye tracker, such as the eye movement trajectory, can be deeply mined to extract more indicators that can objectively quantify fatigue.
Therefore, adding more light environment parameters and increasing the experimental time on the premise of safety in further experiments will make the whole experimental environment closer to the real scene. Meanwhile, superimposing more analysis tools and mining more EEG and eye movement data could allow more comprehensive evaluation results to be obtained, providing further guidance and direction for designing the indoor light environment and helping those working with electronic equipment to improve their user comfort and indoor satisfaction.

5. Conclusions

This study innovatively conducted a visual fatigue quantitative evaluation to provide feedback on the advantages and disadvantages of the corresponding light environment. The individual and interaction effects of illuminance, CCT, and screen brightness on human visual fatigue were explored. An algorithm based on the CRITIC weight method was proposed to fuse multiple indicators, and quantitative evaluation of visual fatigue was achieved through a combination of subjective and objective methods, contributing to the formulation of visual fatigue-related gold standards.
By changing the illuminance and CCT of the light source and the screen brightness of the display screen, this study determined the impact of different office light environments on visual experience from subjective and objective evaluation. Setting the screen brightness to 0% always helped to improve people’s overall comfort. Even though some subjects preferred lower brightness during the post-experiment investigation, the above conclusion did not change with the subjective preferences of participants; the combination of more objective EEG and eye movement data of participants still revealed that properly increasing brightness can reduce visual fatigue and provide a more comfortable experience.
Appropriately raising the average illuminance of the working plane to 350 lx could make people feel more relaxed. The analysis of the results showed that a reasonable combination of CCT and illuminance can provide users with a comfortable experience. However, more detailed questions in the subjective link should be used in further research, in order to determine the origin of the specific comfort experience difference.
This study also revealed some potential future research directions: First, in addition to pupil diameter, the eye movement trajectory, and fixation point can also explain the visual perception ability of the experimenter to a certain extent, which needs to be excavated. Second, the fusion of indicators, the key fusion parameters, and determining whether more parameters are better are also worth studying. Thirdly, the quantitative evaluation of visual fatigue requires a set of gold standards similar to visual function evaluation. It is meaningful to promote the formulation of gold standards by studying the screening and integration of relevant indicators.
Based on the comprehensive analysis of these results, in modern working-from-home life, when the environmental illuminance and CCT cannot be adjusted, setting the screen brightness at about 0% can minimize visual fatigue. When the environmental illuminance and CCT can be adjusted, cold-color light combined with high illuminance or warm-color light combined with low illuminance can provide a better visual experience. This has important reference value for the design and optimization of the office lighting environment and the setting of certain electronic equipment parameters.

Supplementary Materials

The following supporting information can be downloaded at: https://www.mdpi.com/article/10.3390/electronics13173411/s1, Procedure S1: The procedure of CRITIC method. Table S1: The results of One-way ANOVA (SVF). Table S2: The results of One-way ANOVA (SP). Table S3: The results of One-way ANOVA (ES). Table S4: The results of One-way ANOVA (EA). Table S5: The results of One-way ANOVA (PD). Figure S1: Likert Scale of Visual Fatigue Evaluation.

Author Contributions

Conceptualization, P.T. and G.X.; methodology, C.H.; software, X.Z. (Xiaowei Zheng); validation, P.T., K.Z. and S.Z.; formal analysis, C.D. and X.Z. (Xun Zhang); investigation, F.W.; resources, P.T.; data curation, Y.M.; writing—original draft preparation, P.T.; writing—review and editing, G.X. and Q.W.; visualization, C.H.; supervision, G.X.; project administration, P.T.; funding acquisition, G.X., C.H., S.Z. and Q.W. All authors have read and agreed to the published version of the manuscript.

Funding

This work is supported by the National Key Research and Development projects (No. 2021ZD0204300), the Natural Science Basic Research Program of Shaanxi (Program No. 2023-JC-QN-0501), the project of The First Affiliated Hospital of Xi’an Jiaotong University (No. 20231055), and the project of The First Affiliated Hospital of Xi’an Jiaotong University (No. 20231056).

Institutional Review Board Statement

This study was conducted according to the guidelines of the Declaration of Helsinki and approved by the Ethics Committee of Xi’an Jiaotong University, China (No. 2023-1552, 13 March 2023).

Informed Consent Statement

Informed consent was obtained from all subjects involved in the study.

Data Availability Statement

The datasets used and/or analyzed during the current study are available from the corresponding author upon reasonable request.

Acknowledgments

We would like to express our sincere thanks to the researchers who put the research ideas together, the research predecessors for their relevant research experience, and all the subjects who participated in these experiments.

Conflicts of Interest

The authors declare that they have no known competing financial interests or personal relationships that could have appeared to influence the work reported in this paper.

References

  1. Dong, X.; Wu, Y.Y.; Chen, X.D.; Li, H.; Cao, B.; Zhang, X.; Yan, X.; Li, Z.X.; Long, Y.B.; Li, X.T. Effect of thermal, acoustic, and lighting environment in underground space on human comfort and work efficiency: A review. Sci. Total Environ. 2021, 786, 147537. [Google Scholar] [CrossRef]
  2. Wang, K.; Ho, C.H.; Zong, Y. Analysis of Brightness and Color Temperature of Liquid Crystal Display on Visual Comfort Based on Eye Health Monitoring of Humans. J. Med. Imag. Health 2020, 10, 1359–1364. [Google Scholar] [CrossRef]
  3. Hu, S.T.; He, M.Y.; Liu, G.D.; Lu, M.L.; Liang, P.; Liu, F. Correlation between the visual evoked potential and subjective perception at different illumination levels based on entropy analysis. Build. Environ. 2021, 194, 107715. [Google Scholar] [CrossRef]
  4. Ward Thompson, C.; Aspinall, P.A. Natural environments and their impact on activity, health, and quality of life. Appl. Psychol. Health Well Being 2011, 3, 230–260. [Google Scholar] [CrossRef]
  5. Hu, S.T.; Lu, M.L.; He, M.Y.; Wang, G.; Liang, P.; Tong, L.; Liu, G.D. Research on the light comfort characterization method based on visual evoked potential energy. Build. Environ. 2021, 197, 107831. [Google Scholar] [CrossRef]
  6. Wang, C.; Zhang, F.; Wang, J.L.; Doyle, J.K.; Hancock, P.A.; Mak, C.M.; Liu, S.C. How indoor environmental quality affects occupants ? cognitive functions: A systematic review. Build. Environ. 2021, 193, 107647. [Google Scholar] [CrossRef]
  7. Gupta, P.K.; Muhuri, P.K. Perceptual computing based performance control mechanism for power efficiency in mobile embedded systems. In Proceedings of the 2014 IEEE International Conference on Fuzzy Systems (FUZZ-IEEE), Beijing, China, 6–11 July 2014; pp. 1654–1661. [Google Scholar]
  8. Torresin, S.; Pernigotto, G.; Cappelletti, F.; Gasparella, A. Combined effects of environmental factors on human perception and objective performance: A review of experimental laboratory works. Indoor Air 2018, 28, 525–538. [Google Scholar] [CrossRef]
  9. GB50034-2013; Architectural Lighting Design Standard. China Architecture & Building Press: Beijing, China, 2013.
  10. Manav, B. An experimental study on the appraisal of the visual environment at offices in relation to colour temperature and illuminance. Build. Environ. 2007, 42, 979–983. [Google Scholar] [CrossRef]
  11. Gou, Z.H.; Lau, S.S.Y.; Ye, H. Visual alliesthesia: The gap between comfortable and stimulating illuminance settings. Build. Environ. 2014, 82, 42–49. [Google Scholar] [CrossRef]
  12. Leccese, F.; Salvadori, G.; Rocca, M.; Buratti, C.; Belloni, E. A method to assess lighting quality in educational rooms using analytic hierarchy process. Build. Environ. 2020, 168, 106501. [Google Scholar] [CrossRef]
  13. Fakhari, M.; Vahabi, V.; Fayaz, R. A study on the factors simultaneously affecting visual comfort in classrooms: A structural equation modeling approach. Energ. Build. 2021, 249, 111232. [Google Scholar] [CrossRef]
  14. Li, Y.; Ru, T.; Chen, Q.; Qian, L.; Luo, X.; Zhou, G. Effects of illuminance and correlated color temperature of indoor light on emotion perception. Sci. Rep. 2021, 11, 14351. [Google Scholar] [CrossRef] [PubMed]
  15. Xie, X.J.; Song, F.H.; Liu, Y.; Wang, S.R.; Yu, D. Study on the Effects of Display Color Mode and Luminance Contrast on Visual Fatigue. IEEE Access 2021, 9, 35915–35923. [Google Scholar] [CrossRef]
  16. Tian, P.Y.; Xu, G.H.; Han, C.C.; Zheng, X.W.; Zhang, K.; Du, C.H.; Wei, F.; Zhang, S.C. Effects of Paradigm Color and Screen Brightness on Visual Fatigue in Light Environment of Night Based on Eye Tracker and EEG Acquisition Equipment. Sensors 2022, 22, 4082. [Google Scholar] [CrossRef]
  17. Zeng, S.; Hao, W.; Guo, Y.; Wang, Y.; Fu, J.; Wang, G.; Cai, J. Ocular physiological responses to dynamic and constant screen brightness. In Proceedings of the 2021 18th China International Forum on Solid State Lighting & 2021 7th International Forum on Wide Bandgap Semiconductors (SSLChina: IFWS), Shenzhen, China, 6–8 December 2021; pp. 158–161. [Google Scholar]
  18. Lu, M.L.; Hu, S.T.; Mao, Z.; Liang, P.; Xin, S.; Guan, H.Y. Research on work efficiency and light comfort based on EEG evaluation method. Build. Environ. 2020, 183, 107122. [Google Scholar] [CrossRef]
  19. Dillon, T.W.; Emurian, H.H. Some factors affecting reports of visual fatigue resulting from use of a VDU. Comput. Hum. Behav. 1996, 12, 49–59. [Google Scholar] [CrossRef]
  20. Lee, H.J.; Kim, S.J. Factors Associated with Visual Fatigue from Curved Monitor Use: A Prospective Study of Healthy Subjects. PLoS ONE 2016, 11, e0164022. [Google Scholar] [CrossRef]
  21. Kim, Y.-J.; Lee, E.C. EEG based comparative measurement of visual fatigue caused by 2D and 3D displays. In Proceedings of the International Conference on Human-Computer Interaction, Orlando, FL, USA, 9–14 July 2011; pp. 289–292. [Google Scholar]
  22. Ukai, K.; Kato, Y. The use of video refraction to measure the dynamic properties of the near triad in observers of a 3-D display. Ophthalmic Physiol. Opt. 2002, 22, 385–388. [Google Scholar] [CrossRef]
  23. Ukai, K.; Howarth, P.A. Visual fatigue caused by viewing stereoscopic motion images: Background, theories, and observations. Displays 2008, 29, 106–116. [Google Scholar] [CrossRef]
  24. de Zeeuw, J.; Papakonstantinou, A.; Nowozin, C.; Stotz, S.; Zaleska, M.; Hädel, S.; Bes, F.; Münch, M.; Kunz, D. Living in biological darkness: Objective sleepiness and the pupillary light responses are affected by different metameric lighting conditions during daytime. J. Biol. Rhythm. 2019, 34, 410–431. [Google Scholar] [CrossRef]
  25. Sun, C.; Lian, Z.; Lan, L. Work performance in relation to lighting environment in office buildings. Indoor Built Environ. 2019, 28, 1064–1082. [Google Scholar] [CrossRef]
  26. Lambooij, M.; IJsselsteijn, W.; Fortuin, M.; Heynderickx, I. Visual discomfort and visual fatigue of stereoscopic displays: A review. J. Imaging Sci. Technol. 2009, 53, 30201. [Google Scholar] [CrossRef]
  27. Sheedy, J.E.; Hayes, J.; Engle, J. Is all asthenopia the same? Optom. Vis. Sci. 2003, 80, 732–739. [Google Scholar] [CrossRef]
  28. Birbaumer, N. Breaking the silence: Brain–computer interfaces (BCI) for communication and motor control. Psychophysiology 2006, 43, 517–532. [Google Scholar] [CrossRef]
  29. Voznenko, T.I.; Chepin, E.V.; Urvanov, G.A. The Control System Based on Extended BCI for a Robotic Wheelchair. Procedia Comput. Sci. 2018, 123, 522–527. [Google Scholar] [CrossRef]
  30. Tariq, M.; Trivailo, P.M.; Simic, M. EEG-Based BCI Control Schemes for Lower-Limb Assistive-Robots. Front. Hum. Neurosci. 2018, 12, 312. [Google Scholar] [CrossRef] [PubMed]
  31. Veena, N.; Anitha, N. A review of non-invasive BCI devices. Int. J. Biomed. Eng. Technol. 2020, 34, 205–233. [Google Scholar]
  32. Mehdizavareh, M.H.; Hemati, S.; Soltanian-Zadeh, H. Enhancing performance of subject-specific models via subject-independent information for SSVEP-based BCIs. PLoS ONE 2020, 15, e0226048. [Google Scholar] [CrossRef] [PubMed]
  33. Society, A.C.N. Guideline 5: Guidelines for standard electrode position nomenclature. Am. J. Electroneurodiagn. Technol. 2006, 46, 222–225. [Google Scholar]
  34. Almoqbel, F.M.; Yadav, N.K.; Leat, S.J.; Head, L.M.; Irving, E.L. Effects of sweep VEP parameters on visual acuity and contrast thresholds in children and adults. Graefes Arch. Clin. Exp. Ophthalmol. 2011, 249, 613–623. [Google Scholar] [CrossRef]
  35. Ng, K.B.; Bradley, A.P.; Cunnington, R. Stimulus specificity of a steady-state visual-evoked potential-based brain–computer interface. J. Neural Eng. 2012, 9, 036008. [Google Scholar] [CrossRef]
  36. Chen, Y.C.; Yeh, S.L. Catch the moment: Multisensory enhancement of rapid visual events by sound. Exp. Brain Res. 2009, 198, 209–219. [Google Scholar] [CrossRef]
  37. Owens, M.; Koster, E.H.W.; Derakshan, N. Improving attention control in dysphoria through cognitive training: Transfer effects on working memory capacity and filtering efficiency. Psychophysiology 2013, 50, 297–307. [Google Scholar] [CrossRef] [PubMed]
  38. Xie, J.; Xu, G.H.; Wang, J.; Li, M.; Han, C.C.; Jia, Y.G. Effects of Mental Load and Fatigue on Steady-State Evoked Potential Based Brain Computer Interface Tasks: A Comparison of Periodic Flickering and Motion-Reversal Based Visual Attention. PLoS ONE 2016, 11, e0163426. [Google Scholar] [CrossRef]
  39. Zheng, X.W.; Xu, G.H.; Zhang, Y.B.; Liang, R.H.; Zhang, K.; Du, Y.H.; Xie, J.; Zhang, S.C. Anti-fatigue Performance in SSVEP-Based Visual Acuity Assessment: A Comparison of Six Stimulus Paradigms. Front. Human. Neurosci. 2020, 14, 301. [Google Scholar] [CrossRef]
  40. Lin, Z.L.; Zhang, C.S.; Wu, W.; Gao, X.R. Frequency recognition based on canonical correlation analysis for SSVEP-based BCIs. IEEE Trans. Biomed. Eng. 2006, 53, 2610–2614. [Google Scholar] [CrossRef] [PubMed]
  41. Kalunga, E.; Djouani, K.; Hamam, Y.; Chevallier, S.; Monacelli, E. SSVEP enhancement based on Canonical Correlation Analysis to improve BCI performances. In Proceedings of the 2013 Africon IEEE, Pointe aux Piments, Mauritius, 9–12 September 2013; pp. 1–5. [Google Scholar]
  42. Bin, G.; Gao, X.; Yan, Z.; Hong, B.; Gao, S. An online multi-channel SSVEP-based brain–computer interface using a canonical correlation analysis method. J. Neural Eng. 2009, 6, 046002. [Google Scholar] [CrossRef]
  43. Nakanishi, M.; Wang, Y.; Wang, Y.T.; Jung, T.P. A Comparison Study of Canonical Correlation Analysis Based Methods for Detecting Steady-State Visual Evoked Potentials. PLoS ONE 2015, 10, e0140703. [Google Scholar] [CrossRef]
  44. Kim, T.; Lee, E.C. Experimental Verification of Objective Visual Fatigue Measurement Based on Accurate Pupil Detection of Infrared Eye Image and Multi-Feature Analysis. Sensors 2020, 20, 4814. [Google Scholar] [CrossRef]
  45. Hayes, J.R.; Sheedy, J.E.; Stelmack, J.A.; Heaney, C.A. Computer use, symptoms, and quality of life. Optom. Vis. Sci. 2007, 84, E738–E755. [Google Scholar] [CrossRef] [PubMed]
  46. Benedetto, S.; Drai-Zerbib, V.; Pedrotti, M.; Tissier, G.; Baccino, T. E-readers and visual fatigue. PLoS ONE 2013, 8, e83676. [Google Scholar] [CrossRef] [PubMed]
  47. Makri, D.; Farmaki, C.; Sakkalis, V. Visual fatigue effects on steady state visual evoked potential-based brain computer interfaces. In Proceedings of the 2015 7th International IEEE/EMBS Conference on Neural Engineering (NER), Montpellier, France, 22–24 April 2015; pp. 70–73. [Google Scholar]
  48. Seo, S.-P.; Lee, M.-H.; Williamson, J.; Lee, S.-W. Changes in fatigue and EEG amplitude during a longtime use of brain-computer interface. In Proceedings of the 2019 7th International Winter Conference on Brain-Computer Interface (BCI), Gangwon, Republic of Korea, 18–20 February 2019; pp. 1–3. [Google Scholar]
  49. Peng, Y.; Wong, C.M.; Wang, Z.; Wan, F.; Vai, M.I.; Mak, P.U.; Hu, Y.; Rosa, A.C. Fatigue evaluation using multi-scale entropy of EEG in SSVEP-based BCI. IEEE Access 2019, 7, 108200–108210. [Google Scholar] [CrossRef]
  50. Chai, X.; Zhang, Z.; Guan, K.; Zhang, T.; Xu, J.; Niu, H. Effects of fatigue on steady state motion visual evoked potentials: Optimised stimulus parameters for a zoom motion-based brain-computer interface. Comput. Methods Programs Biomed. 2020, 196, 105650. [Google Scholar] [CrossRef] [PubMed]
  51. Peng, Y.; Wong, C.M.; Wang, Z.; Rosa, A.C.; Wang, H.T.; Wan, F. Fatigue detection in SSVEP-BCIs based on wavelet entropy of EEG. IEEE Access 2021, 9, 114905–114913. [Google Scholar] [CrossRef]
  52. Guo, F.; Liu, L.; Li, M.; Greene, R.L. The effect of arm support and control modes on muscle fatigue, eye fatigue, and posture changes in mobile game use among young adults. Human. Factors Ergon. Manuf. Serv. Ind. 2021, 31, 496–505. [Google Scholar] [CrossRef]
  53. Fang, Y.; Liu, C.; Zhao, C.; Zhang, H.; Wang, W.; Zou, N. A study of the effects of different indoor lighting environments on computer work fatigue. Int. J. Environ. Res. Public Health 2022, 19, 6866. [Google Scholar] [CrossRef] [PubMed]
  54. Tian, P.; Xu, G.; Han, C.; Zhang, X.; Zheng, X.; Wei, F.; Zhang, S.; Zhao, Z. A quantization algorithm of visual fatigue based on underdamped second order stochastic resonance for steady state visual evoked potentials. Front. Neurosci. 2023, 17, 1278652. [Google Scholar] [CrossRef]
  55. Osterhaus, W.; Hemphälä, H.; Nylén, P.J.W. Lighting at computer workstations. Work 2015, 52, 315–328. [Google Scholar] [CrossRef]
  56. Guterman, P.S.; Fukuda, K.; Wilcox, L.M.; Allison, R.S. 75.3: Is brighter always better? The effects of display and ambient luminance on preferences for digital signage. SID Symp. Dig. Tech. Pap. 2010, 41, 1116–1119. [Google Scholar] [CrossRef]
  57. Lan, L. Mechanism and evaluation of the effects of indoor environmental quality on human productivity. Ph.D. Thesis, Shanghai Jiao Tong University, Shanghai, China, 2010. [Google Scholar]
  58. Hartstein, L.E.; Tuzikas, A.; Karlicek, R.F., Jr. The impact of dynamic changes in light spectral power distribution on cognitive performance and wellbeing. LEUKOS 2020, 16, 289–301. [Google Scholar] [CrossRef]
  59. Pei, Z.F.; Lin, B.R.; Liu, Y.C.; Zhu, Y.X. Comparative study on the indoor environment quality of green office buildings in China with a long-term field measurement and investigation. Build. Environ. 2015, 84, 80–88. [Google Scholar] [CrossRef]
  60. Cao, C. Research on innovative application of artistic characteristics of building decoration materials in interior design based on big data. J. Phys. Conf. Ser. 2020, 1744, 022020. [Google Scholar] [CrossRef]
  61. Kang, J.; Chen, H.; Li, X.; Li, X. EEG entropy analysis in autistic children. J. Clin. Neurosci. 2019, 62, 199–206. [Google Scholar] [CrossRef] [PubMed]
  62. Xie, Y.; Oniga, S. A Review of Processing Methods and Classification Algorithm for EEG Signal. Carpathian J. Electron. Comput. Eng. 2020, 13, 23–29. [Google Scholar] [CrossRef]
Figure 1. A schematic diagram of the experiment.
Electronics 13 03411 g001
Figure 2. The design of the experiment.
Electronics 13 03411 g002
Figure 3. The experimental process.
Electronics 13 03411 g003
Figure 4. (a). The relationship between subjective visual fatigue and illuminance under different screen brightnesses and correlated color temperatures. (b). The relationship between subjective preference and illuminance under different screen brightnesses and correlated color temperatures.
Electronics 13 03411 g004
Figure 5. (a). The relationship between the objective SNR of EEG and illuminance under different screen brightnesses and correlated color temperatures. (b). The relationship between the objective EEG amplitude and illuminance under different screen brightnesses and correlated color temperatures.
Electronics 13 03411 g005
Figure 6. A comparison of the mean values and SD of normalized SNR between fatigue level 1 and fatigue level 4 for 18 stimulus paradigms for 20 subjects. The statistics were assessed using a one-way ANOVA.
Electronics 13 03411 g006
Figure 7. A comparison of the mean values and SD of the normalized CCA coefficient value index between fatigue level 1 and fatigue level 4 for 18 stimulus paradigms for 20 subjects. The statistics were assessed using a one-way ANOVA.
Electronics 13 03411 g007
Figure 8. The relationship between the objective pupil diameter difference and illuminance under different screen brightnesses and correlated color temperatures.
Electronics 13 03411 g008
Figure 9. A comparison of the mean values and SD of the normalized pupil diameter index between fatigue level 1 and fatigue level 4 for 18 stimulus paradigms for 20 subjects. The statistics were assessed using a one-way ANOVA.
Electronics 13 03411 g009
Figure 10. The relationship between the visual comfort level index and screen brightness under the different combinations of correlated color temperatures and illuminance.
Electronics 13 03411 g010
Table 1. Experimental grouping parameters.
Condition NumberIlluminance/lxCorrelated Color Temperature/KScreen Brightness/%
17568000
2200
3500
4753500
5200
6500
775680050
8200
9500
10753500
11200
12500
13756800100
14200
15500
16753500
17200
18500
Table 2. A comparison between the proposed method and existing visual fatigue assessment methods.
AuthorsYear of PublicationVisual Fatigue Assessment Method
Hayes et al. [45]2007Subjective questionnaire
Benedetto et al. [53]2013Subjective questionnaire + Critical Flicker Frequency (related to sensory perception function) + Eye blink
Makri et al. [49]2015SSVEP
Seo et al. [50]2019Subjective questionnaire + SSVEP
Peng et al. [51]2019Subjective questionnaire + SSVEP
Chai et al. [52]2020SSVEP
Peng et al. [18]2021Subjective questionnaire + SSVEP
Guo et al. [54]2021Subjective questionnaire
Tian et al. [16]2022Subjective questionnaire + SSVEP + Pupil diameter + Fusion indicators (weights given based on experience)
Ours Subjective questionnaire + SSVEP + Pupil diameter + Fusion indicators (CRITIC weighting method, no personal experience required)
Disclaimer/Publisher’s Note: The statements, opinions and data contained in all publications are solely those of the individual author(s) and contributor(s) and not of MDPI and/or the editor(s). MDPI and/or the editor(s) disclaim responsibility for any injury to people or property resulting from any ideas, methods, instructions or products referred to in the content.

