Review

Multi-Stage Optimal Power Control Method for Distribution Network with Photovoltaic and Energy Storage Considering Grouping Cooperation

1
School of Electrical Engineering, Xi’an University of Technology, Xi’an 710048, China
2
Electric Power Research Institute, State Grid Gansu Electric Power Company, Lanzhou 730050, China
*
Author to whom correspondence should be addressed.
Electronics 2024, 13(17), 3415; https://doi.org/10.3390/electronics13173415 (registering DOI)
Submission received: 28 June 2024 / Revised: 23 July 2024 / Accepted: 24 July 2024 / Published: 28 August 2024
(This article belongs to the Special Issue RFID Applied to IoT Devices)

Abstract

:
In view of the current problem of insufficient consideration being taken of the effect of voltage control and the adjustment cost in the voltage control strategy of distribution networks containing photovoltaic (PV) and energy storage (ES), a multi-stage optimization control method considering grouping collaboration is proposed. Firstly, the mechanism by which the access of the PV and ES to the distribution network impacts the node voltage is explored. Then, the unit regulation cost of a photovoltaic inverter and energy storage power is studied. On this basis, the voltage–cost sensitivity is proposed based on the traditional node power–node voltage sensitivity. According to the differences between each group of regulation resources, a multi-stage voltage over-run control strategy based on grouping cooperation is proposed. Finally, the improved 33-node model is taken as an example to verify the correctness and effectiveness of the proposed method.

1. Introduction

The proposal of the “double carbon” goal and the construction of a new power system have effectively promoted the development of distributed PV. According to statistics, by the end of September 2023, the installed capacity of the distributed PVs in the business area of the State Grid Corporation of China had reached 208 million kW, a year-on-year increase of 56%, accounting for 47% of the total installed capacity of PV and 25% of the total installed capacity of new energy. Since 2021, the new installed capacity of distributed PV has been significantly higher than that of centralized PV, becoming the main direction of PV development [1,2,3,4,5]. However, a photovoltaic power generation system has the characteristics of uneven distribution and uncertain output, which may cause the power flow to make the indirect voltage of the distribution network exceed the limit at the stage of photovoltaic power generation, and the problems of power flow to power transmission overload are increasingly prominent, which seriously affect the safe operation of a distribution network. Therefore, it is of great significance to study the voltage control strategy of a distribution network containing PV.
The most traditional reactive power voltage control in distribution networks is to use reactive power resources such as transformer taps and capacitor banks [6,7] for regulation. However, these two kinds of resources have the constraints of high regulation cost and limited regulation times, which cannot adapt to the changeable operation of a distribution network. However, photovoltaic inverters often reserve redundant capacity during operation, which can be used to adjust the reactive voltage [8]. The development of PV and ES collaborative control technology has created good conditions for voltage regulation based on the photovoltaic inverter and energy storage, and this method has a relatively low regulation cost and higher application value.
To date, there has been some research on the voltage control of distribution networks based on PV and ES cooperation. References [9,10] included energy storage in the regulation range. Energy storage regulates active power, and reactive power is provided by SVC and other reactive power compensation equipment. On this basis, a multi-objective optimization control model of an active distribution network is constructed, and a control strategy is formulated according to real-time operation; references [11,12,13,14] established a cooperative control model of energy storage and reactive power compensation equipment with the goal of minimizing power purchase cost, network loss cost, and voltage regulation deviation, and converted them into a single objective for solution. The above methods have mainly focused on consideration of distributed photovoltaic as a fixed power source, and the uncertainty has not been fully considered. In response to this, reference [15] proposed a dynamic voltage control method for a distribution network based on distributed model predictive control. However, as this method still does not include a photovoltaic inverter for regulation, the voltage regulation ability of a distribution network needs to be further explored. In view of this, references [16,17,18] took the reactive power of the photovoltaic inverter as the consistency variable and used the photovoltaic reactive power for voltage control; on this basis, according to the control characteristics and regulation cost of photovoltaic reactive power and energy storage active power, references [19,20,21] proposed the two-stage voltage control of a distribution network: the first stage was to control the reactive power of the photovoltaic inverter first, and the second stage was to control the active power of energy storage.
The abovementioned methods have made important contributions to the research into voltage control in distribution networks, but the following problems still need to be further studied and solved. First, the impact mechanism of PV access on the distribution network voltage needs to be further investigated; second, the regulation costs of photovoltaic and energy storage are different, and the effects of the control by different node powers on node voltage are also different. The above control strategy has not considered the overall effect of regulation costs and effects. To solve the above problems, this paper carries out the following innovative work:
(1)
Taking a radial distribution network as an example, the mechanism by which the optical-storage system influences the voltage is explored, which lays a theoretical foundation for subsequent research.
(2)
In order to clarify the priority of each resource and comprehensively consider the regulation cost and voltage power sensitivity, a comprehensive voltage–cost sensitivity index is proposed (the resource with the highest traditional sensitivity may have a high cost, the resource with a low cost may have high sensitivity, and only the resource with high voltage–cost sensitivity has the lowest cost), which is used as a benchmark for regulation to ensure the lowest regulation cost.
(3)
We avoid reverse regulation as much as possible (for example, if the sensitivity of over-voltage node A1 and control node C is positive, and the sensitivity of over-voltage node A2 and control node C is negative, the power of node C is reduced when the voltage of node A1 is reduced, but the power of node C is increased when the voltage of node A2 is reduced). The power of energy storage and the power of the photovoltaic inverter are divided into four groups according to the overall voltage–cost sensitivity. A grouping cooperative control strategy is proposed, giving priority to the resources with higher voltage–cost sensitivity.

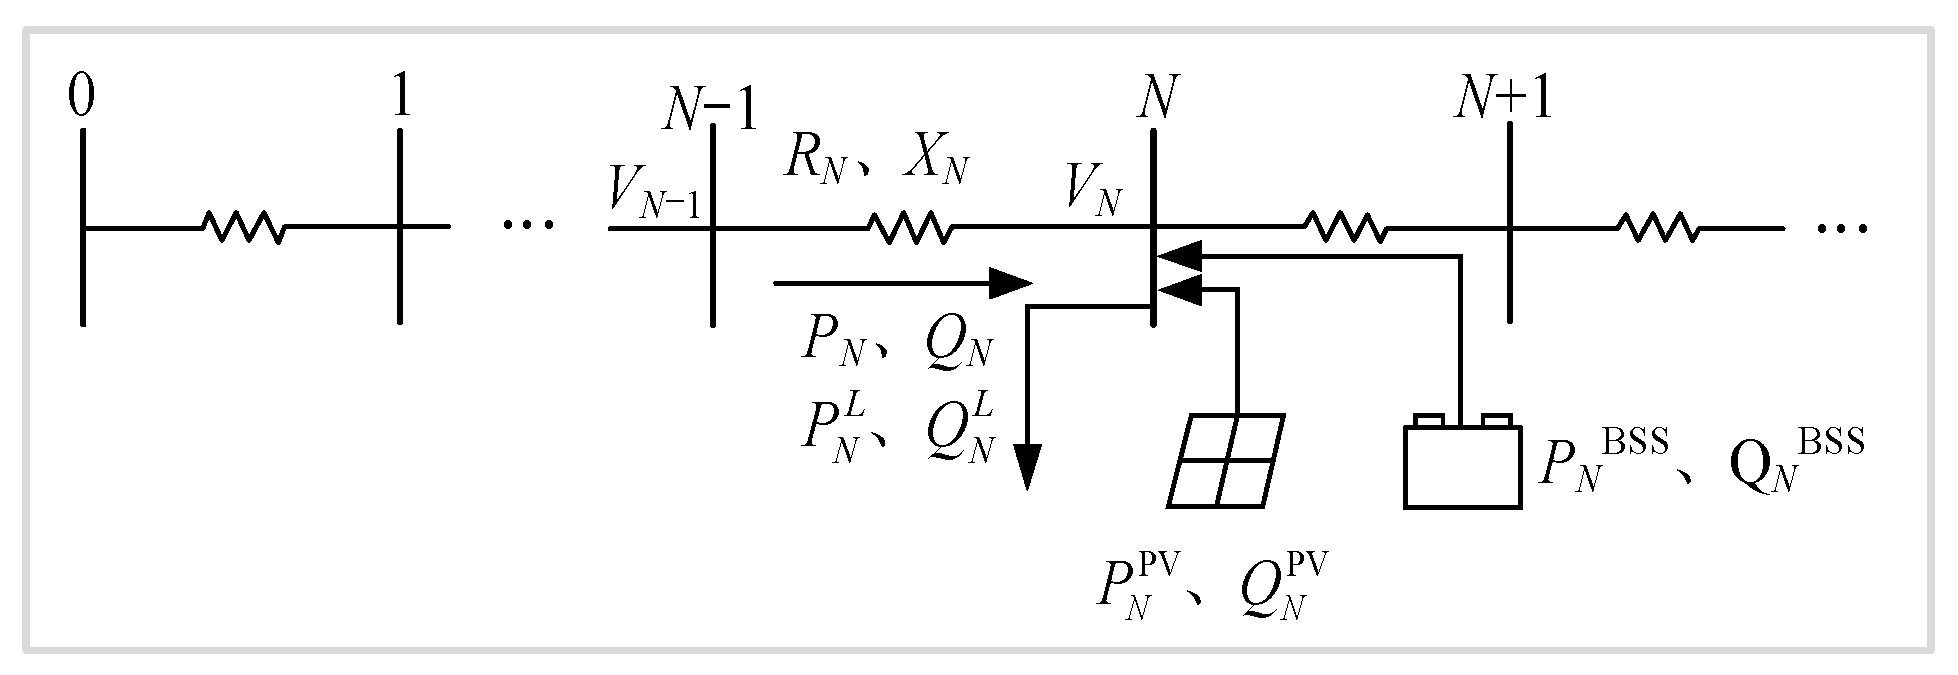
2. Mechanisms of the Impact of PV and ES Systems on Distribution Network Voltage

Considering that distribution networks are mostly radial structures, this paper analyzes the distribution network shown in Figure 1 as an example.
Since this paper mainly focuses on the analysis of voltage deviation in long time scales, a static load model is used to reflect the relationship between load power and voltage. Without loss of generality, the distribution of load current along the line is shown in Figure 2, and in order to simulate the charging and discharging behaviors of the PV and ES, two typical peak and valley load curves are used, with the photovoltaic-storage system discharging during the peak period, and the photovoltaic-storage system charging during the valley period.
Let x be the ratio of the distance from the beginning of the feeder line to the total length of the feeder line, x∈(0,1), i 1 ( x ) , i 2 ( x ) are the current in peak period and valley period, respectively. For the convenience of analysis, it is assumed that the load current is evenly distributed along the feeder line, as shown in Figure 3.
Then, the current distribution along the line during peak period and valley period is as follows:
i 1 ( x ) = I 1 e n d I 1 s t a r t x + I 1 s t a r t = M 1 x + N 1 i 2 ( x ) = I 2 e n d I 2 s t a r t x + I 2 s t a r t = M 2 x + N 2
In the formula, I 1 s t a r t and I 1 e n d are the current at the beginning and end of the feeder line during peak period; I 2 s t a r t and I 2 e n d are the current at the beginning and end of the feeder line during valley period; M = I e n d I s t a r t is the difference between the current at the end and the beginning of the feeder line; and M 0 , N = I e n d is the current at the end of the feeder line.

2.1. Without Photovoltaic and Energy Storage

Under the normal operation of the distribution network, the phase difference between the two ends of the feeder line is small, and the transverse component of the voltage drop has little influence on the voltage loss, so it is considered that the mode of the voltage drop is the voltage loss. Assuming that the impedance mode per unit length of feeder line is z, the voltage loss during peak and valley period is as follows:
Δ U 1 ( x ) = 0 x i 1 ( y ) z d y = 1 2 z M 1 x 2 + z N 1 x Δ U 2 ( x ) = 0 x i 2 ( y ) z d y = 1 2 z M 2 x 2 + z N 2 x

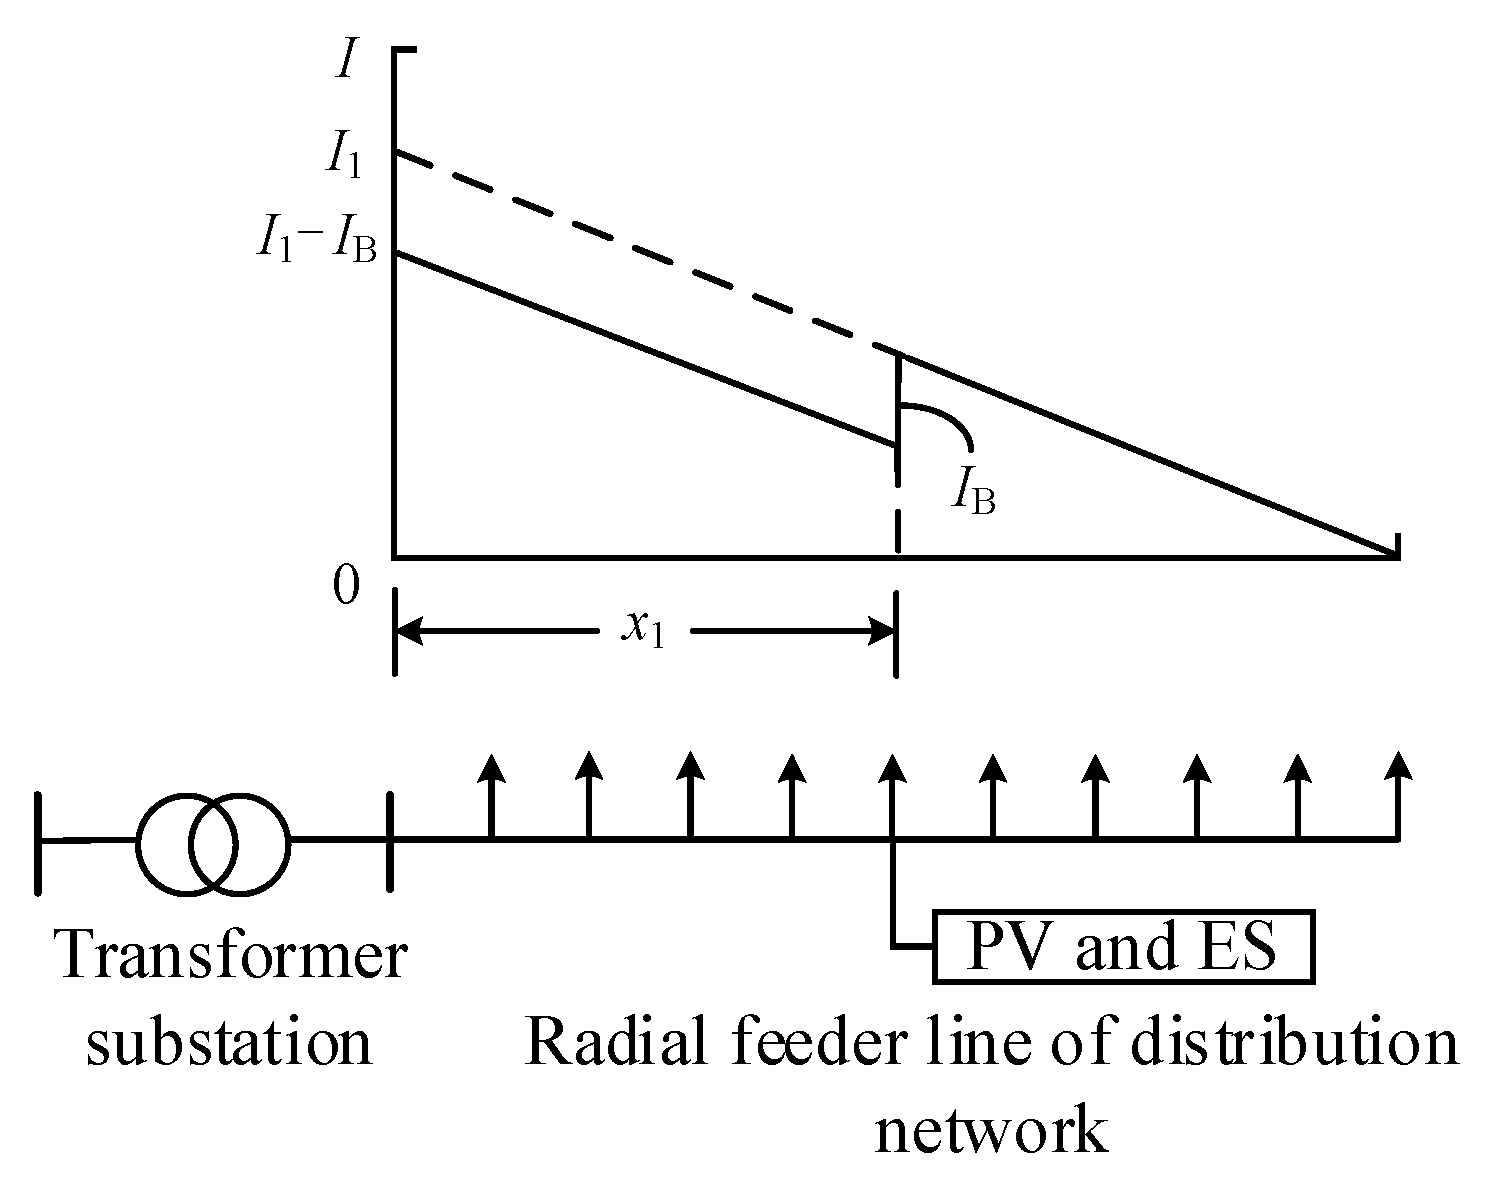
2.2. Discharge of Photovoltaic-Storage System during Peak Period

The photovoltaic-storage system is connected at x1 from the beginning of the feeder line, and carries out peak shaving and valley filling with constant current (IB) during the peak and valley periods, respectively. When the current is released during the peak period, IB > 0, the feeder current distribution is shown in Figure 4 and Equation (3).
i 1 ( x ) = M 1 x + N 1 I B     0   <   x     x 1 M 1 x + N 1                     x 1   <   x   <   1
where i 1 ( x ) is the feeder current distribution when the photovoltaic-storage system discharges during peak period, and x1 is the ratio of the distance between photovoltaic-storage system location and the start of the feeder line to the total length of the feeder line.
If Formula (3) is introduced into Formula (2), the voltage loss ( Δ U ˜ 1 ( x ) ) at x from the start of feeder line can be obtained, as follows.
Δ U ˜ 1 ( x ) = 1 2 z M 1 x 2 + z N 1 I B x , 0 < x x 1 1 2 z M 1 x 2 + z N 1 x z I B x 1 , x 1 < x < 1
In order to investigate the effect of voltage loss, take the derivative of x, and let d Δ U ˜ 1 ( x ) d x 0 , we can obtain the following:
d Δ U ˜ 1 ( x ) d x = z M 1 x + z N 1 I B , 0 < x x 1 z M 1 x + z N 1 , x 1 < x < 1 and d Δ U ˜ 1 ( x ) d x 0 M 1 x I B N 1 , 0 < x x 1 M 1 x N 1 , x 1 < x < 1   ,   where   M 1 = I 1 e n d I 1 s t a r t < 0 x I B N 1 M 1 , 0 < x x 1 x N 1 M 1 , x 1 < x < 1
According to Equation (5), the voltage loss during peak discharge period is related to the current at the start and end of the feeder line and the access position of the photovoltaic-storage system, as shown in Table 1.

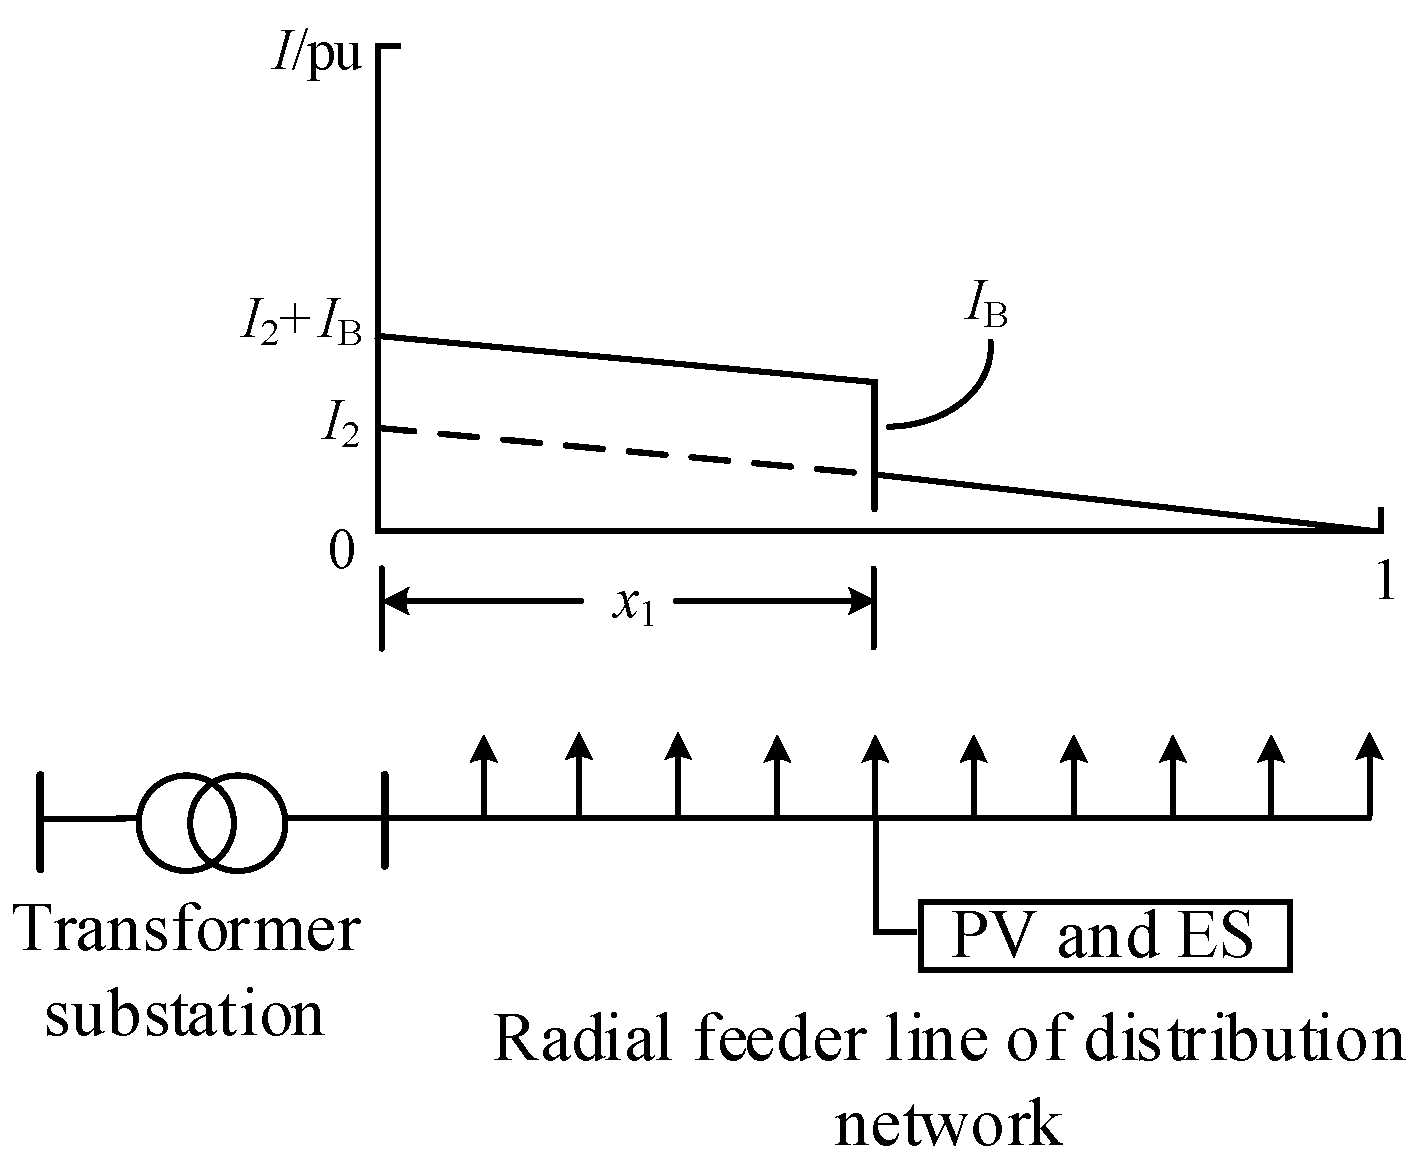
2.3. Charge of Photovoltaic-Storage System during Valley Period

During the valley period, the photovoltaic-storage system is charged, and the distribution of the current is shown in Figure 5 and Equation (6).
i 2 ( x ) = M 2 x + N 2 + I B   0 < x x 1 M 2 x + N 2 x 1 < x < 1
Substituting Equation (6) into Equation (2), we can obtain the voltage loss at x from the beginning of the feeder line during the valley period Δ U ˜ 2 ( x ) , as follows.
Δ U ˜ 2 ( x ) = 1 2 z M 2 x 2 + z N 2 + I B x , 0 < x x 1 1 2 z M 2 x 2 + z N 2 x + z I B x 1 , x 1 < x < 1
In order to investigate the effect of voltage loss, take the derivative of x, and let d Δ U ˜ 2 ( x ) d x 0 , we can obtain
d Δ U ˜ 2 ( x ) d x = z M 2 x + z N 2 + I B , 0 < x x 1 z M 2 x + z N 2 , x 1 < x < 1 and d Δ U ˜ 2 ( x ) d x 0 M 2 x I B + N 2 , 0 < x x 1 M 2 x N 2 , x 1 < x < 1 ,   where   M 2 = I 2 e n d I 2 s a t r t < 0 x I B + N 2 M 2 , 0 < x x 1 x N 2 M 2 , x 1 < x < 1
According to Equation (8), the voltage loss during the valley period is related to the current at the head and end of the feeder line and the location of the photovoltaic-storage system, as shown in Table 1.

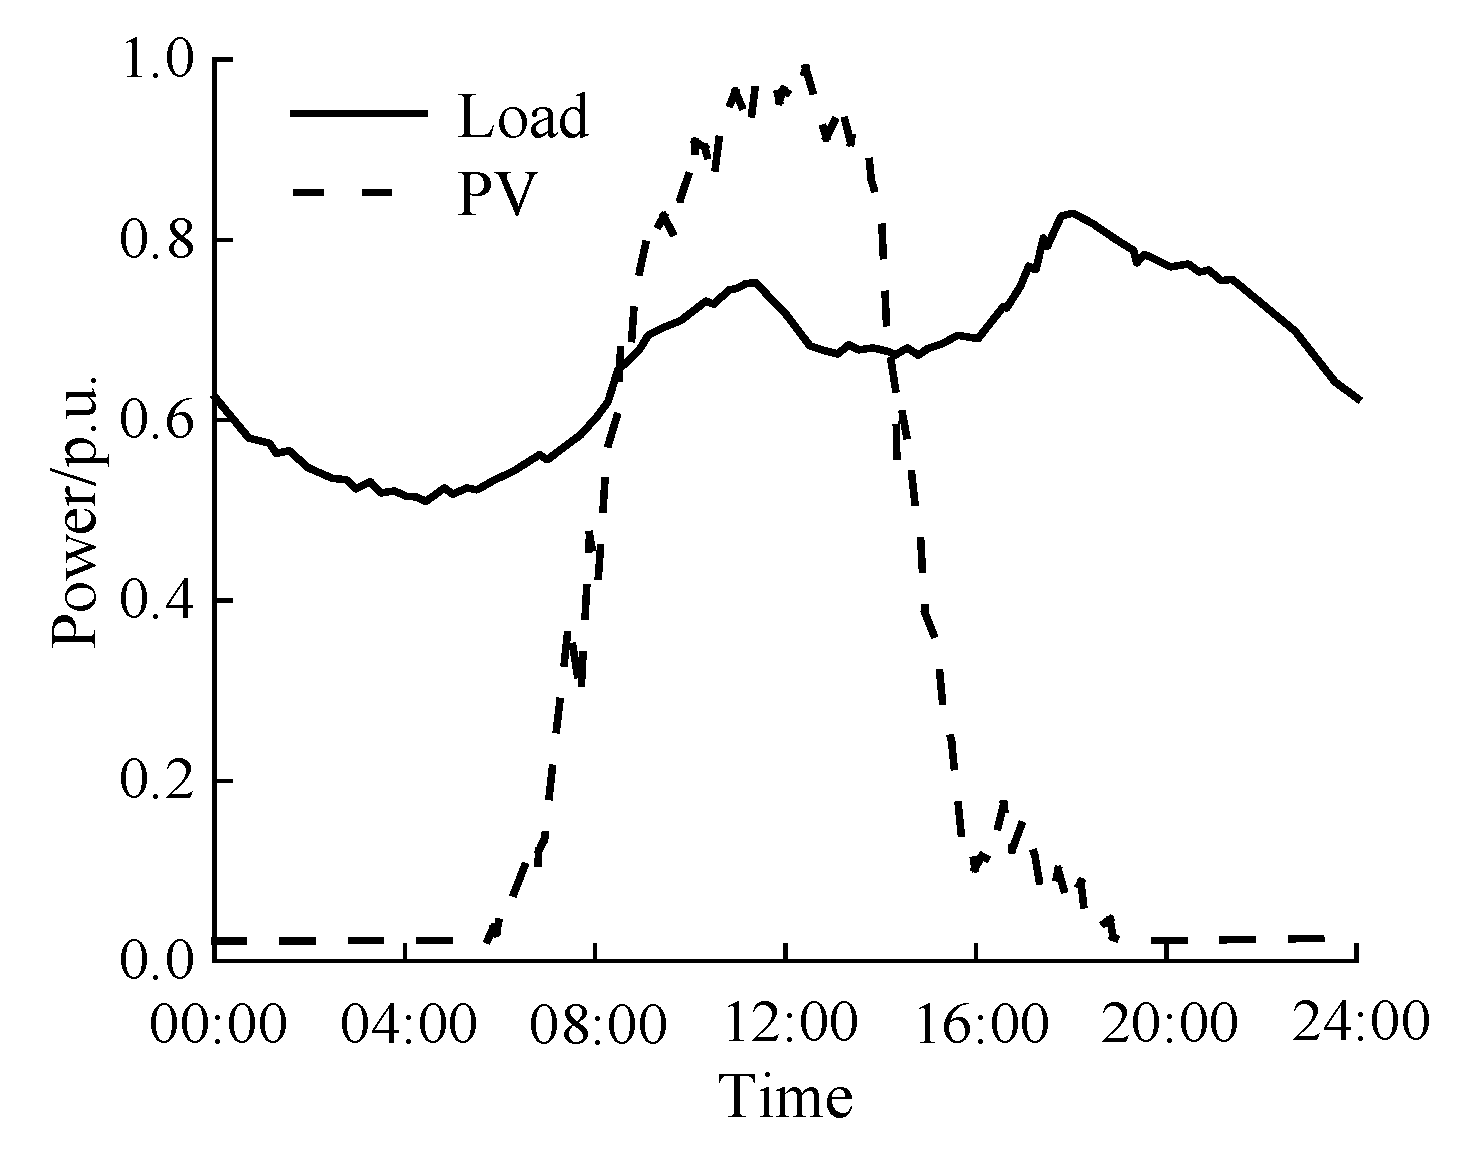
2.4. Feasibility Analysis of Cooperative Control of Photovoltaic Storage

To sum up, the key factors of voltage loss in the distribution network after the photovoltaic-storage system access mainly include the charge and discharge power of the system, the power at the head and end of the feeder line, and the access location of the photovoltaic-storage system. The power at the head and end of the feeder line is determined by the load and cannot be optimized; the access location of the optical storage system has been determined at the planning stage and cannot be optimized during operation. Therefore, by changing the charge and discharge power of the photovoltaic-storage system, the feeder line can operate in an economic state and stabilize the voltage.

3. Voltage–Cost Sensitivity Calculation Method

Due to the difference of network structure, adjustment cost, and other factors, the comprehensive adjustment costs of different nodes to the same node are not the same. The nodes with a similar comprehensive cost are grouped together for overall adjustment. For example, the adjustment amount of node A1 to node B voltage is small, but the unit adjustment cost of node A1 is high; the node A2 adjusts the voltage of the node B more, but the unit adjustment cost of node A2 is lower. Then, the adjustment priority of node A1 and node A2 needs to be determined by combining the unit adjustment cost and sensitivity.

3.1. Adjustment Cost Model of Photovoltaic-Storage System

3.1.1. Unit Regulation Cost Model of Energy Storage

The cost of regulation of energy storage mainly includes the cost of battery life loss and the cost of regulation and maintenance (costs incurred in the actual adjustment process), so the loss of energy storage is mainly generated by the active regulation.
The battery life loss cost is closely related to the discharge depth, power, and cycle times. The battery life loss cost ( c n BS , 1 ) of the nth irregular discharge process is as follows:
c n BS , 1 = d n eff Γ R C P BS
In the formula, C P BS is the initial investment cost of the battery; Γ R is the total effective discharge of the battery; and d n eff is the degree of loss under irregular discharge.
Among them,
Γ R = L R D R C R d n eff = P R P n BS , dis L R L n BS e n a
where LR is the number of cycles of the energy storage system under the rated working condition; DR is the rated discharge depth of the battery; CR is the rated capacity of the battery; e n a is the actual discharge energy at the nth discharge process; PR is the rated power; P n BS , dis is the actual discharge power at the nth discharge process; and L n BS is the actual number of cycles corresponding to the nth discharge process.
Adjusted maintenance costs consist primarily of energy storage unit power maintenance costs ( C mat BS ), and the unit power loss cost ( C loss BS ).
In summary, the unit active regulation cost ( c n BS , P ) of the energy storage system is as follows:
c n BS , P = c n BS , 1 + C mat BS + C loss BS
The regulation cost incurred by the reactive power regulation of the energy storage system is negligible and hence it can be considered to be approximately zero, i.e., the c n BS , Q 0 .

3.1.2. Unit Regulation Cost Model of PV

The reactive power regulation of the inverter will produce greater thermal stress on the inverter components, especially capacitors and other components that are prone to accelerated aging in the thermal power cycle, making the inverter produce additional losses, thus reducing the life of the inverter, and at the same time, the greater power will cause the inverter to produce greater power losses, so the cost of regulating the photovoltaic inverters is mainly caused by the reactive power regulation.
Considering that capacitor is an important component that affects the life of inverter equipment, taking the capacitor as the life benchmark of inverter, and referring to the life formula of the capacitor under normal working conditions, we can obtain the reduction in reactive power injection life as follows:
L R = L P L Q = v θ n 2 λ n μ Q 2
where L P , L Q are the working life of the capacitor when the inverter only outputs active power and reactive power; Q is the output reactive power of inverter; and λn, θn, μ, and ν are calculated from the operating parameters of capacitor bank and inverter during the nth inverter power output.
When the inverter is used to provide reactive power, the life of the inverter is shortened, resulting in an increase in the balanced power cost of PV. In order to integrate LR into the reactive power cost, the effect of inverter life loss must be quantified. In this case, it is necessary to balance the power cost based on the photovoltaic system. The added value of the balanced power cost (LI) for different LR is approximately as follows:
L I = η L 1 , A 1 L R + η L 1 , A 0 L R 2 + η L 1 , B 1 L R + η L 1 , B 0
where ηLI,A0, ηLI,A1, ηLI,B0, and ηLI,B1 are determined according to different inverter models.
The unit cost of reactive power voltage regulation of the nth photovoltaic inverter due to the shortening of inverter life is calculated as follows.
c n QPV , LR = L I / Q n PV
where Q n PV is the reactive power of the nth photovoltaic inverter.
The regulation cost incurred by the active power regulation of the PV inverter is negligible, so it can be assumed to be approximately 0, i.e., the c n PV , P 0 .

3.2. Voltage–Cost-Based Sensitivity

Voltage sensitivity indicates the influence of active or reactive power change in a node on the voltage of a specified node. The influence of power change in node j on the voltage change in node i is as follows:
Δ U i = S i j Δ P i Δ Q i
where ΔUi is the voltage change in node i; ΔPj is the injected active power variation in node j; ΔQj is the change in reactive power injected into node j; and Sij is the voltage sensitivity matrix, and its calculation formula is as follows:
S i j = S i j P , i j S i j Q , i j , i j S i j P , i > j S i j Q , i > j , i > j S i j P , i j = 1 U 0 n = 1 i R k , S i j Q , i j = 1 U 0 n = 1 i X k , i j S i j P , i > j = 1 U 0 n = 1 j R k , S i j Q , i > j = 1 U 0 n = 1 j X k , i > j
where U0 is the outlet voltage of distribution network transformer and Rk and Xk are the line impedance from node k − 1 to node k.
From Equation (16), it can be seen that the node voltage is more affected by the change in its own or downstream node power, and the sensitivity is only related to the line impedance.
In order to take the cost of regulation of the photovoltaic-storage system into consideration, a voltage–cost-based sensitivity is proposed, defined as follows:
S i j U C = Δ U i j C j
where ΔUij is the voltage change in node i caused by power change at node j and Cj is the adjustment cost of equipment at node j.
When the number of energy storage devices and photovoltaic units connected at node j are mj and nj, respectively, the sensitivity of node j’s energy storage active power, energy storage reactive power, photovoltaic inverter reactive power, and photovoltaic inverter active power to node i’s voltage cost are S C i j BS , P , S C i j BS , Q , S C i j PV , Q , and S C i j PV , Q :
S C i j BS , P = k = 1 m j Δ U i j B S , P C n . k BS , P = k = 1 m j S i j P Δ P B S , k C n . k BS , P = k = 1 m j S i j P c n . k BS , P S C i j BS , Q = k = 1 m j Δ U i j B S , Q C n . k BS , Q = k = 1 m j S i j Q Δ Q B S , k C n . k BS , Q = k = 1 m j S i j Q c n . k BS , Q S C i j PV , Q = k = 1 n j Δ U i j PV , Q C n , k PV , Q = k = 1 n j S i j Q Δ Q P V , k C n , k PV , Q = k = 1 n j S i j Q c n , k PV , Q S C i j PV , P = k = 1 n j Δ U i j PV , P C n , k PV , P = k = 1 n j S i j P Δ P P V , k C n , k PV , P = k = 1 n j S i j P c n , k PV , P
In the formula, Δ U i j p , Δ U i j Q are the voltage variation in node i caused by the regulation of energy storage active power and the regulation of reactive power by photovoltaic inverter at node j, respectively, and C n . k BS , C n , k QPV , LR are the costs of energy storage regulating active power and photovoltaic inverter regulating reactive power, respectively.
The greater the absolute value of sensitivity ( S C i j ), the smaller the adjustment cost of node j, and the higher the adjustment priority of node j. Because c n BS , Q 0 , c n PV , P 0 , when there exists a node where the reactive power of the energy storage device or the active power of the PV inverter is involved in the adjustment, the S C i j approximated to infinity, this node is prioritized to participate in the adjustment. When the reactive power of the energy storage or the active power of the PV inverter of this node is exhausted, it is necessary to compare its S C i j with S C i k k j of other nodes to determine the adjustment object.

4. Multi-Stage Voltage Overrun Control Based on Group Collaboration

4.1. A Grouping Method Based on Voltage–Cost Sensitivity

As can be seen in Section 3, the larger the voltage–cost sensitivity is, the higher is the regulation priority, but there may be more than one overrun node in the grid at the same time, and for different voltage overrun nodes, different control nodes (nodes accessed by the photovoltaic-storage system) do not have the same degree of regulation priority. In order to minimize the regulation cost, a group cooperative control method is proposed. Firstly, the grouping method is introduced.
The control resources involved in voltage overrun mainly include the active and reactive power of the energy storage device and the active and reactive power of the photovoltaic inverter. At the same time, it is assumed that both the energy storage device and the inverter can realize active and reactive decoupling control. Considering the positive and negative relationship between the comprehensive regulation cost and sensitivity, the grouping method is as follows:
The first group: the ES reactive power of each control node and the active power of the PV inverter. From the analysis in Section 2, it can be seen that the regulation cost is mainly generated by the ES active power and the PV inverter reactive power, so the first group consists of the no-cost regulation resources. Let the combination of control nodes be Φ con , and the node regulation resource set of the first group be Φ 1 , then,
Φ 1 = Φ 1 B S Φ 1 P V Φ 1 B S = Δ Q j B S S C i j BS , Q , j Φ con Φ 1 P V = Δ P j P V S C i j PV , P , j Φ con
The second group: The collection of energy storage active power and photovoltaic inverter reactive power that can simultaneously improve the node voltage above and below the voltage limit. Since the voltage–cost sensitivity of the control node to the over-voltage node is positive and negative, in order to avoid reverse regulation as much as possible. The active power of energy storage and reactive power of photovoltaic inverter are divided into four parts according to the sensitivity (mutual intersection), which are the set of control resources with positive sensitivity to nodes whose voltage exceeds the upper limit ( Φ pos up ), the set of control resources with negative sensitivity to nodes whose voltage exceeds the upper limit ( Φ neg up ), the set of control resources with positive sensitivities to nodes whose voltage exceeds the lower limit ( Φ pos down ), and the set of control resources with negative sensitivities to nodes whose voltage exceeds the lower limit ( Φ neg down ), whose adjustment direction is shown in Table 2.
From Table 2, the common resource of set Φ pos up and set Φ neg down can simultaneously improve the problem of voltage exceeding the upper limit, and the common resource of set Φ neg up and set Φ pos down can simultaneously improve the problem of voltage exceeding the lower limit. Therefore, the set Φ 2 of control resources in the second group is as follows:
Φ 2 = Φ pos up Φ neg down Φ neg up Φ pos down Φ pos up = Δ P j B S Δ Q j P V S C i j BS , P > 0 S C i j PV , Q > 0 i Φ up j Φ con Φ neg down = Δ P j B S Δ Q j P V S C i j BS , P < 0 S C i j PV , Q < 0 i Φ down j Φ con Φ neg up = Δ P j B S Δ Q j P V S C i j BS , P < 0 S C i j PV , Q < 0 i Φ up j Φ con Φ pos down = Δ P j B S Δ Q j P V S C i j BS , P > 0 S C i j PV , Q > 0 i Φ down j Φ con
In the formula, Φ up , Φ down are the nodes whose voltage is beyond the upper limit and the nodes whose voltage is below the lower limit, respectively.
Group III: In addition to the sum of other control resources in the first group and the second group, the control resources in this group have no obvious regulatory advantage, their regulation cost is relatively high, there is the possibility of reverse regulation, and the regulation order is the lowest. Let the set of all regulating resources be Φ res , then the node regulating resource set of the third group Φ 3 is as follows:
Φ 3 = Φ res Φ 1 Φ 2

4.2. Multi-Stage Over-Voltage Control Based on Group Collaboration

In the previous section, all regulation resources were divided into three groups. From the perspective of control effect, the control effect of the first group is better than that of the second group, and the control effect of the second group is better than that of the third group. Therefore, a multi-stage voltage overrun control based on grouping cooperation is proposed.

4.2.1. Over-Voltage Control Method in the First Stage

In the first stage, the over-voltage control method takes the first group of control resources as the optimization variable. Because the adjustment cost of this group of resources is almost zero, the voltage of each node can be adjusted to operate according to the optimal voltage curve. Therefore, the objective of the over-voltage control is to minimize the deviation between the over-voltage and the optimal voltage operation curve.
(1)
Determination of optimal voltage curve
The meaning of the optimal voltage curve is that when the voltage of the node is running in this curve, the whole system has the lowest power loss. Therefore, the optimal voltage curve should satisfy the following equation:
min P loss = min i , i N l g i j U i 2 + U j 2 2 U i U j cos θ i j
where gij is the conductance between node i and node j; Nl is the line set; and θij is the voltage phase angle difference between node i and node j.
When determining the curve, energy storage and photovoltaic power are taken as fixed values and are not involved in the optimization.
(2)
Over-voltage control model
Because of the low control cost at this stage, the deviation between the voltage of each node and the optimal voltage of the node is minimized on the premise that the control voltage does not exceed the limit. Therefore, the objective function is as follows:
min f 1 = min i = 1 , i Φ up Φ up Δ U i up , lim + i = 1 , i Φ down Φ down Δ U i down , lim min f 2 = min i = 1 , i Φ Φ U i opt U i U i N
In the formula,
Δ U i up , lim = U i U i up , lim U i N       U i U i up , lim 0                                               U i < U i up , lim Δ U i d o w n , lim = U i d o w n , lim U i U i N       U i < U i up , lim 0                                               U i U i up , lim
In the formula, U i , U i up , lim , U i down , lim , U i N , and U i opt are the operating voltage, upper limit, lower limit, rated voltage, and optimal operating voltage.
Objective 1 needs to be satisfied first, and objective 2 is optimized on the basis of satisfying objective 1.
The constraints mainly include current constraints, distributed power output constraints, etc., which are conventional constraints and will not be repeated.

4.2.2. Over-Voltage Control Method in the Second Stage

In the second stage, the over-voltage control takes the second group of control resources as the optimization variable. Any control resource adjustment in this group can improve the all over-voltage problem at the same time. According to the principle of minimum regulation cost, the regulation resources with the highest voltage cost sensitivity are preferentially adjusted.
First, calculate the comprehensive voltage–cost sensitivity of resource r (energy storage active power or photovoltaic reactive power) at node j ( S C j r ), which is the sum of sensitivity of resource r at node j to all over-voltage nodes, and the formula is as follows:
S C j r = i = 1 , i Φ up Φ up S C i j r + i = 1 , i Φ down Φ down S C i j r
According to the properties of the second group of control resources, when S C i j r , i Φ up is positive, S C i j r , i Φ down is negative, so the absolute value is taken in the formula.
When S C j r is larger, it indicates that the resource r at node j has the best control effect on the whole network. Therefore, in the second stage of control, all resources in the second group are sorted by S C j r from large to small and called in turn until the voltage of all over-voltage nodes no longer runs out of limits.

4.2.3. Over-Voltage Control Method in the Third Stage

In the third stage, the over-voltage control takes the third group of control resources as the optimization variable. Similar to the second group of resources, it is also called in order according to the value of S C j r . However, since the resources in this group must have reverse adjustment, in order to avoid this situation as much as possible, priority should be given to the resources that minimize the reverse adjustment of the whole grid. The sensitivity calculation formula is as follows:
S C j r = i = 1 , i Φ up Φ up S C i j r i = 1 , i Φ down Φ down S C i j r
It should be noted that in the three-stage over-voltage control process, the elements of Φ up and Φ down are not immutable. After each resource is exhausted, they will be updated again. The update process is also relatively simple, it is only required to delete the overrun node eliminated by the resource directly.

5. Simulation Analysis

5.1. Example Introduction

In order to verify the effectiveness of the over-voltage control method proposed in this paper, the improved 33-node system is taken as an example for simulation analysis, and its topology is shown in Figure 6. The access location of the photovoltaic-storage system is also shown in Figure 6, and the load and photovoltaic installed capacity of each node are shown in Figure 7. The distributed energy storage and photovoltaic are connected at the same node. The total load of the system and the active output of photovoltaic are shown in Figure 8.
After simulation, the maximum voltage of each key node in the system is shown in Table 3 without voltage regulation of the photovoltaic-storage system.
Among them, node 18 has the most serious over-voltage, and its voltage profile is shown in Figure 9.
From Table 3 and Figure 9, it can be seen that the over-voltage mainly occurs at noon when the PV power is significant, and the larger the PV power in the system is, the more serious is the reserve power to delivery, resulting in more serious over-voltage at the nodes of the system.

5.2. Simulation Results of the Method in This Paper
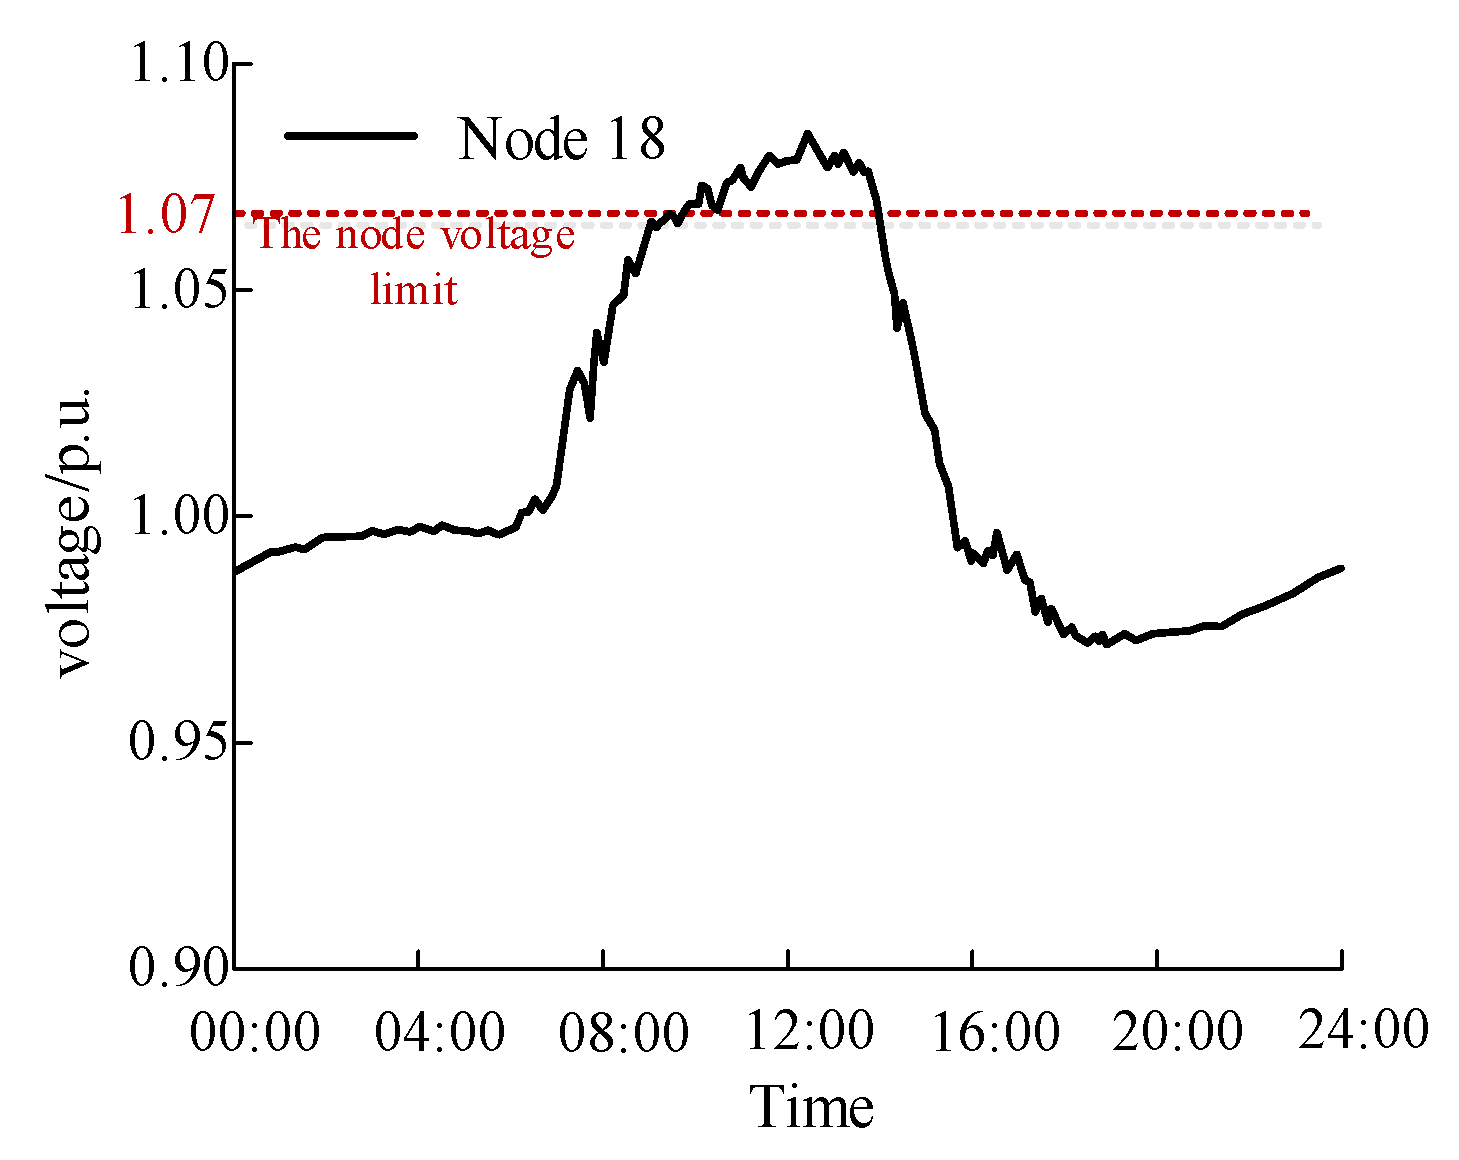
Using the over-voltage control method in this paper, energy storage and photovoltaic are mobilized to carry out over-voltage control. The regulation capacity of various resources and the voltage–cost sensitivity are shown in Table 4.
It can be seen from the table that according to the comprehensive voltage–cost sensitivity, the priority of each resource is as follows: photovoltaic reactive power of node 18 > energy storage active power of node 18 > photovoltaic reactive power of node 16 > photovoltaic reactive power of node 10 > energy storage active power of node 10 > photovoltaic reactive power of node 33 > energy storage active power of node 33 > photovoltaic reactive power of node 25 > photovoltaic reactive power of node 21, and so on.
The power of the energy storage and photovoltaic inverter at each node during the over-voltage period is shown in Figure 10 and Figure 11.
It can be seen from Table 4 and Figure 10 and Figure 11 that various resources are basically called in the order of comprehensive voltage–cost sensitivity. The specific analysis is as follows:
(1)
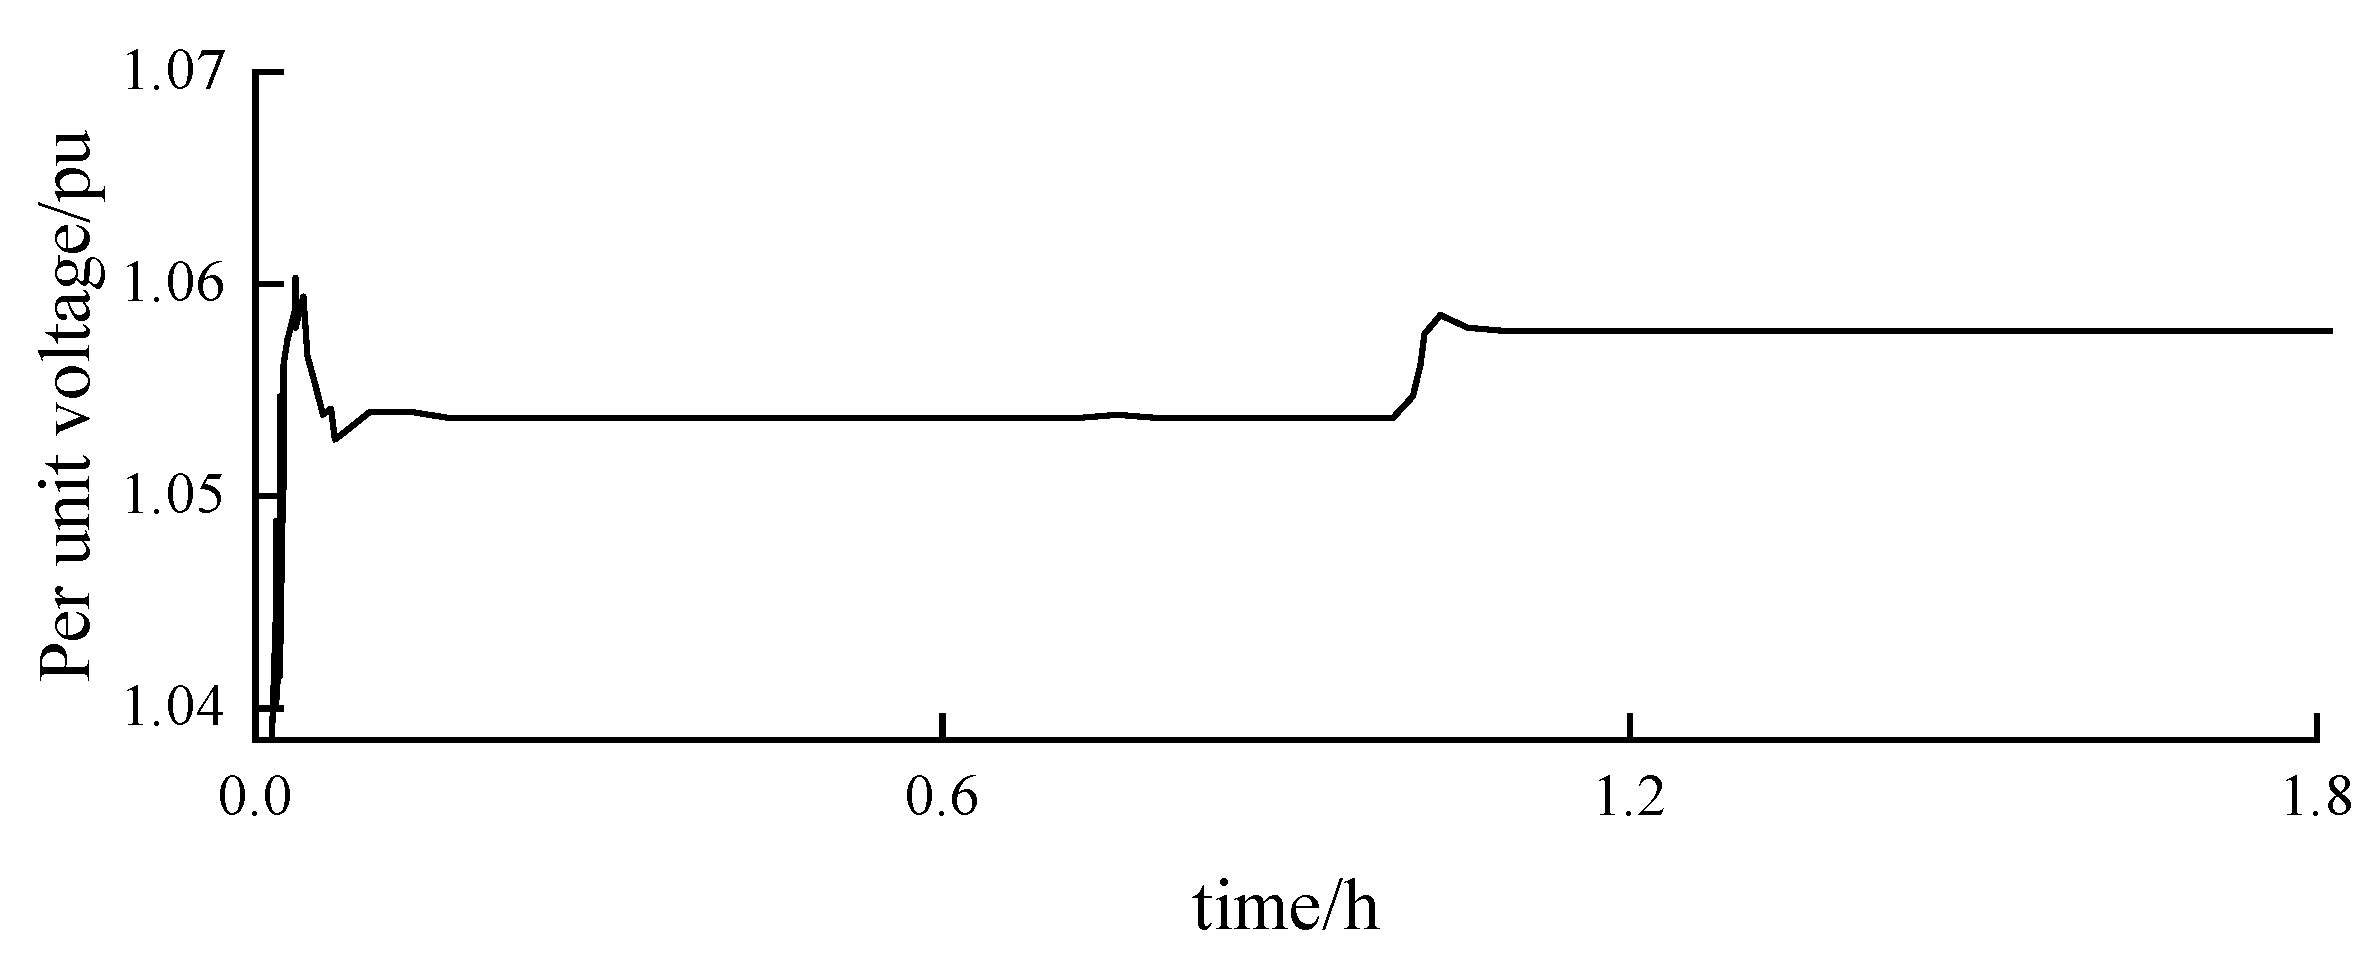
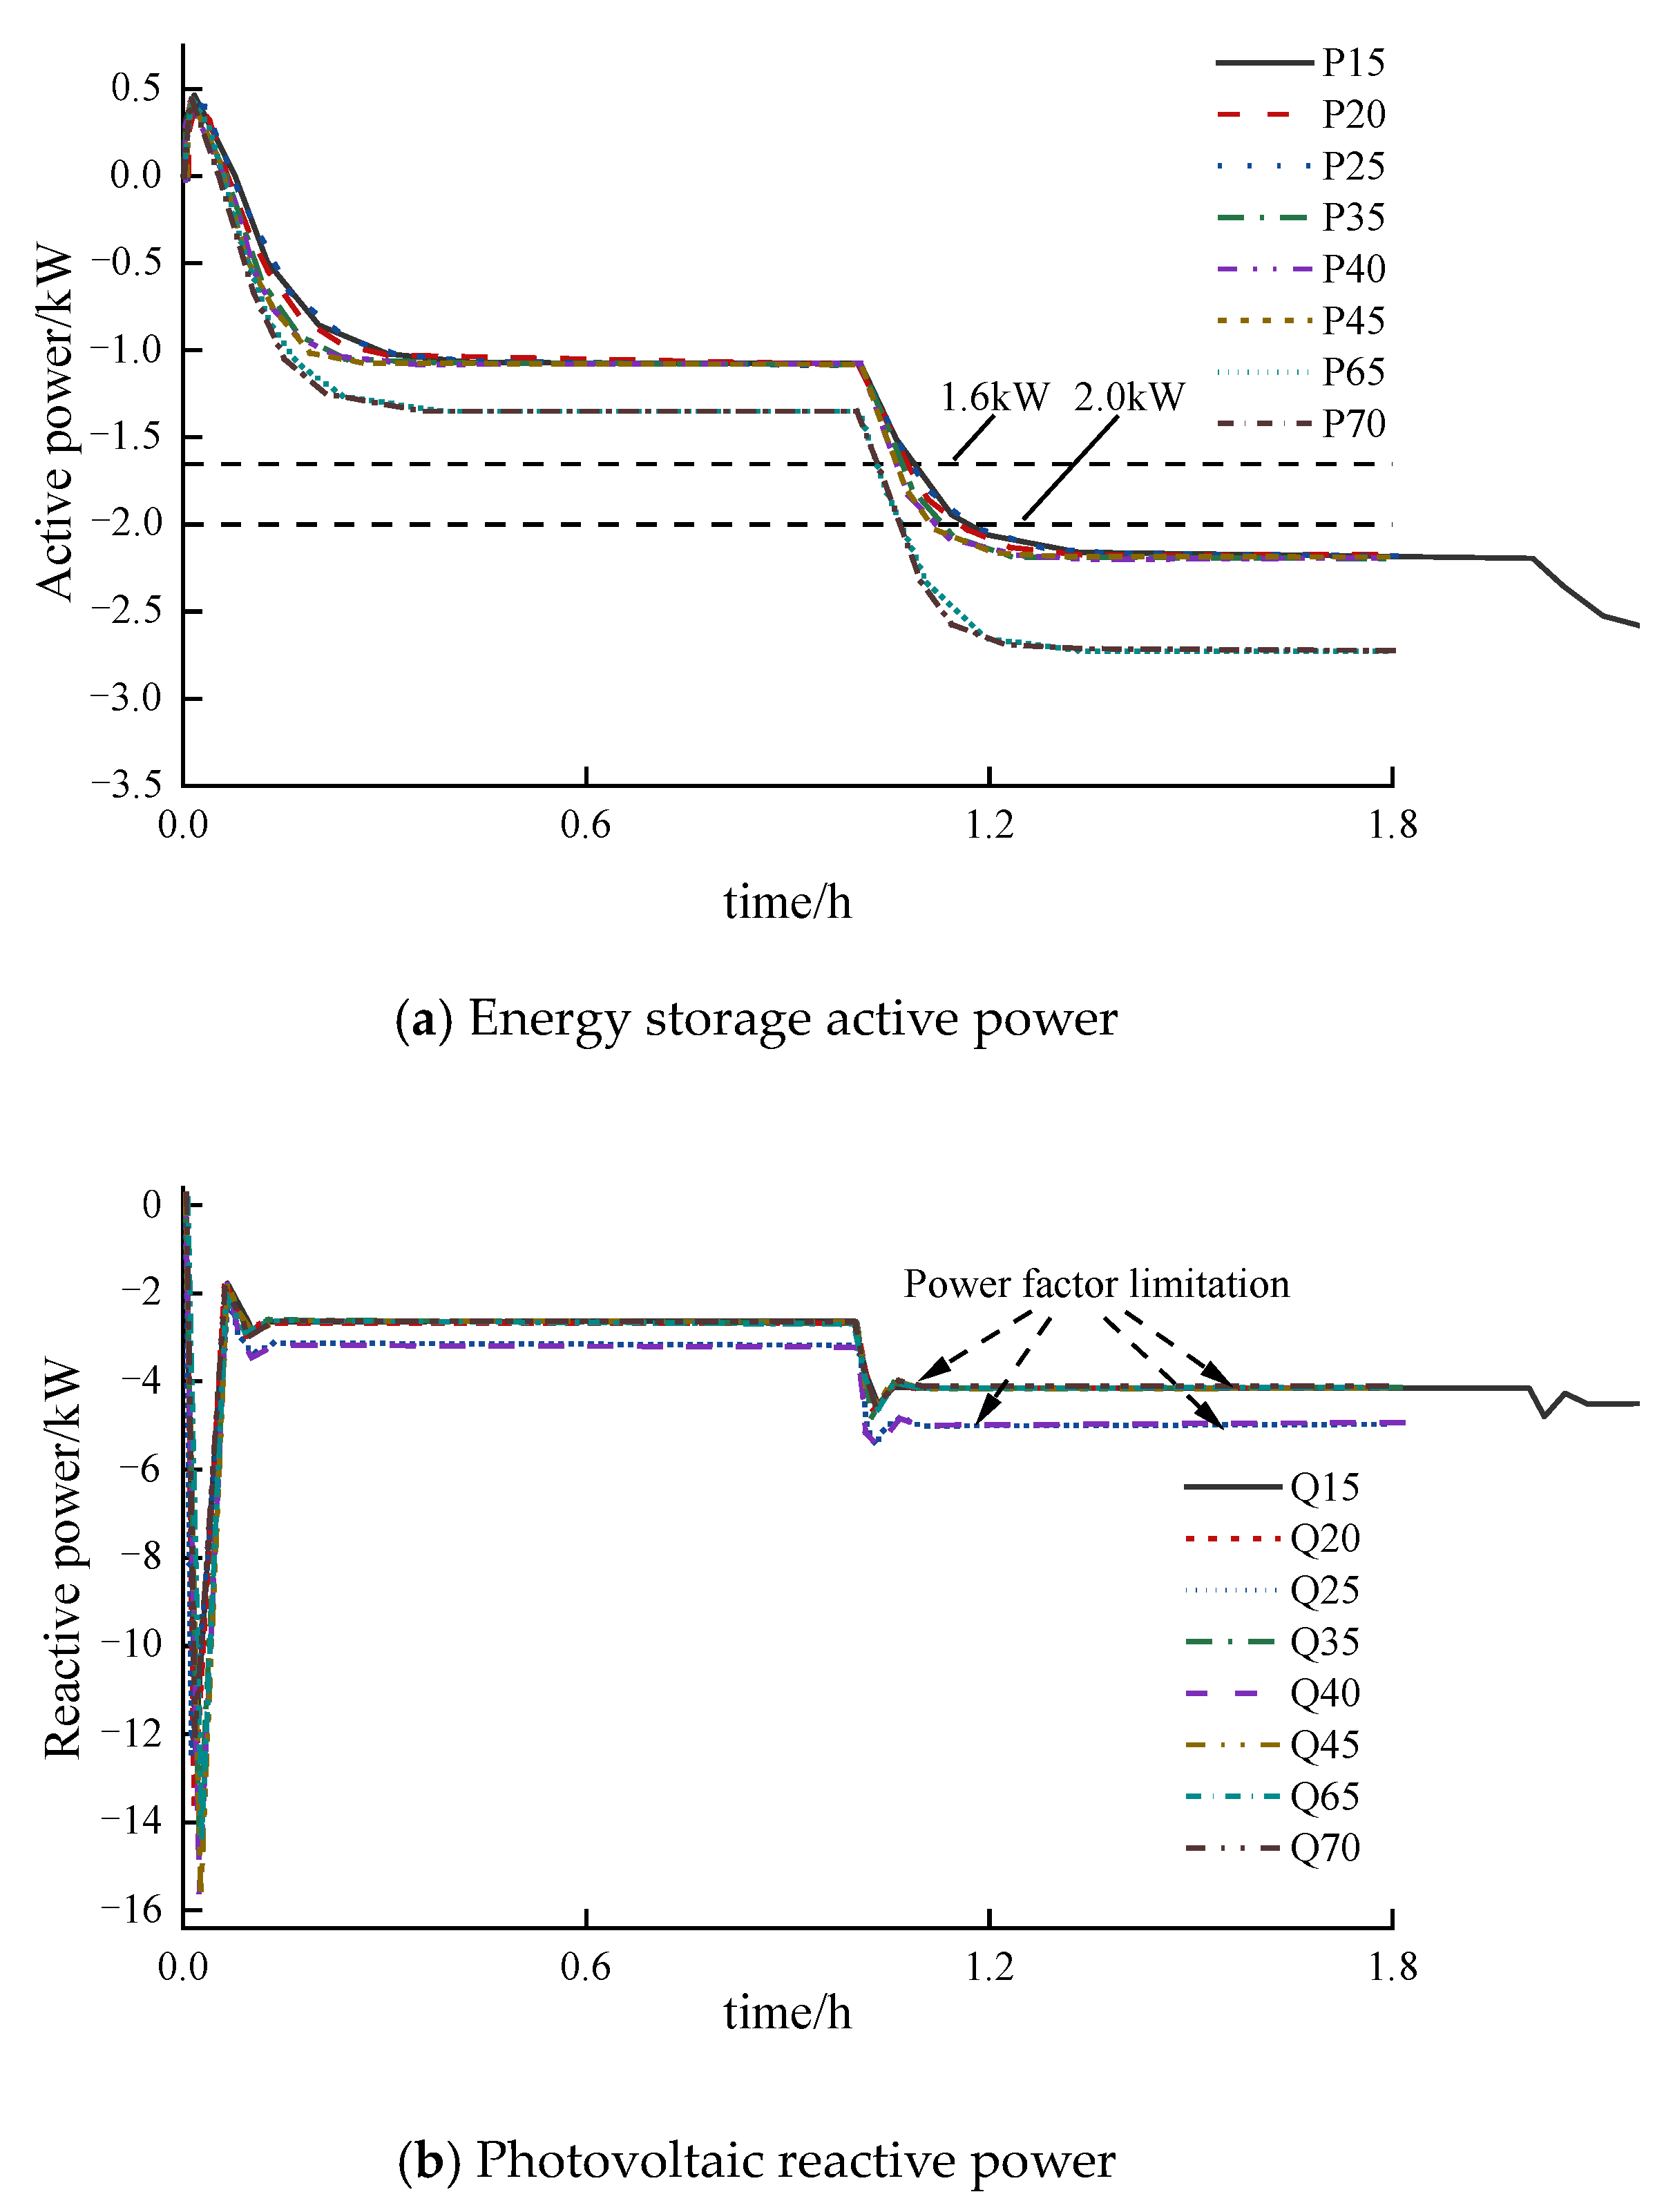
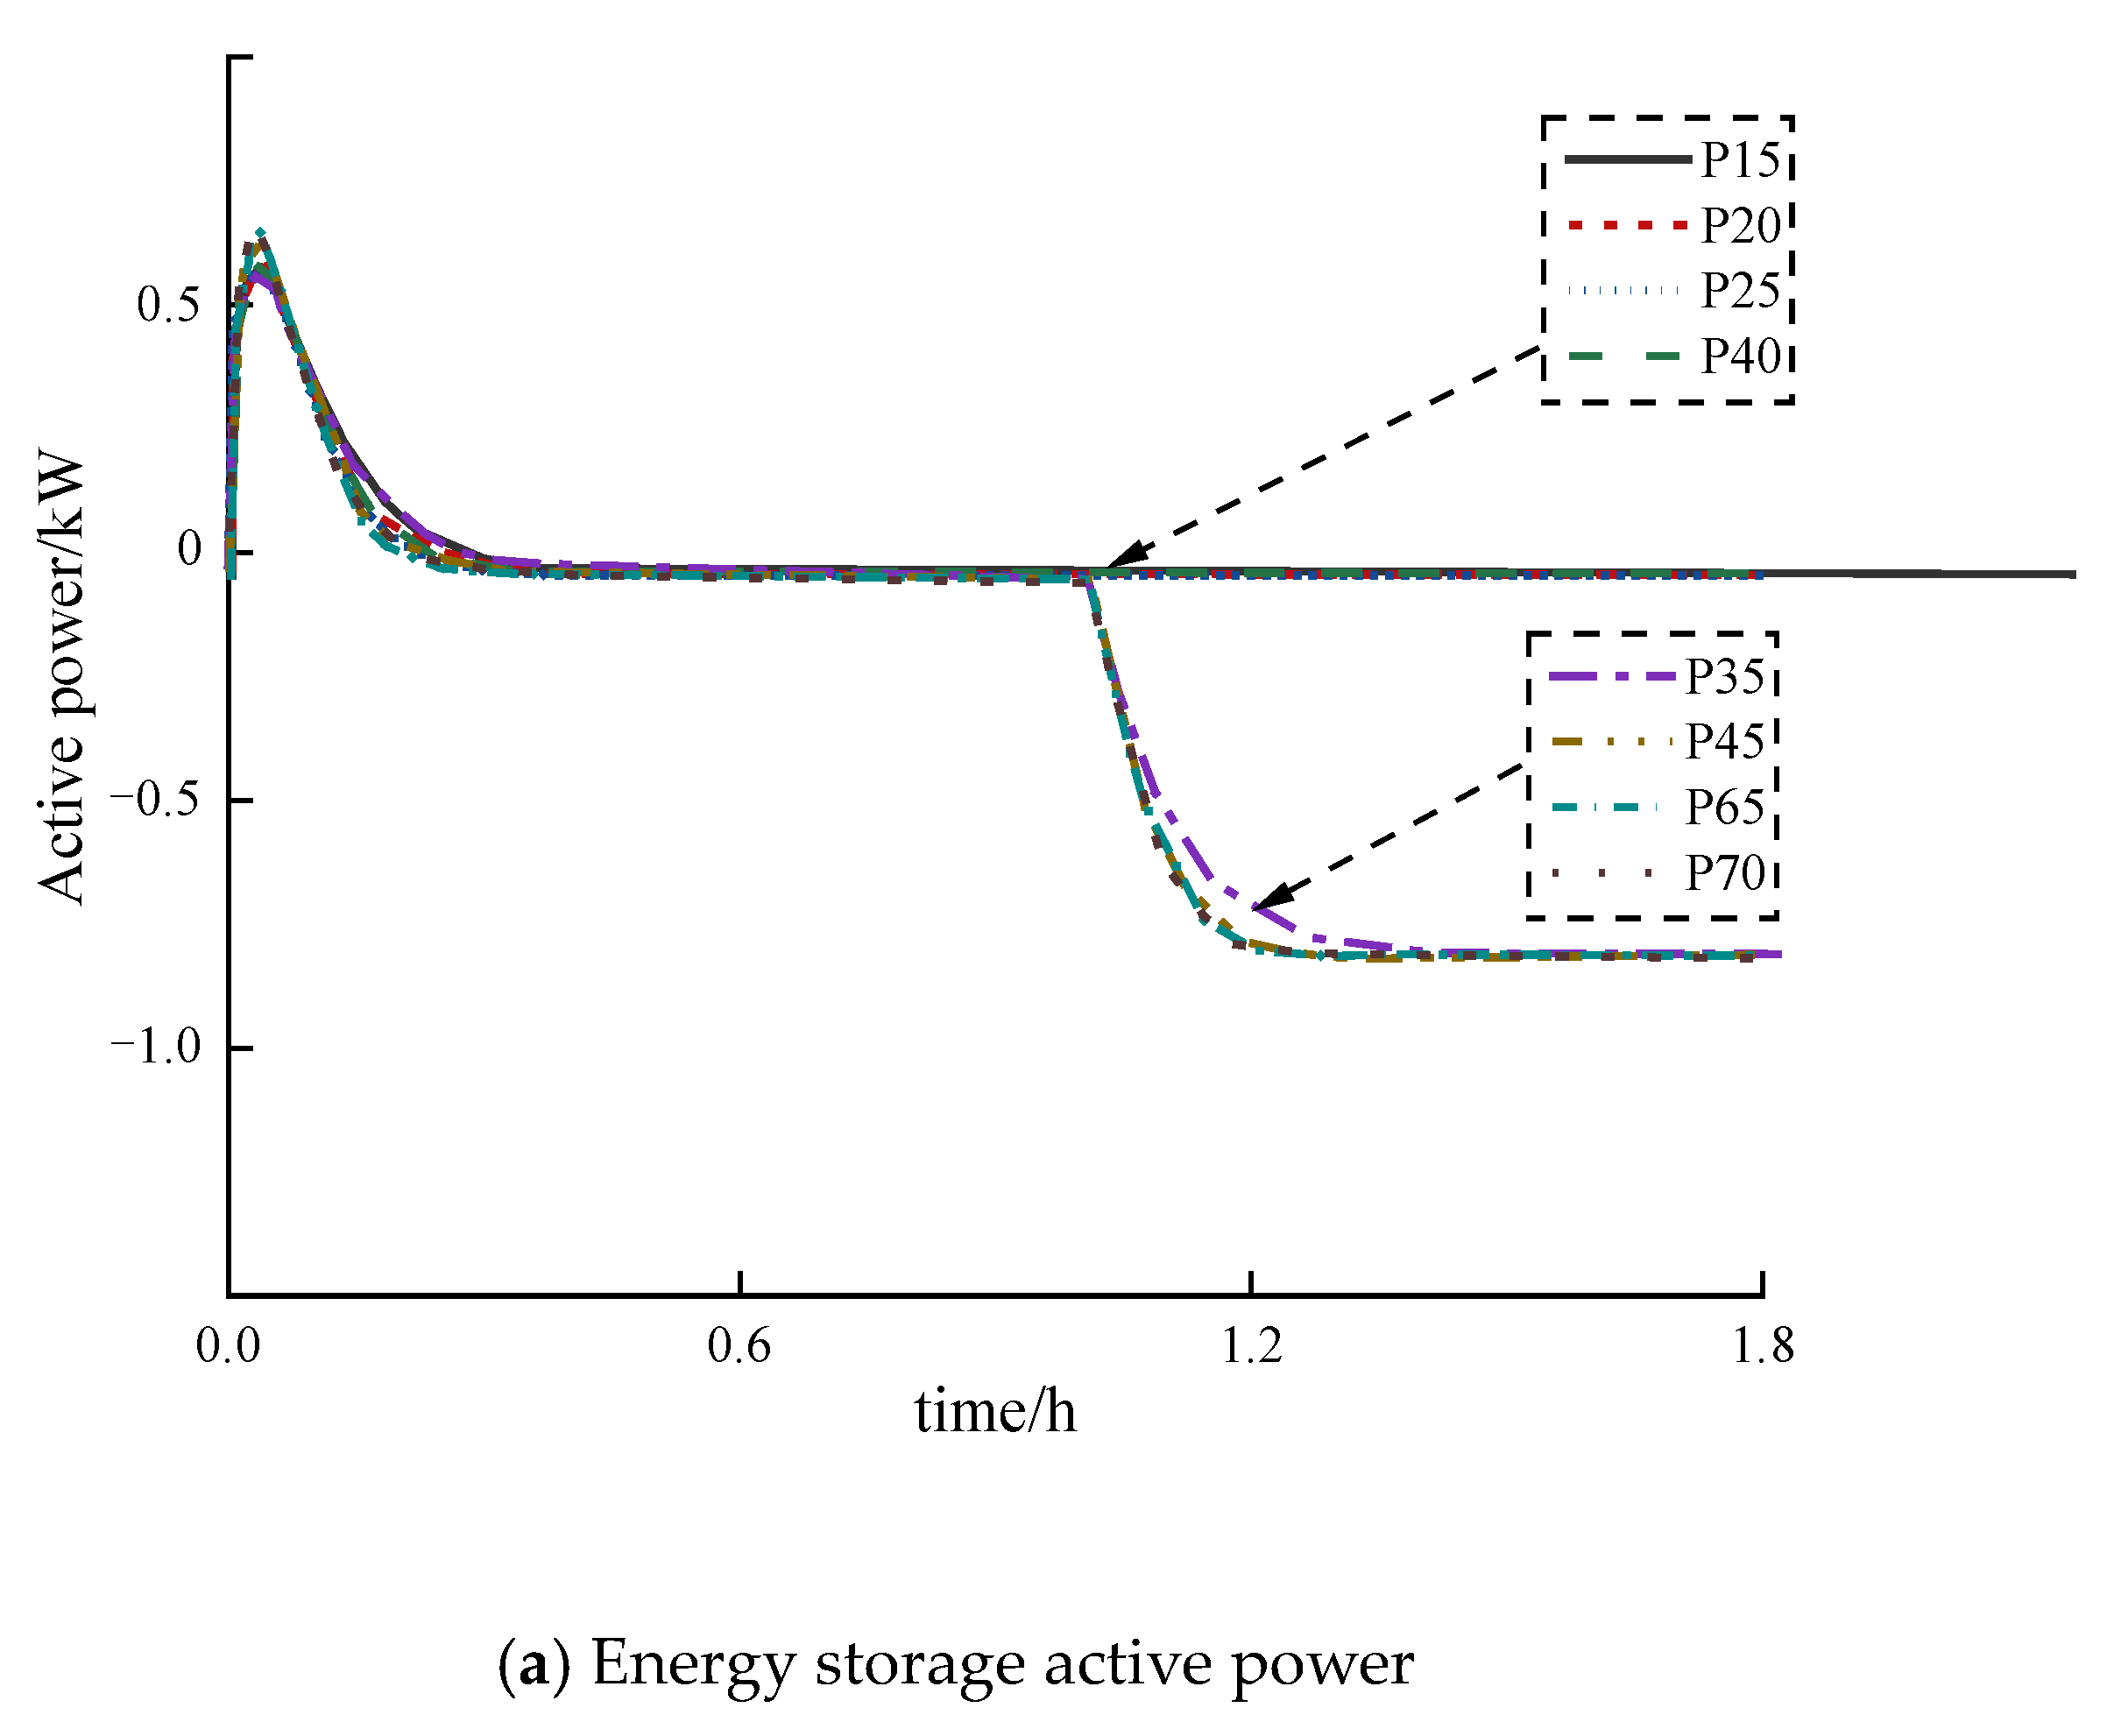
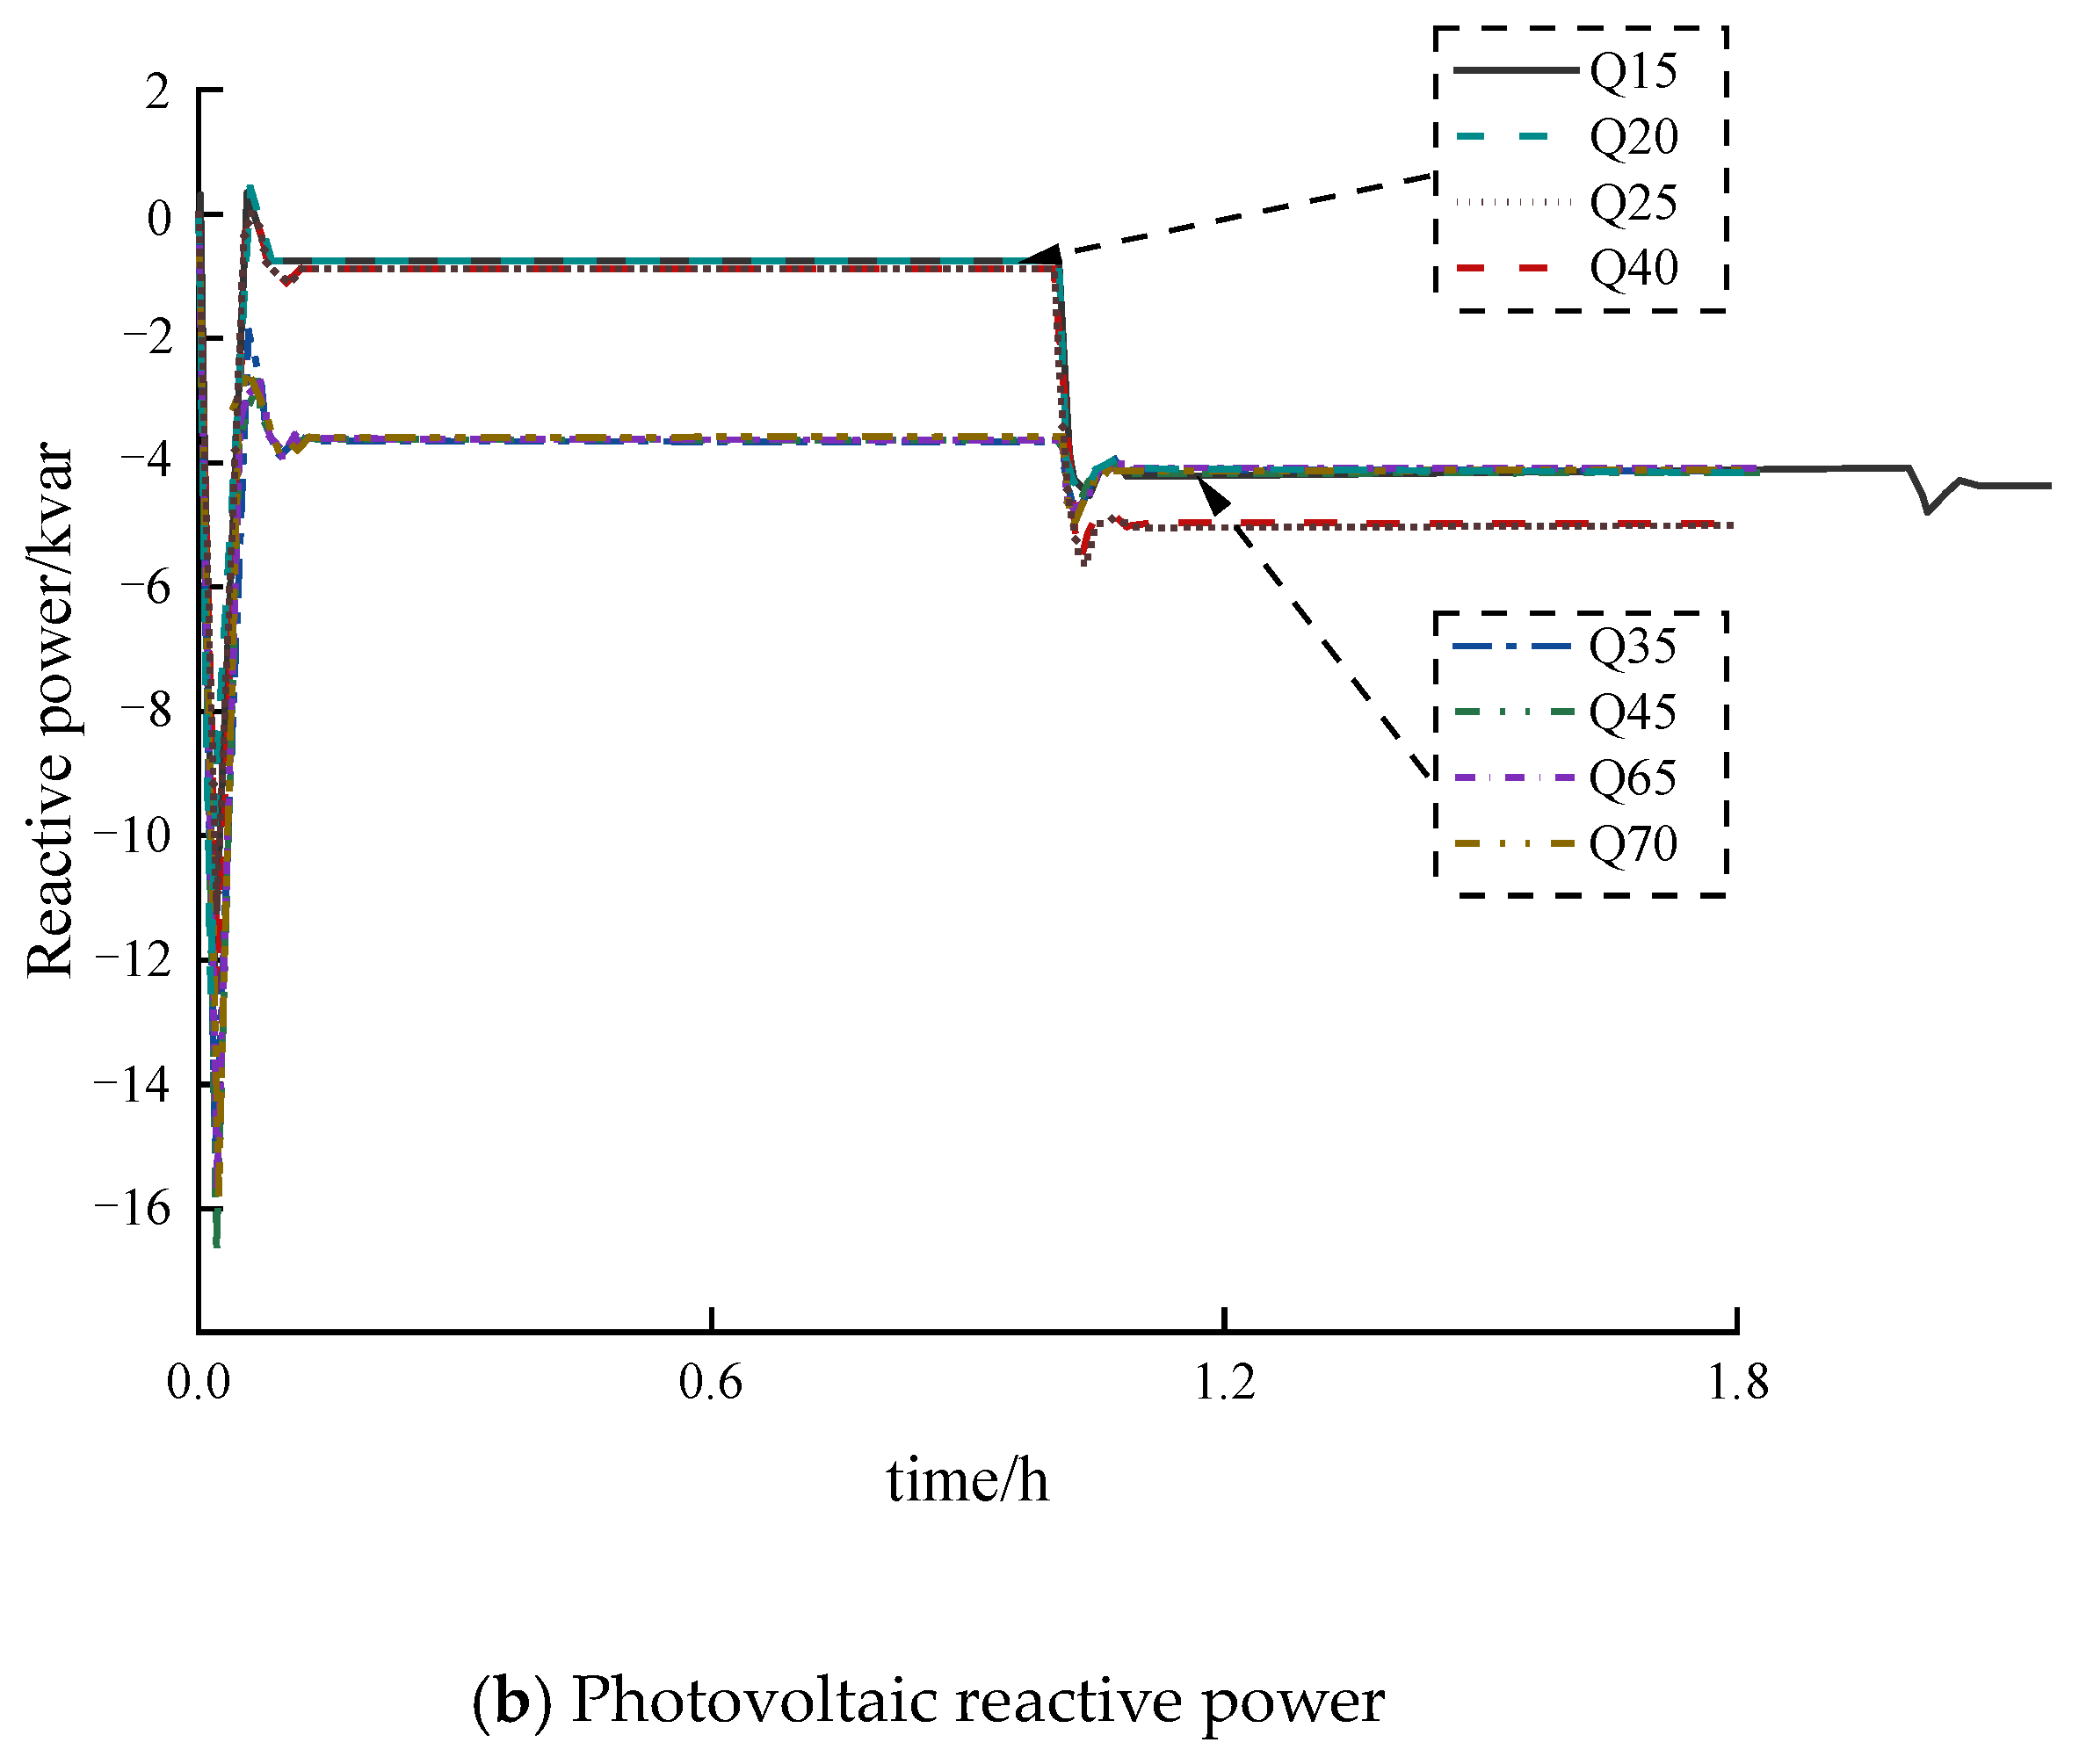
There are three peaks in the over-voltage process. The first peak voltage is small, and only node 18 voltage is out of limit. At this time, the inverters of nodes 10, 16, and 18 are involved in voltage regulation. The output power value increases with the reduction in the impedance distance from the over-voltage node, and node 18 is not working at full load because it is a local node. At the same time, the inverters of other nodes did not act because of the low voltage sensitivity and the high unit voltage regulation cost.
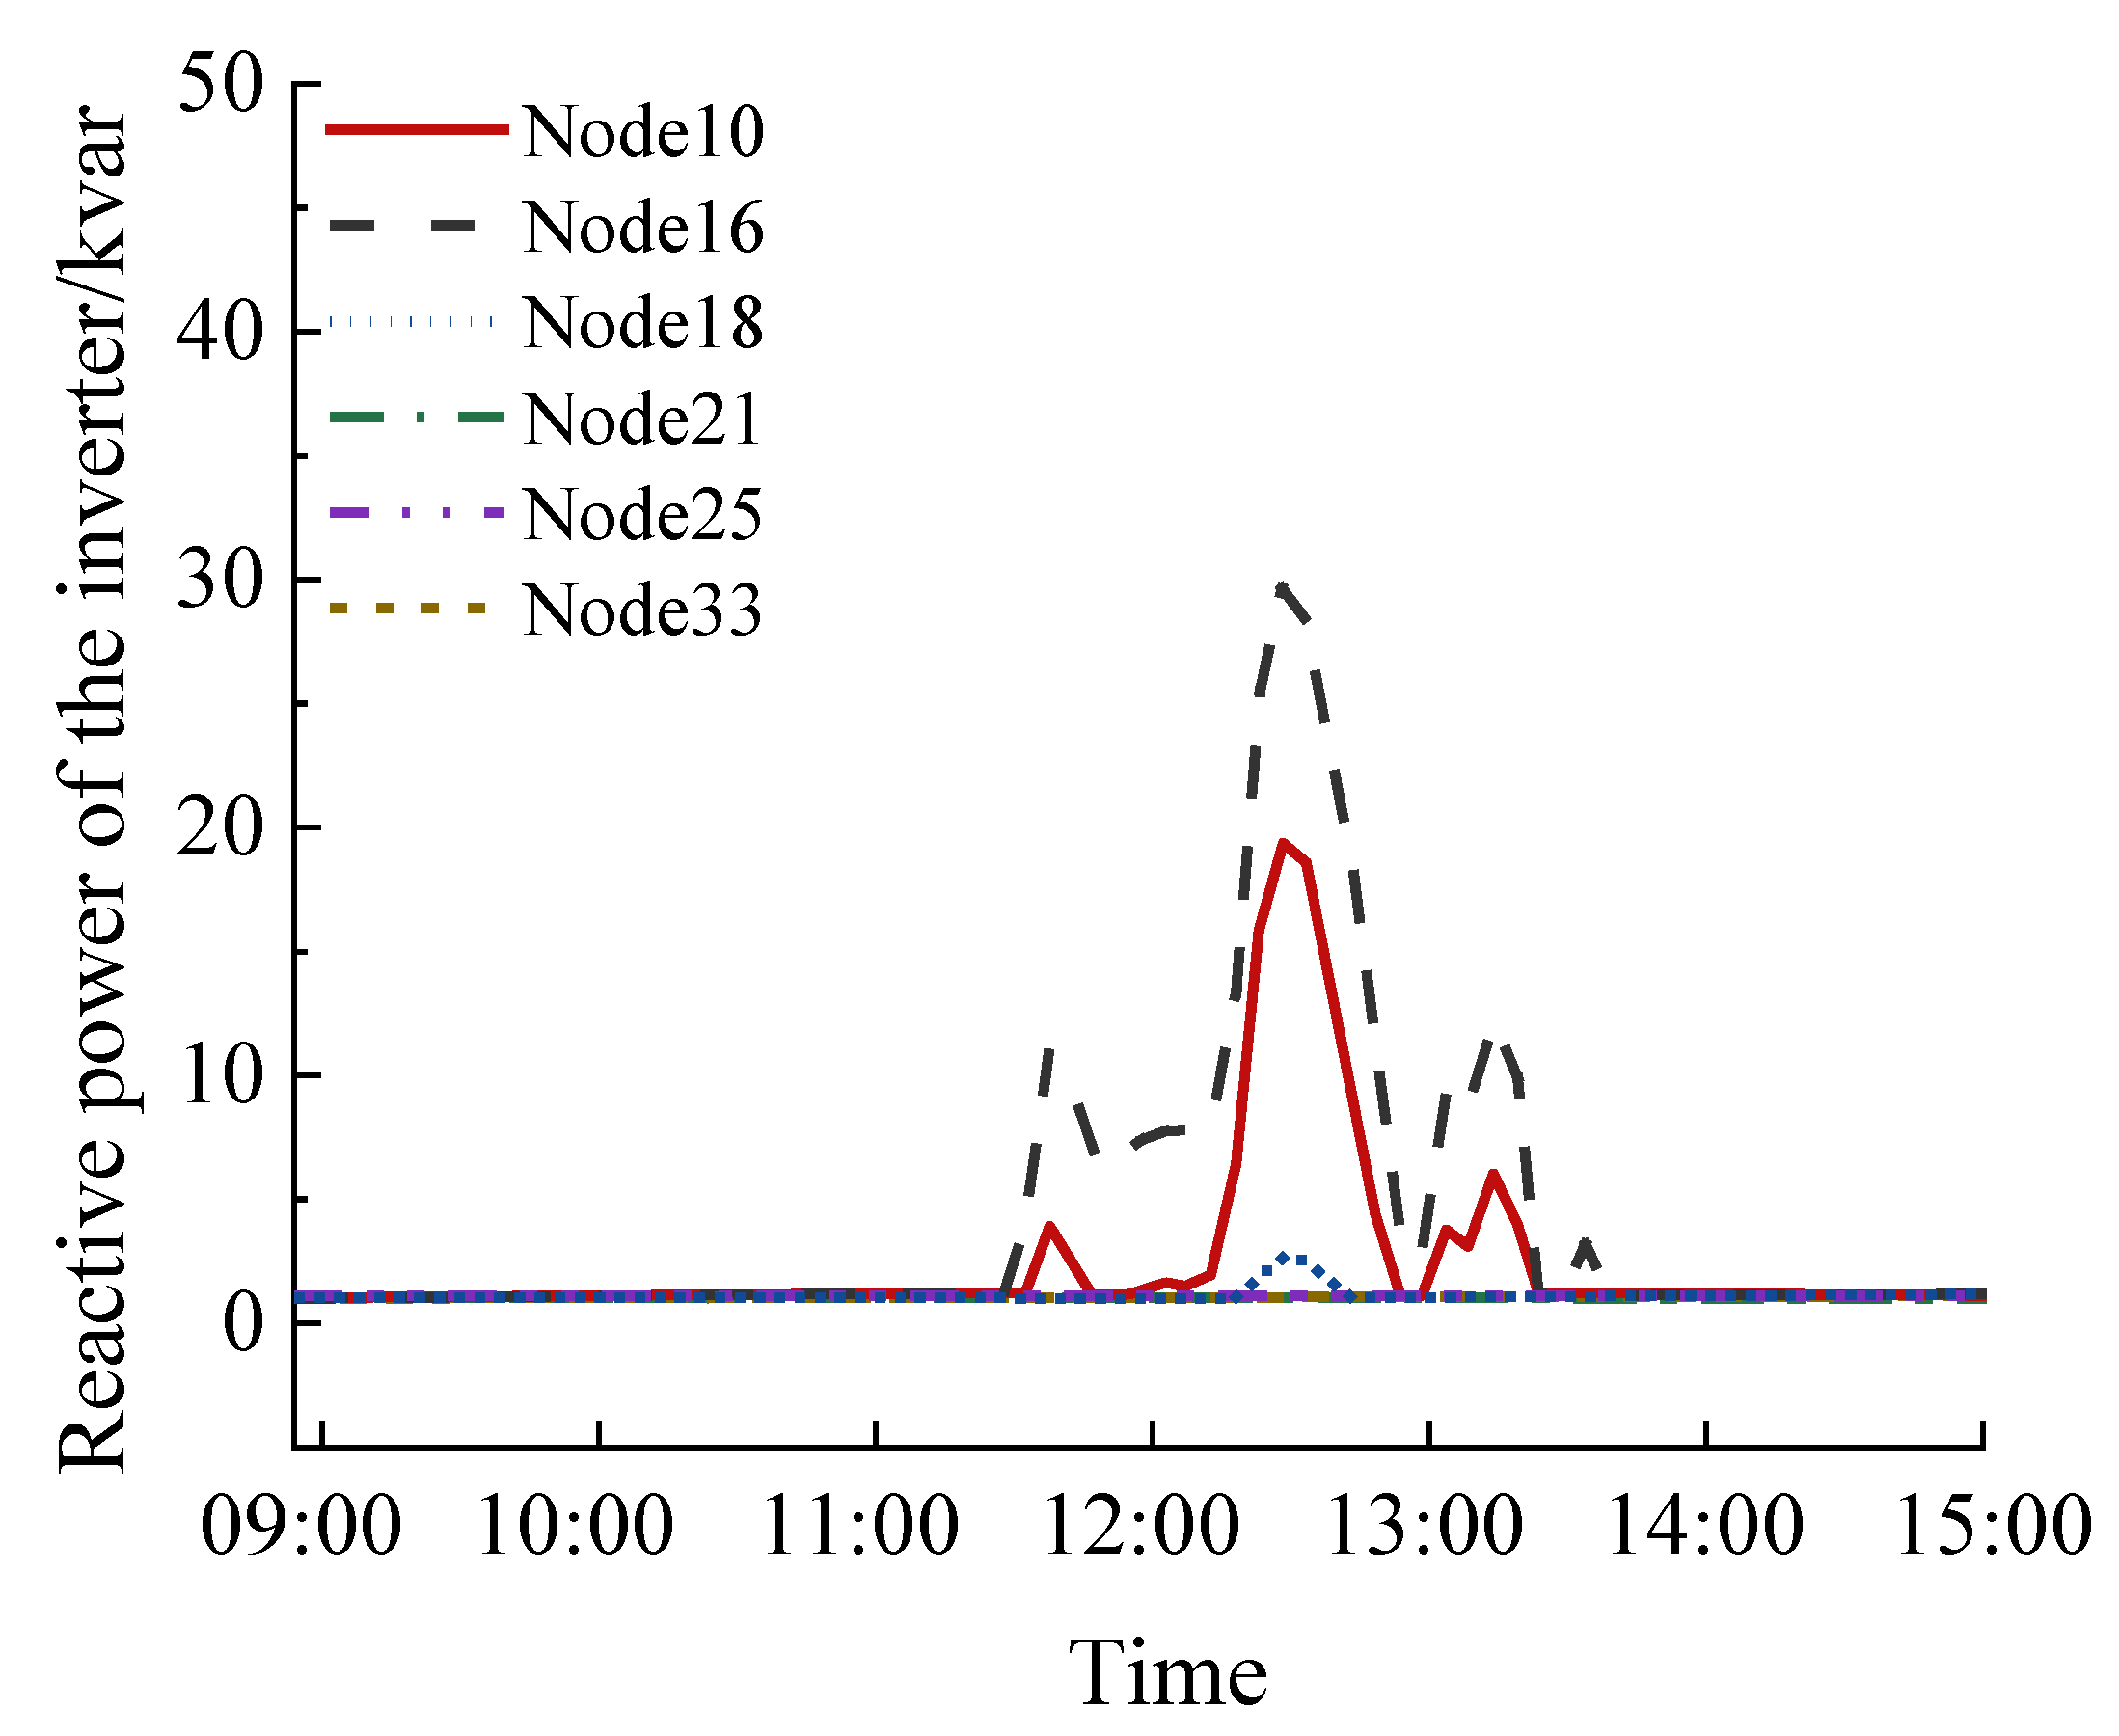
(2)
At the second voltage peak, the voltage exceeds the limit more, and the inverters of nodes 10, 16, and 18 inject a large amount of reactive power into the distribution network. During this period, there is short-term saturation, and node 10 also has a greater sensitivity. At the same time, the inverter of node 33 also participates in voltage regulation in the period, but the two over-voltage values did not exceed 0.015 p.u., so the energy storage of all nodes except node 18 was not put into voltage regulation.
(3)
The third over-voltage value is much higher than the previous two over-voltage values. The inverter of node 25 is also put into use, and the energy storage of other nodes that have not been put into use before also participate in voltage regulation. Node 18 is the dominant node, and node 16 is close to the dominant node and has large capacity, so the energy storage of these two nodes has high output power. The output power of nodes 10 and 33 far away from the dominant node is relatively small because of their small voltage sensitivity and higher unit voltage regulation cost under the same voltage regulation effect.
Under the above power regulation, the voltage of each node is suppressed within the voltage limit, as shown in Figure 12, and the regulation cost is shown in Figure 13.

5.3. Comparative Analysis with Traditional Methods

In order to verify the superiority of the method in this paper, it is analyzed in comparison with two traditional schemes.
Scheme 1: Decentralized control strategy. This is the conventional decentralized local control strategy of calling reactive power first and then active power.
Scheme 2: Two-stage control strategy. This is a two-stage control strategy based on the consistency of inverter reactive power utilization and energy storage SOC.
Scheme 3: Control strategy in this paper.
The three methods can control the voltage of all over-voltage nodes within the limit range, but due to different control strategies, the energy storage and photovoltaic power are inconsistent, and the corresponding voltage regulation costs are also different. Figure 14 shows the power adjustment of each node under three strategies.
The corresponding voltage regulation costs under the three control strategies are shown in Figure 15.
It can be seen that the control strategy proposed in this paper has a significant cost advantage. Compared with decentralized local control, the proposed control strategy calls for more reactive power of adjacent nodes to replace local active power, which reduces the unit active power cost and unit reactive power cost by 67.2% and 1.9%, respectively, compared with decentralized local control. The total amount of active voltage regulation decreases by 54.4%, and the total amount of reactive voltage regulation increases by 183.1%, thus reducing the final total cost by 48.9%. Compared with two-stage control, the proposed control strategy uses voltage price sensitivity to balance the effect and cost of voltage regulation, which makes the unit active power cost and unit reactive power cost increase by 14.3% and 6.2%, respectively, compared with two-stage control, and the total amount of active and reactive voltage regulation decreases by 46.6% and 30.9%, respectively, thus reducing the final total cost by 30.3%.
In terms of inverter control, considering the characteristics that provide that the higher the output power, the greater the service life loss, the proposed control strategy absorbs the advantages of two-stage control, and distributes the reactive power demand evenly to each inverter, so that the energy storage with higher voltage sensitivity and the inverter are more involved in voltage regulation, and the power deficit is mainly made up by the energy storage at the node with higher voltage sensitivity, avoiding the increase in the average unit power cost of the inverter.
In terms of energy storage control, due to the priority of calling the inverter for voltage regulation when the voltage exceeds the limit, the demand for active voltage regulation of energy storage is relatively small. It mainly calls the energy storage with high voltage sensitivity and near the node where the voltage exceeds the limit, taking into account the cost increase caused by the rise in energy storage’s SOC. Compared with the decentralized local control, it calls more energy storage, and at the same time, it calls 82 kw less active power than the two-stage control strategy, so as to fully reduce the cost of voltage regulation.

5.4. Simulation Analysis of Real Power Grid

This paper takes the example analysis of a 110 kV distribution network in Gansu Province (a 278-node system). Gansu is a big province with new energy. With the continuous access of new energy, the over-voltage caused by power flow reverse transmission is also gradually prominent. The following figure shows the voltage variation at the end node when there is no control. With the continuous increase in photovoltaic power, the reverse power flow is formed in the line, resulting in serious over-voltage in the system, as shown in Figure 16.
The two-stage control strategy and the control strategy in this paper are used to compare and analyze the changes of photovoltaic reactive power and energy storage active power corresponding to the two schemes, as shown in Figure 17 and Figure 18.
The voltage curves of the two control schemes are basically the same, as shown in Figure 19. However, the control cost is different. The reactive power regulation cost of the inverter is CNY 0.067/(kvar·h), and the active power regulation cost of energy storage is CNY 0.6/kWh. The comprehensive sensitivity calculation shows that the cost of the two-stage control strategy and the control strategy in this paper are CNY 315,400 and CNY 112,600, respectively. The cost of the control strategy in this paper is only 35% of the traditional two-stage control cost.

6. Conclusions

Aiming at the problem that the current voltage control strategy takes insufficient consideration of the voltage control effect and regulation cost, the unit regulation cost of photovoltaic inverter and energy storage power is firstly studied, and then the voltage–cost sensitivity is proposed. The photovoltaic-storage system regulation resources are grouped, and according to the differences of each group of regulation resources, a multi-stage voltage control strategy based on grouping cooperation is proposed. The main conclusions are as follows:
(1)
The voltage control in this paper gives priority to the use of resources with high voltage sensitivity for voltage control. This index considers the unit regulation cost and power sensitivity of the regulation resources at the same time, and can achieve the best voltage control effect with the minimum regulation cost.
(2)
Compared with the traditional decentralized control strategy and two-phase control strategy, the least resources are called for and the lowest regulation cost is achieved without voltage overrun.

Author Contributions

Conceptualization, X.M. and R.J.; methodology, C.L.; software, R.X.; validation, X.M., R.J. and R.X.; formal analysis, R.X.; investigation, C.L.; resources, X.M.; data curation, X.M.; writing—original draft preparation, X.M.; writing—review and editing, R.J.; visualization, C.L.; supervision, R.X.; project administration, R.X.; funding acquisition, X.M. All authors have read and agreed to the published version of the manuscript.

Funding

This research was funded by the [Natural Science Foundation of Gansu Province] grant number [22JR11RA157] and the [State Grid Corporation of China headquarters science and technology project] grant number [52272223003C].

Data Availability Statement

The data presented in this study are available on request from the corresponding author due to (specify the reason for the restriction).

Conflicts of Interest

Authors Xiping Ma, Chen Liang and Rui Xu were employed by the company State Grid Gansu Electric Power Company. The remaining authors declare that the research was conducted in the absence of any commercial or financial relationships that could be construed as a potential conflict of interest.

References

  1. Chunguang, Y.; Xue, W.; Qichao, S.; Wu, H.; Zhu, Y. An Enhanced Power Allocation Strategy for Microgrids Considering Frequency and Voltage Restoration. Electronics 2024, 13, 1966. [Google Scholar] [CrossRef]
  2. Guo, Y.; Gao, H.; Wang, D.; Wu, Q. Online Optimal Feedback Voltage Control of Wind Farms: Decentralized and Asynchronous Implementations. IEEE Trans. Sustain. Energy 2021, 12, 1489–1492. [Google Scholar] [CrossRef]
  3. Zhang, Y.; Qian, W.; Shao, J.; Zhang, F.; Wang, L.; Hu, Q.; Li, W. Adaptive Voltage Reference Based Controls of Converter Power Sharing and Pilot Voltage in HVDC System for Large-Scale Offshore Wind Integration. IEEE Open Access J. Power Energy 2024, 11, 55–67. [Google Scholar] [CrossRef]
  4. Akekachai, P.; Tanakorn, K.; Chayakarn, S.; Pachapan, P.; Hinkkannen, M.; Somkun, S. Design and Implementation of Single-Phase Grid-Connected Low-Voltage Battery Inverter for Residential Applications. Electronics 2024, 13, 1014. [Google Scholar] [CrossRef]
  5. Maharjan, S.; Khambadkone, A.M.; Peng, J.C.-H. Robust Constrained Model Predictive Voltage Control in Active Distribution Networks. IEEE Trans. Sustain. Energy 2021, 12, 400–411. [Google Scholar] [CrossRef]
  6. Cheng, Z.; Wang, L.; Zeng, S.; Su, C.; Zhang, R.; Zhou, W. Partition-Global Dual-Layer Collaborative Voltage Control Strategy for Active Distribution Network With High Proportion of Renewable Energy. IEEE Access 2024, 12, 22546–22556. [Google Scholar] [CrossRef]
  7. Kou, P.; Liang, D.; Gao, R.; Liu, Y.; Gao, L. Decentralized Model Predictive Control of Hybrid Distribution Transformers for Voltage Regulation in Active Distribution Networks. IEEE Trans. Sustain. Energy 2020, 11, 2189–2200. [Google Scholar] [CrossRef]
  8. Liu, Q.; Wang, Y.; Wang, S.; Liang, D.; Zhao, Q.; Zhao, X. Voltage Regulation Strategy for DC Distribution Networks Based on Coordination of Centralized Control and Adaptive Droop Control. IEEE Trans. Power Deliv. 2022, 37, 3730–3739. [Google Scholar] [CrossRef]
  9. Gui, Y.; Nainar, K.; Bendtsen, J.D.; Diewald, N.; Iov, F.; Yang, Y.; Blaabjerg, F.; Xue, Y.; Liu, J.; Hong, T.; et al. Voltage Support With PV Inverters in Low-Voltage Distribution Networks: An Overview. IEEE J. Emerg. Sel. Top. Power Electron. 2024, 12, 1503–1522. [Google Scholar] [CrossRef]
  10. Zhang, B.; Tang, W.; Liang, J.; Zhang, L.; Zhao, C. EV Integration-Oriented DC Conversion of AC Low-Voltage Distribution Networks and the Associated Adaptive Control Strategy. IEEE Trans. Transp. Electrif. 2024, 10, 213–223. [Google Scholar] [CrossRef]
  11. Gerdroodbari, Y.Z.; Razzaghi, R.; Shahnia, F. Decentralized Control Strategy to Improve Fairness in Active Power Curtailment of PV Inverters in Low-Voltage Distribution Networks. IEEE Trans. Sustain. Energy 2021, 12, 2282–2292. [Google Scholar] [CrossRef]
  12. Kriukov, A.; Gavrilaş, M.; Ivanov, O.; Grigoraş, G.; Neagu, B.-C.; Scarlatache, F. Novel Decentralized Voltage-Centered EV Charging Control Algorithm Using DSRC System in Low Voltage Distribution Networks. IEEE Access 2021, 9, 164779–164800. [Google Scholar] [CrossRef]
  13. Alzaareer, K.; Saad, M.; Mehrjerdi, H.; Asber, D.; Lefebvre, S. Development of New Identification Method for Global Group of Controls for Online Coordinated Voltage Control in Active Distribution Networks. IEEE Trans. Smart Grid 2020, 11, 3921–3931. [Google Scholar] [CrossRef]
  14. Wang, Y.; Syed, M.H.; Guillo-Sansano, E.; Xu, Y.; Burt, G.M. Inverter-Based Voltage Control of Distribution Networks: A Three-Level Coordinated Method and Power Hardware-in-the-Loop Validation. IEEE Trans. Sustain. Energy 2019, 11, 2380–2391. [Google Scholar] [CrossRef]
  15. Nguyen, H.M.; Torres, J.L.R.; Lekić, A.; Pham, H.V. MPC Based Centralized Voltage and Reactive Power Control for Active Distribution Networks. IEEE Trans. Energy Convers. 2021, 36, 1537–1547. [Google Scholar] [CrossRef]
  16. Mudaliyar, S.; Mishra, S. Real-Time Coordinated Control of Low-Voltage DC Distribution Network With Soft Opening Point. IEEE Trans. Power Electron. 2021, 36, 7123–7137. [Google Scholar] [CrossRef]
  17. Xu, X.; Li, Y.; Yan, Z.; Ma, H.; Shahidehpour, M. Hierarchical Central-Local Inverter-Based Voltage Control in Distribution Networks Considering Stochastic PV Power Admissible Range. IEEE Trans. Smart Grid 2023, 14, 1868–1879. [Google Scholar] [CrossRef]
  18. Su, T.; Zhao, J.; Pei, Y.; Ding, F. Probabilistic Physics-Informed Graph Convolutional Network for Active Distribution System Voltage Prediction. IEEE Trans. Power Syst. 2023, 38, 5969–5972. [Google Scholar] [CrossRef]
  19. Huo, Y.; Li, P.; Ji, H.; Yu, H.; Yan, J.; Wu, J.; Wang, C. Data-Driven Coordinated Voltage Control Method of Distribution Networks with High DG Penetration. IEEE Trans. Power Syst. 2023, 38, 1543–1557. [Google Scholar] [CrossRef]
  20. Li, Y.; Lu, C.; Tang, Y.; Fang, C.; Cui, Y. Dynamic Control and Time-Delayed Channel Scheduling Co-Design for Voltage Control in Active Distribution Networks. IEEE Trans. Smart Grid 2024, 15, 1837–1848. [Google Scholar] [CrossRef]
  21. Dutta, A.; Ganguly, S.; Kumar, C. Coordinated Volt/Var Control of PV and EV Interfaced Active Distribution Networks Based on Dual-Stage Model Predictive Control. IEEE Syst. J. 2022, 16, 4291–4300. [Google Scholar] [CrossRef]
Figure 1. Structure of a typical radial distribution network.
Electronics 13 03415 g001
Figure 2. Current distribution of distribution network feeder lines.
Electronics 13 03415 g002
Figure 3. Uniform current distribution.
Electronics 13 03415 g003
Figure 4. Current distribution during discharge of photovoltaic-storage system.
Electronics 13 03415 g004
Figure 5. Current distribution during charge of photovoltaic-storage system.
Electronics 13 03415 g005
Figure 6. Schematic of distribution network structure and distribution of photovoltaic-storage system.
Electronics 13 03415 g006
Figure 7. Installed capacity of PV vs. peak load power.
Electronics 13 03415 g007
Figure 8. Typical daily power of total PV and load in the system.
Electronics 13 03415 g008
Figure 9. Node voltage without control.
Electronics 13 03415 g009
Figure 10. PV inverter reactive power.
Electronics 13 03415 g010
Figure 11. Energy storage active power.
Electronics 13 03415 g011
Figure 12. Voltage comparison before and after control.
Electronics 13 03415 g012
Figure 13. Voltage regulation cost.
Electronics 13 03415 g013
Figure 14. Comparison of control results under the 3 strategies.
Electronics 13 03415 g014
Figure 15. Cumulative cost of voltage regulation under 3 control strategies.
Electronics 13 03415 g015
Figure 16. Voltage of terminal node without control.
Electronics 13 03415 g016
Figure 17. Regulation results under two-stage control strategy.
Electronics 13 03415 g017
Figure 18. The photovoltaic and energy storage power under the control strategy in this paper.
Electronics 13 03415 g018aElectronics 13 03415 g018b
Figure 19. Voltage curve after control.
Electronics 13 03415 g019
Table 1. Relationship between voltage loss and position.
SceneConditionsVoltage Loss Trends
Peak period 0 < x x 1 I B > N 1 /Down
I B N 1 0 < x I B N 1 M 1 Rising
I B N 1 M 1 < x x 1 Down
x 1 < x < 1 0 < N 1 M 1 x 1 /Down
x 1 < N 1 M 1 1 x 1 < x N 1 M 1 Rising
N 1 M 1 < x 1 Down
1 < N 1 M 1 /Rising
valley period 0 < x x 1 I B + N 2 M 2 > x 1 /Down
I B + N 2 M 2 x 1 0 < x I B + N 2 M 2 Rising
I B + N 2 M 2 < x x 1 Down
x 1 < x < 1 N 1 M 1 x 1 /Down
x 1 < N 1 M 1 1 x 1 < x N 1 M 1 Rising
N 1 M 1 < x 1 Down
1 < N 1 M 1 /Rising
Table 2. Regulatory direction of control resources.
Voltage Overrun TypeControl Nodes
Positive SensitivityNegative Sensitivity
Voltage exceeds the upper limitDownward adjustmentsUpward adjustments
Voltage exceeds the lower limitUpward adjustmentsDownward adjustments
Table 3. Over-voltage node table.
Node NumberMaximum VoltageNode NumberMaximum Voltage
Node 181.098Node 151.077
Node 331.073Node 161.082
Node 131.070Node 171.091
Node 141.073Node 251.074
Table 4. The regulation capacity of various resources and the voltage–cost sensitivity unit of measurement: kW/Var, p.u./ten-thousand-yuan.
GroupingResource NumberAdjustable Capacity S C j r GroupingResource NumberAdjustable Capacity S C j r
BNode
18
Energy storage active power300.7721CNode
20
Energy storage active power00
Photovoltaic reactive power250.8573Photovoltaic reactive power300.2954
BNode
16
Energy storage active power00CNode
24
Energy storage active power00
Photovoltaic reactive power400.7435Photovoltaic reactive power100.2877
BNode
10
Energy storage active power200.7006CNode
17
Energy storage active power00
Photovoltaic reactive power400.7106Photovoltaic reactive power350.2567
BNode
33
Energy storage active power100.6854CNode
31
Energy storage active power00
Photovoltaic reactive power200.6908Photovoltaic reactive power380.2139
CNode
25
Energy storage active power00CNode
32
Energy storage active power00
Photovoltaic reactive power400.3544Photovoltaic reactive power550.2091
CNode
21
Energy storage active power00CNode
28
Energy storage active power00
Photovoltaic reactive power300.3106Photovoltaic reactive power500.1583
Note: the resources in group A include the reactive power of all energy storage and the active power of photovoltaic, which will not be displayed due to its small capacity.
Disclaimer/Publisher’s Note: The statements, opinions and data contained in all publications are solely those of the individual author(s) and contributor(s) and not of MDPI and/or the editor(s). MDPI and/or the editor(s) disclaim responsibility for any injury to people or property resulting from any ideas, methods, instructions or products referred to in the content.

