
Encouraging the Submission of Information by Reducing Confirming Costs

Abstract
:1. Introduction
2. Related Works
3. Model
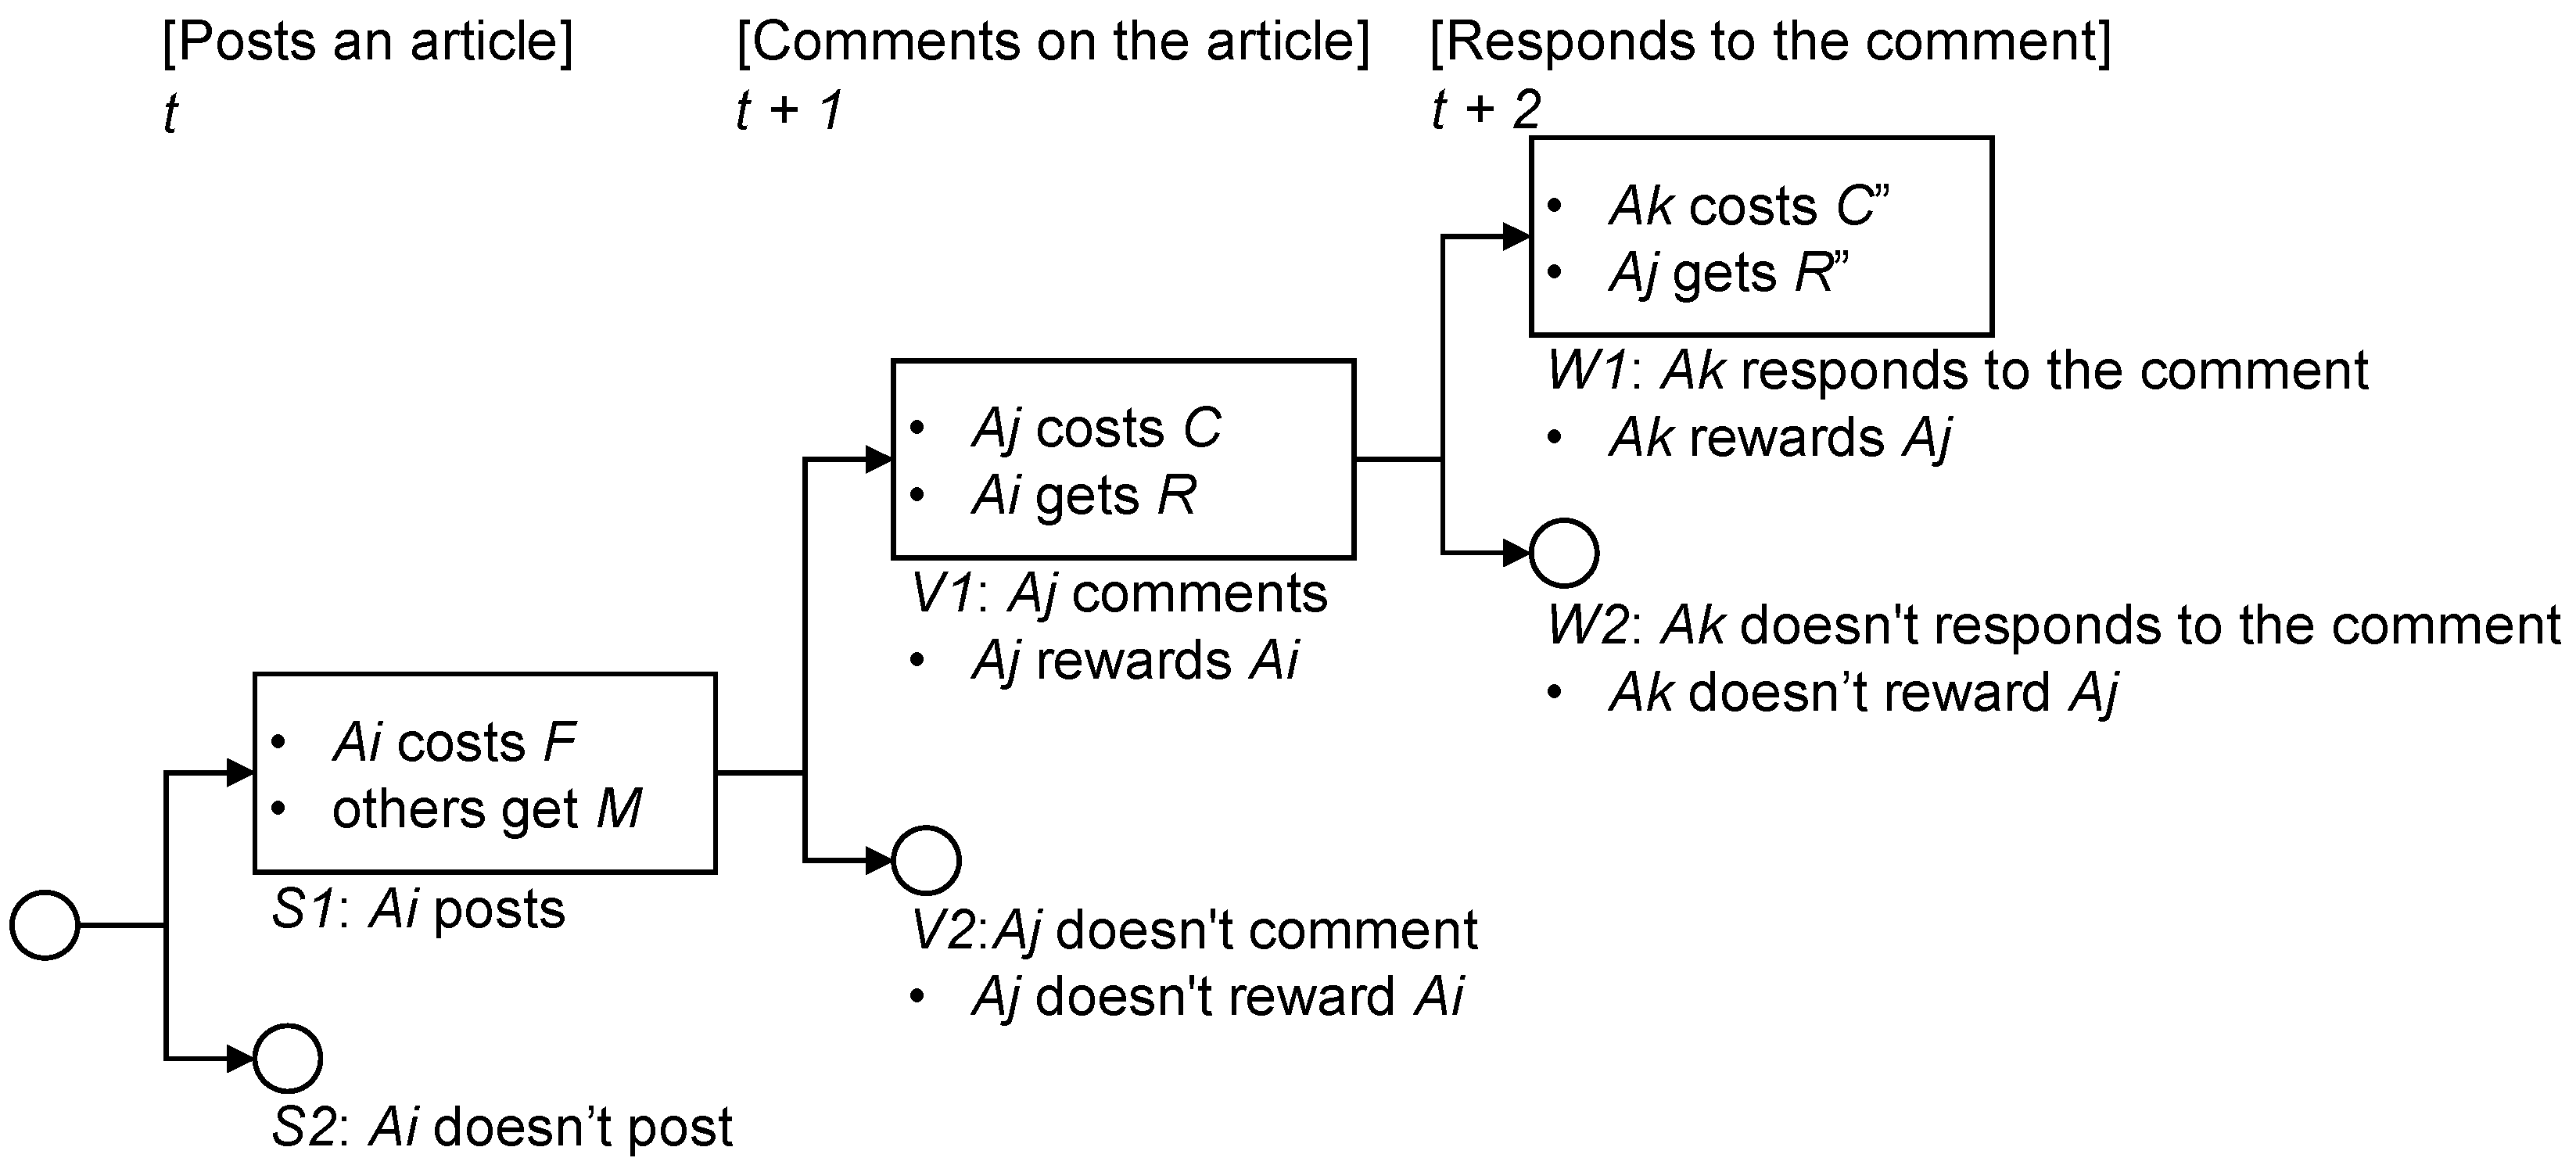
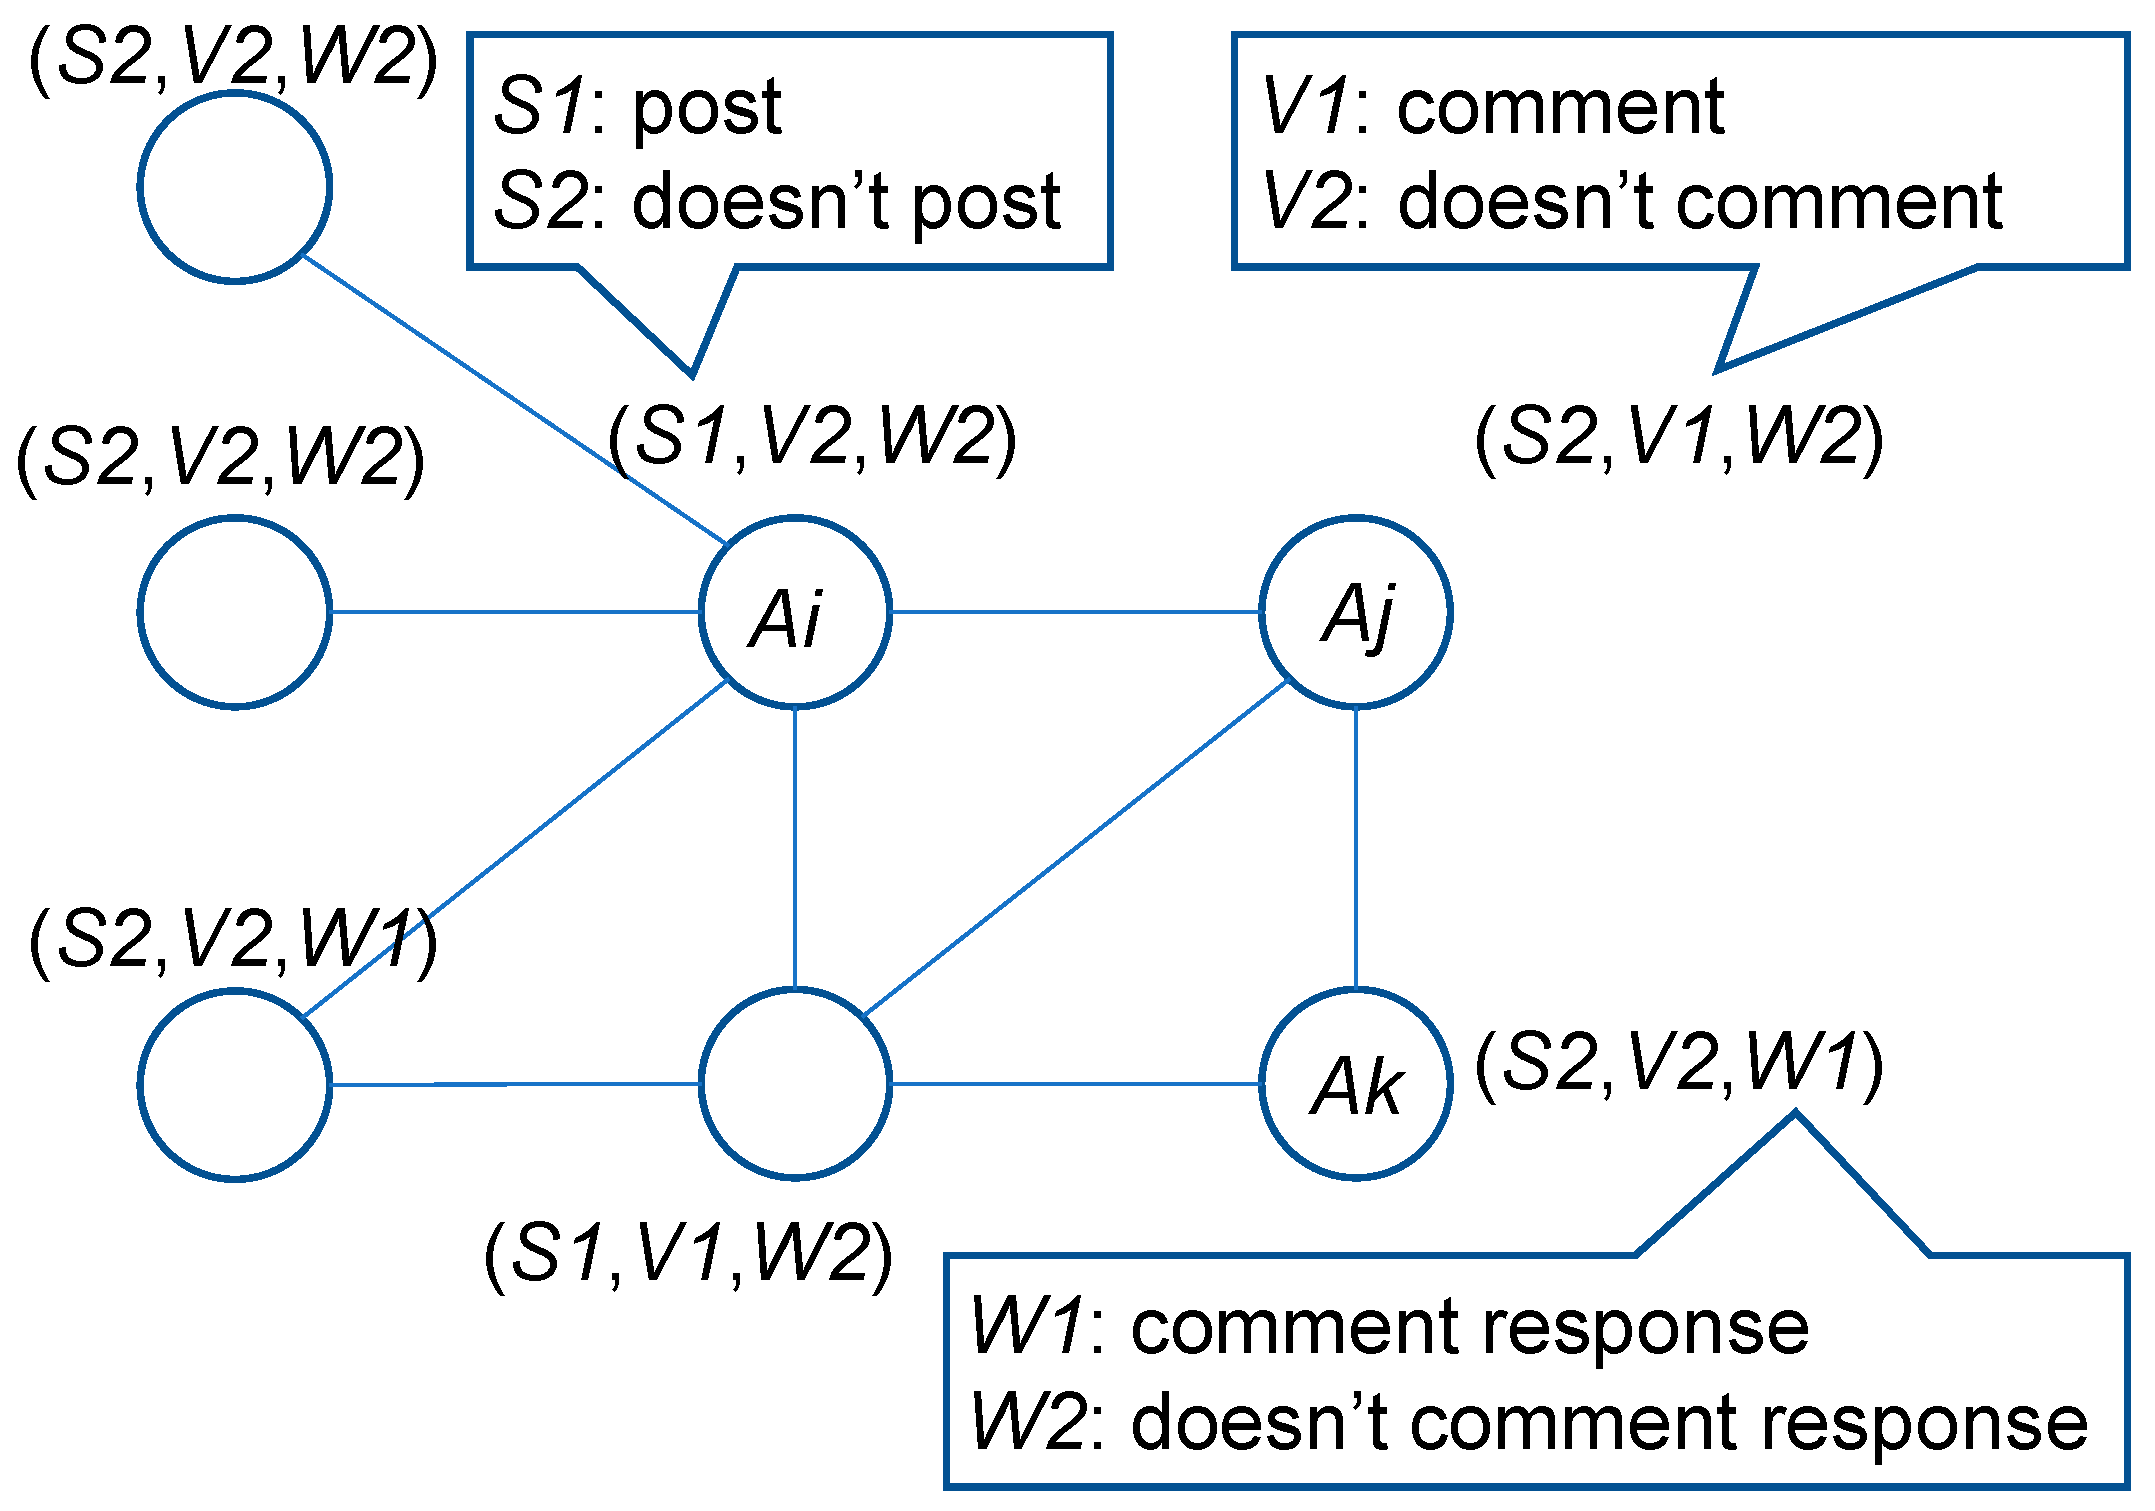
3.1. Framework of a Meta-Reward Game
| Ui (S1) = M − F, | |
| Ui (S2) = M, | |
| if Aj comments, | Uj (V1) = −C, Ui (S1) = Ui (S1) + R, |
| if Aj does not comment, | Uj (V2) = 0, |
| if Aj does not comment and Ak responds to a comment, | Uk (W1) = −C″, Uj (V1)= Uj (V1) + R″, |
| if Aj does not comment and Ak does not respond to a comment, | Uk (W2) = 0 |
Ui (4l, S2) = M Nis
Ui (4l, V2) = 0
Ui (4l, W2) = 0
3.2. Best Response Rule
3.2.1. When Costs F, C, and C″ Are Positive
3.2.2. When Cost F, C, and C″ Are Zero and Reward M, R, and R″ Are Positive
4. Simulation Settings
4.1. Social Network
4.2. Complete Graph
4.3. Local Network
4.4. Complex Network
5. Simulation Results
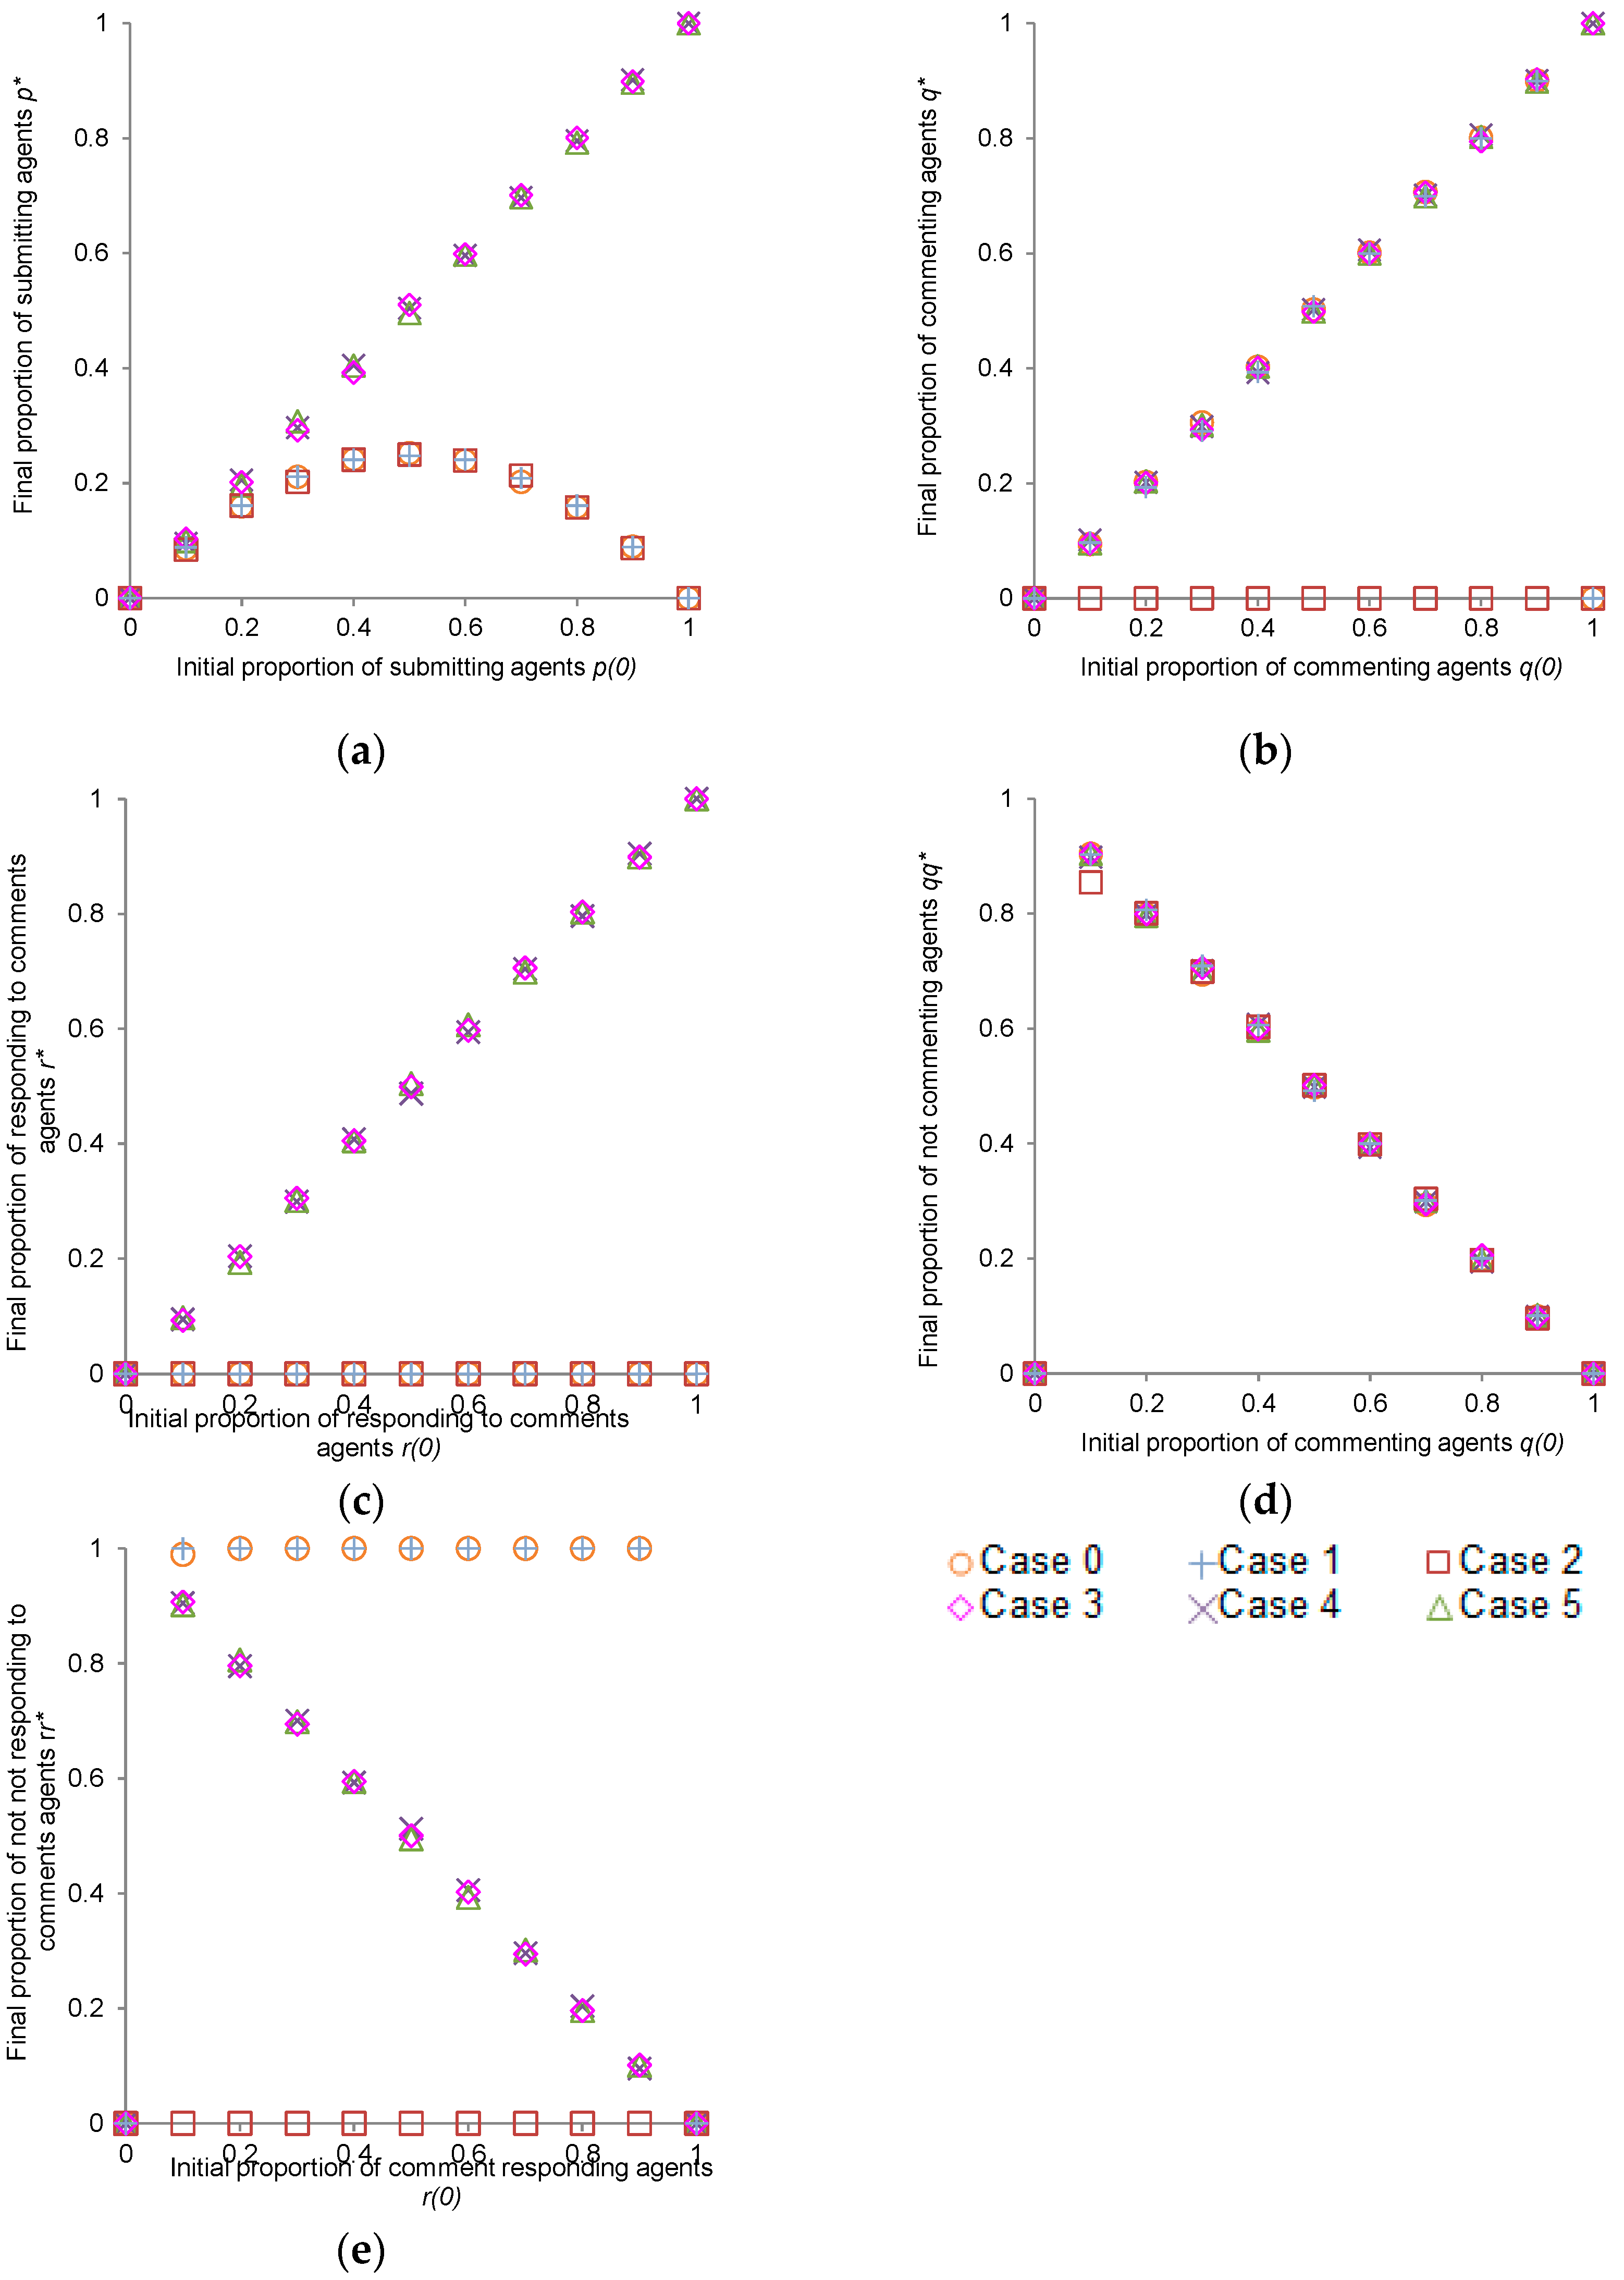
5.1. Complete Graph
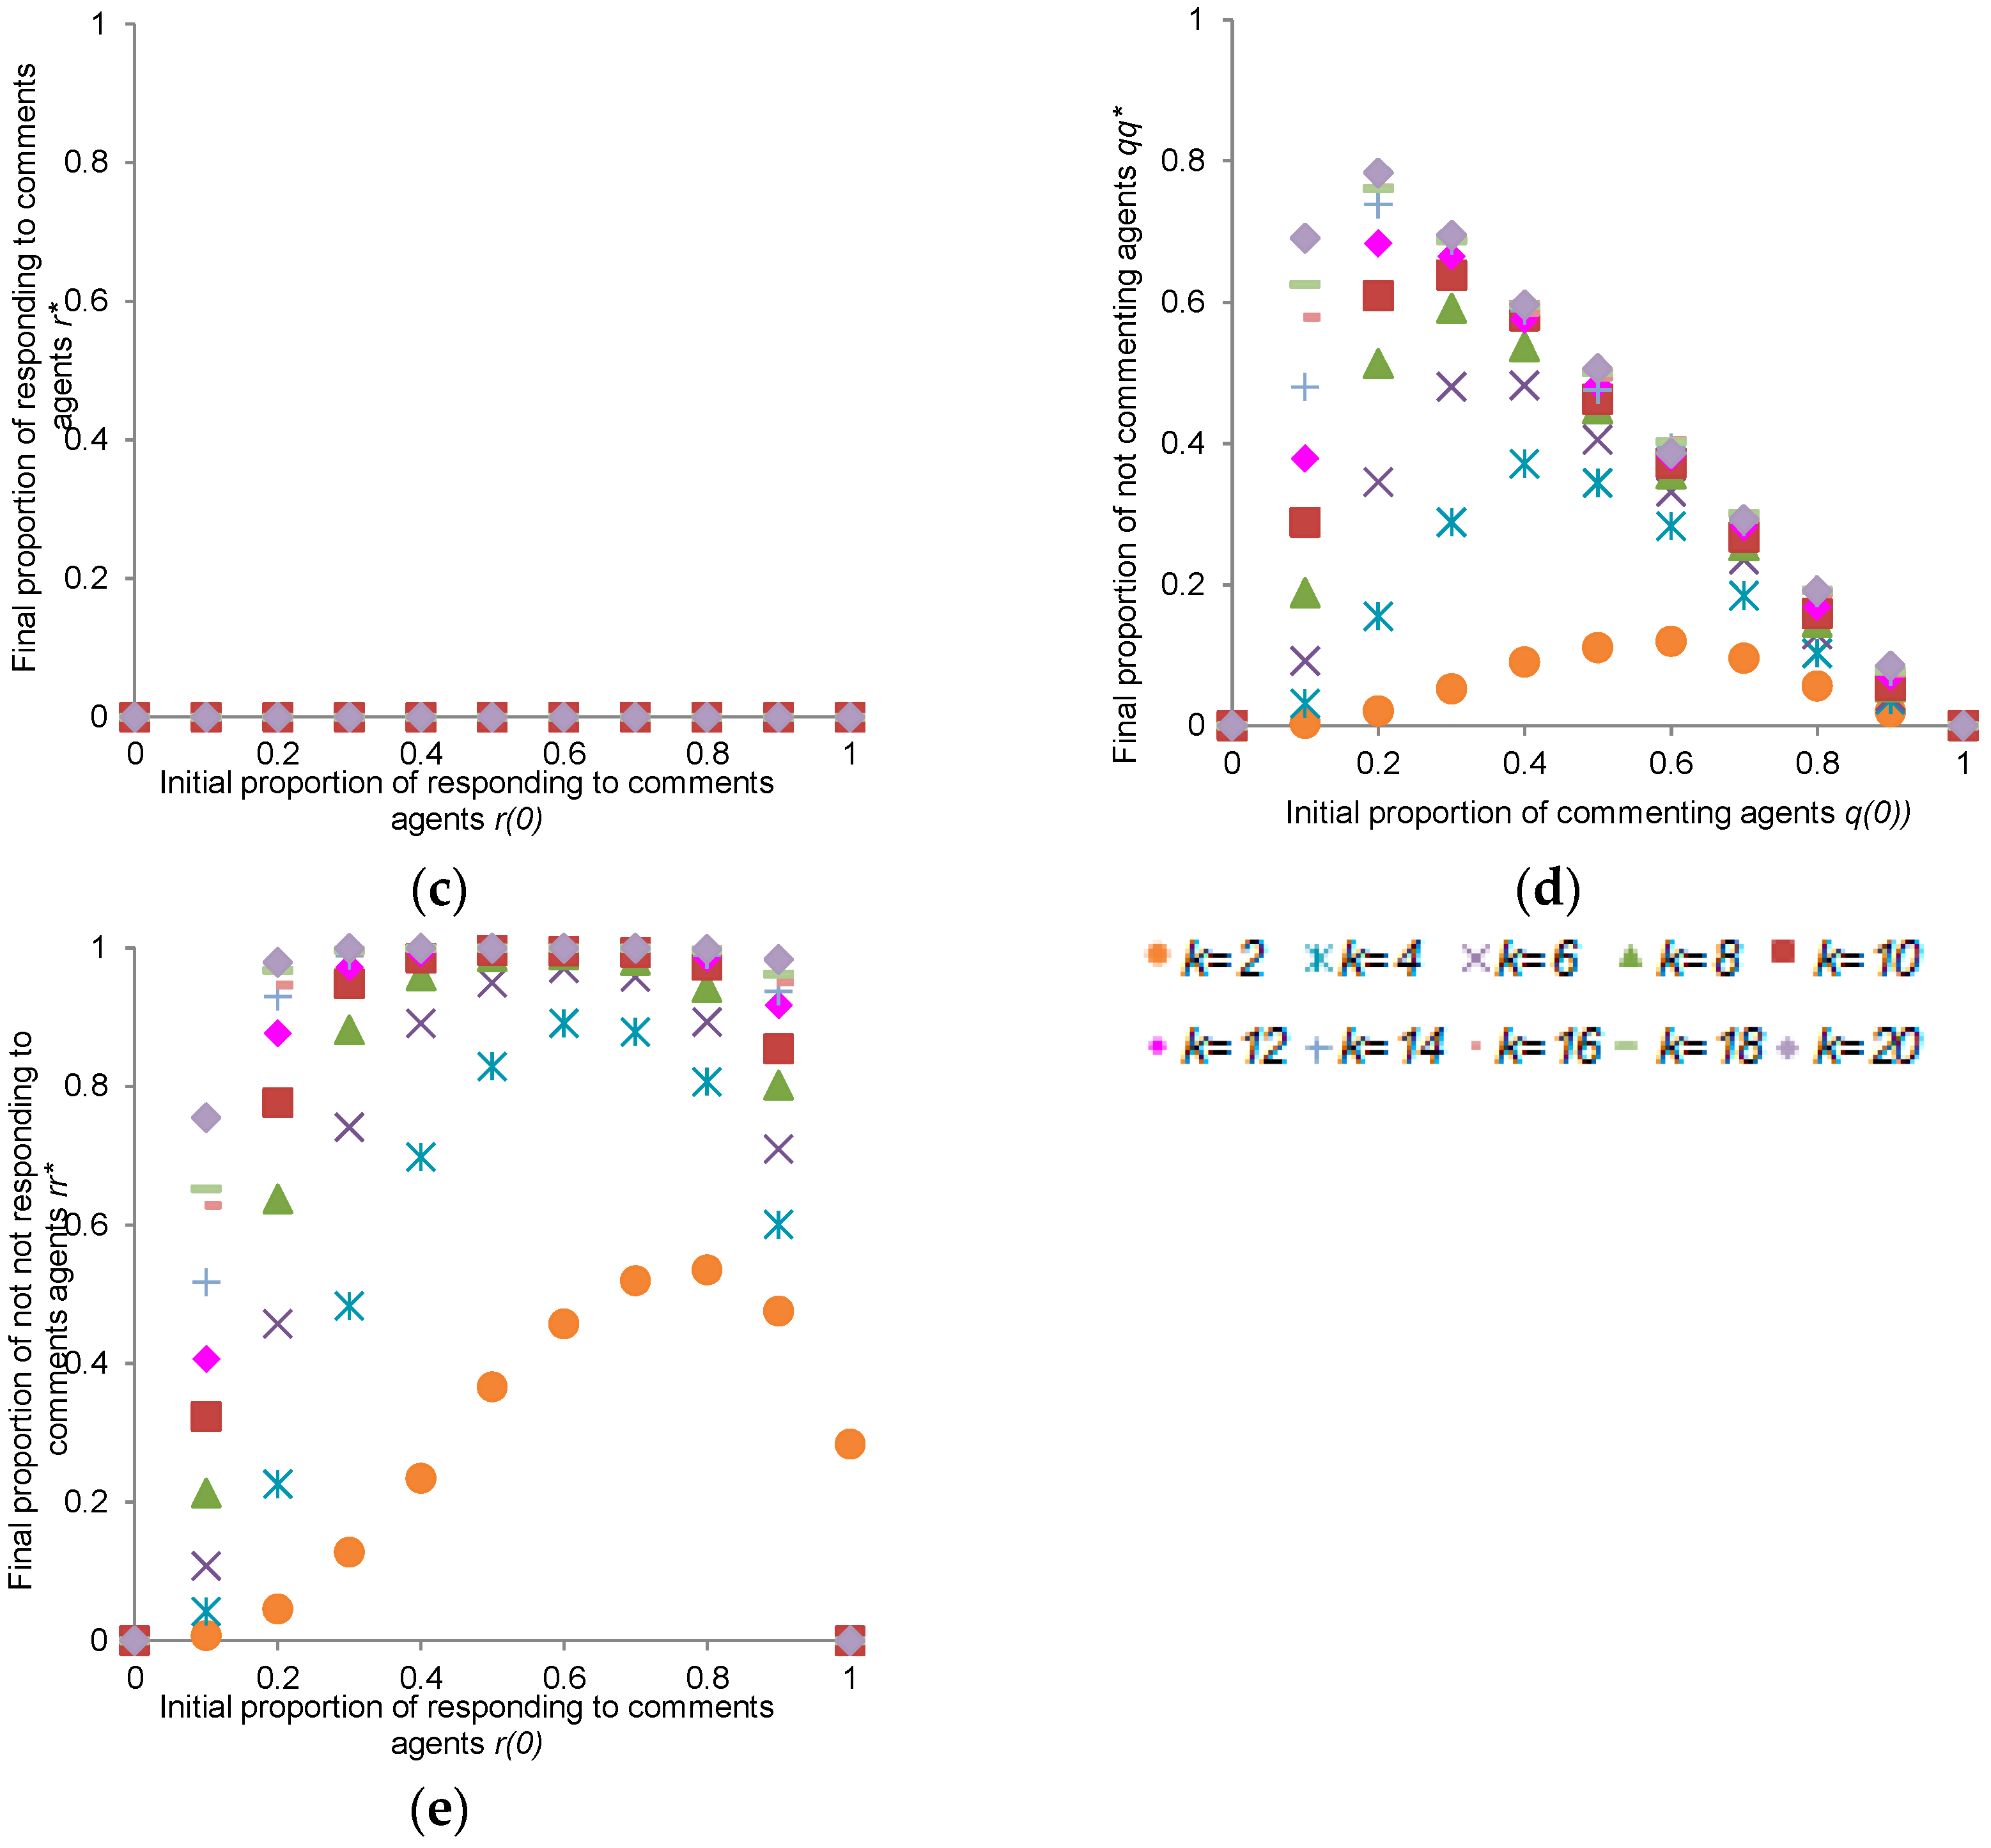
5.2. Local Network
5.3. Complex Network
6. Discussion
6.1. Regarding Social Network
6.2. Previous Study
6.3. Practical Application
7. Conclusions and Possible Future Work
Author Contributions
Funding
Data Availability Statement
Conflicts of Interest
References
- Allport, G.W.; Postman, L. The Psychology of Rumor; Henry Holt and Company: New York, NY, USA, 1947. [Google Scholar]
- Sekiya, N. Disaster Information and Social Psychology: Lessons from the Great East Japan Earthquake; The University of Tokyo Press: Tokyo, Japan, 2021. (In Japanese) [Google Scholar]
- Miyabe, M.; Umejima, A.; Nadamoto, A.; Aramaki, E. Characteristic analysis of rumor and correction texts on microblog. Trans. IPSJ 2013, 54, 223–236. (In Japanese) [Google Scholar]
- Takayasu, M.; Sato, K.; Sano, Y.; Yamada, K.; Miura, W.; Takayasu, H. Rumor diffusion and convergence during the 3.11 earthquake: A Twitter case study. PLoS ONE 2015, 10, e0121443. [Google Scholar] [CrossRef] [PubMed]
- Toriumi, F.; Yamamoto, H.; Okada, I. Why Do People Use Social Media? Agent-Based Simulation and Population Dynamics Analysis of the Evolution of Cooperation in Social Media. In Proceedings of the 2012 IEEE/WIC/ACM International Conferences on Web Intelligence and Intelligent Agent Technology, Macau, China, 4–7 December 2012; pp. 43–50. [Google Scholar]
- Shibutani, T. Improvised News: A Sociological Study of Rumor; The Bobbs-Merrill Company Inc.: Indianapolis, IN, USA, 1966. [Google Scholar]
- Razaque, A.; Rizvi, A.; Jaro khan, M.; Almiani, M.; Rahayfeh, A.A. State-of-art review of information diffusion models and their impact on social network vulnerabilities. J. King Saud Univ.-Comput. Inf. Sci. 2022, 34, 1275–1294. [Google Scholar] [CrossRef] [PubMed]
- Meel, P.; Vishwakarma, D.K. Fake news, rumor, information pollution in social media and web: A contemporary survey of state of-the-arts, challenges and opportunities. Expert Syst. Appl. 2020, 153, 112986. [Google Scholar] [CrossRef]
- Mendoza, M.; Poblete, B.; Castillo, C. Twitter under crisis: Can we trust what we RT? In Proceedings of the First Workshop on Social Media Analytics, Washington, DC, USA, 25–28 July 2010; pp. 71–79. [Google Scholar]
- Chua, A.Y.K.; Cheah, S.-M.; Goh, D.H.; Lim, E.-P. Collective Rumor Correction on the Death Hoax of a Political Figure in Social Media. In Proceedings of the Pacific Asia Conference on Information Systems, Chiayi, Taiwan, 27 June–1 July 2016. [Google Scholar]
- Vosoughi, S.; Roy, D.; Aral, S. The spread of true and false news online. Science 2018, 359, 1146–1151. [Google Scholar] [CrossRef] [PubMed]
- Luna, S.; Pennock, M.J. Social media applications and emergency management: A literature review and research agenda. Int. J. Disaster Risk Reduct. 2018, 28, 565–577. [Google Scholar] [CrossRef]
- Hughes, A.L.; Palen, L.; Peterson, S. Social media and emergency management. In Critical Issues in Disaster Science and Management; FEMA Higher Education Project: Emmitsburg, MD, USA, 2014; pp. 349–392. [Google Scholar]
- Wardle, C.; Derakhshan, H. Information Disorder: Toward an Interdisciplinary Framework for Research and Policymaking; Council of Europe: Strasbourg, France, 2017. [Google Scholar]
- Palen, L.; Vieweg, S.; Anderson, K.M. Supporting “Everyday analysts” in safety- and time-critical situations. Inf. Soc. 2011, 27, 52–62. [Google Scholar] [CrossRef]
- Simon, H. The Sciences of the Artificial, 3rd ed.; MIT Press: Cambridge, MA, USA, 1996. [Google Scholar]
- Internet Use. Available online: https://www.itu.int/itu-d/reports/statistics/2023/10/10/ff23-internet-use/ (accessed on 20 August 2024).
- Agarwal, P.; Aziz, R.A.; Zhuang, J. Interplay of rumor propagation and clarification on social media during crisis events—A game-theoretic approach. Eur. J. Oper. Res. 2022, 298, 714–733. [Google Scholar] [CrossRef]
- Kubo, M.; Sato, H.; Iwanaga, S.; Yamaguchi, A. Preventing the diffusion of disinformation on disaster sns by collective debunking with penalties. J. Robot. Mechatron. 2024, 36, 555–567. [Google Scholar] [CrossRef]
- Miura, A.; Kawaura, Y. Why do people join web-based knowledge-sharing communities? Analysis on questioning and answering behaviors. Jpn. J. Soc. Psychol. 2008, 23, 233–245. (In Japanese) [Google Scholar]
- Osaka, K.; Hirahara, Y.; Toriumi, F.; Sugawara, T. The evolution of cooperation in social media where direct reciprocity works. IPSJ SIG Tech. Rep. 2015, 2015-ICS-178, 1–7. (In Japanese) [Google Scholar]
- Hirahara, Y.; Toriumi, F.; Sugawara, T. Cooperation-dominant situations in meta-rewards games on WS- and BA-model networks. Jpn. Soc. Softw. Sci. Technol. 2014, 31, 211–221. (In Japanese) [Google Scholar]
- Neumann, V.J.; Morgenstern, O. Theory of Games and Economic Behavior; Princeton University Press: Princeton, NJ, USA, 1944. [Google Scholar]
- Nowak, M.; Sigmund, K. Evolution of indirect reciprocity by image scoring. Nature 1998, 393, 573–577. [Google Scholar] [CrossRef] [PubMed]
- Axelrod, R. An evolutionary approach to norms. Am. Political Sci. Rev. 1986, 80, 1095–1111. [Google Scholar] [CrossRef]
- Kawachi, Y.; Murata, K.; Yoshii, S.; Kakazu, Y. The Structural Phase Transition among Fixed Cardinal Networks. In Proceedings of the 7th Asia-Pacific Complex Systems Conference, Cairns, Australia, 6–10 December 2004; pp. 247–255. [Google Scholar]
- Iwanaga, S.; Namatame, A. Collective behavior and diverse social network. Int. J. Adv. Comput. Technol. 2012, 4, 320–321. [Google Scholar]
- Iwanaga, S.; Namatame, A. Hub agents determine collective behavior. New Math. Nat. Comput. 2015, 11, 165–181. [Google Scholar] [CrossRef]


| T | 1 | 2 | 3 | 4 | 5 | 6 | 7 | 8 |
|---|---|---|---|---|---|---|---|---|
| Action | S1/S2 | V1/V2 | W1/W2 | * | S1/S2 | V1/V2 | W1/W2 | * |
| Case | When Submitting | When Commenting or Responding to Comments | Type | ||
|---|---|---|---|---|---|
| Cost F | Benefit M | Cost C | Reward R | ||
| 0 | 3 | 1 | 2 | 9 | X |
| 1 | 0 | 1 | 2 | 9 | |
| 2 | 3 | 1 | 2 | 0 | Y |
| 3 | 3 | 1 | 0 | 0 | Z |
| 4 | 3 | 1 | 0 | 9 | |
| 5 | 0 | 1 | 0 | 9 | |
| Small World | Scale Free | |
|---|---|---|
| Probability, | 0.01 | 1.0 |
| Times, | 3 | 20 |
| Standardized clustering coefficient | 0.99 | 0.11 |
| Standardized characteristic path length | 0.21 |
Disclaimer/Publisher’s Note: The statements, opinions and data contained in all publications are solely those of the individual author(s) and contributor(s) and not of MDPI and/or the editor(s). MDPI and/or the editor(s) disclaim responsibility for any injury to people or property resulting from any ideas, methods, instructions or products referred to in the content. |
© 2024 by the authors. Licensee MDPI, Basel, Switzerland. This article is an open access article distributed under the terms and conditions of the Creative Commons Attribution (CC BY) license (https://creativecommons.org/licenses/by/4.0/).
Share and Cite
Iwanaga, S.; Kubo, M.; Sato, H. Encouraging the Submission of Information by Reducing Confirming Costs. Electronics 2024, 13, 3495. https://doi.org/10.3390/electronics13173495
Iwanaga S, Kubo M, Sato H. Encouraging the Submission of Information by Reducing Confirming Costs. Electronics. 2024; 13(17):3495. https://doi.org/10.3390/electronics13173495
Chicago/Turabian StyleIwanaga, Saori, Masao Kubo, and Hiroshi Sato. 2024. "Encouraging the Submission of Information by Reducing Confirming Costs" Electronics 13, no. 17: 3495. https://doi.org/10.3390/electronics13173495