Article

Station for Tuning and Testing Digital Twin in Hydraulic Actuator Control Systems under Programmable Load—Methodology, Design, and Tests

by
Grzegorz Ćwikła
* and
Mirosław Szewczyk
Faculty of Mechanical Engineering, Silesian University of Technology, Konarskiego 18A, 44-100 Gliwice, Poland
*
Author to whom correspondence should be addressed.
Electronics 2024, 13(17), 3528; https://doi.org/10.3390/electronics13173528
Submission received: 5 August 2024 / Revised: 30 August 2024 / Accepted: 2 September 2024 / Published: 5 September 2024

Abstract

:
This article presents the methodology and process of the modeling, designing, and testing of a research station enabling the identification, tuning, and verification of Digital Twin (DT) in control systems in power hydraulics. The concept of the station is presented, the main part of which is a subsystem forcing a dynamic, variable load using a hydraulic actuator controlled by a proportional valve, together with data acquisition and processing systems and software. The load application subsystem can subject the tested power hydraulic system, usually consisting of an actuator with its own control system, to controlled dynamic loads, which allows for the determination of its characteristics and tuning of the DT. This article describes the electro-hydraulic elements used to adjust the position of the actuators and the designed hydraulic and electrical diagrams of the station. The process of identifying, modeling, and selecting a controller for a subsystem simulating an external load is presented. The test station is built and tested. The identification, modeling, and tuning of DTs, for example, actuators and controllers, are described. A satisfactory convergence of the simulation and modeling results with the operation of the real system is achieved, which allows the obtaining of a reliable DT for actuator control systems operating under variable load.

1. Introduction

The contemporary market characterized by high competitiveness forces manufacturers, among others, to shorten the time of product implementation and ensure their optimal efficiency and quality, which can be achieved by digitizing the design, production, and operation of devices [1]. Digital Twin (DT) is one of the key technologies included in the concept of Industry 4.0 and is generally defined as a virtual computer representation of a physical system. DT was initially used in the aviation and space industry; in the literature on DT, the focus was on the model itself and high-accuracy simulation; later, the importance of direct and bidirectional mapping between the model and the physical object was emphasized [2]. The main effects that can be obtained thanks to DT are the analysis of the machine or system condition in order to plan maintenance activities, management of the entire life cycle of a physical object, and optimization of the system or process operation by supporting decision making.
With the currently adopted, very broad definition of DT, its varieties were inevitable, depending, among other things, on the type of reflected system and the nature of the connection between the virtual model and the physical system. Usually, Digital Twins of parts, products, systems, or processes are distinguished [2]. Other classifications postulate the distinction between product, production, and performance twins. In the article [3], the issue of naming the level of integration of the virtual system with the physical one was detailed, taking into account the type of connection and the directions of data flow—a division into Digital Model—DM (the flow of information in both directions is manual), Digital Shadow—DS (automatic data flow from the physical object to the digital model, manual flow in the opposite direction), and Digital Twin (automatic data flow in both directions, the digital model can control the behavior of the physical object within the given limits). This classification is extended and detailed in [1]. A meta-analysis of articles on DT shows that what is declared as DT, in fact, only meets the criteria for DM or DS [2].
DT must be able to receive and process large amounts of data from various sources. DT is the implementation of the Cyber-Physical Systems concept, proposed as smart embedded systems within production systems, which are to operate at the virtual and physical level, interacting and controlling physical devices and processes thanks to a network of sensors and controllers together with software, using Big Data technology and artificial intelligence [4]. Digital Twin allows for the closed-loop optimization of objects or processes with which it cooperates; a physical object should respond to signals from the environment in an optimized way thanks to analysis and simulation in its virtual counterpart [1].
Power hydraulic systems are used in many industrial installations and systems. Thanks to the introduction of electric or electronic control, there are many opportunities to implement modern systems that combine the advantages of both hydraulics and electronics, allowing easy introduction of increasingly advanced control strategies. Typically, the hydraulic cylinder is the main element of electro-hydraulic systems; it is a device that drives linear movement to machines and is able to move or hold positions with significant force. Positioning the hydraulic actuator is intended to control and maintain the actuator piston in the desired position. Therefore, this is a control task in which the input signal is the flow rate of the working fluid and the output signal is the current position of the actuator. The speed of movement of the actuator piston is directly tied to the flow rate of the liquid supplied to the actuator chamber [5]. Therefore, the liquid flow rate can be directly controlled by the piston speed, which is the time differential of the displacement. This complicates the positioning task. However, in practice, the best solution to this type of problem is to apply feedback on the position of the actuator piston rod and use it to continuously control the flow rate [6,7,8].

1.1. Control of Electro-Hydraulic Positioning Systems

Typical basic flow direction control valves, commonly called hydraulic distributors, allow control of the flow rate through discrete control [9,10]. They have a specific number of slider position states, which corresponds to directing the hydraulic fluid to one of the ports supplying the actuator or cutting off the flow from these ports. There are papers in which the authors decided to perform the positioning task using discrete valves, e.g., [11,12]. However, they do not allow for controlling the liquid flow rate. Devices that are suitable for such tasks are flow servo valves or proportional valves [13,14]. They convert a low-power analog input signal into a strong proportional output signal in the form of a flow rate. To obtain a high amplification factor, an electrical signal is used as the input signal. Devices that accomplish this are electro-hydraulic amplifiers. Servo valves, compared to proportional valves, are characterized by a lower hysteresis of static characteristics and better dynamic properties [15,16].
Servo valves can be used to perform the positioning task but the problem of choosing a control strategy remains. Much research has been conducted to answer the question of how to control such hydraulic systems [17,18]. The article [19] presents a critical overview of some positioning methods, using various solutions in terms of the electro-hydraulic elements used and the control strategy. Many works also focus on simulating the operation of such systems, which is an introduction to laboratory tests [20,21,22]. The paper [23] contains only the identification and simulation of a proportional valve while in [24,25], authors focused on modeling the control of the system using a servo valve, as well as conducting verification experiments. Gao et al. [26] also used a servo valve and simulated the system that implements the ADRC (Active Disturbance Rejection Controller). Another example is [27], where a system with a proportional valve and controllers (PID (proportional–integral–derivative), fuzzy, and fuzzyPID) was modeled. Then, the results of the controllers’ operation were compared.
Schwarz and Lohman in [28] conducted the identification of control systems for mobile hydraulic systems with four valves, where the non-linearities of components must be taken into account, making decisions despite the insufficient number of sensors. Robust identification and model-based control were applied. On the basis of the identified model, two modern controllers were presented and compared with a PID controller, taking into account active damping.
In [29], a control strategy of an electro-hydraulic system is presented, which is implemented using a fuzzy logic controller, where parameters are optimized using particle swarm optimization (PSO). A similar approach was presented in [30], which discussed a proportional valve, a fuzzy controller, and particle swarm optimization (PSO). The paper [31] presents an electro-hydraulic control system for the synchronization of the position of two servo-valve-hydraulic actuator systems. This control system is designed based on auto-interference cancelation and feedback control, in which an auto-interference removal controller (ADRC) is used in the speed loop. The simulation results indicate that the designed control system is characterized by the high precision of synchronous control of the object.
There are also works that focus on an experimental approach without computer simulation of systems. Paper [32] focuses on the task of positioning an actuator using a hydraulic servo valve. In addition, there are papers that do not use the above-mentioned flow control valves (proportional valves or servo valves) as a control element but propose other, more original controls. Zheng et al. [33] proposes controlling the actuator piston directly by controlling the speed of the motor driving the pump in the hydraulic system. Article [34] proposes actuator control using four independent proportional throttle valves.
An interesting issue is also the simultaneous control of many positioning systems to obtain a given position of the platform or a specific movement, for example, a robot [35,36,37,38]. Recognizing and compensating for the impact of disturbances on the positioning of hydraulic control systems is also very important because it allows the design of systems that are resistant to accidental disturbances that occur during the normal operation of machines [39,40,41,42,43].
Various approaches to mitigating the influence of disturbances on the control of the electro-hydraulic system can be found in many articles; for example, in [44], a disturbance observer is implemented and used to control the electro-hydraulic servo system, starting from a non-linear mathematical model, which allows one to obtain stable behavior of the system. In [45], a high-performance motion control method of a dual-valve system is proposed with parameter and model uncertainties, also based on disturbance observer, in which a dual-valve fault system model (DFSM) is constructed and experimentally tested. Global Fast Terminal Sliding-Mode Active Disturbance Rejection Control (GFTSMADRC) is proposed in [46] as a control method for complex non-linear systems with a single structural controller, based on the Lyapunov stability theorem.
Electrohydraulic car suspensions are also an example of systems where there is a need to control multiple actuators subjected to disturbances resulting from driving on random terrain, variable load (also dynamic), and safety margins to ensure stability and, consequently, vehicle comfort and safety [47]. Non-linear filters, backstepping technology, and quadratic Lyapunov function are introduced here to take into account the constraints while achieving the control goal based on limited sensor data.
The use of DS or DT in the control of electro-hydraulic systems will allow the use of more advanced control methods and the continuous monitoring of machine operation, along with online optimization. In [48], the focus was on DT in relatively simple components of hydraulic systems, such as counterbalance valves, which were identified, modeled, and tested in the laboratory. DT was also used in decision support for the control of groups of hydraulic actuators (hydraulic support in mines), allowing self-adjustment according to the current load and control criteria [49] or relative pose reconstruction [50].
In summary, it can be stated that the construction of electro-hydraulic systems is the subject of many articles proposing various approaches to the control problem. Modeling and simulation allow for designing and evaluating the operation of systems in a shorter time than using only classical computational methods, which is of great importance in the context of the need to quickly design products and introduce them to the market. Due to the adoption of certain simplifications during modeling and simulation, it is justified to conduct experimental verification of the simulation results. The use of computer tools in the design stage can be easily extended to the experiment stage because the same software can be used for real-time control and collecting data from sensors in real-time. In this way, it is also possible to obtain the DS or DT of individual components or the entire electro-hydraulic control system. The identification of components and subsystems using simulation tools and their experimental verification will allow for the construction of more complex systems and their DT. This indicates the validity of developing a methodology for modeling and the simulation of electro-hydraulic systems and combining it with a set of equipment that allows the performing of experiments to verify the obtained results in terms of the accuracy of the selected parameters and control algorithms.

1.2. Goals and Approaches

The aim of the project was to develop a design and research methodology and then a laboratory station allowing the selection of parameters and testing of Digital Twins for electro-hydraulic control systems. An electro-hydraulic system was proposed that allows a programmable load on the identified and tested control system of the device for which the Digital Twin will be created. The dynamic load application system, which is to be used to exert pressure on the tested actuator position control system, must itself be mathematically modeled, identified, and tested first. The station must be equipped with control and measurement systems enabling data acquisition and real-time control, taking into account the possibility of configuring model parameters and the flexible adjustment of control algorithms.
Three main stages of work were carried out:
  • Methodology of development of the project—concept development, modeling, simulation, and construction of a station allowing for setting a programmable variable load for the tested hydraulic actuator position control system;
  • Tests and calibration of the station—design and construction of an example of the tested system that can be researched on the station (modeling, simulation of the hydraulic actuator position control system under programmable load with disturbances, using various control algorithms);
  • Hardware tests of the laboratory station in order to verify the simulation results.
Section 2 presents the concept and the design methodology of the laboratory station for tuning and testing DT in hydraulic actuator control systems under variable load. The structure and operating principle of the individual components of the system are described and the roles they play in the system are presented. Hydraulic and electrical diagrams are presented and the components and their role in the system are described.
Section 3 presents the design of a variable load application subsystem, which is intended to simulate an external load acting on the tested hydraulic actuator being positioned. It describes the subsequent steps of identifying the load application system and includes considerations on the adopted mathematical models used for simulation tests of this system. The PI controller settings were determined and it was assessed which of them would best meet the requirements imposed on it. Finally, laboratory tests of the variable load application subsystem were carried out to confirm the simulation results.
The Section 4 presents the methodology and tests of an example system for positioning the piston of a hydraulic actuator operating under variable load, which can be researched on a DT/DS tuning and test station. The identification of the servo-valve-actuator system is presented here. The influence of external load on the mentioned system was discussed. A mathematical model is presented that describes the operation of the positioning system under variable external load. Two control systems were tested, first using a conventional PID controller and second based on a fuzzy controller, which were first simulated and then researched at the test station. It was decided to study these types of controllers because they are often the subject of research and the obtained results can be compared with data from other experiments, e.g., [37,51,52,53,54]. Finally, the results of the system tests were summarized and conclusions were formulated. This allowed us to assess the laboratory station as useful for research related to the parameterization, tuning, and evaluation of DS and DT applications.

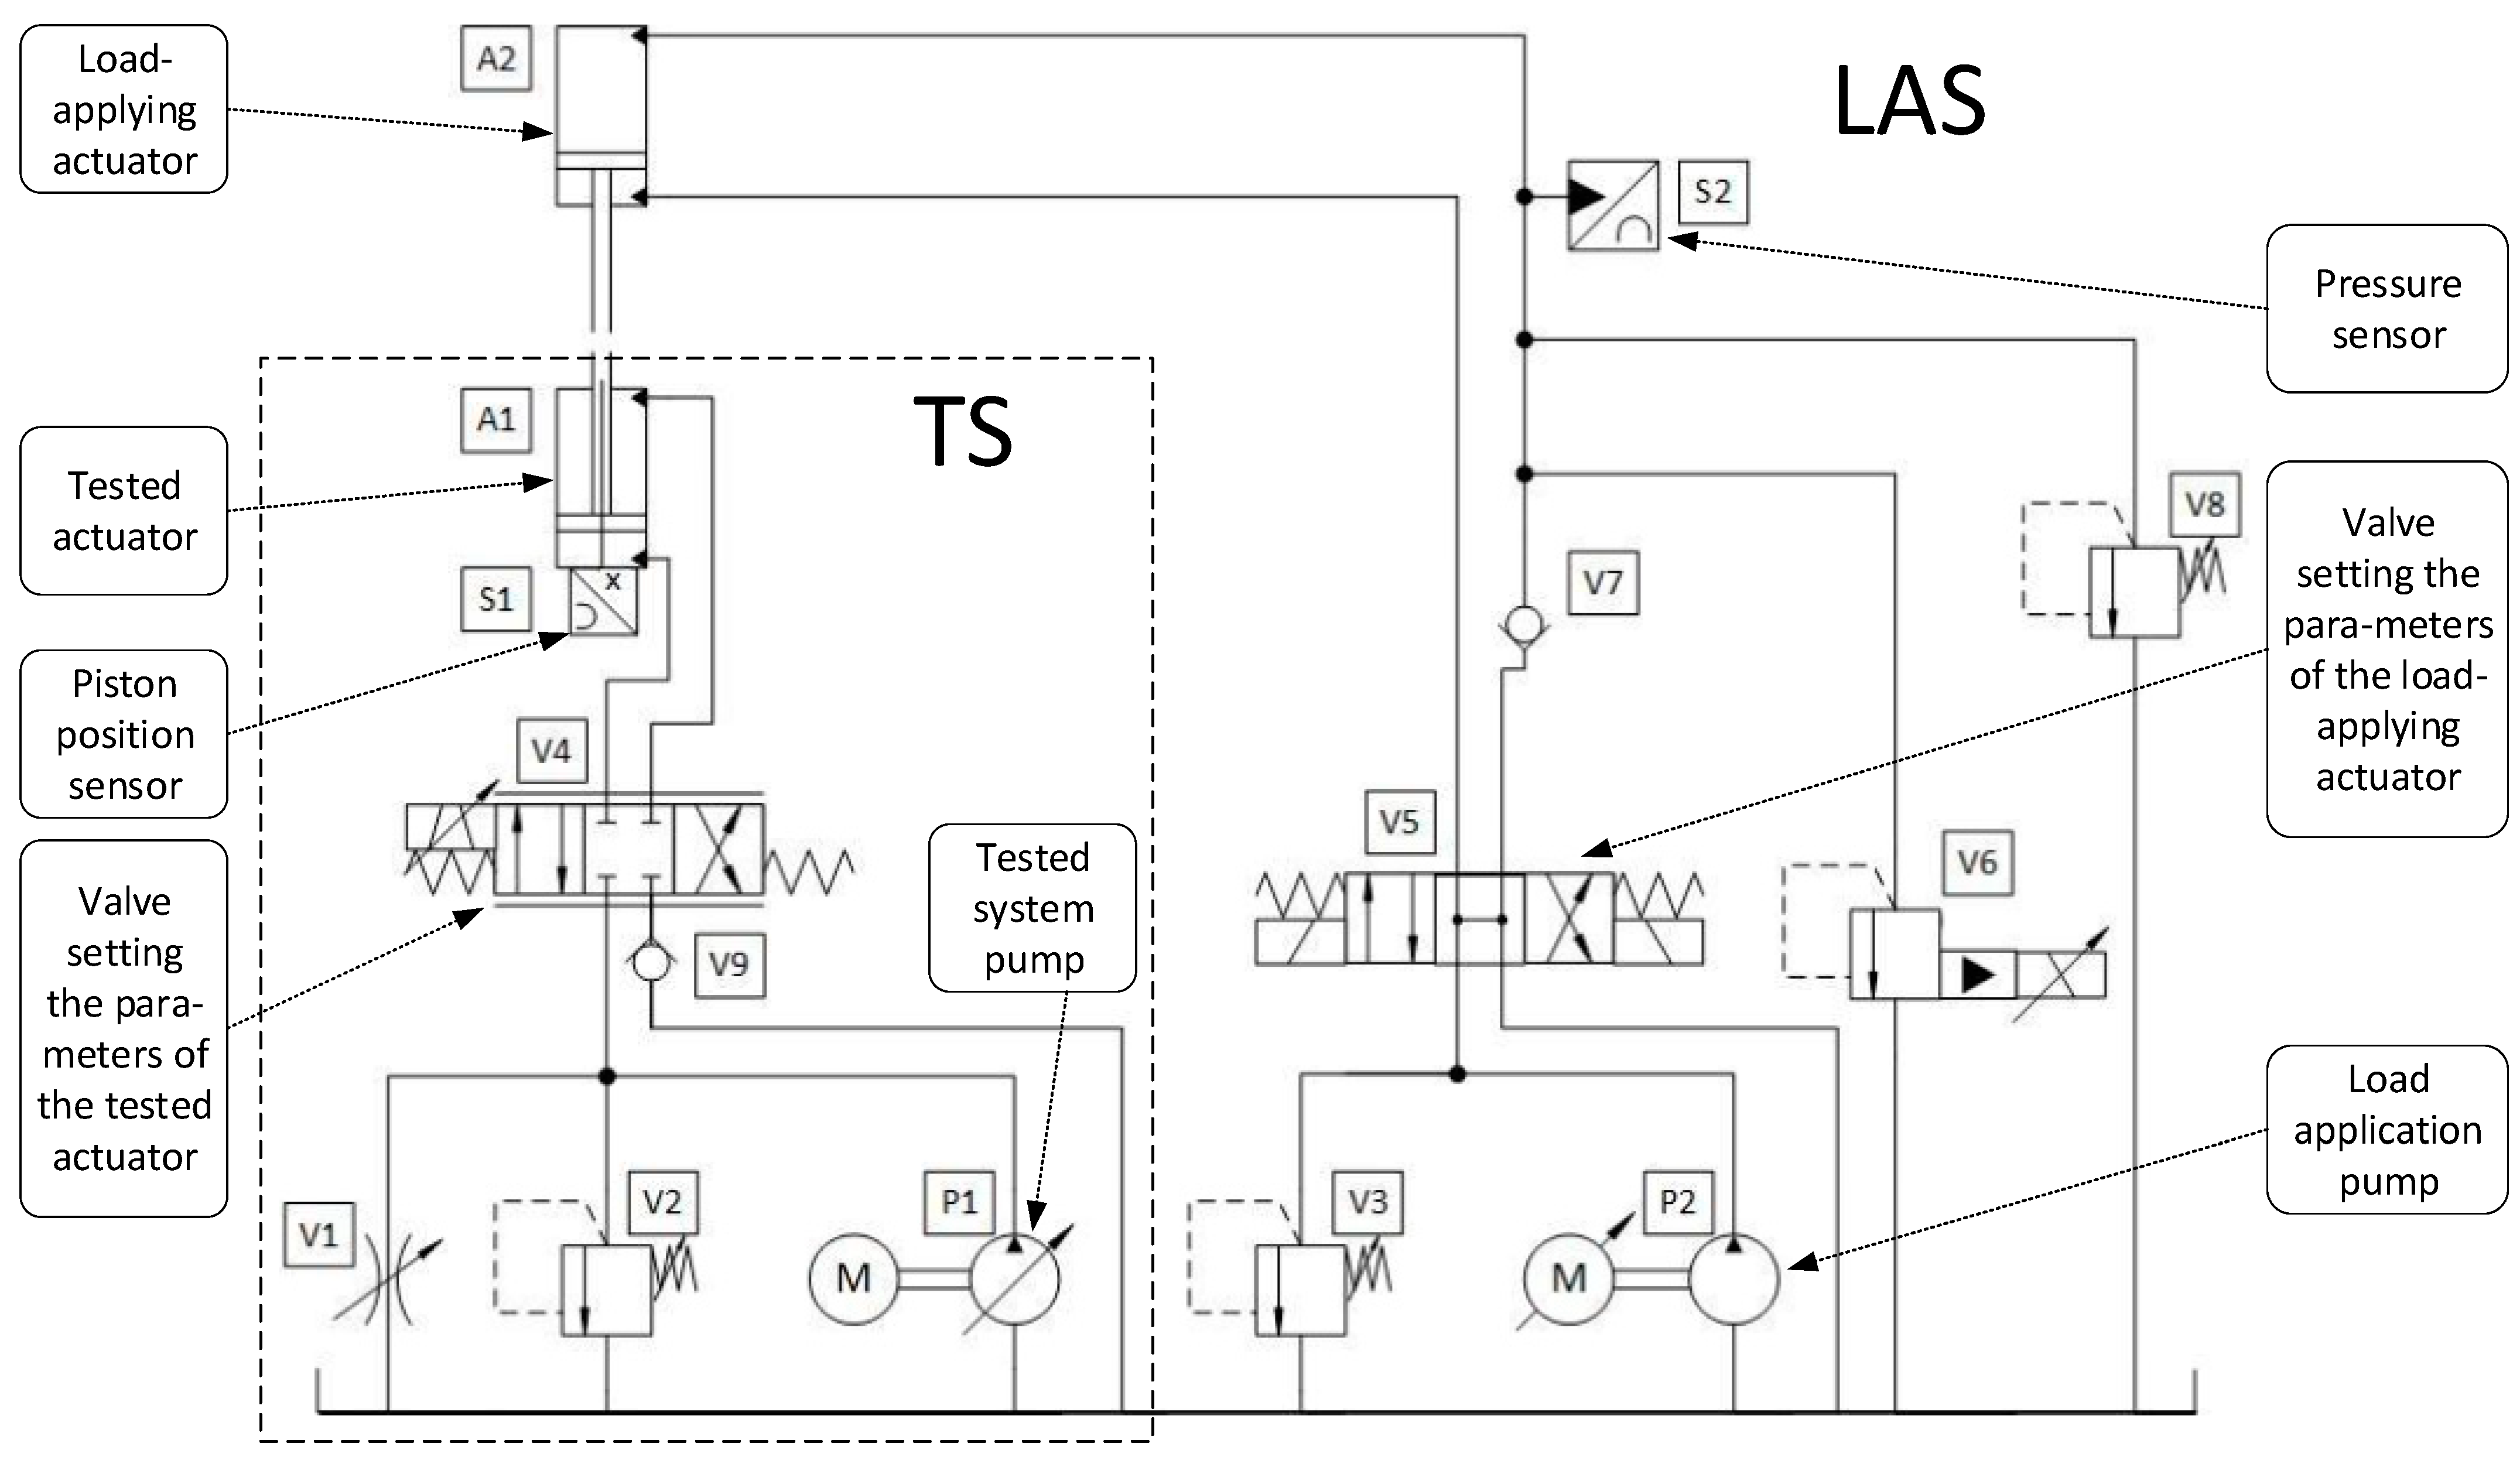
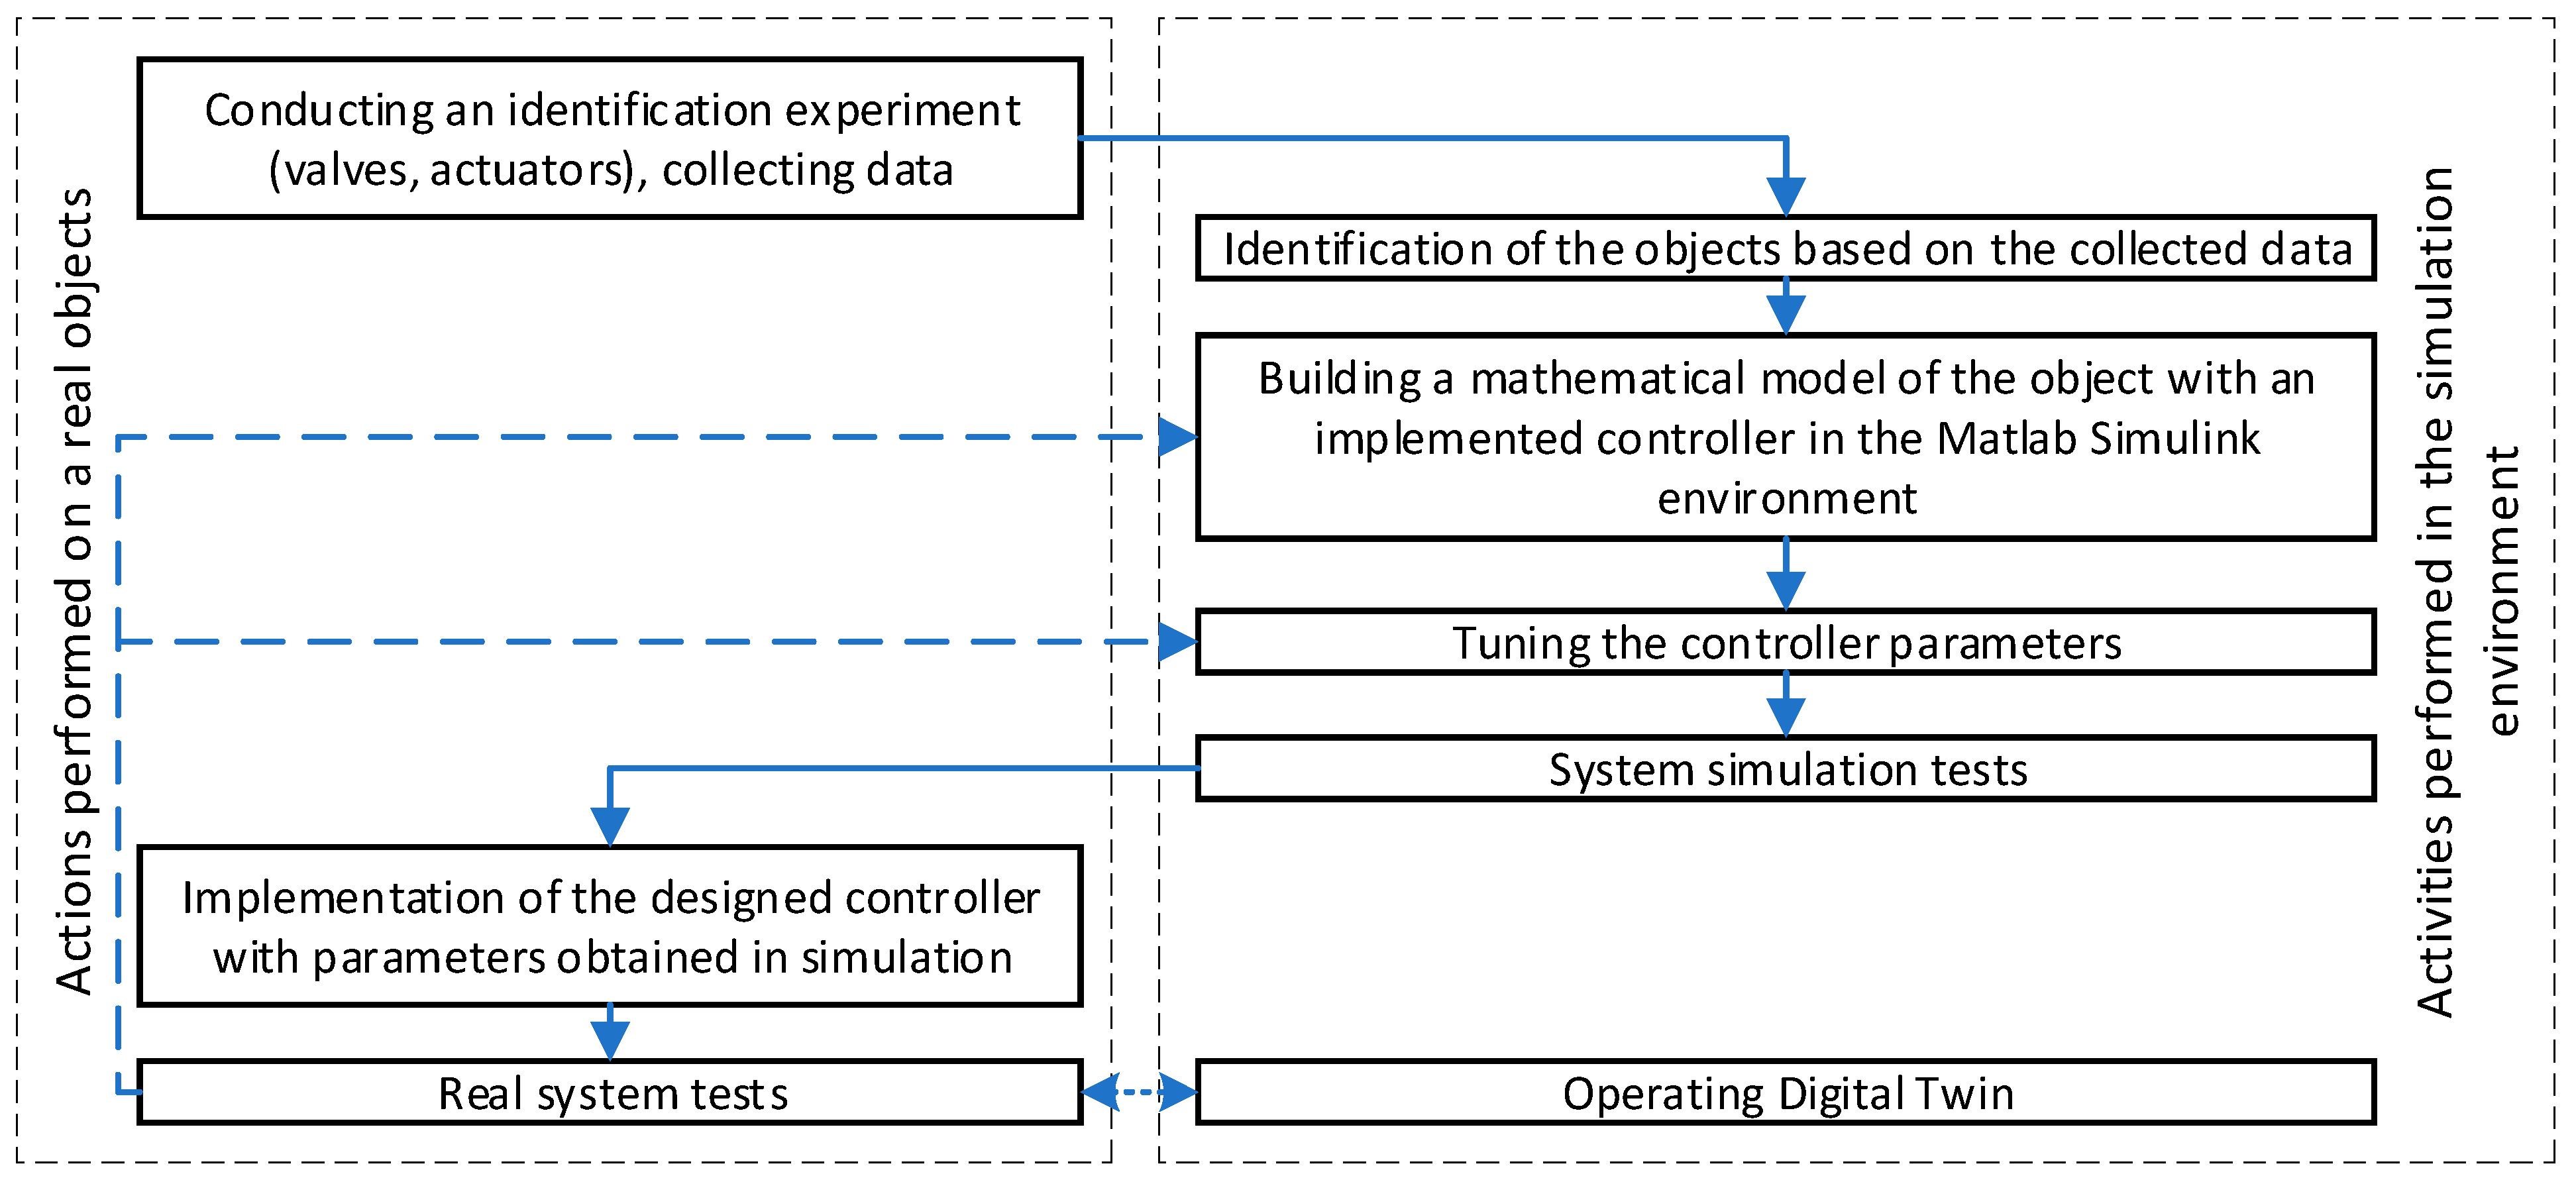
2. Concept of DT/DS Test and Tuning Station

The DS/DT test and tuning station for research on the position control of a hydraulic actuator consists of the following subsystems:
  • The variable load application subsystem, the subsystem that applies a load on the tested actuator;
  • The position control system being tested—usually an actuator with a valve and controller programmed with a specific control strategy algorithm;
  • Mechanical structure in which the actuators and other station elements are installed;
  • Control and measurement processing systems, including sensors, controllers, and DT/DS software.
The mechanical part of the DS/DT station is the frame that holds two actuators on a common axis, opposite each other: the actuator that is being tested, whose position is set by its own control system, and the actuator applying a variable load, the position of which is controlled by the control system of the test station with the use of the proportional valve.
This configuration is often found in research on the control of hydraulic systems, for example, refs. [55,56]. The main part of the paper is focused on developing the control systems, modeling, data acquisition, and subsystem, allowing for controlled load application.
Controlling the proportional servo valve requires the use of an electrical signal; therefore, the DT/DS test station consists of two main systems: hydraulic and electrical. A description of these systems is provided in the following chapters.

2.1. Power Hydraulics System

The hydraulic diagram of the DT/DS tuning station is shown in Figure 1. Part TS of the diagram is the electro-hydraulic actuator positioning system that will be researched at the test station—its task is to maintain the programmed position of the actuator A1, subject to variable loads generated by the actuator A2, which is part of Part LAS—the precisely tested dynamic load application system. Due to the fact that the loads set by A2 are known and consistent with its mathematical model (which will be demonstrated in the next chapter), it will be possible to identify the hardware and assess control algorithms of the actuator A1 and the entire system TS, which, in consequence, will allow for the creation of a reliable DT.
Subsystem TS is a position control system that will be tested, as a result of which it will be possible to obtain parameters for creating its DT. The most important element of the system is the servo valve V4. Based on the electrical input signal, it redirects the hydraulic fluid to the lower or upper chamber of the hydraulic A1 actuator. Additionally, the flow rate at the output of the servo valve V4 is proportional to the electric control signal, due to which it is possible to continuously control the speed of the piston rod of the actuator A1. The system also includes an analog position transducer of the piston of the A1, the signal of which can be used as feedback to the controller.
Subsystem LAS is the main part of the DT/DS test station; it is used to apply a controlled dynamic load on the TS. Its main element is the A2 actuator, which is usually extended so as to contact the tip of the tested actuator A1. The A2 presses on the A1, generating a load that is intended to disrupt its positioning task. When the A1 is extended, the piston of the A2 actuator is pressed into the cylinder, which causes the oil to be squeezed out of the upper chamber of the A2. The V7 check valve ensures that the fluid does not flow through the V6 or V5 but through a proportional overflow valve. Because it is electrically controlled, the pressure in the upper chamber of A2 can be continuously adjusted and, consequently, any load on the A1 actuator can be generated. The system also includes an analog pressure transducer S2, whose signal can be used as feedback for precise load regulation.
Actuators with the following parameters (piston diameter, piston rod diameter, stroke (mm)) were used: A1—68/36/540 and A2—50/28/540. The A2 has a smaller diameter and, consequently, a smaller piston surface than the A1 actuator. This means that it is able to generate less force with the same pressure. This is desirable because the A2 should generate an external load that the A1 is able to overcome and achieve the programmed position. The most important valves are the Moog 77-537 servo valve [57] and the WZPSE6 proportional overflow valve [58]. They are used to control the position of the A1 and to control the pressure in the upper chamber of the A2, i.e., to control the load.

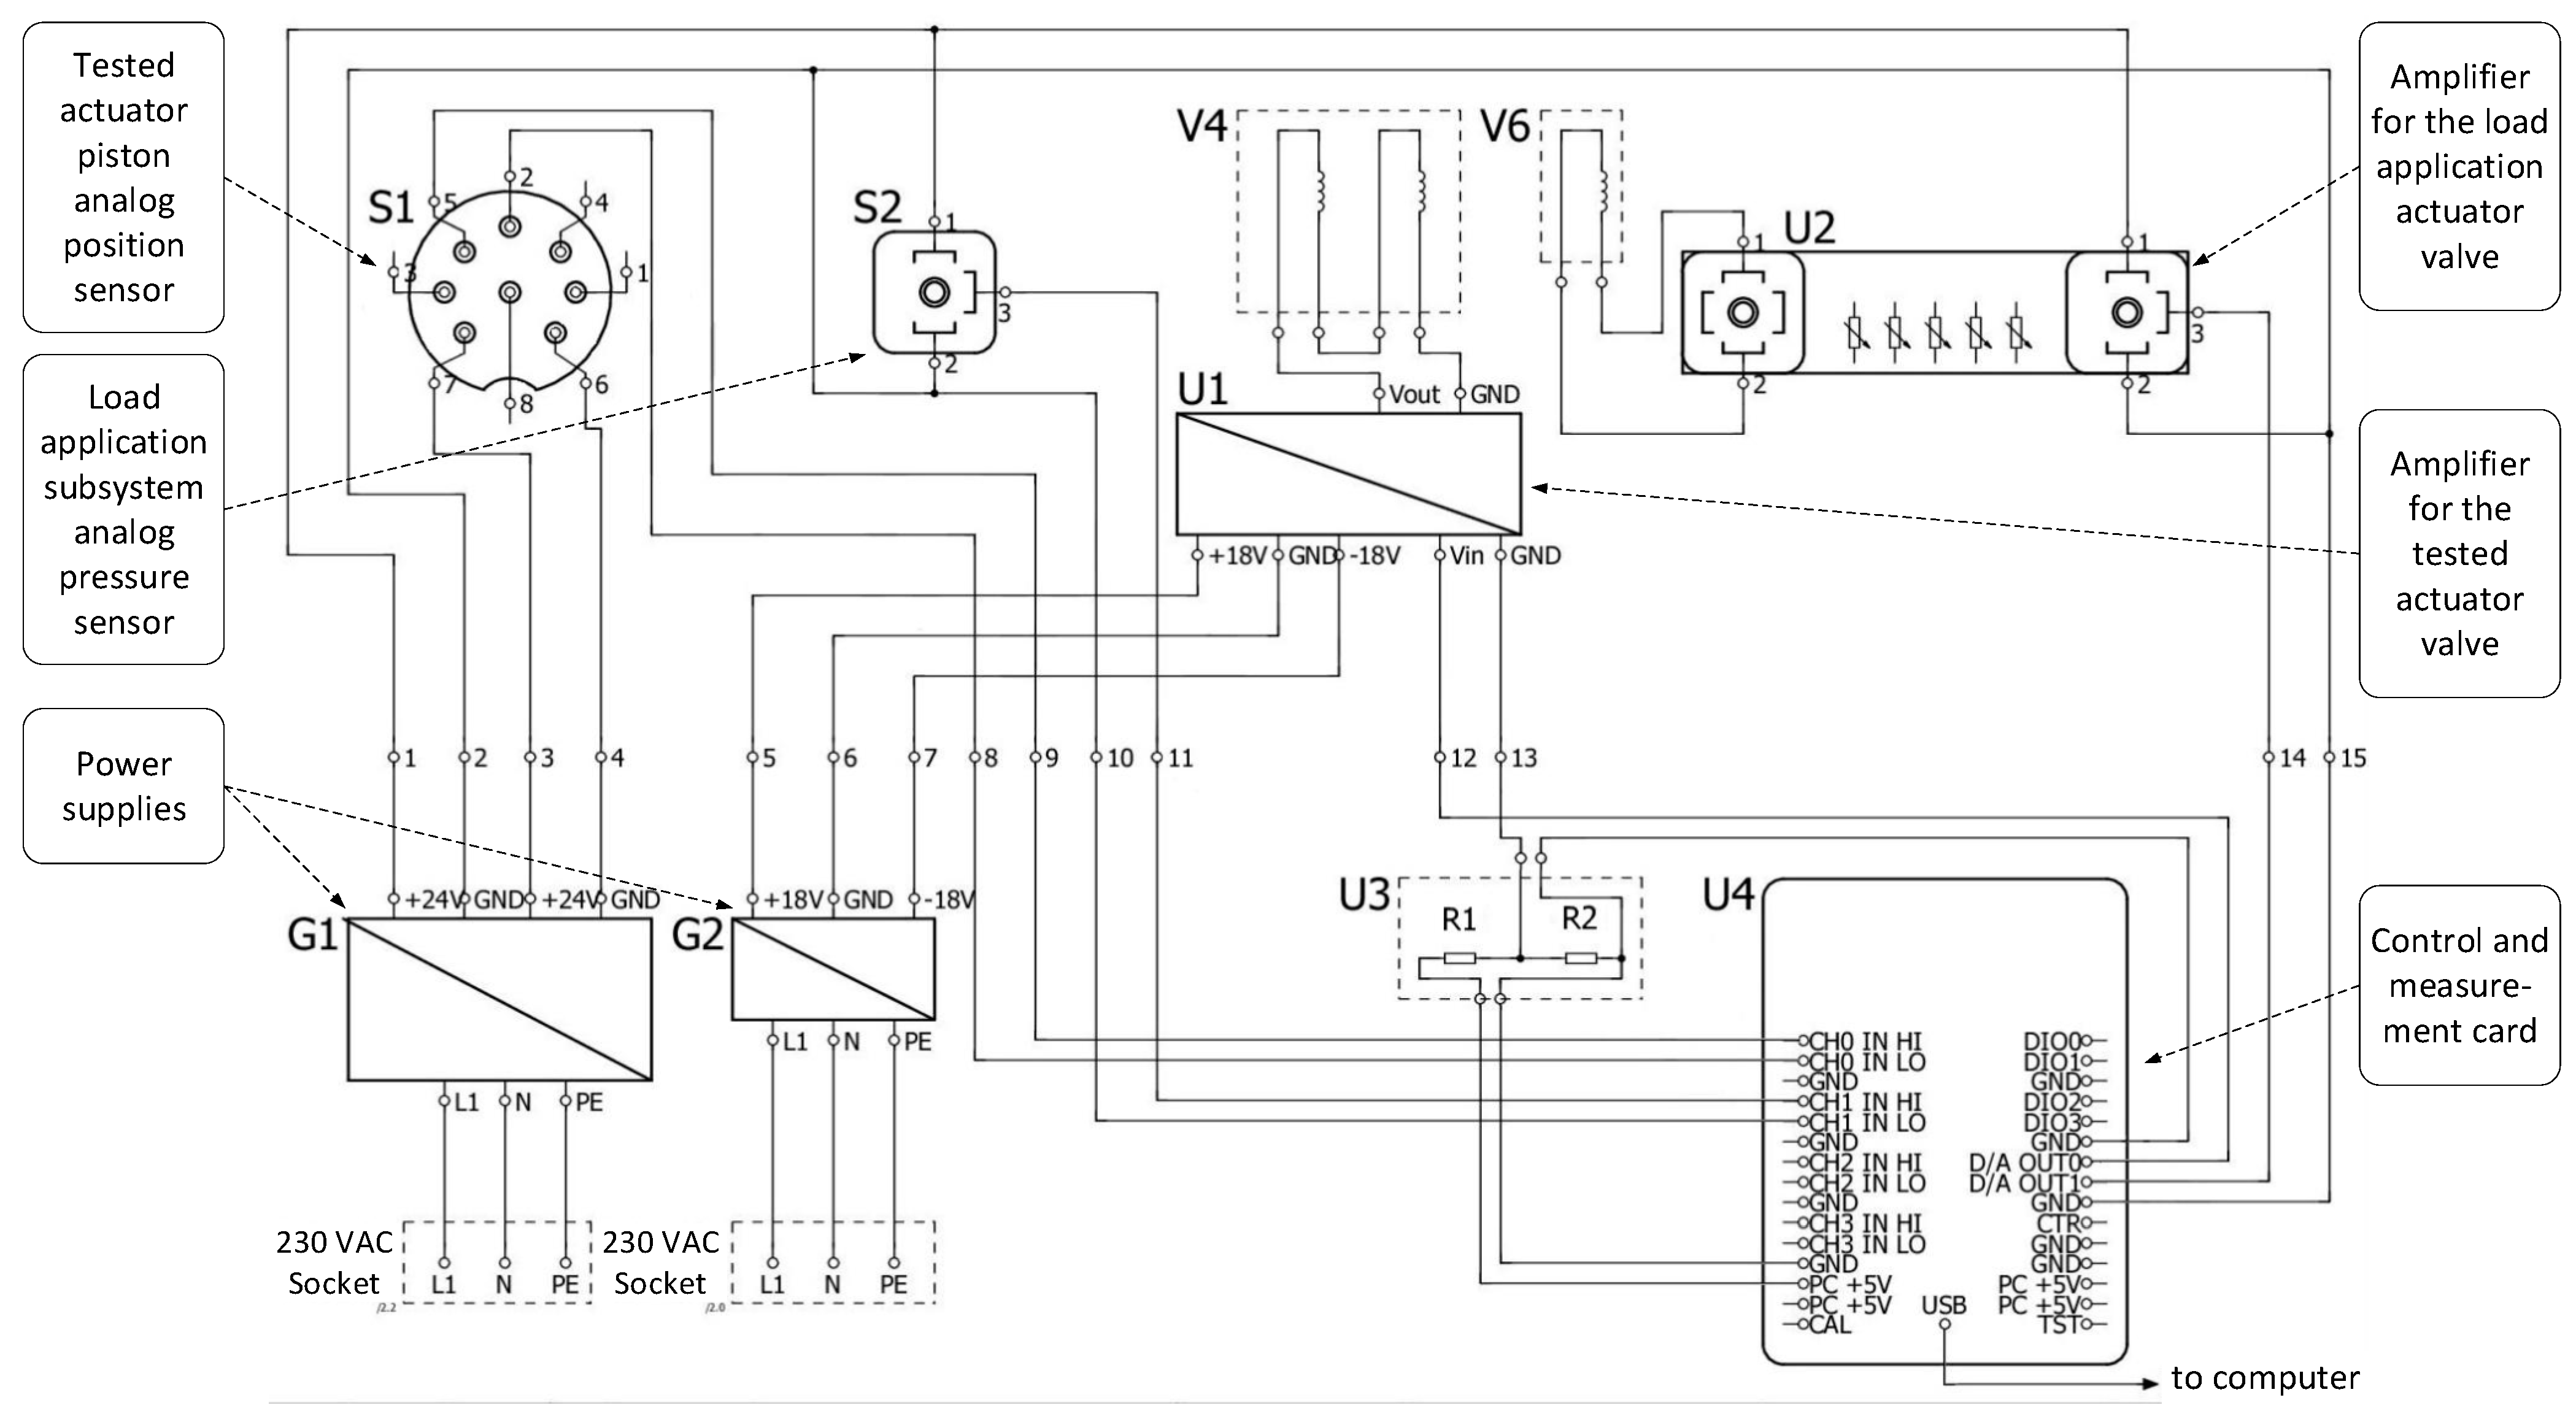
2.2. Control and Measurement System

Figure 2 shows the electrical diagram of the DT/DS tuning station. The electrical control system, similarly to the hydraulic system, can be divided into two subsystems. The first part of the control system cooperates with Subsystem TS positioning the A1 actuator. Its most important elements are the servo valve coils V4, the amplifier U1, the measurement and control card U4 [59], and the actuator piston position transducer S1 [60]. The U4 card connected to a computer enables the implementation of programmed and parameterized controllers. The control program processes the information from the position sensor and, on its basis, calculates the servo-valve control signal in order to achieve the programmed position. This signal is fed to the Ao0 analog output of the U4 card in the form of a voltage signal, which, after being converted by the U1 amplifier into a current signal, is sent to the servo valve coils, controlling the flow rate and, consequently, the speed of the A1. This part of the control system was used during the initial tests of the station; during normal operation, the tested subsystem TS can be controlled by its own independent control system (actuator, control valve, sensors, amplifier, etc.).
The main part of the control system is used to set the pressure in the upper chamber of the A2 actuator. Its most important elements are the S2 pressure transducer, the coil of the proportional overflow valve V6, and the measurement and control card U4. The S2 pressure sensor [61] measures the current pressure in the chamber of the A2 actuator and is connected to the analog input Ai1 of the U4 card. The control algorithm, using current pressure, calculates the control signal for the overflow valve V6 and sends it to the analog output Ao1. From there, the signal is sent to the U2 amplifier [62], which converts the voltage signal to a current signal required to control the valve V6. The V6 valve sets the programmed pressure in the system.

3. Methodology of Design and Identification of the Load Application Subsystem (LAS)

To create and test the load setting subsystem, the activities presented in the diagram (Figure 3) were carried out. Some of them were performed on a real object and the rest were performed on a computer environment, as simulations. First, an identification experiment was performed on a real object (hardware) in order to collect measurement data. Then, using these data, the object was identified in the computer environment, which led to the construction of a mathematical model. After that, a system containing the tested object was designed together with the PID controller. Then, the controller parameters were tuned in the simulated system. Finally, simulation tests were performed. After the simulation tests were completed, the designed controller was implemented in software, together with the designated settings, on the control and measurement card U4, in order to control the real object. Finally, the controller was tested on the real object. The initial test results could lead to changes in the mathematical model and the selection of controller parameters, which were re-implemented in the real object. During the testing of the real object, it was connected to its Digital Twin in a simulation environment.
The task of the load application system (LAS) is to provide control of the actuator A2. This control can be performed from the level of a computer program and should provide the ability to set a constant or programmed variable pressure, which simulates a constant or a dynamic load, respectively. The variable load can be implemented as sinusoidal, rectangular, triangular, or sawtooth signals with set parameters (amplitude and frequency). It was necessary to develop a measurement and control system and a program that controlled the proportional valve (Figure 4).
In order to design a system with known parameters, the following steps were carried out: identification of the load setting system completed with the construction of a mathematical model, preparation of the controller and its program implementation, simulation tests of the controller on the mathematical model, and laboratory tests.

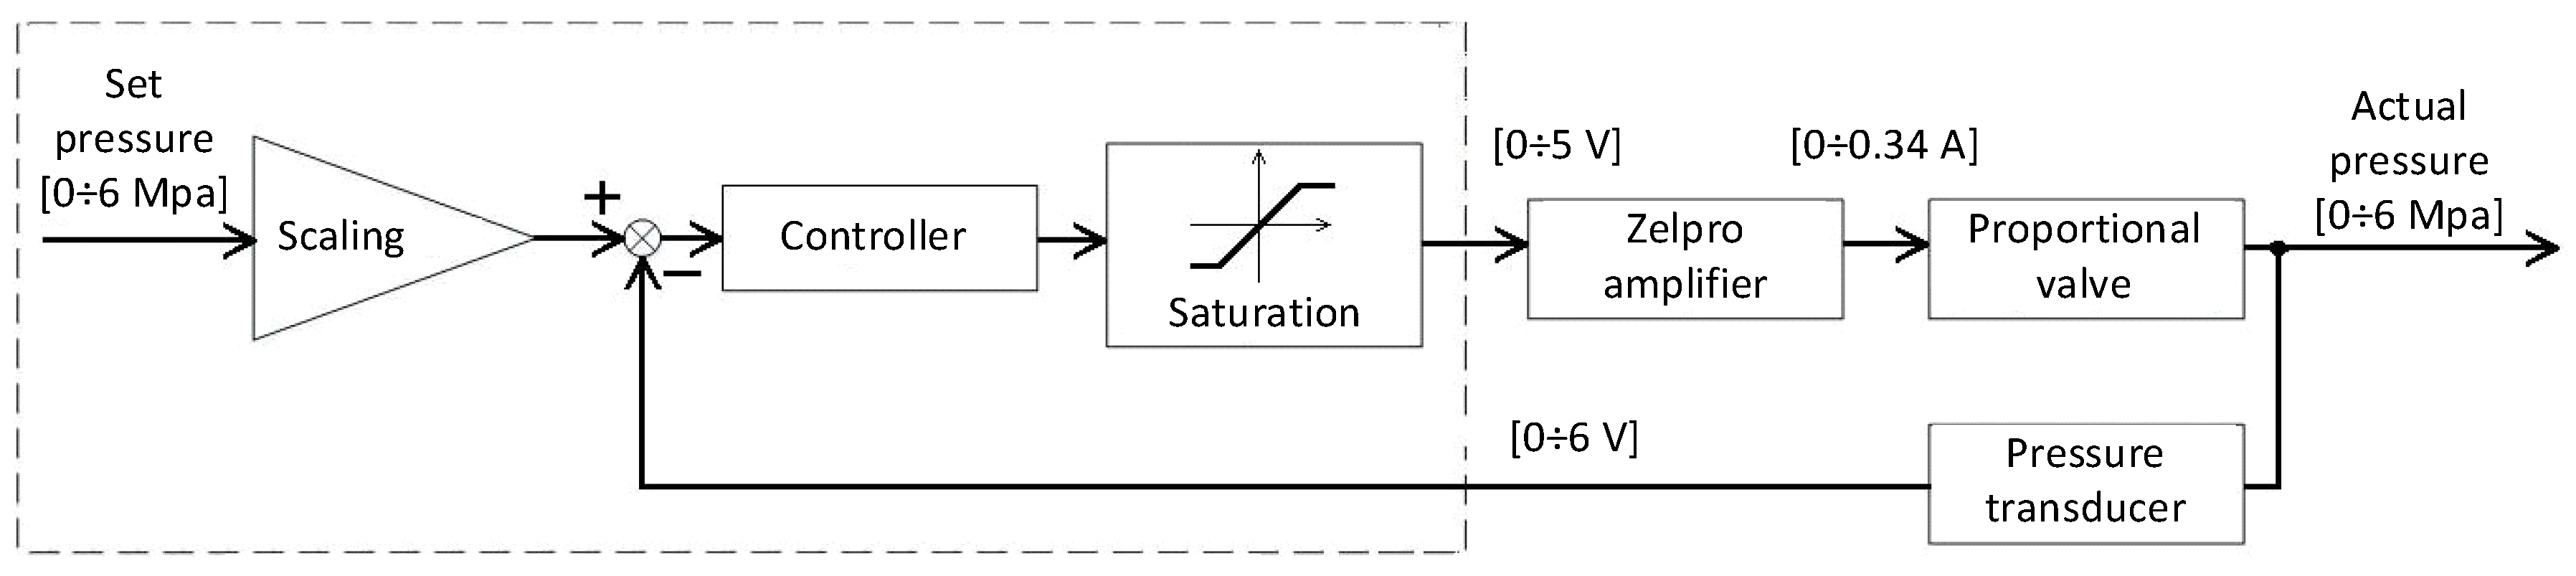
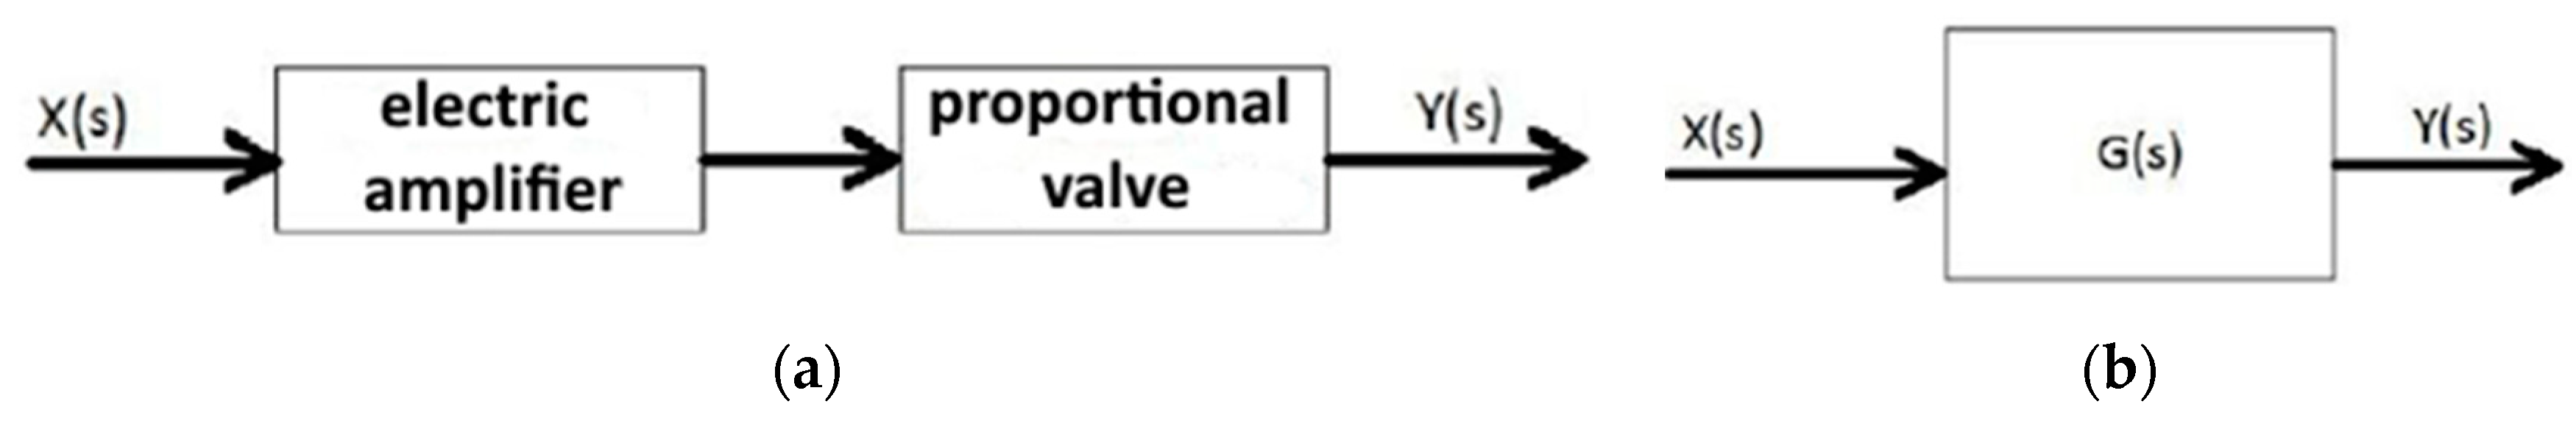
3.1. Identification and Modeling

The identification task consists of preparing a mathematical description of the control object, which, in this case, is the load setting/application system. For this purpose, an identification experiment should be carried out, which involves feeding a known signal to the input to the system and reading the signal at the system’s output. These data should be compared and an appropriate mathematical model should be adjusted, which would transform the input signal into the output signal in such a way as to reproduce the operation of the system as faithfully as possible [63]. Figure 5 shows the actual (a) and simplified (b) diagram of the regulated object. The X(s) signal is the set value of the control voltage and the Y(s) signal is the output pressure to be set in the A2 actuator.
A rectangular wave with a nominal value of 5 V was selected as the input signal, which is advantageous from the point of view of the identification task because it contains a wide frequency spectrum. The result of the identification experiment is presented in Figure 6. The minimum value of the output pressure is 1 MPa. The output signal was reduced by this value so the zero input signal corresponds to the zero output signal, which will simplify the identification procedure. Finally, the output of the model developed in this way should be increased again by 1 MPa.
The next step was to use the Matlab System Identification (SI) toolkit [63]. Data collected from the identification experiment were loaded into it and then several models were estimated, differing in the number of zeros and poles. A selection of several models was carried out, taking into account, among others, the degree of similarity between the actual data and the model data calculated by the SI toolkit. The resulting transmittance of the mathematical model is presented in Equation (1):
G s = 295.1 s 4 2.944 10 4 s 3 + 7.457 10 6 s 2 1.267 10 8 s + 3.217 10 10 s 6 + 159.3 s 5 + 1.962 10 4 s 4 + 1.479 10 6 s 3 + 7.247 10 7 s 2 + 2.244 10 9 s + 3.242 10 10
where G(s)—determined transfer function of the amplifier-proportional valve system, s—is a complex variable used to describe a model of a system in the frequency domain.
The obtained model is a linear object but the actual electro-magnetic proportional valve contains a hysteresis loop in its static characteristics, which makes it non-linear. For better mapping, features, such as dead zone and saturation, have been added to the model. This was implemented in the Matlab Simulink 2023 environment. Figure 7 presents the diagram of the non-linear model (a) and a comparison of the static characteristics of the real object, the linear model, and non-linear models (b).
The identification and modeling of key hardware elements, taking into account their behavior under the influence of specific signals and non-linearities, allowed us to determine their characteristics during operation in a closed control system. This allows us to move on to the design and implementation stage of the controller.

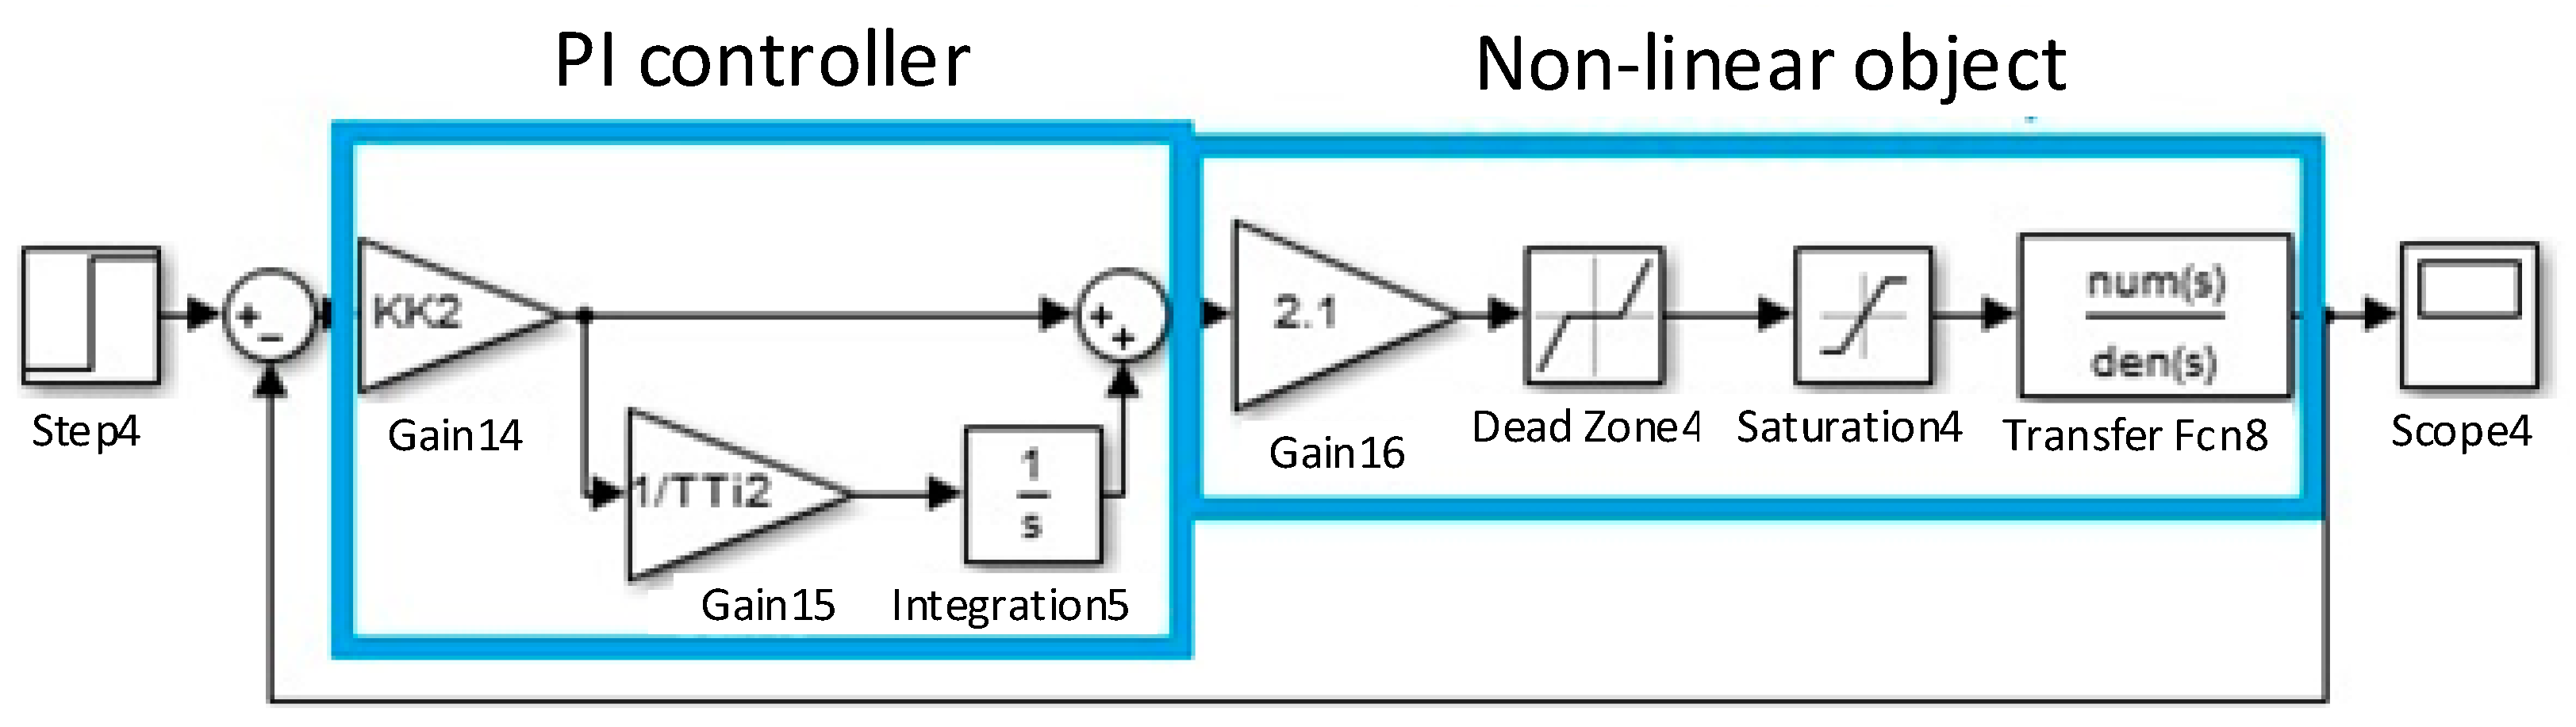
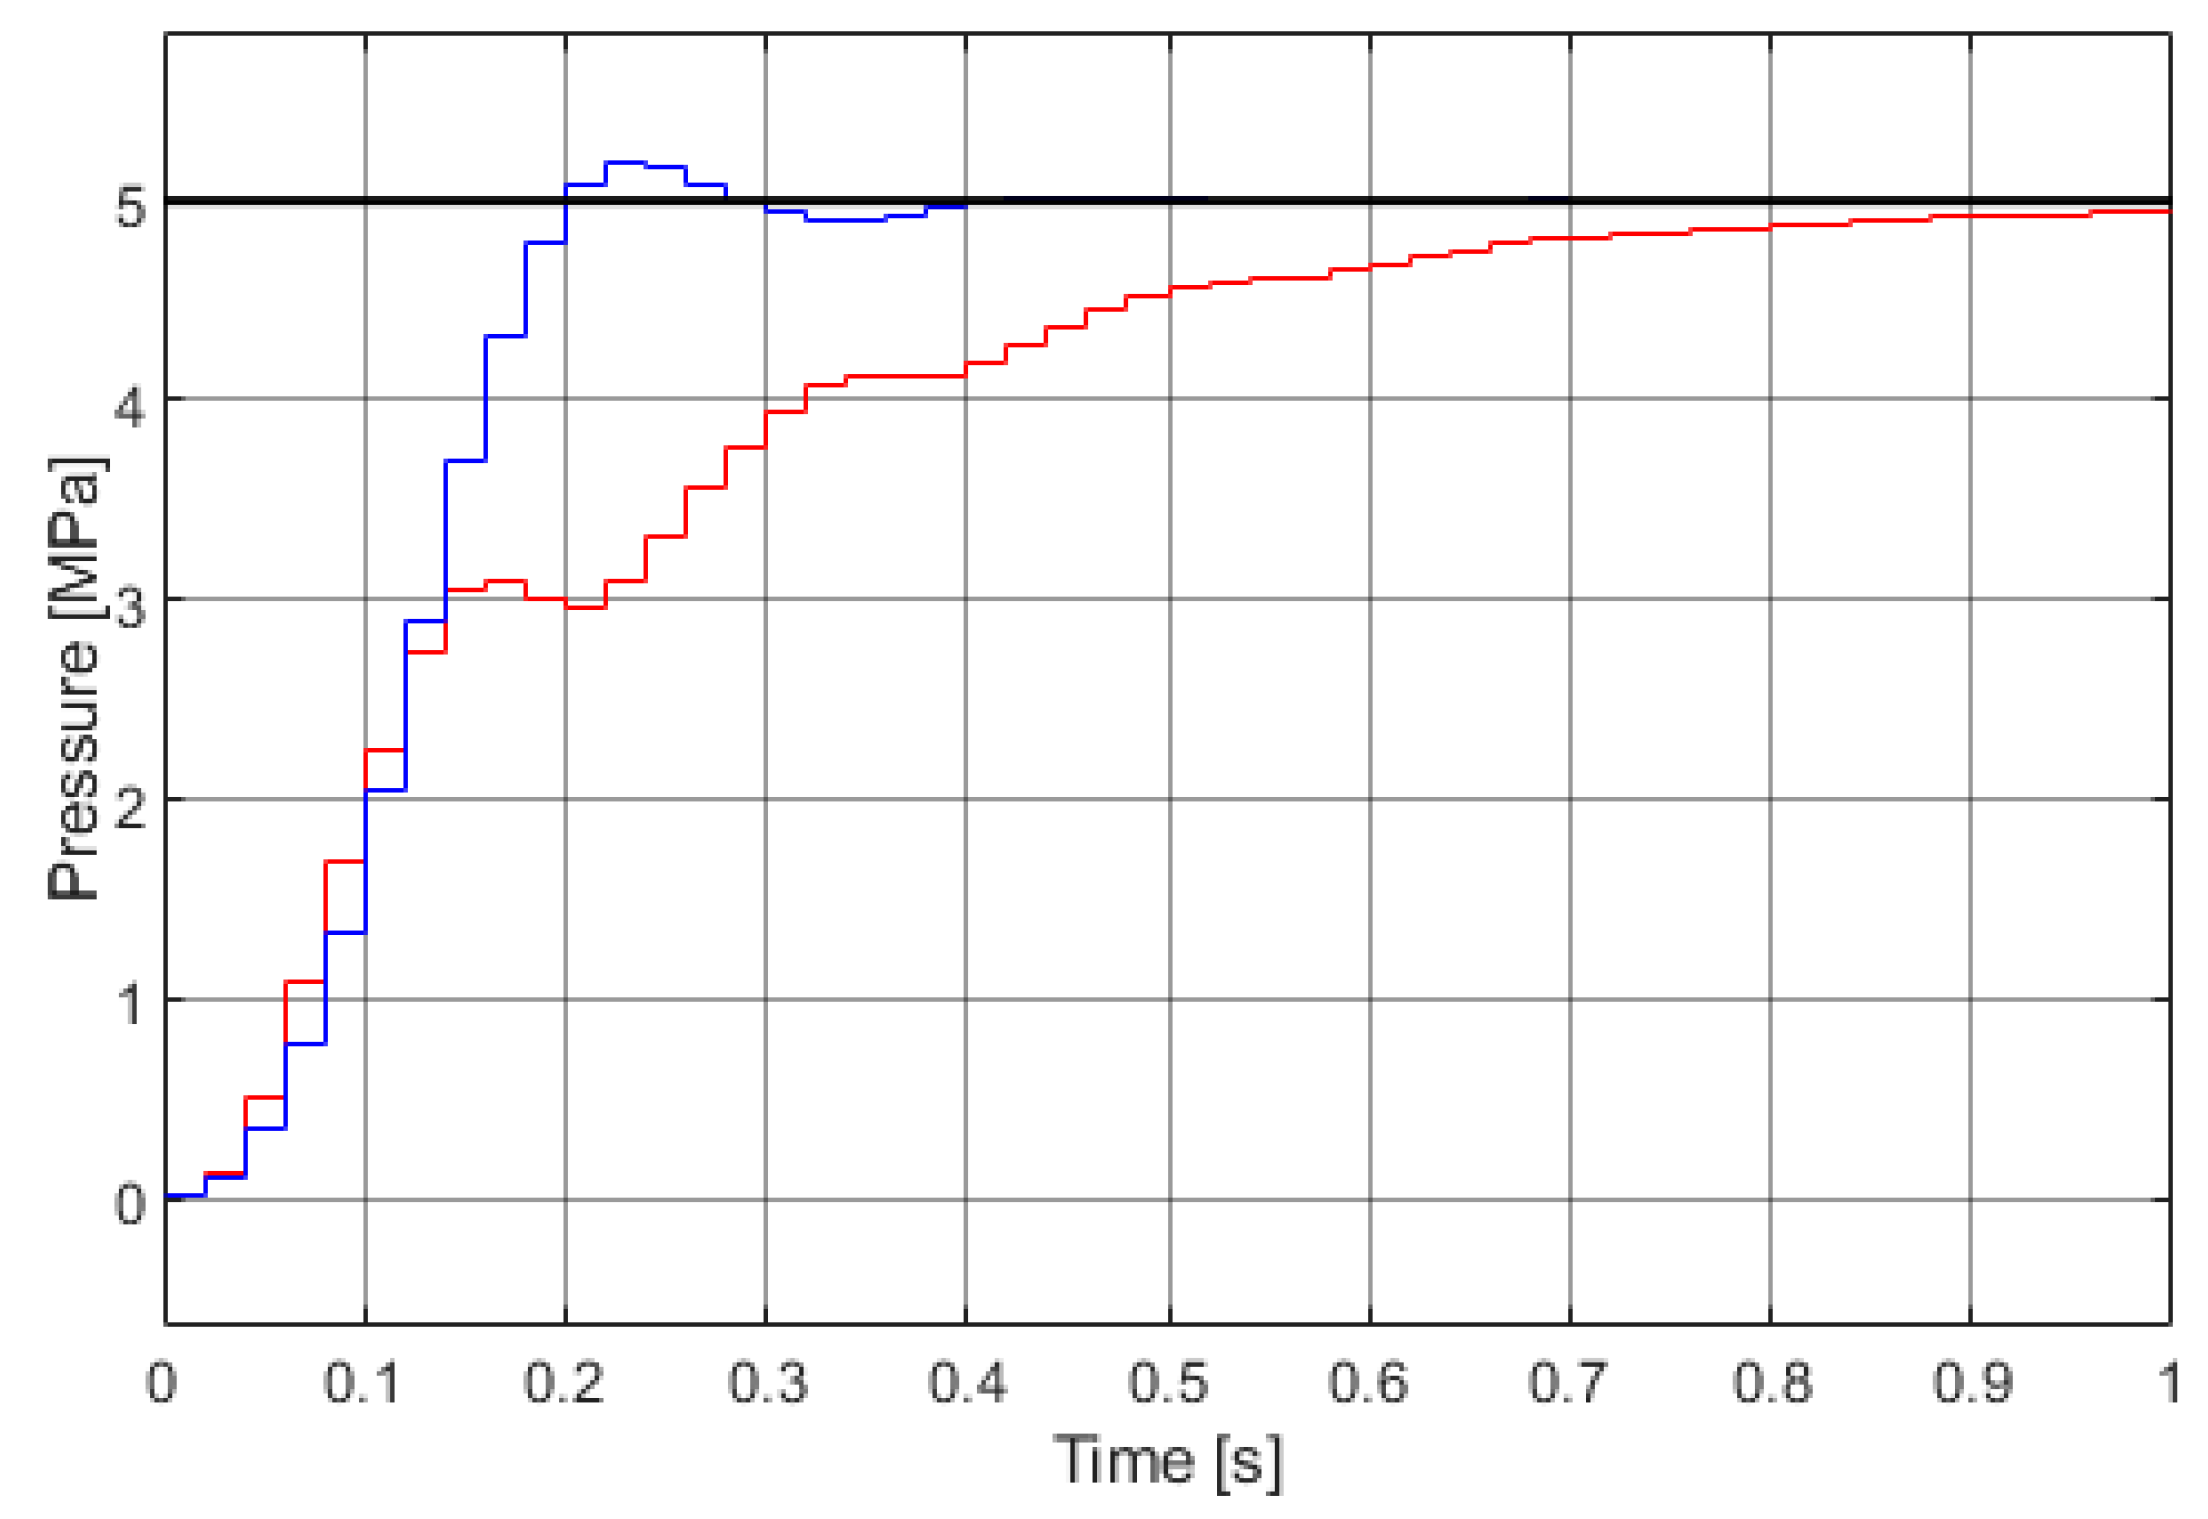
3.2. Controller Selection, Implementation, and Computer Simulation

The next step is the selection and implementation of the controller. To regulate the loading pressure, a PI controller was chosen. To determine the controller parameters, the Matlab Simulink and a previously prepared mathematical model were applied. The Ziegler–Nichols (Z–N) method and the Simulink Design Optimization (SDO) toolkit implemented in Matlab were used. Figure 8 shows the diagram of the closed-loop system. The PI controller settings for the load application system were determined: the controller gain Kr = 0.4590 for the Z–N method and 0.2861 for the SDO toolkit; the integration constant Ti = 0.1328 for the Z–N method and 0.0452 for the SDO toolkit.
Then, simulations were performed using Matlab Simulink 2023 to test the quality of the regulation. An additional step that had to be performed was to switch from the continuous transmittance of the controller to the discrete transmittance using the Matlab c2d function, assuming a sampling rate of 20 ms. The results obtained are presented in Table 1.
Here, G(z) is the determined transmittance Z of the amplifier-proportional valve system (transmittance Z is the equivalent of Laplace’s transmittance for describing discrete systems) and z is a complex variable z used to describe a model of a discrete system in the frequency domain (equivalent to the variable s for describing continuous systems).
Figure 9 presents the simulation results. The black line is the setpoint; the red line shows the response of the system with the PI controller, in which the settings determined using the Z–N method were implemented; and the blue line shows the response of the system tuned with the SDO toolkit.
The settings determined using the SDO toolkit were found to be better than the Z–N method. The regulation time is shorter by approx. 0.5 s. The parameters of the selected controller obtained from the simulation can be used during the implementation of the control strategy during tests on real equipment. The tests conducted there will allow us to check whether the theoretical predictions (simulation results) match the data and the behavior of the system during real tests. If significant differences are found, it is necessary to return to the simulation stage.

3.3. Laboratory Tests of the Load Application Subsystem

In order to implement the PI controller in the LabView environment, which cooperates with the U5 card and is used for its programming, the controller equation had to be transformed from a discrete form to a differential Equation (2):
y n = a x n b x n 1 + y n 1
where:
  • n—sample number in the n-th step;
  • yn, yn−1—output of the controller at time n, n − 1;
  • xn, xn−1—input to the controller at moment n, n − 1;
  • a, b—coefficients determining the controller settings.
Finally, laboratory tests were performed. The response of the load application subsystem to a given square wave signal is presented in Figure 10, in which a PI controller with settings determined using a toolbox from the SDO toolkit (a) and the Z–N method (b) was implemented. The load application system based on the SDO toolkit settings achieved an adjustment time of 0.5 s and no overshoots. The system tuned with the Z–N method had an adjustment time of approximately 1 s and minor overshoots.
For further work, it was decided to use a controller whose settings were determined using the SDO toolkit. It allows for a sufficiently precise setting of the desired pressure in the load application subsystem. Thanks to the program in the LabView 2023 environment, the user has the ability to set any pressure within the valve’s operating range as a constant value. Using the functions available in this programming environment, the user is able to set variable setpoint signals (such as a rectangular, triangular, sawtooth, or sine signal) and, as a result, it is possible to generate a variable load in the system, which is necessary for testing the DT/DS of actuator positioning control systems.

4. Position Control System TS—Modeling, Identification, Simulation, and Tests

The example position control system (TS), whose characteristics are to be determined in order to create DT/DS, must also be designed and built for the purpose of testing the developed station for tuning and testing hydraulic actuator control systems under variable load conditions. Its task is to position the piston of the A1 actuator’s piston (maintaining a given position or moving it according to a program), which is under a variable load exerted by the load application system (LAS) A2 actuator. The proposed example position control system is based on a proportional servo valve, allowing continuous control of the A1 actuator.

4.1. Identification and Modeling, Including Disruption Modeling

The identification of the positioning system (TS) was carried out in a similar way to the identification of the load application system (LAS). However, in this case, referring to the source [5], the general transmittance of the amplifier-servo-valve-actuator system can be represented as follows (3):
G s = Y ( s ) X ( s ) = K s ( T s + 1 )
where G(s)—transmittance of the servo valve-actuator system, X(s)—Laplace transform of the input signal, Y(s)—Laplace transform of the output signal, K—object amplification factor, and T—time constant of the object.
Due to the fact that the tested system is a first-order astatic object, the identification experiment was carried out on a closed-loop system. Figure 11 presents the complete block diagram of the system, its simplified form, and the transfer function of the system.
The relationship between the transmittance of a closed-loop system and the transmittance of an open system of a first-order astatic object can be seen when transforming the transmittance of an open system into a closed system (4):
G z s = L z ( s ) M z ( s ) = G ( s ) G s + 1 = L ( s ) M ( s ) L ( s ) M ( s ) + M ( s ) M ( s ) = L ( s ) M s + L ( s ) = K s T s + 1 + K
where Gz(s)—transmittance of a closed system, Lz(s)—transmittance counter of a closed system, Mz(s)—denominator of the transmittance of a closed system, G(s)—transmittance of the open system, L(s)—transmittance counter of the open system, and M(s)—denominator of the open system transmittance.
Therefore, the transmittance of an open system is the same as the transmittance of a closed-loop system, omitting the free term in the denominator.
Similarly to the load application system (LAS), a square wave signal was selected as input for the identification experiment, the results of which are shown in Figure 12a.
Then, Matlab’s System Identification toolkit was used and the numbers of zeros and poles of the object were initially set to 0 and 2, respectively. The result is the estimated transmittance of the closed-loop system, from which, after removing the free term from the denominator and dividing by the scaling gain in the system, a model of the amplifier-servo-valve-actuator system was obtained (5):
G s = 206.4 s 2 + 23.34 s
To verify the accuracy of the obtained model, its static characteristics were determined and compared with the actual static characteristics of the tested system. The result of this comparison is shown in Figure 12b.
In the control system (A), there is an external disturbance, exerted by the load application system (B). To correctly simulate the operation of the system (A), it must be included in the mathematical model of the positioning system, Figure 13a. Once again, identification must be performed, this time for the transmittance of the load application path. The identification experiment consists of applying an input signal to the disturbance path (which in this case is pressure) and observing how it affects the output of the system (which is the displacement of the actuator). The result of the identification experiment is shown in Figure 13b.
Using the System Identification toolbox, the transmittance of the disturbance path was estimated (6):
G o b s = 64.72 s 16.45 s 3 + 76.54 s 2 + 2009 s
where Gob(s) is the operator transmittance of the load application path.
The parameters obtained from the simulation of the positioning system allow for the selection and testing of various types and parameters of controllers for which we want to obtain a DT with satisfactory operation accuracy.

4.2. Tuning and Simulation of the Example Controllers: PID and Fuzzy

The next step was to design a controller for Control System TS. Two frequently used controllers, PID and fuzzy, were selected for station testing. The PID controller is the most commonly used controller in the industry. Its operation consists of calculating the error, i.e., the difference between the setpoint and the actual output value of the object, and, then, using three modules, proportional, integral, and derivative, it calculates the desired control signal in order to minimize the error. The PID controller is easy to implement in most cases and is very effective if the object operates at a predetermined operating point. The disadvantages of the PID controller include the difficulty in selecting the most appropriate settings; e.g., the Ziegler–Nichols method requires the object to enter unquenching oscillations, which, in the case of real objects, can result in damage to the equipment and, in extreme cases, can also be dangerous for the operator. This problem can be overcome by conducting simulation tests on a Digital Twin object, which is presented in this paper. Another disadvantage of the PID controller is poor handling of the object’s non-linearity and problems with operation when working far from the designed operating point.
The fuzzy controller is based on the use of fuzzy variables, which assign to input values the degrees of membership in the given fuzzy sets, and then, on this basis, the values of the control signal are determined. The advantages of the fuzzy controller include the lack of the need for detailed knowledge of the system when designing it because the fuzzy rules and the rule base can be determined intuitively and based on the subjective experience of the object operator. Fuzzy controllers are slightly more difficult to implement in industrial control systems and do not provide as precise control as PID controllers at established operating points but they cope better with external disturbances and when the object moves away from the established operating point.
For the purposes of the tests, it was decided to prepare and compare two previously mentioned controllers: PID and fuzzy. The advantages of the PID controller are good operation for linear and stationary systems. The advantages of the fuzzy controller are good control results, even in the case of minor parameter changes and, in addition, selecting its settings, i.e., rules and membership functions, is intuitive. The PID controller settings were determined using the Response Optimization toolkit. The settings obtained are as follows: P: 7.1545, I: −0.0047, D: 0.1473.
The discrete transmittance of the PID controller is expressed by Equation (7):
G P I D z = P + I T s 1 z 1 + D 1 T s z 1 z
where GPID(z)—transmittance of a discrete PID controller, P—proportional gain factor, I—integrating gain factor, D—derivative gain factor, and Ts—sampling time.
The design of the fuzzy controller consisted of determining the input variables, the membership function for them, the output variable, and developing a rule base. The input variables were the error in the piston position control and the pressure in the load application actuator A2. The output variable was established as the control signal for the servo valve amplifier. The graphs of the membership function are shown in Figure 14 (a—error, b—load, c—control).
The next step is to build a base of rules that are based on linguistic variables, which allows their intuitive formulation. For example, “If the error is strong and negative and the load is slight, the control must be significantly reduced”.
Finally, the defuzzification method was selected, as shown in Figure 14d. The area marked in blue is the result membership function, which tells us to what extent a given premise affects the output value. Depending on the selected method, the final value of the output variable Y can take different values. For the first maximum method, the variable Y takes on the value of the coordinate for which the first maximum of the activation degree of the premises will appear, so, in this case, the value is marked as ‘a’. The center and the last maximum methods are analogous with the difference with which the search for the center or last maximum of the activation degree is carried out. In this case, the variable Y would take values marked as ‘b’ and ‘c’, respectively. In the center of gravity method, the output Y of the fuzzy controller takes on the value of the coordinate of the center of gravity ‘d’ of the figure, which is created by the resultant activation function—this method was finally selected.
The next step was to conduct a simulation of System A (including the controllers tested: PID and fuzzy), which took into account the mathematical model of the positioning system and the variable load application subsystem B, adding disturbances. Figure 15 shows the whole model in Matlab Simulink.
Figure 16 shows the simulation results (the gray rectangle shows a close-up of the selected area): red waveform—set value, green waveform—response of the system with a PID controller, blue waveform—response of the system with a fuzzy controller, purple waveform—pressure in the actuator.
The signal waveforms obtained during the simulation shown in the graphs indicate that the PID controller is better at maintaining the actuator in the set position when the disturbances are caused by the load setting system according to the square waveform. The fuzzy controller in the given simulation conditions has clear problems with maintaining the actuator position after cyclic changes of disturbances and also shows a growing drift from the set value. This indicates the need to tune the controller, which was completed.

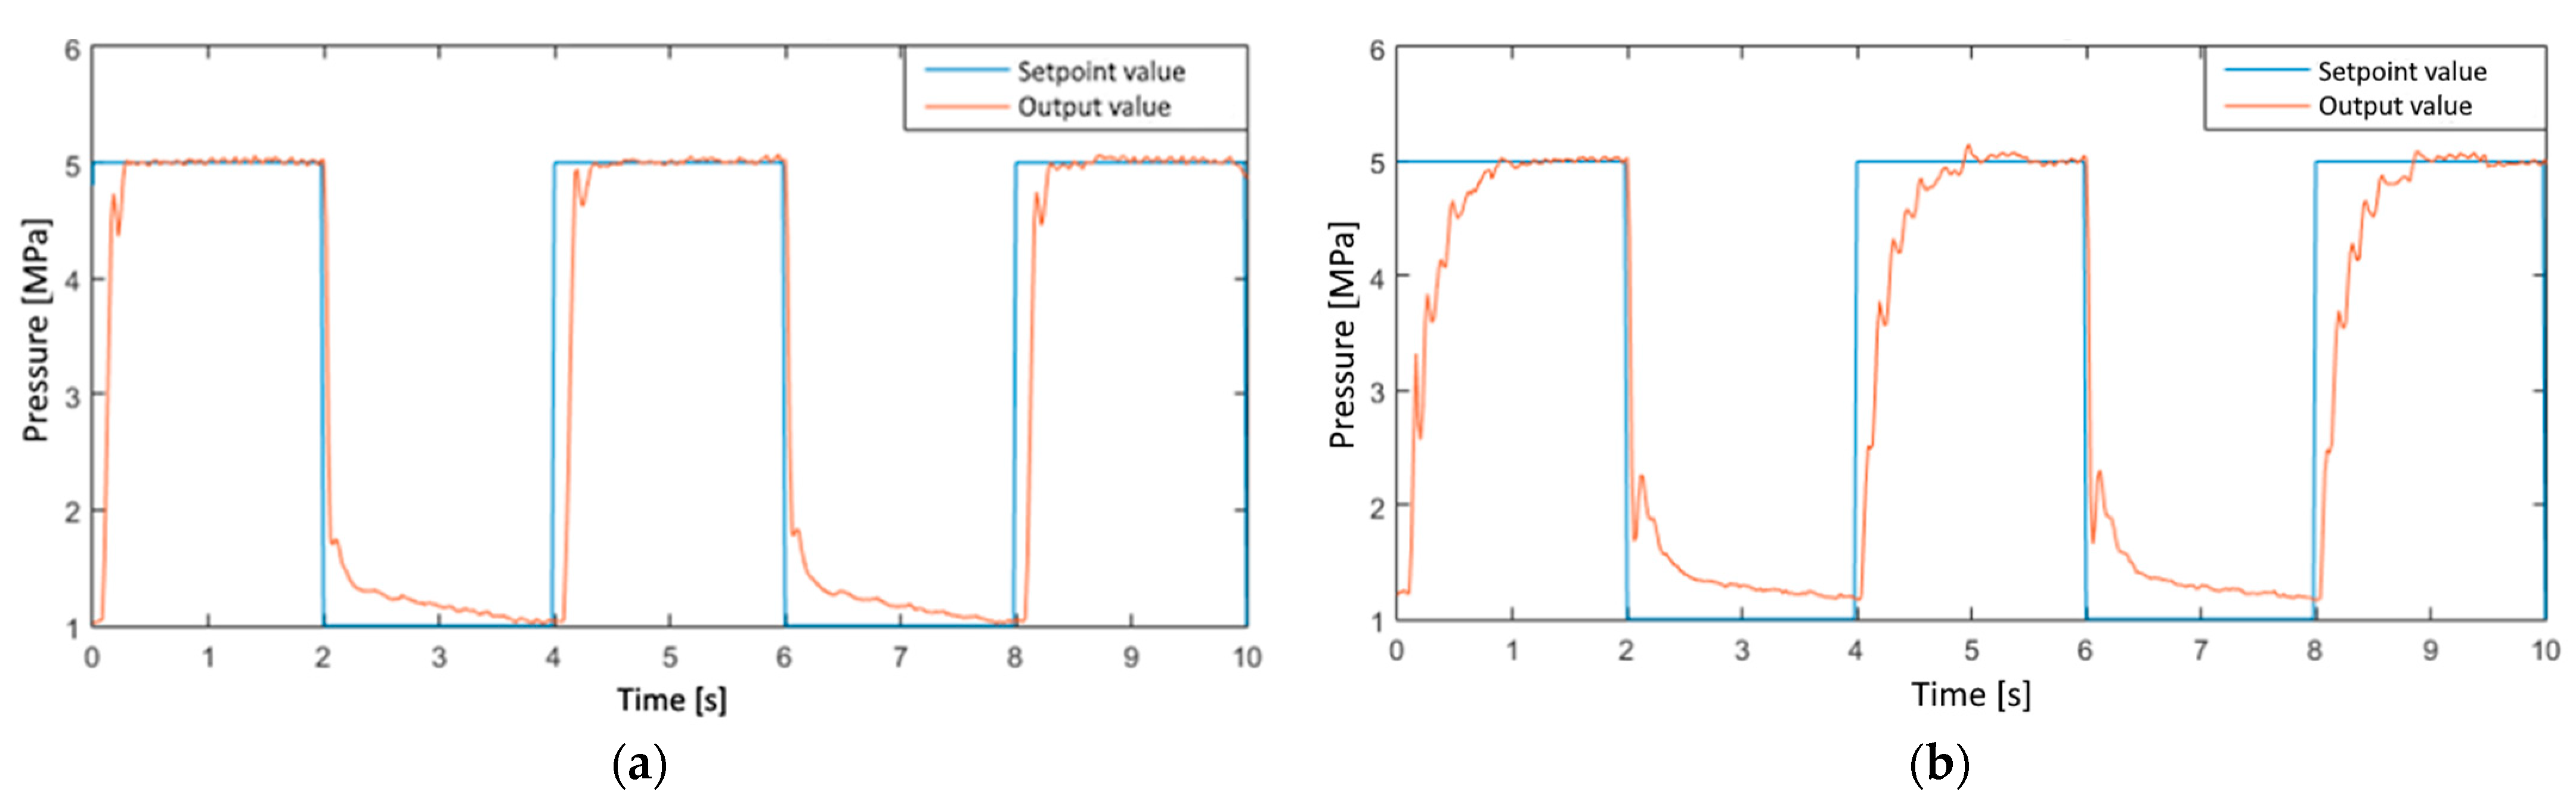
4.3. Tests of the Laboratory Station

Finally, an analogous experiment was carried out, this time on real equipment. The results for the control systems with PID and fuzzy controllers are shown in Figure 17 and Figure 18; the main output parameter is the actuator position. The gray rectangle shows an enlarged fragment of the graph.
The PID controller is characterized by a slightly better regulation time, due to the fact that its settings are fine-tuned for the given system parameters. It can be assumed that with a small change in these parameters, the PID controller would not maintain its good control properties, in contrast to the fuzzy controller, which is resistant to such changes.
In order to determine which of the controllers is better at maintaining the set position under variable load conditions, it was decided to introduce an error size indicator, which will be the integral of the square of the difference between the set value and the piston position. The integral mentioned will actually be the sum of n elements because the measured signals are discrete. The formula for the error indicator (8):
w = j = 1 n x j y j 2
where w—error indicator, n—number of samples, jj-th sample number, xj—position setpoint at j-th instant, and yj—measured position at j-th instant.
The error indicator was calculated for the waveforms shown in Figure 17 and Figure 18 in the time interval from 4 to 20 s of measurement. In this interval, both graphs of the current piston position are already stabilized at the level of the set position and the deviations that appear there are only the result of the external load, so the indicator will help determine which controller is better at eliminating interference. Additionally, in the time interval from 4 to 20 s of measurement, the external load goes through exactly four cycles of variability for both the measurement performed for the positioning system with a fuzzy controller and with a PID controller. The error indicator was calculated using Matlab and its values are as follows:
  • For the PID controller: 1.3031;
  • For the fuzzy controller: 1.8612.
Analysis of the results shows that both controllers cope well with the task of positioning the actuator under variable load. There is no overshoot or static error in the waveforms. In the case of variable load, the controllers compensate for the deviation of the piston position back to the set point.

5. Summary

As a result of the work carried out, a framework was obtained that allows testing control systems of electro-hydraulic elements in order to create their Digital Twin or Digital Shadow. The designed and tested laboratory station for testing and tuning Digital Twin control systems of hydraulic actuator positions in variable load conditions allows for practical verification of the accuracy of hydraulic control systems for various applications, in which it is important to maintain a constant position or move actuators according to a given path, regardless of the current load and other disturbances. The framework describes the methodology and methods for using hardware and software, which allow modeling, selection of parameters, tuning, simulation, and, finally, control of active electro-hydraulic elements in real-time. Thanks to sensor systems and coupling between hardware elements and the control system, as well as software, it is possible to verify the correctness of the selected control algorithms or create a DT/DS of such systems. The developed test station allows the testing of various actuator position control systems, provided that the generated forces are maintained within the range permissible for the pressure setting system and the mechanical structure of the station.
In the traditional approach, the construction of mathematical models should be based on theoretical calculations and the determination of measurement uncertainties but, in the example used, it was decided to use direct identification. Knowing the resulting order of the identified object, ready-made identification tools were used and the parameters of the operator transfer function were matched to the collected identification data and measurement results. The object prepared in this way was subjected to simulation tests and, then, its results were verified with real tests. The fact that the results were similar allows us to state that a simplified approach to the identification problem, omitting classical theoretical calculations, is equally effective. The need to shorten the time of developing new solutions, algorithms, and structures, related to the challenges of the modern competitive economy, means that such methods, thanks to the growing computing power of computers and the application of artificial intelligence algorithms, will be used more and more often.
During laboratory tests, the correctness of the developed methodology was confirmed using two simple controllers, PID and fuzzy, but the hardware, software, and methodology can be applied to any much more advanced actuator position control systems, not only hydraulic ones—the only condition is to create sensor connections for these systems or to use additional sensors integrated with the DT/DS testing and tuning station.
Tuning the controller settings, which is performed on a real object, is often troublesome and may carry certain risks. The experiments carried out have shown that, after performing appropriate measurements and identification tests, a Digital Twin of the electro-hydraulic system can be created, on which various control strategies can be tested in a safe simulation environment, without fear of damaging the real object. The proposed approach (methodology, software, and hardware) can be extended to more complex electro-hydraulic systems, e.g., those consisting of a larger number of actuators, the movement of which should be synchronized with each other in order to achieve the required position and orientation in space. Testing and tuning such complex systems can be difficult (e.g., power consumption, human and expensive construction safety issues); therefore, it is reasonable to conduct preliminary tests and selections of controllers in a safe simulation environment, so as not to waste resources on initial hardware tests, and to start them only after appropriate refinement of the control strategies.

Author Contributions

Conceptualization, G.Ć. and M.S.; methodology, G.Ć. and M.S.; software, M.S.; validation, G.Ć. and M.S.; formal analysis, G.Ć. and M.S.; resources, G.Ć.; data curation, M.S.; writing—original draft preparation, G.Ć. and M.S.; writing—review and editing, G.Ć. and M.S.; visualization, G.Ć. and M.S. All authors have read and agreed to the published version of the manuscript.

Funding

This research received no external funding.

Data Availability Statement

Data obtained during the research will be made available by the authors upon request to interested parties.

Conflicts of Interest

The authors declare no conflicts of interest.

References

  1. Barricelli, B.R.; Casiraghi, E.; Fogli, D. A Survey on Digital Twin: Definitions, Characteristics, Applications, and Design Implications. IEEE Access 2019, 7, 167653–167671. [Google Scholar] [CrossRef]
  2. Liu, M.; Fang, S.; Dong, H.; Xu, C. Review of Digital Twin about Concepts, Technologies, and Industrial Applications. J. Manuf. Syst. 2021, 58, 346–361. [Google Scholar] [CrossRef]
  3. Kritzinger, W.; Karner, M.; Traar, G.; Henjes, J.; Sihn, W. Digital Twin in Manufacturing: A Categorical Literature Review and Classification. IFAC-PapersOnLine 2018, 51, 1016–1022. [Google Scholar] [CrossRef]
  4. Negri, E.; Fumagalli, L.; Macchi, M. A Review of the Roles of Digital Twin in CPS-Based Production Systems. Procedia Manuf. 2017, 11, 939–948. [Google Scholar] [CrossRef]
  5. Pizoń, A. Hydrauliczne i Elektrohydrauliczne Układy Sterowania i Regulacji [in Polish] Hydraulic and Electrohydraulic Control and Regulation Systems; Wydawnictwa Naukowo-Techniczne: Warszawa, Poland, 1987; ISBN 83-204-0851-2. [Google Scholar]
  6. Zhu, T.; Xie, H.; Yang, H. Design and Tracking Control of an Electro-Hydrostatic Actuator for a Disc Cutter Replacement Manipulator. Autom. Constr. 2022, 142, 104480. [Google Scholar] [CrossRef]
  7. Andersen, T.; Pedersen, H.; Bech, M.; Schmidt, L. A Low Order Adaptive Control Scheme for Hydraulic Servo Systems. In Proceedings of the 2015 International Conference on Fluid Power and Mechatronics (FPM), Harbin, China, 5–7 August 2015; pp. 1148–1152. [Google Scholar]
  8. Kim, J.; Jin, M.; Choi, W.; Lee, J. Discrete Time Delay Control for Hydraulic Excavator Motion Control with Terminal Sliding Mode Control. Mechatronics 2019, 60, 15–25. [Google Scholar] [CrossRef]
  9. Chiang, M.-H.; Lee, L.-W.; Huang, K.-S. Development of a Hydraulic-Piezoelectric-Actuator for Hybrid Positioning Control with Large Stroke, High Loading and Sub-Micrometer Accuracy. In Proceedings of the IEEE International Conference on Mechatronics, ICM ’05, Taipei, Taiwan, 10–12 July 2005; pp. 45–49. [Google Scholar]
  10. Lukachev, E.; Scheidl, R. Hydraulic Switching Type Position Control Of A Large Cylinder Drive. In Proceedings of the 2018 Global Fluid Power Society PhD Symposium (GFPS), Samara, Russia, 18–20 July 2018; pp. 1–6. [Google Scholar]
  11. Jin, L.; Wang, Q. Positioning Control of Hydraulic Cylinder with Unknown Friction Using on/off Directional Control Valve. Proc. Inst. Mech. Eng. Part J. Syst. Control Eng. 2018, 232, 983–993. [Google Scholar] [CrossRef]
  12. Lei, J.; Wang, X.; Xu, Z.; Luo, Y.; Pi, Y. Position Control for Asymmetrical Hydraulic Cylinder System Using a Single on/off Valve. J. Shanghai Jiaotong Univ. Sci. 2010, 15, 651–656. [Google Scholar] [CrossRef]
  13. Ursu, I.; Toader, A.; Halanay, A.; Balea, S. New Stabilization and Tracking Control Laws for Electrohydraulic Servomechanisms. Eur. J. Control 2013, 19, 65–80. [Google Scholar] [CrossRef]
  14. Liu, Z.; Gao, Q.; Niu, H. The Research on the Position Control of the Hydraulic Cylinder Based on the Compound Algorithm of Fuzzy & Feedforward-Feedback. Sens. Transducers 2014, 162, 314. [Google Scholar]
  15. Dang, X.; Zhao, X.; Dang, C.; Jiang, H.; Wu, X.; Zha, L. Incomplete Differentiation-Based Improved Adaptive Backstepping Integral Sliding Mode Control for Position Control of Hydraulic System. ISA Trans. 2021, 109, 199–217. [Google Scholar] [CrossRef]
  16. Sekhavat, P.; Wu, Q.; Sepehri, N. Lyapunov-Based Friction Compensation for Accurate Positioning of a Hydraulic Actuator. In Proceedings of the 2004 American Control Conference, Boston, MA, USA, 30 June–2 July 2004; Volume 1, pp. 418–423. [Google Scholar]
  17. Jiang, C.; Sui, S.; Tong, S. Finite-Time Fuzzy Adaptive Output Feedback Control of Electro-Hydraulic System with Actuator Faults. Inf. Sci. 2023, 623, 577–591. [Google Scholar] [CrossRef]
  18. Shi, J.; Quan, L.; Zhang, X.; Xiong, X. Electro-Hydraulic Velocity and Position Control Based on Independent Metering Valve Control in Mobile Construction Equipment. Autom. Constr. 2018, 94, 73–84. [Google Scholar] [CrossRef]
  19. Meena, K.; Dhavalikar, M.; Thorat, S. A Review on the Position Control of Hydraulic Cylinder for Accuracy and Response Time. Mater. Today Proc. 2023, 72, 995–999. [Google Scholar] [CrossRef]
  20. Meng, J.; Wang, X.; Liu, Z.; Wang, B. Design and Simulate Analysis on Fuzzy Sliding Mode Controller in High Precise Electro-Hydraulic System. In Proceedings of the 2009 First International Workshop on Education Technology and Computer Science, Wuhan, China, 7–8 March 2009; pp. 441–445. [Google Scholar]
  21. Jin, K.; Yan, H.-z.; Tan, W.-z.; Chen, X.-y. United Simulation of Hydraulic System and Control System of Dumping Casting Machine by Low Flow Hydraulic Driving. In Proceedings of the 2012 Power Engineering and Automation Conference, Wuhan, China, 18–20 September 2012; pp. 1–4. [Google Scholar]
  22. Sosnovsky, N.; Ganieva, D. Mathematical Modeling and Analysis of the Electrohydraulic Actuator with the Throttle Control. IOP Conf. Ser. Mater. Sci. Eng. 2019, 589, 012016. [Google Scholar] [CrossRef]
  23. Acuña-Bravo, W.; Canuto, E.; Agostani, M.; Bonadei, M. Proportional Electro-Hydraulic Valves: An Embedded Model Control Solution. Control Eng. Pract. 2017, 62, 22–35. [Google Scholar] [CrossRef]
  24. Tran, N.H.; Tao, Q.B.; Huynh, T.T.; Tran, X.T.; Vo, N.T. Modeling of Position Control for Hydraulic Cylinder Using Servo Valve. In Proceedings of the Intelligent Information and Database Systems: 10th Asian Conference, ACIIDS 2018, Dong Hoi City, Vietnam, 19–21 March 2018; Proceedings, Part II 10. Springer: Cham, Switzerland, 2018; pp. 696–706. [Google Scholar]
  25. Maghareh, A.; Silva, C.E.; Dyke, S.J. Servo-Hydraulic Actuator in Controllable Canonical Form: Identification and Experimental Validation. Mech. Syst. Signal Process. 2018, 100, 398–414. [Google Scholar] [CrossRef]
  26. Gao, B.; Shao, J.; Yang, X. A Compound Control Strategy Combining Velocity Compensation with ADRC of Electro-Hydraulic Position Servo Control System. ISA Trans. 2014, 53, 1910–1918. [Google Scholar] [CrossRef]
  27. Çetin, Ş.; Akkaya, A.V. Simulation and Hybrid Fuzzy-PID Control for Positioning of a Hydraulic System. Nonlinear Dyn. 2010, 61, 465–476. [Google Scholar] [CrossRef]
  28. Schwarz, J.; Lohmann, B. Robust Identification and Control of Mobile Hydraulic Systems Using a Decentralized Valve Structure. Control Eng. Pract. 2024, 151, 106030. [Google Scholar] [CrossRef]
  29. Wonohadidjojo, D.M.; Kothapalli, G.; Hassan, M.Y. Position Control of Electro-Hydraulic Actuator System Using Fuzzy Logic Controller Optimized by Particle Swarm Optimization. Int. J. Autom. Comput. 2013, 10, 181–193. [Google Scholar] [CrossRef]
  30. Ghani, M.F.; Ghazali, R.; Jaafar, H.I.; Soon, C.C. Real-Time Trajectory Tracking Control of an Electro-Hydraulic System Using a Fuzzy Logic Sliding Mode Controller. In Proceedings of the 2022 IEEE International Conference on Artificial Intelligence in Engineering and Technology (IICAIET), Kinabalu, Malaysia, 13–15 September 2022; pp. 1–6. [Google Scholar]
  31. Ren, X.; Zhao, Y. Electro-Hydraulic Position Synchronization Control System Based on Auto-Disturbances Rejection and Feedback. In Proceedings of the World Automation Congress 2012, Puerto Vallarta, Mexico, 24–28 June 2012; pp. 1–4. [Google Scholar]
  32. Chen, H.-M.; Renn, J.-C.; Su, J.-P. Sliding Mode Control with Varying Boundary Layers for an Electro-Hydraulic Position Servo System. Int. J. Adv. Manuf. Technol. 2005, 26, 117–123. [Google Scholar] [CrossRef]
  33. Zheng, J.; Zhao, S.; Wei, S. Adaptive Fuzzy PID Control for Switched Reluctance Motor Direct Drive Servo Hydraulic Press. In Proceedings of the 2009 International Conference on Measuring Technology and Mechatronics Automation, Zhangjiajie, China, 11–12 April 2009; Volume 1, pp. 771–774. [Google Scholar]
  34. Noskievič, P. Smart Control of the Integrated Hydraulic Actuator. In Proceedings of the 2018 19th International Carpathian Control Conference (ICCC), Szilvasvarad, Hungary, 28–31 May 2018; pp. 307–311. [Google Scholar]
  35. Shi, H.; Yang, J.; Mei, X.; Gong, G. Coordination Control for Parallel Actuation of Hydraulic Power Assisted Ball Screw Drive System. In Proceedings of the 2015 IEEE Advanced Information Technology, Electronic and Automation Control Conference (IAEAC), Chongqing, China, 19–20 December 2015; pp. 1010–1014. [Google Scholar]
  36. Chen, Z.; Wang, S.; Xu, K.; Wang, J.; Zhao, J.; Niu, S. Research on High Precision Control of Joint Position Servo System for Hydraulic Quadruped Robot. In Proceedings of the 2019 Chinese Control Conference (CCC), Guangzhou, China, 27–30 July 2019; pp. 755–760. [Google Scholar]
  37. Zhang, L.; Li, Y. Synchronous Control of Double Hydraulic Cylinders of Scissors Aerial Work Platform Based on Fuzzy PID. In Proceedings of the 2020 5th International Conference on Electromechanical Control Technology and Transportation (ICECTT), Nanchang, China, 15–17 May 2020; pp. 349–354. [Google Scholar]
  38. Bernzen, W.; Wey, T.; Riege, B. Nonlinear Control of Hydraulic Differential Cylinders Actuating a Flexible Robot. In Proceedings of the 36th IEEE Conference on Decision and Control, San Diego, CA, USA, 10–12 December 1997; Volume 2, pp. 1333–1334. [Google Scholar]
  39. Shen, W.; Pan, J. Angle Tracking Control of Integrated Hydraulic Transformer Inner Loop Servo System. ISA Trans. 2023, 134, 312–321. [Google Scholar] [CrossRef] [PubMed]
  40. Shen, W.; Zhao, H.; Zhang, G.; Lin, Y.-J. An Event-Triggered Based Robust Control for Electro-Hydraulic Servo Machines with Active Disturbances Rejection. J. Frankl. Inst. 2022, 359, 2857–2885. [Google Scholar] [CrossRef]
  41. Han, W.; Xiong, L.; Yu, Z. Braking Pressure Control in Electro-Hydraulic Brake System Based on Pressure Estimation with Nonlinearities and Uncertainties. Mech. Syst. Signal Process. 2019, 131, 703–727. [Google Scholar] [CrossRef]
  42. Razmjooei, H.; Palli, G.; Nazari, M. Disturbance Observer-Based Nonlinear Feedback Control for Position Tracking of Electro-Hydraulic Systems in a Finite Time. Eur. J. Control 2022, 67, 100659. [Google Scholar] [CrossRef]
  43. Hung, H.T.; Kwan, A.K. A Study on the Position Control of Hydraulic Cylinder Driven by Hydraulic Transformer Using Disturbance Observer. In Proceedings of the 2008 International Conference on Control, Automation and Systems, Seoul, Republic of Korea, 14 October 2008; pp. 2634–2639. [Google Scholar]
  44. Bai, Y.; Yao, J.; Hu, J.; Feng, G. Output Feedback Active Disturbance Rejection Control of an Electro-Hydraulic Servo System Based on Command Filter. Chin. J. Aeronaut. 2024, S1000936124003017. [Google Scholar] [CrossRef]
  45. Wang, T.; Zhang, Q.; Fang, J.; Lai, Z.; Feng, R.; Wei, J. Active Fault-Tolerant Control for the Dual-Valve Hydraulic System with Unknown Dead-Zone. ISA Trans. 2024, 145, 399–411. [Google Scholar] [CrossRef]
  46. Jiang, S.; Huang, F.; Liu, W.; Huang, Y.; Chen, Y. A Double Closed-Loop Digital Hydraulic Cylinder Position System Based on Global Fast Terminal Sliding Mode Active Disturbance Rejection Control. IEEE Access 2024, 12, 80138–80152. [Google Scholar] [CrossRef]
  47. Diao, S.; Zhao, X.; Zhao, D.; Dong, Z.; Qin, Y. Active Suspension Hierarchical Control with Parameter Uncertainty and External Disturbance of Electro-Hydraulic Actuators. Appl. Math. Model. 2024, 134, 50–70. [Google Scholar] [CrossRef]
  48. Rituraj, R.; Scheidl, R. Towards Digital Twin Development of Counterbalance Valves: Modelling and Experimental Investigation. Mech. Syst. Signal Process. 2023, 188, 110049. [Google Scholar] [CrossRef]
  49. Jiao, X.; Xie, J.; Wang, X.; Yan, Z.; Hao, Z.; Wang, X. Intelligent Decision Method for the Position and Attitude Self-Adjustment of Hydraulic Support Groups Driven by a Digital Twin System. Measurement 2022, 202, 111722. [Google Scholar] [CrossRef]
  50. Cai, N.; Xie, J.; Wang, X.; Liu, S.; Du, W. Method for the Relative Pose Reconstruction of Hydraulic Supports Driven by Digital Twins. IEEE Sens. J. 2023, 23, 4707–4719. [Google Scholar] [CrossRef]
  51. Li, M.; Wei, J.; Fang, J.; Shi, W.; Guo, K. Fuzzy Impedance Control of an Electro-Hydraulic Actuator with an Extended Disturbance Observer. Front. Inf. Technol. Electron. Eng. 2019, 20, 1221–1233. [Google Scholar] [CrossRef]
  52. Sun, C.; Fang, J.; Wei, J.; Hu, B. Nonlinear Motion Control of a Hydraulic Press Based on an Extended Disturbance Observer. IEEE Access 2018, 6, 18502–18510. [Google Scholar] [CrossRef]
  53. Ye, Y.; Yin, C.-B.; Gong, Y.; Zhou, J. Position Control of Nonlinear Hydraulic System Using an Improved PSO Based PID Controller. Mech. Syst. Signal Process. 2017, 83, 241–259. [Google Scholar] [CrossRef]
  54. Minav, T.; Pietola, M.; Filatov, D.M.; Devyatkin, A.V.; Heikkinen, J. Fuzzy Control of Direct-Driven Hydraulic Drive without Conventional Oil Tank. In Proceedings of the 2017 XX IEEE International Conference on Soft Computing and Measurements (SCM), Saint Petersburg, Russia, 24–26 May 2017; pp. 444–447. [Google Scholar]
  55. Feng, Y.; Ide, T.; Nabae, H.; Endo, G.; Sakurai, R.; Ohno, S.; Suzumori, K. Experimental Comparison of Antagonistic Hydraulic Muscle Actuation under Single/Dual and Zero/Overlapped Servovalve Configurations. Mechatronics 2022, 83, 102737. [Google Scholar] [CrossRef]
  56. Bonchis, A.; Corke, P.I.; Rye, D.C. Experimental Evaluation of Position Control Methods for Hydraulic Systems. IEEE Trans. Control Syst. Technol. 2002, 10, 876–882. [Google Scholar] [CrossRef]
  57. Moog G771, G772, G773, 771, 772, and 773 Series Direct-Operated Servo Valves for Analog Signals. Available online: https://www.moog.com/literature/ICD/77seriesvalves.pdf (accessed on 23 October 2023).
  58. PONAR Wadowice Zawory Sterujące Ciśnieniem, Zawory Przelewowe Przelewowe Nabojowe, Proporcjonalne Typ WZPSE6 [in Polish]. Pressure Control Valves, Cartridge Pressure Relief Valves, Proportional Type WZPSE6. Available online: https://www.ponar-wadowice.pl/typ/667-zawory-sterujace-cisnieniem-zawory-przelewowe-przelewowe-nabojowe-proporcjonalne-wzpse6 (accessed on 22 October 2023).
  59. Meilhaus Electronic RedLab-1008, USB-1008, MiniLab-1008. Available online: https://www.meilhaus.de/en/redlab-1008.htm (accessed on 22 October 2023).
  60. Balluff BTL0324 (BTL5-E10-M0150-P-S32) Magnetostrictive Linear Position Sensors in Profile Design. Available online: https://www.balluff.com/en-lv/products/BTL5-E10-M0150-P-S32 (accessed on 12 November 2023).
  61. Danfoss Pressure Transmitter Sensor MBS 32-3015-1AB08. Available online: https://www.mandmcontrols.com/060g1259 (accessed on 12 November 2023).
  62. Zelpro Regulowany Wzmacniacz Prądu 20RE10E—Adjustable Current Amplifier. Available online: http://zelpro.com.pl/sterowanie-hydrauliki-proporcjonalnej/101-2/ (accessed on 12 November 2023).
  63. Zimmer, A.; Englot, A. Identyfikacja Obiektów i Sygnałów: Teoria i Praktyka Dla Użytkowników Matlaba [in Polish]. Object and Signal Identification: Theory and Practice for Matlab Users; Wydawnictwo PK: Kraków, Poland, 2005. [Google Scholar]
Figure 1. Hydraulic diagram of the DT/DS test station (TS—tested system, LAS—load application system): P1—variable capacity hydraulic pump; P2—constant capacity hydraulic pump; A1—hydraulic actuator being tested; A2—hydraulic actuator applying the load on the A1 actuator; S1—analog position sensor of the A1 actuator; S2—analog pressure sensor; V1—throttle valve; V2, V3, V8—safety valves; V4—servo valve; V5—flow direction valve; V6—proportional overflow valve; V7, V9—check valves.
Electronics 13 03528 g001
Figure 2. Electrical diagram of the station: S1—analog piston position sensor; S2—analog pressure sensor; V4—servo valve coil; V6—proportional overflow valve coil; U1—amplifier for the Moog servo valve; U2—Zelpro amplifier for proportional valve; U3—voltage divider; U4—RedLab 1008 measurement and control card; G1—24V unipolar power supply; G2—18V bipolar power supply.
Electronics 13 03528 g002
Figure 3. Methodology of design and identification of the load application subsystem.
Electronics 13 03528 g003
Figure 4. The diagram of the pressure control system for the programmed load application.
Electronics 13 03528 g004
Figure 5. The identification experiment: X(s)—input signal, Y(s)—output signal: (a) actual scheme of the object being identified, (b) simplified model of the object.
Electronics 13 03528 g005
Figure 6. The result of the load application subsystem identification experiment (a) and the waveforms of the signals used in the identification processes (b).
Electronics 13 03528 g006
Figure 7. The Matlab Simulink model of a non-linear load application system block diagram (a), comparison of static characteristics of linear and non-linear models with real data (b).
Electronics 13 03528 g007
Figure 8. A closed-loop non-linear model system for which controller settings were determined.
Electronics 13 03528 g008
Figure 9. Results of the simulation of the load application subsystem with a non-linear model.
Electronics 13 03528 g009
Figure 10. Response of the load application subsystem with the PI controller to a rectangular signal, (a) settings obtained by the SDO toolkit, and (b) settings obtained by the Z–N method.
Electronics 13 03528 g010
Figure 11. Block diagram of positioning system identification: (a) detailed diagram, (b) simplified diagram with the sought transmittance of the system Gu(s), (c) simplified diagram for the transmittance of the closed-loop system Gz(s).
Electronics 13 03528 g011
Figure 12. Identification of the positioning system: (a) signal waveforms obtained in the identification experiment, (b) static characteristics of the real object and its model.
Electronics 13 03528 g012
Figure 13. Modeling of the disturbances: diagram of the model, taking artificially introduced disturbances into account (a), and signals used to identify the disturbance path (b).
Electronics 13 03528 g013
Figure 14. The membership function adopted for the input and output variables of the fuzzy controller for (a) the control error signal, (b) the loading pressure signal, (c) the servo-valve amplifier control signal; and (d) the graph of defuzzification methods.
Electronics 13 03528 g014
Figure 15. Model of the actuator positioning system operating under variable load in Simulink.
Electronics 13 03528 g015
Figure 16. Simulation results of the positioning system operating under a variable external load.
Electronics 13 03528 g016
Figure 17. Response of the positioning system using a PID controller.
Electronics 13 03528 g017
Figure 18. Response of the positioning system using a fuzzy controller.
Electronics 13 03528 g018
Table 1. Transmittance of continuous and discrete PI controllers with settings obtained using the Z–N method and the SDO toolkit.
Continuous TransmittanceDiscrete Transmittance
Settings obtained using
the Z–N method
G s = 0.459 s + 3.456 s G z = 0.459 z 0.3899 z 1
Settings obtained using
the SDO toolkit
G s = 0.2861 s + 6.33 s G z = 0.2861 z 0.1595 z 1
Disclaimer/Publisher’s Note: The statements, opinions and data contained in all publications are solely those of the individual author(s) and contributor(s) and not of MDPI and/or the editor(s). MDPI and/or the editor(s) disclaim responsibility for any injury to people or property resulting from any ideas, methods, instructions or products referred to in the content.

