Article

Integration of Rooftop Solar PV on Trains: Comparative Analysis of MPPT Methods for Auxiliary Power Supply of Locomotives in Milan

by
Yasaman Darvishpour
1,
Sayed Mohammad Mousavi Gazafrudi
1,*,
Hamed Jafari Kaleybar
2 and
Morris Brenna
2,*
1
School of Railway Engineering, Iran University of Science and Technology, Tehran 13114-16846, Iran
2
Energy Department, Politecnico di Milano, 20156 Milan, Italy
*
Authors to whom correspondence should be addressed.
Electronics 2024, 13(17), 3537; https://doi.org/10.3390/electronics13173537
Submission received: 25 July 2024 / Revised: 28 August 2024 / Accepted: 4 September 2024 / Published: 6 September 2024
(This article belongs to the Special Issue Railway Traction Power Supply, 2nd Edition)

Abstract

:
As electricity demand increases, especially in transportation, renewable sources such as solar energy become more important. The direct integration of solar energy in rail transportation mostly involves utilizing station roofs and track side spaces. This paper proposes a novel approach by proposing the integration of photovoltaic systems directly on the roofs of trains to generate clean electricity and reduce dependence on the main grid. Installing solar photovoltaic (PV) systems on train rooftops can reduce energy costs and emissions and develop a more sustainable and ecological rail transport system. This research focuses on the Milan Cadorna-Saronno railway line, examining the feasibility of installing PV panels onto train rooftops to generate power for the train’s internal consumption, including lighting and air conditioning. In addition, it is a solution to reduce the power absorbed by the train from the main supply. Simulations conducted using PVSOL software 2023 (R7) indicate that equipping a train roof with PV panels could supply up to almost 10% of the train’s auxiliary power needs, equating to over 600 MWh annually. Implementing the suggested system may also result in a decrease of more than 27 tons of CO2 emissions per year for one train. To optimize the performance of PV systems and maximize power output, the gravitational search algorithm (GSA) as an evolutionary-based method is proposed alongside a DC/DC boost converter and its performance is compared with two other main maximum power point tracking (MPPT) methods of perturb and observe (PO), and incremental conductance (INC). The accuracy of the suggested algorithm was confirmed utilizing MATLAB SIMULINK R2023b, and the results were compared with those of the PO and INC algorithms. The findings indicate that the GSA performs better in terms of accuracy, while the PO and INC algorithms demonstrate greater robustness and dynamic response.

1. Introduction

Today, rail transportation is one of the biggest consumers of electricity in both developed and developing countries. As demand for rail transit grows, challenges related to energy usage and greenhouse gas emissions become increasingly apparent [1,2]. The utilization of renewable energy, particularly solar energy, presents a promising solution to these challenges [3,4]. PV systems are gaining popularity across the world due to various benefits, including low maintenance, low depreciation, low noise, no need for fuel, and no pollution. These systems involve simple construction and can produce power at various ranges, ranging from microwatts to megawatts [5].
The transportation sector could significantly decrease its dependency on fossil fuels by embracing renewable energy technology such as solar-powered electric vehicles. This transformation not only tackles air pollution and greenhouse gas emissions, but it also helps to achieve the overarching objective of building a more resilient and sustainable transportation system. While the indirect combination of renewable energy sources (RESs) into the transportation network has been addressed considerably in studies, there has been less focus on directly merging these technologies into the infrastructure for transportation, notably the electric railway network (ERNs) [6].
Australia’s Byron Bay Railway Company has unveiled a new electric train with solar panels on the roof to generate electricity and charge batteries [7]. Vasisht et al. [8] investigated the viability of placing solar PV modules on train carriage roofs in India. The study found that the accessible rooftop area during daylight hours delivers more power than is necessary for electrical loads, resulting in an anticipated yearly saving of INR 5,900,000 and a decrease of 239 tons in CO2 emissions. Thelkar et al. [9] improved solar power production on railway coaches, leading to a 239-ton decrease in yearly carbon dioxide output and a 2- to 3-year period for payback. In 2017, Indian Railways unveiled its first solar-powered train, with PV panels on the carriages’ roofs [10]. Raizada et al.’s research [11] shows that using solar panels on the train’s roof together with new power electronic converters can be a sustainable and cost-effective solution for supplying electricity to trains. Muhammad Talha et al. [12] conducted research using solar panels on the roof of the CRH2 high-speed train in China, which allowed supercapacitor charging during the voyage and also served as a source of power supply in areas of the “Lanshin” railway that did not have electricity. A recent study by Ouaid and colleagues [13] demonstrates that installing solar panels on the roofs of Moroccan trains can be a viable and environmentally friendly solution for powering them. This innovative design, which has the ability to generate up to 7.5 kW of power at each peak, contributes to a considerable reduction in dependency on fossil fuels and greenhouse gas emissions.
However, there are certain challenging difficulties related to PV systems, including high installation costs, minimal conversion efficiency, and limited accessible power. Due to the high initial costs of PV systems, it is necessary to extract the maximum possible power. The power produced by a PV system is highly dependent on radiation intensity and temperature. As factors vary over time, it is necessary to improve MPPT algorithms to extract maximum power from a PV cell in real-time [14]. One of the lowest-cost and most effective methods of maximizing power from PV systems is MPPT. The task of MPPT is to sample the output of solar panels and adjust the amount of current and voltage that transmit the maximum DC power in various environmental conditions. Photovoltaic panels are most efficient at their maximum power point. MPPT can increase power efficiency by 25% [15].
There are various MPPT algorithms suggested in the literature, including the INC algorithm and the PO approach; these conventional algorithms are simple and easy to put into effect [16]. Using the PO approach, the perturbation in the PV system’s operating voltage is proportional to the difference between the array terminal voltage and the real maximum power point (MPP) voltage. However, it cannot be used to determine the new voltage of operation due to the change in power; it is only evaluated as a consequence of the array voltage at the terminal perturbation [17]. The INC algorithm is based on the notion that the slope of a PV array’s power curve is zero MPP, with positive on the left and negative on the right [18]. Although INC does not lose tracking direction like PO, its tracking speed decreases significantly under rapidly changing ambient circumstances [19].
Artificial neural networks are a powerful tool for MPP tracking, but they also have limitations, including the accuracy of MPP tracking [20]. Hybrid MPPT systems, such as the adaptive neuro-fuzzy inference system described in [21], can somewhat address these limitations, although they are difficult to implement. To achieve more accurate tracking of MPPs, new approaches are needed to track the development process of MPPs.
Evolutionary algorithms are useful tools for tackling optimization issues, but they face challenges when working with nonlinear objective functions [22]. These algorithms have two fundamental characteristics, discovery and exploitation [23]. Discovery is the ability to search for the entire issue, whereas exploitation is the capacity to find the optimum answer. Hence, evolutionary algorithms are capable of solving a limited number of issues.
In the midst of evolutionary algorithms, an innovative evolutionary algorithm called the GSA was first introduced by Rashedi in 2009 [24]. In a study by Saha et al. [25], an innovative GSA is introduced to estimate the optimal point of energy generation in solar systems, and its efficiency is compared to the PSO method. Goldvin et al. [26] introduced a novel method for tracking MPPT in PV systems that combines two optimization methods, PSO and GSA. In a study by Pervez et al. [27], the GSA method was utilized to more accurately determine the MPP in PV systems, even under partial shade conditions. Lee et al. [28] created an improved gravitational search algorithm (IGSA) for MPP tracking.
While most previous studies have explored the integration of solar energy in rail transportation using station roofs, this paper proposes the integration of PVs on the roofs of trains. Overall, the main contributions of this paper are as follows:
-
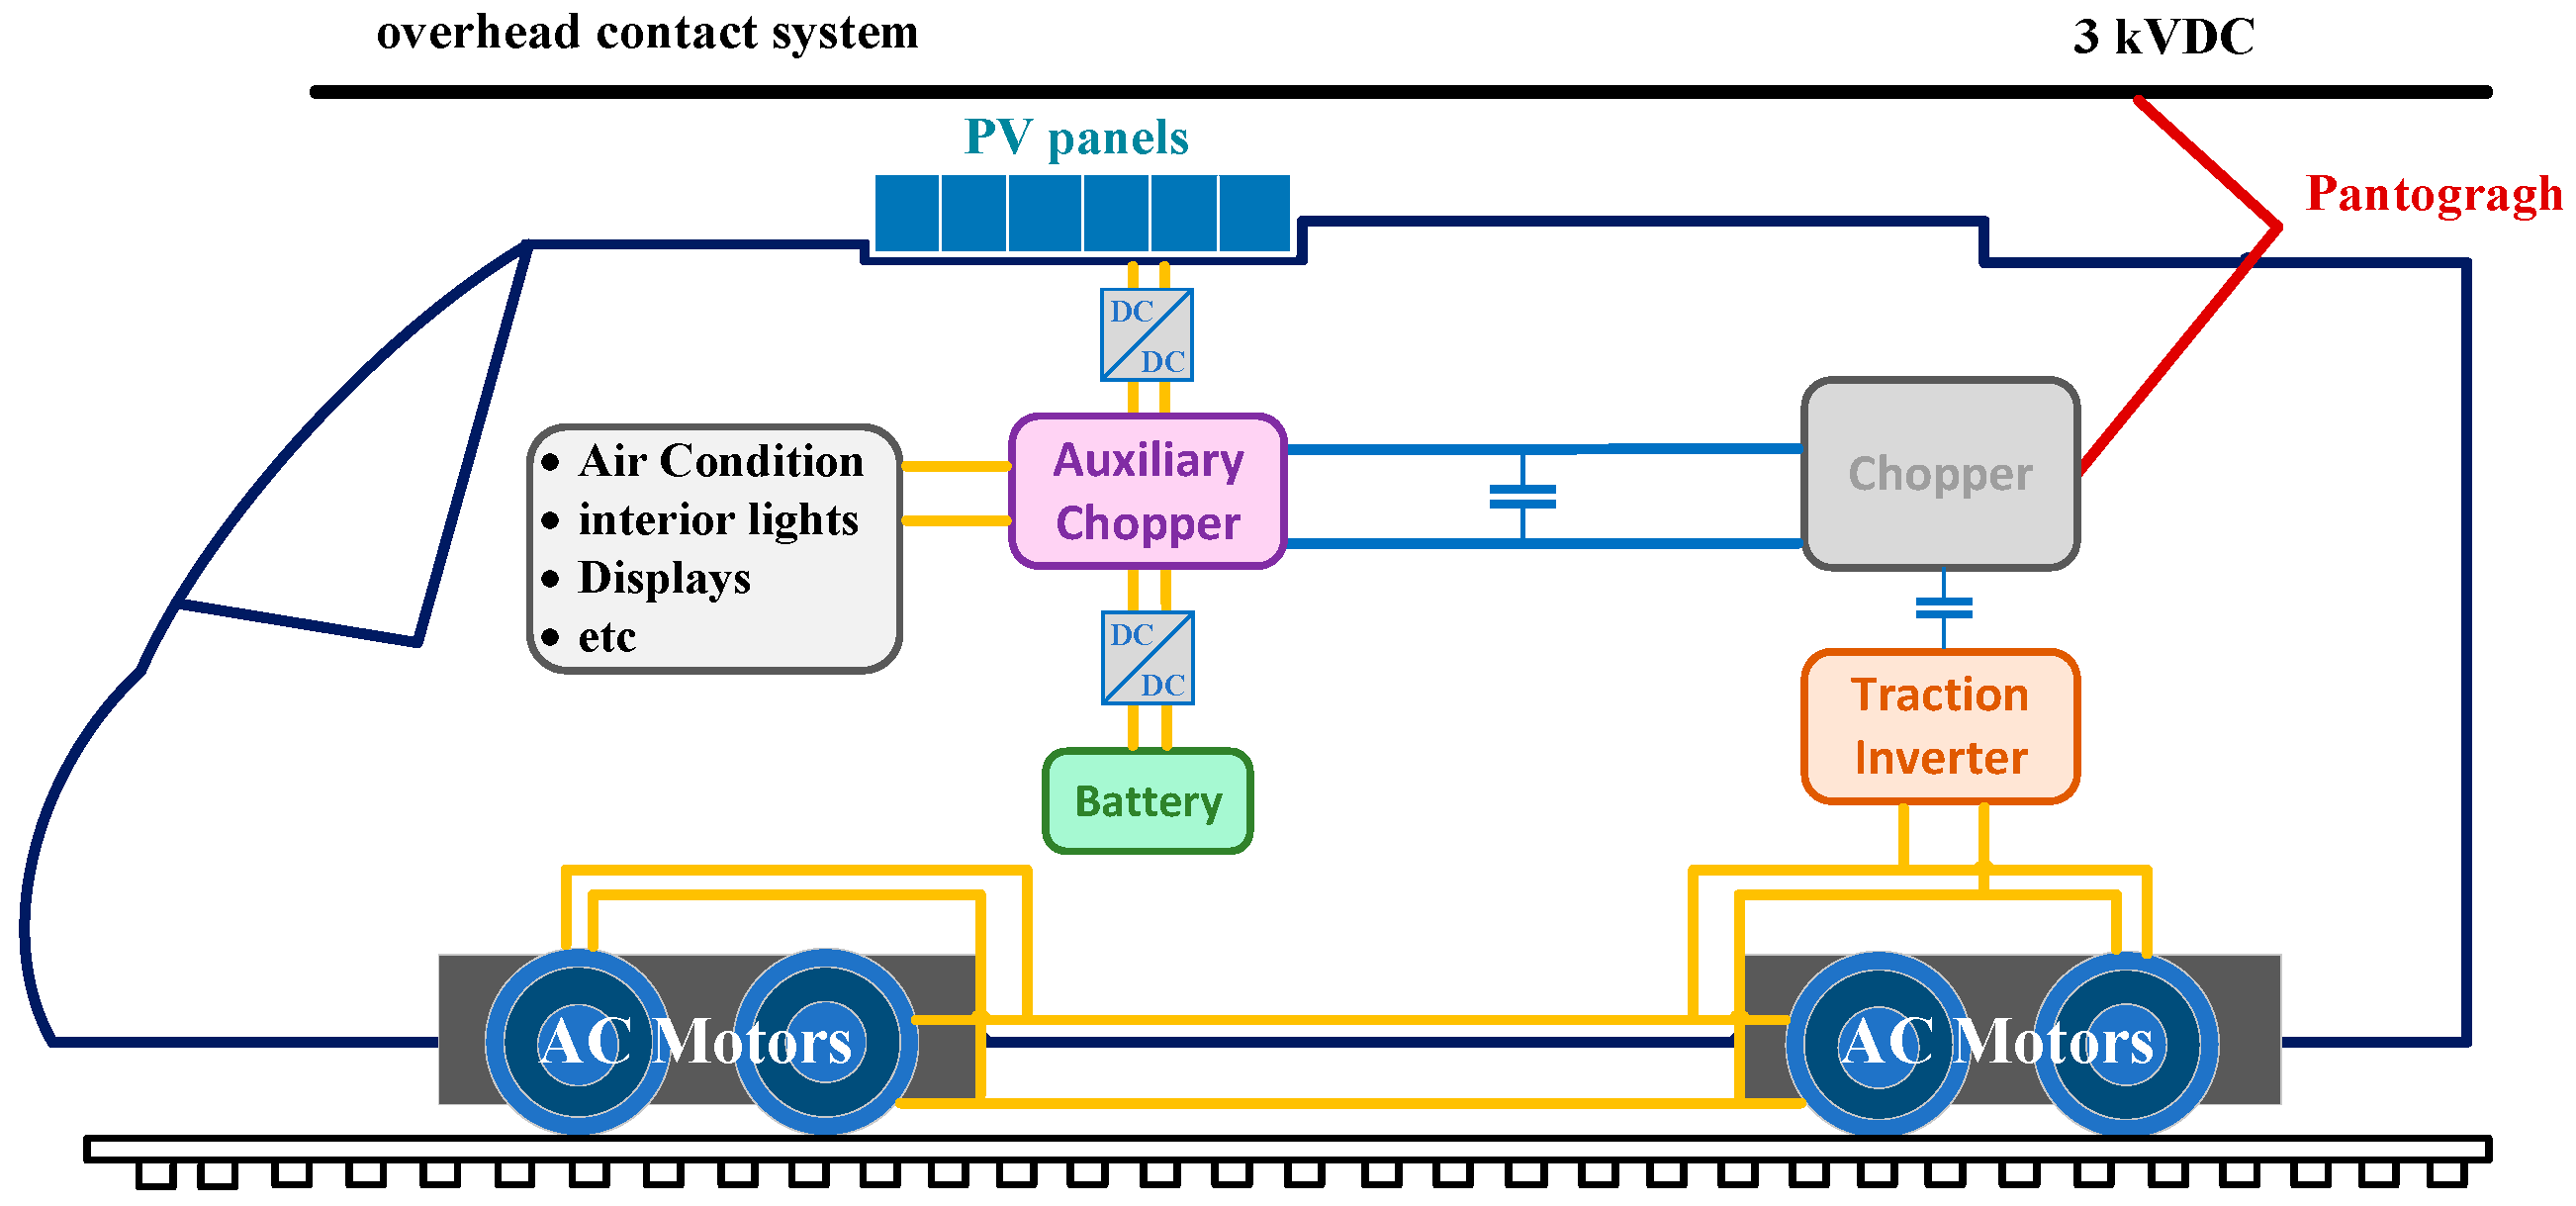
Proposing direct integration of PV panels on a train’s roof;
-
Presenting the GSA as an innovative approach to identifying the MPP in rooftop solar systems;
-
Comparing the performance of GSA with PO and INC algorithms;
-
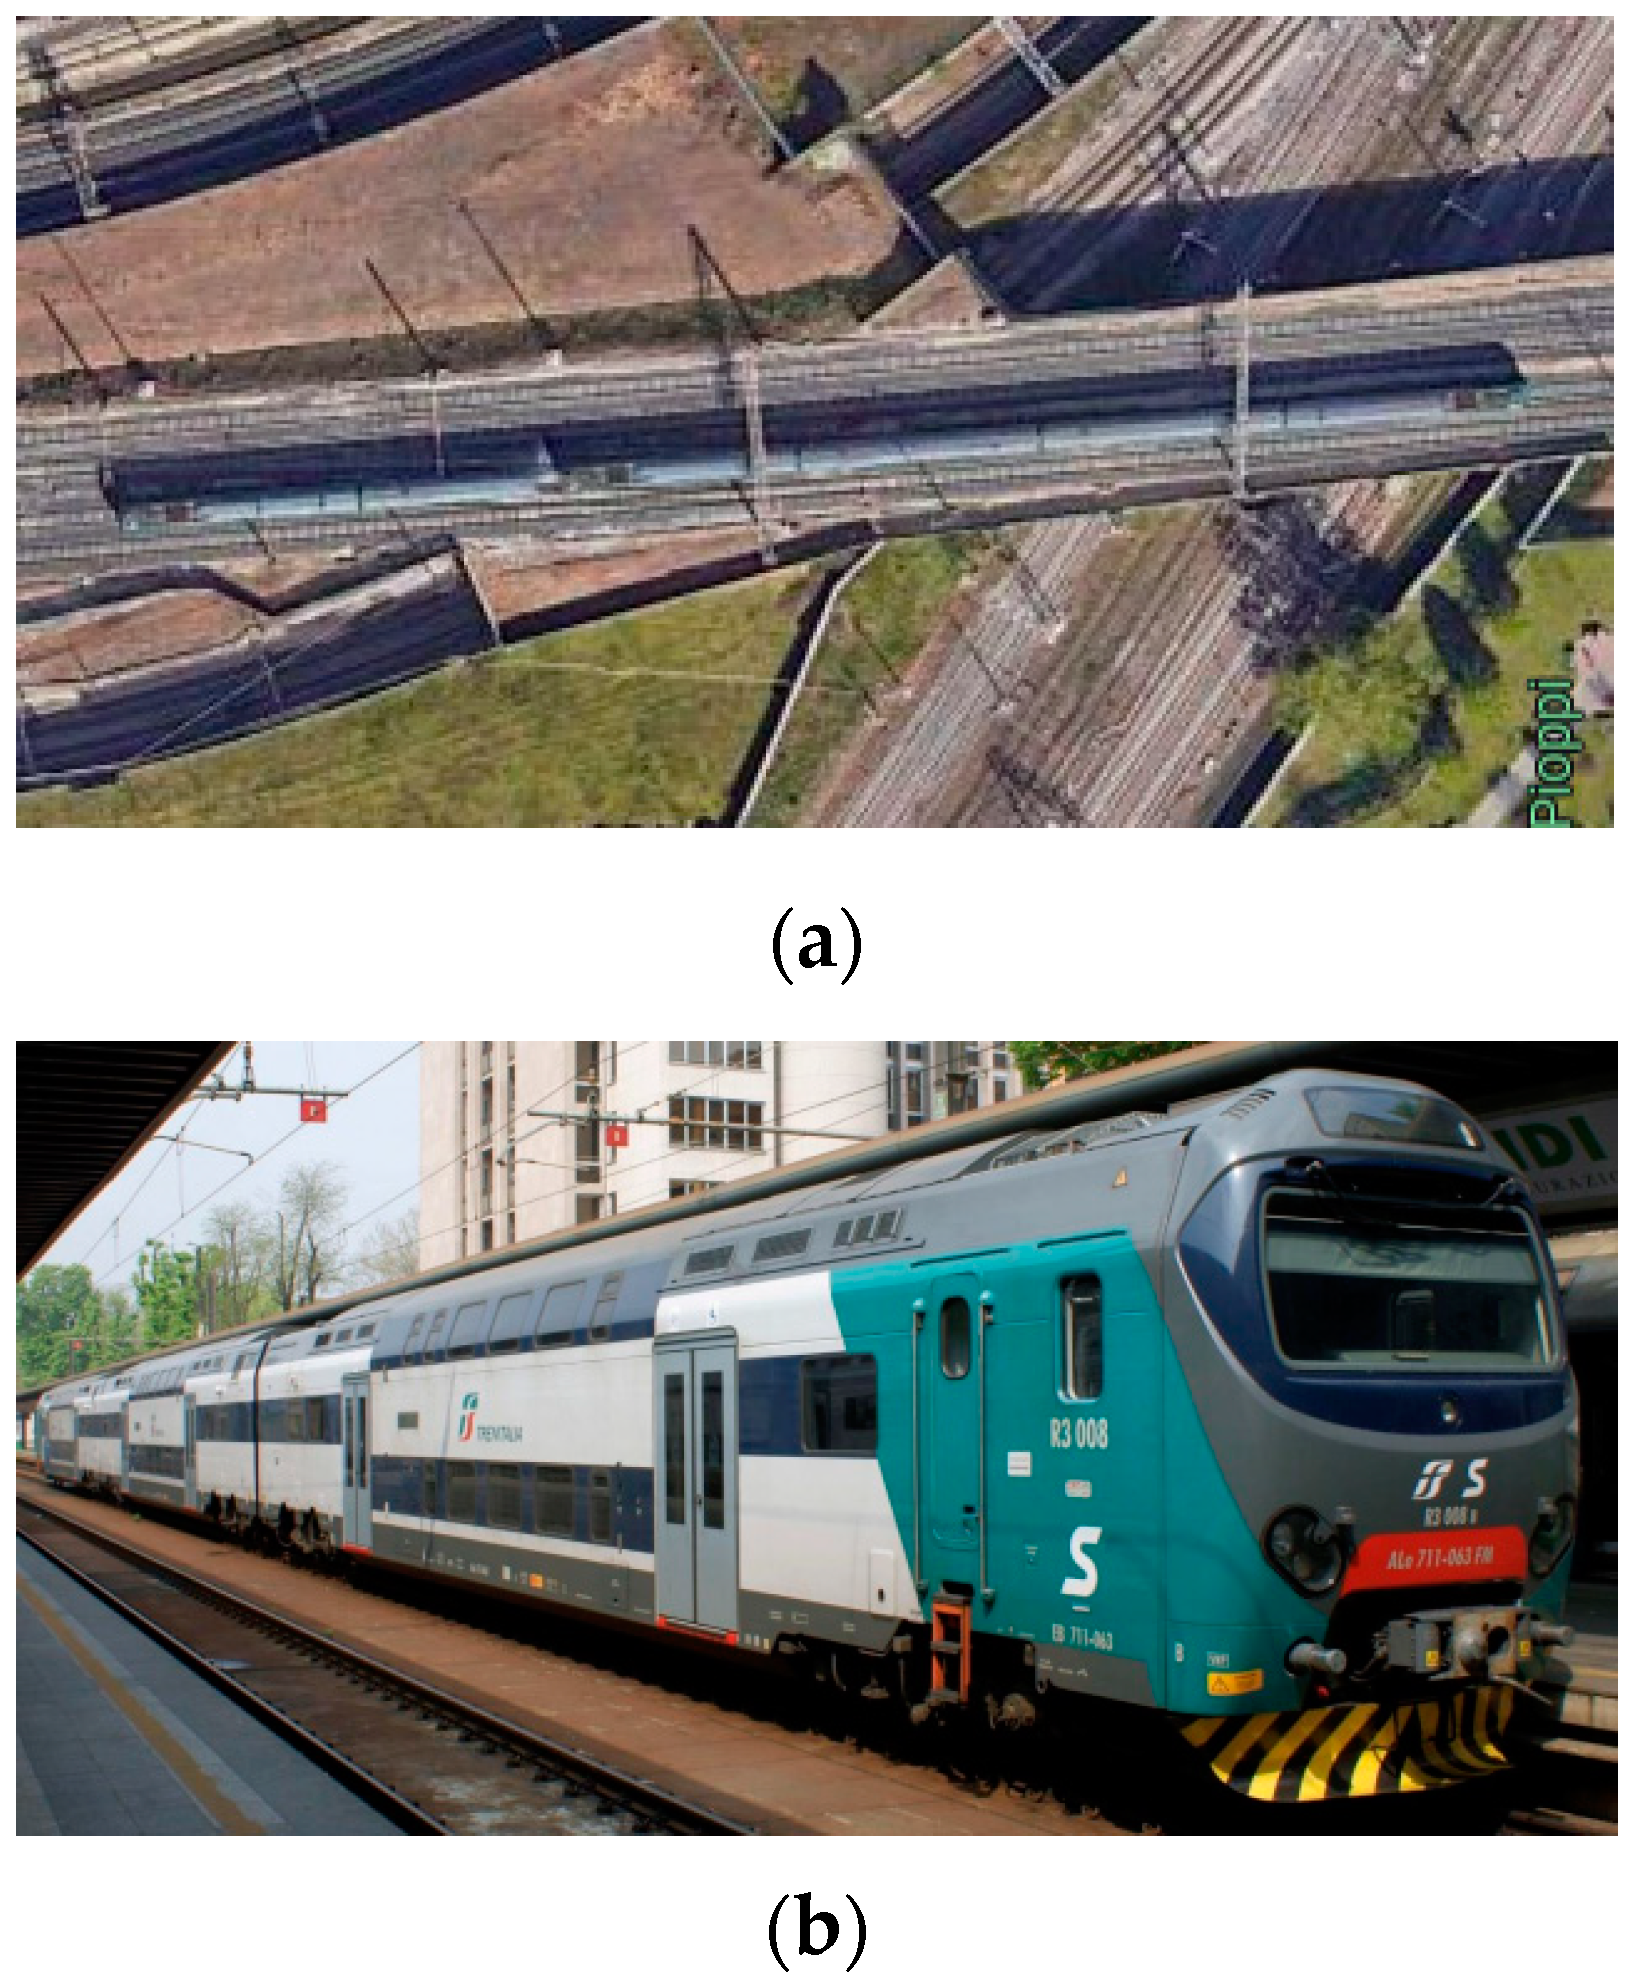
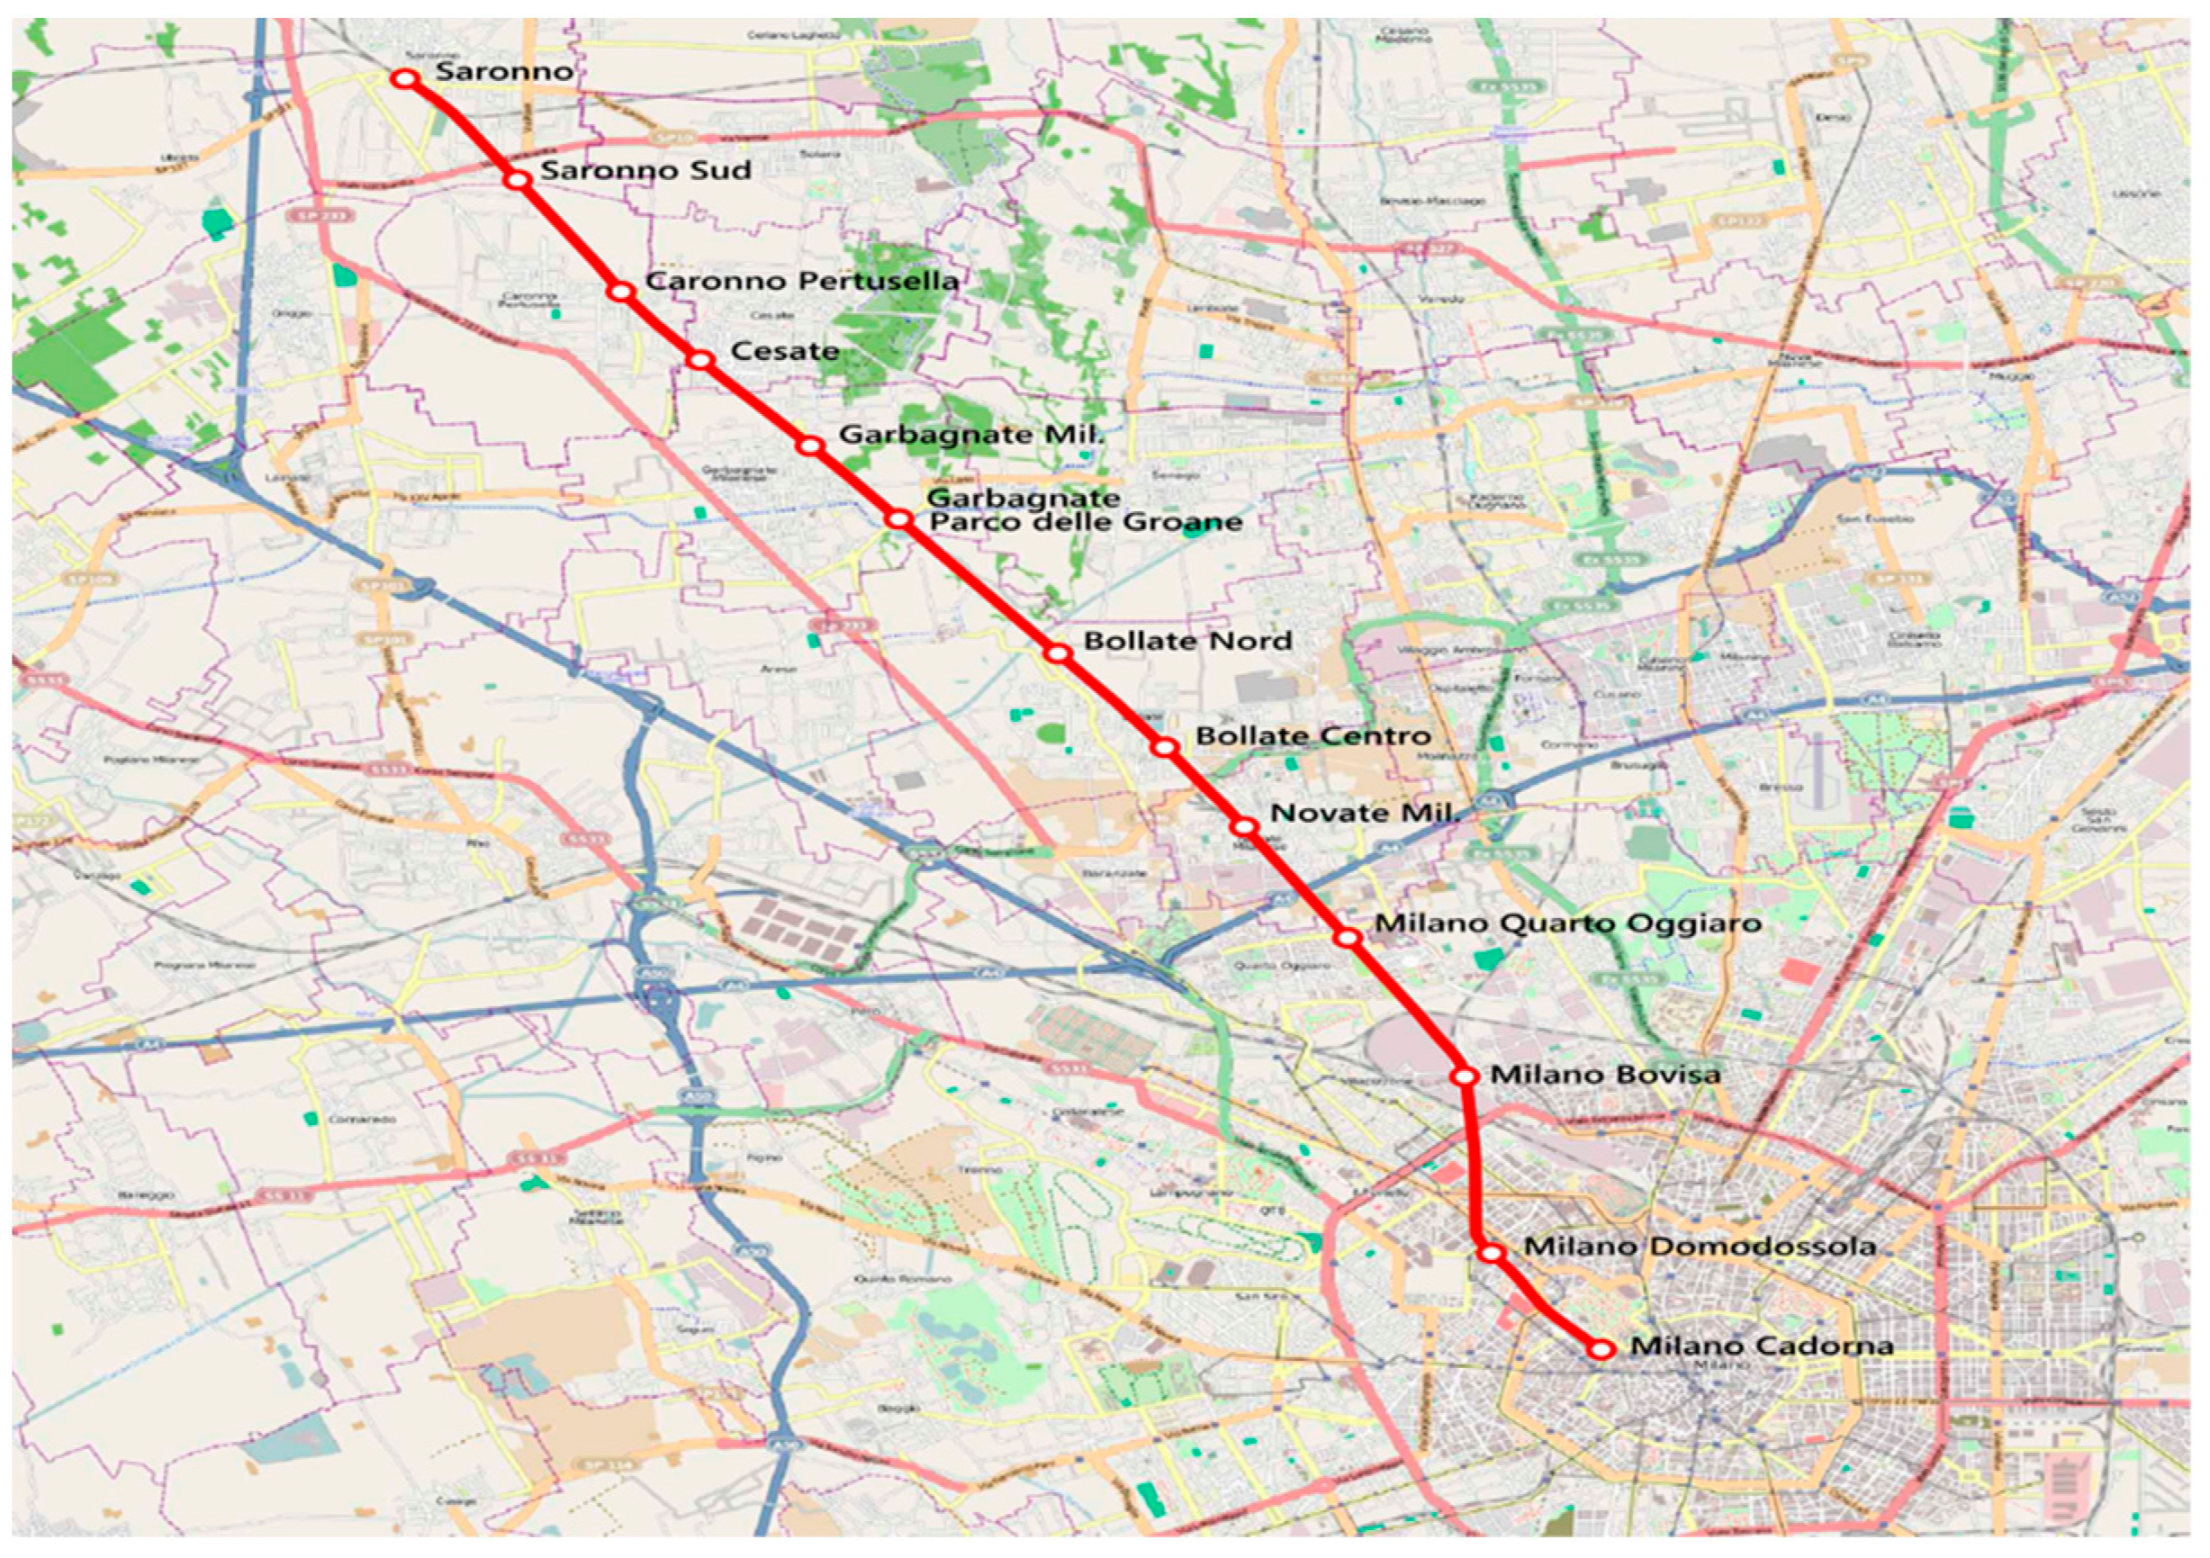
Real case-study-based research regarding integration of PV panels on the roof of trains.
This research results in a significant increase in the efficiency of photovoltaic systems installed on the roof of trains and can help reduce dependence on the main grid. To optimize the performance of PV systems and maximize power output, three maximum power point tracking (MPPT) methods were implemented: GSA, perturb and observe (PO), and incremental conductance (INC). The GSA, an evolutionary method, was used alongside a DC/DC boost converter in the case study of a train traveling from Milano Cadorna to Saronno [29].
The research is organized as follows: Section 2 and Section 3 describe the different parts of the proposed system and their modeling. Section 4 describes the GSA in detail. Section 5 investigates the possibility of employing the proposed solar panel system as a power supply for auxiliary power supply systems in trains. In the next step, the suggested method’s accuracy is compared to the PO and INC algorithms, and the simulation results are discussed.

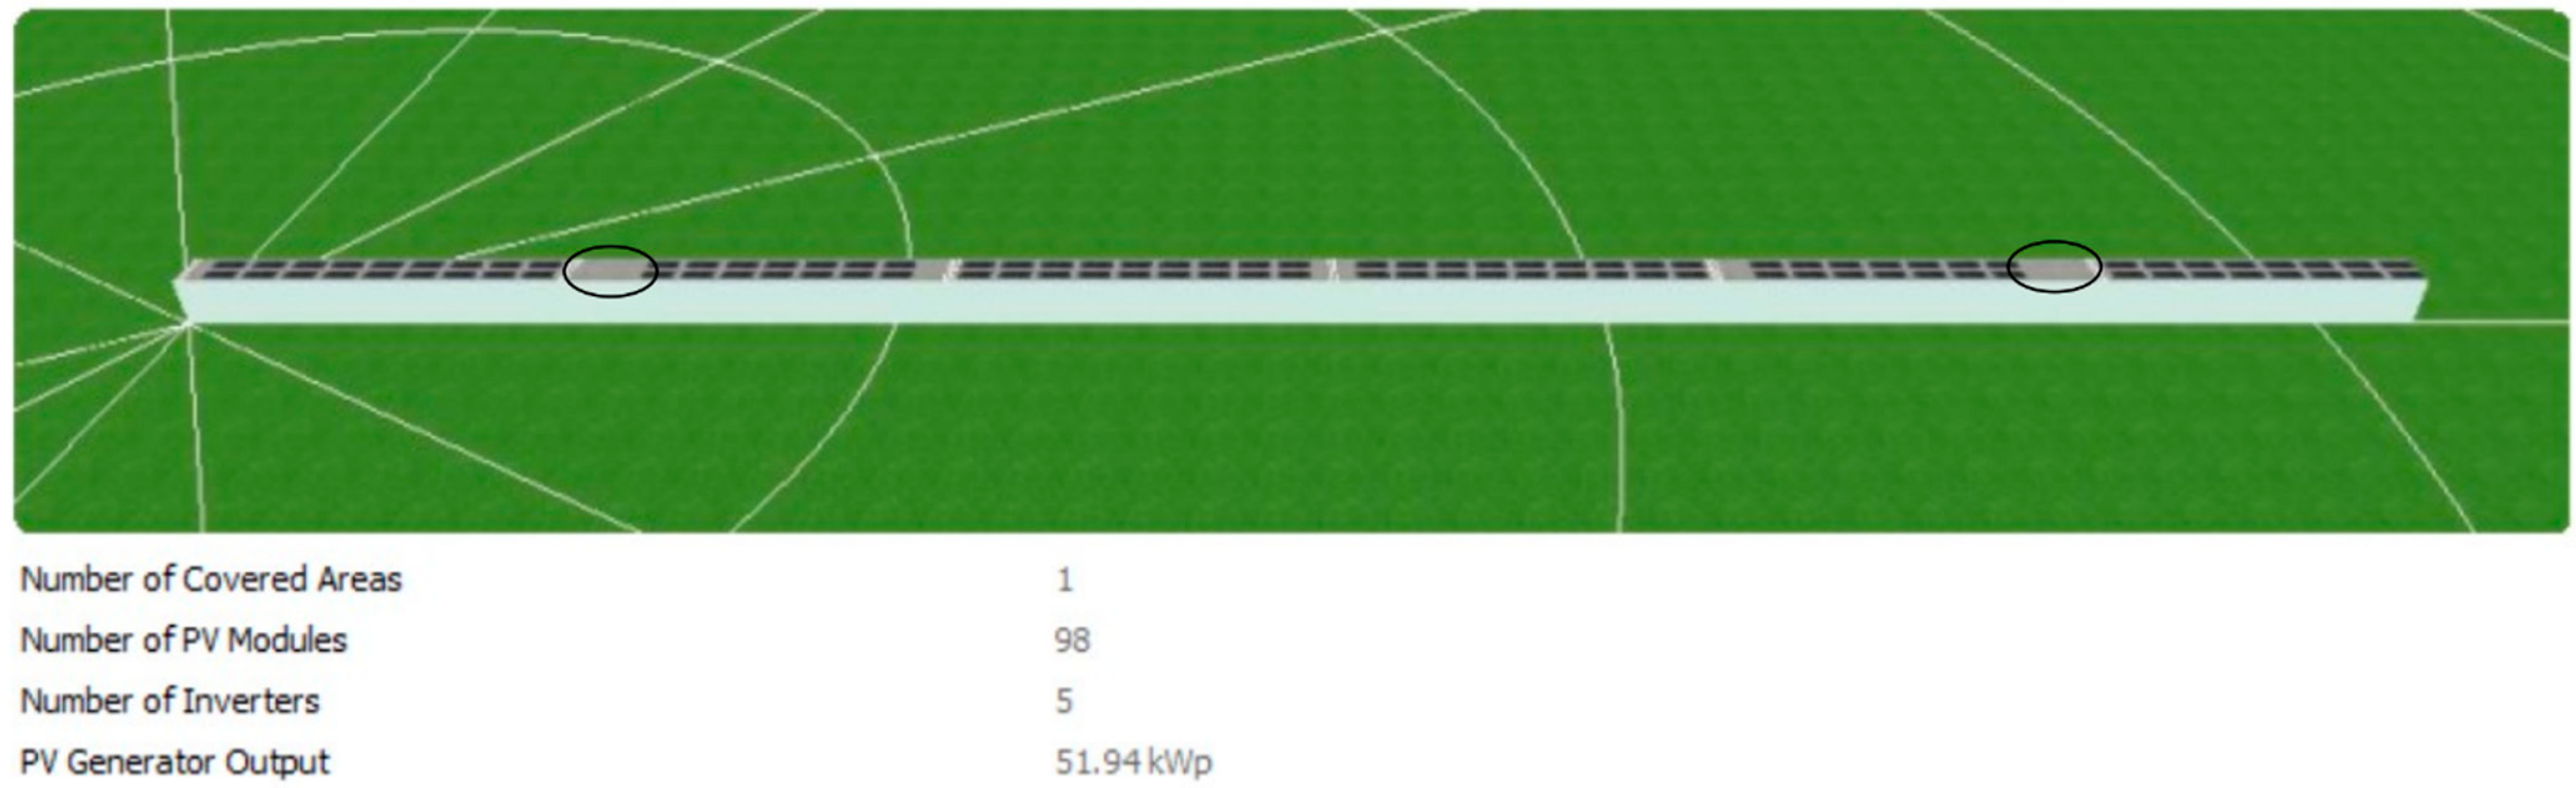
2. Schematic of Proposed System

In the design and modeling portion of this paper, a detailed exploration is undertaken regarding the specific characteristics of the railway line being analyzed. This includes an in-depth review of factors crucial for optimizing the system’s efficiency and ensuring its safety. The study evaluates train attributes such as operational speed, load limits, and the incorporation of modern technology to guarantee that the trains integrate smoothly with the existing railway infrastructure. Additionally, various challenging conditions are considered, including the presence of surrounding structures, tunnels, stations, and bridge clearances. These conditions are used to test the resilience and flexibility of the proposed design, providing crucial insights into how the system functions under diverse and complex scenarios. By thoroughly investigating these aspects, this section aims to contribute significant details about the case study that can improve the functionality and durability of the railway system in question.
The present study focuses on the installation of solar panels on the roof of the train that moves from Milano Cadorna to Saronno. Figure 1 shows an aerial view of the train moving through the route, while Figure 2 depicts the Milan Cadorna to Saronno railway track. As can be seen, the train comprises six cars, which is the same number considered for this study. The features of this train are shown in [30]. The route of the train from Milano Cadorna to Saronno is illustrated in Figure 2. The distance is estimated to be around 13 miles (22 km), and it takes the train 35 min to reach the destination. The proposed location is approximately 45.556537°, 009.10825° (45°33′24″, 009°06′30″) longitude.
Figure 3 shows the schematic of the electric train supplied by a 3 kV DC traction system implemented with rooftop PV panels, which includes a small battery energy storage system and a bidirectional converter. The configuration, as described in reference [7], includes several components, including PV panels, a DC–DC converter with the MPPT method, a bidirectional DC–DC converter, a battery management system (BMS), a grid-connected converter, a grid-connected controller, and an energy management system. Figure 4 displays the inside circuitry of the proposed system.
Figure 5 displays the block diagram of the solar panel installed on the train’s roof to supply the auxiliary system and the MPPT controller. The output voltage and current of the PV panel are measured using voltage and current sensors and are the inputs of the MPPT. The suggested MPPT algorithm produces a duty cycle signal that is compared with a triangular waveform to create the control signal for the IGBT switch of the boost converter (pulse width modulation (PWM)).
This signal controls when the switch turns on and off. Finally, the MPPT system controls the output voltage of the solar panels such that the most power is produced at the MPP. This, in turn, increases system efficiency and guarantees that the solar panels supply maximum power to the train’s auxiliary system.

3. Modeling

3.1. Photovoltaic Cell Model

Solar cell modeling is performed by considering the sun’s radiation on the cell’s sur-face. As shown in Figure 4 on the PV system section, a solar cell is a nonlinear system composed of a parallel current source and a diode. In this model, the practical model of the solar cell includes series and parallel resistors Rs and RP. Open-circuit voltage, which is influenced by the type of material and temperature, and radiation-dependent short-circuit current are two key and important parameters. Equation (1) illustrates the PV cell’s output current in accordance with Kirchhoff’s current law.
I = I p h I o exp q ( V + R S I ) A K T 1 V + R S I   R p
In the following equation,
  • I p h : the current generated by the appearance of light;
  • V   : the PV cell output voltage;
  • I   : the PV cell output current;
  • R s , R p : the equivalent resistors in series and parallel;
  • I o : the reverse saturation current for the diode;
  • q: the charge of the electron (1.6 × 10⁻¹⁹ C);
  • A: ideal diode constants;
  • K: Boltzmann constant (1.38 × 10⁻²³ J/K);
  • T: the absolute Kelvin temperature.
The selected solar panel model is ZXM7-SHLDD144530/M (227 × 1134 × 35). Extraterrestrial radiation is radiation that can be measured outside of the Earth’s atmosphere. Equation (2) determines extraterrestrial radiation E e x t r a based on the day of the year d and the solar constant, as the Earth–Sun distance oscillates around the solar constant E0 throughout the year (according to Duffy/Beckman). The effects of temperature changes have been ignored, and the simulations have been carried out under variable radiation of 1000 W/m2.
E e x t r a = E 0 · 1 + 0.033   · cos 2 π   ·   d 365
where ( E 0 = 1367 W/m2) is the solar constant, d is the days of the year, and E e x t r a is extraterrestrial radiation.
Equation (3) shows that the angle of sunlight on PV panels can be calculated by considering different geometric events.
cos θ g e n = cos γ S ·   sin γ E · cos α S α E + π + sin γ S · cos γ E
where θ g e n is the angle of solar incidence on the PV panel, α S is the orientation of the sun, γ S is the elevation of the sun, α E is the orientation of the module and γ E denotes the elevation of the module.

3.2. DC/DC Boost Converter

The boost converter is necessary in the PV production process due to the fact that it tracks the MPP generated using the PV cell and enables the change in the voltage given by the panel based on its duty cycle [31]. The boost converter has been installed between the solar panel and the auxiliary power supply system. It consists of an amplifier inductor, an IGBT switch, a diode, a resistive load, and the output filter’s capacitance. To provide a constant voltage, an output capacitor is connected to the auxiliary power supply system [32,33]. In the boost converter, the PWM-based MPPT controller modifies the final voltage by applying the gate voltage to the IGBT. The unidirectional boost converter section and PV control section in Figure 4 show the proposed boost converter and MPPT controller for PV. Equation (4) shows the relationship between output voltage and input voltage.
V o u t V i n = 1 1 D
Table 1 presents the parameters of the boost converter utilized in this paper.

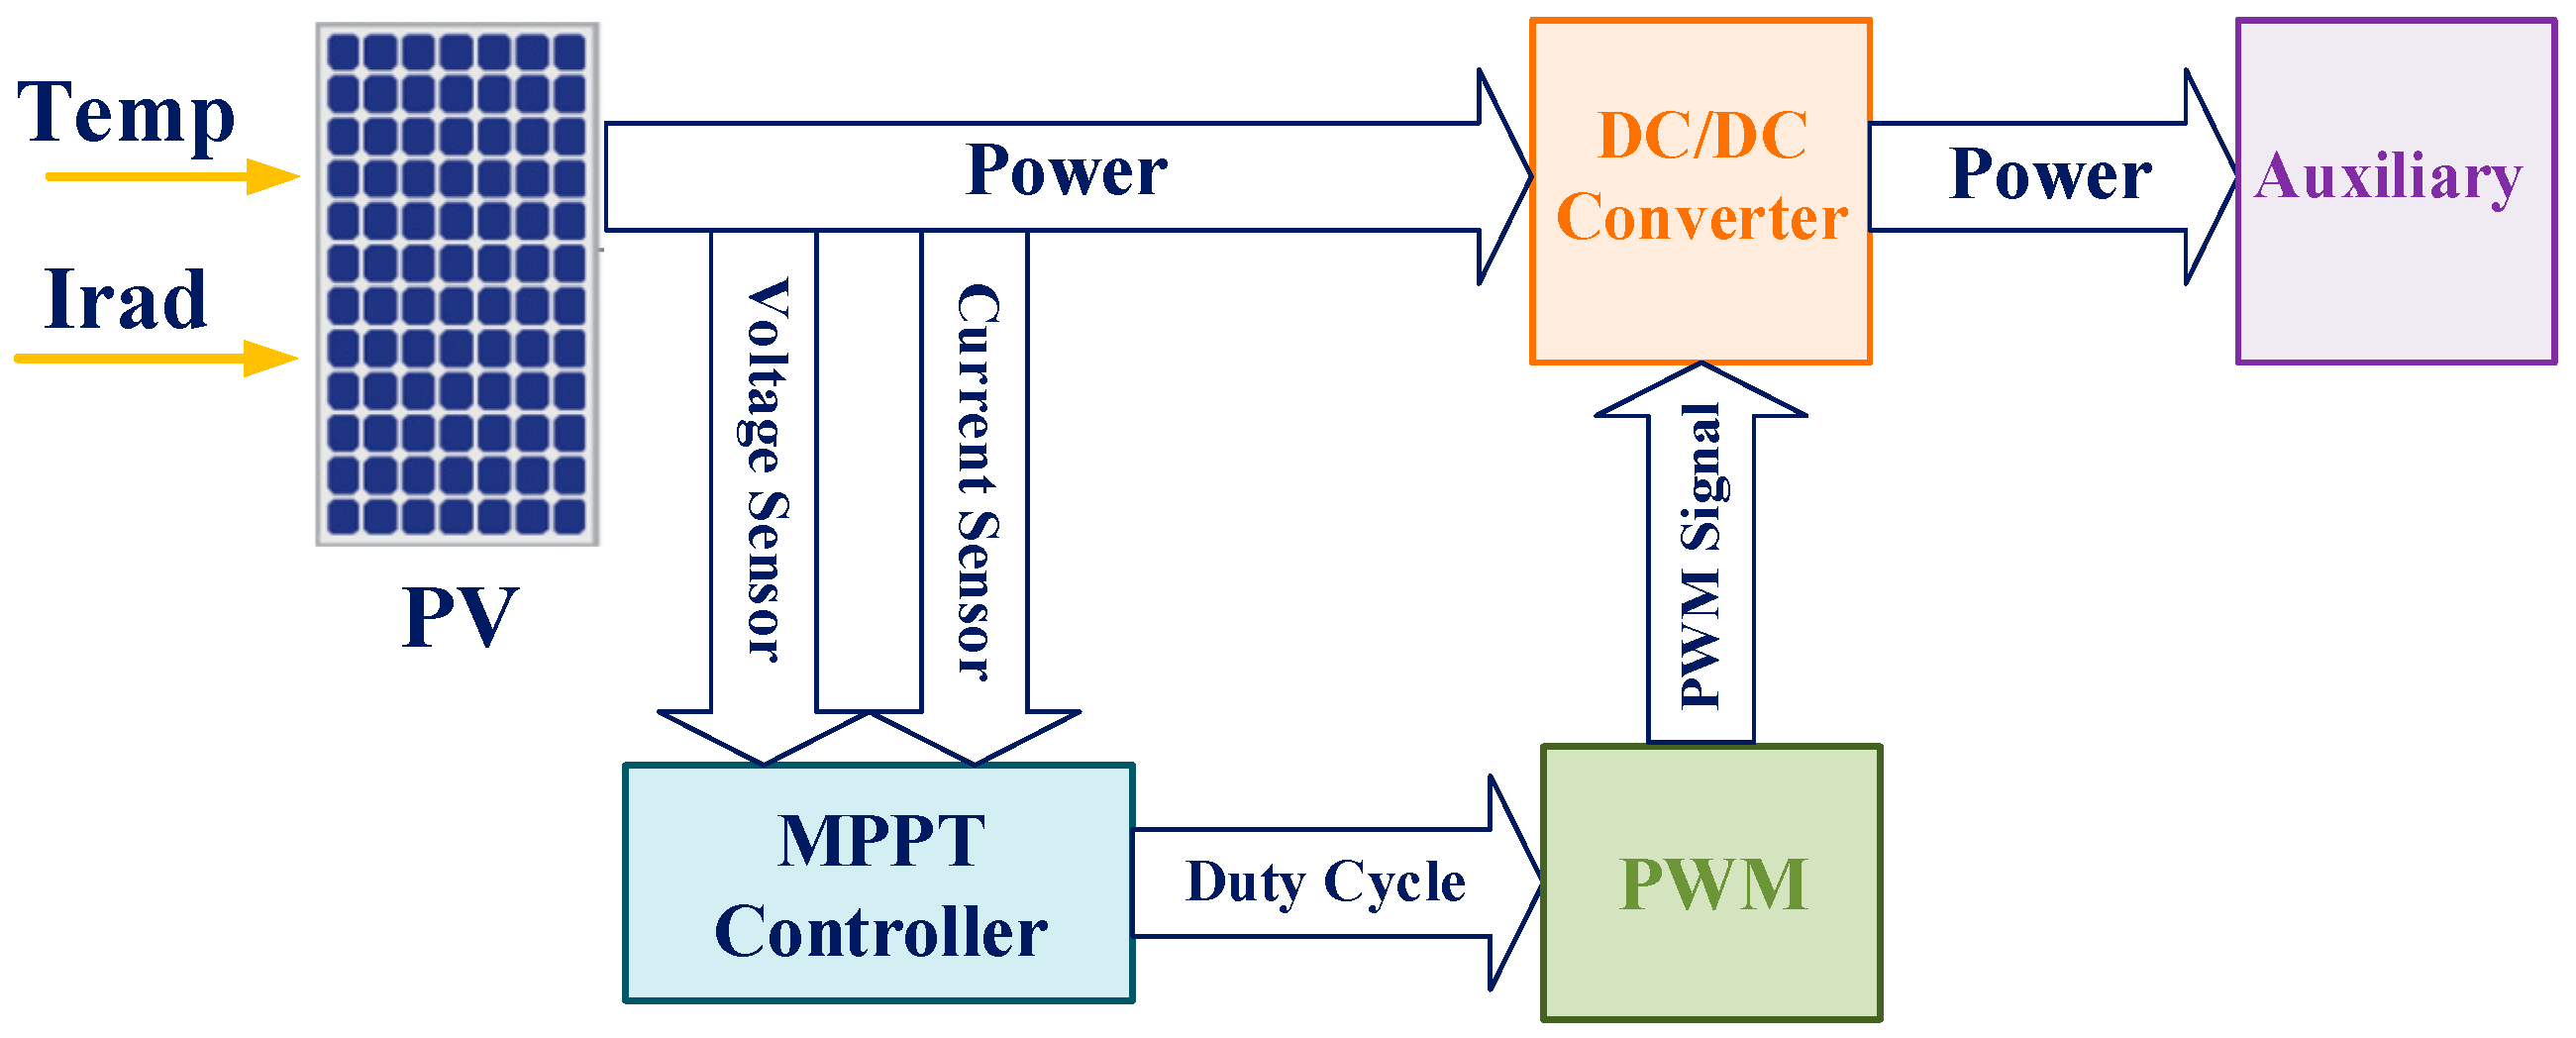
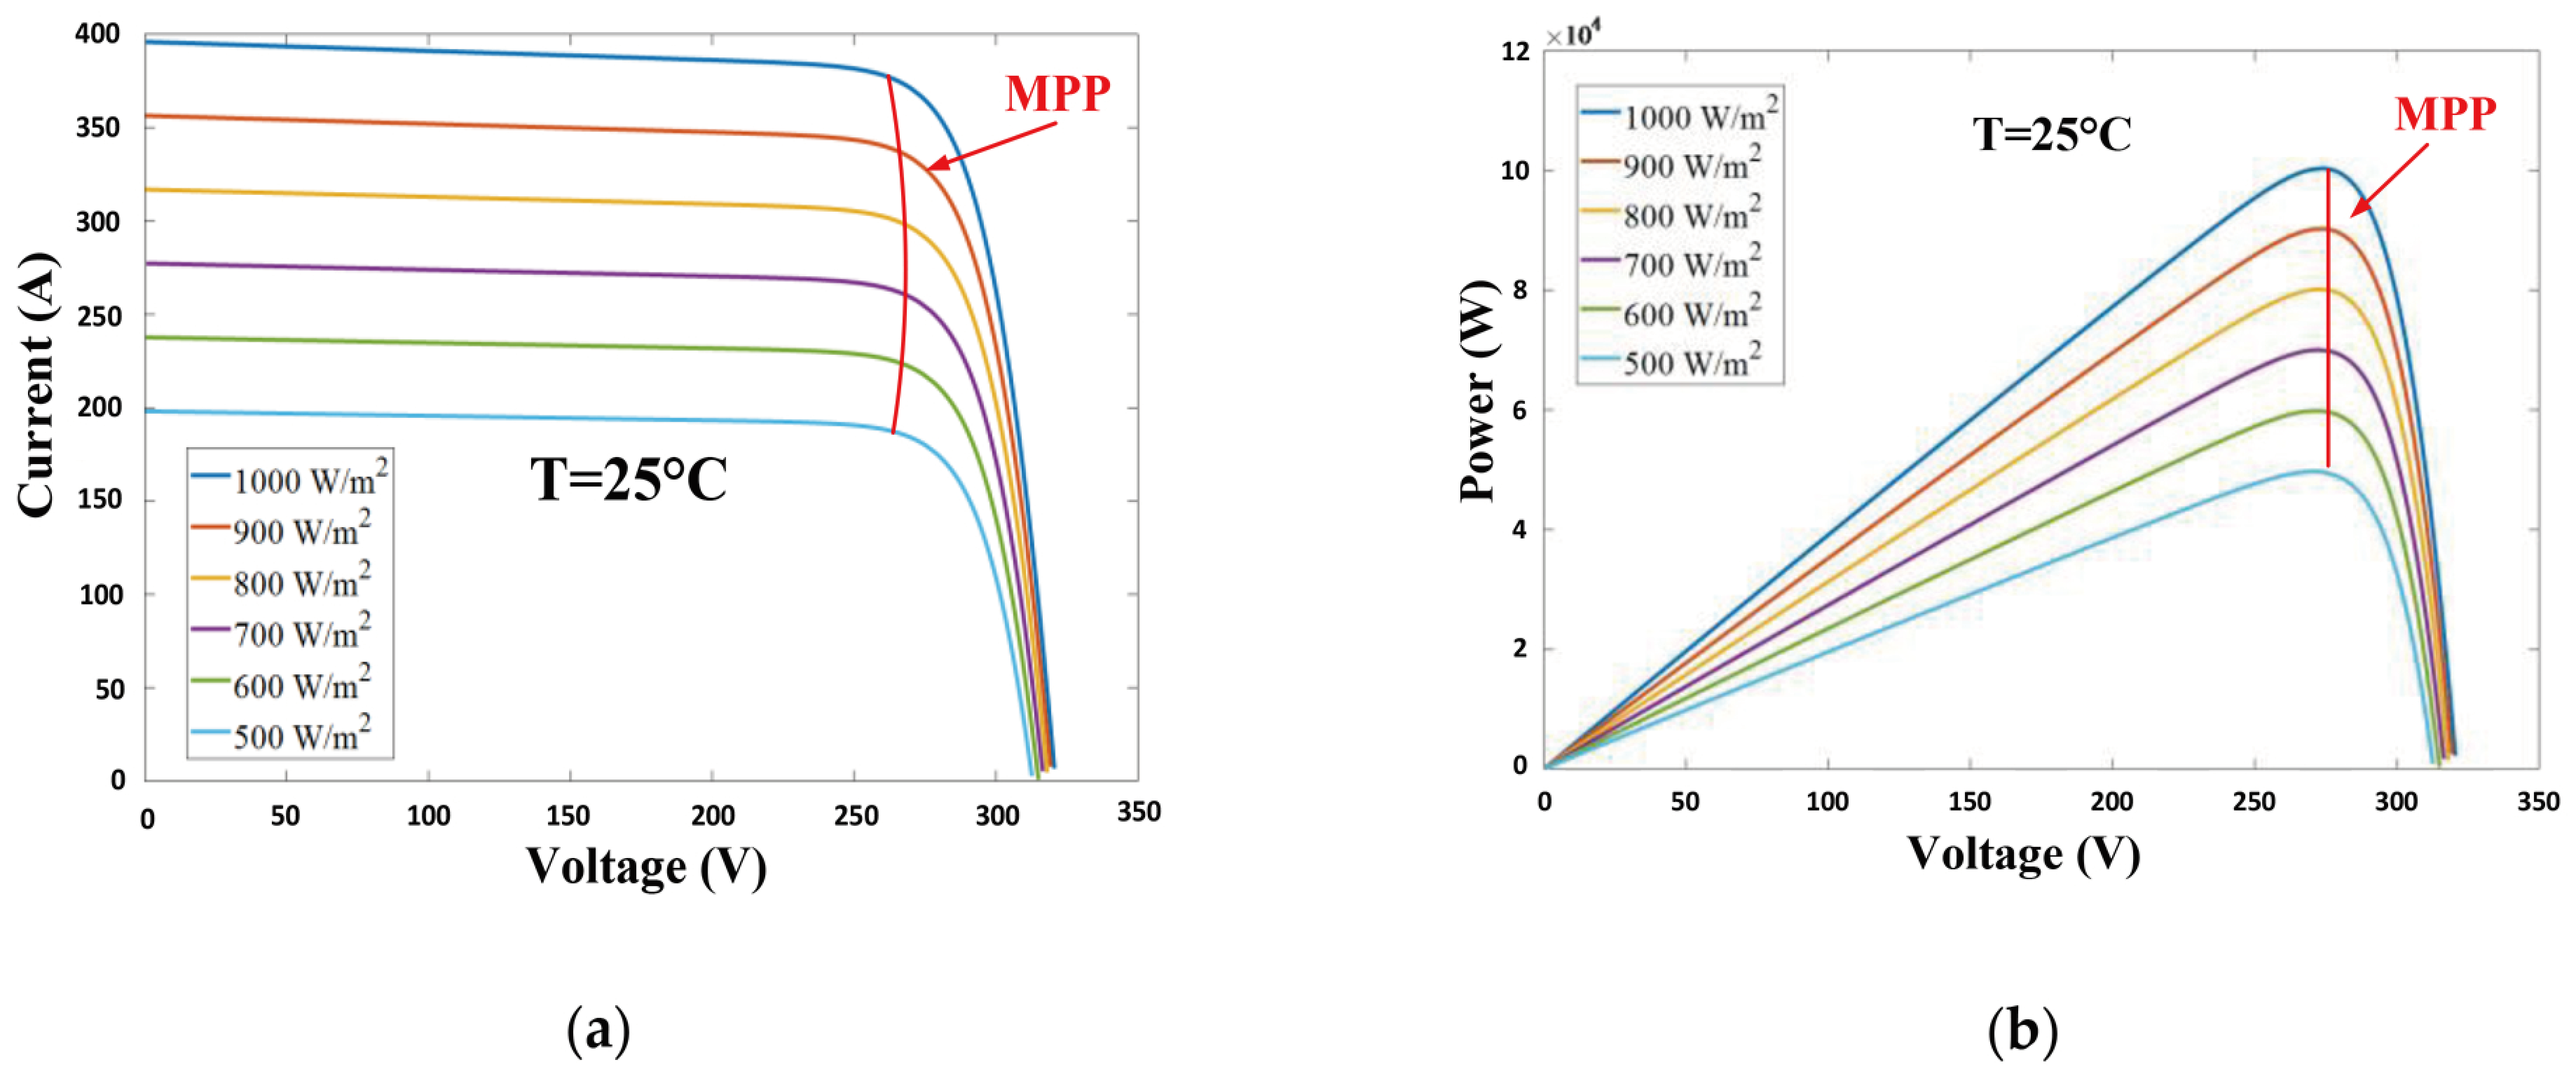
3.3. Maximum Power Point Tracking

Maximum power (MP) is generated by running rooftop solar panels at the maximum voltage for photovoltaic systems. This point is usually observed on the knee of the solar panel’s I-V graph. As a result, the solar panel’s maximum output power may be achieved at a single operating point. This dot on the curve of P-V is referred to as the MPP. Figure 6 depicts the P-V and I-V characteristic curves of the PV cell [34]. These curves indicate that the PV system must operate at specific current and voltage values to achieve MPP. The location of the MPP varies with operational conditions (temperature and irradiance); hence, an MPP tracking system is needed to ensure that we reach as close to the MPP as feasible. The MPP point on the I-V and P-V graphs of the solar cells continuously shifts as the irradiance changes, as seen in Figure 7.

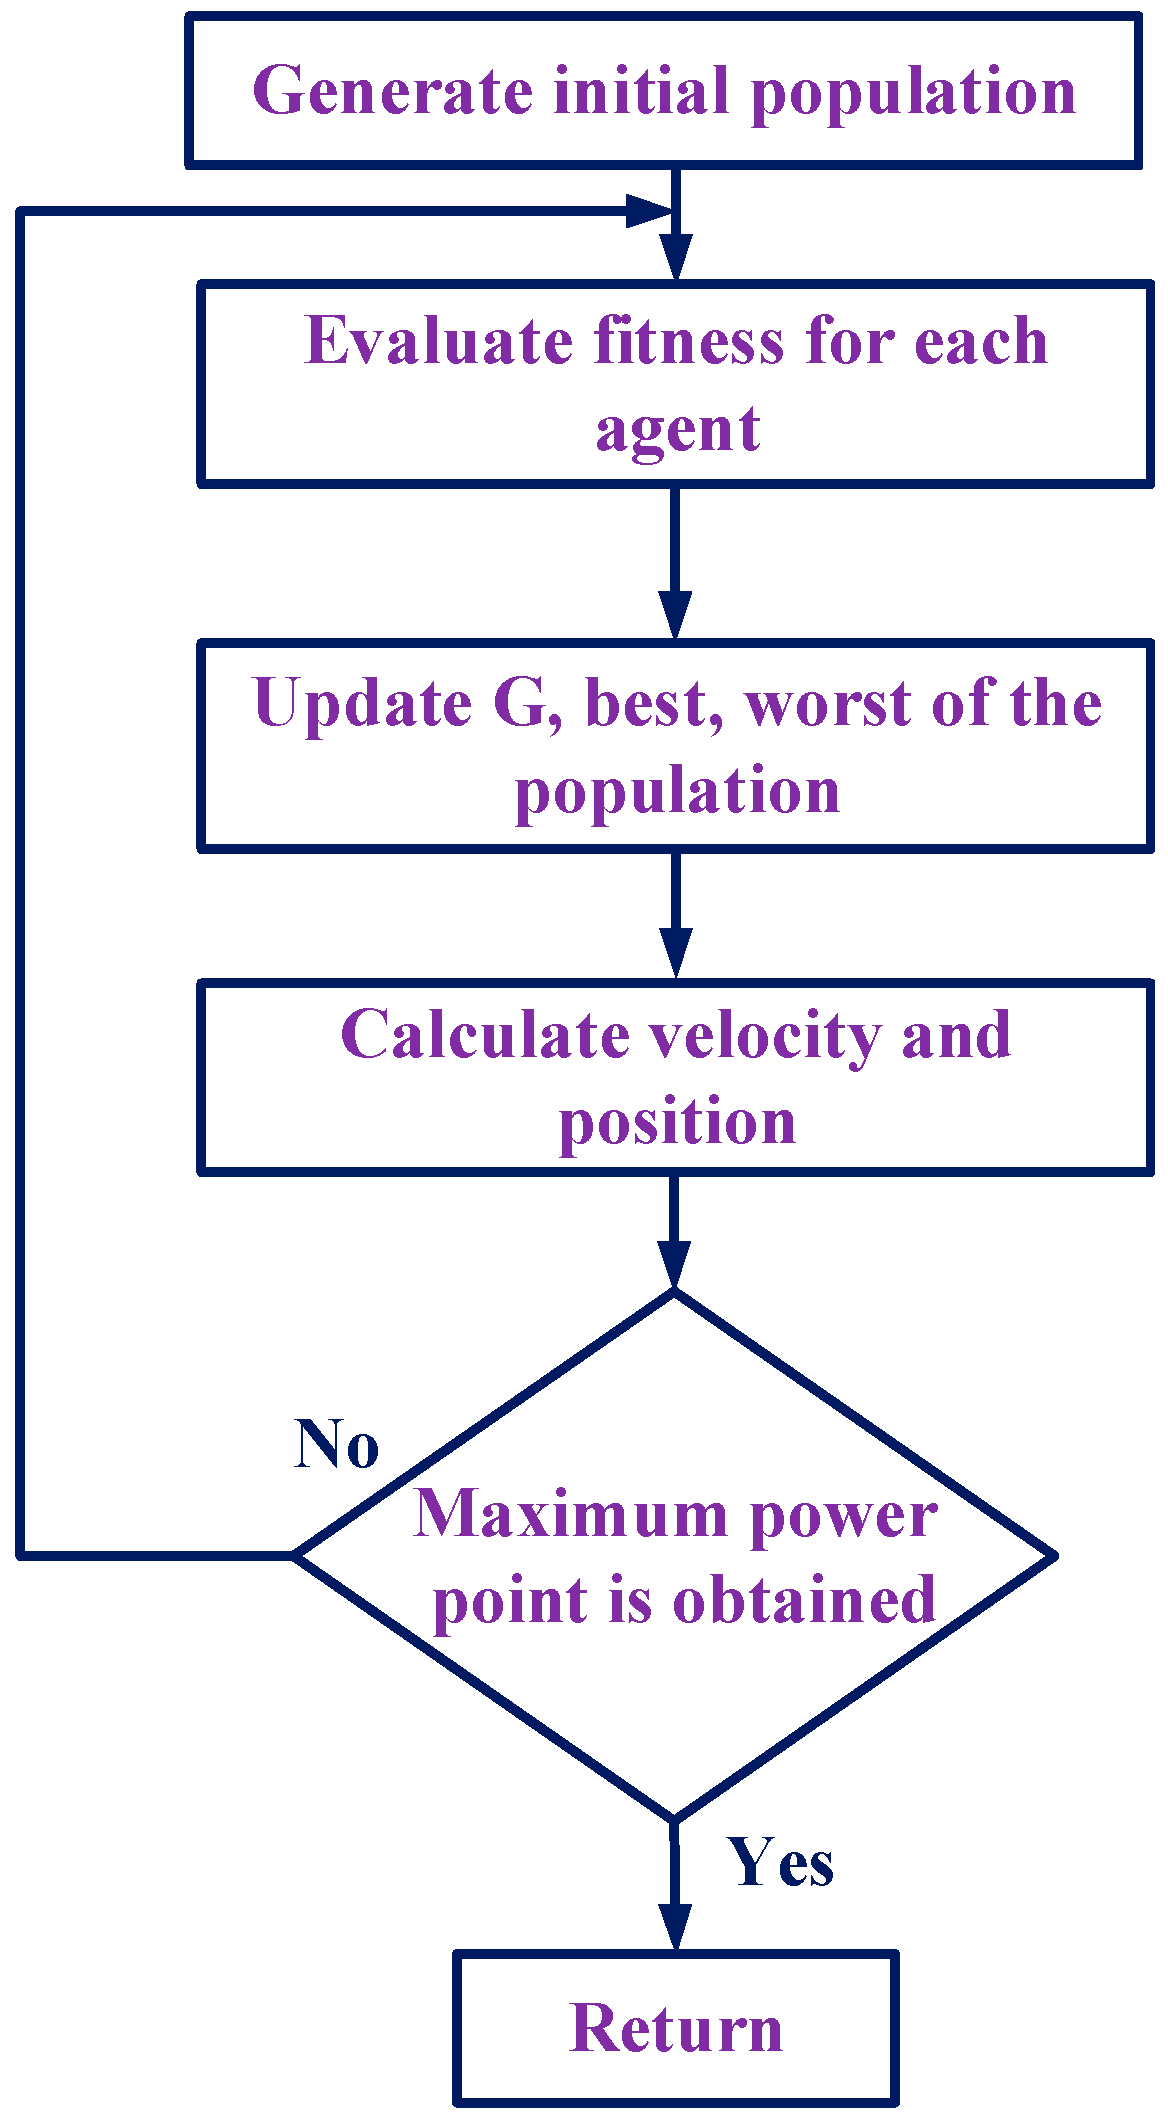
4. Methodology and Proposed Algorithm

The GSA uses Newton’s law of gravitation to determine the best solution to optimization problems. In this method, different solutions are considered as particles moving in the search space. Particles with greater mass represent better solutions and attract particles with lower mass. Finally, all particles converge to the particle with the highest mass, representing the optimal solution to the optimization problem [24]. In this section, Figure 8 shows the flow diagram of the GSA. We must assume here that there is a population of size ‘m’, and the location of agent ‘i’ (solar voltage) is given by Equation (5).
X i = x i 1 , , x i d , , x i m   f o r   i   =   1 ,   2 ,   ,   N
x i d   represents the speed of agent ith in dimension dth. Equation (6) depicts the gravitational force F i j d (t) acting on passive mass ‘i’ and active mass ‘j’.
F i j d ( t ) = G ( t ) M p i ( t ) × M a j ( t ) R i j ( t ) p + ε ( x j d ( t ) x i d ( t ) )
where M a j is the active gravitational mass associated with agent j, M p i is the passive gravitational mass associated with agent i, G(t) is the gravitational constant at time t, e is a small constant, and R i j ( t ) represents the Euclidian distance between agents i and j.
R i j t = X i t , X j t   2
To add a stochastic force in ‘d’, the dimension is chosen at random as the total of the forces in ‘i’ and ‘j’ in the same dimension.
F i d t = j K b e s t , j i r a n d j d F i j d t
where r a n d j is a random number in the interval [0, 1]. The acceleration of agent ‘i’ in dimension ‘d’ is the following:
a i d t = F i d t M i i t
where M i i is the inertial mass of the ith agent.
Equation (9) expresses the next speed of agent ‘i’ in dimension ‘d’ as a proportion of its present speed and acceleration.
v i d t + 1 = r a n d i × v i d t + a i d t
where r a n d i is a uniform random variable in the range [0, 1]. We utilize this random number to assign a randomized character to the search. The next location of agent ‘i’ in the ‘d’ dimension is as follows:
x i d t + 1 = x i d t + v i d t + 1
In the fitness assessment, gravitational and inertia masses are computed. Heavier mass indicates a more effective agent, more attraction, and slower motion.
q i t = f i t i t w o r s t ( t ) b e s t t w o r s t ( t )  
M i ( t ) = q i ( t ) j = 1 N q j ( t )
where   f i t i t denotes the fitness value of agent i at time t, and worst(t) and best(t) are defined as follows (for a minimization problem):
f i t i t = P
P = V p v × I p v
b e s t ( t ) = m a x j 1 , , N f i t j t
w o r s t ( t ) = m i n j { 1 , , N } f i t j ( t )

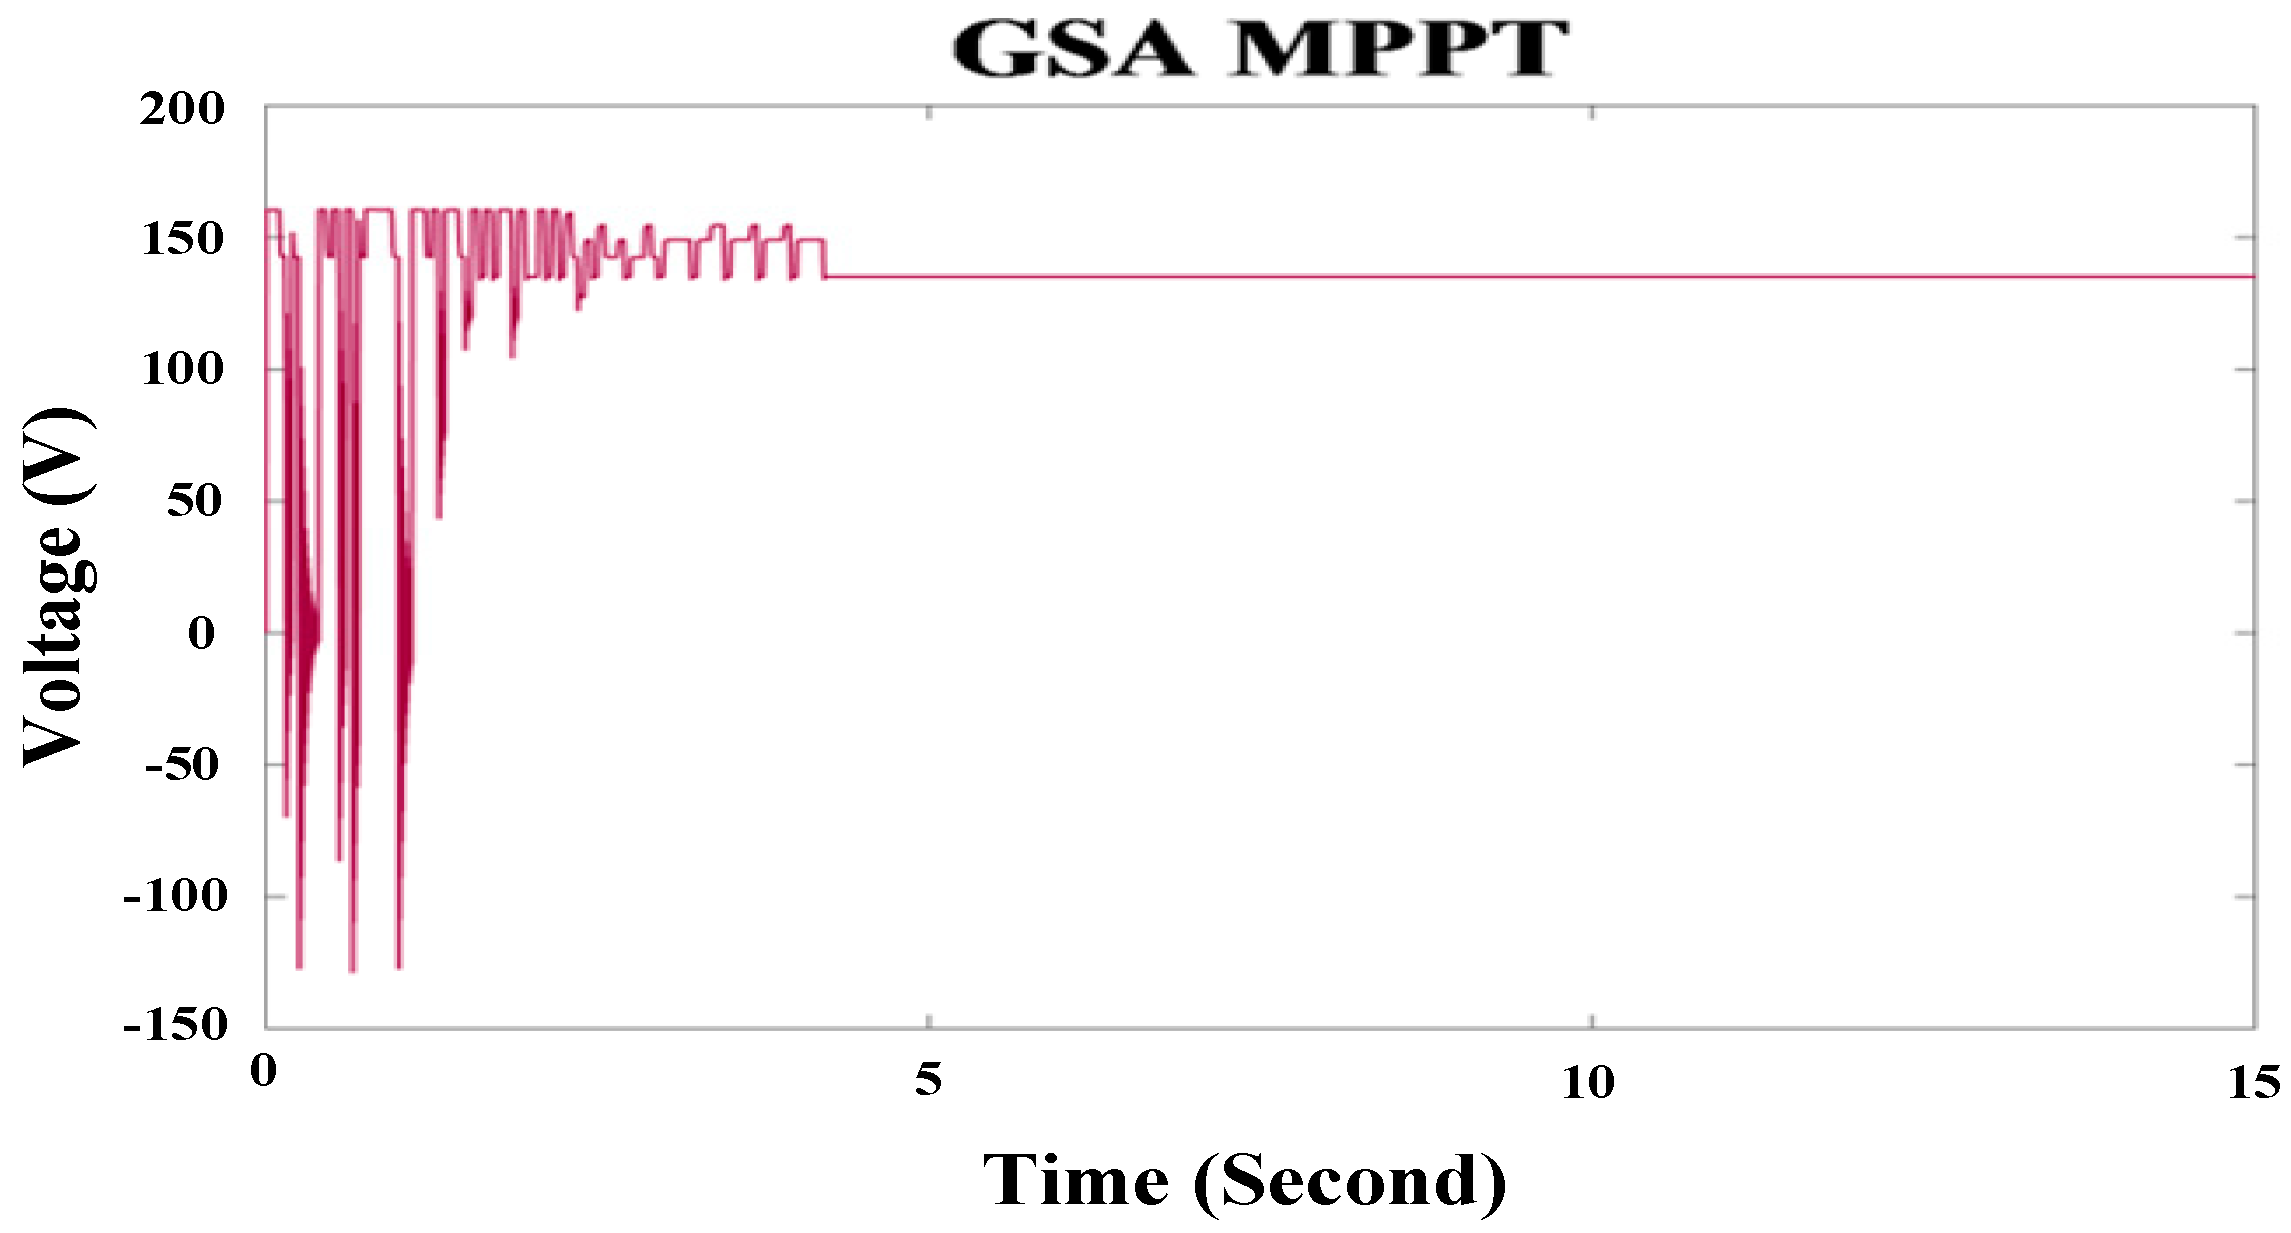
5. Simulation Results and Discussion

Auxiliary power supply systems convert electricity for interior lighting, displays, air conditioning, and other applications. The yearly energy usage for a train on the considered line is estimated to be around 607 MWh. As mentioned earlier, in this section, the issue of auxiliary energy consumption of the train is discussed. The yearly energy consumption for the postulated case study is adopted based on Equation (17), which is as follows:
E a u x / y = η p a u x   .   i = 1 n P a u x i × τ × 365
where η p a u x is the peak efficiency of auxiliary consumption, τ is the average working hours per day and P a u x i is the power of different auxiliaries.
Figure 9 depicts the distribution of energy use in different months of the year, with January and February demonstrating the greatest and lowest usage, respectively, at 53,033.3 and 47,694.8 kWh.
The arrangement of modules on the rooftop of this train, considering six coaches, is shown in Figure 10, and considering the empty space for pantographs that is marked in the figure, the configuration, with one MPPT connected to 98 PV modules, guarantees the panels operate at their maximum efficiency, and these modules are installed on the rooftop and connected with five inverters.
Table 2 shows the output of the proposed system in PVSOL software, which delivers power equivalent to 51.94 kWp. Based on power use and generation, there is no surplus electricity to store, so batteries are not required. Also, the installation of solar panels on the train’s roof would cut CO2 emissions by 27,897 kg per year.
According to Figure 11, the solar panel power output (59,370 kWh) can meet 9.8% of the entire demand (607,083 kWh) of train auxiliary systems per year. It is evident that this usage is related to the auxiliary power of trains. The calculated amount is specific to the type of train considered and the path selected for the case study. The available space for PV implementation will vary depending on the type of train. Additionally, shading and irradiation along the chosen path will affect the output results.
To assess the method’s performance and precision, a photovoltaic system containing a panel of solar cells, a boost DC–DC converter, and a controller MPPT tracker with the GSA is investigated and simulated in MATLAB/SIMULINK software. Figure 12 and Figure 13 show the output voltage and power of the photovoltaic system, respectively.
The GSA optimizes the output voltage of PV systems to allow for optimal power extraction from solar modules. This algorithm’s best performance is determined by the precise setting of its parameters (Table 3). Evaluating the performance of MPPT with the GSA, PO, and INC algorithms shows that MPPT with the GSA can optimize the solar cell output power more accurately and consistently. After several iterations, the algorithm converges to the optimal voltage and power values of approximately 150 V and 50 KW, respectively. Figure 14 indicates that the INC and PO algorithms have a faster convergence speed than the GSA and estimate the output power with 100% and 90% accuracy, respectively; however, there are fluctuations in the output voltage. In contrast, the GSA, despite its longer convergence time, exhibits more stable performance due to the absence of oscillations in the output voltage. Figure 15 shows the performance of MPPT algorithms based on GSA, PO, and INC on the voltage curve of a PV panel.
In the context of PV panels installed on train rooftops, where shading from surrounding buildings and tunnels significantly impacts performance, a comparison of MPPT algorithms—namely GSA, PO, and INC—reveals distinct advantages and limitations for each. While the GSA excels in optimizing the output voltage and ensuring stable performance under varying shading conditions, its longer convergence time compared to PO and INC algorithms may be less ideal for rapidly changing environments. The INC and PO algorithms demonstrate quicker convergence, which is advantageous for adapting to dynamic shading patterns. However, their higher accuracy in estimating output power—100% and 90%, respectively—comes with the trade-off of output voltage fluctuations, potentially affecting the reliability of the power supply. Therefore, although the GSA might be less responsive, its ability to minimize voltage oscillations and hybrid methods integrated with the GSA makes it a strong candidate for ensuring consistent power delivery in the challenging conditions of train-mounted PV systems. One of the other significant challenges is shading caused by overhead contact lines. These lines can cast shadows on the PV panels, particularly as the train moves and the angle of the sun changes throughout the day. This shading can significantly reduce the efficiency of the solar panels, as even partial shading can lead to substantial drops in energy output. Moreover, the dynamic nature of train operations means that shading patterns are constantly changing, complicating the optimization of energy harvest.
To assess the long-term performance of the PV system, the degradation rate of modules must be taken into account. As demonstrated in Figure 16, the output power of PV panels will be 97% after one year and 85% after 20 years, respectively. Taking these into consideration, a typical lifetime of 20 to 25 years can be used in economic research.
Figure 17 shows the monthly energy generated by train rooftop PV power. It is also clear that the largest power generation by PV modules occurs in July, owing to the highest irradiation during this time period. Figure 18 depicts the proposed system’s PV coverage of consumption over several months. For financial analysis, the dynamic price of power and the energy inflation rate in Italy are considered.
Energy inflation in Italy is predicted to reach 11.5 percent in May 2023 [35]. As shown in Figure 19, the economic analysis findings reveal that the original investment is reimbursed after 7 years; therefore, the payback time for the current system is 7 years, and this graph depicts the profit from the deployment of the current system over the following 20 years. It is worth mentioning that in our research, only capital expenditure (CapEx) associated with the initial investment necessary for PV system deployment was included.

6. Conclusions

This paper focuses on the direct integration of photovoltaic technologies onto the roofs of regional trains for auxiliary system power supply. It is positioned as a new investigation in Europe. This study underscores the vital significance of promoting sustainable transportation in line with worldwide endeavors by showcasing the viability of photovoltaic modules installed on trains. As a real-world case study, the production power of PV modules installed on the roof of a regional train in Milan, Italy, that is moving from Cadorna to Saronno is examined.
MATLAB/SIMULINK software has been used to simulate the PV system. This system consisted of a panel of solar cells, a DC–DC converter, and a GSA controller compared with PO and INC. The simulation results indicate that the GSA excels in tracking the Maximum Power Point (MPP) of solar modules compared to the PO and INC algorithms. The GSA demonstrates superior performance by accurately locating the MPP through a simultaneous search of multiple candidate points within the search space. Despite its longer convergence time, the GSA’s strength lies in its ability to maintain stable output voltage, which is crucial for systems with variable shading conditions, such as PV panels mounted on train rooftops. In contrast, while the PO and INC algorithms achieve faster convergence and higher accuracy in power estimation—100% and 90%, respectively—they are prone to fluctuations in output voltage, which can affect power reliability. The GSA’s ease of use and simplicity further enhance its appeal, especially when integrated with hybrid methods to mitigate voltage oscillations. Comparing the GSA-based controller with those using PO and INC algorithms highlights the GSA’s advantage in maintaining consistent power delivery under challenging conditions. The results of modeling and simulation also revealed that by placing 98 solar panels on the roof (taking into account the free space for pantographs and other equipment), 59,370 kWh of energy can be produced annually, which is approximately 9.8 percent of the train’s auxiliary electric load. Furthermore, the suggested system’s environmental impact was assessed, suggesting a possible decrease of 27,897 kg in yearly CO2 emissions.
Economic research has shown that the initial investment in the photovoltaic system will be repaid in seven years through energy cost reductions. This demonstrates the long-term durability and economic sustainability of integrating the suggested solar modules.
For future research, it is suggested that researchers investigate the performance of PV systems in longer-distance trains and in areas with different solar radiation levels. Furthermore, research should completely investigate the potential of excess power provided by PV systems, as well as the integration of energy storage solutions, such as advanced batteries or supercapacitors, with PV systems on trains, which could further enhance energy reliability and provide a buffer against intermittent power generation. Furthermore, innovations in sensor technology and data analytics will likely enable more precise monitoring and management of PV performance, leading to smarter and more responsive energy systems.

Author Contributions

In the development of this manuscript, Y.D., S.M.M.G. and H.J.K. were responsible for implementing the methodology, managing data curation, conducting simulations using software, gathering experimental results, and writing the initial draft. Meanwhile, H.J.K. and M.B. took on the roles of editing, validating, visualizing, managing resources, acquiring funding, and also contributed to the editing and oversight of the work. All authors have read and agreed to the published version of the manuscript.

Funding

This research received no external funding.

Data Availability Statement

Data are contained within the article.

Conflicts of Interest

The authors declare no conflict of interest.

References

  1. Farsi, S.; Asgari, H. Effects of Fouled Ballast Layer on Railway Bridge Vibrations. Int. J. Sci. Eng. Appl. (IJSEA) 2024, 13, 35–39. [Google Scholar]
  2. Kaleybar, H.J.; Brenna, M.; Castelli-Dezza, F.; Carmeli, M.S. Smart Hybrid Electric Railway Grids: A Comparative Study of Architectures. In Proceedings of the 2023 IEEE International Conference on Electrical Systems for Aircraft, Railway, Ship Propulsion and Road Vehicles & International Transportation Electrification Conference (ESARS-ITEC), Venice, Italy, 29–31 March 2023; pp. 1–6. [Google Scholar] [CrossRef]
  3. Farsi, S.; Esmaeili, M.; Naseri, R. Effect of rock strength on the degradation of ballast equipped with under sleeper pad using discrete element method. Int. J. Sci. Res. Arch. 2024, 11, 2579–2586. [Google Scholar] [CrossRef]
  4. Ahmadi, M.; Kaleybar, H.J.; Brenna, M.; Castelli-Dezza, F.; Carmeli, M.S. DC Railway Micro Grid Adopting Renewable Energy and EV Fast Charging Station. In Proceedings of the 2021 IEEE International Conference on Environment and Electrical Engineering and 2021 IEEE Industrial and Commercial Power Systems Europe (EEEIC/I&CPS Europe), Bari, Italy, 7–10 September 2021; pp. 1–6. [Google Scholar] [CrossRef]
  5. Sarvi, M.; Azadian, A. A comprehensive review and classified comparison of MPPT algorithms in PV systems. Energy Syst. 2022, 13, 281–320. [Google Scholar] [CrossRef]
  6. Jafari Kaleybar, H.; Hafezi, H.; Brenna, M.; Faranda, R.S. Smart AC-DC Coupled Hybrid Railway Microgrids Integrated with Renewable Energy Sources: Current and Next Generation Architectures. Energies 2024, 17, 1179. [Google Scholar] [CrossRef]
  7. The World’s First Solar-Powered Train in Australia. Available online: https://www.bridgestone.com/bwsc/stories/article/2019/06/17-2.html (accessed on 1 August 2024).
  8. Vasisht, M.S.; Vishal, C.; Srinivasan, J.; Ramasesha, S.K. Solar photovoltaic assistance for LHB rail coaches. Curr. Sci. 2014, 107, 255–259. [Google Scholar]
  9. Thelkar, A.R.; Veerasamy, B.; Mekonnen, T.; Ahmmed, M.; Alem, A.; Jote, A. Interfacing of regulator and rectifier unit with solar charge controller for optimal utilization of solar power on railway coaches. In Proceedings of the 2016 IEEE International Conference on Renewable Energy Research and Applications (ICRERA), Birmingham, UK, 20–23 November 2016; IEEE: Piscataway, NJ, USA, 2016; pp. 730–735. [Google Scholar]
  10. India’s ‘First Solar-Powered Train’: All You Want to Know About Indian Railways’ Green Initiative. Available online: http://www.financialexpress.com/economy/indiasfirst-solar-poweredtrain-all-you-want-to-know-about-indian-railwaysgreeninitiative/264505/ (accessed on 10 July 2024).
  11. Raizada, S.; Verma, V. Step Up Gain Converter with fast MPPT control under moving partial shading for train rooftop PV-DC-µG. In Proceedings of the 2018 IEEE International Conference on Electrical Systems for Aircraft, Railway, Ship Propulsion and Road Vehicles & International Transportation Electrification Conference (ESARS-ITEC), Nottingham, UK, 7–9 November 2018; IEEE: Piscataway, NJ, USA, 2018; pp. 1–6. [Google Scholar]
  12. Talha, I.M.; Huawei, L.; Abdul, Q.; Arif, H. Design of Hybrid Energy System of CRH2 Train Passing Through Neutral Section. In Proceedings of the 2022 4th Global Power, Energy and Communication Conference (GPECOM), Nevsehir, Turkey, 14–17 June 2022; IEEE: Piscataway, NJ, USA, 2022; pp. 117–123. [Google Scholar]
  13. Ouaid, M.A.; Ouassaid, M.; Tebaa, M. Gain Assessment of Powering Train Loads with Rooftop Solar Panels: Case study of Morocco. In Proceedings of the 2023 5th Global Power, Energy and Communication Conference (GPECOM), Nevsehir, Turkiye, 14–16 June 2023; IEEE: Piscataway, NJ, USA, 2023; pp. 472–476. [Google Scholar]
  14. Sawant, P.T.; Bhattar, C. Optimization of PV system using particle swarm algorithm under dynamic weather conditions. In Proceedings of the 2016 IEEE 6th International Conference on Advanced Computing (IACC), Bhimavaram, India, 27–28 February 2016; IEEE: Piscataway, NJ, USA, 2016; pp. 208–213. [Google Scholar]
  15. Enslin, J.; Wolf, M.; Snyman, D.; Swiegers, W. Integrated photovoltaic maximum power point tracking converter. IEEE Trans. Ind. Electron. 1997, 44, 769–773. [Google Scholar] [CrossRef]
  16. del Rio, A.; Barambones, O.; Uralde, J.; Artetxe, E.; Calvo, I. Particle Swarm Optimization-Based Control for Maximum Power Point Tracking Implemented in a Real Time Photovoltaic System. Information 2023, 14, 556. [Google Scholar] [CrossRef]
  17. Femia, N.; Granozio, D.; Petrone, G.; Spagnuolo, G.; Vitelli, M. Predictive & adaptive MPPT perturb and observe method. IEEE Trans. Aerosp. Electron. Syst. 2007, 43, 934–950. [Google Scholar]
  18. Mei, Q.; Shan, M.; Liu, L.; Guerrero, J.M. A novel improved variable step-size incremental-resistance MPPT method for PV systems. IEEE Trans. Ind. Electron. 2010, 58, 2427–2434. [Google Scholar] [CrossRef]
  19. Ji, Y.-H.; Jung, D.-Y.; Kim, J.-G.; Kim, J.-H.; Lee, T.-W.; Won, C.-Y. A Real Maximum Power Point Tracking Method for Mismatching Compensation in PV Array Under Partially Shaded Conditions. IEEE Trans. Power Electron. 2011, 26, 1001–1009. [Google Scholar] [CrossRef]
  20. Yap, K.Y.; Sarimuthu, C.R.; Lim, J.M.-Y. Artificial intelligence based MPPT techniques for solar power system: A review. J. Mod. Power Syst. Clean Energy 2020, 8, 1043–1059. [Google Scholar]
  21. Kaleybar, H.J.; Davoodi, M.; Brenna, M.; Zaninelli, D. Applications of Genetic Algorithm and Its Variants in Rail Vehicle Systems: A Bibliometric Analysis and Comprehensive Review. IEEE Access 2023, 11, 68972–68993. [Google Scholar] [CrossRef]
  22. Ishaque, K.; Salam, Z. An improved modeling method to determine the model parameters of photovoltaic (PV) modules using differential evolution (DE). Solar Energy 2011, 85, 2349–2359. [Google Scholar] [CrossRef]
  23. Eiben, A.; Schippers, C. On evolutionary exploration and exploitation. Fundam. Inform. 1998, 35, 35–50. [Google Scholar] [CrossRef]
  24. Rashedi, E.; Nezamabadi-Pour, H.; Saryazdi, S. GSA: A gravitational search algorithm. Inf. Sci. 2009, 179, 2232–2248. [Google Scholar] [CrossRef]
  25. Saha, D. A GSA based improved MPPT system for PV generation. In Proceedings of the 2015 IEEE International Conference on Research in Computational Intelligence and Communication Networks (ICRCICN), Kolkata, India, 20–22 November 2015; IEEE: Piscataway, NJ, USA, 2015; pp. 131–136. [Google Scholar]
  26. Dhas, B.G.S.; Deepa, S.N. A hybrid PSO and GSA-based maximum power point tracking algorithm for PV systems. In Proceedings of the 2013 IEEE International Conference on Computational Intelligence and Computing Research, Enathi, India, 26–28 December 2013; IEEE: Piscataway, NJ, USA, 2013; pp. 1–4. [Google Scholar]
  27. Pervez, I.; Sarwar, A.; Tayyab, M.; Sarfraz, M. Gravitational search algorithm (GSA) based maximum power point tracking in a solar PV based generation system. In Proceedings of the 2019 Innovations in Power and Advanced Computing Technologies (i-PACT), Vellore, India, 22–23 March 2019; IEEE: Piscataway, NJ, USA, 2019; Volume 1, pp. 1–6. [Google Scholar]
  28. Li, L.-L.; Lin, G.-Q.; Tseng, M.-L.; Tan, K.; Lim, M.K. A maximum power point tracking method for PV system with improved gravitational search algorithm. Appl. Soft Comput. 2018, 65, 333–348. [Google Scholar] [CrossRef]
  29. Javanmard, A.; Kaleybar, H.J.; Brenna, M. Roof-Top Solar Photovoltaic Integration on Trains Supplying Auxiliary Power Systems: A Real Case Study. Presented at the Power Electronics and Drives: Systems and Technologies Conference Pedstc. 2024. Available online: https://sid.ir/paper/1132513/en (accessed on 5 July 2024).
  30. Double Deck, part 5: ALe.710-ALe.711 alias TSR (Regional Service Train). Available online: https://scalaenne.wordpress.com/2020/10/24/doppio-piano-parte-5-tsr-treno-servizio-regionale (accessed on 5 December 2023).
  31. Hashemi, T.; Esfanjani, R.M.; Kaleybar, H.J. Composite Switched Lyapunov Function-Based Control of DC–DC Converters for Renewable Energy Applications. Electronics 2024, 13, 84. [Google Scholar] [CrossRef]
  32. Chatrenour, N.; Razmi, H.; Doagou-Mojarrad, H. Improved double integral sliding mode MPPT controller based parameter estimation for a stand-alone photovoltaic system. Energy Convers. Manag. 2017, 139, 97–109. [Google Scholar] [CrossRef]
  33. Zandabad, Y.Y.; Fazel, S.S. Soft-switching buck/boost full-bridge three-port converter for DC/DC applications. Eng. Sci. Technol. Int. J. 2023, 41, 101382. [Google Scholar] [CrossRef]
  34. Suganya, R.; Rajkumar, M.V.; Pushparani, P. Simulation and Analysis of Boost Converter with MPPT for PV System using Chaos PSO Algorithm. Int. J. Emerg. Technol. Eng. Res. 2017, 5, 97–105. [Google Scholar]
  35. Harmonized Index of Consumer Prices (HICP) Energy Inflation Rate in Italy from January 2019 to May 2024, by Commodity. Available online: https://www.statista.com/statistics/1329397/italy-energy-inflation-rate-by-commodity/ (accessed on 15 July 2024).
Figure 1. Case study details of the train and route. (a) Aerial photo of the train from Cadorna to Saronno. (b) Train TSR EB 711.
Electronics 13 03537 g001
Figure 2. Milano Cadorna to Saronno railway.
Electronics 13 03537 g002
Figure 3. Electric train traction system.
Electronics 13 03537 g003
Figure 4. Internal circuit of the proposed system.
Electronics 13 03537 g004
Figure 5. The MPPT system block diagram.
Electronics 13 03537 g005
Figure 6. (a) I-V characteristic curve; (b) P-V characteristic curve.
Electronics 13 03537 g006
Figure 7. (a) I-V characteristic curve for various radiation intensities; (b) P-V characteristic curve for various radiation intensities.
Electronics 13 03537 g007
Figure 8. Flowchart of the GSA for MPPT.
Electronics 13 03537 g008
Figure 9. Monthly distribution of consumption.
Electronics 13 03537 g009
Figure 10. Arrangement of solar modules on the rooftop of the train considering 6 coaches (software-generated visualization).
Electronics 13 03537 g010
Figure 11. Percentage of consumption covered by PV.
Electronics 13 03537 g011
Figure 12. PV output voltage with MPPT based on the GSA.
Electronics 13 03537 g012
Figure 13. PV output power with MPPT based on the GSA.
Electronics 13 03537 g013
Figure 14. Comparison of MPPT performance with GSA, PO and INC algorithms using PV power curves.
Electronics 13 03537 g014
Figure 15. Comparison of MPPT performance with GSA, PO and INC algorithms using voltage power curves.
Electronics 13 03537 g015
Figure 16. Degradation of modules.
Electronics 13 03537 g016
Figure 17. PV energy for various months.
Electronics 13 03537 g017
Figure 18. Coverage of consumption by PV for various months.
Electronics 13 03537 g018
Figure 19. Cash flow for the coming years.
Electronics 13 03537 g019
Table 1. Parameters of the used DC/DC converter.
ParametersValues
L0.001 H
C1, C20.001 μF, 0.005 F
f s 20 HZ
Table 2. System output in PVSOL software.
ParametersValues
PV Generator Output51.94 kWp
Spec. Annual Yield1142.77 kWh/kWp
Performance Ratio (PR)88.25%
PV Generator Energy (AC grid)59,370 kWh/year
Own Consumption59,370 kWh/year
Down-regulation at Feed-in Point0 kWh/year
Grid Export0 kWh/year
Own Power Consumption100.0%
CO2 Emissions avoided27,897 kg/year
Table 3. Parameters of the GSA.
ParametersSymbolValues
Population NumberN4
Gravitational Reduction Factor α 10
Gravitational Constant G 0 20
Disclaimer/Publisher’s Note: The statements, opinions and data contained in all publications are solely those of the individual author(s) and contributor(s) and not of MDPI and/or the editor(s). MDPI and/or the editor(s) disclaim responsibility for any injury to people or property resulting from any ideas, methods, instructions or products referred to in the content.

