Article

Z-OFDM: A New High-Performance Solution for Underwater Acoustic Communication

1
School of Electronic Engineering and Automation, Guilin University of Electronic Technology, Guilin 541004, China
2
Guangxi Key Laboratory of Automatic Detection Technology and Instrumentation, Guilin 541004, China
3
School of Integrated Circuits, Huazhong University of Science and Technology, Wuhan 430074, China
*
Author to whom correspondence should be addressed.
Electronics 2024, 13(17), 3543; https://doi.org/10.3390/electronics13173543
Submission received: 7 July 2024 / Revised: 3 September 2024 / Accepted: 4 September 2024 / Published: 6 September 2024
(This article belongs to the Special Issue New Advances in Underwater Communication Systems)

Abstract

:
This paper presents Z-OFDM, a high-performance solution for underwater acoustic communication. Traditional underwater orthogonal frequency division multiplexing (OFDM) systems suffer from spectrum leakage and distortion due to the narrowband nature of underwater acoustic signals and the picket fence effect of the fast Fourier transform (FFT). Z-OFDM addresses these issues by integrating zoom-fast Fourier transform (ZoomFFT) with OFDM and redesigning the modulator and demodulator to replace the conventional FFT. This integration enhances spectral resolution, resulting in higher channel capacity, improved Signal to Interference plus Noise Ratio (SINR), and reduced Bit Error Rate (BER). Computer simulations using underwater acoustic channels from Fuxian Lake and Wuyuan Bay demonstrate that the Z-OFDM system achieves a 6 dB gain compared to conventional OFDM systems at a BER of 10 3 . These results demonstrate the effectiveness of Z-OFDM in overcoming the limitations of traditional FFT-based OFDM systems in underwater environments.

1. Introduction

Underwater Acoustic (UWA) communication systems play a vital role in fields such as oil exploration, oceanographic studies, and military applications [1]. Compared to optical and radio frequency (RF) communications, UWA communication is currently the dominant technology for underwater wireless communication because it can provide transmission distances of up to several kilometers. Orthogonal Frequency Division Multiplexing (OFDM) has been widely used in UWA communication systems [2,3,4,5]. As a multicarrier technology, OFDM benefits from the computational efficiency of processing based on the fast Fourier transform (FFT), which allows the bandwidth to be easily divided into several orthogonal narrowband subcarriers. This simple structure enables high transmission rates and a strong ability to against the frequency-selective multipath distortion of UWA channels [6].
In traditional UWA OFDM communication systems, the design of modulators and demodulators typically employs the FFT algorithm. According to the Web of Science, between 2021 and 2024, a total of 228 studies applied OFDM in UWA communication systems, with 97.8% of them using FFT as the modulation and demodulation algorithm. These studies focus on improving various aspects of the communication system, including channel estimation (CE) [4], carrier frequency offset (CFO) estimation [7], pilot insertion [8], equalizers [9], and mappers [10], to enhance system performance. However, systems that utilize FFT obtain a rough “panoramic spectrum” over the entire folding frequency [11]. It is important to note that UWA OFDM communication is a narrowband communication technology. Due to the limitations of FFT size, spectral leakage and picket fence effects cause many subcarriers near interference frequencies to suffer severe signal-to-interference-plus-noise ratio (SINR) degradation. This makes UWA OFDM systems more susceptible to narrowband interference (NBI), thereby limiting the performance improvement of the systems.
Specifically, UWA OFDM communication systems are extremely sensitive to Carrier Frequency Offset (CFO) caused by the Doppler effect. If the CFO exceeds the carrier spacing, due to the spectral leakage of FFT, the spectrum of NBI will spread in the entire frequency domain, thereby severely affecting adjacent sub-channels [12]. Suppressing Doppler distortion and reducing CFO are considered feasible methods to mitigate interference and have been extensively studied [7,13,14,15]. For instance, Doppler shift compensation often employs resampling-based techniques. However, this significantly increases the size of the FFT, which in turn leads to higher computational complexity and reduced data rates [14]. OFDM is often used as the physical layer solution for UWA wireless sensor networks [16]. It is foreseeable that if the spectral leakage and picket fence effects of FFT are overlooked while continuing to optimize other modules of the communication system, it will greatly increase the computational complexity of the entire network and negatively impact energy efficiency.
The fractional Fourier transform (FRFT) is another implementation method for UWA OFDM modulation and demodulation [17]. The complexity of the OFDM system based on FRFT is similar to FFT, but the performance is better in UWA channels [18]. However, FRFT is only a generalized Fourier transform, which cannot solve the spectrum leakage and picket fence effect of FFT itself. Consequently, it also limits improving UWA OFDM communication performance [19,20].
Based on the previous analysis, improving FFT or FRFT to address their inherent issues of spectral leakage and picket fence effects would be a promising direction. To eliminate the picket fence effect, refining the spectrum of the received signal is necessary to improve its spectral resolution [21]. The basic idea of spectrum refinement is to amplify a specific frequency band in the signal spectrum [22], increasing the spectral line density near a particular frequency to achieve selectable frequency band analysis [23]. Currently, there are mainly two methods for spectrum refinement in engineering: zoom-fast Fourier transform (ZoomFFT) and Chirp-Z transform [24]. Both algorithms can effectively improve the spectral resolution of the narrowband signal. Chirp-Z transform increases the number of FFT transform points by interpolating the target frequency band without expanding the data length to improve the spectral resolution of the signal [25]. ZoomFFT moves the signal spectrum to the baseband, decimates it, and outputs it for spectrum refinement [26]. For the multi-frequency harmonic components with single frequency and less severe spectral line interference, Chirp-Z can obtain higher frequency, amplitude, and phase accuracy than Zoom FFT [27]. For the dense multi-frequency harmonic components with serious interference, Chirp-Z can only amplify the frequency band but cannot eliminate the interference effect [28], while ZoomFFT can separate and correct the interference frequency components by increasing the refinement factor to obtain high-precision signal parameters [29,30,31]. Since OFDM belongs to the multi-carrier communication system, the underwater acoustic OFDM signal is a multi-frequency signal. To improve spectrum utilization and communication speed under extremely limited bandwidth resources [32], the spectrum lines of underwater acoustic OFDM signals are usually quite dense [33]. In addition, the underwater acoustic OFDM signal is vulnerable to the influence of underwater auditory channels, resulting in Inter Carrier Interference (ICI). In contrast, ZoomFFT is more suitable for underwater acoustic OFDM signal processing [34].
Considering the advantage of ZoomFFT, the UWA OFDM communication system based on ZoomFFT (Z-OFDM) is proposed in the paper, which uses ZoomFFT to replace FFT in the modulation and demodulation. This modulation method improves the channel capacity and SINR of the system and reduces the BER of the system. The Z-OFDM system is expected to become a new high-performance and low-complexity solution for UWA communication.
The rest of the paper is organized as follows. In Section 2, the principle of ZoomFFT is reviewed. In Section 3, the design and performance of the Z-OFDM system are presented. Section 4 focuses on the computer simulation experiments of the Z-OFDM system. In Section 5, the innovations and advantages of the Z-OFDM system compared to the traditional FFT-based OFDM system are discussed based on the experimental results. Finally, the conclusion is drawn in Section 6.

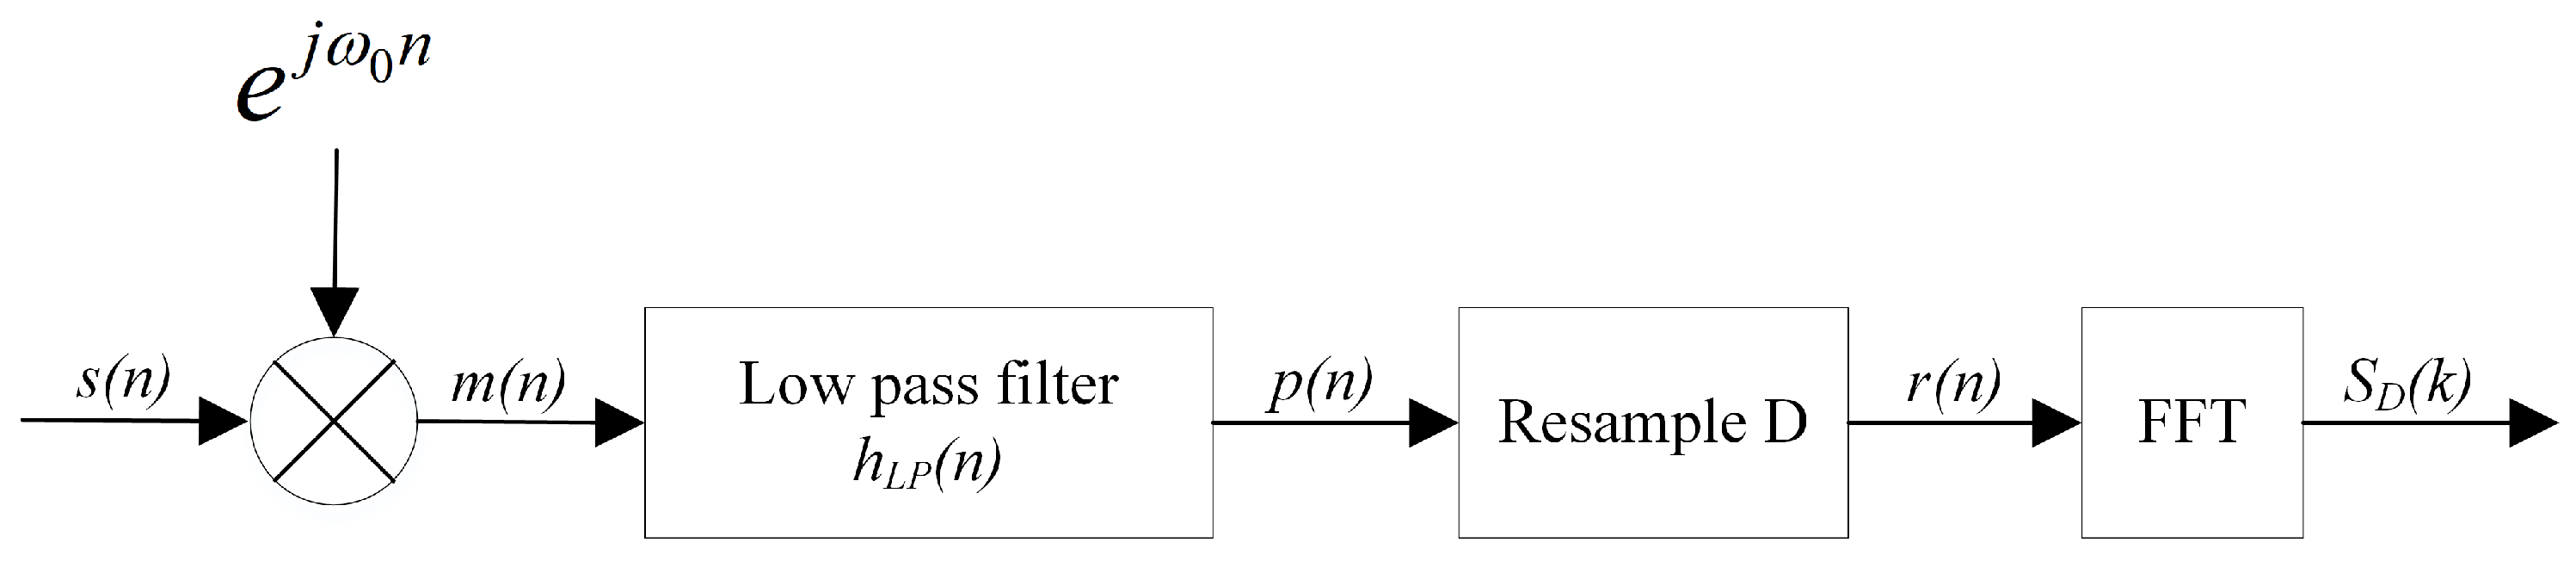
2. ZoomFFT Algorithm

2.1. Principle

The ZoomFFT can be summarized with the following four steps shown in Figure 1 [21]: frequency shift, low pass filtering, resampling, and FFT.
The sequence s ( n ) is the input signal with the length of N. And S D ( k ) is the corresponding refinement spectrum of sequence s ( n ) , which can be expressed as [21]
S D ( k ) = F ( h L P ( n D ) ( s ( n D ) e j ω 0 n D ) = 1 D H L P ( e j 2 π T D k ) S ( e j ( 2 π T D k ω 0 ) )
where h L P the impulse response of the low pass filter is used for anti-aliasing. ω 0 is the frequency shift parameter. D is the refinement factor.
The number of FFT points is N. The spectral resolution of the Zoom-FFT algorithm is [35]
Δ f N = f s N = f s / D N = Δ f N D
where the sampling frequencies for the FFT and Zoom-FFT algorithms are, respectively, f s and f s , and the spectral resolutions are Δ f N and Δ f N . The resolution of the spectrum after refinement is increased D-fold compared with the original range.

2.2. Energy Efficiency

When the number of points in the ZoomFFT is N, the total number of sampling points is N D , the order of the low-pass filter is R, and the FFT requires N 2 log 2 N complex multiplications, the total number of complex multiplications (NCM) for the ZoomFFT algorithm, including frequency shifting, low-pass filtering, and FFT, can be expressed as [21,24]
T Z o o m F F T = T s h i f t ( n ) + T L P ( n ) + T F F T ( n ) = Θ ( ( R + 1 ) N D + N 2 l o g 2 N )
If the traditional FFT algorithm is required to achieve the same frequency resolution as the ZoomFFT, the number of points needs to be increased by D. Therefore, the NCM for the traditional FFT algorithm is
T F F T = Θ ( N D 2 l o g 2 N D )
It is shown from Equation (3) and (4) that the spectrum resolution with ZoomFFT is the same as the spectrum of the original signal with FFT, but the computational complexity has been reduced. When the value of D is relatively small (e.g., D = 2 , 3 ), the computational complexity of the ZoomFFT is not significantly different from that of the FFT due to the frequency shift and filtering steps involved in the ZoomFFT. However, as D increases, in order to achieve the same frequency resolution, the FFT requires a much larger size, specifically D times that of the ZoomFFT. Given that the growth rate of N log 2 N is greater than that of N, this results in a substantial increase in the complexity of the FFT, far exceeding that of the ZoomFFT. Therefore, the larger the value of D, the more pronounced the advantage of the ZoomFFT algorithm becomes.
Using a benchmark signal with a center frequency of 31 kHz, a bandwidth of approximately 2 kHz, and a sampling rate of 144 kHz, both FFT and ZoomFFT are implemented on the same hardware platform [36]. Under the condition of the refinement factor, D is 3, and the execution time of ZoomFFT is 9.528 ms, while that of FFT is 9.722 ms, showing little difference between the two. When the refinement factor D is increased to 12, the execution time of ZoomFFT is 8.578 ms, while that of FFT is 32.604 ms. To achieve the same resolution, the FFT algorithm requires an increase in the number of points, resulting in a much longer execution time compared to ZoomFFT. It is evident that for a specific frequency band, ZoomFFT exhibits a shorter execution time, thereby reducing overall energy consumption.

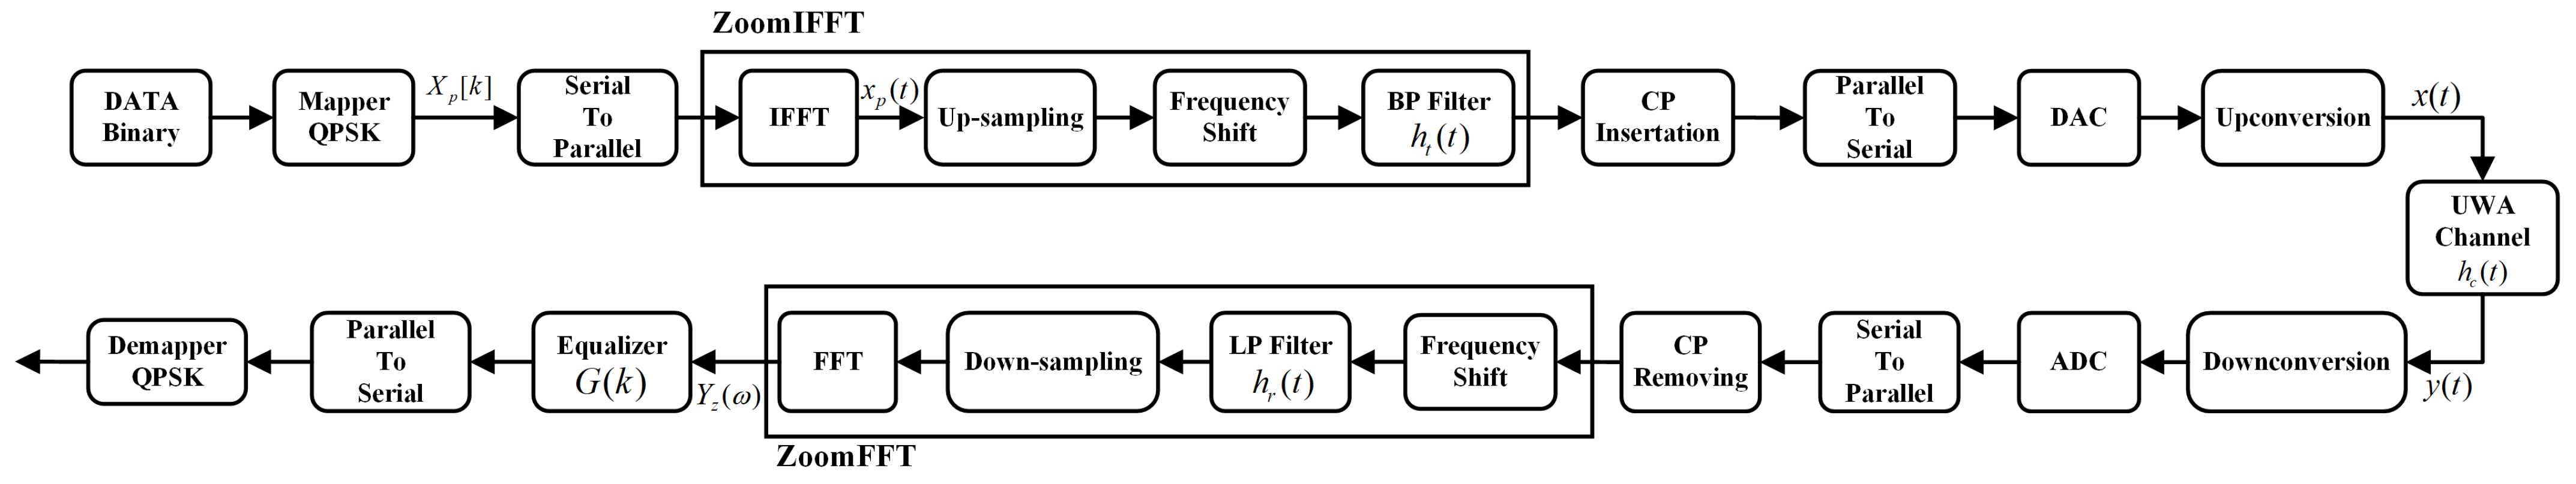
3. Communication System Model

3.1. Theory

The composition of the Z-OFDM system, which belongs to single input-single output (SISO) communication system, is shown in Figure 2 [35]. The input binary data are mapped into a symbol constellation point X p by Quadrature Phase Shift Keying (QPSK) [37] and transferred to the OFDM time domain signal x p ( t ) by the inverse fast Fourier transform (IFFT) algorithm. Up-sampling the OFDM signal x p ( t ) [38], and then the low-pass filter h l ( t ) is added to the system to reduce the aliasing effect. Furthermore, the cyclic prefix (CP) is inserted at the head of the transmitting sequence to minimize the impact of inter-symbol interference (ISI). The signal is then up-converted to the carrier frequency. Subsequently, the signal is transmitted through the underwater acoustic channel, and the received signal y ( t ) is obtained at the receiver. Then, the CP is deleted and the time-domain signal is down-converted, passed through a low-pass filter, and then down-sampled by decimation. Finally, passing the down-sampled signal through FFT and performing channel equalization to reduce channel effects, then demodulating it by QPSK to get the message sequence [39]. The following will introduce the components of the Z-OFDM system from the perspectives of the transmitter model and the receiver model.

3.1.1. Transmitter Model

The transmitter sends data in blocks with a duration of T D . The input bit stream for each block is mapped into M symbols using a QPSK constellation scheme (in this study, M = 4 ). The data stream is then converted from serial to parallel, forming parallel symbol streams, which are transmitted on orthogonal carriers centered at different subcarrier frequencies. Suppose the original data rate is R; the parallel stream rate is R K , where K is the number of parallel streams.
The data streams are loaded onto the subcarriers using IFFT. The symbol duration on each subcarrier increases by a factor of K. The number of subcarriers K is chosen such that the symbol time on each subcarrier is much greater than the channel delay spread, or the subcarrier bandwidth is less than the channel coherence bandwidth. The modulation scheme modulates only the odd subcarriers in the first half of the N subcarriers to meet the Hermitian symmetry requirement.
Let X p = [ X 0 , X 1 , , X N 1 ] be the QPSK modulated information sequence, where N is the number of subcarriers. Zeros are inserted at the carrier positions, and the modulated information sequence is loaded onto the corresponding subcarriers. Suppose the sequence after zero insertion is X i [ k ] ; this step can be expressed by Equation (5).
X i [ k ] = X p [ k ] , if k C D 0 , else
where C D is the data set composed of the positions of the information sequence.
The sequence after zero insertion is transformed into a time-domain signal through IFFT, which can be expressed as
x p ( t ) = 1 N k = 0 N 1 X i [ k ] e j 2 π k T t
where x p ( t ) is the time-domain signal, and N is the number of IFFT points.
The baseband signal x p ( t ) is upsampled (using an upsampling factor D), resulting in the refined frequency bands. These bands are then frequency-shifted to their actual frequencies and passed through a bandpass filter to prevent aliasing, and that can be expressed as
x D ( t ) = x p ( t D ) e j ω 0 t h t ( t )
where h t ( t ) is the impulse response of the low-pass filter, and ω 0 is the frequency shift parameter.
A CP is inserted at the front end of the signal to eliminate ISI. The signal with the CP added is then converted from parallel to serial, and upconverted to the carrier frequency f c . After up-conversion, the transmitted signal x ( t ) and its spectrum X ( ω ) can be described as follows:
x ( t ) = 2 R ( ( x p ( t D ) e j ω 0 t h t ( t ) ) e j 2 π f c t )
X ( ω ) = X p ( ( ω + ω 0 ) D + 2 π f c ) H T ( ω + 2 π f c )

3.1.2. Receiver Model

The signal is subject to multipath propagation within the limited bandwidth through the underwater channel. Multipath propagation causes ISI, which restricts the data through put and degrades the system’s performance. For this reason, the UWA channel impulse response is represented by [40]
h c ( t ) = l = 0 N a l δ ( t τ l )
in which both a l and τ l are the amplitude gain and Delay on the l path.
After passing through the UWA channel, the received signal can be written as [41]
y ( t ) = h c ( t ) x ( t ) + w ( t ) = l = 0 L a l x ( t τ l ) + w ( t )
where w ( t ) is the additive white Gaussian noise (AWGN) process.
At the receiver, the first step is frequency down-conversion, which translates the received signal from its carrier frequency to baseband. This is represented by
y m ( t ) = y ( t ) e j 2 π f c t
where f c is the carrier frequency.
After frequency down-conversion, the signal y m ( t ) undergoes serial-to-parallel conversion. This process converts the entire signal into multiple OFDM symbols. Each OFDM symbol contains a CP that must be removed for restoring the original symbol. Once the CP is removed, the signal is frequency-shifted to near zero frequency and then undergoes to low-pass filtering using a Kaiser window function to prevent spectral aliasing during the downsampling. The process is represented as
y f ( t ) = y m ( t ) e j ω 0 t h r ( t )
where h r ( t ) is the impulse response of the low-pass filter.
After low-pass filtering, the signal is down-sampled to enhance its resolution. Down-sampling involves selecting every D-th sample, and the process is described as
y D ( t ) = y f ( t D )
where D is the down-sampling factor.
This step ensures that the sampling rate of the received signal returns to the original baseband sampling rate.
The down-sampled signal is then transformed to the frequency domain using FFT. At this step, the refined spectrum of the received signal is obtained. The FFT process is represented as
Y z ( ω ) = t = 0 N 1 y D ( t ) e j ω t
where Y z ( ω ) is the frequency-domain representation, and N is the FFT size.
Let ω c = 2 π f c . The complete calculation of the ZoomFFT output at the l subcarrier is as follows:
Y z ( ω ) = F ( y ( t D ) e j ( ω c + ω 0 ) t D h r ( t D ) ) = H C ( ω ( ω c + ω 0 ) D ) X ( ω ( ω c + ω 0 ) D ) H r ( ω D ) + W ( ω )
Subsequently, the refined spectrum of the received signal is subjected to channel equalization. This process eliminates the impact of the channel on the data symbols, thereby reducing the BER. The channel’s target frequency band spectrum is refined using ZoomFFT. By combining the refined spectrum with the Minimum Mean Square Error (MMSE) equalizer, the influence of the channel on the received signal can be more effectively mitigated. The principle of the equalizer G ( k ) , obtained through the methods in references [42,43,44], is given as shown in Equation (17).
S ^ ( k ) = G ( k ) d ( k ) , G ( k ) = Y z Y z H + σ 2 I 1 Y z e i , Y z e i = E [ S i R z ( i ) ]
Then, by performing channel equalization on Y z ( ω ) , the effects of channel transmission are eliminated. Finally, the modulated information X p is extracted from the selected refined spectrum Y z ( ω ) , and by performing QPSK demapping on X p , the binary data are obtained.

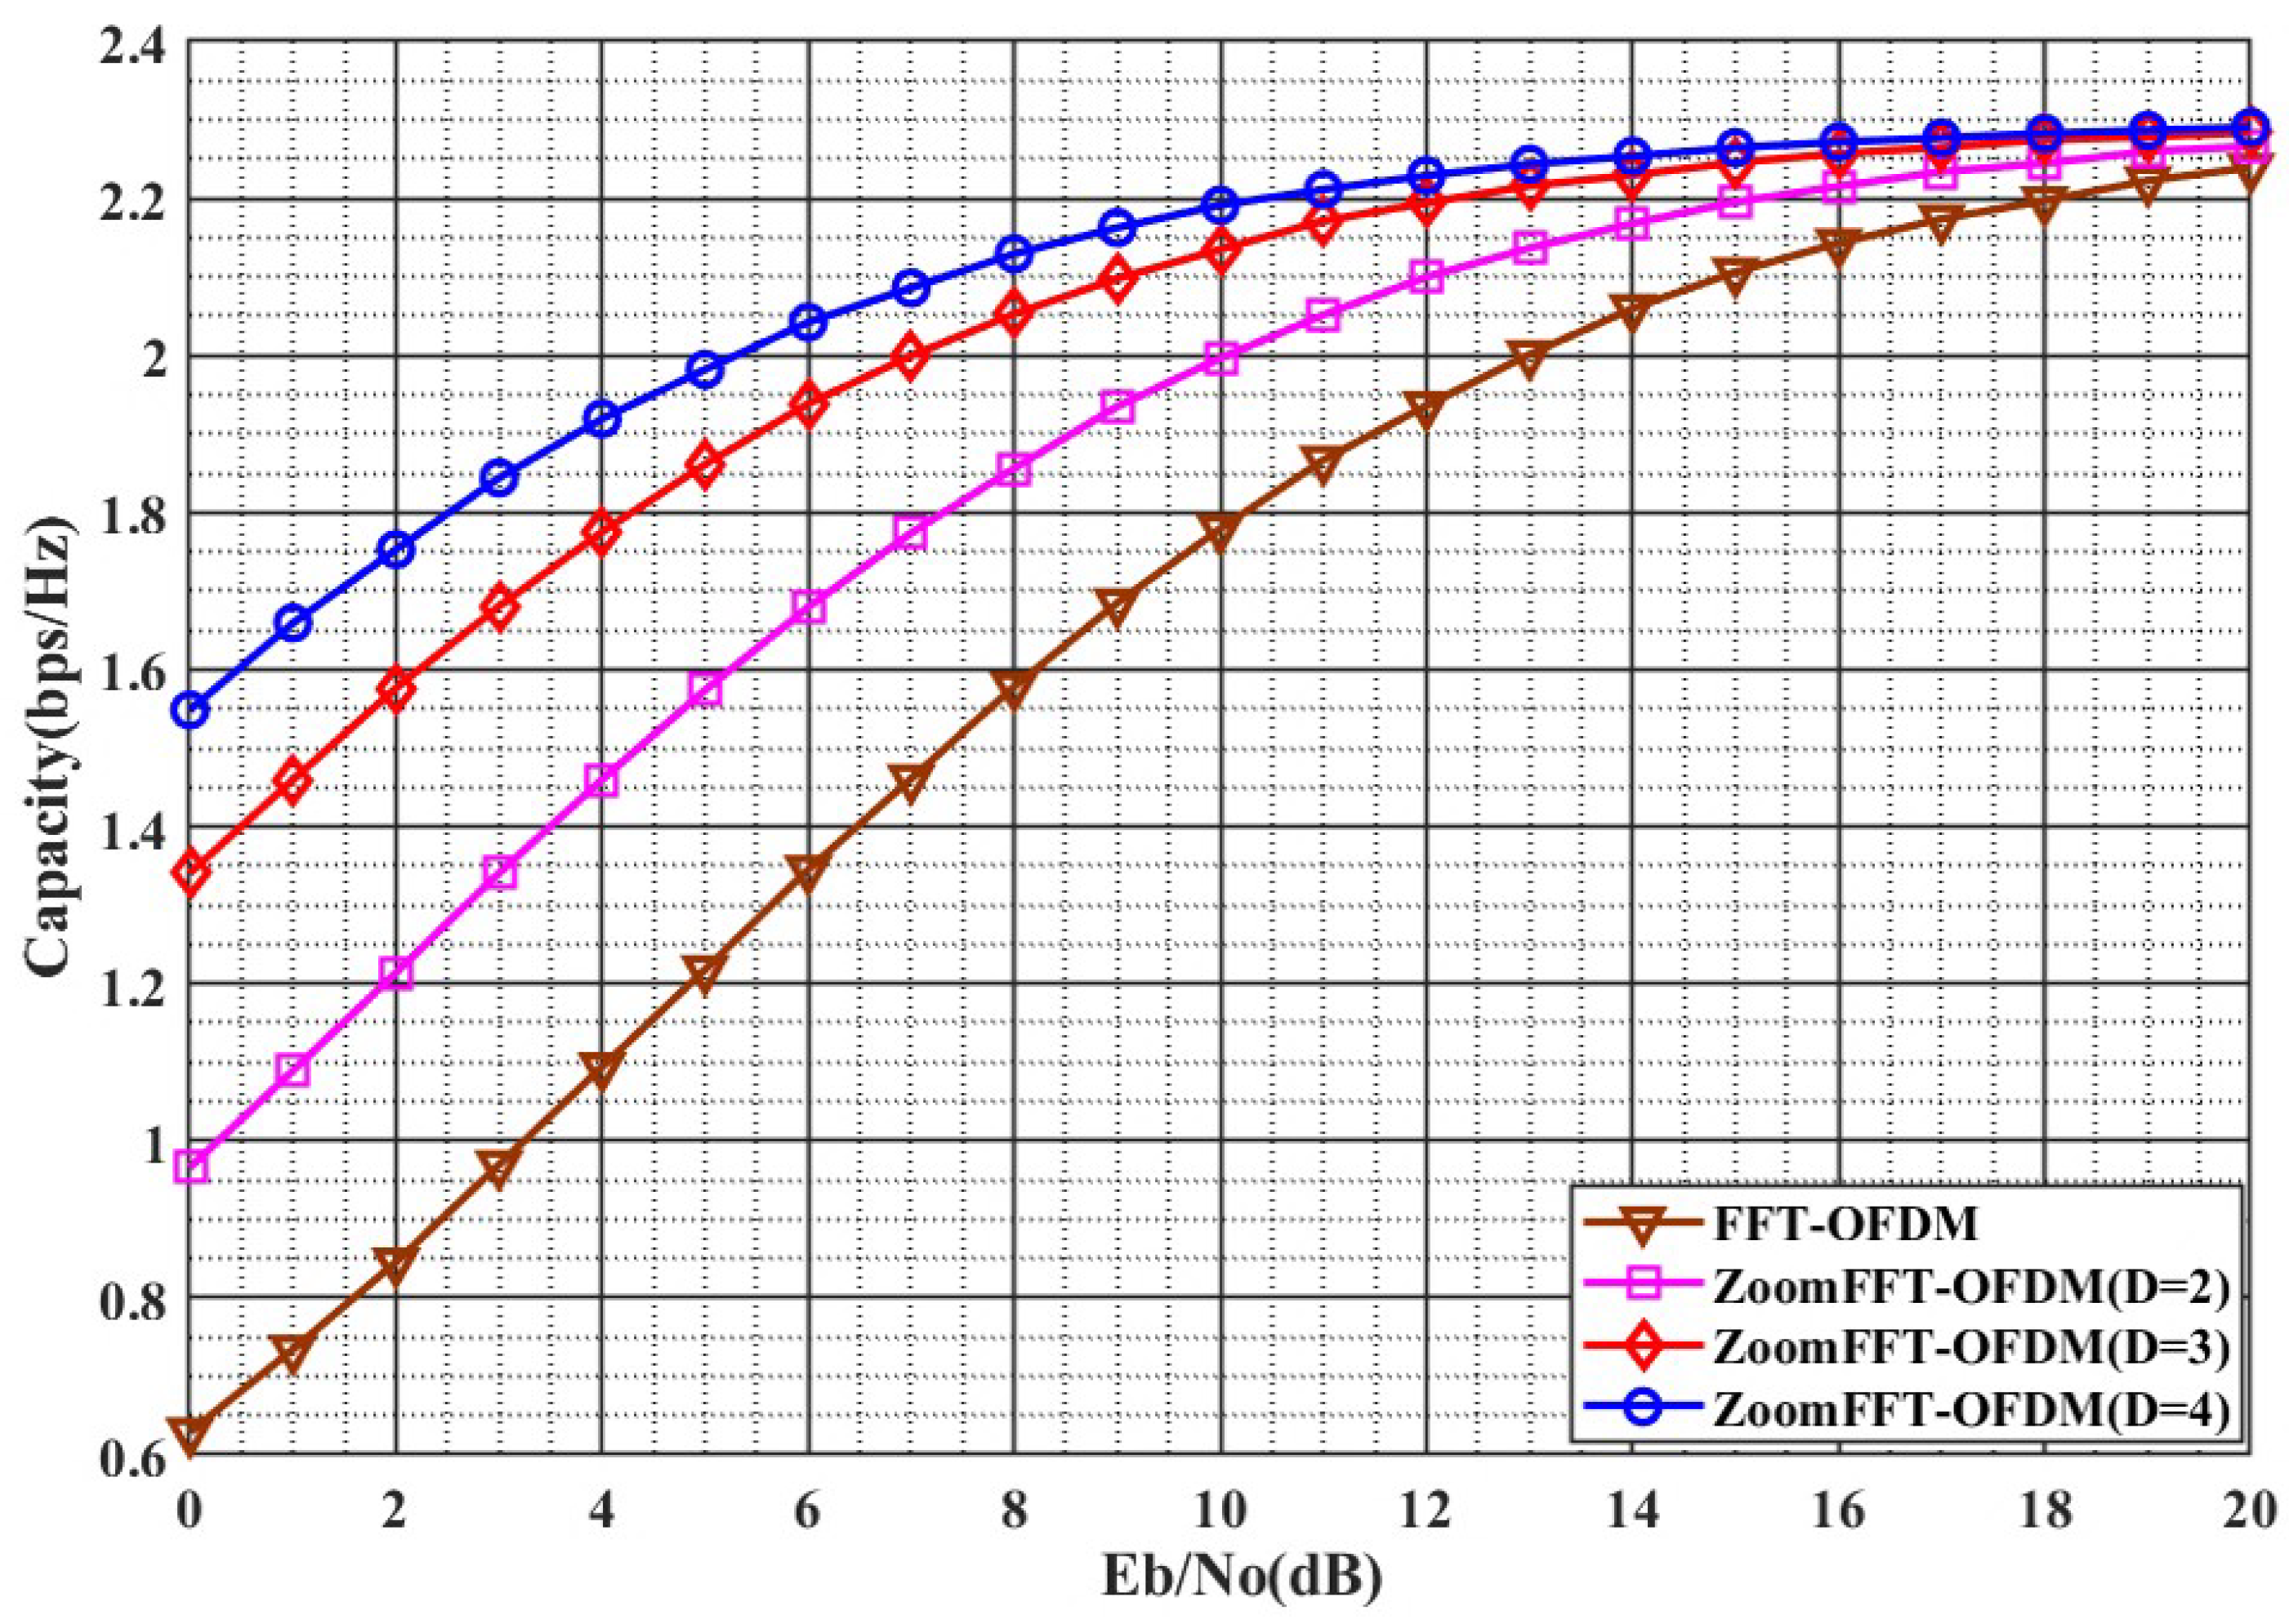
3.2. Performance Analysis

3.2.1. Channel Capacity

According to the definition of spectral resolution, an increase in resolution implies a decrease in the spacing of subcarriers, which means that a constant bandwidth can be synthesized by more subcarriers. For the same bandwidth, the channel capacity of the Z-OFDM system increases with the spectral refinement factor D [45].
According to the definition given in the literature [46], the OFDM channel capacity can be expressed as
C = l = 0 k C k = Δ f k = 1 N l o g 2 ( 1 + P k N 0 )
where C k is the information capacity of the k-th sub-channel, P k is the average power of the sub-carriers under the first sub-channel.
Assuming that the bandwidth of the UWA signal is constant, the relationship between the bandwidth, B, the number of sub-carriers, and the sub-carrier interval should satisfy the description given in Equation (19).
B = N Δ f
Combining Equations (2), (18), and (19), it is derived that the channel capacity of the Z-OFDM system can be described as
C Z = k = 1 N D Δ f D l o g 2 ( 1 + P k N 0 )
The power of the channel noise in the k-th sub-channel is denoted as N 0 . Figure 3 shows the channel capacity of the Z-OFDM system over AWGN channel. From Figure 3, it can be concluded that the channel capacity of the Z-OFDM system increases as the spectral refinement factor D increases for the same E b N 0 . In contrast, the channel capacity of the FFT-based OFDM system is smaller than that of the Z-OFDM system.

3.2.2. Signal Interference plus Noise Ratio

This section analyzes the Signal Interference plus Noise Ratio (SINR) of the Z-OFDM communication system [47,48,49,50].
According to the literature, the SINR of the Z-OFDM system can be defined as [51]
S I N R i = E [ R ( τ ) ] V a r [ I Q ]
where I Q denoted the total interference.
This section I Q was only considered as AWGN to simplify the research, R i ( τ ) which was given in
R i ( τ ) = τ T c P Z j ( t ) P Z j ( t τ )
where P Z j is the average power of the Z-OFDM signal, which is given in
P Z j = 1 T c τ T c y z 2 ( t ) d t = D T c τ T c | X ( 2 π f D ) | 2 d f D = P i D
Combining Equations (21), (22), and (23), they can be written as Equation (23) in another way [52].
S I N R Z j = E [ R Z j ( τ ) ] V a r [ I Q ] = E [ R i ( τ ) D 2 ] V a r [ I Q ]
The comparison between the Z-OFDM system and the FFT-based OFDM system over different values of factor D is shown in Figure 4. The SINR of the Z-OFDM system increased with the increase in factor D and is higher than the SINR of the FFT-based OFDM system.

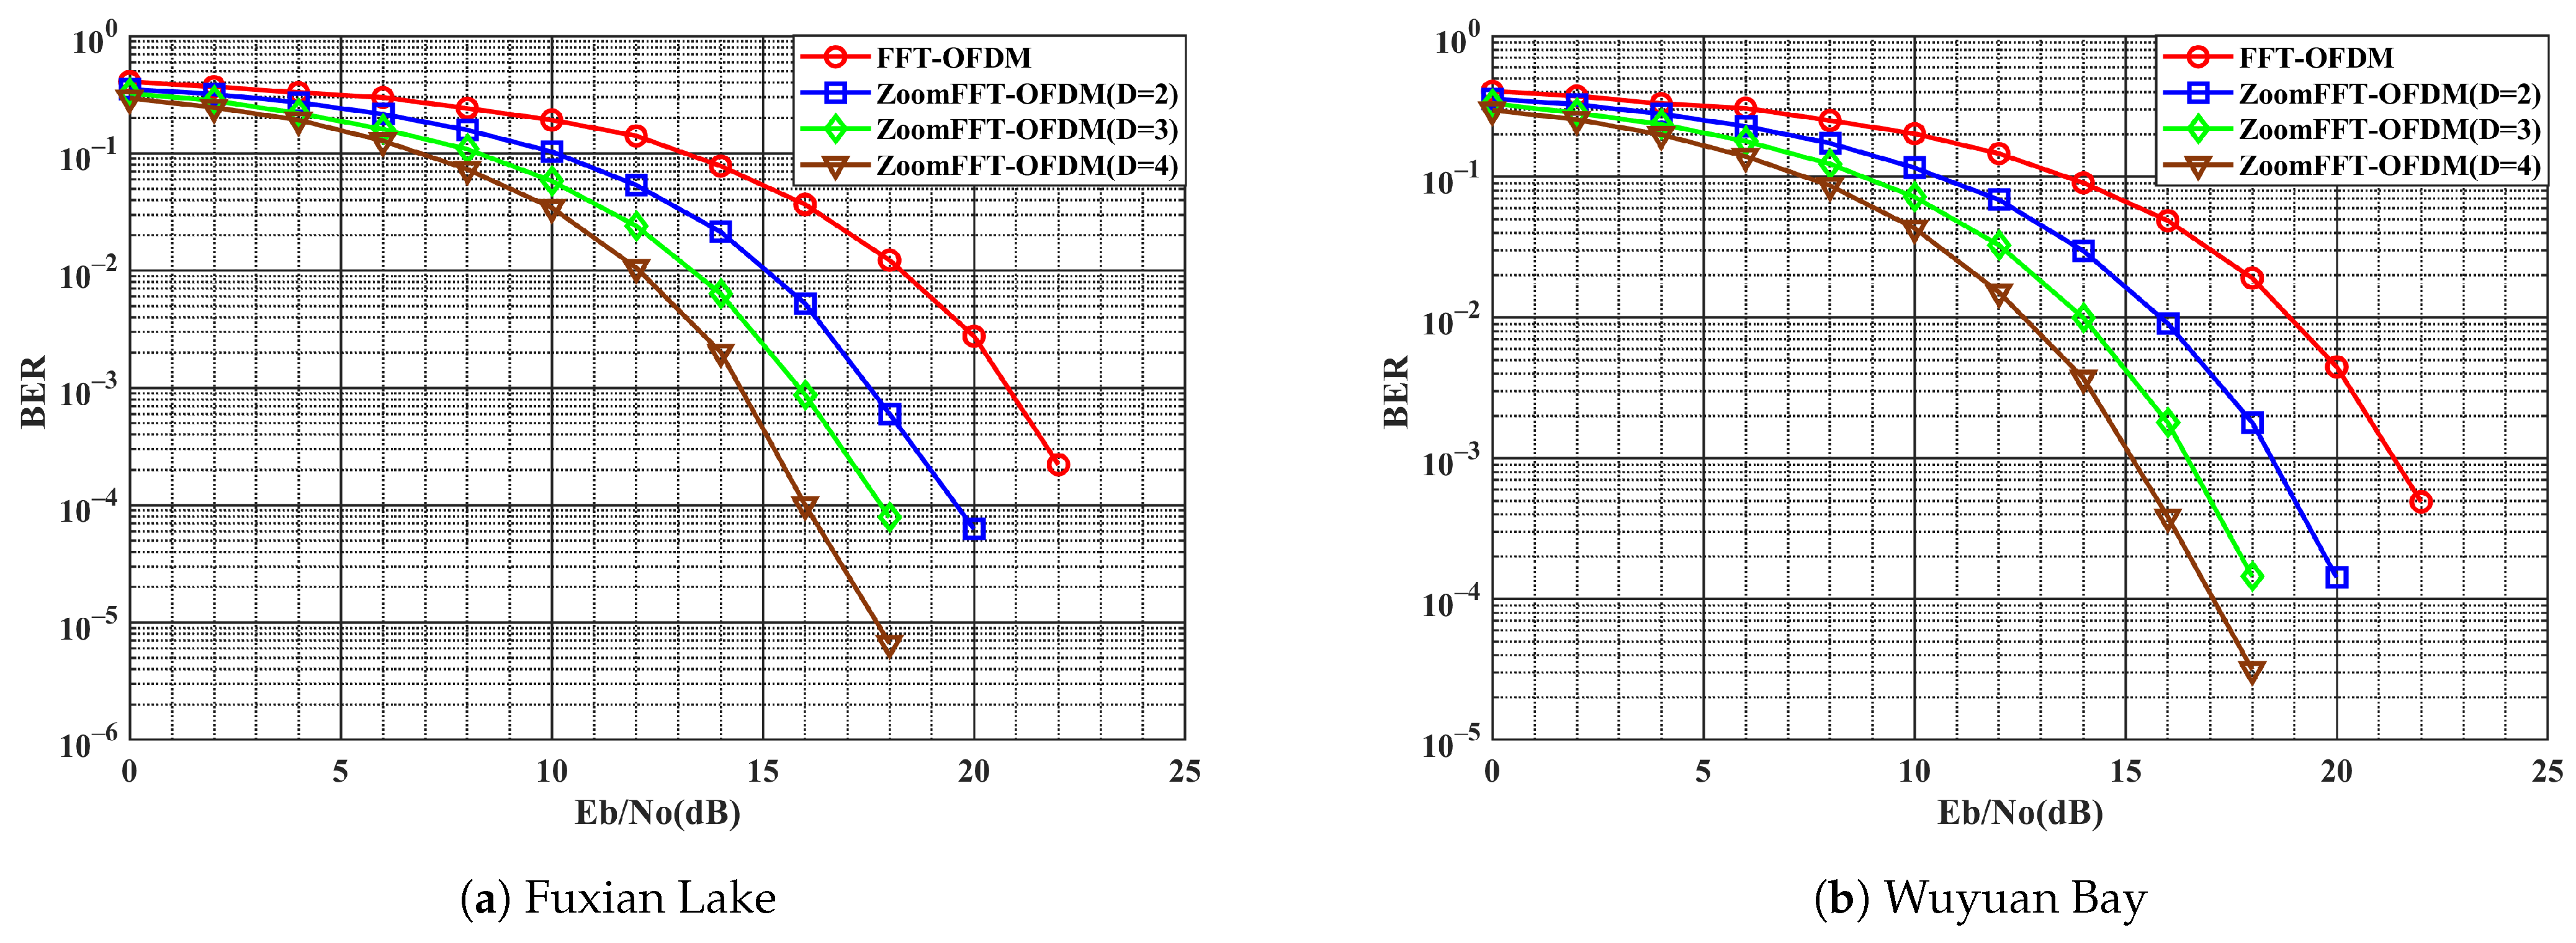
3.2.3. Bit Error Rate

In this paper, it is assumed that the modulation is QPSK. According to the definition given in the literature [53], the BER of the OFDM can be expressed as
P B E R = Q ( 2 | H c | 2 ε Z N 0 )
where N 0 is the noise spectral density of the AWGN channel, ε Z is the total transmitted signal energy for the Z-OFDM signals, which was given by
ε Z = + | Y z ( f ) | 2 d f = + | Y z ( f D ) | 2 d f = D + | Y z ( f D ) | 2 d f D = ε D
Combining Equations (25) and (26), the probability of error of the Z-OFDM system is [46,54]
P B E R = Q ( 2 | H c | 2 ε D N 0 )
Figure 5 shows the BER of Z-OFDM at different values of factor D over the AWGN channel. At a BER of 10 3 , Z-OFDM achieved a 3 dB gain compared to FFT-based OFDM when D = 2 . It also achieved a 6 dB gain when D = 4 and an 8 dB gain when D = 6 . It also shows that the BER of the Z-OFDM system decreased as the factor D increased.

4. Computer Simulation Experiments

This section primarily introduces the computer simulation experiments and experimental results of the Z-OFDM system. The parameter of the Z-OFDM system is given in Table 1. This simulation aims to get the BER of the Z-OFDM system under a natural underwater channel.
In this section, the channel data are obtained from the natural underwater channel in an experiment held by the Key Laboratory of Underwater Acoustic Communication and Marine Information Technology at Xiamen university. The experiment aimed to measure the time evolution of the magnitude impulse response at two different locations. The experiments are held in Fuxian Lake in Yunnan [7,55,56] (Figure 6a) and Wuyuan Bay in Xiamen [57,58,59] (Figure 6b).

4.1. Underwater Acoustic Channels

Figure 7 shows the two impulse responses of underwater channels at (a) Fuxian Lake and (b) Wuyuan Bay. The environmental characteristics of these locations are not similar and can represent different underwater environments.

4.1.1. Fuxian Lake

Fuxian Lake is a freshwater lake, and its underwater acoustic environment is relatively pure due to the lack of human-made noise such as boat activity. From Figure 7a, at least three transmission paths can be observed that are clear and constant. There are also several transmission paths that are not clear enough and can be ignored. The maximum Delay of these clear paths is 3 ms.

4.1.2. Wuyuan Bay

Wuyuan Bay is a semi-enclosed shallow bay. The data were collected in a shallow water channel with a depth of approximately 10 m in the bay. As seen in Figure 6b, there is a large bridge near the channel. The passage of vehicles on the bridge causes vibrations, which are transmitted to the sea through the bridge piers. This results in a complex underwater noise environment with significant human-made noise. In Figure 7b, six paths can be observed. The maximum delay of the paths is 11 ms. The transmission loss in Wuyuan Bay is too serious to keep the other transmitting path.

4.2. Experimental Results

In this section, the experimental results of the Z-OFDM system in two different environments (Fuxian Lake and Wuyuan Bay) are presented by illustrating the BER and its fluctuations as the refinement factor D increases. To ensure a fair comparison of performance, the experiments are conducted at the same transmission rate, which can be calculated using the following equation:
R Z-OFDM = N s · R b = D N s · 1 T · log 2 M = D N s · B 1 + T G T S D N D F T · log 2 M = B N S log 2 M 1 + T G T S N D F T
where N s is the number of subcarriers, R b is the transmission rate of a single subcarrier, T is the period of a single subcarrier, B is the bandwidth, T G is the guard interval, T S is the symbol length, and N D F T is the number of DFT points. Since QPSK modulation is employed in this communication system, M = 4 .
In this experiment, regardless of the value of D, the transmission rate is consistently maintained at 2.025 kbps .

4.2.1. Fuxian Lake

As shown in Figure 8a, the BER decreased with increasing Signal Noise Ratio (SNR) of the communication system. However, with a higher factor D, the BER of the communication system decreased more significantly. In other words, a higher factor D provided higher gain for the communication system. At a BER of 10 3 , the Z-OFDM system achieved a 3 dB gain compared to the FFT-based OFDM system when the refinement factor D = 2 . When D = 3 , the communication system achieved a gain of 5 dB. When D = 4 , the communication system achieved a gain of 6 dB.
Figure 9 shows the BER of the Z-OFDM system with varying parameters of the underwater acoustic channel of Fuxian Lake. At the same E b N 0 , the BER of OFDM is inconsistent with the varying parameter of the underwater acoustic channel. When the refinement factor D = 2 , the BER is still variable at the same E b N 0 , but the variability of the BER of Z-OFDM becomes weaker compared to FFT-based OFDM. When D = 4 , the BER decreases, and the variability of the BER becomes weaker. When D = 6 , the BER decreases even more, and the variability of the BER cannot be observed clearly.

4.2.2. Wuyuan Bay

It can be observed from Figure 8b that the BER of the communication system decreases significantly with the increase in the refinement factor. At a BER of 10 2 , when the refinement factor D = 2 , the Z-OFDM system achieved about 3 dB more gain than the FFT-based demodulation algorithm. When D = 3 , the gain obtained by the communication system was close to 5 dB. Compared with traditional FFT, the maximum gain obtained by the underwater acoustic OFDM demodulation algorithm based on ZoomFFT can reach 6 dB ( D = 4 ).
Figure 10 shows the BER of the Z-OFDM system with varying parameters of the underwater acoustic channel of Wuyuan Bay. In Figure 7, the variability of BER is the same as in Figure 6. With the increase in factor D, the variability of BER of the ZoomFFT decreased. However, due to geological factors, the BER of the communication system under Wuyuan Bay was higher than that under Fuxian Lake, and the variability of BER was more complex.

5. Discussion

In the Z-OFDM system, innovative designs have been implemented from both the transmitter and receiver. On the transmitter side, the modulator generates OFDM signals by loading data streams onto subcarriers and mapping them to corresponding carrier phases via ZoomIFFT. During this process, ZoomIFFT processes the spectrum with higher resolution, allowing for more subcarriers to be accommodated within the same bandwidth, thereby increasing the channel capacity. On the receiver side, the demodulator employs ZoomFFT to refine the spectrum of the received OFDM signal, which enables the receiver to more accurately recover the original signal. As a result, the SINR is improved, and the BER is reduced.
Recently, FFT-based OFDM communication systems continue to be the focus of numerous studies [7,60,61]. In [60], an FFT size of 2048 is used, resulting in a spectral resolution of 46.875 Hz. The study mitigates ICI by improving Doppler shift compensation through the use of a non-uniform fast Fourier transform matrix (NFFT). Experimental results demonstrate that the proposed method achieves at least an 8 dB gain in system performance at a BER of 10 1 compared to systems without Doppler compensation. In [61], the FFT size is 256, yielding a spectral resolution of 390.625 Hz. The study designs a preamble using a CAZAC sequence and develops a new time-frequency synchronization method for the OFDM system. Experimental results show that the proposed improvements lead to a significantly lower symbol error rate (SER) on the order of 10 3 . In [7], an FFT size of 1024 is employed, providing a spectral resolution of 7.8125 Hz. The study enhances system performance by introducing a novel CE technique and an intra-block CFO estimation method. Experimental results indicate that, after compensation, the system’s BER is 3.20 × 10 3 at an SNR of 30 dB. These studies, while achieving specific gains in BER, SER, and other metrics, still face limitations due to the inherent constraints of the FFT, such as increased computational complexity with larger FFT sizes.
As shown in Table 2, Z-OFDM significantly outperforms traditional FFT-based OFDM in several key areas. On the transmitter side, the channel capacity is notably increased. Experiments conducted in an AWGN channel indicate that under the same condition of E b N 0 = 10 dB, the Z-OFDM system (with a refinement factor D = 2 ) achieves an increase in channel capacity by 0.2 bps/Hz compared to the FFT-based OFDM system. Moreover, when channel capacity remains constant, the Z-OFDM system can achieve up to a 3 dB gain over the FFT-based OFDM system. On the receiver side, the increased spectral resolution of Z-OFDM allows it to handle NBI more effectively, leading to lower BER and improved signal quality. Experiments show that under the same condition of E b N 0 = 10 dB, the Z-OFDM system with a refinement factor D = 2 reduces the BER by 0.0683 and improves the SINR by 0.576 compared to the FFT-based OFDM system. When BER and SINR remain constant, the Z-OFDM system can also achieve up to a 3 dB gain over the FFT-based OFDM system. Additionally, Z-OFDM maintains computational efficiency, ensuring that these benefits are achieved without excessive processing overhead. In terms of computational complexity, as the refinement factor D in the Z-OFDM system increases, the spectral resolution becomes higher. To achieve the same resolution, the FFT-based OFDM system would be required to increase the FFT size, leading to a significant increase in computational complexity. However, the Z-OFDM system takes advantage of ZoomFFT, allowing its complexity to remain almost unchanged.
The above comparison is made with the refinement factor D = 2 . However, increasing the factor D can increase both the capacity and the SINR of the Z-OFDM system. It can also decrease the BER of the system over the AWGN channel and reduce the variability of the BER of the system over time in varying underwater acoustic channels. However, the factor D can not increase without the limitation of Shannon’s sampling law. The maximum factor D can be computed by Equation (29).
D = f s 2 ( f H f L )
The limitation of Shannon’s sampling law complicates the problem of how to choose factor D to make the Z-OFDM systematically obtain the best performance. This problem is not discussed in detail in this paper. However, it will be our key concern in the next phase of research work.

6. Conclusions

To eliminate the adverse effects caused by the picket fence effect of FFT and improve the performance of underwater acoustic OFDM systems, this paper proposed using ZoomFFT to replace FFT in the modulator and demodulator of the OFDM system. Performance analysis through simulations with underwater acoustic channel models from Xiamen University, specifically Fuxian Lake and Wuyuan Bay, demonstrated that the Z-OFDM system significantly outperforms traditional FFT-based OFDM systems. Future research will focus on optimizing the selection of the refinement factor D and exploring the application of spectrum refinement to other advanced Fourier Transform methods. Overall, Z-OFDM represents an advancement in underwater acoustic communication technology, offering improved performance and reliability.

Author Contributions

Conceptualization, H.S. and A.L.; methodology, H.S.; software, A.L. and J.C.; validation, A.L., H.S. and J.C.; formal analysis, A.L. and J.C.; investigation, A.L.; resources, H.H. and C.X.; data curation, H.S. and A.L.; writing—original draft preparation, A.L.; writing—review and editing, H.S., A.L. and J.C.; visualization, A.L.; supervision, H.S.; project administration, H.S.; funding acquisition, H.S. All authors have read and agreed to the published version of the manuscript.

Funding

This paper is supported by Guangxi Key Laboratory of Automatic Detecting Technology and Instruments (YQ23106), the Special Funds of the National Natural Science Foundation of China (Grant No. 62341304).

Data Availability Statement

The original contributions presented in the study are included in the article, further inquiries can be directed to the corresponding author.

Conflicts of Interest

The authors declare no conflicts of interest.

References

  1. Kumara, S.; Vatsb, C. Underwater communication: A detailed review. In Proceedings of the CEUR Workshop Proceedings, Naples, Italy, 4–5 October 2021. [Google Scholar]
  2. Liu, L.; Cai, L.; Ma, L.; Qiao, G. Channel State Information Prediction for Adaptive Underwater Acoustic Downlink OFDMA System: Deep Neural Networks Based Approach. IEEE Trans. Veh. Technol. 2021, 70, 9063–9076. [Google Scholar] [CrossRef]
  3. Zhang, Y.; Li, C.; Wang, H.; Wang, J.; Yang, F.; Meriaudeau, F. Deep learning aided OFDM receiver for underwater acoustic communications. Appl. Acoust. 2022, 187, 108515. [Google Scholar] [CrossRef]
  4. Feng, X.; Wang, J.; Kuai, X.; Zhou, M.; Sun, H.; Li, J. Message Passing-Based Impulsive Noise Mitigation and Channel Estimation for Underwater Acoustic OFDM Communications. IEEE Trans. Veh. Technol. 2022, 71, 611–625. [Google Scholar] [CrossRef]
  5. Su, Y.; Dong, L.; Zhou, Z.; Liu, X.; Wei, X. A General Embedded Underwater Acoustic Communication System Based on Advance STM32. IEEE Embed. Syst. Lett. 2021, 13, 90–93. [Google Scholar] [CrossRef]
  6. Zhang, Y.; Wang, H.; Li, C.; Chen, X.; Meriaudeau, F. On the performance of deep neural network aided channel estimation for underwater acoustic OFDM communications. Ocean Eng. 2022, 259, 111518. [Google Scholar] [CrossRef]
  7. Wang, H.; Jiang, W.; Hu, Q.; Zeng, Z.; Li, Z. Time-Varying Channel and Intrablock Carrier Frequency Offset Estimation for OFDM Underwater Acoustic Communication. IEEE Sens. J. 2024, 24, 18405–18417. [Google Scholar] [CrossRef]
  8. Qasem, Z.A.H.; Wang, J.; Kuai, X.; Sun, H.; Esmaiel, H. Enabling Unique Word OFDM for Underwater Acoustic Communication. IEEE Wirel. Commun. Lett. 2021, 10, 1886–1889. [Google Scholar] [CrossRef]
  9. Yin, J.w.; Zhu, G.j.; Han, X.; Ge, W.; Li, L.; Tian, Y.n. Iterative channel estimation-based soft successive interference cancellation for multiuser underwater acoustic communications. J. Acoust. Soc. Am. 2021, 150, 133–144. [Google Scholar] [CrossRef]
  10. Tasadduq, I.A.; Murad, M.; Otero, P. CPM-OFDM Performance over Underwater Acoustic Channels. J. Mar. Sci. Eng. 2021, 9, 1104. [Google Scholar] [CrossRef]
  11. Zhou, J.; Lei, L.; Liu, N. Research on Rough and Detailed Combination Spectrum Analysis of Electromagnetic Signals Based on Complex Modulation ZoomFFT. In Proceedings of the 2019 IEEE 19th International Conference on Communication Technology (ICCT), Xi’an, China, 16–19 October 2019; pp. 786–789. [Google Scholar] [CrossRef]
  12. Shen, W.; Sun, H.; Cheng, E.; Su, W.; Zhang, Y. Narrowband interference suppression in underwater acoustic OFDM system. In Proceedings of the 2010 2nd International Asia Conference on Informatics in Control, Automation and Robotics (CAR 2010), Wuhan, China, 6–7 March 2010; Volume 1, pp. 496–499. [Google Scholar] [CrossRef]
  13. Wang, Z.; Zhou, S.; Giannakis, G.B.; Berger, C.R.; Huang, J. Frequency-Domain Oversampling for Zero-Padded OFDM in Underwater Acoustic Communications. IEEE J. Ocean. Eng. 2012, 37, 14–24. [Google Scholar] [CrossRef]
  14. Li, B.; Zhou, S.; Stojanovic, M.; Freitag, L.; Willett, P. Multicarrier Communication Over Underwater Acoustic Channels with Nonuniform Doppler Shifts. IEEE J. Ocean. Eng. 2008, 33, 198–209. [Google Scholar] [CrossRef]
  15. Ramadan, K.; Dessouky, M.I.; El-Samie, F.E.A. Equalization and Co-Carrier Frequency Offsets Compensations for UWA-OFDM Communication Systems. Wirel. Pers. Commun. 2022, 124, 2229–2245. [Google Scholar] [CrossRef]
  16. Su, Y.; Zuo, Y.; Jin, Z.; Fu, X. OSPG-MAC: An OFDMA-Based Subcarrier Pregrouping MAC Protocol for Underwater Acoustic Wireless Sensor Networks. J. Sens. 2019, 2019, 4965231. [Google Scholar] [CrossRef]
  17. Ashri, R.M.; Shaban, H.A.; El-Nasr, M.A. BER of FRFT-based OFDM system for underwater wireless communication. In Proceedings of the 2016 33rd National Radio Science Conference (NRSC), Aswan, Egypt, 22–25 February 2016; pp. 266–273. [Google Scholar] [CrossRef]
  18. Singh, A.K.; Saxena, R. Doppler Estimation from Echo Signal Using FRFT. Wirel. Pers. Commun. 2013, 72, 405–413. [Google Scholar] [CrossRef]
  19. Dida, M.A.; Hao, H.; Ran, T.; Teng, W.; Urynbassarova, D. Constant envelope FrFT OFDM: Spectral and energy efficiency analysis. J. Syst. Eng. Electron. 2019, 30, 467–473. [Google Scholar] [CrossRef]
  20. Ding, Y.; Sun, L.; Zhang, H.; Zheng, B. A multi-component LFM signal parameters estimation method using STFT and Zoom-FRFT. In Proceedings of the 2016 8th IEEE International Conference on Communication Software and Networks (ICCSN), Beijing, China, 4–6 June 2016; pp. 112–117. [Google Scholar] [CrossRef]
  21. Yanhua, J.; Gun, L.; Kaiyu, Q. Study of a Novel Zoom Spectrum Analysis Approach for Wireless Communication Analyzer. In Proceedings of the 2009 WRI International Conference on Communications and Mobile Computing, Kunming, China, 6–8 January 2009; Volume 1, pp. 367–371. [Google Scholar] [CrossRef]
  22. Carter, T.; Pergande, A.; DeLisio, M. Zoom FFT for millimeterwave additive noise measurement. In Proceedings of the Infrared and Millimeter Waves, Conference Digest of the 2004 Joint 29th International Conference on 2004 and 12th International Conference on Terahertz Electronics, Karlsruhe, Germany, 27 September–1 October 2004; pp. 335–336. [Google Scholar] [CrossRef]
  23. Aval, Y.M.; Stojanovic, M. Partial FFT demodulation for coherent detection of OFDM signals over underwater acoustic channels. In Proceedings of the 2013 MTS/IEEE OCEANS-Bergen, Bergen, Norway, 10–14 June 2013; pp. 1–4. [Google Scholar] [CrossRef]
  24. Shuohan, M.; Qishuang, M.; Xinbo, L. Applications of chirp z transform and multiple modulation zoom spectrum to pulse phase thermography inspection. NDT E Int. 2013, 54, 1–8. [Google Scholar] [CrossRef]
  25. Wu, C.; Gao, Y.; Li, C.; Cao, Y.; Iravani, R. Analytic Mode Decomposition and Windowed Three-Point Interpolated Chirp-Z Transform for Voltage Flicker Components Detection. Electr. Power Syst. Res. 2020, 186, 106382. [Google Scholar] [CrossRef]
  26. Liu, Y.; Li, J.; Wang, H.; Luo, Q. Improved Algorithm for Parameter Estimation of LFM Signal Based on Chirp-Z Transform. In Proceedings of the 2020 International Conference on Computers, Information Processing and Advanced Education, New York, NY, USA, 16–18 October 2020; CIPAE 2020. pp. 125–129. [Google Scholar] [CrossRef]
  27. Watanabe, T. An optimized SAW chirp -Z Transform for OFDM systems. In Proceedings of the 2009 IEEE International Frequency Control Symposium Joint with the 22nd European Frequency and Time Forum, Besancon, France, 20–24 April 2009; pp. 416–419. [Google Scholar] [CrossRef]
  28. Watanabe, T. Study of SAW Chirp- Z transform for an enhancement of OFDM/OFDMA systems. In Proceedings of the 2009 IEEE International Frequency Control Symposium Joint with the 22nd European Frequency and Time Forum, Besancon, France, 20–24 April 2009; pp. 801–806. [Google Scholar] [CrossRef]
  29. Yang, Y.; Li, X.; Tian, G. The Analysis of Seismic Signal Spectrum Based on ZFFT. In Proceedings of the 2013 5th International Conference on Intelligent Human-Machine Systems and Cybernetics, Hangzhou, China, 26–27 August 2013; Volume 2, pp. 290–293. [Google Scholar] [CrossRef]
  30. Hossen, A.; Heute, U. A novel simple adaptive spectral analysis zoom for narrow-band signals. In Proceedings of the 2002 11th European Signal Processing Conference, Toulouse, France, 3–6 September 2002; pp. 1–4. [Google Scholar]
  31. Dahi, K.; Elhani, S.; Guedira, S.; Sadiki, L.; Ouachtouk, I. High-resolution spectral analysis method to identify rotor faults in WRIM using Neutral Voltage. In Proceedings of the 2015 International Conference on Electrical and Information Technologies (ICEIT), Marrakech, Morocco, 25–27 March 2015; pp. 82–87. [Google Scholar] [CrossRef]
  32. Lee, J.S.; Yoon, T.M.; Lee, K.B. Bearing Fault Detection of IPMSMs using Zoom FFT. J. Electr. Eng. Technol. 2016, 11, 1235–1241. [Google Scholar] [CrossRef]
  33. Al-Qudsi, B.; Joram, N.; Strobel, A.; Ellinger, F. Zoom FFT for Precise Spectrum Calculation in FMCW Radar using FPGA. In Proceedings of the 2013 9th Conference on PH. D. Research in Microelectronics and Electronics (PRIME 2013), 345 E 47TH ST, Villach, Austria, 24–27 June 2013; pp. 337–340. [Google Scholar]
  34. Almradi, A.; Hamdi, K.A. Spectral Efficiency of OFDM Systems With Random Residual CFO. IEEE Trans. Commun. 2015, 63, 2580–2590. [Google Scholar] [CrossRef]
  35. Chao, W.; Yi, Z.; Jun-cheng, W.; Hui, L.; Qing-feng, M. A Simple and Effective Algorithm for Sinusoidal Frequency Estimation. In Proceedings of the 2012 International Conference on Computer Distributed Control and Intelligent Environmental Monitoring, Zhangjiajie, China, 5–6 March 2012; pp. 70–73. [Google Scholar] [CrossRef]
  36. Guo, Q.; Li, A.; Wu, J.; Su, H. ZoomFFT-Based Demodulation Algorithm for Underwater Acoustic OFDM Signals. J. Syst. Simul. 2022, 34, 314–322. [Google Scholar]
  37. Huang, X. Analysis and Optimization of OFDM Underwater Acoustic Communications; Stevens Institute of Technology: Hoboken, NJ, USA, 2011. [Google Scholar]
  38. Huang, X.; Lawrence, V.B. OFDM with Pilot Aided Channel Estimation for Time-Varying Shallow Water Acoustic Channels. In Proceedings of the 2010 International Conference on Communications and Mobile Computing, Shenzhen, China, 12–14 April 2010; Volume 2, pp. 442–446. [Google Scholar] [CrossRef]
  39. Huang, Y.; Wan, L.; Zhou, S.; Wang, Z.; Huang, J. Comparison of sparse recovery algorithms for channel estimation in underwater acoustic OFDM with data-driven sparsity learning. Phys. Commun. 2014, 13, 156–167. [Google Scholar] [CrossRef]
  40. Jiang, R.; Wang, X.; Cao, S.; Zhao, J.; Li, X. Joint Compressed Sensing and Enhanced Whale Optimization Algorithm for Pilot Allocation in Underwater Acoustic OFDM Systems. IEEE Access 2019, 7, 95779–95796. [Google Scholar] [CrossRef]
  41. Ma, L.; Li, T.; Liu, S.; Qiao, G.; Jia, H. Efficient interpolation based OMP for sparse channel estimation in underwater acoustic OFDM. Appl. Acoust. 2021, 172, 107606. [Google Scholar] [CrossRef]
  42. Ramos, J. Maximal restriction estimates and the maximal function of the Fourier transform. Proc. Am. Math. Soc. 2020, 148, 1131–1138. [Google Scholar] [CrossRef]
  43. Zhao, K. Underwater Acoustic Signal Processing and Its Applications. Ph.D. Thesis, University of Florida, Gainesville, FL, USA, 2014. [Google Scholar]
  44. Ramadan, K.; Fiky, A.S.; Dessouky, M.I.; Abd El-Samie, F.E. Equalization and carrier frequency offset compensation for UWA-OFDM communication systems based on the discrete sine transform. Digit. Signal Process. 2019, 90, 142–149. [Google Scholar] [CrossRef]
  45. Huang, J. Progressive Receiver Design for Underwater Acoustic OFDM Communications. Ph.D. Thesis, University of Connecticut, Storrs, CT, USA, 2012. [Google Scholar]
  46. Hoseyni, S.M.J. OFDM Carrier Frequency Offset Correction in Spectral Domain Using a Single Pilot Tone. Master’s Thesis, Dalhousie University, Halifax, NS, Canada, 2010. [Google Scholar]
  47. Li, B.; Zhou, S.; Stojanovic, M.; Freitag, L. Pilot-tone based ZP-OFDM demodulation for an underwater acoustic channel. In Proceedings of the OCEANS 2006, Boston, MA, USA, 18–22 September 2006; p. 929+. [Google Scholar]
  48. Cai, G.; Wang, L.; Huang, T. Channel capacity of M-ary Differential Chaos Shift Keying modulation over AWGN channel. In Proceedings of the 2013 13th International Symposium on Communications and Information Technologies (ISCIT), Samui Island, Thailand, 4–6 September 2013; pp. 91–95. [Google Scholar] [CrossRef]
  49. Effros, M.; Goldsmith, A.; Liang, Y. Generalizing Capacity: New Definitions and Capacity Theorems for Composite Channels. IEEE Trans. Inf. Theory 2010, 56, 3069–3087. [Google Scholar] [CrossRef]
  50. Motahari, A.S.; Khandani, A.K. Capacity Bounds for the Gaussian Interference Channel. IEEE Trans. Inf. Theory 2009, 55, 620–643. [Google Scholar] [CrossRef]
  51. Chang, M.K. SINR Analysis and Power Control for Downlink W-CDMA and Multiuser OFDM Systems. Ph.D. Thesis, University of Southern California, Los Angeles, CA, USA, 2003. [Google Scholar]
  52. Yang, F.; Pei, G.; Hu, L.; Ding, L.; Li, Y. Joint optimization of SINR and maximum sidelobe level for hybrid beamforming systems with sub-connected structure. Digit. Signal Process. 2021, 109, 102917. [Google Scholar] [CrossRef]
  53. Zhang, J. Narrowband Interference Suppression in OFDM-based Communication Systems. Ph.D. Thesis, University of New Brunswick, Fredericton, NB, Canada, 2010. [Google Scholar]
  54. Kumhom, P. Design, Optimization, and Implementation of a Universal FFT Processor. Ph.D. Thesis, Drexel University, Pennsylvania, PA, USA, 2001. [Google Scholar]
  55. Jiang, W.; Yang, X.; Tong, F.; Yang, Y.; Zhou, T. A Low-Complexity Underwater Acoustic Coherent Communication System for Small AUV. Remote Sens. 2022, 14, 3405. [Google Scholar] [CrossRef]
  56. Wang, Y.; Yan, H.; Pan, C.; Liu, S. Measurement-based analysis of characteristics of fast moving underwater acoustic communication channel. In Proceedings of the 2022 International Conference on Frontiers of Information Technology (FIT), Islamabad, Pakistan, 12–13 December 2022; pp. 47–52. [Google Scholar] [CrossRef]
  57. Yang, X.; Zhou, Y.; Wang, R.; Tong, F. Research and Implementation on a Real-Time OSDM MODEM for Underwater Acoustic Communications. IEEE Sens. J. 2023, 23, 18434–18448. [Google Scholar] [CrossRef]
  58. Xiao, F.; He, Y.; Xu, X.; Huang, L.; Tao, Y.; Chen, Y. Transmission Characteristics of High-Frequency Underwater Acoustic Channels with High-Frequency Marine Noise in Shallow Sea. In Proceedings of the 2021 IEEE/CIC International Conference on Communications in China (ICCC Workshops), Xiamen, China, 28–30 July 2021; pp. 244–249. [Google Scholar] [CrossRef]
  59. Wang, R.; Zhou, Y.; Yang, X.; Tong, F.; Wu, J. Design and Implementation of a Multi-Function Hydrophone for Underwater Acoustic Application. J. Mar. Sci. Eng. 2023, 11, 2203. [Google Scholar] [CrossRef]
  60. Nguyen, V.D.; Thi, H.L.N.; Nguyen, Q.K.; Nguyen, T.H. Low Complexity Non-Uniform FFT for Doppler Compensation in OFDM-Based Underwater Acoustic Communication Systems. IEEE Access 2022, 10, 82788–82798. [Google Scholar] [CrossRef]
  61. Yang, C.; Wang, L.; Peng, C.; Zhang, S.; Cui, Y.; Ma, C. A Robust Time-Frequency Synchronization Method for Underwater Acoustic OFDM Communication Systems. IEEE Access 2024, 12, 21908–21920. [Google Scholar] [CrossRef]
Figure 1. Block diagram of ZoomFFT.
Electronics 13 03543 g001
Figure 2. Composition of the UWA OFDM system based on ZoomFFT.
Electronics 13 03543 g002
Figure 3. Average capacity of Z-OFDM system over AWGN channel.
Electronics 13 03543 g003
Figure 4. SINR of Z-OFDM system over AWGN channel.
Electronics 13 03543 g004
Figure 5. BER of Z-OFDM system over AWGN channel.
Electronics 13 03543 g005
Figure 6. The map of the outfield in the experiment.
Electronics 13 03543 g006
Figure 7. Time evolution of the magnitude impulse response at two different distances.
Electronics 13 03543 g007
Figure 8. BER of the communication system in this experiment.
Electronics 13 03543 g008
Figure 9. BER over time varies underwater acoustic channel of unit time in Fuxain Lake.
Electronics 13 03543 g009
Figure 10. BER over time varies underwater acoustic channel of unit time in Wuyuan Bay.
Electronics 13 03543 g010
Table 1. Parameter of communication model.
Parameter Value
DFT Point1024
Number of Sub-carrier512
Number of Data Sub-carrier324
Number of Pilot Sub-carrier103
Sampling Rate (kHz)144
Bandwidth (kHz)3.6
Band (kHz)29.1∼32.7
Guard Interval0.125 × Symbol Length
Sub-carrier Spacing (Hz)3.516
Refinement Factor D[2 3 4]
Table 2. Comparison between Z-OFDM (D = 2) and FFT-OFDM systems.
Feature/MetricZ-OFDMFFT-OFDM
Spectral ResolutionHigh (refined with Zoom-FFT)Moderate (limited by FFT size)
Channel CapacityHighLow
BERLow, especially under interferenceHigh
SINRHighLow
Computational ComplexityModerate (efficient spectral refinement)High (requires larger FFT size for similar resolution)
Disclaimer/Publisher’s Note: The statements, opinions and data contained in all publications are solely those of the individual author(s) and contributor(s) and not of MDPI and/or the editor(s). MDPI and/or the editor(s) disclaim responsibility for any injury to people or property resulting from any ideas, methods, instructions or products referred to in the content.

