Abstract
The existing collaborative channel perception suffers from unreasonable data fusion weight allocation, which mismatches the channel perception capability of the node devices. This often leads to significant deviations between the channel perception results and the actual channel state. To solve this issue, this paper integrates the data fusion algorithm from evidence fusion theory with data link channel state perception. It applies the data fusion advantages of evidence fusion theory to evaluate the traffic pulse statistical capability of network node devices. Specifically, the typical characteristic parameters describing the channel perception capability of node devices are regarded as evidence parameter sets under the recognition framework. By calculating the credibility and falsity of the characteristic parameters, the differences and conflicts between nodes are measured to achieve a comprehensive evaluation of the traffic pulse statistical capabilities of node devices. Based on this evaluation, the geometric mean method is adopted to calculate channel state perception weights for each node within a single-hop range, and a weight allocation strategy is formulated to improve the accuracy of channel state perception.
1. Introduction
The UAV (unmanned aerial vehicle) data link is an information transmission network that integrates diverse battlefield elements, including perception systems, command systems, fire control systems, and information attack systems, into a cohesive whole. Communication networks serve as the nexus, with information processing as the core [1,2,3,4]. Combining time-division multiplexing with frequency-division multiplexing constitutes an effective approach for data link networks to achieve multi-network operation. Accessing channels based on message priority levels is a critical means of enhancing the real-time transmission of data link messages. Accurately perceiving the channel state is pivotal to improving the reliability of data link message transmission decisions and reducing the probability of data link message conflicts.
Data link channel state perception can be considered a research branch of radio spectrum perception. It involves detecting traffic pulses in various dimensions, such as time, frequency, space, and polarization, to determine the utilization rate of channel resources. This, in turn, provides a decision-making basis for data link messages to access channels and enhances the efficiency of message exchange between nodes within the data link network.
From the perspective of nodes involved in channel state perception, channel state perception can be categorized into local channel perception and collaborative channel perception.
Local channel perception relies solely on individual nodes within the data link network and typically employs methods such as energy detection and statistical signal feature analysis to perceive the channel state. The carrier sense multiple access (CSMA) protocol utilizes carrier sense technology, which is a typical energy detection method. This technology judges whether a node is currently transmitting data on the channel based on the signal energy detected on the channel, thus classifying the channel as either busy or idle. However, it can only make qualitative analyses of channel states.
The local channel perception [5,6,7,8] quantitatively analyzes the channel state of data link networks by counting traffic pulses in the channel and indicates the congestion level of the current channel state using channel occupancy statistics. This method, coupled with priority thresholds of data link messages, enhances network throughput and overcomes the limitations of qualitative analysis in carrier sensing technology.
However, the local channel perception heavily relies on the channel perception capability of local node devices and is unable to resolve the hidden terminal problem. This results in low reliability and significant application limitations.
The collaborative channel perception involves transmitting perceived data from multiple nodes to a data fusion center. At this center, the channel occupancy statistics is calculated using either equal gain combining or weighted combining [9,10,11,12,13,14]. In comparison to local channel perception, this approach significantly improves the reliability of channel state perception and has become the dominant method in the field of channel state perception.
The collaborative channel perception [15] fuses the perceived data from neighboring nodes within a single-hop range, using a distance-weighted strategy to calculate channel occupancy statistics. This provides a decision-making basis for the transmission of data link messages.
This method addresses the limitations of local channel perception by mitigating the dependence on the perception capability of individual node devices. However, it only takes into account the influence of distance factors on channel state perception. In reality, the channel perception capability of node devices is closely related to their transmission and reception performance. Many factors significantly impact the node device channel perception capability, such as receiving sensitivity, the antenna voltage standing wave ratio (VSWR), signal-to-noise ratio (SNR), component aging, and mean time between failures (MTBF). These factors can cause significant fluctuations in the channel perception capability of nodes, resulting in significant deviations from the actual channel state.
The unreasonable weight allocation is a drawback of the existing collaborative channel perception. The mismatch between the weight allocation and the channel perception capabilities of node devices causes significant discrepancies between the channel perception results and the actual channel states, leading to errors in message transmission decisions. This, in turn, increases the probability of conflicts and reduces network throughput.
To address the shortcomings of existing collaborative channel perception, enhance the rationality of weight allocation, accurately reflect channel states, and improve the transmission performance of UAV networks, this paper integrates the data fusion algorithm from evidence fusion theory into channel state perception for data links. The advantages of data fusion are applied to assessing the traffic pulse statistical capabilities of network node devices. Typical characteristic parameters that describe the traffic pulse statistical capabilities of node devices are considered as sets of evidence parameters within the recognition framework. By calculating the credibility and falsity, and measuring the differences and conflicts of characteristic parameters among neighboring node devices within a single-hop range, a comprehensive evaluation of the traffic pulse statistical capabilities of node devices can be achieved. Based on this evaluation, the geometric mean method was used to calculate channel perception weights for each node within a single-hop range, in order to form a new and reasonable weight allocation strategy. This new strategy is called cooperative channel perception based on data fusion, abbreviated as CCP-DF. This new method can accurately perceive the true state of the channel and provide a reliable basis for decision making in data link message exchange, thereby reducing the probability of conflict and enhancing the throughput of data link networks.
This paper applies the advantages of multi-source data processing in data fusion theory to the measurement of network node channel perception capability. It rationally allocates network node data fusion weights, provides technical support for enhancing the UAV cooperative channel perception capability, and subsequently improves the radio spectrum sensing theory.
2. Collaborative Channel Perception Algorithm
This section first briefly introduces the collaborative channel state perception model and the key issues that need to be solved, namely the reasonable allocation of node weights. Then, it analyzes the typical characteristic parameters of node devices that can be used to describe traffic pulse statistical capabilities. Finally, a new collaborative channel state perception algorithm is proposed.
2.1. Model Establishment
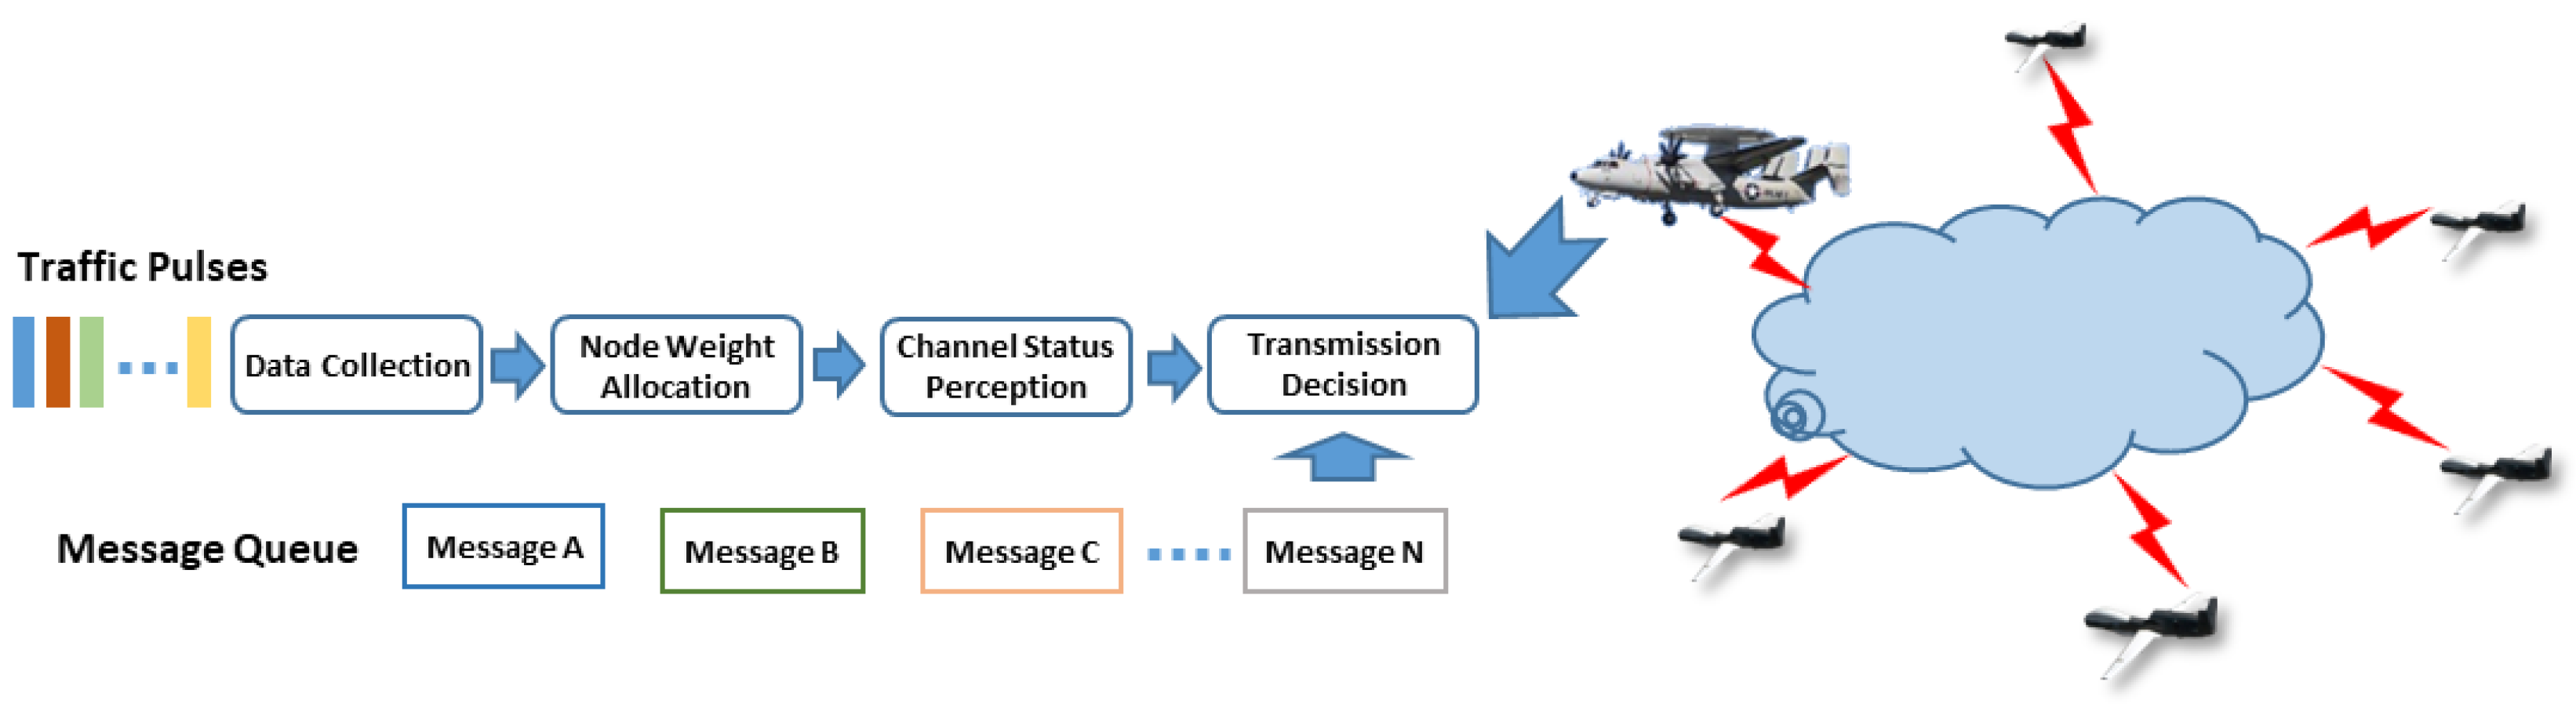
Perceiving the channel state of the data link network is the key to improving the accuracy of message transmission decisions and reducing the probability of message exchange conflicts [6,16,17,18]. To enhance the accuracy and robustness of channel state perception, the data link network employs a distributed and decentralized network topology. Each node within the network counts the number of traffic pulses in the channel and shares this information with other nodes. The network architecture for perceiving the channel state of the data link is shown in Figure 1.
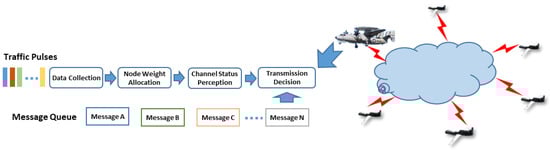
Figure 1.
Network architecture for channel state perception of data link.
As shown in Figure 1, the channel state perception of the data link network mainly includes four stages, which are described below.
Stage 1: Data Collection. Each node in the data link network can acquire the channel state perception data and characteristic parameters of other nodes by receiving the broadcast messages.
Stage 2: Node Weight Allocation. The evidence theory is used to analyze the node characteristic parameters. Nodes’ channel perception capabilities can be scientifically evaluated. Based on this evaluation, reasonable weights can be allocated.
Stage 3: Calculation of Channel Status Perception Results. A weighted data fusion method is employed to calculate the channel state perception results, to quantify the current channel status.
Stage 4: Message Transmission Decision. The priority threshold of the data link message is compared to the channel status perception results. The comparison result serves as the basis for determining whether to send the data link message [7,19,20].
2.2. Problem Description
In a data link network, nodes employ a distributed and decentralized network topology to count the number of traffic pulses. The aim is to address the shortcomings of the local channel perception, thus overcoming the dependence on the channel perception capability of single-node devices and enhancing the accuracy and robustness of channel state perception. In the collaborative channel perception, each node perceives the channel state independently to obtain perceived data. These data are then fused and calculated into a quantitative value for the channel state, either through equal gain combining or weighted combining. This enhances the accuracy of channel state perception and provides a basis for decision making when data link messages access the channel. However, the existing data fusion weight allocation in collaborative channel perception is unreasonable as it sets weight factors solely based on distance factors. This mismatch between weight allocation and the actual channel perception capability of node devices can easily result in significant deviations between the channel perception results and the actual channel state.
When perceiving channel state in a data link network, the channel occupancy statistics are typically calculated based on the number of traffic pulses in the channel counted by node devices. The capability of a node device to count the number of these pulses is not only influenced by distance factors, but also closely related to other factors such as the device’s receiving and transmitting performance, component aging, and operational reliability. Any changes in these factors can significantly impact the node device’s capability to accurately count channel traffic pulses, thereby affecting the perception results of the channel state.
Therefore, in the collaborative channel perception, it is essential to scientifically evaluate the perception capability of each node device and assign node weights based on these capabilities. Thus, the data fusion center can enhance the credibility of channel state perception during the fusion and calculation of channel perception results. The results can ensure a more accurate reflection of the true channel state of the current data link network, providing a reliable basis for decision making in data link message transmission.
2.3. Analysis of Characteristic Parameters of Node Devices
The channel traffic pulse statistical capability of node devices is closely related to their transmission and reception performance.
The counting capability of received and transmitted pulses, the degree of component aging, and operational reliability all have significant impacts on node device performance. Among these, the critical parameters affecting the counting performance of received pulses for node devices are the receiving sensitivity and the signal-to-noise ratio (SNR). For the counting performance of transmitted pulses, the voltage standing wave ratio (VSWR) of the antenna is an important parameter. The number of operating months reflects the extent of aging of node devices, while the mean time between failures (MTBF) is an essential indicator of operational reliability. This paper evaluates the transmission and reception performance of node devices by monitoring their characteristic parameters in real time, including the receiving sensitivity, the VSWR of the antenna, the SNR, the number of operating months, and the MTBF.
The receiving sensitivity is a typical scalar parameter that indicates the lowest signal amplitude that a node device can normally receive and process a data link signal. This directly affects its capability to accurately count the number of received pulses. Antenna VSWR, serving as a negative indicator, reflects the extent of radio frequency (RF) energy reflection in a node device. This directly impacts the radiation performance of the data link signal by causing a reduction in its transmission distance. When there is an impedance mismatch between the node transmitter and the antenna system, it can result in some RF energy of the data link signal being reflected, creating a reverse echo signal. This, in turn, leads to a reduction in the transmission distance of the data link signal. Additionally, SNR, another scalar parameter, indicates the quality of the electromagnetic environment and significantly impacts the capability of node devices to accurately count the number of received pulses. The number of operating months is a reflection of the aging degree of the components in node devices. With an increase in operating months, the component aging intensifies, inevitably affecting both transmission and reception performance and diminishing their statistical capability to process traffic pulses. MTBF describes the ratio of failure time to operating time in the current environment, serving as a crucial metric for assessing operational reliability. This parameter significantly impacts the credibility of traffic pulse statistical results for node devices.
Multiple factors influence the traffic pulse statistical capability of node devices, reflecting different aspects of their physical performance. However, the amplitude or dimension of these factors varies significantly. To reasonably evaluate the traffic pulse statistical capability of node devices, a normalized dimensionless method can be employed to process different types of influencing factors.
By comparing the receiving sensitivity σit at time t with the maximum tolerance value and the nominal value, it is converted into a normalized value ranging from 0 to 1. The normalization formula for the receiving sensitivity ξi of node i is expressed as:
where σimax represents the maximum tolerance value of the receiving sensitivity of the node device, σit represents the detected value of the receiving sensitivity at time t, and σiu is the nominal value of the receiving sensitivity.
By comparing the antenna VSWR ρit at time t with the antenna VSWR corresponding to a reflection coefficient of 0 and the protection threshold value, it is converted into a normalized value ranging from 0 to 1. The normalization formula for the antenna VSWR zi of node i is expressed as:
where ρit represents the detected value of the antenna VSWR zi at time t, represents the antenna VSWR value corresponding to a reflection coefficient of 0, and is the protection threshold value for the antenna VSWR.
By comparing the SNR of the node at time t with the SNR value corresponding to the minimum bit error rate and the nominal value, it is converted into a normalized value ranging from 0 to 1. The normalization formula for the SNR of the node i is expressed as:
where SNRit represents the detected value of the SNR at time t, SNRimax corresponds the SNR value that ensures the minimum bit error rate, and nit is the received noise power at time t.
Using the above method, the normalization of the number of operating months and the MTBF can be completed. It will not be elaborated here.
2.4. Channel Perception Algorithm
To overcome the dependence of local channel perception on single-node devices, enhance the accuracy of collaborative channel perception, and reduce the collision probability in data link network message exchange, this paper proposes a channel state perception algorithm based on the Dempster–Shafer theory (DST) [21,22,23]. In this algorithm, each node in the network calculates the number of channel traffic pulses within a statistical time window and derives its normalized characteristic parameters, such as receiving sensitivity, antenna VSWR, SNR, the number of operating months, and MTBF. The count and the normalized characteristic parameters are periodically broadcast to other nodes in the network through broadcast messages.
Within a one-hop range of the data link network, each node receives broadcast messages from other nodes. It obtains the number of channel traffic pulses and characteristic parameters of node devices. A comprehensive evaluation of the traffic pulse statistical capability of node devices is conducted by employing the Dempster–Shafer theory (DST). Additionally, by calculating the data credibility and falsity of the current node and its neighboring nodes, a weight allocation strategy is formulated to reflect the traffic pulse statistical capability of the node devices. Based on the weights assigned to each node device, the channel occupancy statistics (Cos) is calculated as follows:
where M represents the number of frequency hopping points in the data link network. N represents the number of neighbor nodes within one-hop range of the current node. and represent, respectively, the number of pulses on the frequency hopping point fi received by neighbor node j and the current node. and represent, respectively, the number of pulses on the frequency hopping point fi transmitted by neighbor node j and the current node. αj represents the weight of the neighbor node. β represents the weight of the current node. τ denotes the time period of the pulse and TS represents the duration of the statistical time window.
The weights of node device αj and β satisfy the following relationship:
where N represents the number of nodes within one-hop range of the current node.
For detailed algorithms describing the methods, please see Appendix A.
3. Node Weight Allocation Strategy Based on Data Fusion
This section begins with an introduction to the basic idea of the node weight allocation strategy. It then employs the data fusion theory to analyze the credibility and falsity of a node’s characteristic parameters. These parameters serve as a measure for detecting discrepancies and conflicts in node data. Subsequently, based on the corrected credibility and falsity of the node data, the geometric mean method is applied to calculate the channel state perception weight of the node, leading to the formulation of a weight allocation strategy.
3.1. Basic Idea
In collaborative channel perception, non-differential data fusion can only be performed when each node participating in data fusion has the same importance or contribution value. However, non-differential data fusion may not be suitable for channel perception in data link networks with dynamically changing topologies and complex electromagnetic environments. Considering the influence of each node device’s actual transmission and reception performance on the statistical capability of the channel traffic pulse, it is necessary to accurately measure the extent of difference in the traffic pulse statistical capabilities of each node device within the data link network. Based on this difference in capabilities, different weights need to be assigned to each node in order to improve the accuracy of channel state perception.
The difference in the traffic pulse statistical capability of node devices is closely related to characteristic parameters such as receiving sensitivity, antenna VSWR, SNR, the number of operating months, and MTBF. The problem of how to use multiple characteristic parameters with different dimensions to measure the traffic pulse statistical capability of node devices can be seen as a multi-source data fusion problem.
Data fusion is an information fusion algorithm that can effectively handle uncertainty issues arising from multiple characteristic parameters. This paper integrates the data fusion algorithm from the Dempster–Shafer Theory (DST) with a data link cooperative channel state perception method. It applies the advantages of data fusion from the evidence theory to evaluate the traffic pulse statistical capability of network node devices. The normalized characteristic parameters of node devices are considered as the evidence parameter set within the recognition framework. By calculating the credibility and falsity of the characteristic parameters, it measures the differences and conflicts between one-hop neighbor node devices to achieve a comprehensive evaluation of their traffic pulse statistical capability. Based on this, the geometric mean method is employed to calculate the channel state perception weights for each node within the one-hop range, and a reasonable weight allocation strategy is formulated.
3.2. Credibility of Network Node Data
Consider the normalized characteristic parameters of the node devices as the evidence parameter set under the recognition framework Θ [24,25] denoted as {m1, m2, …, mM}. Using an expert scoring method, the trend performance of each parameter in the evidence parameter set is comprehensively evaluated, and a set of scores {mij(H1), mij(H2), mij(H3), mij(H4), mij(H5)} is provided, where i = 1, 2, …; n represents the i-th expert; j = 1, 2, …; M represents the j-th evidence parameter; and {H1, H2, H3, H4, H5} represents the recognition framework Θ. Each element in the score set corresponds one-to-one with each evaluation index level in the recognition framework Θ. By averaging the scores of the n experts, the basic probability assignment function for the j-th evidence parameter can be obtained, which is expressed as:
where , and mj(Hk) represents the probability assignment corresponding to each index level in the recognition framework Θ.
mj = {mj(H1), mj(H2), mj(H3), mj(H4), mj(H5)}
Due to factors like the electromagnetic environment, channel interference, and device aging, there are significant differences in the traffic pulse statistical capabilities of node devices within a data link network. These differences are evident in aspects such as the transmission and reception performance, as well as the operational reliability of the node devices. These aspects can be measured using characteristic parameters such as receiving sensitivity, antenna VSWR, SNR, the number of operating months, and MTBF. To more accurately measure this variability, we adopted the Euclidean distance [26,27] to represent the differences in characteristic parameters among the node devices, which is expressed as:
The smaller the Euclidean distance between the characteristic parameters of each node device, the greater the similarity between the characteristic parameters, and vice-versa. Based on the Euclidean distance of characteristic parameters, a similarity matrix SM of characteristic parameters is established, expressed as:
where sij represents the similarity among the characteristic parameters of node devices, expressed as:
Based on the similarity matrix SM of characteristic parameters, the credibility of the j-th characteristic parameter can be calculated and is expressed as:
The credibility vector of the characteristic parameters of network nodes can be acquired, which is expressed as:
In this paper, n = 5. Crd(mn) represents the credibility of the five characteristic parameters of the node device, namely receiving sensitivity, antenna VSWR, SNR, the number of operating months, and MTBF.
3.3. Falsity of Network Node Data
Falsity is a measure of evidence conflict and is commonly used in evidence theory to assess the degree of unreliability of certain evidence within an evaluation system. In this paper, it was employed to measure the level of non-acceptance of the characteristic parameters of network node devices. Based on the theory of evidence, the global conflict [28] of characteristic parameters from node devices is expressed as:
where Aij is the focal element of mi and mi(Aij) represents the basic probability assignment for the j-th focal element within the i-th source of characteristic parameters. Furthermore, represents a focal element with a non-empty intersection.
After removing the j-th characteristic parameter from the node device, the local conflict among the remaining characteristic parameters is expressed as:
Taking into account both the global and local conflicts, the falsity of the j-th characteristic parameter of the node device can be expressed as:
Thus, the falsity vector for characteristic parameters of network node devices can be expressed as:
F(m) = [F(m1), F(m2), …, F(mn)]
3.4. Corrected Credibility and Falsity
In data link networks, when counting the channel traffic pulse, the recorded counting values by node devices can be impacted by various factors such as channel fading, electromagnetic interference, and sensor instability. This can easily result in unreliability in the perception of the channel state. In information theory, entropy is frequently used to describe uncertainty. Consequently, in this paper, we employed entropy to depict the uncertainty associated with the characteristic parameters of node devices. The information entropy is expressed as:
The greater the information entropy value, the higher the uncertainty of the characteristic parameters. This indicates that the uncertainty of the counting values recorded by the node device is greater, and therefore, the credibility of the node device when used for channel state perception is lower.
Based on the information entropy of characteristic parameters, a relative certainty index for the characteristic parameters of node devices is calculated to describe the relative degree of certainty. The relative certainty index for the j-th characteristic parameter is expressed as:
This expression indicates that a larger information entropy value for a characteristic parameter of a node device corresponds to a smaller relative certainty index, and a greater uncertainty in the counting values recorded by the node device. Conversely, a smaller in-formation entropy value corresponds to a lower uncertainty in the recorded counting values by the node device.
By introducing the relative certainty index of the characteristic parameters of the node device into the credibility and falsity of the characteristic parameters, and modifying them accordingly, we can further enhance the objective description of credibility and falsity of the characteristic parameters, thereby accurately assessing the traffic pulse statistical capability of the node device. The corrected credibility of the modified j-th characteristic parameter is expressed as:
where Crd(mj) represents the credibility of the j-th characteristic parameter. n represents the number of characteristic parameters of the node device. In this paper, n = 5, indicating five characteristic parameters, namely receiving sensitivity, antenna VSWR, SNR, the number of operating months, and MTBF.
The corrected falsity of the j-th characteristic parameter is expressed as:
where F(mj) represents the falsity of the j-th characteristic parameter and n represents the number of characteristic parameters.
3.5. Node Weight Allocation Strategy
Through the above analysis, it is evident that, in the process of channel state perception within the data link network, acquiring the traffic pulse counting values recorded by each node is necessary to calculate current channel occupancy statistics. However, given the variations in the electromagnetic environment, transmission channels, and device reliability among different nodes, the credibility of the traffic pulse counting values recorded by each node varies obviously. This makes adopting an equal gain combining method for data fusion inappropriate. The statistical capability of the traffic pulse is closely related to its transmission and reception performance. Therefore, accurately measuring the transceiver capabilities of each node device is crucial for enhancing the reliability of channel state perception. In this paper, five characteristic parameters for node devices were established, including receiving sensitivity, antenna VSWR, SNR, the number of operating months, and MTBF. An evidence fusion algorithm was employed to assess the differences in transmission and reception performance among node devices, serving as a foundation for scientifically evaluating the statistical capability of the traffic pulses.
In this paper, based on the evidence fusion theory, the corrected credibility and falsity were used to measure the difference and conflict of characteristic parameters of node devices. The higher the credibility and the lower the falsity of a characteristic parameter, the stronger the traffic pulse statistical capability of the node device. Therefore, when performing channel state perception, a higher weight should be assigned to such node devices. Conversely, the lower the credibility and the higher the falsity of a characteristic parameter, the weaker the traffic pulse statistical capability of the node device, and a lower weight should be assigned to it. Thus, the credibility and falsity of characteristic parameters can serve as a basis to assign channel state perception weights to each node within a one-hop range. Since both the credibility and falsity of each node device share the same positive or negative attributes, the geometric mean method can be employed to calculate the channel state perception weight of each node device. The weight of the j-th node device is expressed as:
where n represents the number of characteristic parameters for the node device. In this paper, n = 5. j represents the number of nodes within the one-hop range of the current node (including the current node itself), with j = 1, 2, …, N + 1. Crd’(mj) represents the corrected credibility of the j-th characteristic parameter for the j-th node, while F’(mj) represents the corrected falsity. The normalized weight assigned to the node device is expressed as:
Through this formula, the node weights are converted into normalized values ranging from 0 to 1.
Compared to the existing collaborative channel perception, this method increases the number of node characteristic parameters from one to five. Data fusion technology is utilized to analyze the credibility and falsity of these five node characteristic parameters. Based on this analysis, allocation weights are determined, and ultimately, the channel perception results are derived. From a computational complexity perspective, the complexity of this method involves two main aspects. Firstly, there is the data fusion calculation process for five node characteristic parameters. Secondly, there is the process of calculating channel perception results based on weights. The complexity of the data fusion calculation process is primarily related to the number of node characteristic parameters and the number of nodes within the one-hop range. Similarly, the complexity of the channel perception result calculation process is mainly influenced by the number of nodes within the one-hop range. In this context, since the number of characteristic parameters for each node increases to 5 in the data fusion process, in contrast to the single characteristic parameter used in the existing method, this method indeed increases the amount of calculation. Nonetheless, the overall computational complexity of this method is still constrained by the number of nodes within the one-hop range, rather than the total number of nodes in the network.
Consequently, when this method is applied to channel perception in large-scale networks, despite the fact that the computational complexity is higher than that of the existing methods, the limited number of nodes within the one-hop range ensures that it does not significantly elevate the requirements for hardware processing capabilities.
4. Simulation Results and Analysis
To further analyze the performance of the proposed data link network collaborative channel perception in this paper, the simulation verification of the above theoretical analysis was conducted. The computer we used for the simulation had a 32 GB cache, a Core i9 CPU, and its operating system was Windows 11. The code was implemented using Matlab 2019. The simulation parameters are listed in Table 1.

Table 1.
Simulation parameters.
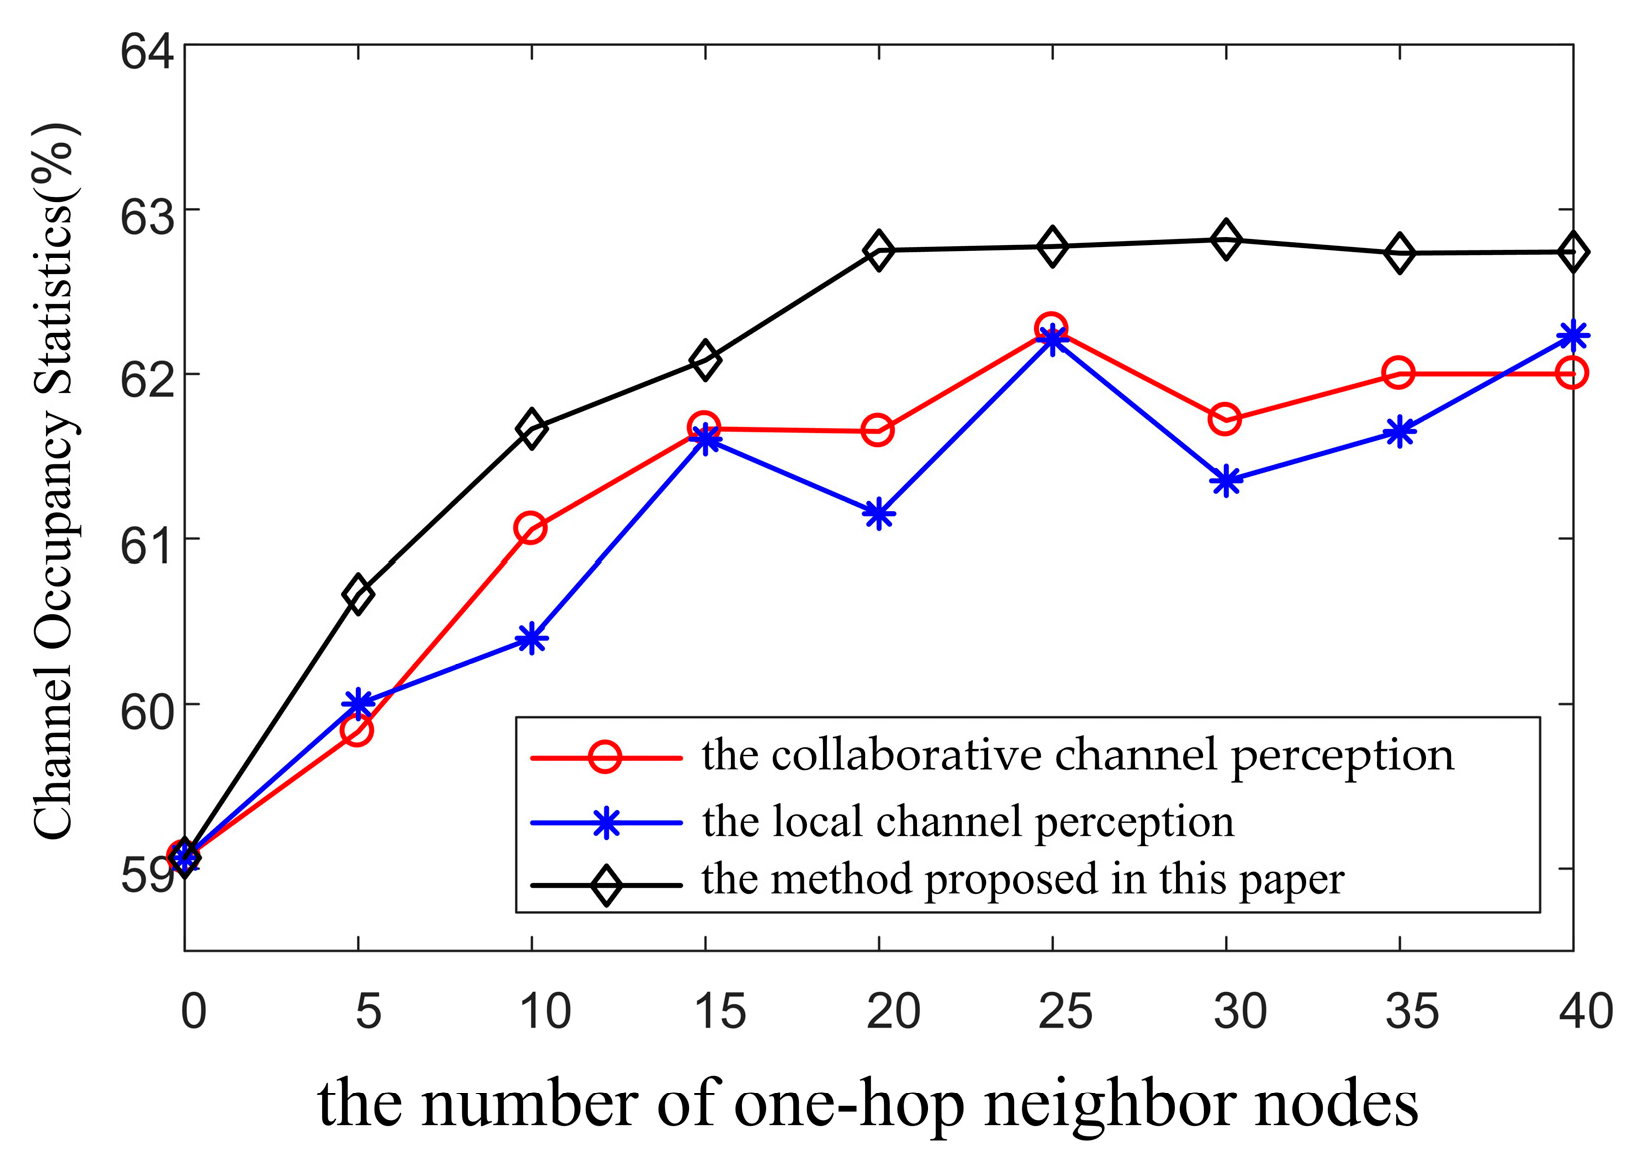
We simulated and analyzed how the number of one-hop neighbor nodes affects the value of channel occupancy statistics. Additionally, we conducted a comparative analysis between the local channel perception [5,6,7,8] and the collaborative channel perception [15], as shown in Figure 2.
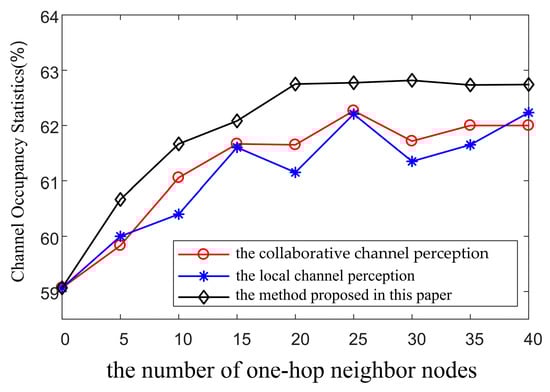
Figure 2.
The impact of the number of one-hop neighbor nodes on channel occupancy statistics.  the collaborative channel perception [15].
  the local channel perception [5].
the collaborative channel perception [15]. the local channel perception [5].
Through analyzing the simulation results in Figure 2, we can observe that, with the change in the number of neighbor nodes within the one-hop range, the channel occupancy statistics calculated by the local channel perception [5] exhibits the greatest fluctuation. The collaborative channel perception, on the other hand, shows moderate fluctuation. The method proposed in this paper, however, displays the smallest fluctuation and gradually stabilizes. This is mainly due to the fact that the local channel perception [5] calculates channel occupancy statistics by counting the number of traffic pulses in the channel based on the local node. This heavily relies on the channel perception capability of the local node device. When the characteristic parameters of the local node device are randomly selected within the normalized range from 0.70 to 0.95, they significantly affect the node’s traffic pulse statistical capabilities, leading to large fluctuations in the value of channel occupancy statistics. The collaborative channel perception [15] overcomes this issue by utilizing data from neighboring nodes for fusion to calculate channel occupancy statistics. However, during data fusion, the weight allocation does not match the channel perception capability of node devices, failing to eliminate the influence of fluctuations in characteristic parameters on the channel occupancy statistics. In contrast, the method proposed in this paper addresses this issue by allocating data fusion weights based on the channel perception capability of node devices. This approach can suppress the influence of fluctuations in characteristic parameters on the channel occupancy statistics, thereby improving the accuracy of channel state perception.
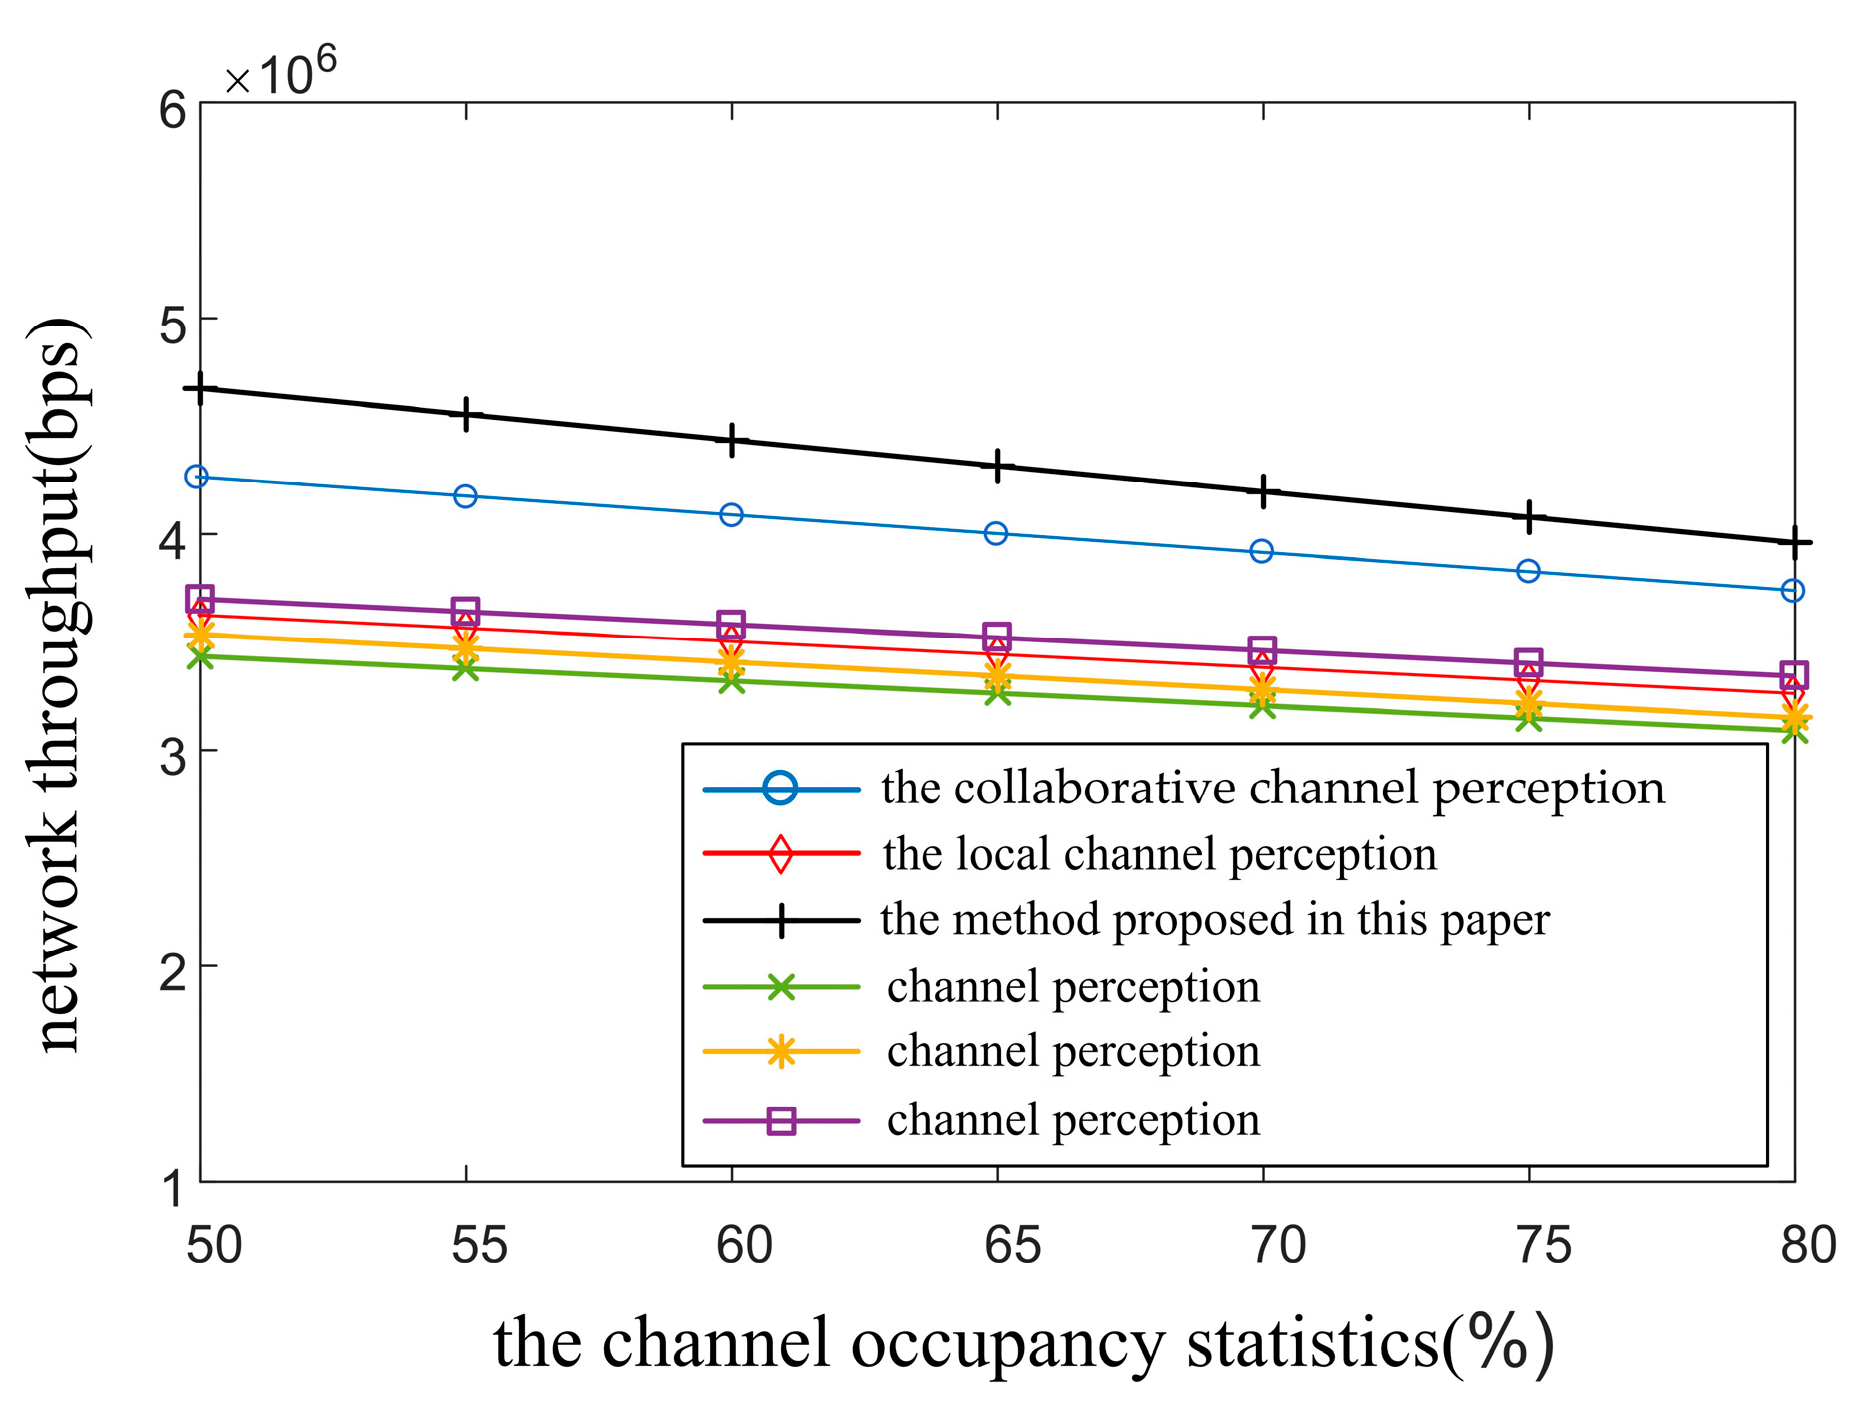
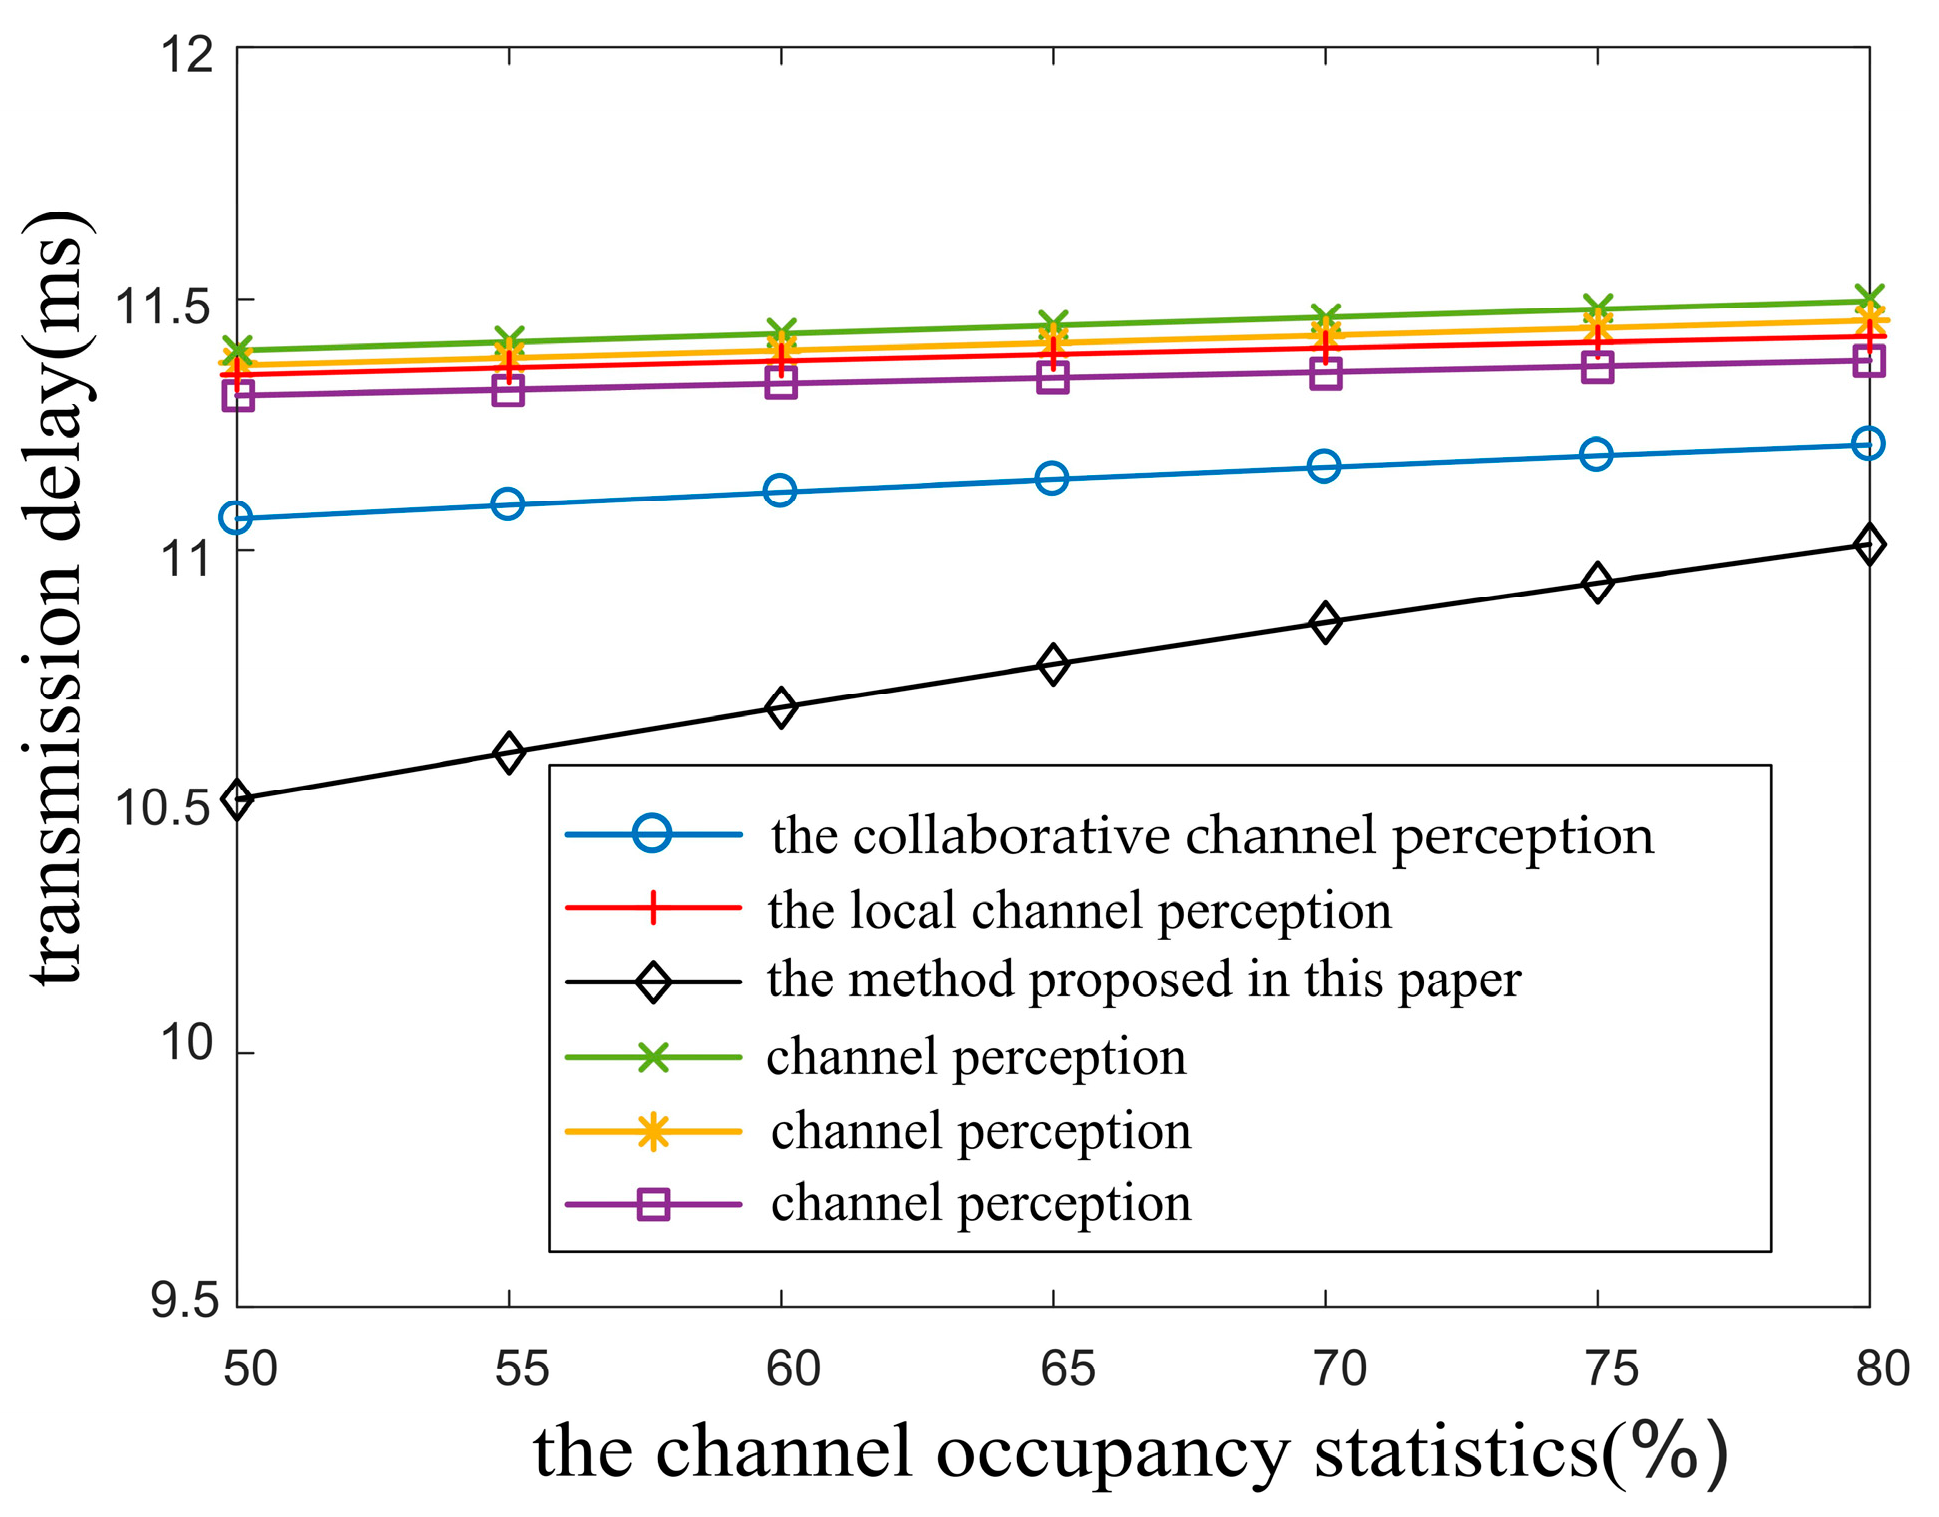
The collaborative channel perception calculates the channel occupancy statistics through rational weight allocation and multi-node data fusion, which represents the congestion level of the current channel state. By combining the channel occupancy statistics with a data link message priority threshold, it performs data link message channel access control, thereby significantly impacting network throughput and transmission delay. Based on the simulation parameters shown in Table 1, this paper simulated and analyzed the impact of channel occupancy statistics on network throughput and transmission delay. The results are shown in Figure 3 and Figure 4, respectively.
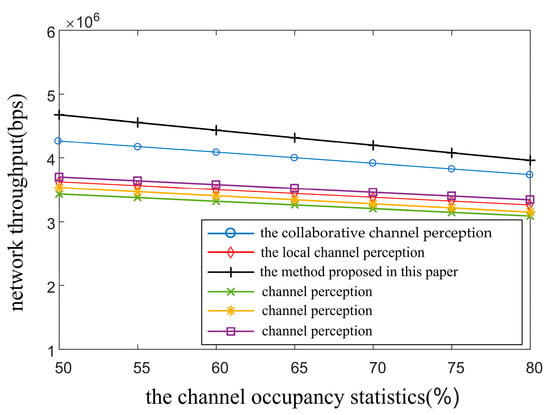
Figure 3.
The impact of channel occupancy statistics on network throughput.  the collaborative channel perception [15].
  the local channel perception [5].
  channel perception [7].
  channel perception [6].
  channel perception [8].
the collaborative channel perception [15]. the local channel perception [5]. channel perception [7]. channel perception [6]. channel perception [8].
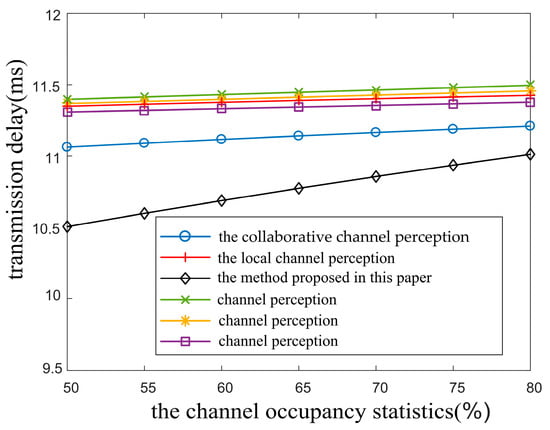
Figure 4.
The impact of channel occupancy statistics on transmission delay.  the collaborative channel perception [15].
  the local channel perception [5].
  channel perception [7].
  channel perception [6].
  channel perception [8].
the collaborative channel perception [15]. the local channel perception [5]. channel perception [7]. channel perception [6]. channel perception [8].
Since channel perception [5,6,7,8] belongs to the local perception method, and the channel perception [5] is the most typical one, this paper, therefore, took the channel perception [5] as the comparison object for the local channel perception in the analysis of simulation results. Through analyzing the simulation results in Figure 3, under identical channel occupancy statistics, the network throughput of the method proposed in this paper is the most optimal. In contrast, the local channel perception [5] performs the worst, while the collaborative channel perception [15] falls in between. This is primarily due to the fact that the local channel perception heavily relies on the traffic pulse statistical capability of the local node device to perceive the channel state, without considering the neighboring nodes’ perception capability. Consequently, when the node device is impacted by factors like electromagnetic interference or sensor instability, the accuracy of traffic pulse statistics decreases, leading to a significant deviation of the channel occupancy statistics from the actual channel state. This results in errors in decision making for transmitting data link messages, reducing the success rate of data link message transmission and ultimately decreasing the network throughput.
The collaborative channel perception [15] overcomes the dependency on the traffic pulse statistical capability of a single node device and employs the distance-weighted fusion of multiple node statistics data. However, the distance-weighting factor does not accurately reflect the traffic pulse statistical capability of nodes. Factors that affect the statistical capability of node devices, such as antenna VSWR, SNR, and component aging, are not reflected in the node weight allocation strategy. This results in errors in the channel occupancy statistics. Nevertheless, the deviation of these errors is less significant than that of the local channel perception.
In contrast, the method proposed in this paper scientifically evaluates the traffic pulse statistical capability through evidence fusion theory and assigns data fusion weights based on the credibility and falsity of characteristic parameters of node devices. This enables the calculated channel occupancy statistics to accurately reflect the actual state of the current data link network channel. This, in turn, improves the success rate of data link message transmission and subsequently enhances the network throughput.
Through analyzing the simulation results in Figure 4, it can be observed that, under the same channel occupancy statistics, the transmission delay of the method proposed in this paper is optimal. In contrast, the local channel perception [5] performs the worst, while the collaborative channel perception [15] falls in the middle. Specifically, when the value of channel occupancy statistics is at 50%, the transmission delay of the method proposed in this paper is reduced by 21% compared to the local channel perception and by 19% compared to the collaborative channel perception [15]. This is primarily due to the fact that the proposed method can scientifically evaluate the traffic pulse statistical capability of nodes within a one-hop range and allocate data fusion weights based on the credibility and falsity of their characteristic parameters. The channel occupancy statistics can accurately reflect the actual state of the current channel, thereby improving the accuracy of data link message transmission decisions and reducing the probability of data link message exchange conflicts within the network. Consequently, this leads to a reduction in the transmission delay of data link messages.
In contrast, the collaborative channel perception [15] exhibits a certain deviation between the calculated channel occupancy statistics and the actual channel state due to unreasonable weight allocation. The local channel perception [5], however, is highly dependent on the traffic pulse statistical capability of a single node device. This can result in large fluctuations in channel occupancy statistics and lead to the inaccurate perception of channel states. Consequently, this causes errors in message transmission decisions, significantly increasing the message conflict probability and thereby increasing the message transmission delay. Therefore, it becomes difficult to meet the real-time requirements of data link message exchange.
By analyzing the simulation results presented above, it becomes evident that the method proposed in this paper effectively mitigates the impact of fluctuations in node characteristic parameters on channel occupancy statistics. It can overcome the influence of the instability of factors such as node perception capability and electromagnetic environment on channel perception. Consequently, this leads to an improvement in the accuracy of channel state perception. Accurately perceiving channel state is pivotal to improving the reliability of data link message transmission decisions and reducing the probability of data link message conflicts. The method can provide technical support for enhancing the UAV cooperative channel perception capability. When considering identical channel occupancy statistics, the network throughput and transmission delay of our proposed method outperform both the local channel perception [5] and the collaborative channel perception [15]. Specifically, at a channel occupancy statistics value of 50%, the transmission delay of the method proposed in this paper is reduced by 21% in comparison to the local channel perception [5] and by 19% compared to the collaborative channel perception [15].
The method proposed in this paper also has certain limitations, which can be summarized into two main aspects. First, the broadcast messages used to share node characteristic parameters and pulse statistics will occupy a certain amount of spectrum resources. Second, when this method is used for large-scale networking, the complexity of node weight calculation will increase.
5. Conclusions
In this paper, we analyze the factors that affect the channel perception capability of node devices and set the characteristic parameters accordingly. We employ the Dempster–Shafer theory to calculate the credibility and falsity of these characteristic parameters, providing a scientific evaluation of the node devices’ channel perception capability. Based on this evaluation, we propose a data fusion weight allocation strategy to calculate channel occupancy statistics and accurately perceive the true state of the channel. This method can effectively eliminate the influence of node characteristic parameter fluctuation on channel occupation statistics and improve the accuracy of channel state perception. Under the same channel occupation statistics, compared to the local perception method and the existing cooperative perception, the network throughput is effectively improved and the transmission delay is reduced.
Author Contributions
Conceptualization, Z.Z. (Zhiyong Zhao); methodology, Z.M.; software, Y.P.; formal analysis, Z.Z. (Zhilin Zhang); resources, J.X. All authors have read and agreed to the published version of the manuscript.
Funding
This research received no external funding.
Data Availability Statement
The original contributions presented in the study are included in the article; further inquiries can be directed to the corresponding author. Due to policy and legal restrictions, data requests will be limited.
Conflicts of Interest
The authors declare no conflicts of interest.
Appendix A
| Algorithm A1. Collaborative channel perception based on data fusion |
| Input: {, , , }, {ξi, zi, si, moni, MTBFi} |
| Output: the channel occupancy statistics (Cos) |
| 1: {mij(H1), mij(H2), mij(H3), mij(H4), mij(H5)};// a set of score |
| 2: mj = {mj(H1), mj(H2), mj(H3), mj(H4), mj(H5)};// the basic probability assignment function |
| 3: mdij = sqrt(2));// the Euclidean distance |
| 4: SM = ()n×n;// similarity matrix |
| 5: for (j = 1 to 5) do |
| 6: ;// credibility of node data |
| 7: end for |
| 8: , ;// the global conflict and the local conflict |
| 9: ;// falsity of node data |
| 10: ;//the relative certainty index |
| 11: , ;// corrected credibility and falsity |
| 12: for (i = 1 to 5) do |
| ;// weight of node |
| 14: end for |
| 15: for (j = 1 to 5) do |
| 16: ;// the normalized weight |
| 17: end for |
| 18: for (j = 1 to M) do |
| 19: for (i = 1 to M) do |
| 20: , ;// M represents the number of frequency hopping points, αj represents the weight of the neighbor node. β represents the weight of the current node |
| 21: end for |
| 22: ;// τ denotes the time period of the pulse and TS represents the time length of the statistical time window |
| 23: end for |
References
- Chen, C.; Tang, Z.; Hu, J.; Wang, Y.; Jiang, X. Data link 2.0: The victory maker of intelligent war. J. Command Control 2020, 6, 5–12. [Google Scholar]
- Chen, G.; Cheng, C.; Xu, X.; Zeng, Y. Minimizing the Age of Information for Data Collection by Cellular-Connected UAV. IEEE Trans. Veh. Technol. 2023, 72, 9631–9635. [Google Scholar] [CrossRef]
- Watanabe, K.; Sakai, R.; Tanaka, S.; Nagata, M.; Osaka, H.; Nakamura, A.; Gotoh, K. Electromagnetic Interference With the Mobile Communication Devices in Unmanned Aerial Vehicles and Its Countermeasures. IEEE Access 2024, 12, 11642–11652. [Google Scholar] [CrossRef]
- Liu, D.; Gao, Y.; Hu, S.; Ni, W.; Wang, X. Trajectory Design for Integrated Sensing and Communication Enabled by Cellular-Connected UAV. IEEE Wirel. Commun. Lett. 2024, 13, 1973–1977. [Google Scholar] [CrossRef]
- Zhang, Y.; He, Y.; Sun, H.; Wang, X.; Quek, T.Q.S. Performance analysis of statistical priority-based multiple access network with directional antennas. IEEE Wirel. Commun. Lett. 2022, 11, 220–224. [Google Scholar] [CrossRef]
- Zheng, W.; Jin, H.; Guo, J.; Feng, H. Research on a new data link MAC protocol and its channel occupancy. Comput. Simul. 2019, 36, 148–152. [Google Scholar]
- Liu, J.; Peng, T.; Quan, Q.; Cao, L. Performance analysis of the statistical priority-based multiple access. In Proceedings of the 3rd IEEE International Conference on Computer and Communications (ICCC), Chengdu, China, 13–16 December 2017. [Google Scholar]
- Zhao, Z.; Hu, D.; Mao, Z.; Liu, X. Backoff algorithm for random access protocol based on channel state decision. Syst. Eng. Electron. 2023, 45, 1866–1872. [Google Scholar]
- Rao, A.K.; Sabat, S.; Singh, R.K.; Srivastava, N. Cooperative Spectrum Sensing using Mobile Full-Duplex Cognitive Radio and Non-time-slotted Primary user Activity. Trans. Electr. Electron. Mater. 2021, 22, 679–686. [Google Scholar] [CrossRef]
- Patel, J.B.; Collins, S.; Sirkeci, M.B. A framework to analyze decision strategy for multi-band spectrum sensing in cognitive radios-Science Direct. Phys. Commun. 2020, 42, 429–433. [Google Scholar] [CrossRef]
- Lu, J.; Huang, M.; Yang, J. A covariance matrix-based spectrum sensing technology exploiting stochastic resonance and filters. EURASIP J. Adv. Signal Process. 2021, 1, 58–65. [Google Scholar] [CrossRef]
- Chaurasiya, R.B.; Shrestha, R. Fast Sensing-Time and Hard-ware-Efficient Eigenvalue-Based Blind Spectrum Sensors for Cognitive Radio Network. IEEE Trans. Circuits Syst. 2020, 67, 1296–1308. [Google Scholar] [CrossRef]
- Sharma, G.; Sharma, R. Distributed cooperative spectrum sensing over different fading channels in cognitive radio. In Proceedings of the 2017 International Conference on Computer, Communications and Electronics (Comptelix), Jaipur, India, 1–2 July 2017; pp. 107–111. [Google Scholar]
- Hassan, A.Y. Enhancing Signal Detection in Frequency Selective Channels by Exploiting Time Diversity in Inter-symbol Interference Signal. Wirel. Pers. Commun. 2019, 106, 1373–1395. [Google Scholar] [CrossRef]
- Zhao, Z.; Zhang, Y.; Liu, X. Channel Load Statistics Algorithm for Data Link Based on SPMA Protocol. J. Command Control 2023, 8, 230–235. [Google Scholar]
- Sun, F.; Deng, Z.; Wang, C.; Li, Z. A networking scheme for FANET basing on SPMA protocol. In Proceedings of the 2020 IEEE 6th International Conference on Computer and Communications (ICCC), Chengdu, China, 11–14 December 2020; pp. 182–187. [Google Scholar]
- Liu, P.; Wang, C.; Lei, M.; Li, M.; Zhao, M. Adaptive priority threshold setting strategy for statistical priority-based multiple access network. In Proceedings of the 2020 IEEE 91st Vehicular Technology Conference (VTC2020-Spring), Antwerp, Belgium, 25–28 May 2020; pp. 1–5. [Google Scholar]
- Zheng, W.; Jin, H. Analysis and research on a new data link MAC protocol. In Proceedings of the 10th International Conference on Communication Software and Networks, Chengdu, China, 6–9 July 2018; pp. 281–285. [Google Scholar]
- Gao, S.; Yang, M.; Yu, H. Modeling and parameter optimization of statistical priority-based multiple access protocol. China Commun. 2019, 16, 45–61. [Google Scholar] [CrossRef]
- Sharma, V.; Kumar, R.; Kumar, N. Distributed priority tree-based routing protocol for FANETs. Comput. Commun. 2018, 122, 129–151. [Google Scholar] [CrossRef]
- Hao, S.; Chen, Y.; Hu, B.; Cui, Y. A classifier-combined method based on D-S evidence theory for the land cover classification of the Tibetan Plateau. Environ. Sci. Pollut. Res. 2020, 28, 16152–16164. [Google Scholar] [CrossRef] [PubMed]
- Lin, G.; Liang, J.; Qian, Y. An information fusion approach by combining multigranulation rough sets and evidence theory. Inf. Sci. 2015, 314, 184–199. [Google Scholar] [CrossRef]
- Hoang, D.; Kang, H. Rolling element bearing fault diagnosis using convolutional neural network and vibration image. Cogn. Syst. Res. 2018, 53, 42–50. [Google Scholar] [CrossRef]
- Xu, X.; Zheng, J.; Yang, J.; Xu, D.; Chen, Y. Data classification using evidence reasoning rule. Knowl.-Based Syst. 2017, 116, 144–151. [Google Scholar] [CrossRef]
- Wang, M.; Wan, Y.; Ye, Z.; Lai, X. Remote sensing image classification based on the optimal support vector machine and modified binary coded ant colony optimization algorithm. Inf. Sci. 2017, 402, 50–68. [Google Scholar] [CrossRef]
- Zhou, L.; Zhang, X.; Guo, W.; Wang, Y. A direct fusion algorithm for multiple pieces of evidence based on improved conflict measure. J. Electron. Inf. Technol. 2019, 41, 1145–1151. [Google Scholar]
- Peng, Y.; Hu, Z.; Shen, H. A modified distance of evidence. J. Electron. Inf. Technol. 2013, 35, 1624–1629. [Google Scholar] [CrossRef]
- Schubert, J. Conflict management in Dempster-Shafer theory using the degree of falsity. Int. J. Approx. Reason. 2011, 52, 449–460. [Google Scholar] [CrossRef]
Disclaimer/Publisher’s Note: The statements, opinions and data contained in all publications are solely those of the individual author(s) and contributor(s) and not of MDPI and/or the editor(s). MDPI and/or the editor(s) disclaim responsibility for any injury to people or property resulting from any ideas, methods, instructions or products referred to in the content. |
© 2024 by the authors. Licensee MDPI, Basel, Switzerland. This article is an open access article distributed under the terms and conditions of the Creative Commons Attribution (CC BY) license (https://creativecommons.org/licenses/by/4.0/).