Article

Dual-Stream Feature Collaboration Perception Network for Salient Object Detection in Remote Sensing Images

by
Hongli Li
1,2,†,
Xuhui Chen
1,2,†,
Liye Mei
3,4 and
Wei Yang
5,*
1
School of Computer Science and Engineering, Wuhan Institute of Technology, Wuhan 430205, China
2
Hubei Key Laboratory of Intelligent Robot, Wuhan Institute of Technology, Wuhan 430205, China
3
School of Computer Science, Hubei University of Technology, Wuhan 430068, China
4
The Institute of Technological Sciences, Wuhan University, Wuhan 430072, China
5
School of Information Science and Engineering, Wuchang Shouyi University, Wuhan 430064, China
*
Author to whom correspondence should be addressed.
These authors contributed equally to this work.
Electronics 2024, 13(18), 3755; https://doi.org/10.3390/electronics13183755
Submission received: 15 August 2024 / Revised: 12 September 2024 / Accepted: 19 September 2024 / Published: 21 September 2024

Abstract

:
As the core technology of artificial intelligence, salient object detection (SOD) is an important approach to improve the analysis efficiency of remote sensing images by intelligently identifying key areas in images. However, existing methods that rely on a single strategy, convolution or Transformer, exhibit certain limitations in complex remote sensing scenarios. Therefore, we developed a Dual-Stream Feature Collaboration Perception Network (DCPNet) to enable the collaborative work and feature complementation of Transformer and CNN. First, we adopted a dual-branch feature extractor with strong local bias and long-range dependence characteristics to perform multi-scale feature extraction from remote sensing images. Then, we presented a Multi-path Complementary-aware Interaction Module (MCIM) to refine and fuse the feature representations of salient targets from the global and local branches, achieving fine-grained fusion and interactive alignment of dual-branch features. Finally, we proposed a Feature Weighting Balance Module (FWBM) to balance global and local features, preventing the model from overemphasizing global information at the expense of local details or from inadequately mining global cues due to excessive focus on local information. Extensive experiments on the EORSSD and ORSSD datasets demonstrated that DCPNet outperformed the current 19 state-of-the-art methods.

1. Introduction

Salient object detection (SOD) is a visual attention-based technique designed to precisely locate and segment the most prominent regions in images [1,2]. Similar to semantic segmentation, SOD isolates salient regions and generates pixel-level saliency maps [3]. Both semantic segmentation and saliency mapping involve pixel-level processing, but semantic segmentation assigns semantic labels to all pixels, while saliency maps differentiate foreground from background without assigning specific meanings. SOD can accurately capture significant targets in remote sensing images, offering valuable applications in environmental protection, urban development, and national defense [4,5,6,7]. For instance, SOD can monitor changes in forest cover, wetland protection, and vegetation health, aiding environmental departments in detecting ecological changes [8]. Additionally, SOD also supports resource monitoring, building detection, and road network analysis, enhancing urban management and resource allocation [9]. Finally, it can be used for enemy target identification, battlefield analysis, and strategic resource monitoring, improving national defense and operational efficiency.
In recent years, researchers have proposed various improved strategies for segmentation tasks to address different challenges. For example, Prokop et al. [10] had introduced a heuristic algorithm-based training set expansion strategy, combined with an improved thresholding method, which significantly enhanced the ability to capture fine-grained features in images. The PiDNet proposed by Wang et al. [11] had combined hierarchical feature extraction and a progressive saliency refinement mechanism to effectively alleviate common issues in salient object detection, such as false saliency, detail loss, and blurred boundaries. The GPONet proposed by Zhang et al. [12], inspired by the gating mechanism, had designed a gate fusion unit (GFU) that refined effective features during multi-level feature fusion while suppressing redundant information, further enhancing feature representation. Zhou et al. [13] had employed unsupervised learning strategies and domain adaptation methods to align the data distribution between the source and target domains, leveraging high-level information to refine segmentation results and reduce the model’s dependency on data scale.
However, unlike natural images [14,15,16], SOD faces many challenges in remote sensing due to structural differences. Remote sensing images have complex backgrounds with diverse spectral information, making target detection harder [17]. And the high-altitude perspective of remote sensing images introduces varying object directions and significant scale changes, increasing detection complexity [18]. Additionally, remote sensing images contain various types of objects such as buildings, roads, and water bodies, differing greatly in size, shape, and color. These challenges require the development of more robust feature extraction and fusion strategies to design SOD methods tailored to remote sensing characteristics.
Despite these challenges, many scholars had explored SOD methods in remote sensing based on CNN and achieved a series of significant advancements. Xu et al. [19] had proposed a progressive semantic flow strategy that enhances global semantic cues while refining salient objects on complex backgrounds. Huang et al. [20] had utilized memory modules to store and retrieve cross-image context information, enhancing context awareness. Zhang et al. [3] had recognized that a large amount of noise interfering with detection could be generated during the multi-scale feature fusion process, so they designed a two-stage multi-scale weighting strategy to effectively reduce noise impact. Li et al. [21] had used dynamic convolution to perceive advanced semantic features, aligning multi-scale features from the perspective of channel correlation and improving feature fusion accuracy. Gong et al. [22] had optimized the initial saliency map using target edge and skeleton information to restore target details. However, these CNN-based methods excel at generating discriminative local features but lack long-range dependency modeling capability. This limitation makes it challenging to precisely extract salient objects from complex backgrounds.
With the rise of transformers [23,24,25], the importance of global information in SOD has been increasingly recognized. VST [26] was the first to propose a transformer architecture suitable for SOD, detecting salient objects through global perception. Subsequently, Gao et al. [27] had carried out adaptive tokenization of Patch to reduce information redundancy in Transformer. Li et al. [28] had used a Transformer-driven model to extract multi-level features with global dependencies, achieving knowledge transfer from global to local. Liu et al. [29] had extracted features using Transformer blocks with global receptive fields, employing a divide-and-conquer approach to capture and fuse specific information from multiple branches. Dong et al. [30] had designed an architecture capable of capturing long-range dependencies, using large convolution kernels to fuse multi-scale information during the decoding, enhancing salient features recovery. Yan et al. [31] had cleverly integrated Transformer and CNN into an encoder, modeling global and local relationships through an adaptive semantic matching mechanism. However, while Transformers can capture long-range dependencies by processing images into patches without spatial constraints, they lack local mechanisms for information exchange within individual image patches.
Considering that CNN excels at capturing local information while Transformer is adept at modeling global dependencies, devising a fusion strategy that leverages the complementary features of both approaches is a viable solution. One strategy [32,33] involves using convolutional blocks in the shallow layers to capture local textures and transformer blocks in the deep layers to model long-range dependencies. However, this strategy fails to collect sufficient contextual information in the shallow layers, making it prone to losing targets in dense detection tasks. Another strategy [34,35] is to create a new module by combining convolution and attention. Liu [36] had designed a novel hybrid block that cascades W-MSA and CNN, capable of modeling local information and global dependencies simultaneously. A third fusion strategy [37,38] employs a parallel architecture, fully utilizing Transformer and CNN strengths at each stage. The features at each stage can flexibly choose various fusion mechanisms for features complementarity and interaction. Given the differing feature distribution dimensions in shallow and deep layers, we adopted the third approach for flexible feature processing at various stages.
Despite significant progress in SOD, existing research that employs a single feature-extraction strategy still has certain limitations. The CNN-based methods lack global modeling capabilities, making it difficult to comprehensively understand the overall structure of ground object distribution. Conversely, the Transformer-based methods lack inductive bias towards local regions, failing to adequately capture local information. To address these limitations, we proposed a Dual-Stream Feature Collaboration Perception Network (DCPNet) that enabled Transformer and CNN to synergize. First, DCPNet established a dual-branch feature extractor that combined Transformer and CNN strengths to deeply explore local features and capture extensive dependencies in remote sensing images. Next, to achieve a deep fusion of global and local features, we designed a Multi-path Complementary-aware Interaction Module (MCIM), which achieved multi-path interaction and salient feature alignment between the dual branches. Finally, we introduced a Feature Weighting Balance Module (FWBM) to balance global semantics and local information, refining and enhancing features across different regions, thereby improving the perception of salient features.
Our contributions are summarized as follows:
(1)
We develop a Dual-Stream Feature Collaboration Perception Network (DCPNet) that coordinates Transformer and CNN to model global relationships and capture local fine-grained representations.
(2)
We propose a Multi-path Complementary-aware Interaction Module (MCIM) to fully leverage the local bias of CNN and the long-range dependency characteristics of Transformer, thereby achieving complementation between global information and local details.
(3)
We propose a Feature Weighting Balance Module (FWBM) to balance global and local features, preventing the model from overly focusing on global information at the expense of local details, or overly focusing on local information at the expense of overall understanding of images.

2. Materials and Methods

2.1. Network Overview

The high resolution and diverse scene structures of remote sensing images increase the difficulty of SOD. Single feature-extraction methods, such as CNN or Transformer, have limitations in addressing these challenges. CNN performs well in extracting local detail features but struggles to capture global information, particularly when handling complex semantic relationships, scale variations, and occlusions. On the other hand, while Transformer can effectively capture global features, its self-attention mechanism tends to introduce irrelevant background noise into the feature representation, which negatively impacts detection accuracy.
Therefore, we designed a Dual-Stream Feature Collaborative Perception Network (DCPNet) that leverages the strengths of both CNN and Transformer. The main framework is shown in Figure 1. The CNN branch focuses on extracting local detail features, allowing the model to perform more finely on small-scale features, while the Transformer branch captures global features, enabling the model to understand large-scale semantic relationships. These two sets of features are complemented and fused through the dual-branch structure, allowing the model to effectively handle targets of varying scales and complex backgrounds. This dual-branch architecture enables the use of CNN’s local bias to reduce interference from background noise, while Transformer’s global feature extraction enhances the model’s semantic understanding.
First, the dual-stream feature extractor consisted of a complementary transformer branch and CNN branch to realize the collaboration of global context dependent and local fine-grained features. The transformer branch was built on PVTv2 [39], while the CNN branch was based on ResNet50 [40]. PVTv2 had four stages, each with patch embedding and multi-head attention blocks. ResNet50 retained pooling layers and four residual layers for feature extraction. The input image x 3 × 352 × 352 was processed by both encoders, outputting four sets of multi-scale complementary features, f i x ,   f i y   (   i = 1 ,   2 ,   3 ,   4   ) . The global features were f 1 x 64 × 88 × 88 , f 2 x 128 × 44 × 44 , f 3 x 320 × 22 × 22 , f 4 x 512 × 11 × 11 . The local features were f 1 y 256 × 88 × 88 , f 2 y 512 × 44 × 44 , f 3 y 1024 × 22 × 22 , f 4 y 2048 × 11 × 11 .
Then, the corresponding features were input into the MCIM for fine-grained feature fusion and interactive feature alignment. The MCIM integrated global features and local details, meticulously merging salient information from different channels. Subsequently, the FWBM was designed to maintain the balance of semantic information between foreground and background in the deep features, adaptively enhancing feature representation in different regions.
Finally, multi-level feature cascading fusion and up-sampling were performed in the decoder to output high-quality segmentation results. The decoder comprised DeBlock1, DeBlock2, DeBlock3, and SalHead. The DeBlocks integrated convolution and deconvolution operations, with deconvolution used to up-sample low-resolution feature maps, addressing the issue of inconsistent resolutions across multi-level features. SalHead was a 1 × 1 convolution used to generate a single-channel segmentation map.

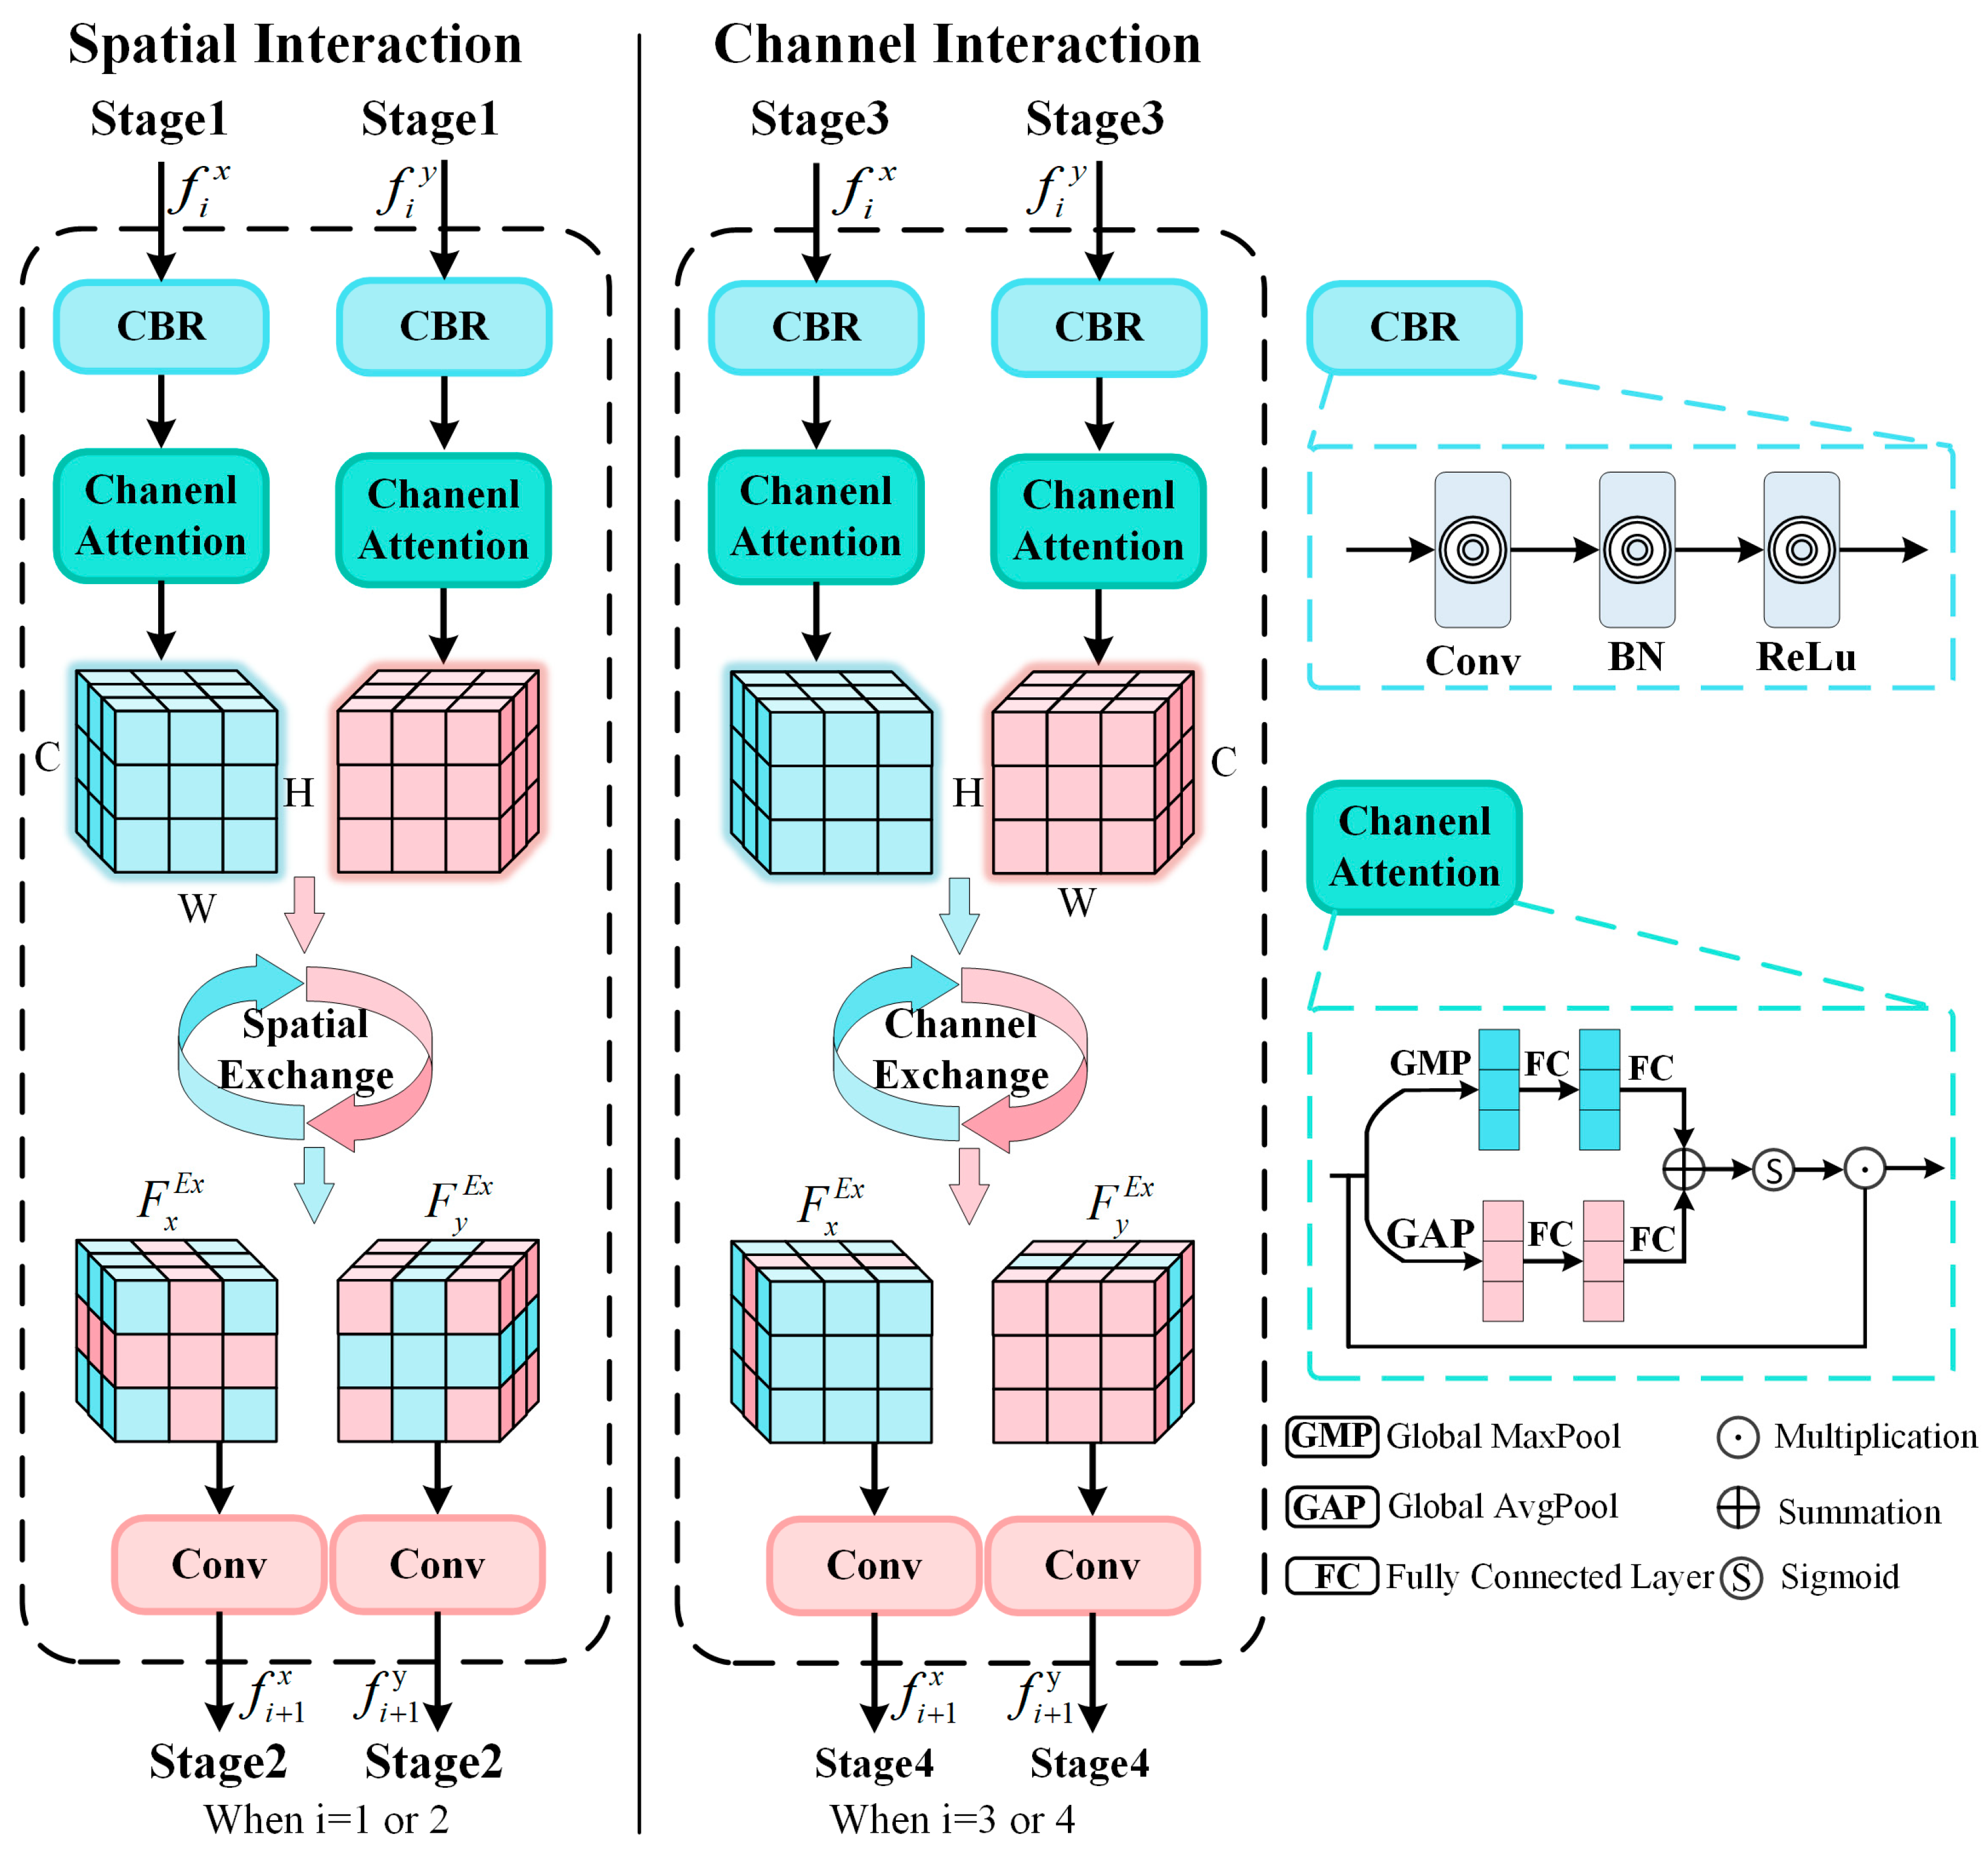
2.2. Multi-Path Complementarity-Aware Interaction Module (MCIM)

In the SOD, methods relying exclusively on either CNN or Transformer have inherent limitations. The strengths and weaknesses of CNN and Transformer decide that a single-feature extraction approach cannot fully harness their capabilities, thereby constraining the performance of SOD.
CNN extracts local features progressively through a sliding window mechanism. The strong correlation between pixels within the window enables CNN to excel at capturing local details of salient objects. However, this mechanism also restricts the ability of CNN to capture global features, as they have limited connectivity to pixels outside the window, leading to suboptimal performance in representing the global structure of images. Transformer, on the other hand, transforms all pixels into query (Q), key (K), and value (V) triplets for self-attention interaction, which allows for comprehensive connectivity of all pixel information on a global scale. This gives Transformer a notable advantage in aggregating global features. However, this global attention mechanism can introduce substantial background noise, which interferes with salient features extraction and decreases detection accuracy.
In order to solve these limitations, we proposed a Multi-path Complementary-aware Interaction Module (MCIM). This module deeply explored the complementary information within the CNN and Transformer branches to perform multi-layer feature fusion, achieving alignment between global and local features. The MCIM employed spatial and channel interaction strategies at different feature extraction stages to fuse and complement features from both branches. The architecture of this module is depicted in Figure 2.
This module adopted different interaction strategies at various stages of feature extraction, employing spatial interaction in Stage 1 and Stage 2, and channel interaction in Stage 3 and Stage 4. Due to the higher resolution and lower channel dimension of feature maps in the shallow network, spatial interaction is more appropriate. In contrast, feature maps in the deep network have higher channel dimensions, making channel interaction more suitable.
Spatial Interaction: In the shallow network (Stage 1 and Stage 2), the feature maps have higher resolution, with features primarily distributed in the spatial dimension. We adopted a spatial interaction strategy for feature alignment and fusion. Spatial Exchange involves embedding contextual information and local area features into each other in the spatial dimension. On one hand, the feature information from the Transformer branch helps the model better capture spatial relationships and structural information within the image. On the other hand, the feature information from the CNN branch enables the model to capture clearer local details.
Channel Interaction: In the deep network (Stage 3 and Stage 4), salient features are primarily concentrated in the channel dimension, making channel interaction strategies more suitable for information fusion across different feature channels. The contextual aggregated features from the global branch enhance the model’s perception of overall patterns, while the detailed regional information from the local branch further refine the feature representation of the targets.
Thus, by adopting a spatial interaction strategy in the shallow layers, we can fully utilize the cooperativity of local and global features in the initial stages, improving feature representation capability and target recognition accuracy. By employing a channel interaction strategy in the deeper layers, we can effectively integrate feature information across different channels when handling complex scenes, improving the richness and accuracy of salient feature representation.
First, channel normalization was performed on the input feature map to align the channel numbers of the CNN and Transformer branches.
Z i x = C B R ( f i x ) Z i y = C B R ( f i y )
where C B R stands for a combination of convolution, batch normalization, and the activation function ReLU. This step ensured that the feature maps from different branches had the same number of channels, facilitating subsequent feature complementation.
Next, channel attention was used to enhance the representation capability of important feature channels, improving the recognizability of salient features.
A i x = Z i x σ ( F C ( G M P ( Z i x ) ) + F C ( G A P ( Z i x ) ) ) A i y = Z i y σ ( F C ( G M P ( Z i y ) ) + F C ( G A P ( Z i y ) ) )
where G M P denotes Global Max Pooling, G A P stands for Global Average Pooling, F C is Fully Connected Layer, σ is the Sigmoid activation function, and ⊙ denotes channel-wise multiplication.
Then, depending on the distribution of the input features in the spatial and channel dimensions, different exchange strategies were adopted. Spatial feature exchange was used in the shallow layers, while channel feature exchange was used in the deep layers.
F x E x , F y E x   =   S E x ( A i x , A i y ) i f   i = 1   o r   2 F x E x , F y E x   =   C E x ( A i x , A i y )       i f   i = 3   o r   4
where S E x represents spatial exchange operations, C E x means channel exchange operations, and i indicates the feature at the i-th stage of the encoder.
After performing feature exchange, a 1 × 1 convolution was used to adjust the number of channels in the feature map back to its original size. This ensured that the interacted features can be smoothly passed on to the next stage of the backbone, further promoting the fusion of dual-branch information.
f i + 1 x = c o n v 1 × 1 ( F x E x ) f i + 1 y = c o n v 1 × 1 ( f y E x )

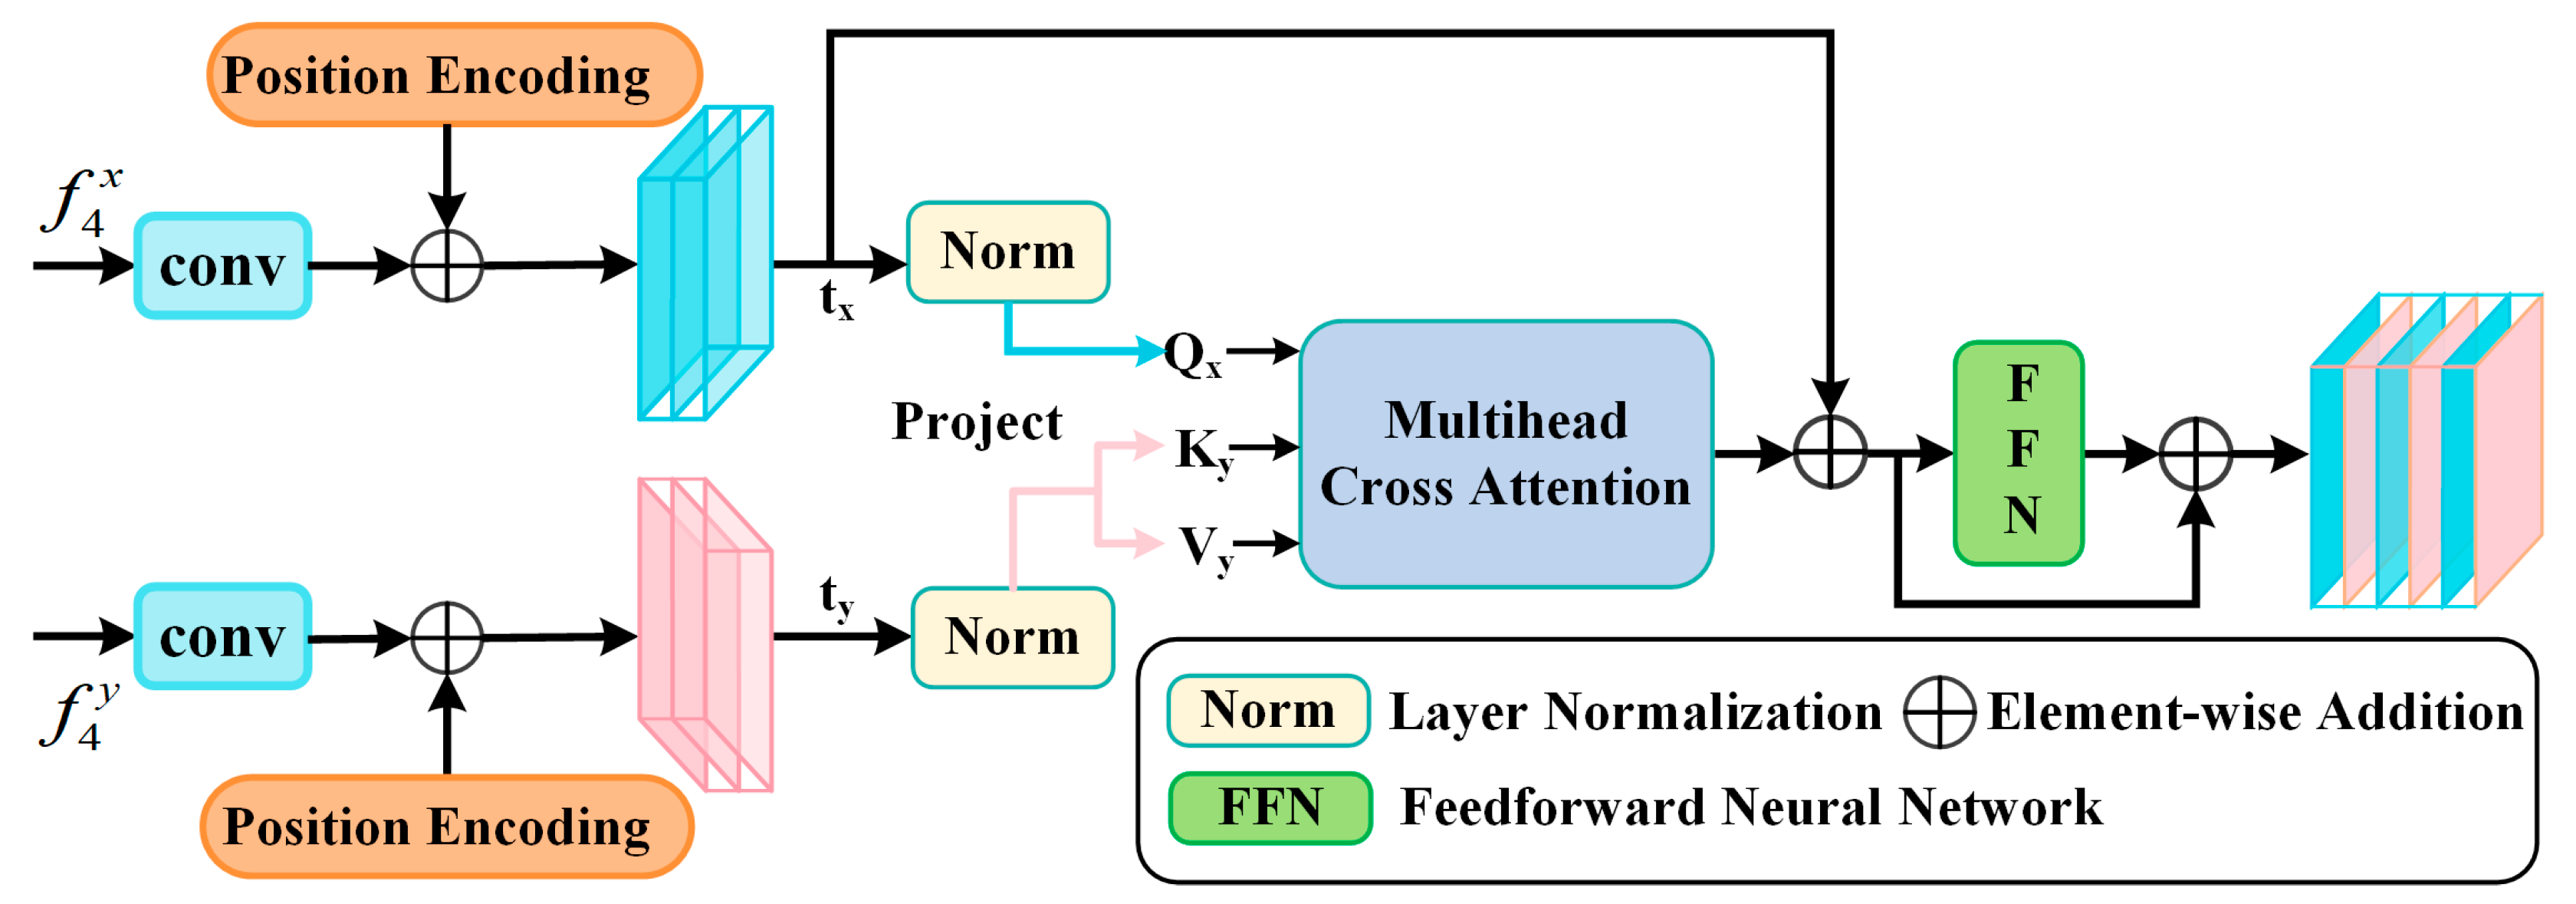
2.3. Feature Weighting Balance Module (FWBM)

For salient objects in complex scenes, such as buildings, roads, and water bodies, the semantic features extracted can vary significantly due to differences in size, shape, color, lighting, and imaging conditions. Although we had made improvements through global and local feature complementation and fusion strategies, an imbalance between global semantics and local information can still lead to the drowning of critical features. Specifically, an overabundance of global features may result in inadequate capture of foreground details, while an excess of local features can lead to insufficient understanding of background information, thereby affecting the distinction between foreground and background. To address this, we proposed a Feature Weighting Balance Module (FWBM) to balance the global and local features of salient regions and to refine and enhance features in different areas.
This module allowed the model to adaptively weight the features of foreground and background regions. When the ground things in the background area are misjudged as the salient object, indicating that the background features are too strong, the module weakens the feature representation of the background regions to achieve more accurate separation of salient objects. Conversely, when the object features of the salient area are interfered with by background information, the module enhances the feature representation of the salient targets, ensuring their clarity and recognition in complex backgrounds.
The FWBM integrated global context and local detail information, using self-attention and feature re-weighting strategies to dynamically adjust the importance of features. This ensures the precise detection and detailed depiction of salient targets in diverse remote sensing scenes, significantly enhancing the detection performance of the model. The architecture of this module is displayed in Figure 3.
The deep feature maps f 4 x and f 4 y from the Transformer and CNN branches were used as inputs to achieve feature refinement and enhancement. First, the input features were embedded through a convolutional layer, and trainable positional encoding was added to retain positional information.
t x = e m b e d x ( x ) + p o s x t y = e m b e d y ( y ) + p o s y
Next, the feature signals underwent layer normalization (LN) to stabilize the training process and accelerate convergence.
t ^ x = L N ( t x ) t ^ y = L N ( t y )
The layer normalization processed the input x as follows:
y = x E ( x ) V a r ( x ) + ε γ + β
where E ( · ) and V a r ( · ) represent the expectation and standard deviation of the input x . The term ε is added to the denominator for numerical stability, typically set to 1 × 10⁻⁵. The parameters β and γ are learnable affine transformation parameters.
In the multi-head cross-attention, global features were transformed into queries (Q), while local features were transformed into keys (K) and values (V). This cross-attention aggregated global contextual information, effectively capturing relationships between distant pixels in the image and providing the model with a deeper understanding of global structural information.
c a = φ ( Q x K y T d ) V y
where Q x , K y , and V y are obtained through projection matrices W q , W k , and W v . The d is the normalization parameter, and φ ( · ) represents the softmax function.
Q x     = t ^ x W q K y = t ^ y W k V y       = t ^ y W v
Then, a feedforward neural network (FFN) further processed the features to enhance their representational capacity. Residual addition was used to merge the information processed by different branches, further enhancing the features of different regions.
g ^ = t x + c a g = g ^ + F F N ( g ^ )

2.4. Hybrid Loss

During the training phase, we defined a hybrid loss to backpropagate and update the model parameters. The overall loss comprised a pixel-level loss, BCE, and a map-level loss, IOU, with the following formula:
L t o t a l = L b c e ( U p ( S ) , G T ) + L I O U ( σ ( U p ( S ) ) , G T )
where S represents the saliency segmentation map, G T indicates the ground truth labels, U p ( · ) is the bilinear interpolation used for up-sampling, and σ is the sigmoid function.

3. Results

3.1. Datasets

We used two datasets, ORSSD and EORSSD, to evaluate the performance of DCPNet. Each dataset includes original images along with their corresponding pixel-level annotations. It should be noted that in order to better train the model, the number of training samples in both datasets was augmented by eight times. The detailed descriptions of these two datasets are as follows:
(1) The ORSSD, proposed by Li et al. [41], is the first publicly available remote sensing dataset for SOD. It comprises 800 images in total, with 600 designated for training and 200 for testing. These images are generated by remote sensing satellites and aerial systems, primarily collected through Google Earth, with a few sourced from existing databases. Each original image has a spatial resolution between 0.5 and 2 m, and image resolutions vary between 256 × 256 and 2107 × 1198 pixels. This dataset covers eight types of salient objects, including airplanes, ships, cars, rivers, ponds, bridges, stadiums, and beaches.
(2) The EORSSD [42] is an extended version of ORSSD, incorporating 1200 additional images, also sourced from Google Earth. EORSSD contains a total of 2000 samples, divided into 1400 for training and 600 for testing. Compared to ORSSD, EORSSD presents greater challenges. For instance, in EORSSD, individual images frequently contain multiple targets, with scenes featuring two or more targets accounting for 36.5% of the dataset, increasing the difficulty of multi-target detection. Moreover, scenes with small targets (where targets occupy less than 10% of the image) account for 84.65% of the dataset, emphasizing the challenges of small target detection.

3.2. Experiment Details

3.2.1. Parameter Settings

Our research was conducted using the PyTorch 2.1 alongside a high-performance GPU 4060Ti with 16GB of memory. During the training process, we used PVTv2 [39] and ResNet50 [40] as the feature extraction networks, initializing them with their respective pre-trained weights. The input image size was set to 352 × 352 pixels. We employed the Adam optimizer for network training. During training, the batch size was set to eight, and the model was trained for a total of 90 epochs. During our experiments, we observed that the training loss stabilized at around 90 epochs, indicating that the model had largely converged. The initial learning rate was set at 1 × 10⁻⁴ and was reduced to one-tenth of the initial value after 75 epochs. The code is available at https://github.com/OrangeCat12352/DCPNet (accessed on 18 September 2024).

3.2.2. Evaluation Metrics

To comprehensively evaluate our approach, we employed various evaluation metrics for comparison with different methods. The S-measure [43] assesses the structural similarity between the predicted results and the ground truth from both object similarity and background similarity perspectives, with the parameter α set to 0.5 to balance the importance of the object and the background. The Mean Absolute Error (MAE) indicates the absolute error between the predicted results and the ground truth and is a commonly used metric for assessing prediction accuracy. The E-measure [44] evaluates experimental results based on the differences between the global mean and local pixels, emphasizing the overall characteristics of the image and the matching degree of local details. The F-measure [45] comprehensively evaluates the quality of the saliency map by balancing precision and recall. Among these metrics, a smaller MAE indicates better model performance, while higher values for the other metrics signify better performance.

3.3. Comparison with State-of-the-Arts

We conducted both visual and quantitative comparisons of DCPNet with 19 competitive SOD methods. These methods are categorized into CNN-based methods (SAMNet [46], HVPNet [47], DAFNet [42], MSCNet [48], MJRBM [49], PAFR [50], CorrNet [51], EMFINet [52], MCCNet [53], ACCoNet [54], AESINet [55], ERPNet [56], ADSTNet [57], SFANet [19]), Transformer-based methods (VST [26], ICON [58], HFANet [59], TLCKDNet [30]), and the CNN–Transformer-based method (ASNet [31]).

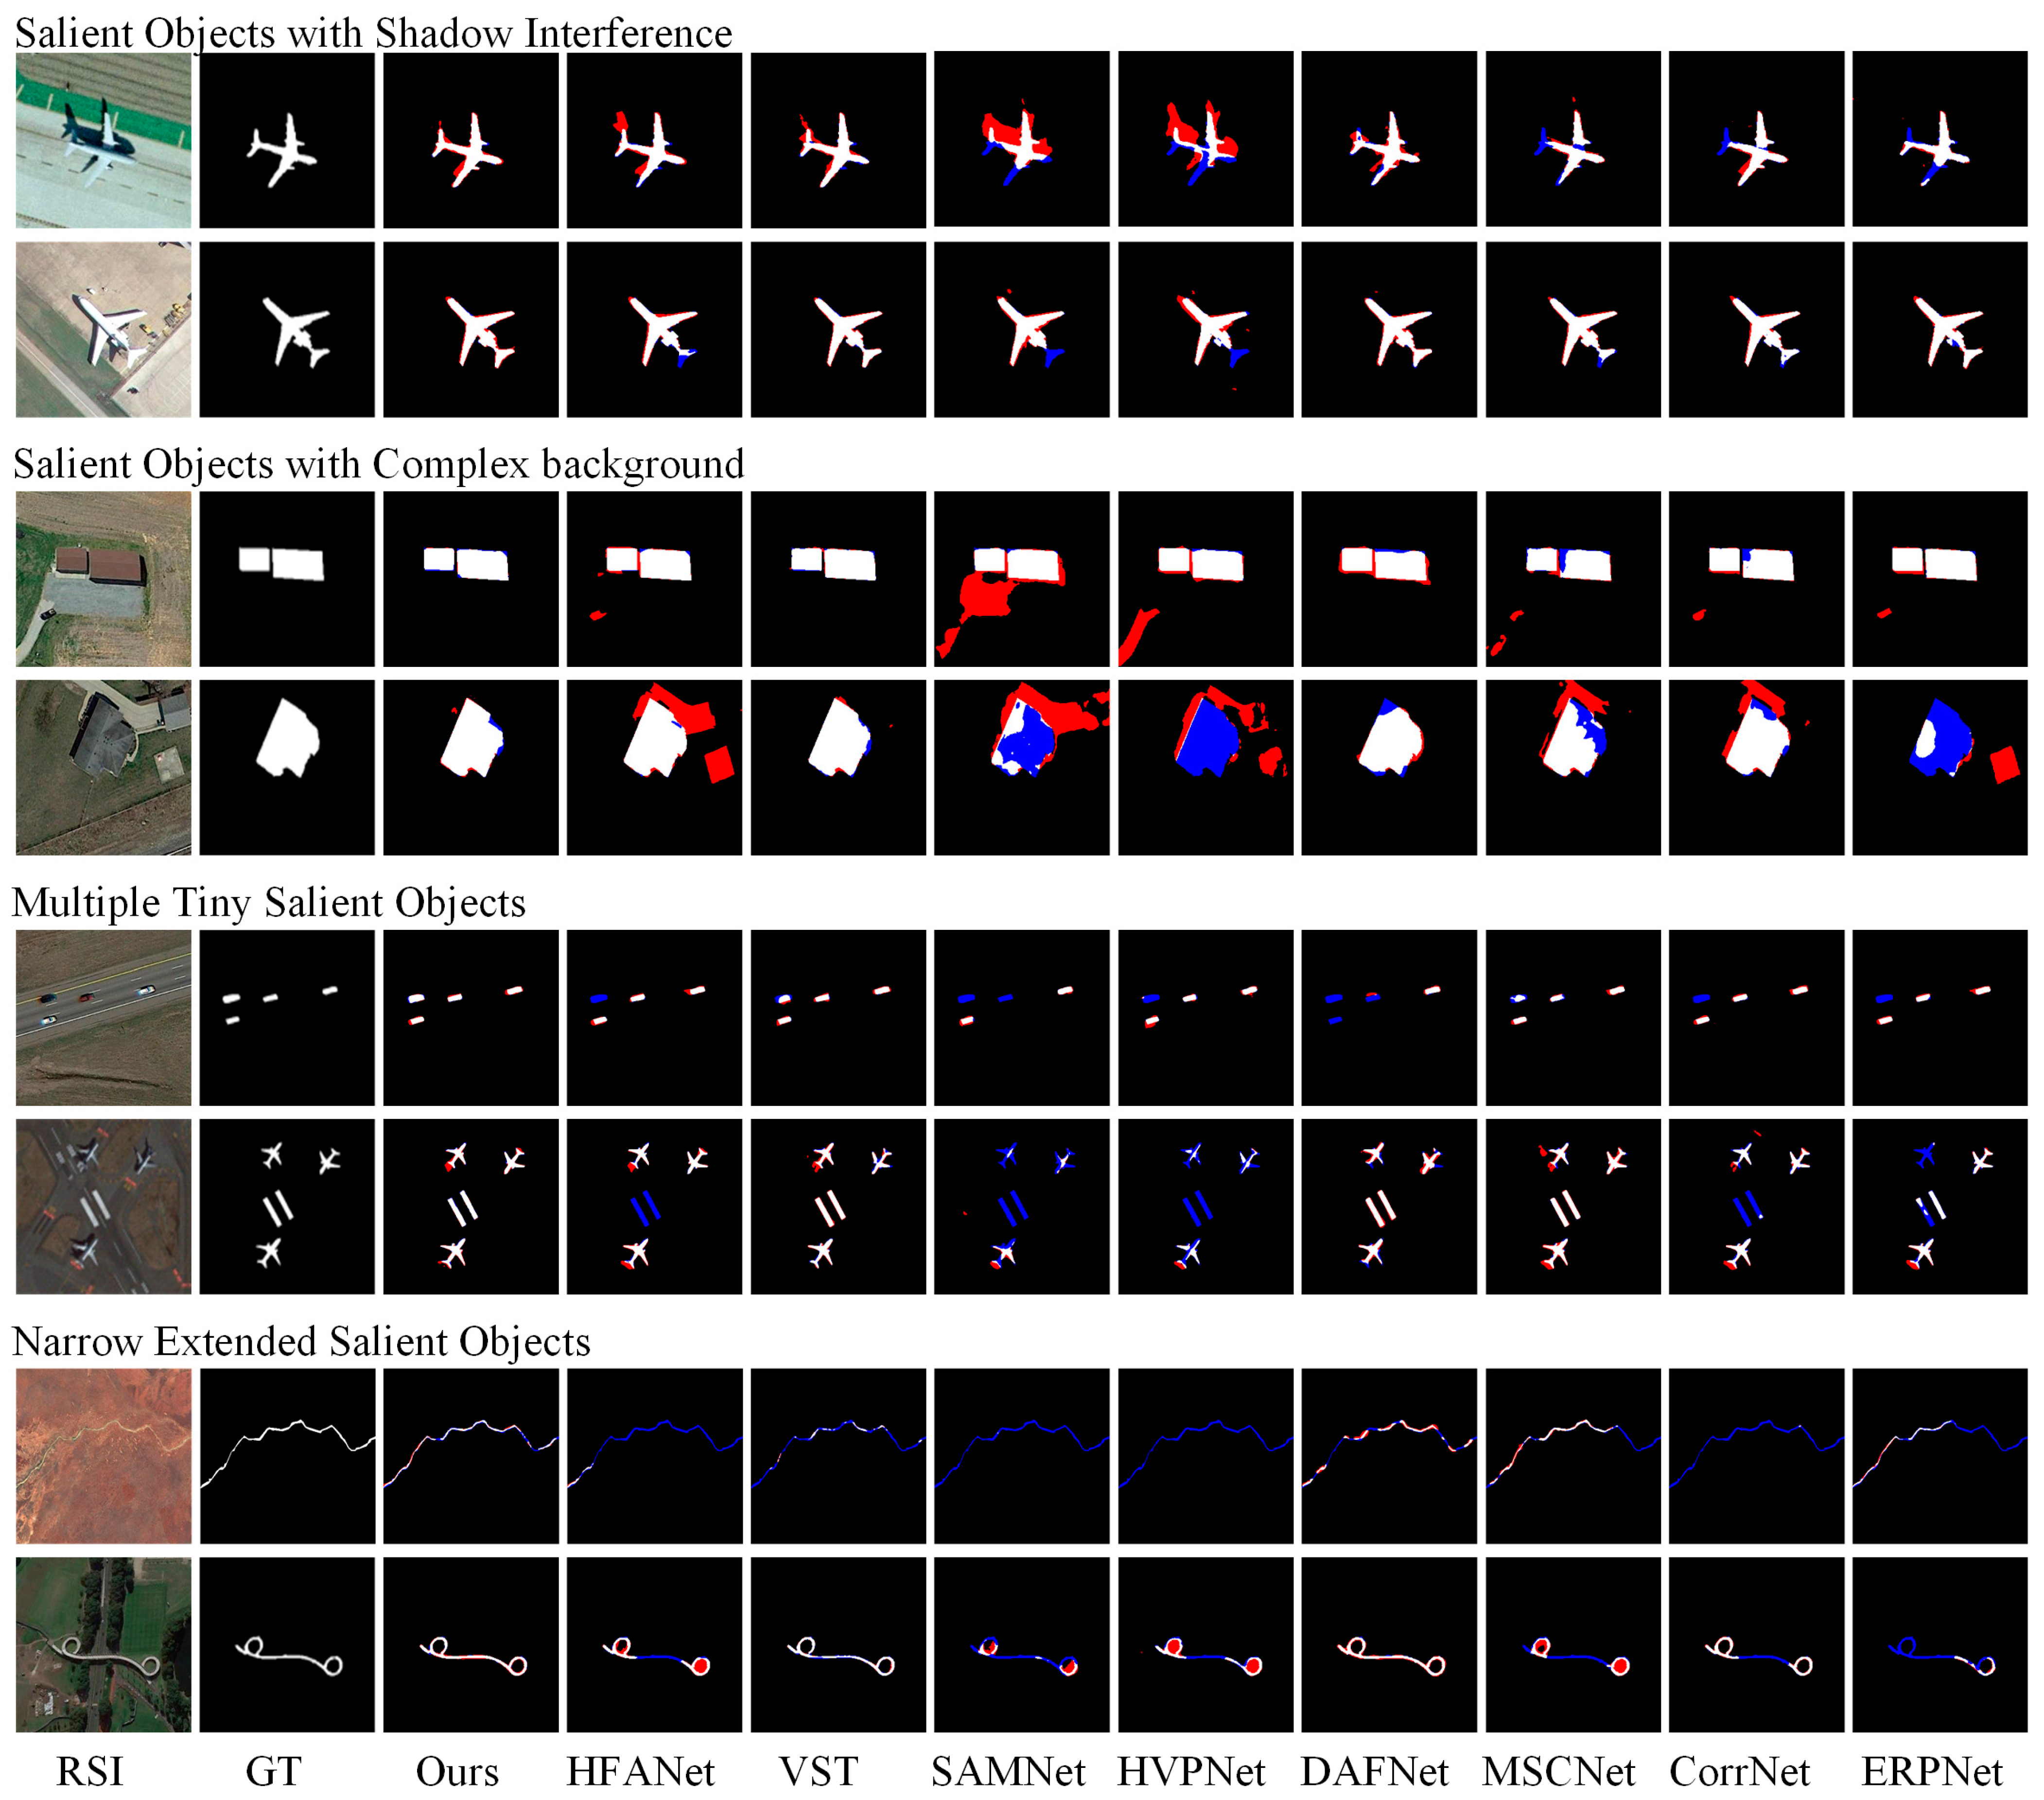
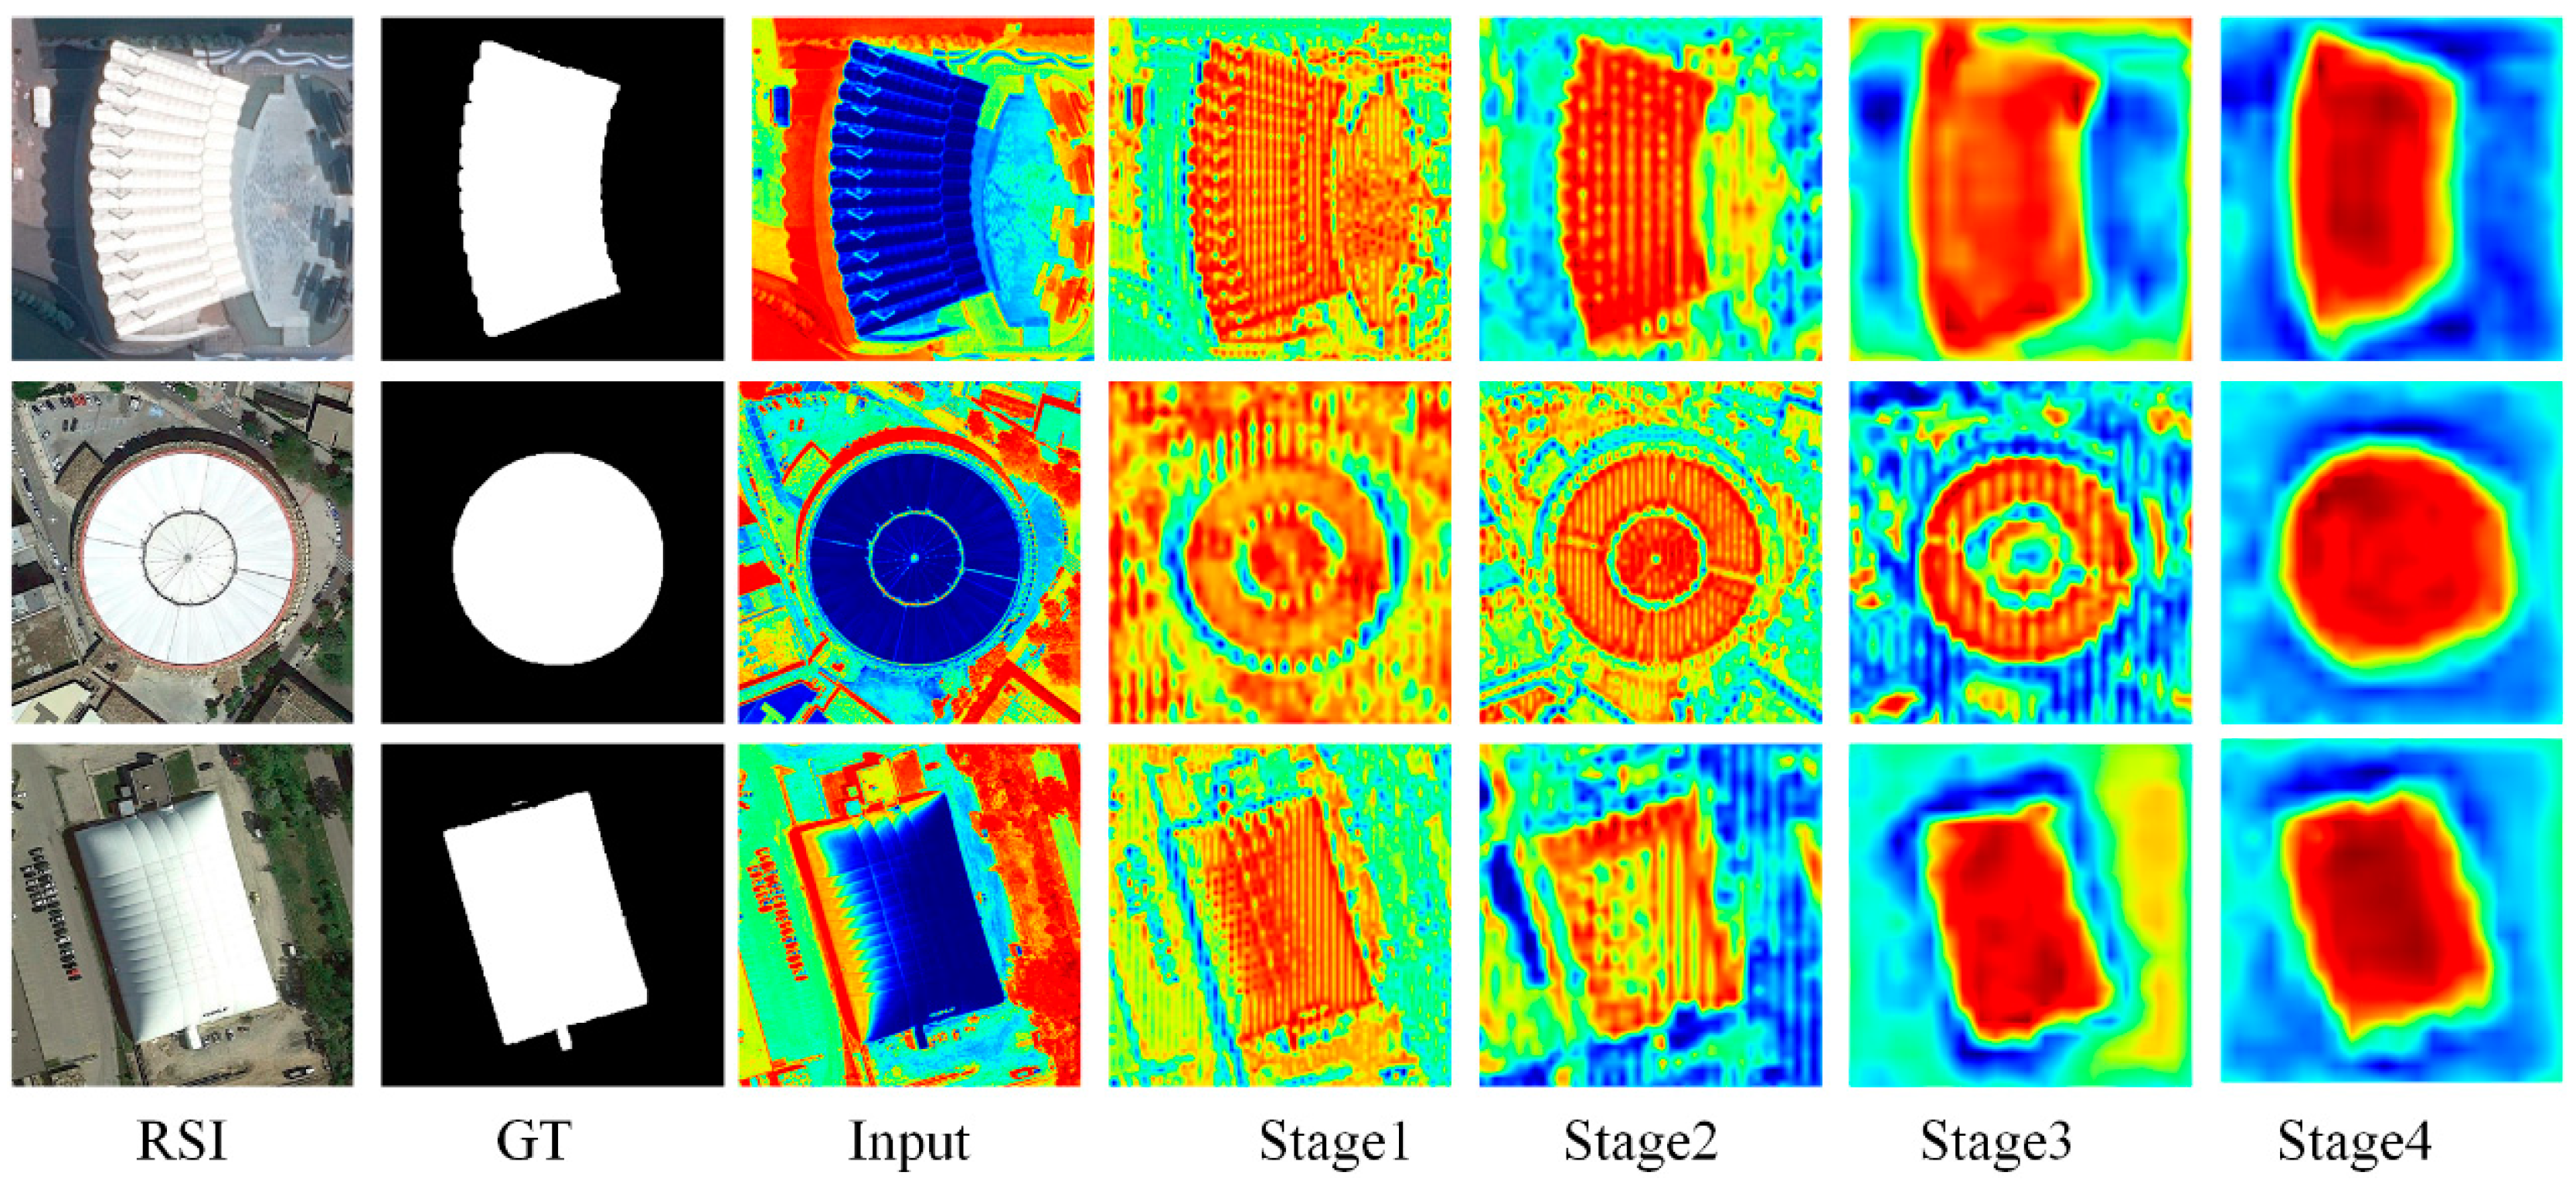
3.3.1. Visual Comparison

To demonstrate the superiority of the proposed method in visual detection performance, we showed the visualization results in Figure 4, comparing it with other existing methods across various challenging scenarios. Specifically, we selected a series of representative complex scenes, including scenarios with shadow interference, complex backgrounds, multiple small targets, and narrow elongated salient objects. By comparing the visualization effects of different methods in these scenarios, our method showed significant advantages in visual presentation, capturing and displaying key details in the images more accurately. In addition, to more clearly illustrate the visual differences between various methods, we further processed the saliency maps. In comparison to the ground truth (GT), red areas represent false positives, while blue areas indicate missed detections.
Salient Objects with Shadow Interference: In scenes with shadow interference, the overlapping of shadows and targets can affect detection. In the two illustrated examples, airplane detection was misled by shadows. DAFNet failed to accurately distinguish between the airplane and the shadow, resulting in very blurry airplane contours. Although CorrNet was able to barely outline the plane, it was not able to fully detect the full shape of the aircraft. In our method, the FWBM was used to carry out weighted processing on the features of the aircraft and the shadow, weakening the feature weight of the shadow and enhancing the weight of the aircraft. This approach effectively distinguished the target from the shadow, maintaining edge clarity and avoiding the blurring caused by shadows.
Salient Objects with Complex Backgrounds: In detecting salient objects within complex backgrounds, there is often an inter-class feature similarity problem between the background and the target, making it challenging for a single feature-extraction strategy to cope effectively. For example, in the two illustrated instances, the Transformer-based HFANet failed to extract sufficient texture details around the target and mistakenly considers the surrounding roads as part of the building. Our method employed a dual-stream feature extraction strategy based on both Transformer and CNN, achieving a complementarity of global semantics and local details. Through Transformer, we captured the global spatial distribution features, and, through CNN, we extracted local features around the target. Consequently, our method can recognize the spatial distribution of various objects and capture the texture details around the target, effectively isolating the target from the background and making it more visually prominent.
Multiple Tiny Salient Objects: In a scenario with multiple small targets, the tiny size and varied shapes of the targets make them prone to being missed, posing a significant challenge for the model to capture small features. In the two illustrated examples, although ERPNet focused on capturing target edges, it still missed some small targets. Our method adopted the MCIM to achieve feature fusion of the two branches, processing in the spatial dimension to preliminarily locate the spatial areas of small targets and then enhancing the feature representation of small targets in the channel dimension. Compared to other methods, our approach demonstrated excellent detection capabilities, accurately identifying each small target and clearly showing their contours and details. This is particularly important for images with dense and small-sized targets.
Narrow Extended Salient Objects: For narrow and elongated salient objects, due to their irregular geographical structures and small width, most models showed broken detection results, as illustrated by HFANet and MSCNet. This further demonstrated the limitations of single feature-extraction strategies. On the other hand, our method maintained the integrity and details of the target through multi-feature complementation, multi-scale fusion, and salient feature enhancement, avoiding breakage or detail loss.

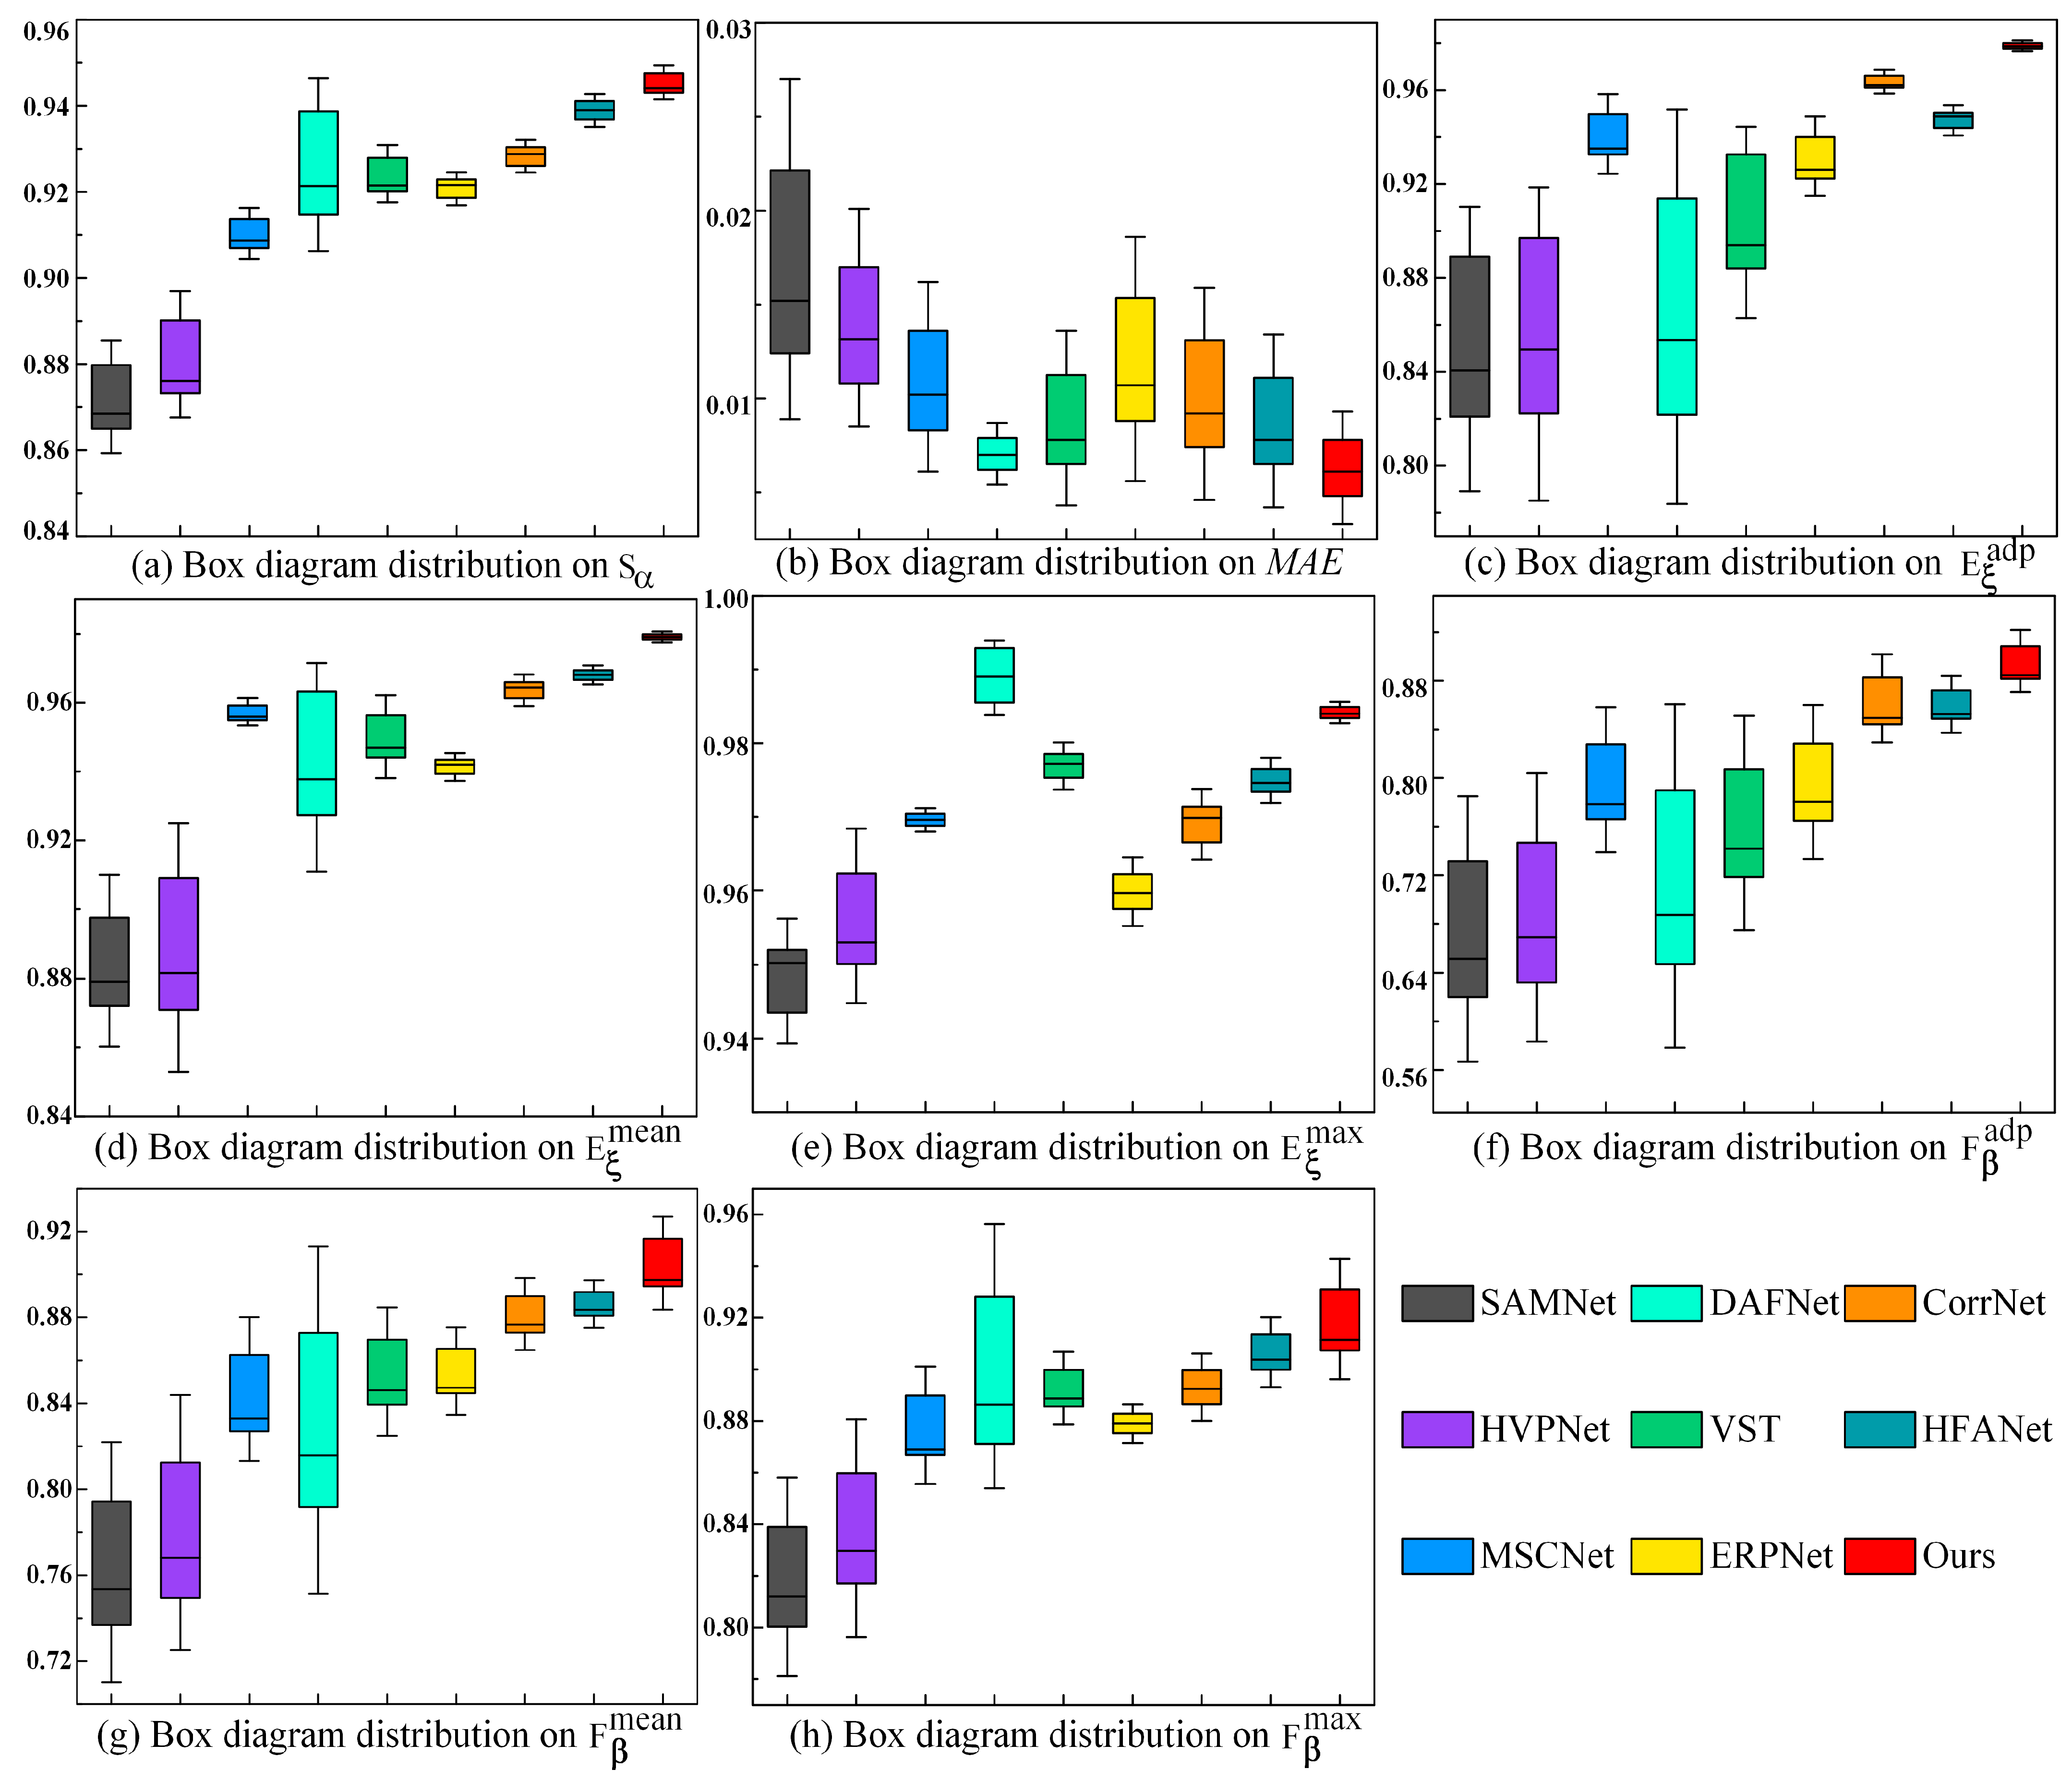
3.3.2. Quantitative Comparison

Table 1 and Table 2 presented the quantitative comparison results of our approach with others on the EORSSD and ORSSD datasets. These methods were categorized into CNN-based, Transformer-based, and CNN–Transformer-based methods. Regardless of which category, ours had a leading position in a variety of indicators. This indicated that the feature complementation strategy using CNN and Transformer was feasible and effective. Specifically, our method ranked first in all six metrics on EORSSD, outperforming other methods comprehensively, and had only a slight underperformance compared to DAFNet in E ξ m a x . DAFNet employed dense attention to inject shallow cues into deep layers during feature extraction, supplementing shallow texture information in high-level features but still lacking the ability to model globally. The significantly inferior performance of DAFNet across other metrics substantiated this point. And, on ORSSD, ours ranked first in seven different indicators, except for MAE, where it was only 0.003 behind the top-ranked SFANet.
Among the numerous compared methods, DCPNet demonstrated significant superiority on both datasets. This can be attributed to the unique dual-stream architecture of DCPNet, which skillfully combines the advantages of Transformer and CNN to achieve a complementary fusion of global semantics and local features. DCPNet not only has strong global modeling capabilities, analyzing the spatial distribution of multi-scale, multi-category, and multi-quantity targets, but also possesses good local bias capabilities, mining more detailed abstract semantic information of significant objects. Additionally, the MCIM answers the issue of “how to fuse dual-branch features” by adopting spatial and channel interaction strategies for feature alignment, enabling multiple feature exchanges during the feature coding phase and achieving the deep fusion of features. The FWBM balances global and local features by weighting features in different regions, refining and enhancing features. Overall, both the visual results in various complex scenarios and the quantitative results across different metrics demonstrate the robustness and superiority of DCPNet.
In addition, in Figure 5, we used PR and F-measure curves on ORSSD and EORSSD to examine the superiority of DCPNet. As seen in (a) and (c), the balance point of ours on the PR curves was closer to (1,1) compared to other methods, showcasing a clear advantage. Specifically, our method maintained high Precision and Recall on the PR curves. The F-measure curves in (b) and (d) showed that as the threshold increases, our method consistently performed better than others, demonstrating satisfactory performance. This further verified the stability and superiority of our method across different thresholds.
The box chart is a statistical figure mainly applied to explore the distribution characteristics of a group of data and shows the centralized trend and dispersion degree of the data. Figure 6 presented the comparative results of box plots across eight metrics. Each box has boundary lines representing the maximum value, median, and minimum value from top to bottom. In the metrics (a) to (h), the boxes for our method are generally narrower, indicating a more concentrated data distribution. This concentration reflects the consistent and stable performance of our method across various metrics, demonstrating its reliability and robustness. For instance, in (a), our method not only achieved the highest value but also had a very concentrated data distribution. Additionally, although our method did not achieve the highest value in (e), the data distribution was more concentrated, showing strong consistency and stability. Since a smaller MAE indicates better model performance, our method’s performance in (b) meets expectations, achieving the lowest error value, further proving the superiority of our method. Overall, whether in terms of the concentration of data distribution or the overall performance across various metrics, our method exhibits significant advantages, demonstrating excellent reliability and consistency.

3.4. Ablation Studies

3.4.1. The Ablation Study of DCPNet

We conducted multiple ablation experiments on the EORSSD to verify the effectiveness and contributions of each module in DCPNet. In this experiment, we designed four combination schemes: (1) Baseline, a U-shaped network architecture using only Transformer and CNN feature extractors; (2) Baseline + MCIM; (3) Baseline + FWBM; (4) the complete model DCPNet, combining all modules. The results are shown in Table 3.
As shown in Table 3, on the EORSSD dataset, the Baseline with the addition of the MCIM showed improvements of 0.41%, 0.39%, 0.45%, and 0.86% in four indicators. The Baseline with the addition of the FWBM showed increases of 0.55%, 1.03%, 1.08%, and 1.06% in the same metrics. This indicated that the MCIM and FWBM modules effectively enhance model performance. Moreover, DCPNet, through the collaborative work of the MCIM and FWBM modules, achieved the best performance across all metrics. Specifically, DCPNet reached 94.08%, 86.95%, 88.12%, and 89.36% in S α , F β a d p , F β m e a n , F β max , respectively.

3.4.2. Analysis of Feature Interaction Strategies

The MCIM employed a spatial interaction strategy in the shallow layers and a channel interaction strategy in the deep layers. To further investigate the impact of interaction strategies between the dual branches, we designed two variants of the MCIM: (1) MCIM with Spatial Interaction, which uses the spatial interaction strategy in all four stages of feature extraction; (2) MCIM with Channel Interaction, which uses the channel interaction strategy in all four stages of feature extraction. The analysis results are shown in Table 4.
As seen from the table, the MCIM exhibited optimal performance, outperforming the other two variants in three metrics. MCIM with Spatial Interaction, although handling spatial dimension features well in the shallow layers, overlooked the richness of channel dimension features in the deep layers, resulting in lower overall performance than the MCIM. Conversely, MCIM with Channel Interaction shows the opposite pattern. This demonstrated that employing a spatial interaction strategy in the shallow layers and a channel interaction strategy in the deep layers allows the MCIM to better capture and fuse feature information, thereby enhancing overall performance.
Additionally, the distribution of attention for features at different stages was shown in Figure 7. When the image is input, the texture distribution of the image is clearly visible, but the attention is not focused on the salient targets. In Stage 1 and Stage 2, the model primarily extracted features in the spatial dimension, with attention dispersed across the texture and structure of the entire image, and the semantic representation of the salient targets was not prominent. However, in Stage 3 and Stage 4, the model extracted more salient semantic information, with attention focused in the channel dimension, making the features of the salient targets more prominent and distinct. This phenomenon indicates that adopting a spatial interaction strategy is more effective in the shallow stages of the network, as the model needs to capture the overall spatial structure and texture distribution of the image at this point. In the deeper stages of the network, a channel interaction strategy is more appropriate, as the model is already focused on the salient targets and needs to further refine and enhance feature representation at the semantic level. This provided a certain level of interpretability for the use of different interaction strategies in the MCIM at different stages.

4. Discussion

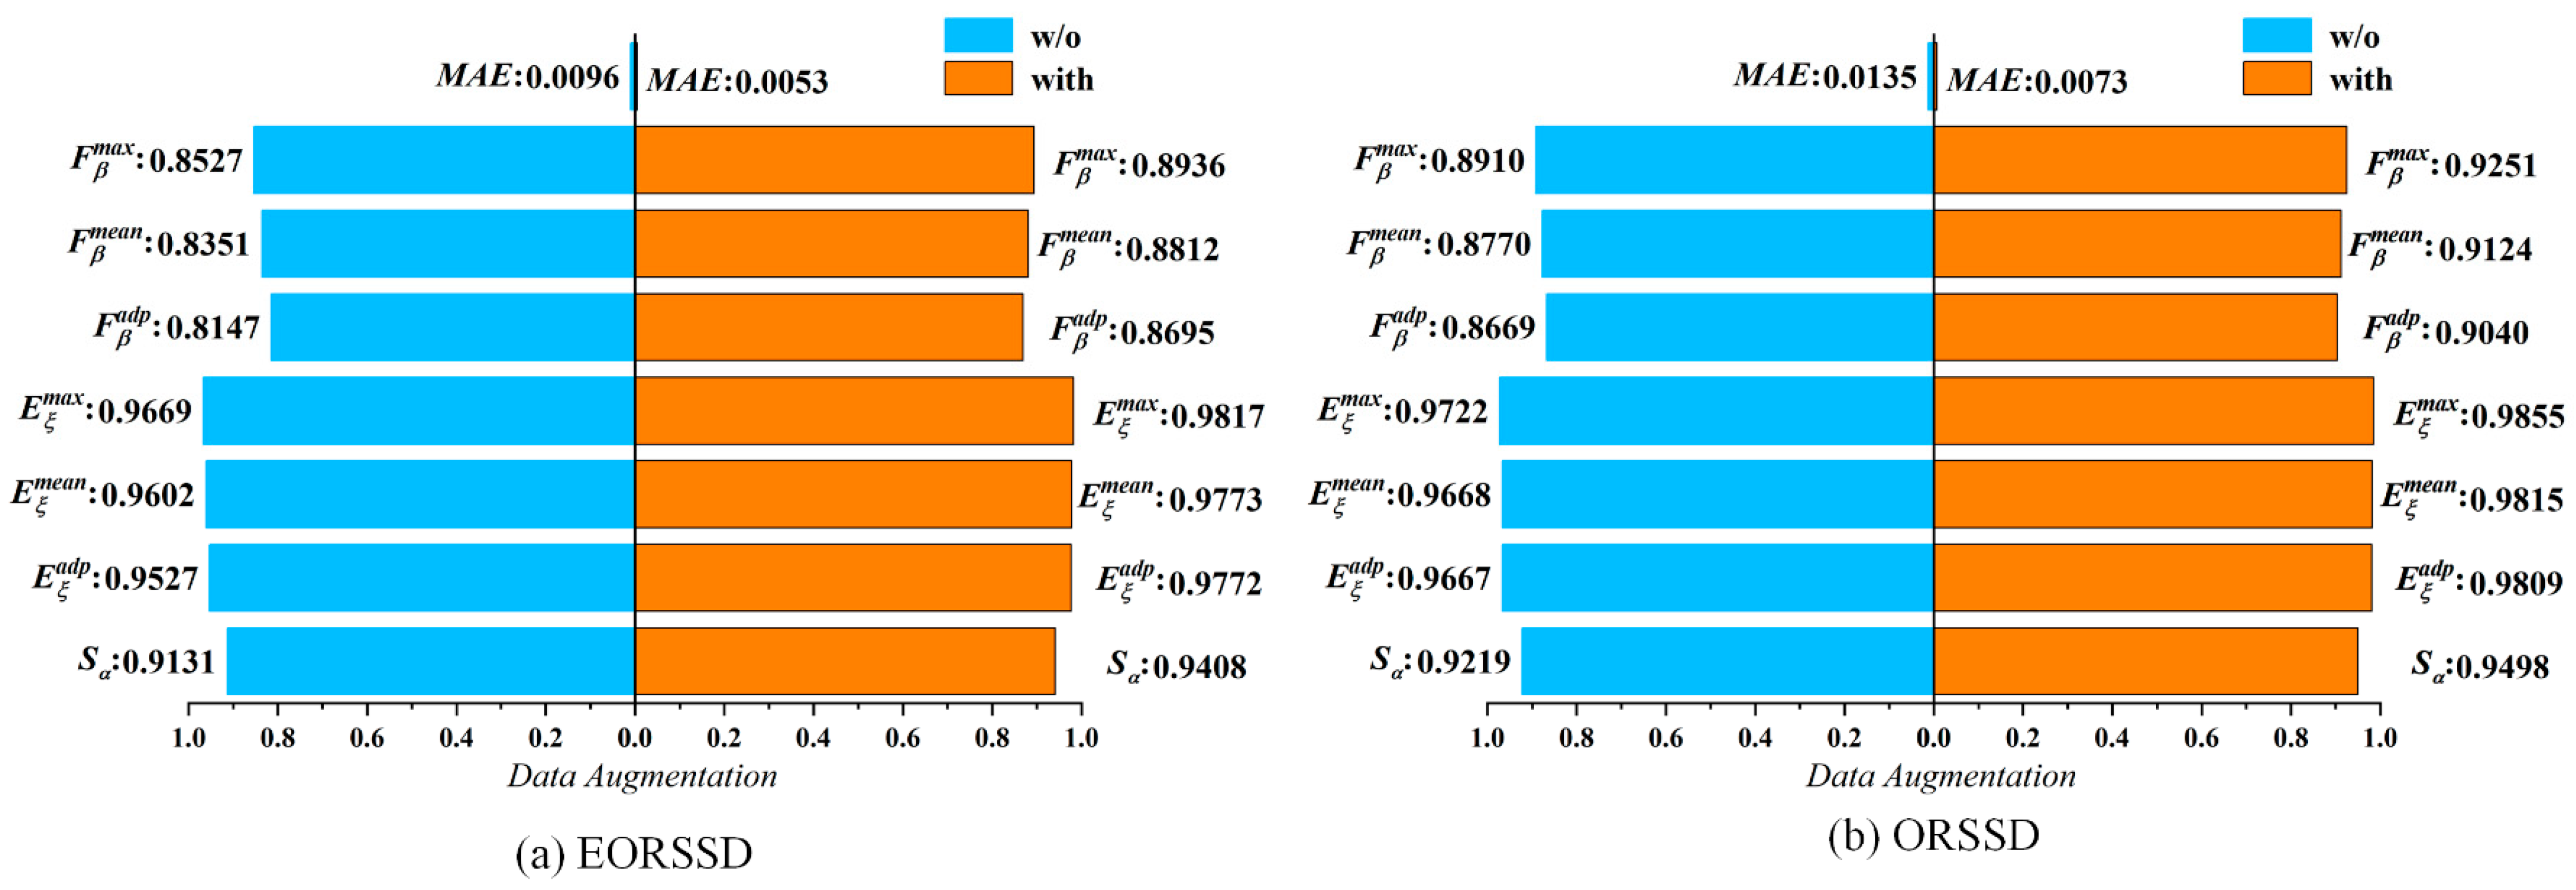
4.1. Effect of Date Augmentation Analysis

We used rotation and flipping methods to augment the training samples of EORSSD and ORSSD, significantly increasing the sample number. Rotation and flipping only alter the orientation of objects in the image while preserving the core features and semantic integrity of the original image. This allows the model to learn the diverse representations of targets from different angles and directions, enhancing its robustness in various scenarios and further improving its generalization ability. Specifically, the training images for EORSSD were expanded from 1400 to 11,200, and the training images for ORSSD were expanded from 600 to 4800. To investigate the influence of data augmentation strategies on the detection results of DCPNet, Figure 8 compared the metrics without data augmentation (blue) and with data augmentation (orange).
The data shown in Figure 8 indicates that data augmentation is significantly necessary for improving model performance. On the EORSSD dataset, all metrics show notable improvement after data augmentation. For instance, MAE decreased from 0.0096 to 0.0053, indicating a significant reduction in error; S α increased from 0.9131 to 0.9408, indicating an enhanced overall ability of the model to recognize salient features; F β m a x increased from 0.8527 to 0.8936, demonstrating a significant improvement in detection accuracy; E ξ m a x increased from 0.9669 to 0.9871, further proving that the model’s ability to capture significant target details is enhanced. Similarly, on the ORSSD dataset, data augmentation brought significant performance improvements. In summary, data augmentation plays an essential role in improving the performance, detection accuracy, and stability of the DCPNet model. By augmenting the data, we can sufficiently increase the sample amount, thereby enhancing the overall performance of the model.

4.2. Model Parameter Analysis

We conducted a comparative analysis of the complexity of multiple models, evaluating them using the Params and FLOPs metrics, with the results shown in Table 5.
As seen in Table 5, our method had more parameters than all models except ACCoNet, indicating that, while ours performs exceptionally well in terms of accuracy, there is still room for improvement in terms of lightweight optimization. In the future, we will consider incorporating techniques such as pruning to further optimize the model’s parameter size and computational efficiency.

5. Conclusions

We designed a Dual-Stream Feature Collaboration Perception Network (DCPNet) based on Transformer–CNN to address the issue where a single branch cannot fully extract salient objects in complex environments. The design concept of DCPNet is to combine the strengths of Transformer and CNN, enabling the modeling of global relationships while capturing local fine-grained representations, thus enhancing the detection capability for salient objects. First, we simultaneously modeled global relationships and captured local biases through Transformer, which has long-distance dependency characteristics, and CNN, which has a strong local bias. This dual strategy ensures that the model can understand global structures while focusing on local details when handling large-scale scenes. Next, during the feature extraction stage, we employed a Multi-path Complementary-aware Interaction Module (MCIM) to achieve feature alignment and interaction between the dual branches. The MCIM guided local feature perception through global semantics and supplements the weak parts of global semantics with local details, thereby promoting deep fusion of dual-branch features. Finally, to prevent an excess of global features from leading to insufficient capture of foreground details or an excess of local features from leading to inadequate understanding of background information during dual-branch feature complementation, we adopted a Feature Weighting Balance Module (FWBM) to balance the foreground and background features of salient regions. The FWBM integrated global context and local detail information, employing self-attention and feature re-weighting strategies to refine and enhance features in different regions. In summary, DCPNet performed excellently across multiple benchmark datasets, achieving breakthroughs in SOD and demonstrating outstanding performance and broad application potential in complex environments.
We found that dataset scale is crucial for model training, so future research will focus on exploring semi-supervised learning to reduce reliance on large amounts of labeled data. In addition, although DCPNet is currently used for significant object detection in remote sensing images, it is essentially a binary segmentation task. Similar tasks also exist in the fields of medical and natural images. We can consider extending DCPNet to other areas. For instance, DCPNet can be applied to segment important organs or lesions in medical images, helping to improve diagnostic accuracy. Likewise, in natural images, DCPNet can also be used to detect and segment key objects.

Author Contributions

Conceptualization, H.L., X.C., W.Y. and L.M.; methodology, L.M.; software, X.C.; validation, X.C. and L.M.; formal analysis, W.Y.; investigation, X.C.; data curation, H.L.; writing—original draft preparation, X.C.; writing—review and editing, L.M.; visualization, H.L.; supervision, W.Y., L.M. and H.L.; project administration, W.Y.; funding acquisition, H.L., L.M. and W.Y. All authors have read and agreed to the published version of the manuscript.

Funding

This research was funded by the Open Research Fund Program of LIESMARS (Grant No. 21E02); the Hubei Key Laboratory of Intelligent Robot (Wuhan Institute of Technology) of China (HBIRL 202113); the Hubei Province Young Science and Technology Talent Morning Hight Lift Project (202319); the University Student Innovation and Entrepreneurship Training Program Project (202210500028); the Doctoral Starting Up Foundation of Hubei University of Technology (XJ2023007301); the Science and Technology Research Project of Education Department of Hubei Province (B2023362); the Excellent Young and Middle aged Science and Technology Innovation Team Project for Higher Education Institutions of Hubei Province (T2023045).

Data Availability Statement

Data are contained within the article.

Conflicts of Interest

The authors declare no conflicts of interest.

References

  1. Zhao, J.; Jia, Y.; Ma, L.; Yu, L. Recurrent Adaptive Graph Reasoning Network with Region and Boundary Interaction for Salient Object Detection in Optical Remote Sensing Images. IEEE Trans. Geosci. Remote Sens. 2024, 62, 5630720. [Google Scholar] [CrossRef]
  2. Wang, W.; Lai, Q.; Fu, H.; Shen, J.; Ling, H.; Yang, R. Salient object detection in the deep learning era: An in-depth survey. IEEE Trans. Pattern Anal. Mach. Intell. 2021, 44, 3239–3259. [Google Scholar] [CrossRef]
  3. Di, L.; Zhang, B.; Wang, Y. Multiscale and Multidimensional Weighted Network for Salient Object Detection in Optical Remote Sensing Images. IEEE Trans. Geosci. Remote Sens. 2024, 62, 5625114. [Google Scholar] [CrossRef]
  4. Wellmann, T.; Lausch, A.; Andersson, E.; Knapp, S.; Cortinovis, C.; Jache, J.; Scheuer, S.; Kremer, P.; Mascarenhas, A.; Kraemer, R. Remote sensing in urban planning: Contributions towards ecologically sound policies? Landsc. Urban Plan. 2020, 204, 103921. [Google Scholar] [CrossRef]
  5. Mei, L.; Ye, Z.; Xu, C.; Wang, H.; Wang, Y.; Lei, C.; Yang, W.; Li, Y. SCD-SAM: Adapting Segment Anything Model for Semantic Change Detection in Remote Sensing Imagery. IEEE Trans. Geosci. Remote Sens. 2024, 62, 5626713. [Google Scholar] [CrossRef]
  6. Sun, L.; Wang, Q.; Chen, Y.; Zheng, Y.; Wu, Z.; Fu, L.; Jeon, B. CRNet: Channel-Enhanced Remodeling-Based Network for Salient Object Detection in Optical Remote Sensing Images. IEEE Trans. Geosci. Remote Sens. 2023, 61, 5618314. [Google Scholar] [CrossRef]
  7. Cong, R.; Zhang, Y.; Fang, L.; Li, J.; Zhao, Y.; Kwong, S. RRNet: Relational reasoning network with parallel multiscale attention for salient object detection in optical remote sensing images. IEEE Trans. Geosci. Remote Sens. 2021, 60, 5613311. [Google Scholar] [CrossRef]
  8. Huang, M.; Gong, D.; Zhang, L.; Lin, H.; Chen, Y.; Zhu, D.; Xiao, C.; Altan, O. Spatiotemporal dynamics and forecasting of ecological security pattern under the consideration of protecting habitat: A case study of the Poyang Lake ecoregion. Int. J. Digit. Earth 2024, 17, 2376277. [Google Scholar] [CrossRef]
  9. Fu, Y.; Huang, M.; Gong, D.; Lin, H.; Fan, Y.; Du, W. Dynamic simulation and prediction of carbon storage based on land use/land cover change from 2000 to 2040: A case study of the Nanchang urban agglomeration. Remote Sens. 2023, 15, 4645. [Google Scholar] [CrossRef]
  10. Prokop, K.; Polap, D. Image segmentation enhanced by heuristic assistance for retinal vessels case. In Proceedings of the 2024 IEEE Congress on Evolutionary Computation (CEC), Yokohama, Japan, 30 June–5 July 2024; pp. 1–6. [Google Scholar]
  11. Wang, X.; Liu, Z.; Liesaputra, V.; Huang, Z. Feature specific progressive improvement for salient object detection. Pattern Recognit. 2024, 147, 110085. [Google Scholar] [CrossRef]
  12. Yi, Y.; Zhang, N.; Zhou, W.; Shi, Y.; Xie, G.; Wang, J. GPONet: A two-stream gated progressive optimization network for salient object detection. Pattern Recognit. 2024, 150, 110330. [Google Scholar] [CrossRef]
  13. Zhou, S.; Feng, Y.; Li, S.; Zheng, D.; Fang, F.; Liu, Y.; Wan, B. DSM-assisted unsupervised domain adaptive network for semantic segmentation of remote sensing imagery. IEEE Trans. Geosci. Remote Sens. 2023, 61, 5608216. [Google Scholar] [CrossRef]
  14. Bai, Z.; Liu, Z.; Li, G.; Wang, Y. Adaptive group-wise consistency network for co-saliency detection. IEEE Trans. Multimed. 2021, 25, 764–776. [Google Scholar] [CrossRef]
  15. Cong, R.; Qin, Q.; Zhang, C.; Jiang, Q.; Wang, S.; Zhao, Y.; Kwong, S. A weakly supervised learning framework for salient object detection via hybrid labels. IEEE Trans. Circuits Syst. Video Technol. 2022, 33, 534–548. [Google Scholar] [CrossRef]
  16. Wang, K.; Tu, Z.; Li, C.; Zhang, C.; Luo, B. Learning Adaptive Fusion Bank for Multi-modal Salient Object Detection. IEEE Trans. Circuits Syst. Video Technol. 2024, 34, 7344–7358. [Google Scholar] [CrossRef]
  17. Ma, L.; Luo, X.; Hong, H.; Zhang, Y.; Wang, L.; Wu, J. Scribble-attention hierarchical network for weakly supervised salient object detection in optical remote sensing images. Appl. Intell. 2023, 53, 12999–13017. [Google Scholar] [CrossRef]
  18. Luo, H.; Liang, B. Semantic-Edge Interactive Network for Salient Object Detection in Optical Remote Sensing Images. IEEE J. Sel. Top. Appl. Earth Obs. Remote Sens. 2023, 16, 6980–6994. [Google Scholar] [CrossRef]
  19. Quan, Y.; Xu, H.; Wang, R.; Guan, Q.; Zheng, J. ORSI Salient Object Detection via Progressive Semantic Flow and Uncertainty-aware Refinement. IEEE Trans. Geosci. Remote Sens. 2024, 62, 5608013. [Google Scholar] [CrossRef]
  20. Huang, K.; Li, N.; Huang, J.; Tian, C. Exploiting Memory-based Cross-Image Contexts for Salient Object Detection in Optical Remote Sensing Images. IEEE Trans. Geosci. Remote Sens. 2024, 62, 5614615. [Google Scholar] [CrossRef]
  21. Li, G.; Liu, Z.; Zhang, X.; Lin, W. Lightweight salient object detection in optical remote-sensing images via semantic matching and edge alignment. IEEE Trans. Geosci. Remote Sens. 2023, 61, 5601111. [Google Scholar] [CrossRef]
  22. Gong, A.; Nie, J.; Niu, C.; Yu, Y.; Li, J.; Guo, L. Edge and Skeleton Guidance Network for Salient Object Detection in Optical Remote Sensing Images. IEEE Trans. Circuits Syst. Video Technol. 2023, 33, 7109–7120. [Google Scholar] [CrossRef]
  23. Vaswani, A.; Shazeer, N.; Parmar, N.; Uszkoreit, J.; Jones, L.; Gomez, A.N.; Kaiser, Ł.; Polosukhin, I. Attention is all you need. Adv. Neural Inf. Process. Syst. 2017, 30, 1–11. [Google Scholar]
  24. Dosovitskiy, A.; Beyer, L.; Kolesnikov, A.; Weissenborn, D.; Zhai, X.; Unterthiner, T.; Dehghani, M.; Minderer, M.; Heigold, G.; Gelly, S. An image is worth 16 × 16 words: Transformers for image recognition at scale. arXiv 2020, arXiv:2010.11929. [Google Scholar]
  25. Liu, Z.; Lin, Y.; Cao, Y.; Hu, H.; Wei, Y.; Zhang, Z.; Lin, S.; Guo, B. Swin transformer: Hierarchical vision transformer using shifted windows. In Proceedings of the IEEE/CVF International Conference on Computer Vision, Montreal, BC, Canada, 11–17 October 2021; pp. 10012–10022. [Google Scholar]
  26. Liu, N.; Zhang, N.; Wan, K.; Shao, L.; Han, J. Visual saliency transformer. In Proceedings of the IEEE/CVF International Conference on Computer Vision, Montreal, BC, Canada, 11–17 October 2021; pp. 4722–4732. [Google Scholar]
  27. Gao, L.; Liu, B.; Fu, P.; Xu, M. Adaptive spatial tokenization transformer for salient object detection in optical remote sensing images. IEEE Trans. Geosci. Remote Sens. 2023, 61, 5602915. [Google Scholar] [CrossRef]
  28. Li, G.; Bai, Z.; Liu, Z.; Zhang, X.; Ling, H. Salient Object Detection in Optical Remote Sensing Images Driven by Transformer. IEEE Trans. Image Process. 2023, 32, 5257–5269. [Google Scholar] [CrossRef]
  29. Liu, K.; Zhang, B.; Lu, J.; Yan, H. Towards Integrity and Detail with Ensemble Learning for Salient Object Detection in Optical Remote Sensing Images. IEEE Trans. Geosci. Remote Sens. 2024, 62, 5624615. [Google Scholar] [CrossRef]
  30. Dong, P.; Wang, B.; Cong, R.; Sun, H.-H.; Li, C. Transformer with large convolution kernel decoder network for salient object detection in optical remote sensing images. Comput. Vis. Image Underst. 2024, 240, 103917. [Google Scholar] [CrossRef]
  31. Yan, R.; Yan, L.; Geng, G.; Cao, Y.; Zhou, P.; Meng, Y. ASNet: Adaptive Semantic Network Based on Transformer-CNN for Salient Object Detection in Optical Remote Sensing Images. IEEE Trans. Geosci. Remote Sens. 2024, 62, 5608716. [Google Scholar] [CrossRef]
  32. Li, K.; Wang, Y.; Zhang, J.; Gao, P.; Song, G.; Liu, Y.; Li, H.; Qiao, Y. Uniformer: Unifying convolution and self-attention for visual recognition. IEEE Trans. Pattern Anal. Mach. Intell. 2023, 45, 12581–12600. [Google Scholar] [CrossRef]
  33. Li, Y.; Yuan, G.; Wen, Y.; Hu, J.; Evangelidis, G.; Tulyakov, S.; Wang, Y.; Ren, J. Efficientformer: Vision transformers at mobilenet speed. Adv. Neural Inf. Process. Syst. 2022, 35, 12934–12949. [Google Scholar]
  34. Li, J.; Xia, X.; Li, W.; Li, H.; Wang, X.; Xiao, X.; Wang, R.; Zheng, M.; Pan, X. Next-vit: Next generation vision transformer for efficient deployment in realistic industrial scenarios. arXiv 2022, arXiv:2207.05501. [Google Scholar]
  35. Wu, H.; Xiao, B.; Codella, N.; Liu, M.; Dai, X.; Yuan, L.; Zhang, L. Cvt: Introducing convolutions to vision transformers. In Proceedings of the IEEE/CVF International Conference on Computer Vision, Montreal, BC, Canada, 11–17 October 2021; pp. 22–31. [Google Scholar]
  36. Liu, J.; Sun, H.; Katto, J. Learned image compression with mixed transformer-cnn architectures. In Proceedings of the IEEE/CVF Conference on Computer Vision and Pattern Recognition, Vancouver, BC, Canada, 17–24 June 2023; pp. 14388–14397. [Google Scholar]
  37. Chen, B.; Zou, X.; Zhang, Y.; Li, J.; Li, K.; Xing, J.; Tao, P. LEFormer: A hybrid CNN-transformer architecture for accurate lake extraction from remote sensing imagery. In Proceedings of the ICASSP 2024—2024 IEEE International Conference on Acoustics, Speech and Signal Processing (ICASSP), Seoul, Republic of Korea, 14–19 April 2024; pp. 5710–5714. [Google Scholar]
  38. Zhao, Z.; Bai, H.; Zhang, J.; Zhang, Y.; Xu, S.; Lin, Z.; Timofte, R.; Van Gool, L. Cddfuse: Correlation-driven dual-branch feature decomposition for multi-modality image fusion. In Proceedings of the IEEE/CVF Conference on Computer Vision and Pattern Recognition, Vancouver, BC, Canada, 17–24 June 2023; pp. 5906–5916. [Google Scholar]
  39. Wang, W.; Xie, E.; Li, X.; Fan, D.-P.; Song, K.; Liang, D.; Lu, T.; Luo, P.; Shao, L. Pvt v2: Improved baselines with pyramid vision transformer. Comput. Vis. Media 2022, 8, 415–424. [Google Scholar] [CrossRef]
  40. He, K.; Zhang, X.; Ren, S.; Sun, J. Deep residual learning for image recognition. In Proceedings of the IEEE Conference on Computer Vision and Pattern Recognition, Las Vegas, NV, USA, 26 June–1 July 2016; pp. 770–778. [Google Scholar]
  41. Li, C.; Cong, R.; Hou, J.; Zhang, S.; Qian, Y.; Kwong, S. Nested network with two-stream pyramid for salient object detection in optical remote sensing images. IEEE Trans. Geosci. Remote Sens. 2019, 57, 9156–9166. [Google Scholar] [CrossRef]
  42. Zhang, Q.; Cong, R.; Li, C.; Cheng, M.-M.; Fang, Y.; Cao, X.; Zhao, Y.; Kwong, S. Dense attention fluid network for salient object detection in optical remote sensing images. IEEE Trans. Image Process. 2020, 30, 1305–1317. [Google Scholar] [CrossRef]
  43. Fan, D.-P.; Cheng, M.-M.; Liu, Y.; Li, T.; Borji, A. Structure-measure: A new way to evaluate foreground maps. In Proceedings of the IEEE International Conference on Computer Vision, Venice, Italy, 22–29 October 2017; pp. 4548–4557. [Google Scholar]
  44. Fan, D.-P.; Gong, C.; Cao, Y.; Ren, B.; Cheng, M.-M.; Borji, A. Enhanced-alignment measure for binary foreground map evaluation. arXiv 2018, arXiv:1805.10421. [Google Scholar]
  45. Achanta, R.; Hemami, S.; Estrada, F.; Susstrunk, S. Frequency-tuned salient region detection. In Proceedings of the 2009 IEEE Conference on Computer Vision and Pattern Recognition, Miami, FL, USA, 20–25 June 2009; pp. 1597–1604. [Google Scholar]
  46. Liu, Y.; Zhang, X.-Y.; Bian, J.-W.; Zhang, L.; Cheng, M.-M. SAMNet: Stereoscopically attentive multi-scale network for lightweight salient object detection. IEEE Trans. Image Process. 2021, 30, 3804–3814. [Google Scholar] [CrossRef]
  47. Liu, Y.; Gu, Y.-C.; Zhang, X.-Y.; Wang, W.; Cheng, M.-M. Lightweight salient object detection via hierarchical visual perception learning. IEEE Trans. Cybern. 2020, 51, 4439–4449. [Google Scholar] [CrossRef]
  48. Lin, Y.; Sun, H.; Liu, N.; Bian, Y.; Cen, J.; Zhou, H. A lightweight multi-scale context network for salient object detection in optical remote sensing images. In Proceedings of the 2022 26th International Conference on Pattern Recognition (ICPR), Montreal, QC, Canada, 21–25 August 2022; pp. 238–244. [Google Scholar]
  49. Tu, Z.; Wang, C.; Li, C.; Fan, M.; Zhao, H.; Luo, B. ORSI salient object detection via multiscale joint region and boundary model. IEEE Trans. Geosci. Remote Sens. 2021, 60, 5607913. [Google Scholar] [CrossRef]
  50. Li, X.; Xu, Y.; Ma, L.; Huang, Z.; Yuan, H. Progressive attention-based feature recovery with scribble supervision for saliency detection in optical remote sensing image. IEEE Trans. Geosci. Remote Sens. 2022, 60, 5631212. [Google Scholar] [CrossRef]
  51. Li, G.; Liu, Z.; Bai, Z.; Lin, W.; Ling, H. Lightweight Salient Object Detection in Optical Remote Sensing Images via Feature Correlation. IEEE Trans. Geosci. Remote Sens. 2022, 60, 5617712. [Google Scholar] [CrossRef]
  52. Zhou, X.; Shen, K.; Liu, Z.; Gong, C.; Zhang, J.; Yan, C. Edge-Aware Multiscale Feature Integration Network for Salient Object Detection in Optical Remote Sensing Images. IEEE Trans. Geosci. Remote Sens. 2022, 60, 5634819. [Google Scholar] [CrossRef]
  53. Li, G.; Liu, Z.; Lin, W.; Ling, H. Multi-Content Complementation Network for Salient Object Detection in Optical Remote Sensing Images. IEEE Trans. Geosci. Remote Sens. 2022, 60, 5614513. [Google Scholar] [CrossRef]
  54. Li, G.; Liu, Z.; Zeng, D.; Lin, W.; Ling, H. Adjacent Context Coordination Network for Salient Object Detection in Optical Remote Sensing Images. IEEE Trans. Cybern. 2023, 53, 526–538. [Google Scholar] [CrossRef] [PubMed]
  55. Zeng, X.; Xu, M.; Hu, Y.; Tang, H.; Hu, Y.; Nie, L. Adaptive Edge-Aware Semantic Interaction Network for Salient Object Detection in Optical Remote Sensing Images. IEEE Trans. Geosci. Remote Sens. 2023, 61, 5617416. [Google Scholar] [CrossRef]
  56. Zhou, X.; Shen, K.; Weng, L.; Cong, R.; Zheng, B.; Zhang, J.; Yan, C. Edge-Guided Recurrent Positioning Network for Salient Object Detection in Optical Remote Sensing Images. IEEE Trans. Cybern. 2023, 53, 539–552. [Google Scholar] [CrossRef]
  57. Zhao, J.; Jia, Y.; Ma, L.; Yu, L. Adaptive Dual-Stream Sparse Transformer Network for Salient Object Detection in Optical Remote Sensing Images. IEEE J. Sel. Top. Appl. Earth Obs. Remote Sens. 2024, 17, 5173–5192. [Google Scholar] [CrossRef]
  58. Zhuge, M.; Fan, D.-P.; Liu, N.; Zhang, D.; Xu, D.; Shao, L. Salient object detection via integrity learning. IEEE Trans. Pattern Anal. Mach. Intell. 2022, 45, 3738–3752. [Google Scholar] [CrossRef]
  59. Wang, Q.; Liu, Y.; Xiong, Z.; Yuan, Y. Hybrid feature aligned network for salient object detection in optical remote sensing imagery. IEEE Trans. Geosci. Remote Sens. 2022, 60, 5624915. [Google Scholar] [CrossRef]
Figure 1. The network framework of DCPNet. DCPNet adopted a classic encoder–decoder architecture comprising a dual-stream feature extractor, Multi-path Complementary-aware Interaction Module (MCIM), Feature Weighting Balance Module (FWBM), and a decoder. Below, we detail the functionality of each component.
Electronics 13 03755 g001
Figure 2. Architecture of the MCIM. MCIM used spatial interaction on low-level feature maps and channel interaction on high-level feature maps.
Electronics 13 03755 g002
Figure 3. Structure diagram of FWBW. The blue feature map represents features from the global branch, and the red one represents features from the local branch.
Electronics 13 03755 g003
Figure 4. The results of visualization comparison between ours and other methods in different scenarios. Red indicates false positives, and blue indicates false negatives.
Electronics 13 03755 g004
Figure 5. Comparison of PR curve (a,c) and F-measure (b,d) curve on two datasets.
Electronics 13 03755 g005
Figure 6. Box chart visual comparison of eight metrics obtained from 600 test samples of EORSSD. (ah) represent the box diagram distribution on 8 metrics respectively.
Electronics 13 03755 g006
Figure 7. Feature visualization at different stages.
Electronics 13 03755 g007
Figure 8. Comparison of EORSSD (a) and ORSSD (b) with and without data augmentation.
Electronics 13 03755 g008
Table 1. Quantitative comparisons with competitive SOD methods on EORSSD dataset.
MethodsEORSSD [42]
S α M A E E ξ a d p E ξ m e a n E ξ m a x F β a d p F β m e a n F β m a x
CNN-based SOD methods
SAMNet0.86220.01320.82840.87000.94210.61140.72140.7813
HVPNet0.87340.01100.82700.87210.94820.62020.73770.8036
DAFNet0.91660.00600.84430.92900.98590.64230.78420.8612
MSCNet0.90710.00900.93290.95510.96890.75530.81510.8539
MJRBM0.91970.00990.88970.93500.96460.70660.82390.8656
PAFR0.89270.01190.89590.92100.94900.71230.79610.8260
CorrNet0.92890.00830.95930.96460.96960.83110.86200.8778
EMFINet0.93190.00750.95000.95980.97120.80360.85050.8742
MCCNet0.93270.00660.95380.96850.97550.81370.86040.8904
ACCoNet0.9290.00740.94500.96530.97270.79690.85520.8837
AESINet0.93580.00790.94620.96360.97510.79230.85240.8838
ERPNet0.92100.00890.92280.94010.96030.75540.83040.8632
ADSTNet0.93110.00650.96810.97090.97690.85320.87160.8804
SFANet0.93490.00580.96690.97260.97690.84920.86800.8833
Transformer-based SOD methods
VST0.92080.00670.89410.94420.97430.70890.82630.8716
ICON0.91850.00730.94970.96190.96870.80650.83710.8622
HFANet0.93800.00700.96440.96790.97400.83650.86810.8876
TLCKDNet0.93500.00560.95140.96610.97880.79690.85350.8843
CNN–Transformer-based SOD methods
ASNet0.93450.00550.97480.97450.97830.86720.87700.8959
Ours0.94080.00530.97720.97730.98170.86950.88120.8936
The best result is highlighted in red, and the second-best is indicated in blue.
Table 2. Quantitative comparisons with competitive SOD methods on ORSSD dataset.
MethodsORSSD [41]
S α M A E E ξ a d p E ξ m e a n E ξ m a x F β a d p F β m e a n F β m a x
CNN-based SOD methods
SAMNet0.87610.02170.86560.88180.94780.68430.75310.8137
HVPNet0.86100.02250.84710.87170.93200.67260.73960.7938
DAFNet0.91910.01130.93600.95390.97710.78760.85110.8928
MSCNet0.92270.01290.95840.96530.97540.83500.86760.8927
MJRBM0.92040.01630.93280.94150.96230.80220.85660.8842
PAFR0.89380.02110.93150.92680.94670.80250.82750.8438
CorrNet0.9380.00980.97210.97460.9790.88750.90020.9129
EMFINet0.94320.00950.97150.97260.98130.87970.90000.9155
MCCNet0.94370.00870.97350.97580.98000.89570.90540.9155
ACCoNet0.94370.00880.97210.97540.97960.88060.89710.9149
AESINet0.94600.00860.97070.97470.98280.86660.89860.9183
ERPNet0.92540.01350.95200.85660.97100.83560.87450.8974
ADSTNet0.93790.00860.97850.97400.98070.89790.90420.9124
SFANet0.94530.00700.97650.97890.98300.89840.90630.9192
Transformer-based SOD methods
VST0.93650.00940.94660.96210.98100.82620.88170.9095
ICON0.92560.01160.95540.96370.97040.84440.86710.8939
HFANet0.93990.00920.97220.97120.97700.88190.89810.9112
TLCKDNet0.94210.00820.96960.97100.97940.87190.89470.9114
CNN–Transformer-based SOD methods
ASNet0.94410.00810.97950.97640.98030.89860.90720.9172
Ours0.94980.00730.98090.98150.98550.90400.91240.9251
The best result is highlighted in red, and the second-best is indicated in blue.
Table 3. The contribution degree analysis of each module. The best one in each column is shown in bold.
No.MethodEORSSD [42]
S α F β a d p F β m e a n F β max
1Baseline0.93460.85450.86750.8826
2Baseline + MCIM0.93870.85840.87490.8912
3Baseline + FWBM0.94010.86480.87830.8932
4DCPNet0.94080.86950.88120.8936
Table 4. Analysis of feature interaction strategies. The best one in each column is shown in bold.
No.Interaction Method S α E ξ max F β max
1DCPNet (MCIM)0.93870.98160.8912
2MCIM w/, Spatial Interaction0.93640.97800.8857
3MCIM w/, Channel Interaction0.93730.97870.8868
Table 5. Analysis of the computational efficiency of various methods.
MethodsParams (M)FLOPs (G)
CorrNet4.08621.379
EMFINet95.086176
MCCNet67.652114
ACCoNet12750.422
ERPNet77.195171
GeleNet25.4536.43
Ours99.31120.524
Disclaimer/Publisher’s Note: The statements, opinions and data contained in all publications are solely those of the individual author(s) and contributor(s) and not of MDPI and/or the editor(s). MDPI and/or the editor(s) disclaim responsibility for any injury to people or property resulting from any ideas, methods, instructions or products referred to in the content.

