Abstract
Anger impairs a driver’s control and risk assessment abilities, heightening traffic accident risks. Constructing a multimodal dataset during driving tasks is crucial for accurate anger recognition. This study developed a multimodal physiological -vehicle driving dataset (DPV-MFD) based on drivers’ self-reported anger during simulated driving tasks. In Experiment 1, responses from 624 participants to anger-inducing videos and driving scenarios were collected via questionnaires to select appropriate materials. In Experiments 2 and 3, multimodal dynamic data and self-reported SAM emotion ratings were collected during simulated and real-vehicle tasks, capturing physiological and vehicle responses in neutral and anger states. Spearman’s correlation coefficient analysis validated the DPV-MFD’s effectiveness and explored the relationships between multimodal data and emotional dimensions. The CNN-LSTM deep learning network was used to assess the emotion recognition performance of the DPV-MFD across different time windows, and its applicability in real-world driving scenarios was validated. Compared to using EEG data alone, integrating multimodal data significantly improved anger recognition accuracy, with accuracy and F1 scores rising by 4.49% and 9.14%, respectively. Additionally, real-vehicle data closely matched simulated data, confirming the dataset’s effectiveness for real-world applications. This research is pivotal for advancing emotion-aware human–machine- interaction and intelligent transportation systems.
1. Introduction
Emotion is an individual’s subjective experience and internal response to specific situations or events, characterized by emotional, physiological, and behavioral components. Emotions guide individuals by focusing attention on critical environmental features, helping adjust decision-making and responses. Driving behavior results from complex interactions among human, vehicle, road, and environmental factors, involving a continuous “perception–-judgment–-decision” loop that directly affects vehicle safety. In [1], research has demonstrated that drivers experiencing anger exhibit an increased frequency of behaviors such as lane changing, braking, honking, and accelerating, which are often accompanied by aggressive driving and verbal abuse of other drivers. These behaviors reduce attention and increase driving errors. In 2019, the National Highway Traffic Safety Administration (NHTSA) [2] reported that 1.3 million people die annually in road accidents worldwide, with over 1500 deaths and 50,000 injuries linked to driving-related anger. Consequently, reducing accident risks from negative driver emotions has become a major research focus in fields like cognitive psychology, neuroscience, automotive engineering, human factors, and affective computing, attracting scholarly attention.
With the advancement of sensing technologies, deep learning, and information technology, intelligent vehicles have evolved into smart mobile terminals capable of delivering various functions and services. This evolution expands the scope of human–machine-interaction. It introduces a novel and challenging area: emotion-aware human–machine-interaction during driving tasks [3]. Specifically, emotion-aware interaction uses multimodal emotion recognition and regulation, allowing driver assistance systems to identify driver emotions. These systems can evaluate the driver’s emotional state in real-time by extracting features such as facial expressions, speech, physiological signals, and driving behaviors. After analyzing emotional expressions, the system provides emotional regulation strategies, enhancing driver-vehicle interaction. Consequently, developing a robust mechanism for accurate and timely recognition of driver anger is crucial for promptly identifying potential traffic risks. This allows timely psychological interventions via brain-machine or human–machine-systems. It is noteworthy that multimodal information fusion technology is a critical step toward advancing artificial intelligence to emotional intelligence, enhancing the computer’s capacity for emotional and expressive abilities. Among these, the collection and processing of multimodal datasets are fundamental for accurately recognizing emotions during driving tasks. Using relevant, reliable, and distinctive emotion labels to represent multimodal information is essential for effectively detecting negative emotions during driving.
1.1. Limitations of Existing Driving Emotion Datasets
Researchers require rich and reproducible datasets to investigate emotional changes and decision-making processes during driving tasks. However, current driving emotion datasets have several limitations. Primarily, the evocation of emotions in these datasets often relies on single-method approaches, leading to unresolved issues regarding the accuracy of evaluating how effectively target emotions are evoked in participants. Individual differences in responses to emotion evocation techniques can be significant, and maintaining the continuity of these evoked emotional states is challenging. Additionally, datasets based on facial expressions or eye movements often rely on external cameras to capture facial features. The data collection process is sensitive to external factors like lighting conditions, illumination changes, and vehicle vibrations. These factors can impede the rapid and accurate detection of dynamic facial expressions [4]. Furthermore, physiological signals also contain features relevant to emotion recognition. Research has shown that electroencephalography (EEG) and electrodermal activity (EDA) outperform other physiological signals in understanding and representing emotional states. The development of low-power, high-precision wearable devices has further advanced research in emotion recognition [5]. In dynamic traffic environments, driving behavior reflects the driver’s responses to demands and is an external sign of emotional perception [6]. However, current datasets focus on vehicle dynamics, often ignoring lane offset, which is vital for assessing driver stability, attention, and emotional state. Furthermore, relying solely on driving data to infer emotional state is inadequate, as it fails to differentiate driver errors from vehicle issues [7]. Traditional methods face significant challenges in deeply analyzing the relationship between driving behavior and emotions. When driving behavior data are used independently for recognizing anger, their effectiveness is limited. They are often integrated with other data types in current research to enhance predictive accuracy.
This study addresses a vital issue by integrating physiological signals from wearable devices, vehicle data, and traffic scenarios to create a multimodal dataset for studying driving-related anger. Although driving anger significantly contributes to traffic accidents, existing datasets have not effectively combined these data sources to fully capture drivers’ emotional and behavioral responses in complex traffic environments. Therefore, developing this dataset is crucial for enhancing our understanding of driving anger and improving emotion recognition accuracy in driving contexts.
1.2. Our Contributions
Based on the challenges above, this study addresses these issues by employing a multimodal dataset that integrates both physiological and vehicle driving data of drivers, referred to as the Driving Physiological and Vehicle Data Multimodal Fusion Dataset (DPV-MFD). This dataset is specifically designed to capture the mapping relationships between the physiological responses and driving behavior characteristics of angry drivers, including vehicle driving data collected in simulated driving scenarios, synchronized EEG and EDA signals, and subjective ratings from participants. The DPV-MFD includes both anger and neutral emotional states observed during driving. The experiments show that using multimodal signals greatly enhances the accuracy of recognizing drivers’ anger. The main contributions of this paper are summarized as follows:
- Development of a Procedure for Evoking Driving Anger: We designed a comprehensive procedure to evoke anger. Video clips were used as preliminary evocation material in a driving simulator environment. In contrast, traffic simulation software encoded scenarios as continuous and deep evocation materials during the experiment. This combination effectively evoked anger in participants and established a framework for collecting valid data on their spontaneous expressions of anger;
- Construction of a Simulated Driving Experiment Environment Using a Simulation Platform: We recruited 56 participants of varying ages and driving experiences to collect data on EEG, EDA, vehicle driving behavior (including acceleration, speed, lane offset, and steering wheel angle), and Self-Assessment Manikin (SAM) under both angry and neutral emotional states. This approach enabled the creation of a multimodal dataset capturing drivers’ spontaneous expressions of anger, effectively addressing the scarcity of data for research on driving emotion recognition. Additionally, a real-world driving experiment was designed to collect multi-source data and validate the applicability of the DPV-MFD in real driving environments;
- Preprocessing and Quality Validation of Synchronized Physiological and Vehicle Driving Data in the Multimodal Dataset: We first verified the validity and correlation between the multimodal data and emotion labels across three dimensions. Subsequently, the DPV-MFD was applied to the existing CNN (Convolutional Neural Network-Long Short-Term Memory) deep learning network to evaluate the emotion recognition accuracy of multichannel time series under different time windows. Performance experiments on driving anger recognition were conducted using multimodal information fusion. The experimental results demonstrated that multimodal signal fusion significantly outperformed single-modal signals in recognizing driver emotions, providing a viable direction for future research.
The remainder of this paper is organized as follows. Section 2 reviews related work, including cognitive evaluation methods for driving emotions, emotion evocation techniques using driving simulators, and multimodal driving emotion datasets. Section 3 details the experimental design and data collection methods. Section 4 presents the validity assessment of the constructed multimodal dataset. Section 5 discusses the current study’s limitations and suggests directions for future research. Finally, Section 6 provides a summary of the findings and conclusions of this study.
2. Related Work
This section systematically reviews and analyzes the literature related to the construction and validation of driving emotion datasets. The first part introduces the relevant theories of cognitive evaluation methods for driving emotions. The second part reviews emotion evocation techniques based on driving simulators. The third part summarizes the work conducted on multimodal datasets for driving emotions.
2.1. Cognitive Evaluation Methods for Driving Emotions
Due to the complexity of emotions and differences in participants’ backgrounds, experiences, interpretations, and the varying levels and intensities, it is challenging to categorize different emotions distinctly. As a result, many psychologists have attempted to classify human emotions into different categories. Early theories in the philosophy of mind posited that all emotions could be broadly divided into pleasure and pain [8]. However, more in-depth research on emotions has led to two fundamental perspectives. The first perspective suggests that emotions are discrete, independent entities with distinct structures (such as anger, fear, and happiness). The second perspective argues that emotions can be categorized along relatively simple dimensions based on intensity and duration. Based on these viewpoints, the cognitive evaluation of driving emotions can be approached in two ways. The first approach relies on basic emotion theory and psychological knowledge, using numerical scales to measure emotional levels [9], including methods like the semantic differential scale, the Likert scale, and the emotion wheel. This approach allows participants to self-assess their emotional state quickly. However, the use of verbal descriptors in numerical scales may introduce errors in emotion evaluation due to cultural differences and varying interpretations of language. The second approach uses dimensional theories of emotion and affective design knowledge to develop visual scale representations. This helps reduce cultural and linguistic specificities to some extent [10]. An example of this is the SAM model. The SAM, developed by Bradley and Lang at the Center for Emotion and Attention at the University of Florida, is an emotional self-assessment rating system designed to measure participants’ emotional responses based on the dimensional PAD (pleasure, arousal, dominance) model. The SAM illustrates the levels of pleasure, arousal, and dominance using cartoon figures, as shown in Figure 1. Arousal ranges from inactive to active; valence ranges from unpleasant to pleasant; and dominance ranges from helplessness to power. The specific scoring criteria are shown in Table 1. Previous studies have successfully used the SAM for self-assessment labeling of driving emotions [11], demonstrating high reliability in both validity and consistency. Using images to process emotional experiences minimizes deeper cognitive processing, making graphical self-assessment models more direct in conveying emotions than numerical evaluations in driving tasks. This study intends to use the SAM to label anger evoked during driving and evaluate the effectiveness of emotion evocation across the three dimensions of pleasure, arousal, and dominance.

Figure 1.
Self-Assessment Manikin.

Table 1.
Emotional dimensions rating scale: valence, arousal, and dominance levels.
2.2. Emotion Evocation Techniques Based on Driving Simulators
Evoking emotions in a driving simulator is a crucial technique for studying the mechanisms by which emotions impact driving behavior. Researchers have primarily used two methods for emotion evocation in driving simulators: emotional stimulus materials and proactive traffic scenarios using a traffic coding system. Emotional stimulus materials evoke emotions by presenting audiovisual videos and images of driving scenarios while collecting self-report data from drivers in the simulator. Trick et al. [12] explored the effects of emotional stimuli on driving behavior by presenting emotionally charged images in a simulated driving environment. The results indicated that positive images were positively correlated with improved steering control, while negative images led to decreased accuracy in executing steering commands. Chan et al. [13] investigated the effects of emotional information on driver distraction through a dual-task approach. In their study, a driving simulator was used to present three categories of emotional target words (neutral, positive, and negative), and participants were asked to respond to these words while driving. The findings showed that the valence of emotional words significantly influenced driving performance: positive words caused a prolonged deceleration effect, whereas negative words enhanced memory recall. Overall, emotional information disrupts attention allocation through arousal mechanisms, remarkably increasing risk when faced with high-arousal positive stimuli. Using images or videos related to driving allows researchers to precisely evoke emotion-related emotional responses by controlling variables and setting contextual consistency. However, according to theories of emotion evocation, individuals’ emotional responses to the same visual stimuli can differ greatly. This variability is due to factors such as previous experiences, cognitive appraisals, and individual differences, which influence how emotions are evoked.
Proactive traffic scenarios encoded in driving simulators effectively evoke anger. This method captures the physiological and behavioral responses of drivers under anger. Typical simulated traffic situations include congestion, slow-moving vehicles, sudden braking, and abrupt lane changes, mirroring real-world driving environments. The field of emotion recognition using physiological signals [14,15,16,17] has produced substantial research; however, only a few studies using traffic scenarios to evoke target emotions have achieved notable results. For example, Lisetti et al. [18] successfully evoked emotions such as panic, anger, frustration, and fatigue in participants by setting up a series of triggering events in virtual traffic scenarios, including pedestrians crossing slowly at a crosswalk, large trucks making U-turns, persistent honking from following vehicles, and waiting for crowds of pedestrians to cross the street until stopping again at a red light. Similarly, Katsis et al. [19] explored the physiological characteristics of drivers under different emotional states, such as low stress, high stress, disappointment, frustration, and excitement, by designing various scenarios and sudden events within a driving simulator. However, due to individual differences, the effectiveness of these single-method anger evocation techniques has yet to be fully validated. Cai et al. [20] used vehicle-to-vehicle interactions to evoke emotions like anger or excitement, collected corresponding vehicle driving data, and conducted simulation experiments on driving performance under different emotions using a multi-user driving simulator to explore the relationship between traffic violations and emotional states. Bethge et al. [21] proposed a method for detecting driver emotions based on traffic conditions, weather, and vehicle dynamics, utilizing the V Emotion model, which achieved an accuracy of 71%. To detect driving-related anxiety, Lee et al. [22] designed traffic scenarios to collect multimodal bio signals, including EEG, PPG, EDA, and pupil size. Using a logistic regression model for classification, the highest accuracy for detecting anxiety solely through EEG reached 77.01%. Nasoz et al. [23] introduced a multimodal intelligent vehicle interface to enhance driving safety by detecting driver emotions. Their study collected physiological data such as skin conductance, heart rate, and body temperature through driving simulations. The feelings were analyzed using K-Nearest Neighbors (KNNs), Marquardt Backpropagation (MBP), and Resilient Backpropagation (RBP) algorithms, with RBP achieving the highest classification accuracy of 82.6%. Moreover, some studies have enhanced the immersion and realism of simulators by introducing weather conditions like sunny, rainy, and foggy scenarios in simulated environments [24,25]. Using proactive traffic scenarios in driving simulators to evoke emotions effectively replicates the stressors and emotion-evoking events that drivers might encounter in real-life driving. Thus, it achieves natural emotion evocation and allows for real-time observation of drivers’ responses to dynamic traffic environments. This approach provides a valuable experimental platform for studying the relationship between emotions and driving behavior.
2.3. Multimodal Driving Emotion Datasets
Emotion is a psychophysiological experience that has a complex and intense impact on an individual’s internal experiences and external environment, manifesting in diverse forms. Advances in emotion recognition have facilitated the creation of new databases that include various forms of emotional expression. Commonly used driving emotion datasets typically encompass four modalities:
- Machine vision and image processing studies of facial expressions and body postures;
- Speech text and acoustic recognition studies;
- Parametric studies of vehicle driving status and driver behavior;
- Analyses of EEG signals from the central nervous system and various physiological signals from the autonomic nervous system.
For example, the Database for Emotion Analysis using Physiological Signals (DEAP) developed by Koelstra et al. [26] is specifically designed for analyzing human emotional states. It uses music video material to evoke emotional responses in 32 participants, recording EEG and peripheral physiological signals (such as skin conductance, electrocardiogram, electromyogram, and skin temperature) from 20 participants, along with frontal facial video. The PPB-Emo dataset created by Li et al. [27] evokes emotions in 40 participants using movie clips, covering five emotional states (happiness, sadness, neutral, fear, and disgust). It also records participants’ psychological data, EEG data, and vehicle driving data to study the impact of emotions on driving behavior. Ramanishka et al. [28] used a driving simulator to collect 104 h of driving behavior data, constructing the Honda Research Institute Driving Dataset (HDD) dataset to explore the relationship between traffic scenarios and driving behavior. Ab. Aziz et al. [29] successfully evoked target emotions in 47 Asian participants of different racial backgrounds using 25 visual and auditory stimuli, recording EEG and photoplethysmography (PPG) signals. Nguyen et al. [30] developed a multimodal facial emotion dataset that includes natural and spontaneous visible light and thermal infrared videos, incorporating information on the intensity of emotions. Shafaei et al. [31] collected facial images of drivers and developed an emotion recognition model based on facial images, as well as vehicle driving parameters such as acceleration and steering wheel angle. Table 2 summarizes commonly used driving emotion datasets. However, most of these datasets are established under controlled laboratory conditions, where emotional expressions are not entirely spontaneous. Furthermore, text data are mainly sourced from various website evaluations, which introduces certain limitations in application scenarios. Additionally, most driving emotion datasets are based on relatively short data collection periods, so more in-depth research on the dynamic changes and cumulative effects of emotions during long-duration driving tasks is needed.
Table 2.
Driving emotions dataset.
The literature review above indicates that the SAM focuses more on participants’ sensations and perceptions of emotional responses. This approach has the advantage of capturing subtle variations in different emotions more precisely and offering a user-friendly interface. Since the generation and perception of emotions largely depend on the context’s diversity and complexity, a combined emotion evocation method that integrates video and traffic simulation scenarios is more effective than methods based solely on audiovisual stimuli. This approach more readily encourages participants to express emotions spontaneously [34]. Moreover, there currently needs to be more research on driving emotion datasets based on physiological signals and vehicle driving data. The dynamic relationship between physiological responses and driving behavior remains to be seen, especially concerning datasets specifically dedicated to negative emotions such as anger. A multimodal dataset integrating physiological and vehicle driving data designed explicitly for studying driving anger was created to address this gap. The advantages of this dataset include the following: (1) the collection of physiological signals is unaffected by the driver’s position, providing relatively stable physiological signal data to ensure consistency and reliability; (2) it clearly and directly reflects the correlation between driving behavior and physiological data. The construction of this dataset provides a solid foundation for in-depth research into the mechanisms underlying the impact of driving emotions, particularly anger.
3. Experimental Design and Data Collection Methods
This section provides a detailed overview of the DPV-MFD, including participant selection, emotion stimulus evocation, data collection modules, 3D scene construction, and the overall experimental design. The comprehensive workflow of the experimental design is illustrated in Figure 2. The process of acquiring and validating the multimodal driving anger emotion dataset is divided into 3 stages: (1) Selecting four movie clips and six traffic scenarios or specific events likely to evoke anger through a preliminary questionnaire. These are used as initial emotion evocation and deep emotion evocation materials in the main experiment. (2) Conducting a driving simulation experiment, during which participants’ EEG data, EDA signals, and vehicle driving data are synchronously collected while completing a time-constrained driving task. (3) Conducting real-world driving experiments to compare and analyze participants’ physiological and behavioral differences between simulated and real-world driving and validate the reliability of the DPV-MFD in practical applications.
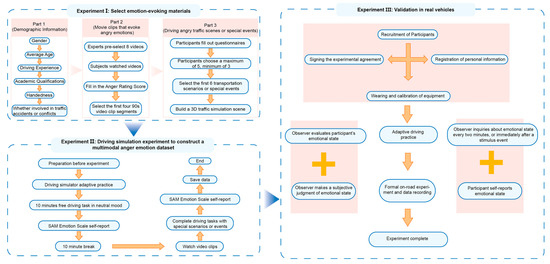
Figure 2.
The overall experimental design process.
3.1. Ethical Statement
All subjects gave their informed consent for inclusion before they participated in the study. The study was conducted in accordance with the Declaration of Helsinki, and the protocol was approved by the Ethics Committee of Northeast Forestry University, China (NEFU-CMEE-2024-0018). Participants were explicitly informed prior to the experiment that the driving simulator might cause discomfort, such as dizziness, and they were given the right to withdraw from the experiment at any time. The experiment was only conducted after each participant signed a written consent form, which explicitly authorized the use of their video data for academic research and related publications.
3.2. Emotion Evocation Analysis
Before the formal experiment began, news analysis and in-depth interviews were used to explore the triggers of driving anger. The news analysis aimed to extract typical scenarios from real-world events that could provoke solid emotional responses [35]. To ensure that the extracted emotion triggers were representative and practical, this study screened high-impact reports or incident records related to road rage from several mainstream news sources, including the websites of the Ministry of Transport of China, China Transportation News, China Road Transport Network, and the Scientific Research Institute of the Ministry of Transport. Using keyword analysis and semantic analysis techniques, we systematically summarized the specific triggers that lead to changes in driver emotions. This analysis identified seven typical emotional change scenarios and triggers, including high-frequency road rage incidents such as disputes in traffic jams, dangerous lane changes, speeding or aggressive overtaking, occupying emergency lanes, changing lanes or turning without signaling, tailgating, and malicious merging. These triggers were a critical basis for discussion during the interview phase and were selected through a questionnaire survey. They were used to evoke anger in the subsequent driving simulation experiments.
In the interview phase, the design of open-ended questions allowed for a comprehensive capture of respondents’ emotional reactions and provided a multidimensional understanding of the triggers of these emotions. This study conducted in-depth interviews with 28 participants, of whom 11 were female (22.22%) and 17 were male (77.78%). The participants ranged from 20 to 53 years, averaging 31.75 (Standard Deviation (SD) = 7.26). Their driving experience varied from 1 to 23 years, averaging 7.48 years (SD = 5.32). Based on the interview guide methodology, the interviews were divided into three groups, each consisting of 8, totaling 24 participants. In addition to the participants, each group interview included one experienced moderator and two note-takers. The interviews focused on three core questions:
- What movie clips have left the strongest impression on you in terms of evoking feelings of anger?
- Which traffic scenarios or specific incidents have you encountered while driving that made you feel slightly or even extremely angry?
- After viewing the road rage-triggering incidents summarized from the news analysis displayed on the large screen, please provide an open-ended response, focusing on the extent to which these incidents evoke anger.
Each participant answered the questions during group interviews lasting about 40 min. All responses were recorded via audio and detailed on-site notes to ensure data completeness and analytical accuracy. After the interviews, all recordings and notes were transcribed verbatim, and a systematic analysis was conducted using Excel files. Initially, the original transcripts from the 28 respondents were split into complete sentences. Then, two researchers with professional knowledge and extensive experience in analyzing and evaluating driver emotions (one male and one female) independently sorted these sentences. Through a consensus process, they identified the movie clips and primary driving scenarios associated with anger emotions mentioned in the sentences. Through this analysis, a total of 8 clips capable of evoking human anger and 10 traffic scenarios or specific incidents likely to trigger driver anger were identified. Based on this, we manually selected 8 corresponding movie audio-visual clips online. The most empathetic segments were chosen by analyzing the “bullet comments” (a scrolling commentary system on videos). Each movie clip was edited down to 90 s to be used in Experiment 2 for the initial evocation of anger in drivers. The 10 traffic scenarios or specific incidents were presented using descriptive language.
3.3. Experiment 1: Selecting Emotion Evocation Materials Using a Questionnaire Survey
Using online questionnaires can effectively overcome the limitations of traditional data collection methods, and previous research has demonstrated the reliability and validity of online tools for assessing driving emotions [36]. Therefore, this study designed and distributed a questionnaire via the professional online survey platform Google Forms (https://forms.google.com (accessed on 8 April 2024)) to select initial emotion evocation materials based on movie clips and deep emotion evocation materials based on traffic simulation 3D scenarios. This platform automatically records participants’ responses, locations, and response times, ensuring accurate and comprehensive data collection.
3.3.1. Experiment 1-Participant Demographic Information
This experiment’s 624 participants completed valid questionnaires, including 393 males and 231 females. The average age of the participants was 35.74 years (SD = 9.28), and the average driving experience was 8.29 years (SD = 4.62). Regarding educational background, 74% of the participants held a bachelor’s degree or higher. Regarding handedness, 92% of the participants were right-handed, while only 8% were left-handed. Additionally, 91% of the participants had experienced a traffic accident or conflict, whereas 9% had not had any such experience.
3.3.2. Experiment 1-Procedure
The online questionnaire was divided into three sections, each targeting different aspects: participants’ demographic information, ratings of anger in movie clips, and selection of driving anger scenarios. Participants were required to complete each section sequentially and provide answers as instructed. The questionnaire was designed for completion in approximately 20 min. It required participants to finish in one continuous session to ensure the continuity of emotional responses and the validity of the data. The specific content of each section is as follows: The first section focused on demographic information, with 6 questions covering gender, age, driving experience, educational background, handedness, and experience with traffic accidents or conflicts (Table 3). The second section required participants to rate movie clips on their ability to evoke anger. Video and audio clips have reliably triggered emotions in human drivers [37]. This section included 8 questions, each corresponding to a 90 s-movie clip. These clips were selected based on the results discussed in Section 3.2. After viewing each clip, participants rated their level of anger on a scale from 1 (not at all angry) to 4 (extremely angry) based on their emotional reaction. This section aimed to quantify participants’ emotional responses to specific stimuli, providing empirical data on the intensity of anger. The third section focused on selecting driving anger scenarios or specific incidents. Based on the survey and interview results from Section 3.2, this section included 10 descriptive questions covering the most frequently mentioned driving anger scenarios or special events. Participants were asked to select the scenarios that most evoked anger, choosing a minimum of 3 and a maximum of 5. This section aimed to capture participants’ perceptions and feelings about driving anger scenarios, revealing which situations are most likely to trigger feelings of anger.
Table 3.
Part 1-participant demographic information.
3.3.3. Evoked Material Selection
Table 3, Table 4 and Table 5 provides a detailed overview of the questionnaire’s design and the survey results for each section. First, based on the ratings from 624 participants regarding the level of anger evocation (Table 4), the study selected the four movie clips that had the highest number of participants rating them as “Extremely angry” to be used as initial anger evocation materials in the driving tasks. The results indicated the following films: “Blind Mountain” (41.18%), “Fist of Fury” (34.93%), “Ding to Survive” (32.69%), and “Caught in the Web” (31.57%). Secondly, Table 5 presents the frequency of scenarios likely to evoke anger among the 624 participants. From the ten traffic scenarios or specific incidents, the study selected the top six most frequently chosen scenarios to serve as deep anger evocation materials in the driving tasks. These six scenarios were as follows:
Table 4.
Part 2-film clips that evoke anger.
Table 5.
Part 3-angry driving scenarios or special event investigations.
- After ensuring that pedestrians are prioritized through the intersection, vehicles start and then face a prolonged red-light signal (65.06%);
- When non-motorized vehicles persistently occupy lanes designated for motorized vehicles (62.02%);
- When pedestrians disregard traffic signals and proceed slowly (58.49%);
- Failure to pass due to randomly parked vehicles not by regulations (51.92%);
- Overloaded traffic flow causes prolonged congestion (50.96%);
- Nearby vehicles intentionally obstructing traffic (47.76%).
Based on the results from this scenario survey, traffic simulation scenarios were constructed using the driving simulator’s simulation software (Section 3.4.3). To enhance participants’ immersion in Experiment 2, the scenarios were designed from the driver’s first-person perspective. Finally, since neutral emotions are more accessible to evoke and maintain than other discrete emotions, according to Palazzi A’s research [38], the neutral emotion was evoked using a musical emotion evocation method. Background music with a steady rhythm, simple melody, and no apparent emotional inclination, such as environmental music featuring natural landscapes, was selected. Table 6 summarizes the emotion evocation materials used in Experiment 2.
Table 6.
Emotionally evocative material.
3.4. Experiment 2: Constructing a Multimodal Anger Emotion Dataset through Driving Simulation
3.4.1. Experiment 2-Participant Demographic Information
In total, 56 healthy volunteers were recruited in Harbin to participate in this experiment. The participants were aged between 20 and 35, with an average age of 24.28 years (SD = 1.58), and all were experienced drivers with 1 to 12 years of actual driving experience. Young drivers exhibit significant behavioral differences when coping with emotional fluctuations and complex traffic scenarios, and they face relatively higher risks of being involved in traffic accidents. Most participants were well-educated, with 87% holding a bachelor’s degree or higher. Their occupations varied, including workers, teachers, students, farmers, office staff, civil servants, and professional drivers. Additionally, 96% of the participants were right-handed, and 93% had experienced a traffic accident or conflict.
All participants held valid driver’s licenses, had a vision of 1.0 or better, were free of color blindness or color weakness, possessed normal cognitive comprehension abilities, had no depressive tendencies, and could accurately express their emotional experiences. None of the participants had a history of perming their hair within the past three months or a history of drug use. In the 48 h prior to the experiment, they had not consumed any stimulants, including but not limited to sedatives, tranquilizers, alcohol, coffee, tea, or cigarettes. All participants were free from cognitive and psychiatric disorders and were instructed to complete the experiment according to their actual driving style. Before the experiment began, participants signed consent forms agreeing to record physiological data, vehicle driving data, and video information during the driving tasks. Additionally, an experienced observer with over 25 years of driving experience and a background in driving instruction was recruited to record participants’ SAM emotion ratings during the experiment. A pre-experiment was conducted before the main experiment, and none of the 56 volunteers reported symptoms of dizziness.
3.4.2. Experimental Environment Setup
The multimodal driving anger emotion data collection system primarily consists of three modules: an EEG signal collection module, an EDA signal collection module, and a vehicle driving data collection module. Figure 3 illustrates the overall setup of the multimodal data collection experiment. The specific details of each module are as follows:
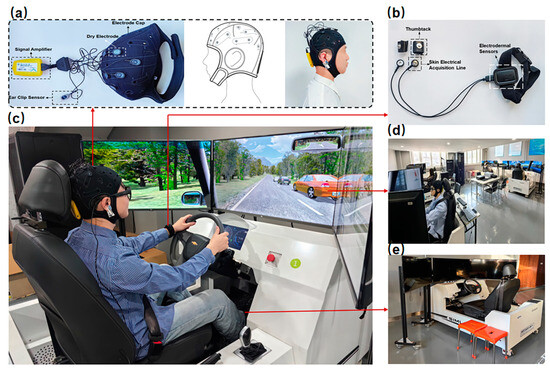
Figure 3.
Experimental setup for multimodal driving anger emotion data collection: (a) EEG signal collection module and EEG headset setup; (b) EDA signal collection module; (c) overall experimental environment; (d) multi-user driving interaction; (e) vehicle driving data collection module for the six degrees of freedom driving simulator.
- (a)
- EEG Signal Collection Module
In this experiment, the Eno-Bio wireless dry electrode EEG system, manufactured by Artinis Medical Systems in the Netherlands, was used to collect EEG signals from drivers under neutral and angry emotional states. This system comprises an electrode cap, a signal amplifier, and data acquisition and analysis software (Figure 3a). The signal acquisition software, Neuroelectrics Instrument Controller (NIC), supports real-time EEG data processing and offers various functionalities, including quick checks, raw data export, data filtering, spectral analysis, and scalp map generation. The electrodes on the EEG cap are positioned according to the standard international 10–20 system, with electrodes selected at CP5, FC5, FC1, FZ, C2, FC2, C1, and C4 (Figure 4a). The alpha (α), beta (β), gamma (γ), delta (δ), and theta (θ) waves from these positions are directly output to a computer for analysis via the NIC 2.0 software. The signal amplifier is an 8-channel direct current (DC) amplifier, Neuroelectrics (NE). To accurately capture the EEG signals under the target emotions, the experiment was set with a sampling frequency of 125 Hz, a wireless transmission rate of 24-bit, and high-pass and low-pass filter thresholds of 0.05 Hz and 50 Hz, respectively. These settings ensure a high signal-to-noise ratio, accurately recording all DC signals while removing artifacts. All electrodes used in this experiment are dry electrodes, and their conductivity can be visualized using the signal acquisition software NIC from the Eno-Bio system (Figure 4b). The signal quality window features an indicator light at the upper left corner of each channel, showing the signal quality: green indicates good conductivity, orange indicates moderate conductivity, and red indicates poor conductivity.
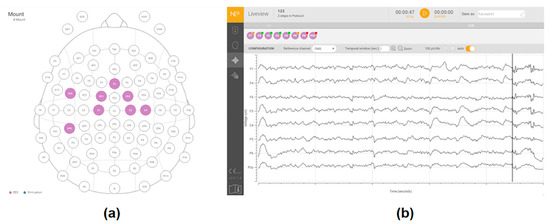
Figure 4.
Eno-Bio wireless EEG system: (a) EEG electrode placement; (b) NIC software for real-time EEG signal acquisition.
- (b)
- EDA Signal Collection Module
A wireless skin conductance device was used during the experiment to collect drivers’ EDA signals. This device comprises a skin conductance sensor, physiological acquisition cables, sensor clips, and finger cuffs (Figure 3b). It measures skin conductance (SC) with a precision of 0.01 µS and a sampling frequency of 64 Hz. EDA is measured by placing two electrodes on the distal phalanges of the middle and index fingers. As sweating increases, the skin’s electrical resistance decreases, typically associated with the physiological responses of individuals experiencing emotions such as stress and anger. The collected EDA signals were processed and analyzed using ErgoLAB 3.0 software to ensure accuracy and consistency in data handling.
- (c)
- Vehicle Driving Data Collection Module
Vehicle driving data were collected using the SIMLAB high-performance driving simulation system at the Traffic Experiment Center of Northeast Forestry University (Figure 3e). This system comprises a driving simulator, a visual simulation system, an audio system, and a traffic scene simulation system, which can comprehensively simulate the road traffic environment and vehicle dynamics encountered during real-world driving. The driving simulator setup includes a steering wheel, gear shifter, accelerator pedal, brake pedal, and clutch, providing drivers with a 270° wide field of view. The visual simulation system uses three flat-panel displays with 180° viewing angles, integrated with SILAB/Road 1.0 software to configure complex traffic environments, such as road obstacles, surrounding vehicles, and varying weather conditions, while simultaneously recording driver behaviors, vehicle dynamics, and road traffic data. The audio system delivers surround sound to simulate the acoustic environment during driving. The dashboard is an LCD screen (1920 × 720 resolution, 60 Hz) that displays speed, Revolutions Per Minute (RPMs), and gear position. During the driving process, data on driver actions, road information, and vehicle dynamics are synchronized in real time with the central control computer for further analysis.
3.4.3. Constructing 3D Traffic Simulation Scenarios
Based on the questionnaire survey results in Table 5, the simulation software was used to construct driving scenarios. The simulated driving environment features a two-way, four-lane urban road with variable traffic flow and a total experimental route length of 15 km, with a speed limit of 60 km/h. In addition to the primary driving scenarios, participants will randomly encounter particular scenarios, such as prolonged traffic light waits, improperly parked vehicles, and traffic congestion. These scenarios include sequences of uncivil driving behaviors, such as non-motorized vehicles occupying motor lanes for extended periods, pedestrians ignoring traffic signals, and surrounding vehicles cutting in or merging unexpectedly, as illustrated in Figure 5. Disruptive behaviors, such as cutting in and lane merging by nearby vehicles, are implemented through interactive driving using a networked multi-user, single-channel driving simulator (Figure 3d). Other vehicles are controlled using a path module trigger system.

Figure 5.
Traffic scenarios or special events based on simulation traffic simulation software: (a) failure to pass due to randomly parked vehicles not by regulations; (b) after ensuring that pedestrians are prioritized through the intersection, vehicles start and then face a prolonged red-light signal; (c) nearby vehicles intentionally obstructing traffic; (d) overloaded traffic flow causes prolonged congestion; (e) persistent occupation of designated motor vehicle lanes by non-motorized vehicles; (f) when pedestrians disregard traffic signals and proceed slowly.
3.4.4. Experiment 2-Procedure
- Experiment Preparation Phase: Before the formal experiment begins, researchers must thoroughly explain the experiment’s requirements and guidelines to the participants, such as the need to complete time-constrained tasks on schedule and prohibition against violating any traffic rules. Participants must also avoid experiencing significant emotional fluctuations within the hour preceding data collection to ensure the accuracy of EEG and EDA data. Participants then complete a demographic questionnaire covering gender, age, driving experience, education level, handedness, and history of traffic conflicts or accidents.
- Experiment Calibration Phase: Participants are fitted with the EEG and EDA devices, followed by equipment calibration and signal stability checks. They then undergo a 5 min-adaptation session with the driving simulator to familiarize themselves with the controls, such as the steering wheel, accelerator, brake, and clutch. After this pre-experiment session, participants sit quietly for 3 min to adjust their emotional and physical state, minimizing the impact of wearing physiological monitoring equipment.
- Control Experiment Phase: Once prepared for driving, participants listen to 5 min of ambient music featuring natural landscapes to calm their minds and ensure a neutral emotional state before the main experiment. They then perform a 10 min-free driving task along a predefined route in a basic scenario involving a two-way, four-lane rural road with scenic surroundings and low traffic flow. During this period, physiological and vehicle driving data are continuously collected for 2 min once the physiological signals stabilize. Upon completing the task, participants report their emotional state and level using the SAM emotion assessment scale and take a 5 min-break.
- Anger Evocation Phase: After resting, the start time for anger evocation is determined based on the participant’s physiological signals. Once the signals stabilize, participants watch a pre-selected 12 min-movie clip to evoke anger as an initial stimulus. After viewing, participants use the SAM emotion activation scale to report their emotional state to the observer objectively. Participants are only allowed to enter the driving simulator if their valence score reaches levels 3 or 4 and their arousal score reaches levels 5 or 6. During the simulated driving task, participants randomly encounter six different traffic scenarios. To maintain anger activation and achieve a more profound evocation, four additional drivers using networked simulators provide interference, such as flashing high beams from oncoming traffic and nearby vehicles cutting in unexpectedly. Each experiment is designed to be completed in about 180 s, during which participants must not violate any traffic rules. When encountering particular scenarios, participants must again objectively report their emotional state and the effectiveness of the evocation to the observer. Simultaneously, the observer assesses the participant’s emotional state based on their driving experience, micro-expressions, body language, breathing patterns, or actions (such as sudden braking, gripping the steering wheel tightly, or hitting the dashboard).
- Experiment Conclusion Phase: At the end of the experiment, SAM emotion activation scales are collected, and questionnaires under the same emotional evocation are categorized. Questionnaires with inconsistent or uncertain emotional responses are excluded, prioritizing those with more substantial evocation effects. The specific process is illustrated in Figure 6.
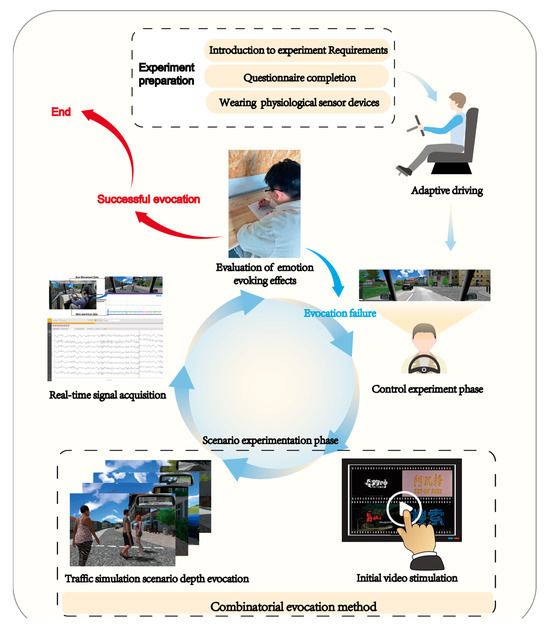 Figure 6. Experimental procedure. (The Chinese in the figure is the name of the movie).
3.4.5. Dataset Content
To ensure that each participant’s emotional evocation does not interfere with others and to guarantee the reliability of the experimental data, this study adopted a sequential approach where each driver underwent the driving simulation individually. Each participant first completed the neutral emotion driving simulation and the anger emotion experiment. The next participant began their simulations only after the previous participant completed both experiments. Each emotional state experiment was repeated 10 times, resulting in 1012 driving simulations. Based on the participants’ SAM emotion assessment scales, 432 questionnaires from the anger-evoked state and 487 sets from the neutral state that met the selection criteria were retained, yielding 919 valid samples. Any data where emotion evocation was unsuccessful were discarded. To ensure the reliability of the data, no data were collected during the first 15 s and the last 15 s of each simulation driving experiment. The samples were segmented every 30 s during the middle 150 s. The experiment yielded 4595 vehicle driving data samples, 4595 EEG data samples, and 4595 EDA data samples, creating a multi-source heterogeneous dataset comprising 13,785 data points. In the data labeling process, samples with anger emotions were labeled as 1, and neutral emotion samples were labeled as 0. Table 7 summarizes the detailed information on the DPV-MFD.
Table 7.
DPV-MFD content.
3.5. Experiment 3: Validation in Real-Vehicle
3.5.1. Real-World Driving Test Overview
To capture the actual emotional states of drivers during driving, a real-world driving experiment was conducted to validate the reliability of the data collected in the simulated tests. The test route was primarily selected in high-traffic areas of Harbin, such as primary and secondary roads in busy commercial districts, as shown in Figure 7. The total route spanned 23 km, with a duration of approximately 40 min. It passed through 35 traffic signal intersections, 47 pedestrian crosswalks, and 3 large commercial areas. The route included sections with varying traffic densities to induce different levels of anger. For this experiment, a 2023 BYD Tang DMI Champion 1.5T model, in good condition, was used as the test vehicle. Three people occupied the vehicle: one driver, an observer responsible for recording, and one researcher for data collection.
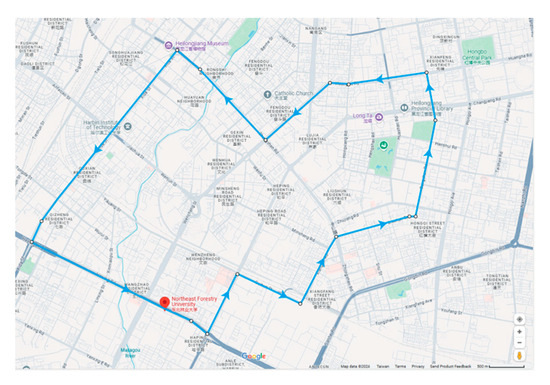
Figure 7.
Real-world driving test route. (Label location names in both Chinese and English).
During the experiment, multimodal data were collected using multiple devices. The 5G onboard unit (OBU) was connected to the vehicle’s OBD interface to collect CAN data at a frequency of 100 Hz. Physiological data collection was conducted using the same equipment as in Experiment 2. An Eno-Bio wireless dry electrode EEG system was used to track the driver’s raw EEG signals during the test, with a sampling frequency of 125 Hz. An Ergo LAB wireless skin conductance system was also employed to record the driver’s skin conductance at a sampling frequency of 64 Hz. The setup for the real-world driving test and the equipment used are shown in Figure 8.
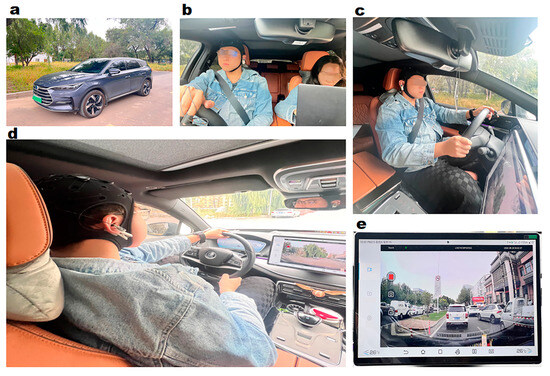
Figure 8.
Schematic of the real-world driving test process: (a) test platform; (b) test recording; (c) instrument setup; (d) in-vehicle behavior; (e) real-time external environment data collection.
3.5.2. Experiment 3-Participant Demographic Information
Twenty drivers were recruited for this experiment, all of whom held valid Chinese driver’s licenses and were in good health. None of the participants had a history of medication use within the past month. They were instructed to abstain from alcohol for 24 h and from stimulant-containing beverages for 12 h prior to the experiment. The demographic information of the participants is shown in Table 8.
Table 8.
Basic demographic information of the participants in Experiment 3.
3.5.3. Experiment 3-Procedure
Before starting the formal test, drivers underwent an adaptation session to familiarize themselves with the vehicle’s characteristics and adjust to a comfortable driving position. Once the formal test began, drivers drove in the world on the pre-determined route. Every two minutes, the observer sitting in the passenger seat inquired about the driver’s current emotional state, and similar to the simulated experiment, the emotional state was assessed using the SAM scale. The observer immediately asked the driver to report their emotional state, particularly during stimuli events, such as pedestrians crossing the road, nearby vehicles cutting in, red light stops, and traffic congestion. Given the inherent and transient nature of driving emotions, immediate verbal reporting was used instead of post-experiment recall questionnaires or video-based self-assessments, which could introduce bias from external interpretations. This method allowed drivers to express their emotional states directly, providing results closer to the emotional truth. It was considered a reliable and valid method for assessing drivers’ anger. The observer also initially judged the driver’s anger level based on their experience, the road environment, and the driver’s tone, facial expressions, or actions.
Throughout the experiment, EEG signals, skin conductance, and vehicle driving data were synchronously collected by corresponding equipment. At the end of the experiment, drivers filled out a post-experiment questionnaire to ensure that emotions other than anger were not affecting the results. The entire in-car audio was recorded via real-time communication equipment, and road rage emotion scores were obtained through the SAM scale and verbal reports. By combining the scale results with specific scenarios or events recorded on video, valid data for each driver’s anger were segmented into multiple 150 s-time windows to align with the simulated experiment data.
In total, 552 data samples were collected during the real-world driving experiment, with 184 samples each for EEG, skin conductance, and vehicle driving data.
3.6. Data Processing
The data collected from the simulated or real-world driving experiments include physiological data from the sensors and vehicle driving data collected by the driving simulation platform or CAN bus, as shown in Table 9.
Table 9.
Types of data collected in the experiment.
The collected signals were processed as follows: Data generated during the familiarization phase at the beginning of the experiment and the removal of equipment after the vehicle stopped at the end were considered invalid and discarded. Since different devices recorded data at varying frequencies, the vehicle driving data with the lowest sampling frequency in the simulated driving experiment were used as the reference timeline. EEG, skin conductance, and CAN data were down sampled to 8 Hz. Data synchronization was achieved by aligning the data using timestamps. After removing invalid samples from both the simulated driving and real-world driving experiments, as outlined in Section 3.4.5 and Section 3.5.3, the remaining data, which are discrete time series, underwent noise reduction processing.
3.6.1. EEG Signal Preprocessing
The preprocessing of the original EEG signals involved several critical steps, including band-pass filtering, data segmentation, and artifact removal.
- Data Segmentation and Filtering: In the driving simulation experiment and the real vehicle experiment, the participants were stimulated by different traffic scenarios, leading to the segmentation of EEG data into multiple epochs, each representing a specific time window. However, EEG signals are susceptible to interference from various noise sources or artifacts, such as eye movements, muscle activity, and electrical power interference. These disturbances can contaminate certain epochs, rendering them unsuitable for subsequent analysis. To address this, a rejection threshold of 75 μV was established for epochs, and a band-pass filter was applied with a frequency range set to [0.5 Hz, 40 Hz] to suppress low-frequency and high-frequency noise effectively;
- Time Window Selection: Based on each marked time point, this study selected a time interval of −0.5 s, 1.5 s corresponding to the filtered data samples of vehicle driving. This time interval served only as a reference for technical validation and was not intended as a mandatory segmentation criterion;
- Data Segmentation and Filtering: the ICA algorithm in MATLAB’s EEGLAB toolbox and recommended standards and typical artifact paradigms (including noticeable eye movement artifacts, muscle motion artifacts, and abnormal electrode artifacts) were used to judge and process the signals comprehensively.
The adequate EEG waveform data extracted from all participants during the experiment are illustrated in Figure 9. The waveforms show that each participant’s EEG signals met the experimental requirements, with no significant anomalies detected in the samples. These data maintain consistency with critical signal quality indicators, artifact control, and the signal-to-noise ratio (SNR) across the sample library.

Figure 9.
The distribution of EEG signals across all eight channels for all samples: each column represents one EEG channel, and each row corresponds to data from a repeated experiment. Each subplot displays the EEG signals of 56 participants across the respective channels. (Each line represents a curve of the participant’s single-channel EEG amplitude over time).
3.6.2. EDA Signal Preprocessing
The raw EDA signals collected during the experiment were single-channel recordings with a sampling rate of 64 Hz. The recorded EDA signals were processed using the Ergo LAB 3.0 system to enhance signal quality and eliminate noise interference. A band-pass filter was applied, with a frequency range between 0.01 Hz and 5 Hz. This filtering process effectively removed low-frequency variations caused by changes in skin temperature or electrode positioning and high-frequency noise outside this range. The resultant EDA waveforms, representing the valid data samples extracted from all experiments, are illustrated in Figure 10.
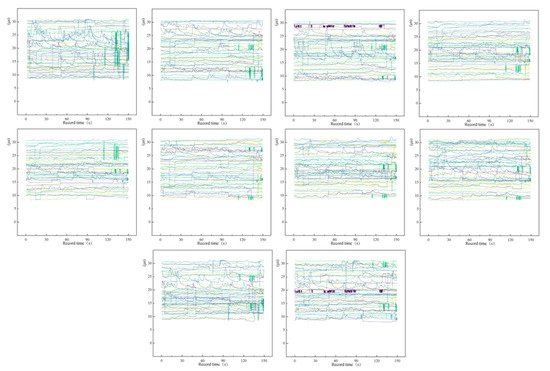
Figure 10.
EDA signals of all samples: each subplot represents data from a repeated experiment. (Each line represents a curve of the participant’s single-channel skin conductance values over time).
3.6.3. Validation of Vehicle Driving Data Quality
The vehicle driving data include four dynamic parameters representing driving behavior: speed, acceleration, steering angle, and lane offset. Figure 11 illustrates the time-series curves of the vehicle driving data recorded across all experiments. The results demonstrate a high degree of consistency in the temporal trends of the vehicle driving data for each driving simulation experiment, ensuring uniformity in participant behavior. This consistency indicates that under the controlled experimental conditions, the driving behavior of different participants within the same traffic simulation scenario was remarkably similar. Consequently, this validates the effectiveness of the acquired data as reliable repeat samples for the four distinct types of driving behavior.
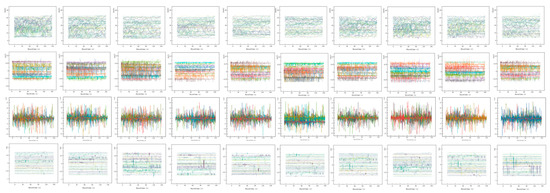
Figure 11.
Vehicle driving data: each column represents the waveform curves of speed, acceleration, steering angle, and lane offset over time, and each row represents data collected from repeated experiments. (Each line represents the curve of speed/acceleration/steering wheel angle/lane offset over time in the participant’s simulated driving experiment).
To eliminate dimensional discrepancies among the data, all data were normalized using the min–max scaling method, transforming the values to a range between 0 and 1, as represented in Equation (1):
represents the normalized physiological signal, denotes the raw physiological signal, is the maximum value of the physiological signal within a specific segment, and is the minimum value within the same segment.
4. Validity Testing of the Multimodal Dataset
4.1. Validity Verification of Emotion Labels
4.1.1. Validity Evaluation of SAM Labels Based on t-SNE Three-Dimensional Clustering
This study used the SAM to measure drivers’ anger during simulated driving tasks, evaluating emotions across three dimensions: valence, arousal, and dominance. Based on valence scores, anger was categorized into three levels: Level 1 anger (valence = 3), Level 2 anger (valence = 2), and Level 3 anger (valence = 1). To verify the validity of the SAM, the clustering results of EEG-EDA physiological data and vehicle driving data collected during the simulated driving tasks were compared with the SAM scores.
First, features significantly contributing to emotion classification were selected using a feature importance evaluation method based on random forests. Then, t-SNE, an unsupervised learning dimensionality reduction technique, was applied to map the data into a low-dimensional space while preserving the local structure of the high-dimensional data. The t-SNE mechanism calculates the conditional probability between each pair of data points in the high-dimensional space to reflect their similarity, followed by constructing a corresponding probability distribution in the low-dimensional space. The algorithm then optimizes the low-dimensional representation by minimizing the Kullback–Leibler-divergence between these two probability distributions, thereby revealing the local clustering structure of the data [39]. This approach allows the multimodal data to visualize the clustering effect of emotional states in a three-dimensional space. In comparison, traditional PCA dimensionality reduction techniques primarily rely on the covariance matrix to find directions that maximize variance, often neglecting the local structure of the data and failing to reveal the non-linear boundaries between different emotional states. t-SNE, on the other hand, effectively preserves the neighborhood relationships in high-dimensional data, more accurately capturing subtle differences between emotional states.
is the similarity between data points i and j in the high-dimensional space, and is the similarity between the data points i and j in the low-dimensional space.
Figure 12 presents the visualization results of multiple raw physiological and vehicle driving datasets from 56 participants from different perspectives. The results show that two emotional categories, corresponding to anger and neutral emotions, were generated and represented by cylindrical and triangular prism shapes in the figure. Additionally, three levels of anger were identified, represented by different colors. The data clustered into four main groups, indicating that the SAM is effective in distinguishing between the two emotional states and the three levels of anger among drivers. However, the analysis also revealed some overlapping between clusters, with indistinct inter-cluster differences and less compact intra-cluster distances. This is likely because the visualization results were based on raw physiological data from drivers, which included noise and other interfering factors. Therefore, these results can only roughly reflect the validity of the subjective evaluation method.
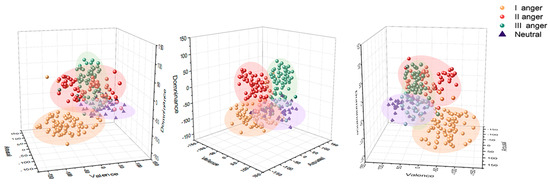
Figure 12.
Three-dimensional clustering analysis of driving anger emotion and subjective affective dimensions based on t-SNE.
4.1.2. Subjective Rating Analysis
Further validation of the efficacy of emotional labels was conducted based on the distribution of valence, arousal, and dominance scores within the SAM framework. Figure 13a illustrates the distribution of valence scores, which indicate emotional positivity or negativity. Typically, higher valence scores correspond to positive emotions, while lower scores indicate negative emotions. The data in Figure 13a align with this pattern: anger scores cluster between 1 and 4, while neutral scores range from 4 to 6. This expected distribution pattern substantiates the validity of the valence scores. Figure 13b depicts the distribution of arousal scores, reflecting the emotional excitement or relaxation level. Lower arousal scores indicate that participants are more relaxed without experiencing significant positive or negative emotions, while higher scores denote heightened alertness. The arousal scores for anger primarily concentrate between 6 and 9, whereas neutral emotions are distributed between 3 and 5. The observed data distribution corresponds with the defined criteria. The dominance scores range from low to high, indicating submissiveness to dominance. Figure 13c shows that anger emotions are characterized by high dominance, while neutral emotions occupy a middle ground. The distribution of anger scores primarily centers between 1 and 3, whereas neutral emotions are concentrated between 4 and 6, suggesting that participants maintain moderate control over their emotional responses. The analytical results conform to the expected distribution patterns, reinforcing the dominance scores’ reliability.
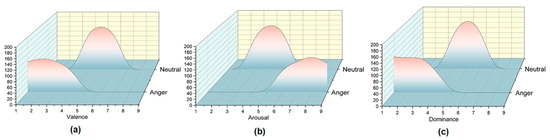
Figure 13.
Relationship diagrams of different emotional dimensions and emotion category distribution: (a) valence dimension and emotion category distribution; (b) arousal dimension and emotion category distribution; (c) dominance dimension and emotion category distribution.
This section evaluates the efficacy of emotional labels for drivers in simulated driving tasks through t-SNE dimensionality reduction clustering analysis and SAM score distributions. The results indicate that the SAM effectively distinguishes between varying anger and neutral emotions, validating its effectiveness in assessing emotional elicitation effects. However, some data showed inter-class overlap, likely due to noise in the physiological data. The distribution of the SAM’s valence, arousal, and dominance scores further corroborates its reliability in emotional assessment.
4.2. Correlation Analysis between Multimodal Data and Emotion Labels
Among commonly used mathematical models for evaluating the validity of variables are the Pearson Correlation Coefficient and Kendall’s Tau Coefficient. However, these methods have certain limitations when handling variable relationships. The Pearson Correlation Coefficient requires a linear relationship between variables. It usually assumes distributed data, making it less effective in capturing correlations in non-linear relationships or non-normal distributions. While Kendall’s Tau Coefficient can handle some non-linear relationships, it has higher computational complexity, and its efficiency decreases with larger datasets. In contrast, Spearman’s rank correlation coefficient is more robust to non-linear relationships and more straightforward to compute, making it superior when analyzing data with complex non-linear or monotonic trends. Therefore, this study employs the Spearman correlation to explore the relationships between eight-channel EEG data, one-channel skin conductance data, and four-channel vehicle driving data with three emotional dimensions. Specifically, for each data modality, we calculate its Spearman rank correlation coefficient with each emotional dimension to assess the strength of association between features (e.g., EEG power, skin conductance response frequency, vehicle speed) and the emotional dimensions. The calculation formula for Spearman’s rank correlation coefficient is as follows:
is the Spearman rank correlation coefficient, is the rank coefficient for each pair of observations, and n is the total number of observations.
4.2.1. EEG Data and Emotion Labels
The time-frequency characteristics of EEG signals were analyzed using a Short-Time Fourier Transform (STFT). The basic principle of STFT involves segmenting the time series signal and applying the Fourier Transform to each segment within a time window, thus obtaining a time-frequency representation of the signal. The formula for STFT is as follows:
where is the original input signal, is a window function used to extract the signal within a local time range, and represents the frequency.
The power changes of the EEG signals are averaged over the Delta (1–4 Hz), Theta (4–8 Hz), Alpha (8–13 Hz), Beta (16–30 Hz), and Gamma (30–40 Hz) frequency bands. Spearman correlation coefficients were calculated to investigate the relationship between EEG power changes and the three emotional dimensions. This analysis involved generating corresponding scalp heat maps to visually represent these correlations. As shown in Figure 14, during the emotional state of anger, the Gamma band power in the valence dimension was prominently concentrated in the prefrontal region, particularly at the Fz location, reflecting high activation levels of the prefrontal cortex when processing anger. Additionally, enhanced Gamma band power in the prefrontal cortex during high arousal states indicate significantly increased cognitive load and alertness in drivers experiencing anger. A positive correlation was observed between the arousal dimension and Gamma band power. Similarly, the dominance dimension also exhibited a significant positive correlation with prefrontal Gamma band power, suggesting a stronger sense of control and dominance in individuals experiencing anger.

Figure 14.
Topographic distribution of EEG power across frequency bands in relation to emotional dimensions.
4.2.2. EDA Data and Emotion Labels
Figure 15a presents the correlation heatmap between the average skin conductance level (SCL), the number and peak amplitude of skin conductance responses (SCRs), and the three emotional dimension scores. The results indicate a strong positive correlation between valence and SCR frequency, reflecting a higher tendency for individuals to experience frequent physiological responses during anger. Furthermore, the correlation coefficient between arousal and average SCL was significant, suggesting that sympathetic nervous system activity increases when individuals experience intense anger, leading to elevated skin conductance levels. A strong positive correlation was also observed between dominance and SCR peak amplitude, indicating that individuals exhibit more intense and pronounced physiological responses in high-dominance anger states.
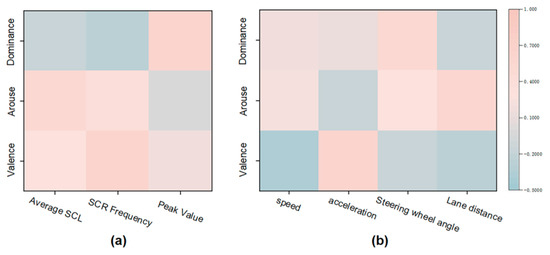
Figure 15.
Correlation analysis of valence–arouse–dominance—(VAD) with EDA and vehicle data: (a) correlation of SCL, SCR frequency, and peak amplitude from EDA data with emotional dimensions; (b) correlation of mean vehicle driving data with emotional dimensions.
4.2.3. Vehicle Driving Data and Emotion Labels
Figure 15b illustrates the correlation between the mean values of vehicle driving data and the scores of the three emotional dimensions. The analysis reveals a negative correlation between valence and speed, suggesting that drivers tend to drive at higher speeds when experiencing anger, reflecting the aggressive influence of emotions on driving style. Acceleration showed a positive correlation with arousal, indicating that drivers are more likely to engage in rapid acceleration under high arousal states, suggesting that intense emotional reactions can provoke more aggressive driving behaviors. Steering angle was positively correlated with dominance, highlighting that drivers make more frequent or vigorous adjustments in high-dominance emotional states. Lane offset positively correlated with arousal, indicating that drivers are more prone to lane offsets under high arousal conditions, likely due to emotionally-evoked distractions.
4.3. Performance Evaluation of the DPV-MFD Multimodal Dataset Using CNN-LSTM Network
4.3.1. Multimodal Fusion Architecture Based on CNN-LSTM
The CNN-LSTM deep learning network was employed to evaluate the effectiveness of the DPV-MFD multimodal dataset in recognizing driving anger. CNN-LSTM is a neural network architecture designed explicitly for multimodal time-series data [40]. Its structure is illustrated in Figure 16 and includes four stages: preprocessing, feature extraction, feature fusion, and classification.
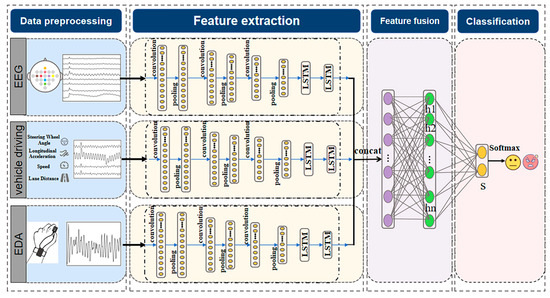
Figure 16.
CNN-LSTM neural network structure.
- Preprocessing: After preprocessing the raw data described in Section 3.6, the sliding window method was used to divide the features of each modality into fixed-size overlapping time windows, generating a new training dataset.
- Feature Extraction: The new training dataset for each modality was fed into the 1D-CNN and LSTM framework for feature extraction. Specifically, the segmented time windows from the training data were first input into the 1D-CNN, which automatically learned the features. The feature extraction framework consists of three 1D convolutional layers, three max-pooling layers, and two LSTM layers. The convolutional layers use sliding filters to extract relevant features, and the activation function is the Exponential Linear Unit (ELU), which accelerates convergence and enhances model robustness. Each convolution layer is followed by a max-pooling layer that reduces data volume by half, reducing complexity. A dropout layer is applied after pooling to prevent overfitting. After three convolution and pooling layers, the input data are transformed into high-dimensional feature maps. Since the convolution and pooling operations preserve the temporal sequence, the feature maps are directly fed into the two-layer LSTM network, converting them into corresponding hidden states.
- Feature Fusion: The hidden states generated from the EEG, EDA, and vehicle driving data are integrated into a new feature map containing n hidden states ht, represented as H.
- Classification: The vector S is computed as the weighted sum of the hidden states. In the final classification step, the vector S is used as the input feature to the Softmax layer for emotion classification.
4.3.2. Model Training Process
The data used for validation came from the DPV-MFD constructed through the driving simulation experiments designed in this study. All algorithms were implemented using the Python 1.6 deep learning framework with an NVIDIA GeForce 3060 GPU (12GB VRAM). The data were randomly split into training, validation, and test sets in a 6:2:2 ratio. The training set was used for model parameter training, the validation set for hyperparameter tuning, and the test set for model performance evaluation. The Adam optimizer, commonly used in LSTM tasks, was employed for gradient updates. Detailed hyperparameter settings are shown in Table 10.
Table 10.
Hyperparameter optimization.
4.3.3. Performance Evaluation Metrics
This study employed accuracy and the F1 score as performance evaluation metrics for recognition, where accuracy quantifies the degree of correct recognition in the classification task, and the F1 score, commonly used in classification tasks, accounts for both the precision and recall of the model. The calculation formulas are as follows:
In Equations (6) and (7), represents true positives, i.e., correctly identified angry driving when the actual condition is angry driving; denotes false positives, where angry driving is incorrectly detected when the actual condition is neutral driving; represents false negatives, where neutral driving is incorrectly detected when the actual condition is angry driving; and denotes true negatives, correctly identified as neutral driving when the actual condition is neutral driving.
4.3.4. Results
- A.
- Driving Anger Emotion Recognition Based on Unimodal EEG
The preprocessed EEG signals were segmented into 3–12 s intervals and input into the CNN-LSTM neural network model for analysis to observe its classification performance. (As the EDA signal is a single-channel signal, it contains relatively limited information and may not fully capture the complexity and diversity of emotional states [41]. Additionally, the vehicle driving data have a low sampling rate, and using these data alone may not provide sufficient temporal resolution to capture subtle changes in emotional states [42]. Therefore, this study did not independently validate the accuracy of EDA and vehicle driving data in recognizing angry driving emotions.) As shown in Figure 17a, the accuracy of recognizing angry driving emotions based on EEG signals improves with increasing signal duration, peaking at 8 s with a classification accuracy of 79.48%. This suggests that longer signal durations better capture the complexity and diversity of emotional states.

Figure 17.
(a) Accuracy of emotion recognition from EEG signals across different time windows; (b) confusion matrix for EEG signals only; (c) confusion matrix for multimodal signals.
- B.
- Driving Anger Emotion Recognition Based on Multimodal Information Fusion
The EEG, EDA, and vehicle driving data from the DPV-MFD were segmented into 8 s-windows as input. Each unimodal data type was first processed through an LSTM layer for sequential feature extraction, followed by multimodal feature fusion in the latent space. A decoding LSTM layer further processed the fused feature vectors, and finally, the classification results for driving anger were obtained through a fully connected layer. Figure 17b,c display confusion matrices illustrating the model’s ability to distinguish between neutral and anger states. Integrating EEG, EDA, and vehicle data improved classification accuracy, as shown in Table 11, from 79.48% (only EEG) to 83.97%, and enhanced the F1 score from 74.62% to 83.76%. The increased proportion of correctly identified anger states demonstrates the enhanced reliability of multimodal fusion, validating its effectiveness for emotion recognition.
Table 11.
Accuracy and F1 scores for different modal information in DPV-MFD.
- C.
- Actual driving verification validation
The multimodal data collected from driving simulations and real-world experiments underwent rigorous preprocessing, including cleaning, synchronization, and normalization, to ensure high data quality and consistency (Section 3.6.2). The data were segmented into time windows using a sliding window method and input into a CNN-LSTM model for training (Section 4.3.2). During training, backpropagation was employed to minimize prediction error and update model parameters. The training set was used for learning model parameters, while the validation set was utilized for hyperparameter tuning and performance evaluation, ensuring strong generalization capability and classification accuracy. The CNN layers extracted spatiotemporal features and enhanced key emotional characteristics, which were further refined by the LSTM layers to strengthen temporal dynamics. Ultimately, these features were processed through a Softmax classifier for emotion state recognition. A comprehensive analysis of physiological data, vehicle data, and SAM emotion self-assessment scales collected from real-world driving was conducted to evaluate the performance of the CNN-LSTM model in both simulated and natural driving environments. Figure 18 presents the results of real-time anger emotion recognition from both the simulation and real-world data. The curves demonstrate a high degree of alignment between the emotion recognition results from these two datasets. Both exhibit consistent accuracy trends over time (Figure 18a,b), supporting that the DPV-MFD constructed through driving simulation experiments is effectively applicable to real-world scenarios.
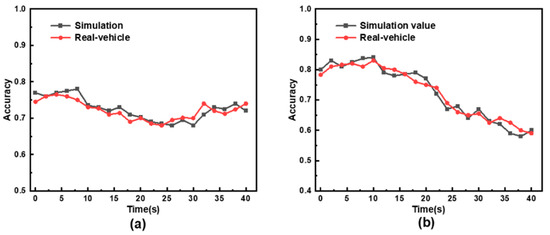
Figure 18.
Comparison of emotion recognition accuracy between simulated and real-world data using the CNN-LSTM model: (a) neutral emotion; (b) anger emotion.
- D.
- Comparative Analysis of CNN-LSTM Fusion Model with Existing Driver Emotion Recognition Research
Table 12 provides a comparative analysis of our research with recent advancements in driver emotion recognition. Requardt et al. [43] collected speech data to assess recognition accuracy with RF and SVM models, recording 52.8% and 77.4%, respectively. Most studies rely on wearable devices for emotion recognition. Nasoz et al. [44] employed machine learning models, including KNN, MBP, and RBP, to analyze signals from chest-mounted devices, achieving a peak accuracy of 82.60%. Additionally, Wan et al. [44] utilized least squares-based machine learning approaches, integrating multimodal data—such as EEG, Blood Volume Pulse (BVP), EDA, and Respiration—alongside driving behavior, achieving an 82.2% accuracy. These machine-learning methodologies necessitate manual feature extraction, extensive parameter tuning, and feature selection, which are computationally intensive. In contrast, deep learning models offer the advantage of automatic feature learning. For instance, Elalamy [40] and Kim [45] utilized CNN-LSTM and Transfer Learning frameworks to evaluate emotion recognition across different modalities within the publicly available DEAP dataset, achieving approximately 80% accuracy. Our study integrates EEG, EDA, and vehicle driving data to more precisely capture drivers’ emotional nuances compared to traditional physiological data, achieving superior accuracy with the CNN-LSTM deep learning architecture. This indicates that the dataset and model performance in our study surpass recent efforts in driver emotion recognition, offering a robust framework for future research.
Table 12.
Comparison of the optimal performance of the multimodal model based on CNN-LSTM network with other recent research results.
5. Limitations and Future Research
This study faced several limitations during the analysis. First, the sample did not cover diverse populations due to experimental constraints, and the experiment was conducted entirely based on right-hand driving rules. Future studies should consider including diverse groups and individuals who follow different driving rules. Second, road rage is typically triggered by unpleasant events during driving, such as sudden lane cutting. However, the emotional state of drivers prior to these events still needs to be explored. Therefore, future research should investigate the relationship between road rage and the driver’s emotional state before such events. Time -series analyses of emotional fluctuations during different driving phases and various times of the day will be essential to uncover the dynamic patterns of emotion throughout the driving process. Moreover, metaverse and digital twin technologies could be employed to simulate more complex driving scenarios, enhancing the utility of emotion recognition systems [46,47].
In addition, future work will integrate more advanced machine learning algorithms and various physiological measures (such as heart rate variability, eye tracking, facial expressions, and voice features) to improve the precision and generalizability of multimodal emotion recognition. Finally, this study proposed a multimodal data collection framework based on wearable physiological sensors and vehicle driving data for driving anger. The long-term goal is to develop an advanced driver assistance system capable of continuously monitoring and regulating the driver’s emotional state. By incorporating multi-sensory emotion regulation methods, such as visual, auditory, tactile, and olfactory stimuli, the system would adjust the driver’s negative emotions to higher valence, lower arousal, and greater dominance, promoting safer driving conditions.
6. Conclusions
This study developed a multimodal dataset (DPV-MFD) for simulating driver self-expressed anger during driving tasks. The research was conducted in two experiments. In Experiment 1, participants’ feedback on videos and driving scenarios that elicited anger was collected through questionnaires. Based on this feedback, four video clips and six traffic scenarios or specific events were selected as preliminary and deep anger-evoking materials. In Experiment 2, a combination of emotion evocation methods was employed to collect synchronized physiological and vehicle driving data from 56 participants during 1012 simulated driving trials using a wearable physiological sensing setup and a driving simulator. The dataset comprises 13,045 records, including eight-channel EEG, single-channel EDA, and four-channel vehicle driving data. Experiment 3 involved real-world driving tests, where the high degree of alignment in emotion recognition results validated the applicability of the DPV-MFD in real-world driving scenarios. Additionally, emotional valence, arousal, and dominance ratings were annotated for each driving task to support the validation of anger and neutral emotion evocation effects.
To validate the effectiveness of the DPV-MFD, this study conducted the following four tasks:
- Validation of Emotional Labeling: the reliability of the SAM scale in assessing emotion evocation effects was validated through t-SNE dimensionality reduction clustering analysis of emotional labels and the distribution of SAM scores based on participants’ self-reports.
- Data Quality and Consistency Evaluation: EEG, EDA, and vehicle driving data were subjected to noise reduction and quality checks. The stationary distribution of the multimodal data waveforms from all participants during the experiments assessed the data’s stability and consistency.
- Correlation Analysis: the Spearman correlation coefficient was used to explore the relationships between multimodal data and the three emotional dimensions, examining the strength of the association between different modal features and emotional dimensions.
- Performance Evaluation of Emotion Recognition: The publicly available CNN-LSTM deep learning network was used to assess the performance of the DPV-MFD in emotion recognition, comparing the effectiveness of unimodal and multimodal data. The results showed that integrating multimodal information significantly improved the accuracy of angry driving emotion recognition, confirming the effectiveness of multi-source information fusion. Furthermore, the high degree of alignment between emotion recognition results from real-world driving data and simulated driving data confirmed the generalizability of the DPV-MFD in real-world driving scenarios.
In practical applications for intelligent vehicles, the dataset and analyses developed in this study provide critical data support, mechanistic insights, and modality selection references for future research on driving emotion recognition. These findings have significant implications for intelligent transportation engineering, driving safety optimization, and human–machine-collaborative driving system designs.
Author Contributions
Conceptualization, L.S. and B.L.; Methodology, H.Y.; Software, L.S.; Validation, L.S. and B.L.; Formal analysis, H.Y.; Investigation, L.S.; Resources, B.L. and H.Y.; Data curation, L.S.; Writing—Original draft preparation, L.S.; Writing—Review and editing, B.L.; Visualization, H.Y.; Supervision, B.L.; Project administration, B.L.; Funding acquisition, B.L. All authors have read and agreed to the published version of the manuscript.
Funding
This research was funded by the Industry-University Collaborative Education Project of the Ministry of Education of China (grant number 220606545201713), and the ‘Human Factors and Ergonomics’ Education Project by the Department of Higher Education, Ministry of Education of China (grant number 220705329115056).
Institutional Review Board Statement
The study was conducted in accordance with the Declaration of Helsinki, and the protocol was approved by the Ethics Committee of NEFU-CMEE-2024-0018.
Informed Consent Statement
Informed consent for participation was obtained from all subjects involved in the study.
Data Availability Statement
The datasets generated or analyzed during the current study are available from the corresponding author upon reasonable request.
Conflicts of Interest
The authors declare no conflicts of interest.
References
- Bowen, L.; Budden, S.L.; Smith, A.P. Factors underpinning unsafe driving: A systematic literature review of car drivers. Transp. Res. Part F Traffic Psychol. Behav. 2020, 72, 184–210. [Google Scholar] [CrossRef]
- Woldu, A.B.; Desta, A.A.; Woldearegay, T.W. Magnitude and determinants of road traffic accidents in Northern Ethiopia: A cross-sectional study. BMJ Open 2020, 10, e034133. [Google Scholar] [CrossRef]
- Wang, B.; Han, Y.; Wang, S.; Tian, D.; Cai, M.; Liu, M.; Wang, L. A review of intelligent connected vehicle cooperative driving development. Mathematics 2022, 10, 3635. [Google Scholar] [CrossRef]
- Sahoo, G.K.; Das, S.K.; Singh, P. Performance comparison of facial emotion recognition: A transfer learning-based driver assistance framework for in-vehicle applications. Circ. Syst. Signal Process. 2023, 42, 4292–4319. [Google Scholar] [CrossRef]
- Habibifar, N.; Salmanzadeh, H. Improving driving safety by detecting negative emotions with biological signals: Which is the best? Transp. Res. Rec. 2022, 2676, 334–349. [Google Scholar] [CrossRef]
- Khattak, A.J.; Ahmad, N.; Wali, B.; Dumbaugh, E. A taxonomy of driving errors and violations: Evidence from the naturalistic driving study. Accid. Anal. Prev. 2021, 151, 105873. [Google Scholar] [CrossRef]
- Huang, T.; Fu, R.; Chen, Y. Deep driver behavior detection model based on human brain consolidated learning for shared autonomy systems. Measurement 2021, 179, 109463. [Google Scholar] [CrossRef]
- Van Kleef, G.A.; Côté, S. The social effects of emotions. Annu. Rev. Psychol. 2022, 73, 629–658. [Google Scholar] [CrossRef]
- Bru-Luna, L.M.; Martí-Vilar, M.; Merino-Soto, C.; Cervera-Santiago, J.L. Emotional intelligence measures: A systematic review. In Proceedings of the Healthcare, Basel, Switzerland, 9–12 December 2021; MDPI: Basel, Switzerland, 2021. [Google Scholar]
- Zhang, F.; Markopoulos, P.; Bekker, T.; Paule-Ruíz, M.; Schüll, M. Understanding design-based learning context and the associated emotional experience. Int. J. Technol. Des. Educ. 2022, 32, 845–882. [Google Scholar] [CrossRef]
- Younis, E.M.G.; Zaki, S.M.; Kanjo, E.; Houssein, E.H. Evaluating ensemble learning methods for multi-modal emotion recognition using sensor data fusion. Sensors 2022, 22, 5611. [Google Scholar] [CrossRef]
- Trick, L.M.; Brandigampola, S.; Enns, J.T. How fleeting emotions affect hazard perception and steering while driving: The impact of image arousal and valence. Accid. Anal. Prev. 2012, 45, 222–229. [Google Scholar] [CrossRef] [PubMed]
- Chan, M.; Singhal, A. The emotional side of cognitive distraction: Implications for road safety. Accid. Anal. Prev. 2013, 50, 147–154. [Google Scholar] [CrossRef] [PubMed]
- Li, Q.; Liu, Y.; Yan, F.; Zhang, Q.; Liu, C. Emotion recognition based on multiple physiological signals. Biomed. Signal Process. Control 2023, 85, 104989. [Google Scholar] [CrossRef]
- Huang, J.; Liu, Y.; Peng, X. Recognition of driver’s mental workload based on physiological signals, a comparative study. Biomed. Signal Process. Control 2022, 71, 103094. [Google Scholar] [CrossRef]
- Chen, J.; Lin, X.; Ma, W.; Wang, Y.; Tang, W. EEG-based emotion recognition for road accidents in a simulated driving environment. Biomed. Signal Process. Control 2024, 87, 105411. [Google Scholar] [CrossRef]
- Zhang, X.; Xu, C.; Xue, W.; Hu, J.; He, Y.; Gao, M. Emotion recognition based on multichannel physiological signals with comprehensive nonlinear processing. Sensors 2018, 18, 3886. [Google Scholar] [CrossRef]
- Lisetti, C.L.; Nasoz, F. Using noninvasive wearable computers to recognize human emotions from physiological signals. EURASIP J. Adv. Signal Process. 2004, 2004, 929414. [Google Scholar] [CrossRef]
- Katsis, C.D.; Katertsidis, N.; Ganiatsas, G.; Fotiadis, D.I. Toward emotion recognition in car-racing drivers: A bio signal processing approach. IEEE Trans. Syst. Man Cybern. A Syst. Hum. 2008, 38, 502–512. [Google Scholar] [CrossRef]
- Cai, H.; Lin, Y.; Mourant, R.R. Study on driver emotion in driver-vehicle-environment systems using multiple networked driving simulators. In Proceedings of the Driving Simulation Conference North America (DSC’07), Iowa, IA, USA, 12–14 September 2007; Driving Simulation Association: Antibes, France, 2007. [Google Scholar]
- Bethge, D.; Kosch, T.; Grosse-Puppendahl, T.; Chuang, L.L.; Kari, M.; Jagaciak, A.; Schmidt, A. Vemotion: Using driving context for indirect emotion prediction in real-time. In Proceedings of the Annual ACM Symposium on User Interface Software and Technology, Virtual Event, 10–13 October 2021; ACM: New York, NY, USA, 2021. [Google Scholar]
- Lee, S.; Lee, T.; Yang, T.; Yoon, C.; Kim, S.P. Detection of drivers’ anxiety invoked by driving situations using multimodal biosignals. Processes 2020, 8, 155. [Google Scholar] [CrossRef]
- Nasoz, F.; Lisetti, C.L.; Vasilakos, A.V. Affectively intelligent and adaptive car interfaces. Inf. Sci. 2010, 180, 3817–3836. [Google Scholar] [CrossRef]
- Yang, W.; Wan, B.; Qu, X. A forward collision warning system using driving intention recognition of the front vehicle and V2V communication. IEEE Access 2020, 8, 11268–11278. [Google Scholar] [CrossRef]
- Chen, C.; Zhao, X.; Liu, H.; Ren, G.; Liu, X. Influence of adverse weather on drivers’ perceived risk during car following based on driving simulations. J. Mod. Transp. 2019, 27, 282–292. [Google Scholar] [CrossRef]
- Koelstra, S.; Muhl, C.; Soleymani, M.; Lee, J.S.; Yazdani, A.; Ebrahimi, T.; Pun, T.; Nijholt, A.; Patras, I. DEAP: A database for emotion analysis using physiological signals. IEEE Trans. Affect. Comput. 2011, 3, 18–31. [Google Scholar] [CrossRef]
- Li, W.; Tan, R.; Xing, Y.; Li, G.; Li, S.; Zeng, G.; Wang, P.; Zhang, B.; Su, X.; Pi, D.; et al. A multimodal psychological, physiological and behavioural dataset for human emotions in driving tasks. Sci. Data 2022, 9, 481. [Google Scholar] [CrossRef]
- Ramanishka, V.; Chen, Y.T.; Misu, T.; Saenko, K. Toward driving scene understanding: A dataset for learning driver behavior and causal reasoning. In Proceedings of the IEEE Conference on Computer Vision and Pattern Recognition, Salt Lake, UT, USA, 18–22 June 2018; IEEE: Piscataway, NJ, USA, 2018. [Google Scholar]
- Ab. Aziz, N.A.; Ismail, S.N.M.S.; Hasnul, M.A.; Ab.Aziz, K.; Ibrahim, S.Z.; Abd. AZIZ, A.; Raja, J.E. Asian affective and emotional state (A2ES) dataset of ECG and PPG for affective computing research. Algorithms 2023, 16, 130. [Google Scholar] [CrossRef]
- Nguyen, H.; Tran, N.; Nguyen, H.D.; Nguyen, L.; Kotani, K. KTFEv2: Multimodal facial emotion database and its analysis. IEEE Access 2023, 11, 17811–17822. [Google Scholar] [CrossRef]
- Shafaei, S.; Hacizade, T.; Knoll, A. Integration of driver behavior into emotion recognition systems: A preliminary study on steering wheel and vehicle acceleration. In Proceedings of the 14th Asian Conference on Computer Vision (ACCV 2018) Workshops, Perth, Australia, 2–6 December 2018; Springer: Cham, Switzerland, 2019. [Google Scholar]
- Zheng, W.L.; Lu, B.L. Investigating critical frequency bands and channels for EEG-based emotion recognition with deep neural networks. IEEE Trans. Auton. Ment. Dev. 2015, 7, 162–175. [Google Scholar] [CrossRef]
- Bosch, E.; Corbí, R.L.H.; Ihme, K.; Hörmann, S.; Jipp, M.; Käthner, D. Frustration recognition using spatio temporal data: A novel dataset and GCN model to recognize in-vehicle frustration. IEEE Trans. Affect. Comput. 2022, 14, 2864–2875. [Google Scholar] [CrossRef]
- Alonso, M.A.; Vilares, D.; Gómez-Rodríguez, C.; Vilares, J. Sentiment analysis for fake news detection. Electronics 2021, 10, 1348. [Google Scholar] [CrossRef]
- Mou, L.; Zhou, C.; Zhao, P.; Nakisa, B.; Rastgoo, M.N.; Jain, R.; Gao, W. Driver stress detection via multimodal fusion using attention-based CNN-LSTM. Expert Syst. Appl. 2021, 173, 114693. [Google Scholar] [CrossRef]
- Gerrards-Hesse, A.; Spies, K.; Hesse, F.W. Experimental inductions of emotional states and their effectiveness: A review. Br. J. Psychol. 1994, 85, 55–78. [Google Scholar] [CrossRef]
- Ni, J.; Xie, W.; Liu, Y.; Zhang, J.; Wan, Y.; Ge, H. Driver emotion recognition involving multimodal signals: Electrophysiological response, nasal-tip temperature, and vehicle behavior. J. Transp. Eng. Part A Syst. 2024, 150, 04023125. [Google Scholar] [CrossRef]
- Palazzi, A.; Wagner Fritzen, B.; Gauer, G. Music-induced emotion effects on decision-making. Psychol. Music 2019, 47, 621–643. [Google Scholar] [CrossRef]
- Melit Devassy, B.; George, S.; Nussbaum, P. Unsupervised clustering of hyperspectral paper data using t-SNE. J. Imaging 2020, 6, 29. [Google Scholar] [CrossRef]
- Elalamy, R.; Fanourakis, M.; Chanel, G. Multi-modal Emotion Recognition Using Recurrence Plots and Transfer Learning on Physiological Signals. In Proceedings of the 9th International Conference on Affective Computing and Intelligent Interaction (ACII), Online, 12–17 September 2021; IEEE: Piscataway, NJ, USA, 2021. [Google Scholar]
- Affanni, A. Wireless sensors system for stress detection by means of ECG and EDA acquisition. Sensors 2020, 20, 2026. [Google Scholar] [CrossRef]
- Lin, L.; Li, W.; Peeta, S. Efficient data collection and accurate travel time estimation in a connected vehicle environment via real-time compressive sensing. J. Big Data Anal. Transp. 2019, 1, 95–107. [Google Scholar] [CrossRef]
- Requardt, A.F.; Ihme, K.; Wilbrink, M.; Wendemuth, A. Towards Affect-Aware Vehicles for Increasing Safety and Comfort: Recognising Driver Emotions from Audio Recordings in a Realistic Driving Study. IET Intell. Transp. Syst. 2020, 14, 1265–1277. [Google Scholar] [CrossRef]
- Wan, P.; Wu, C.; Lin, Y.; Ma, X. Driving Anger States Detection Based on Incremental Association Markov Blanket and Least Square Support Vector Machine. Discrete Dyn. Nat. Soc. 2019, 2019, 2745381. [Google Scholar] [CrossRef]
- Kim, B.H.; Jo, S. Deep Physiological Affect Network for the Recognition of Human Emotions. IEEE Trans. Affect. Comput. 2020, 11, 230–243. [Google Scholar] [CrossRef]
- Saad, M.; Khan, M.; Saeed, M.; El Saddik, A.; Gueaieb, W. Combating Counterfeit Products in Smart Cities with Digital Twin Technology. In Proceedings of the 2023 IEEE International Smart Cities Conference (ISC2), Como, Italy, 25–28 September 2023; IEEE: Piscataway, NJ, USA, 2023. [Google Scholar]
- Saeed, M.; Khan, A.; Khan, M.; Saad, M.; El Saddik, A.; Gueaieb, W. Gaming-Based Education System for Children on Road Safety in Metaverse Towards Smart Cities. In Proceedings of the 2023 IEEE International Smart Cities Conference (ISC2), Como, Italy, 25–28 September 2023; IEEE: Piscataway, NJ, USA, 2023. [Google Scholar]
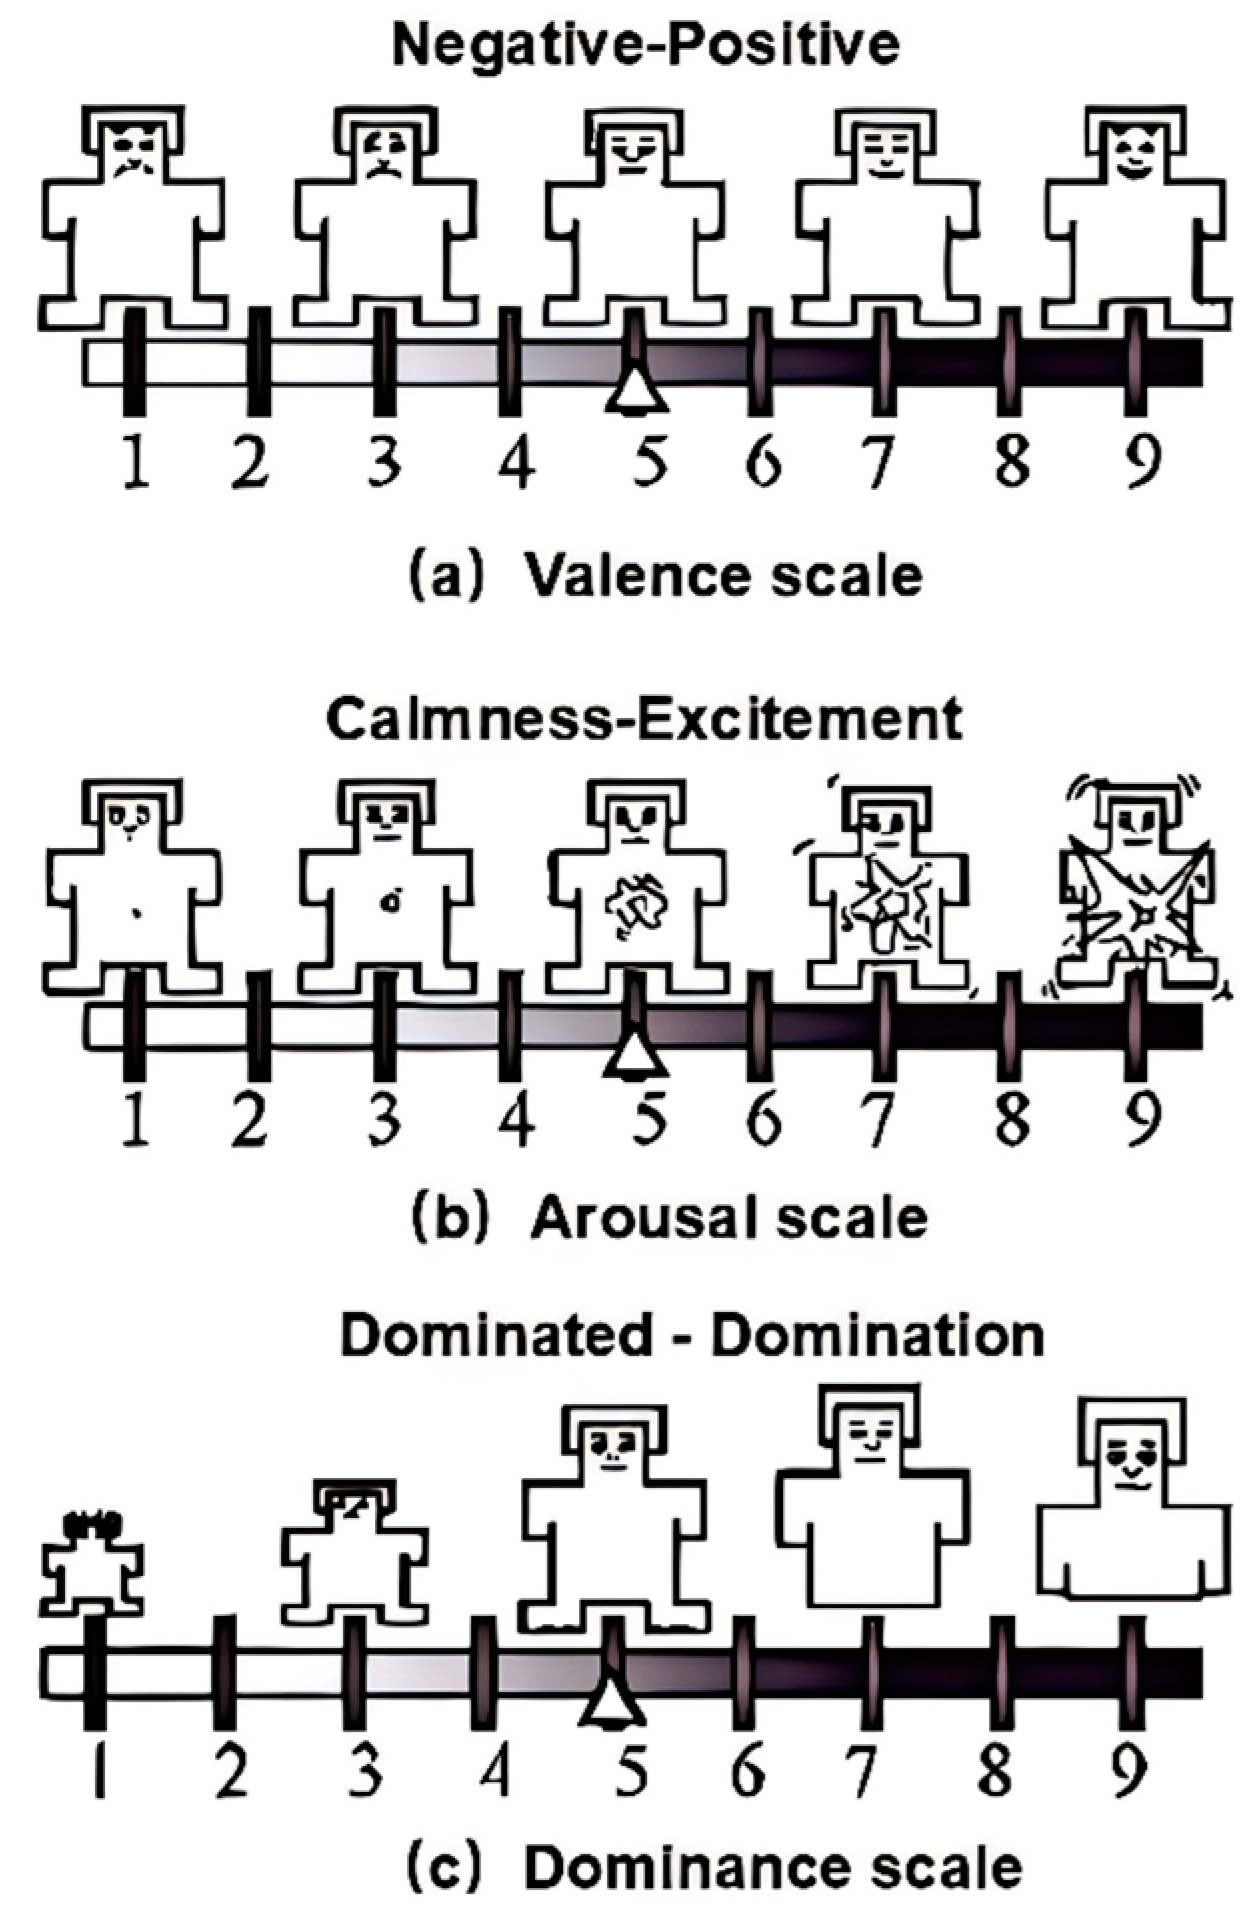
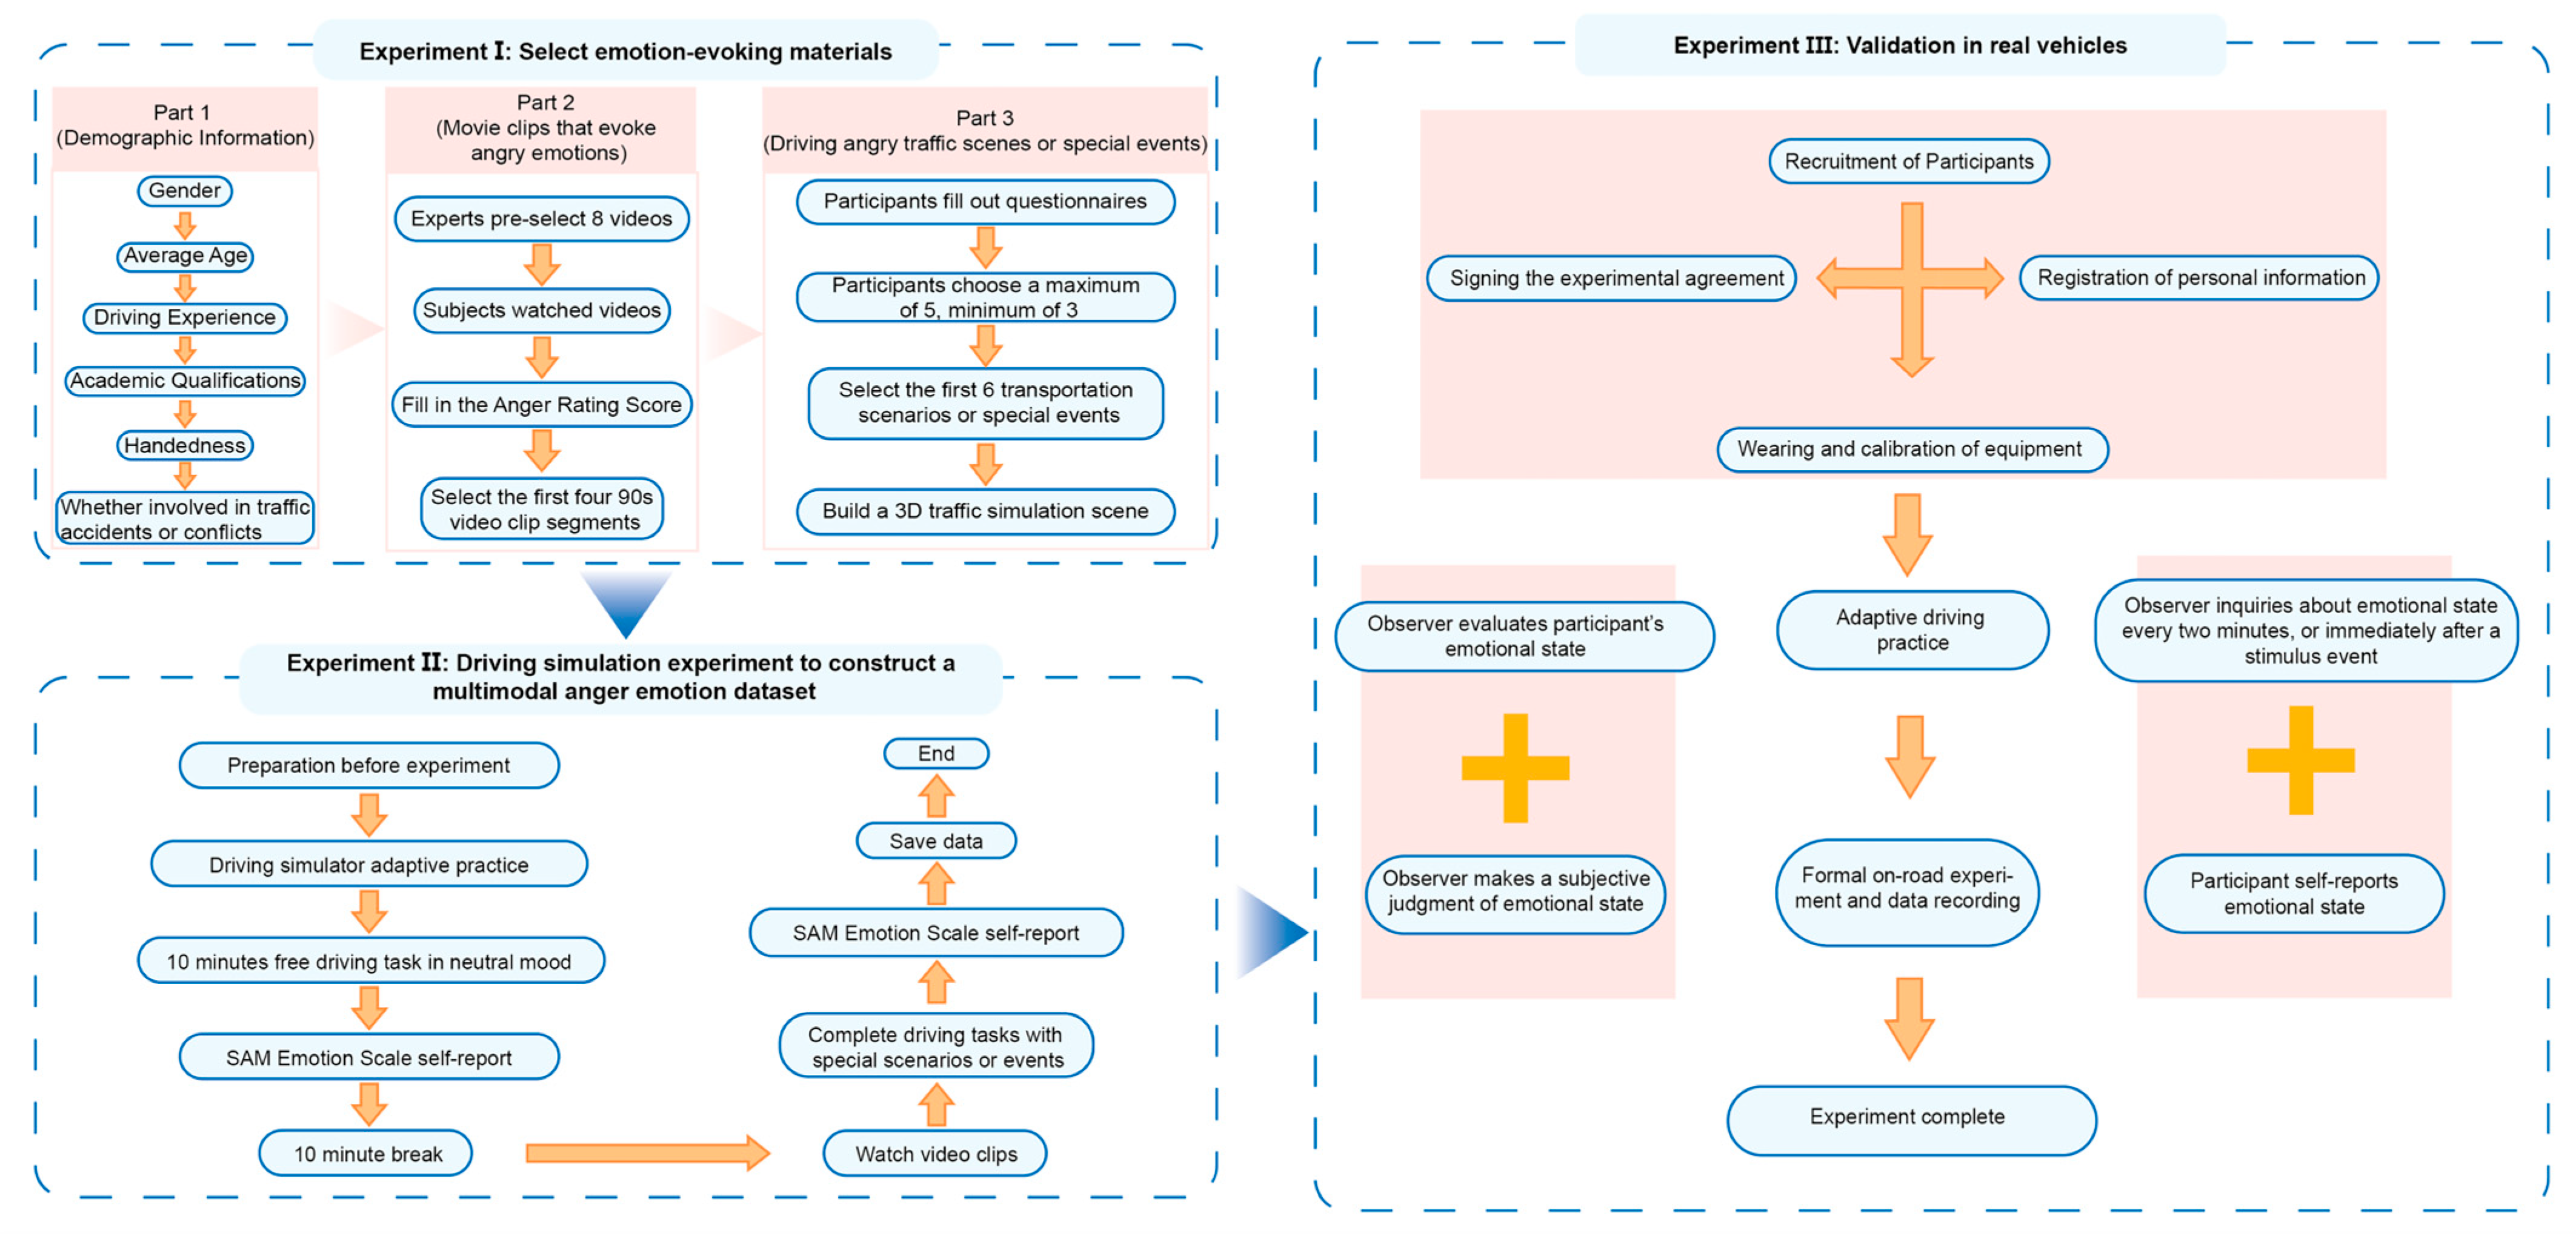

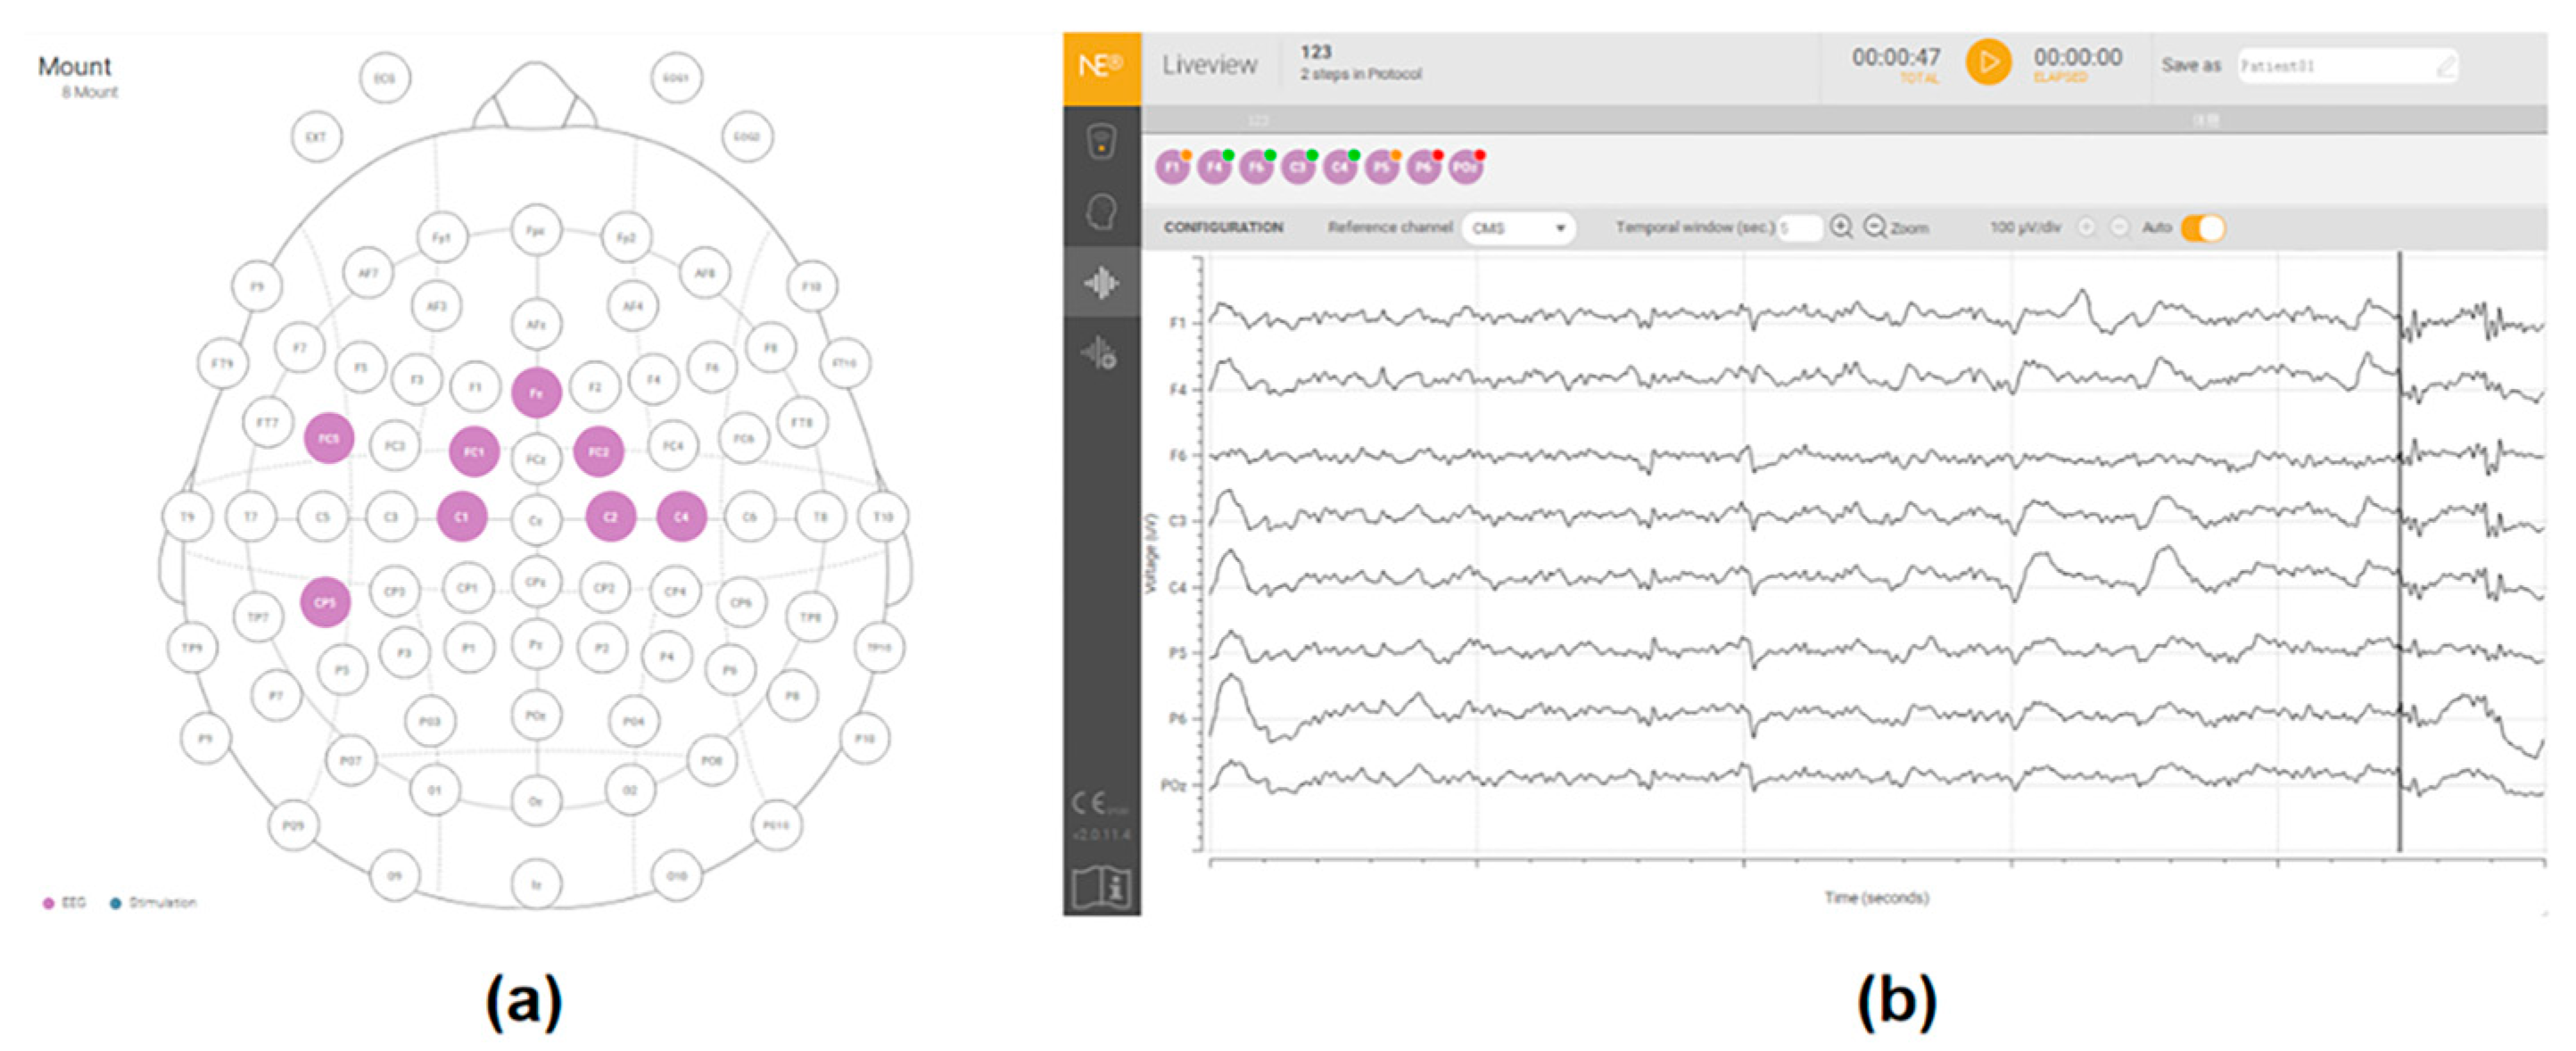
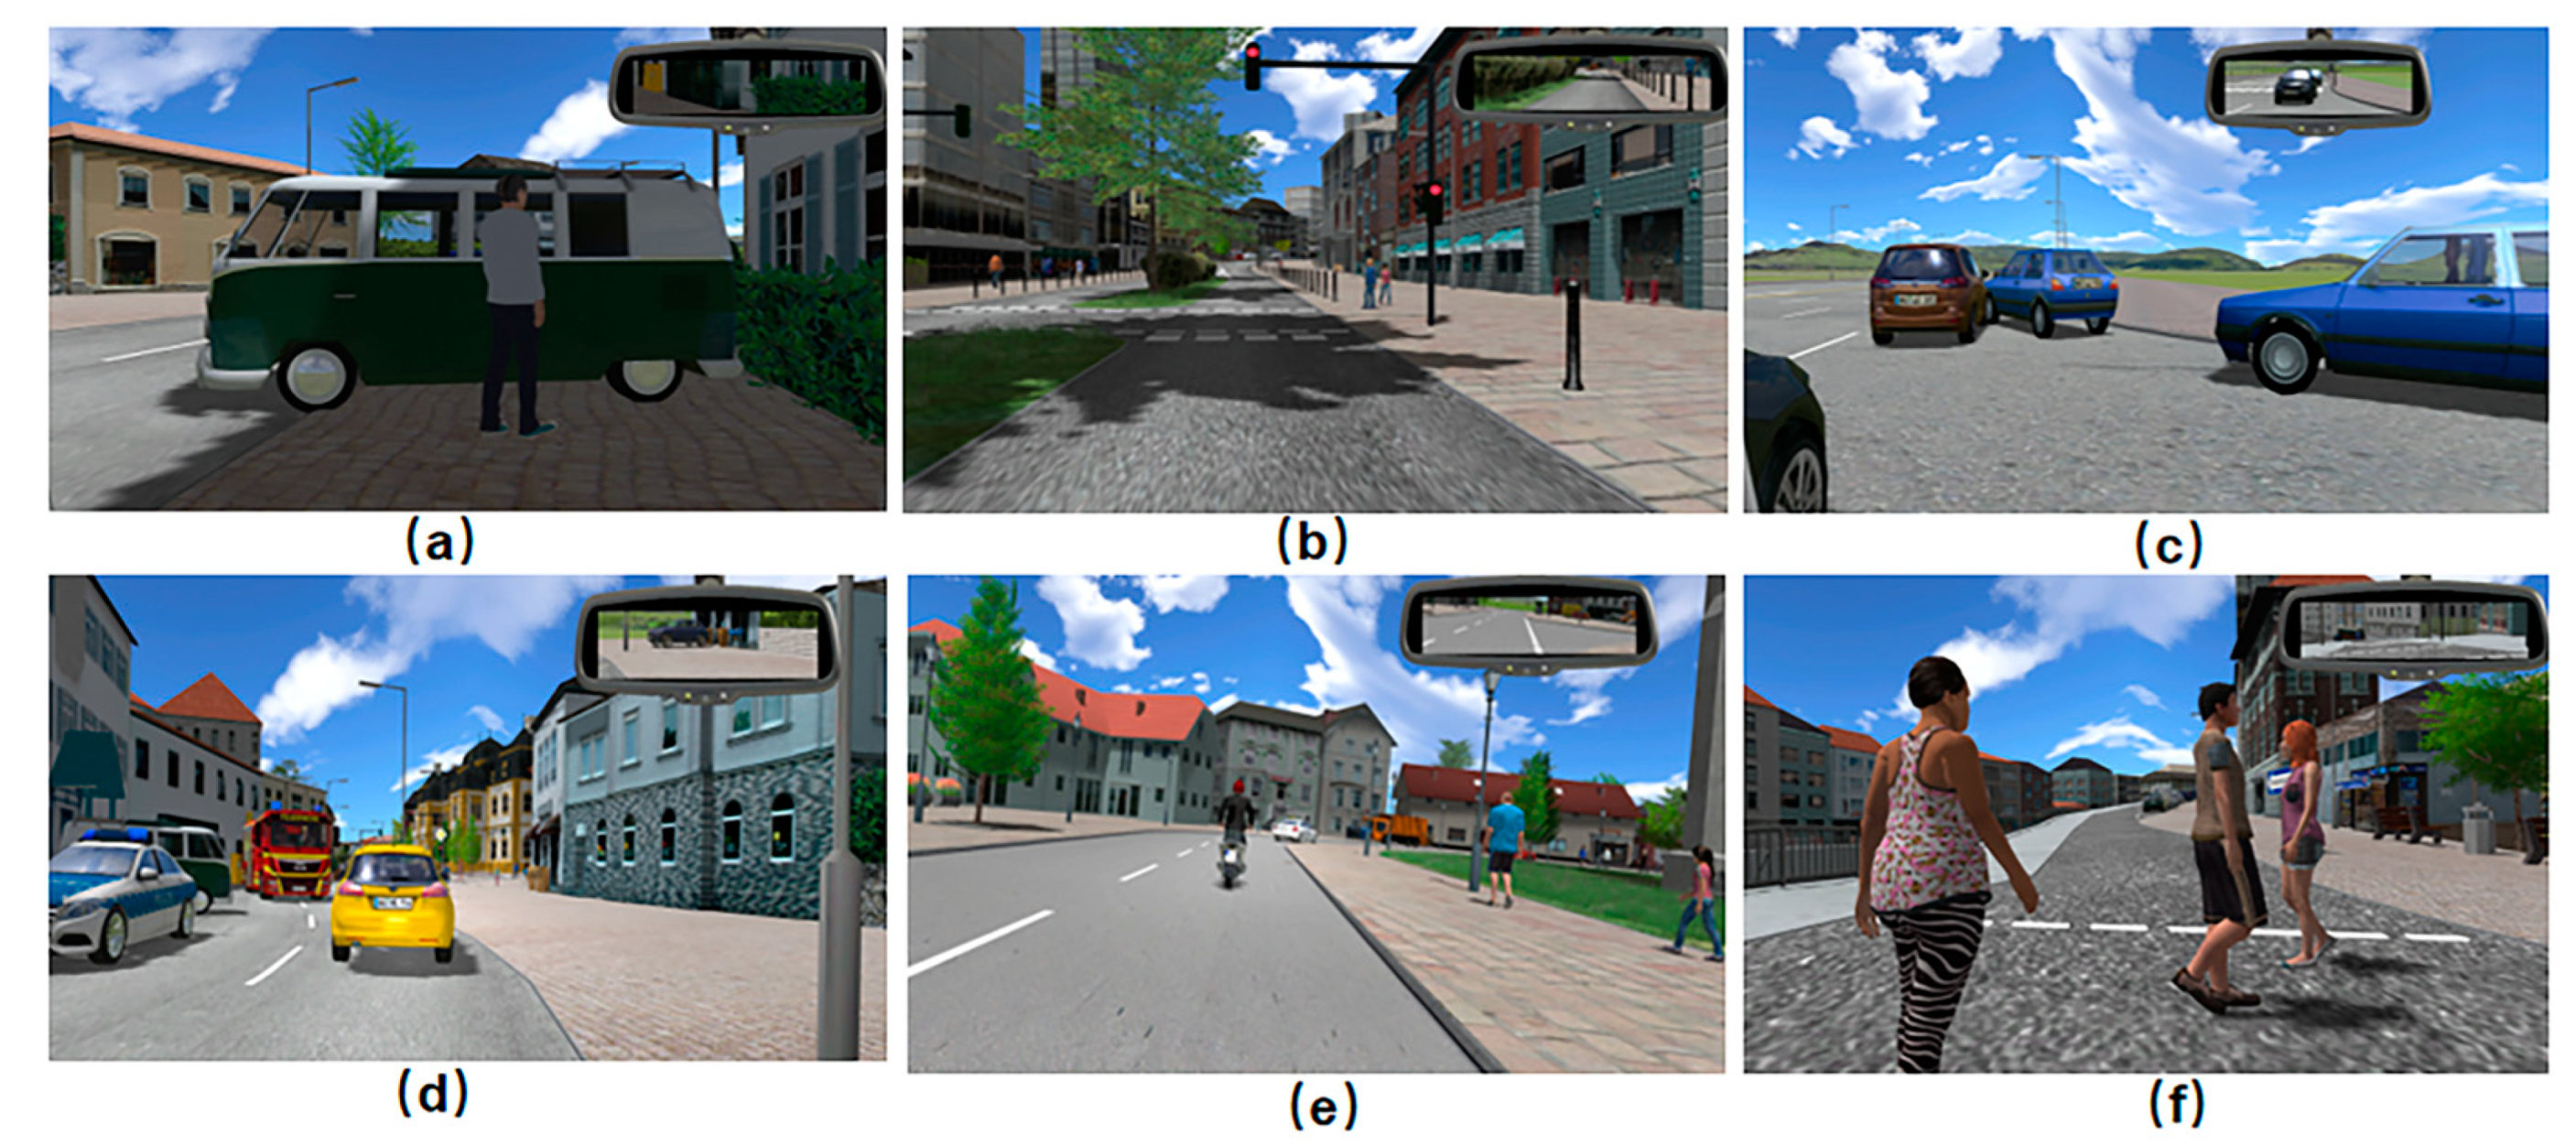
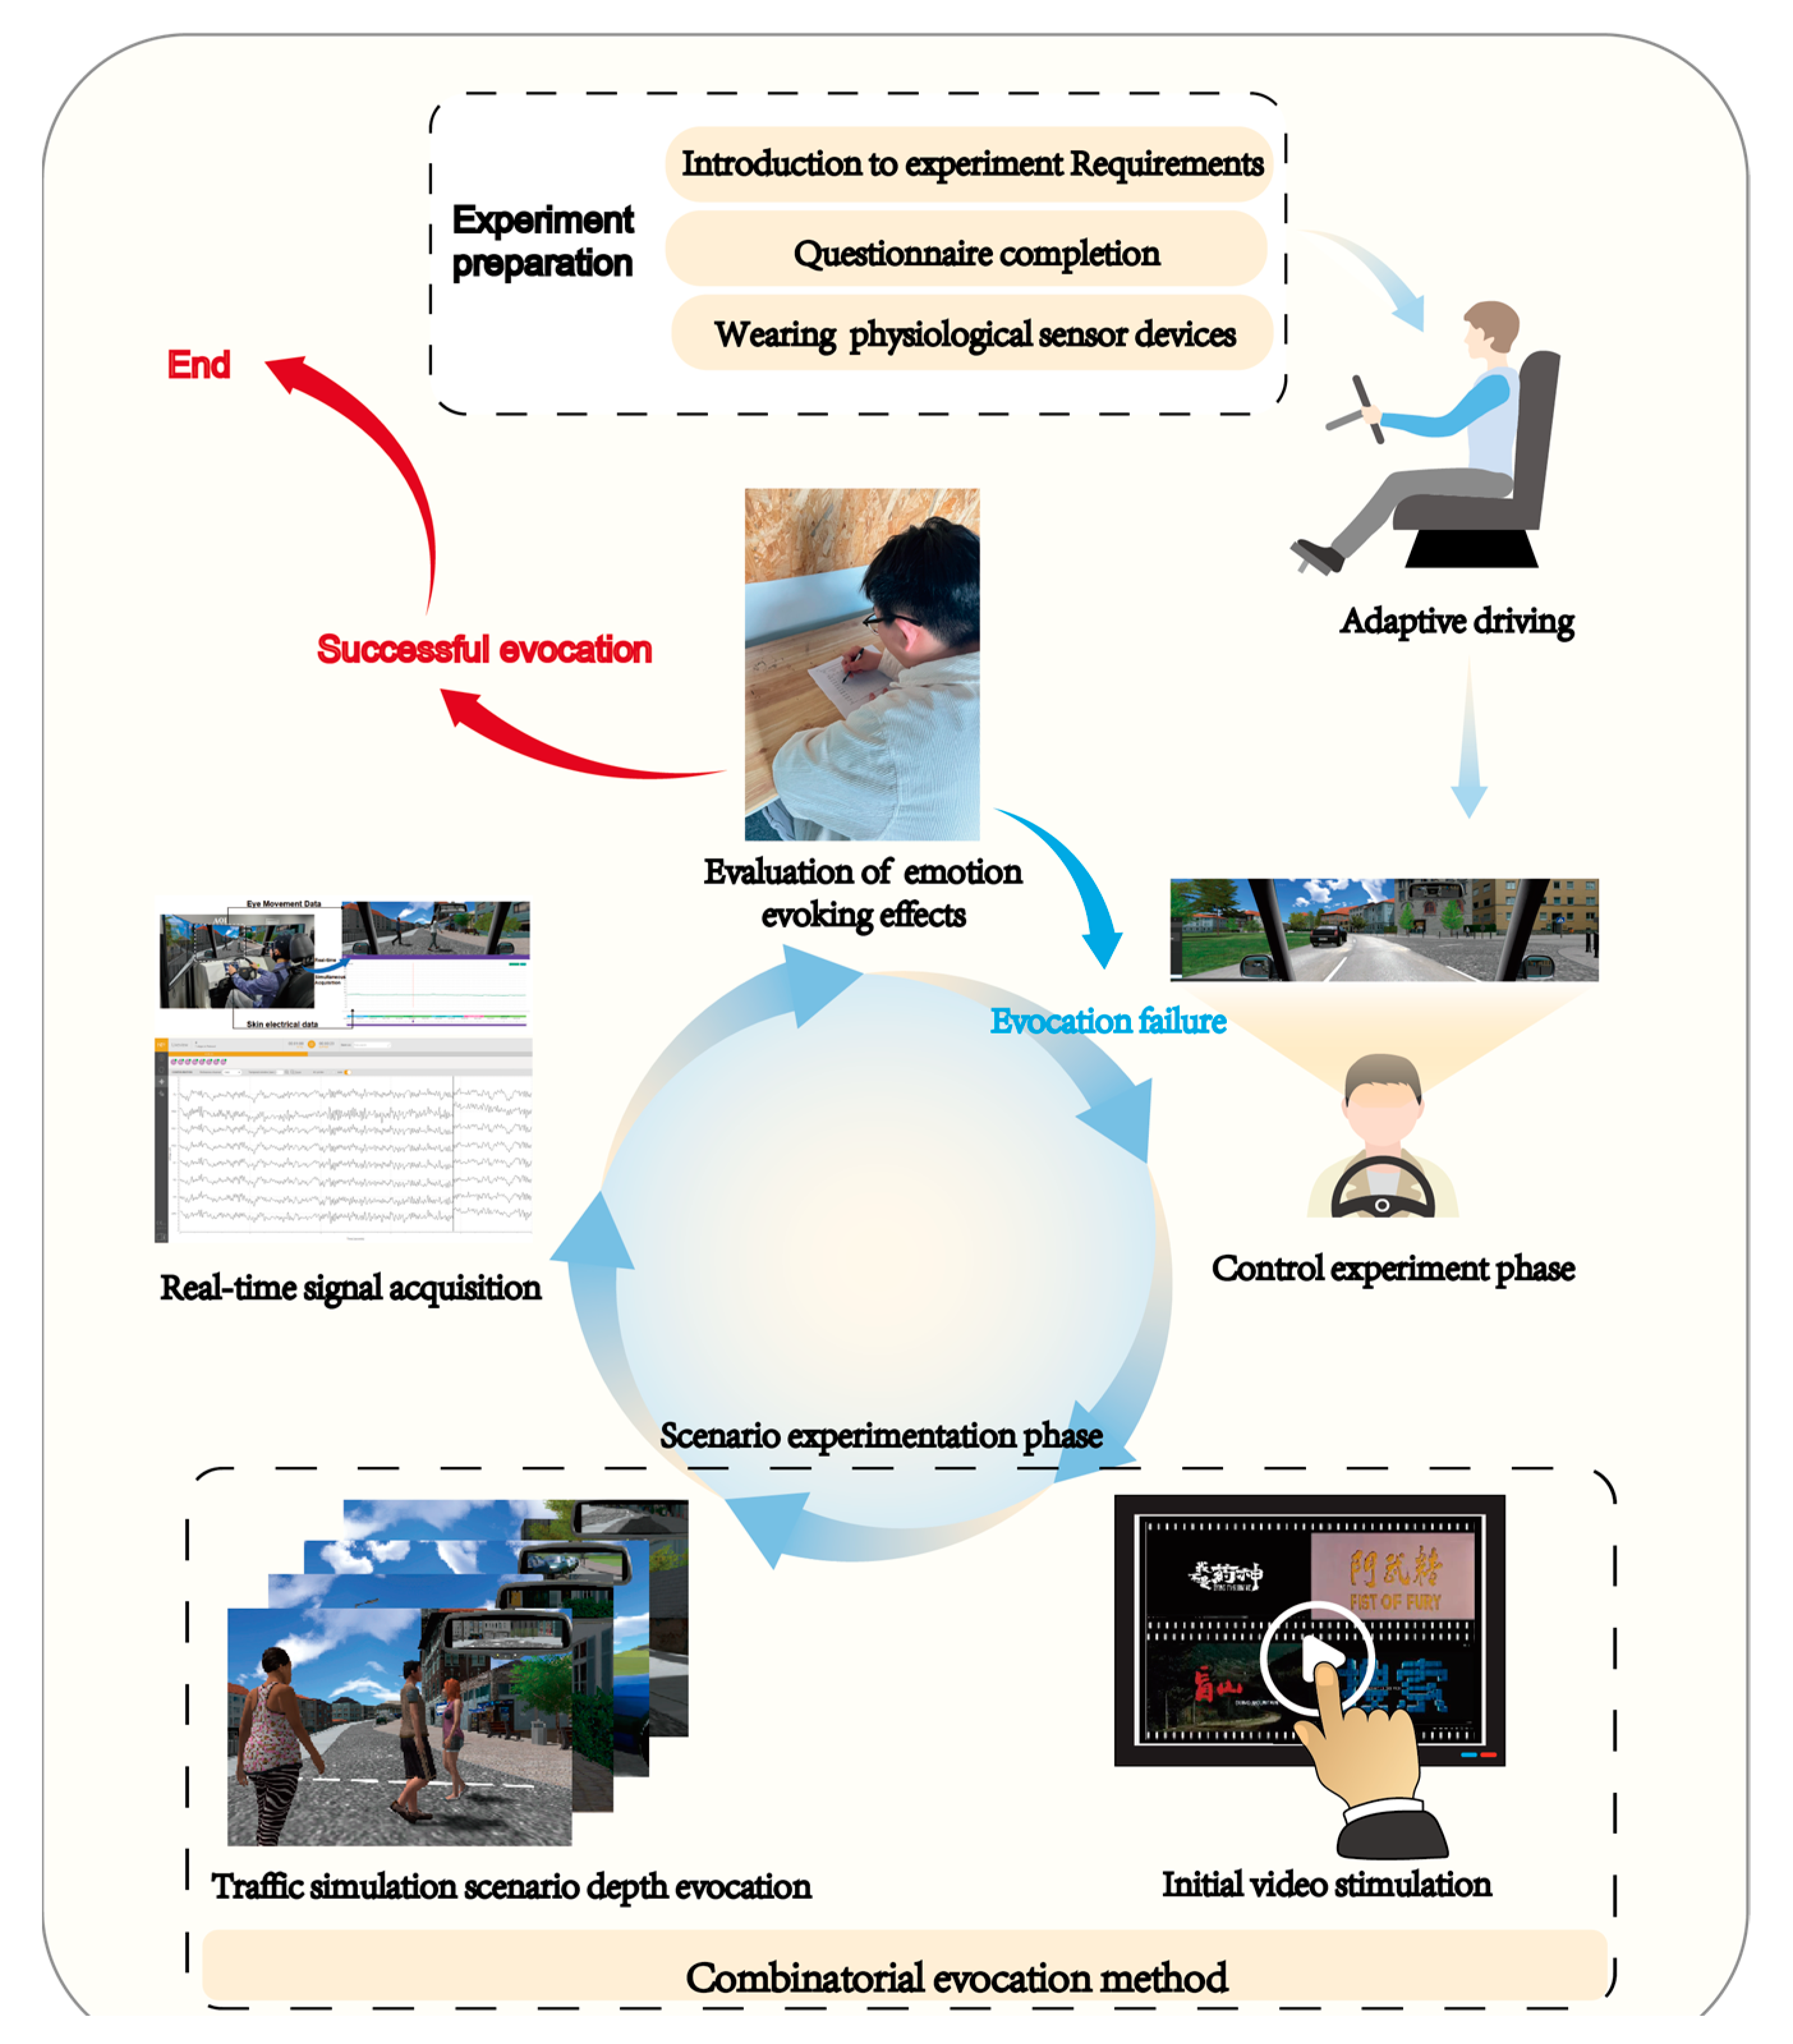
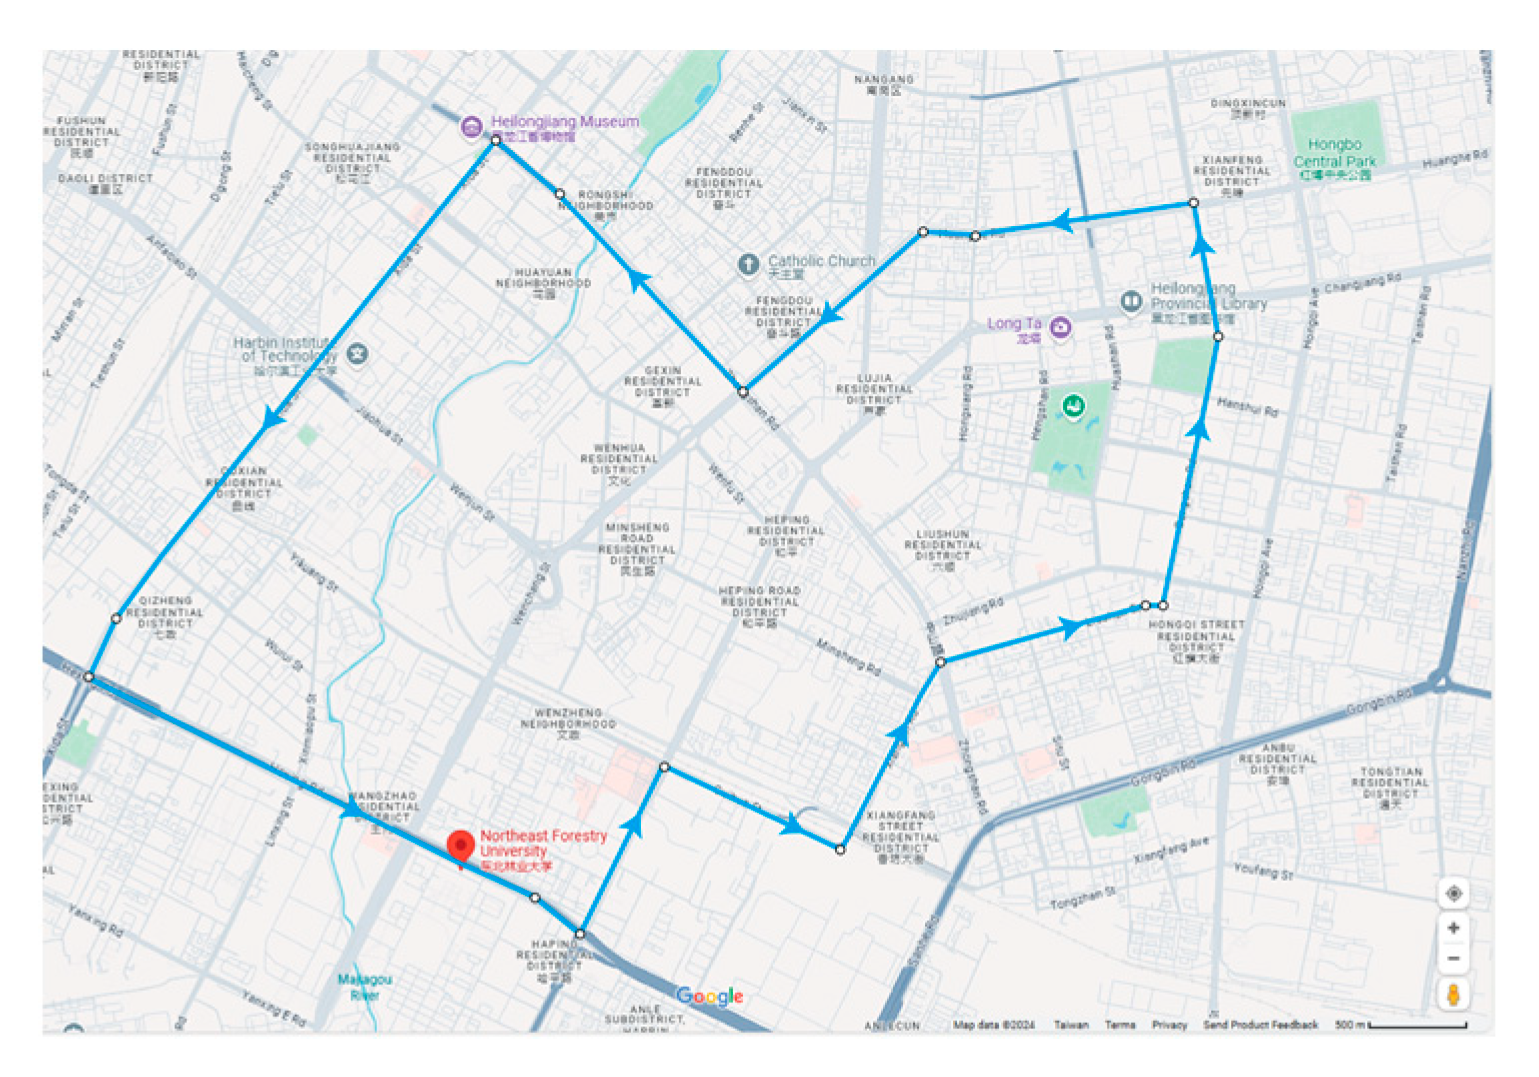
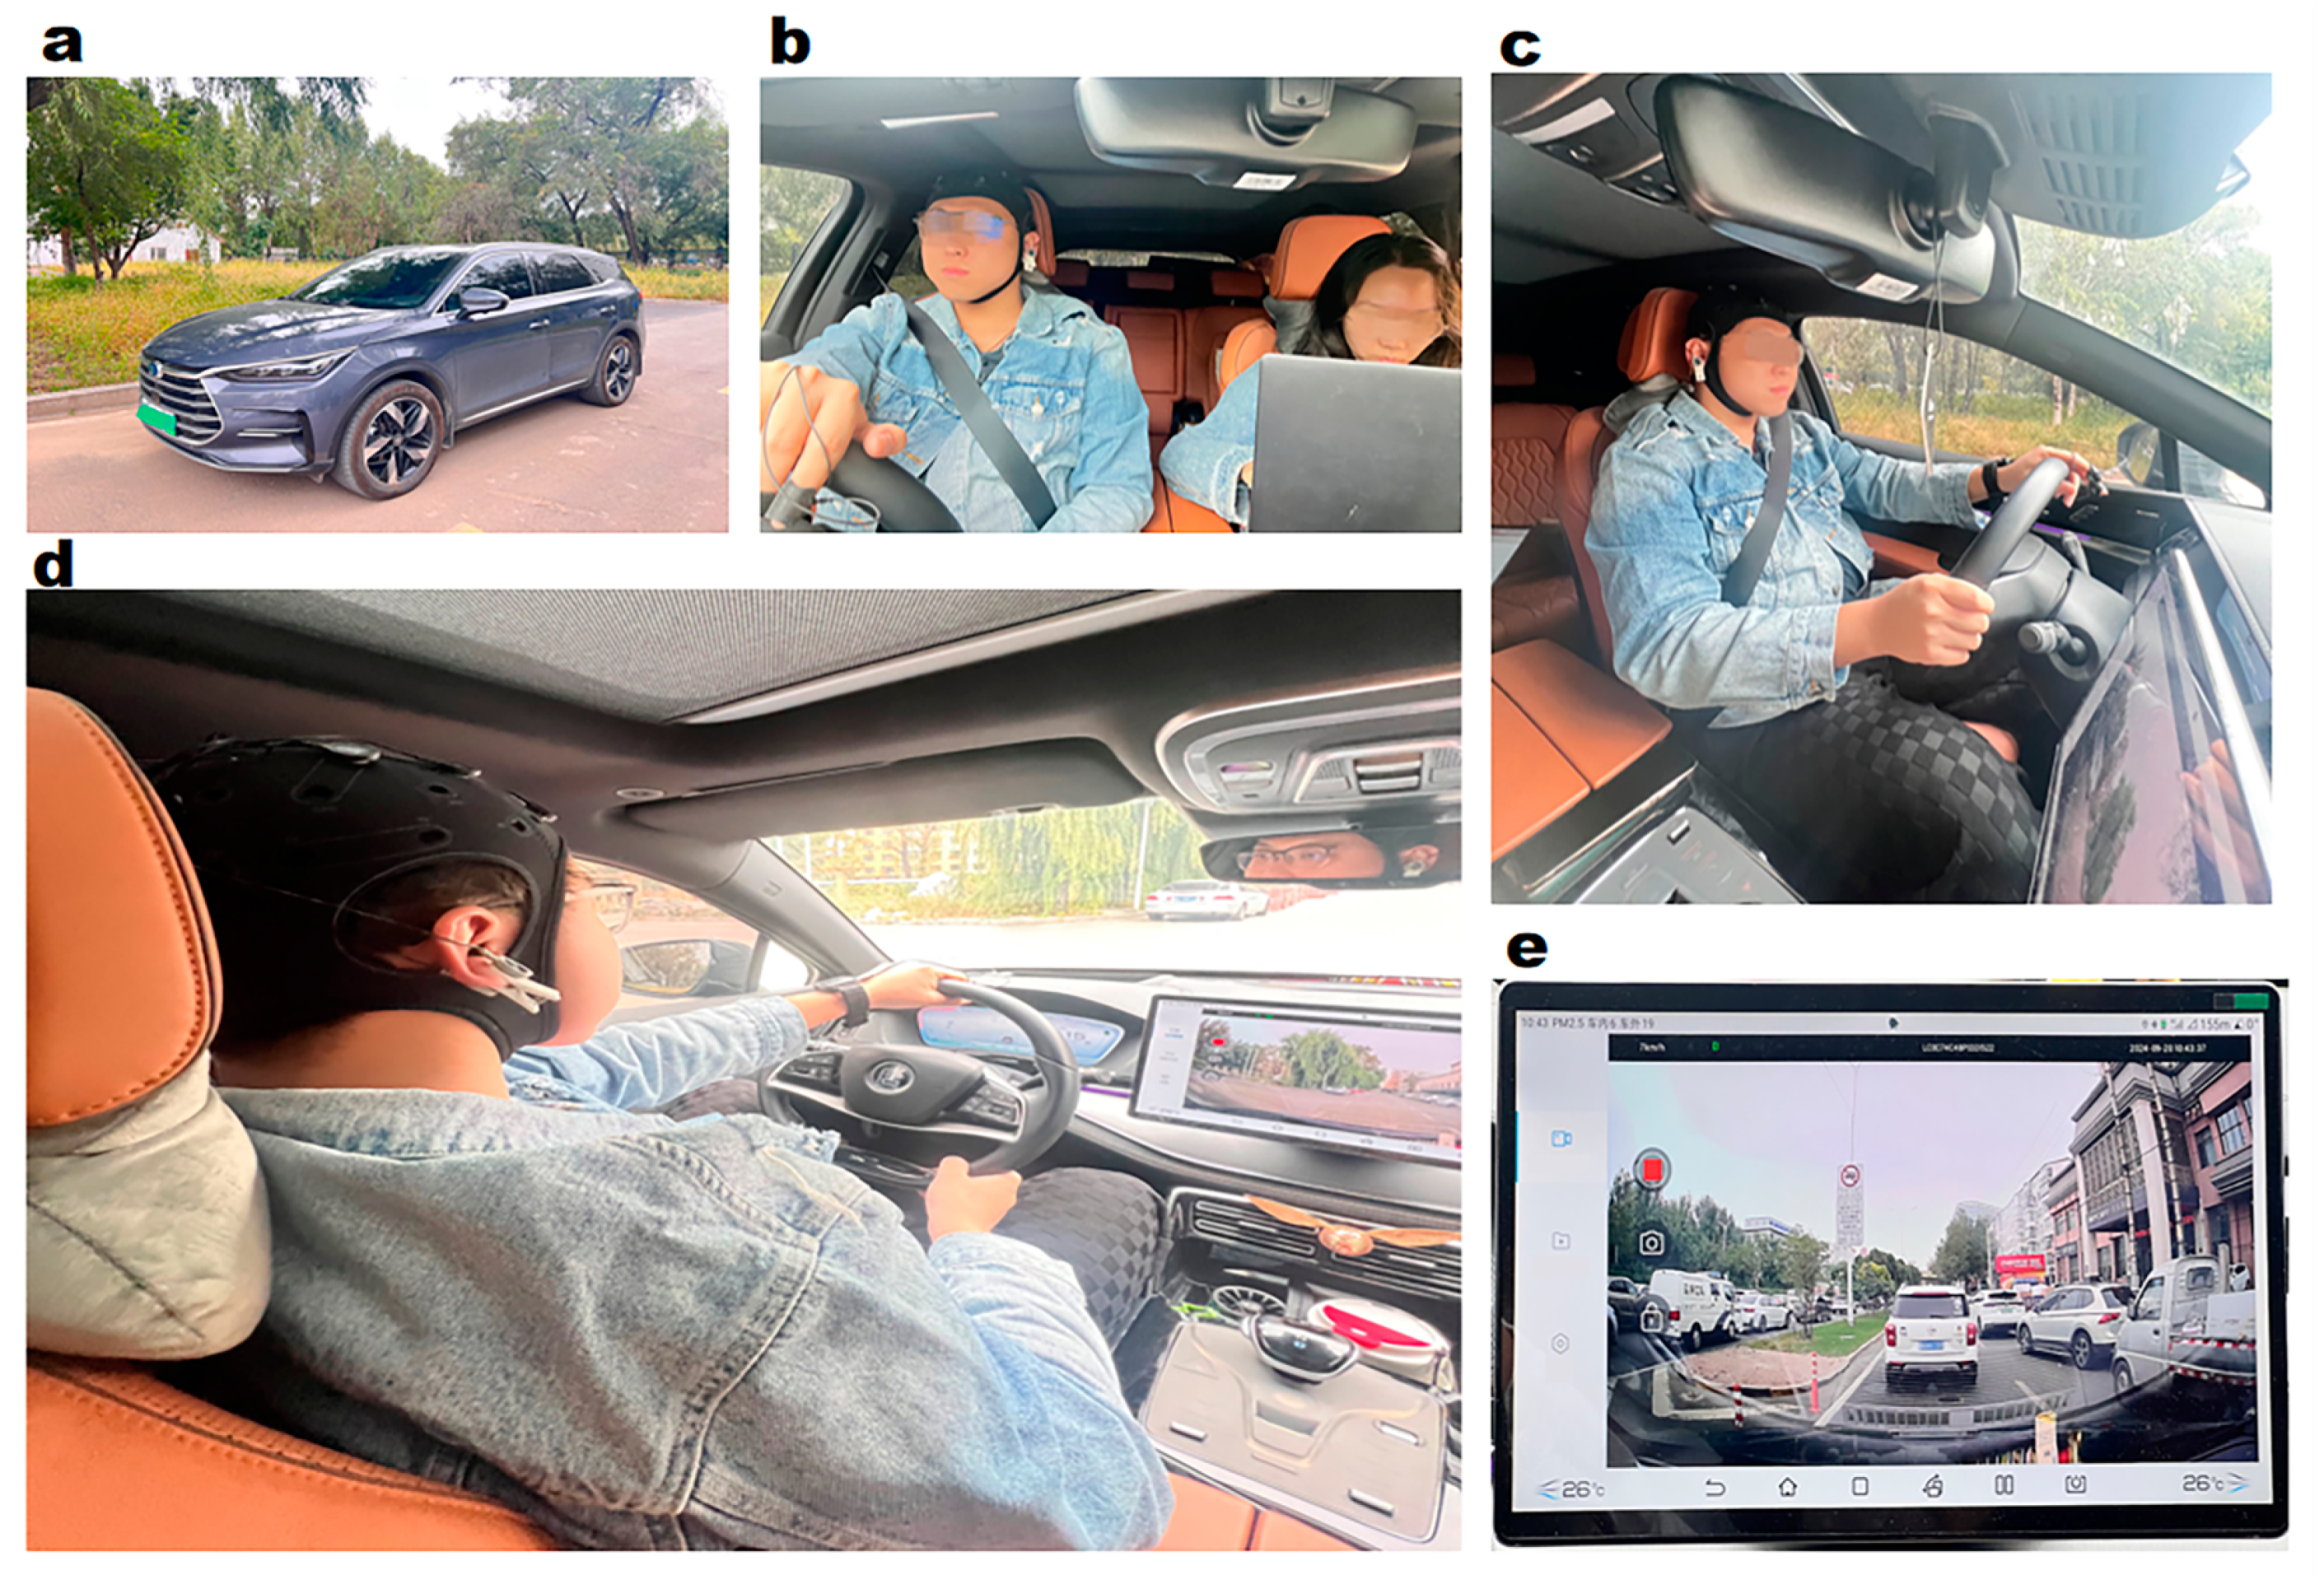

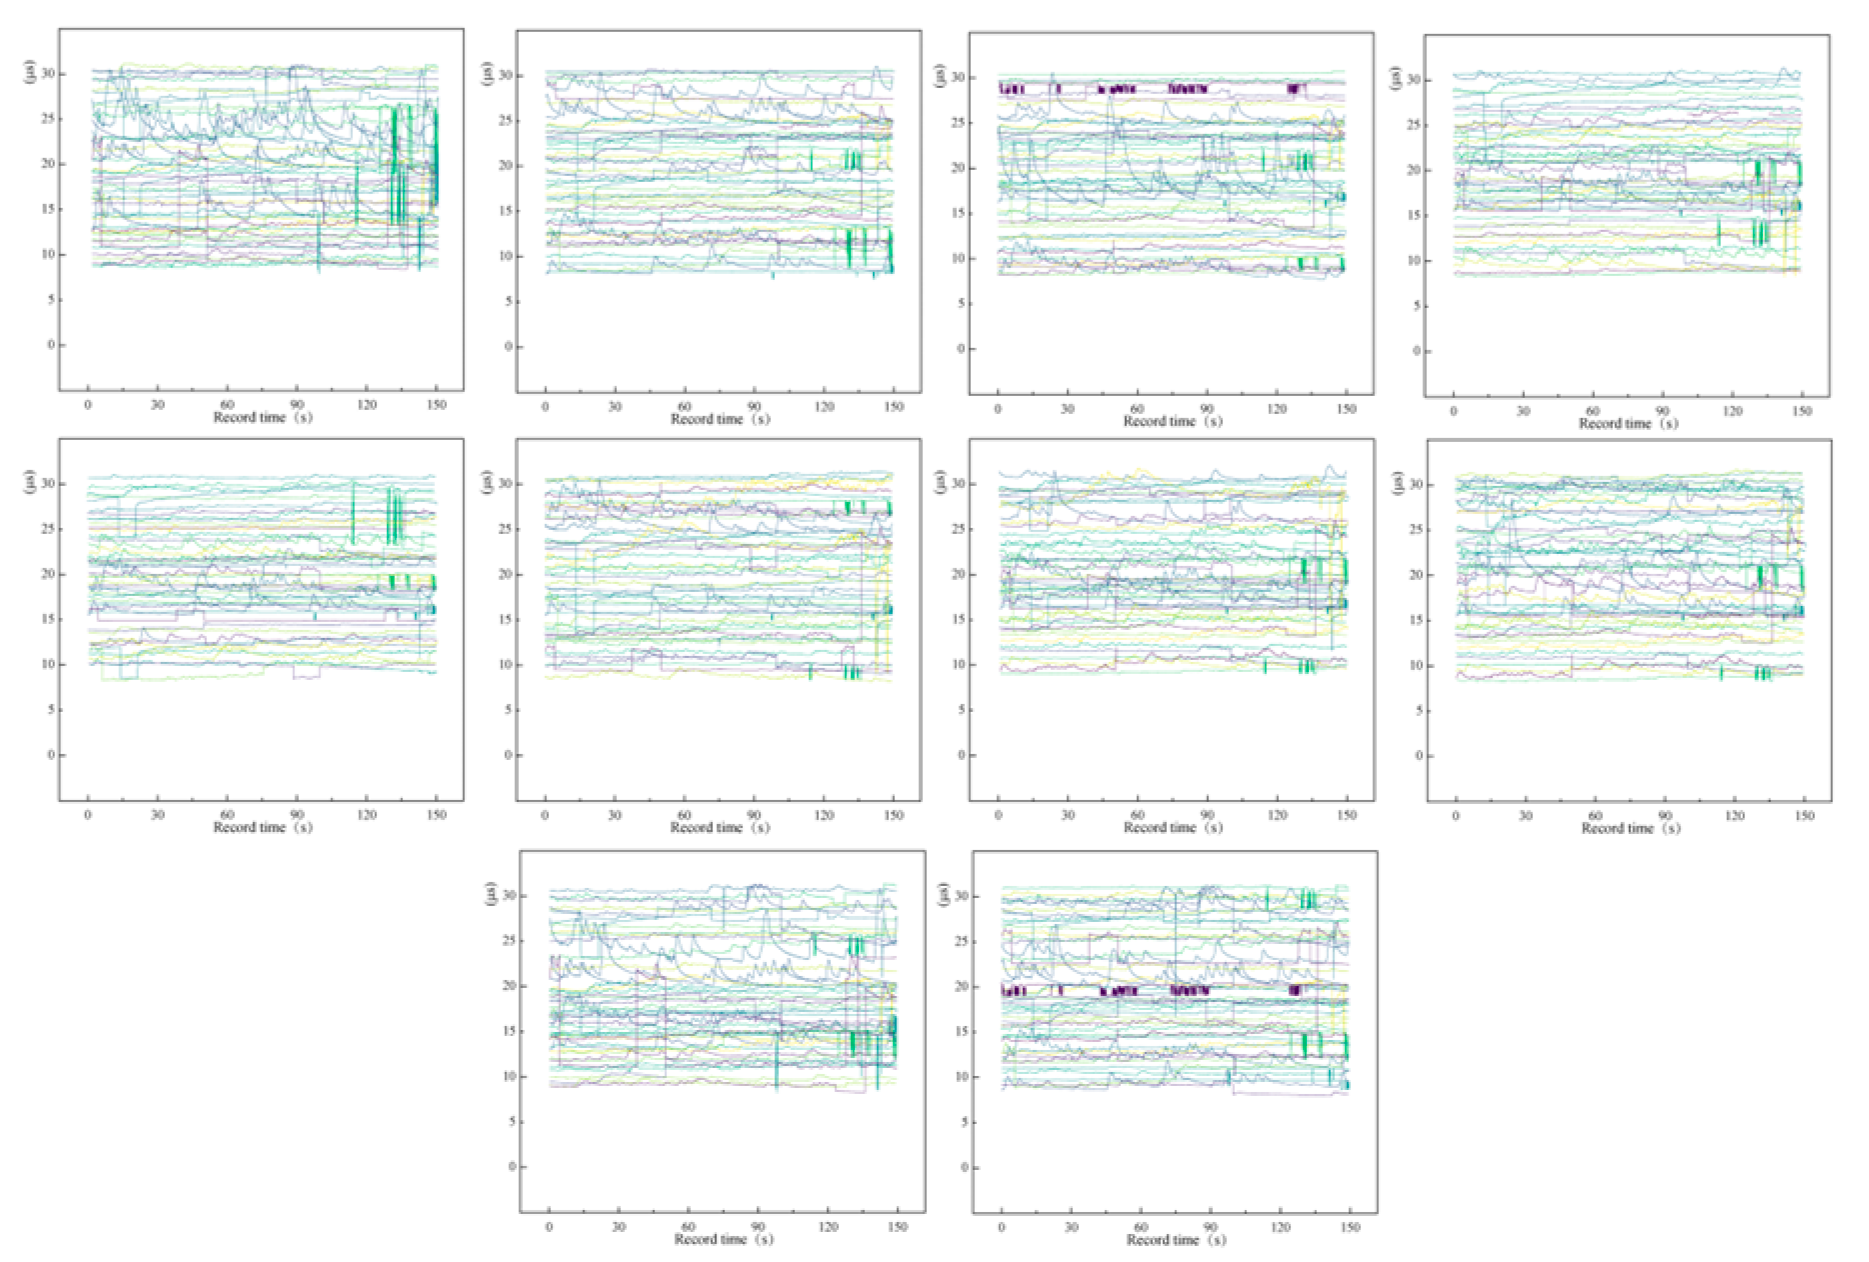
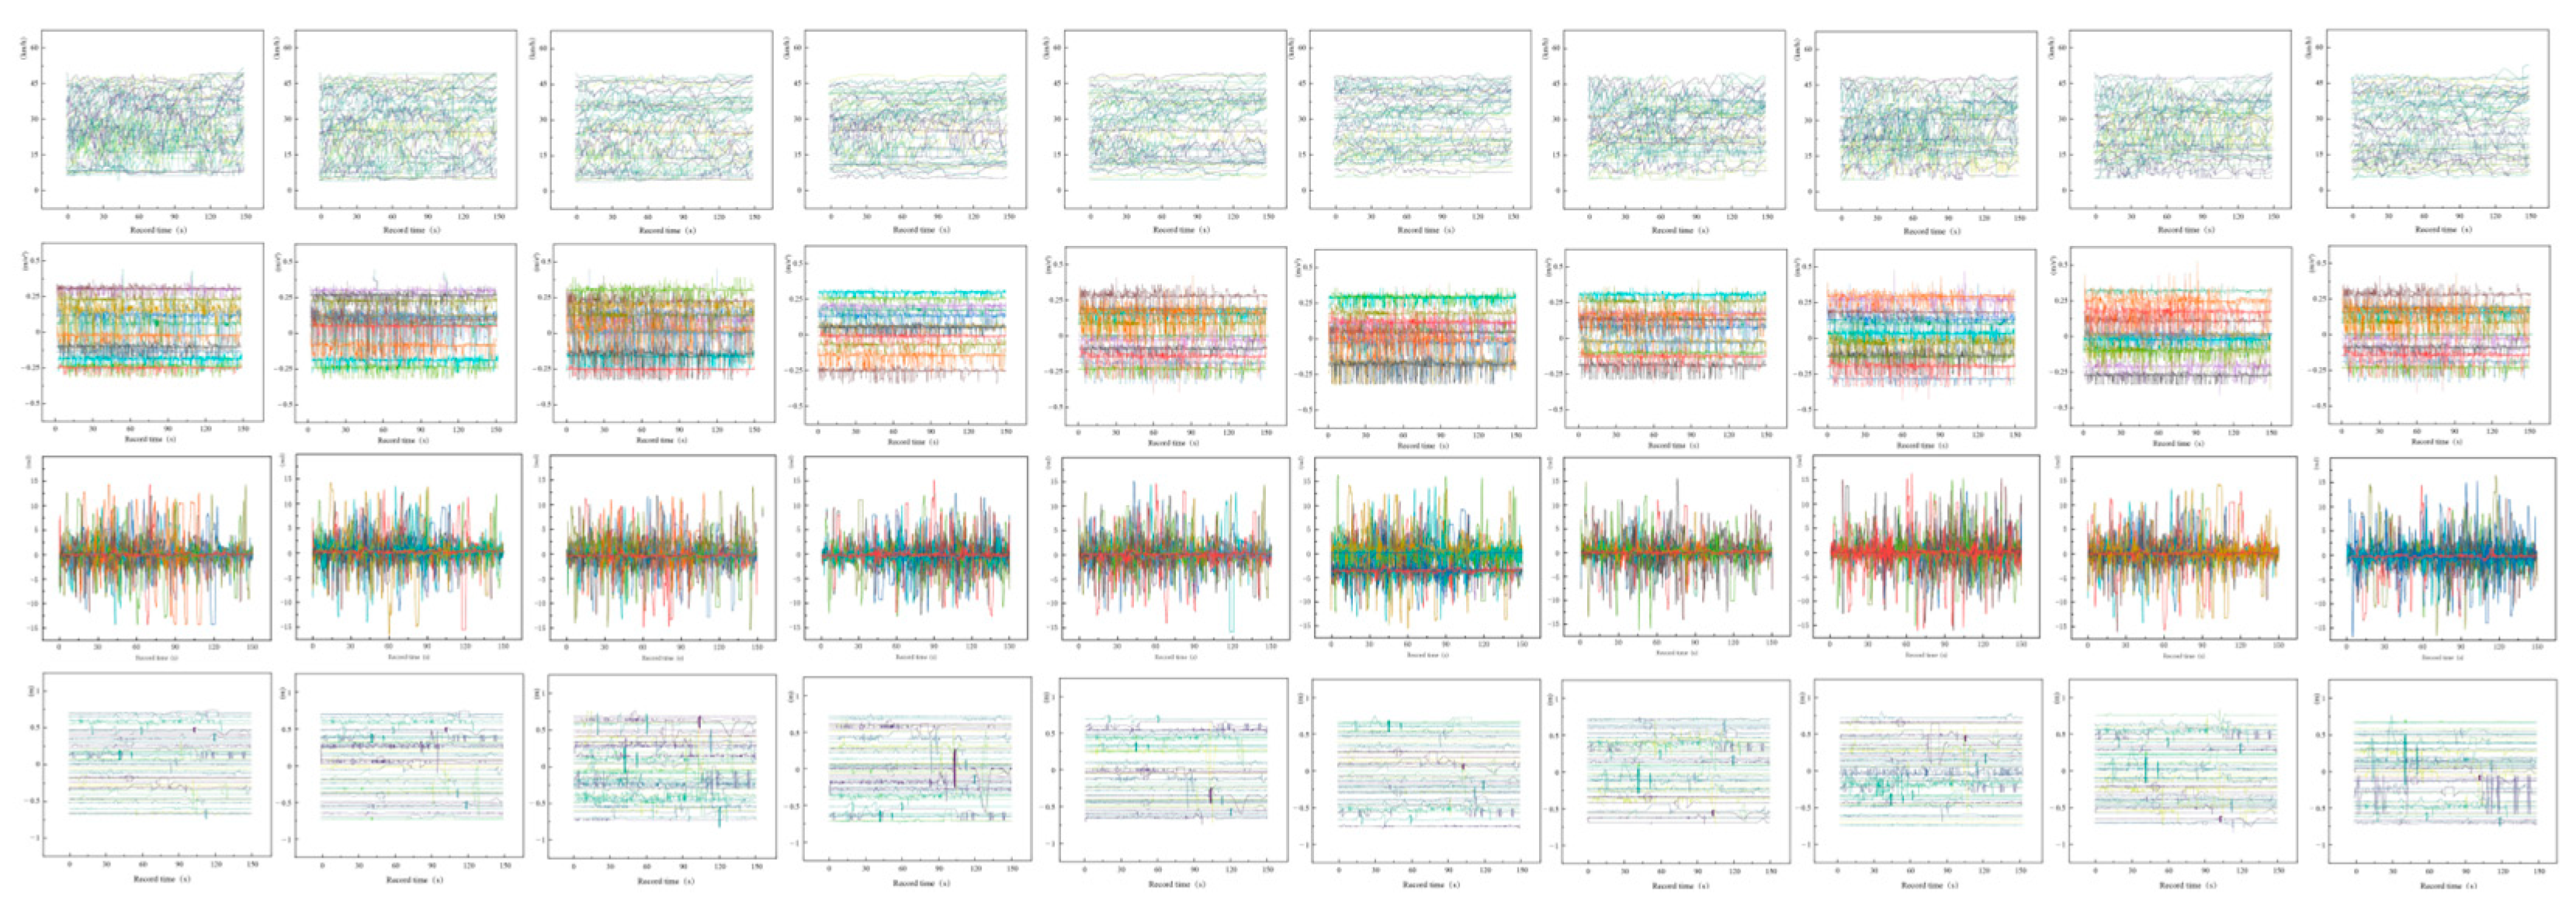

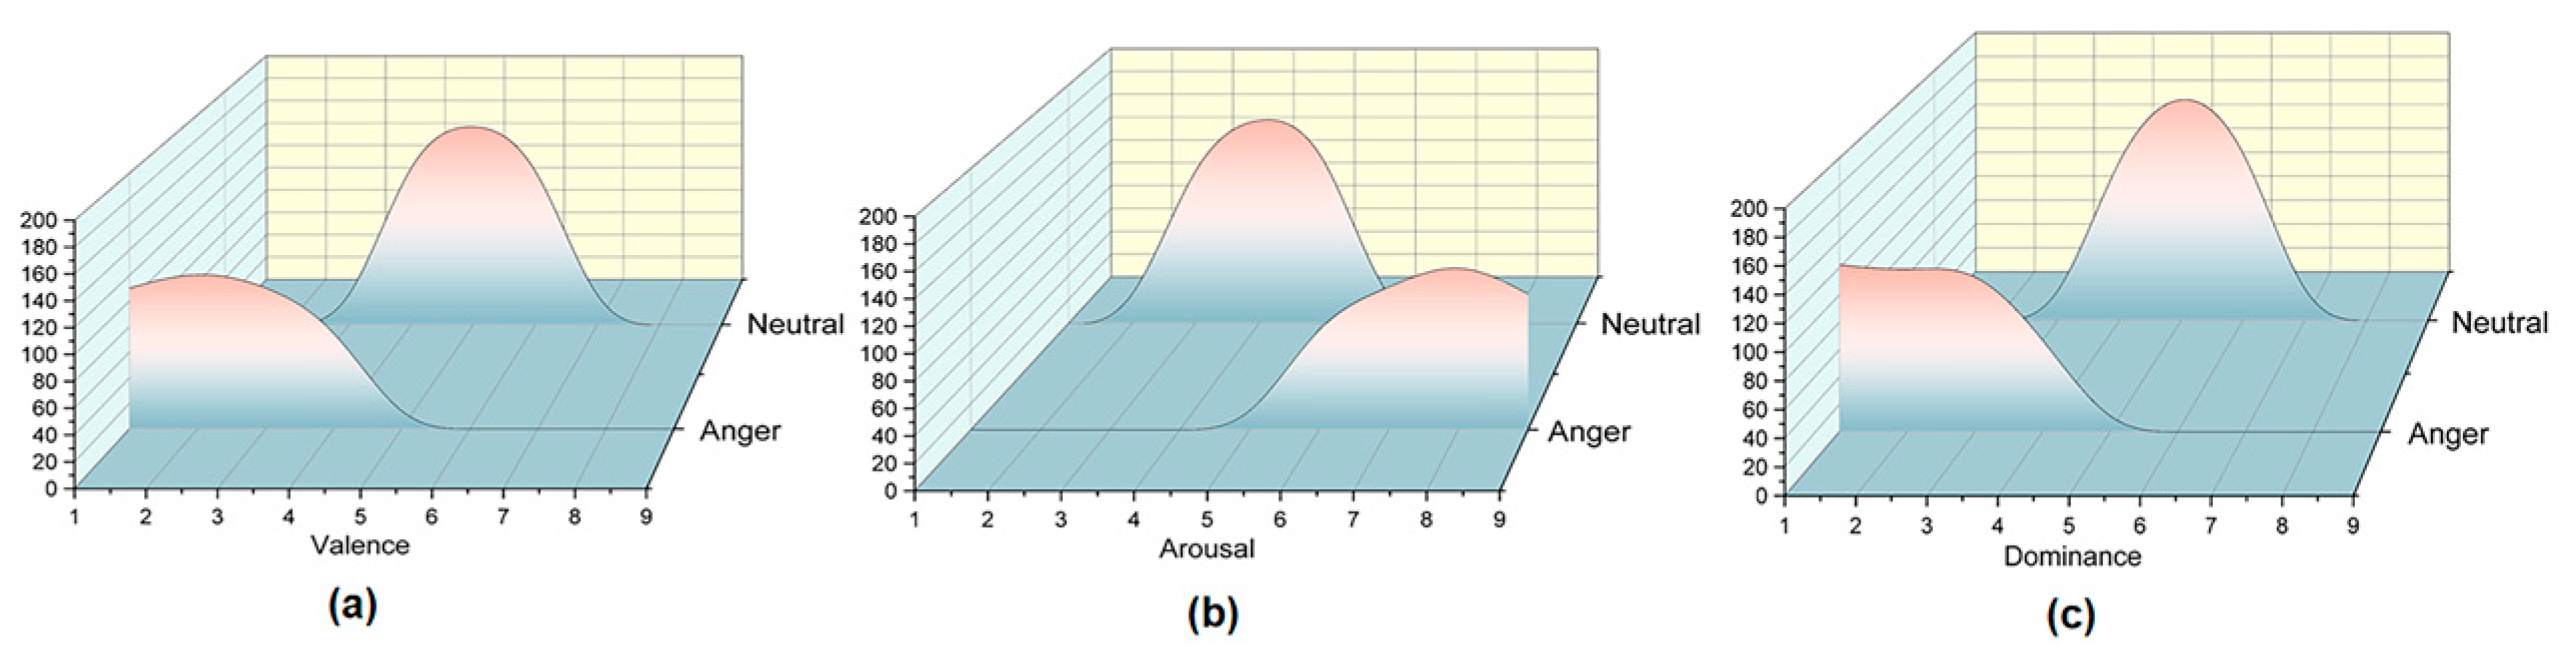
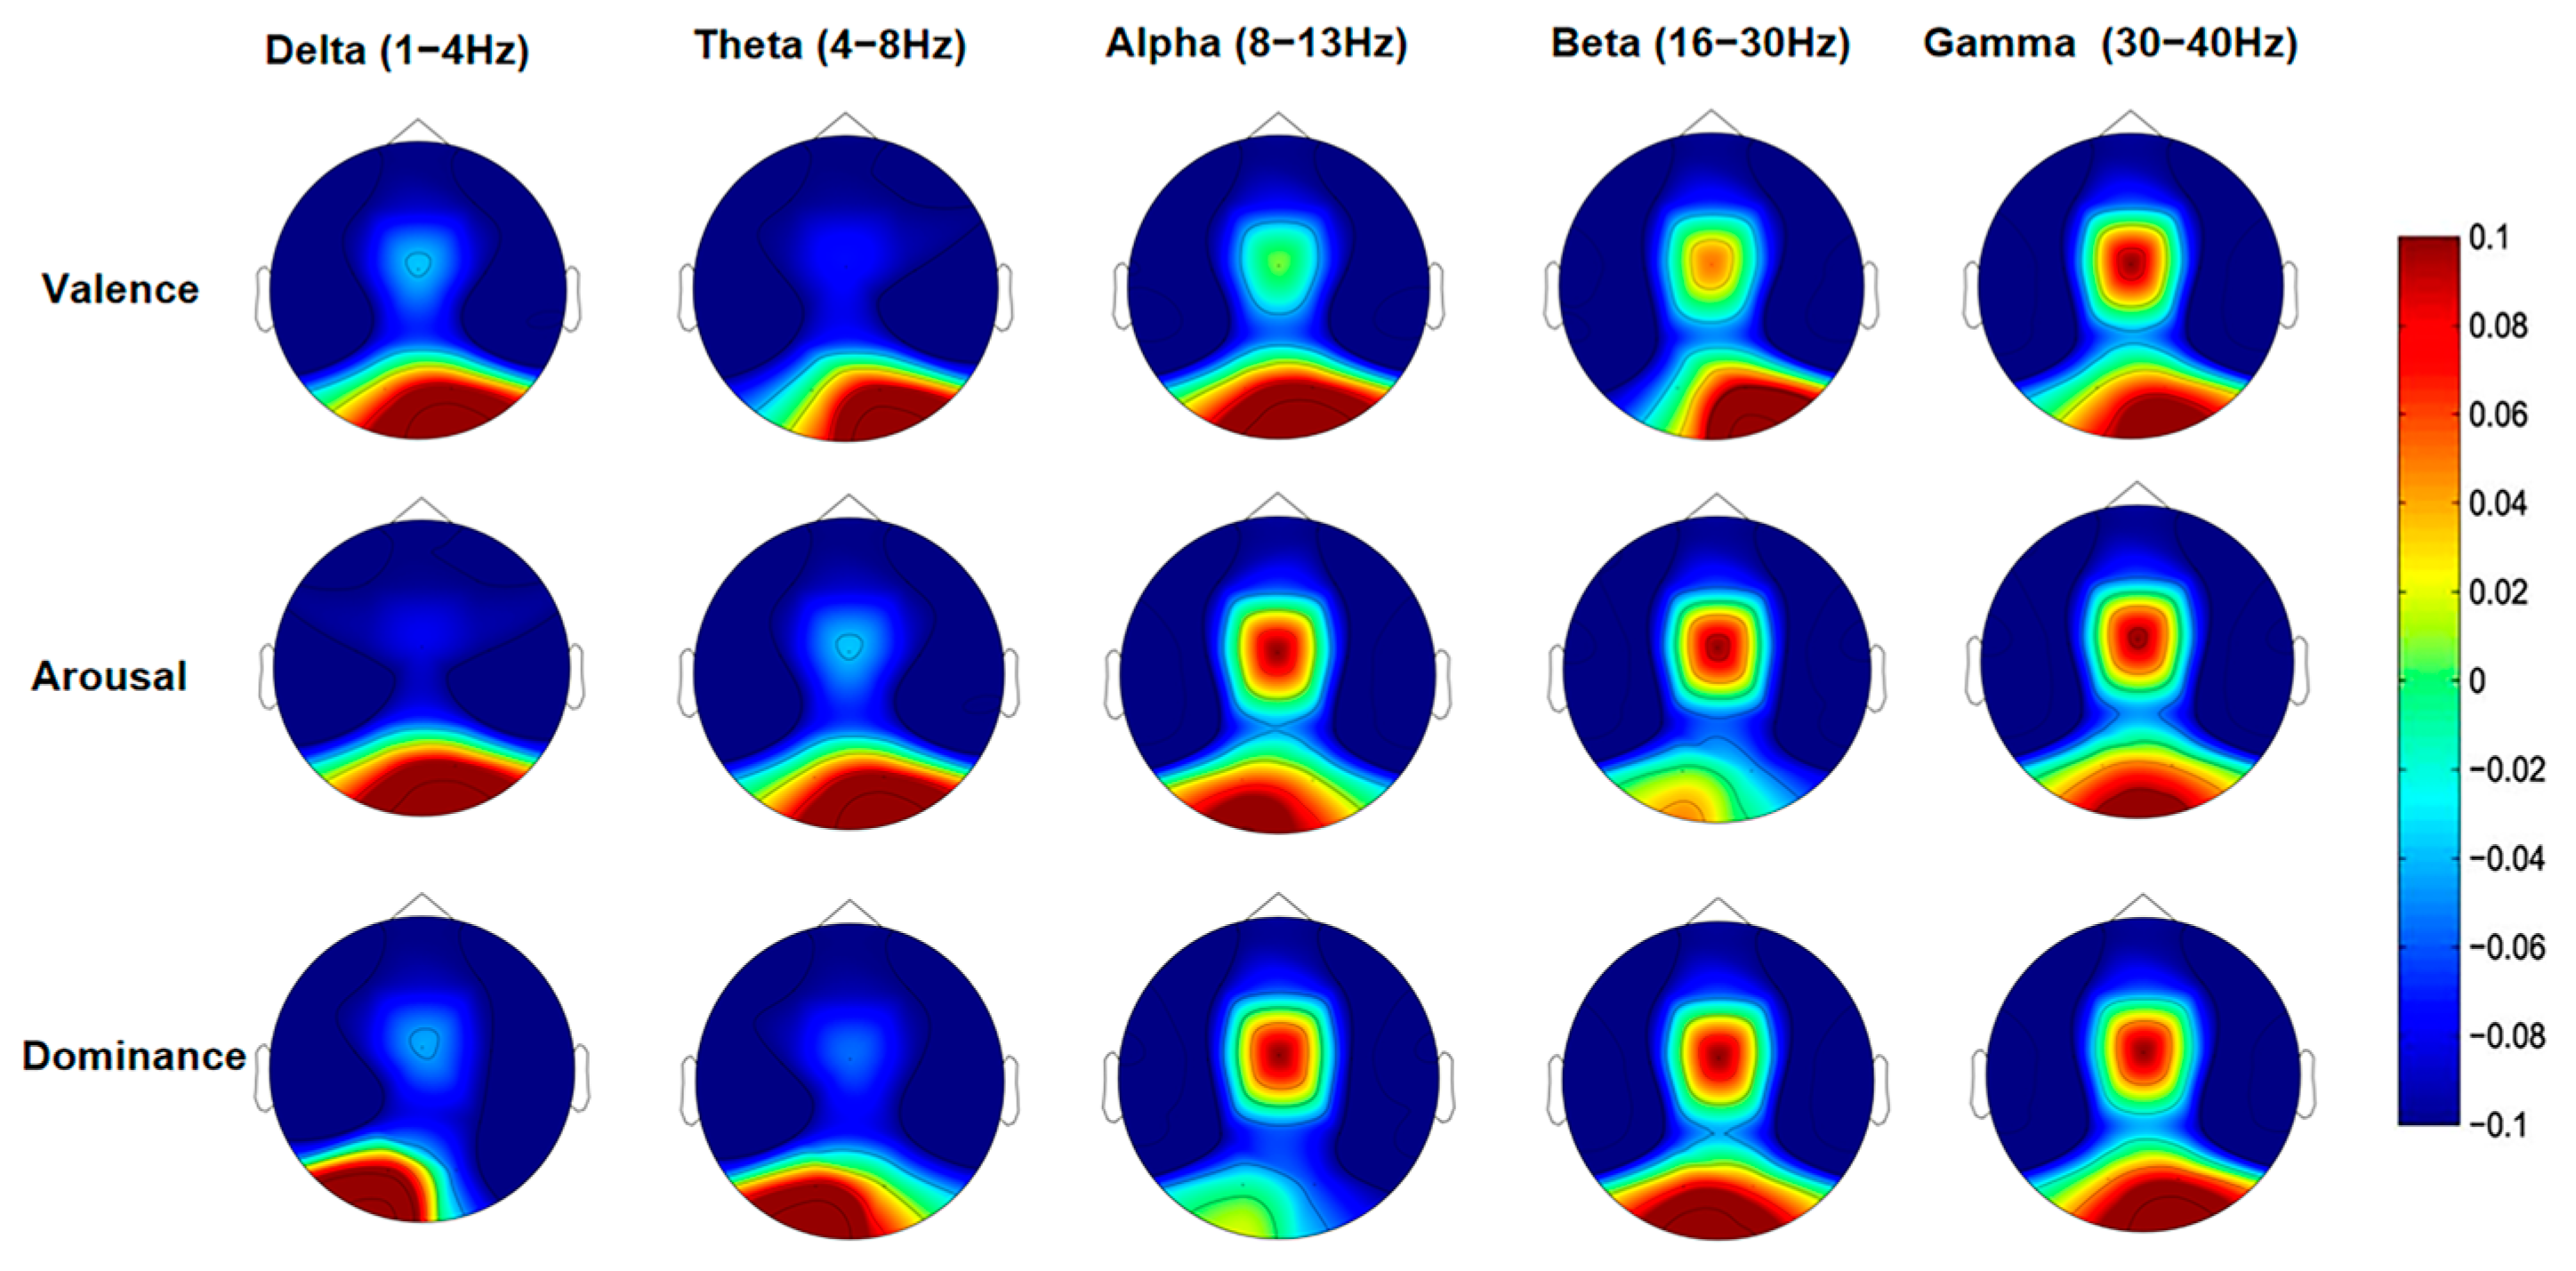
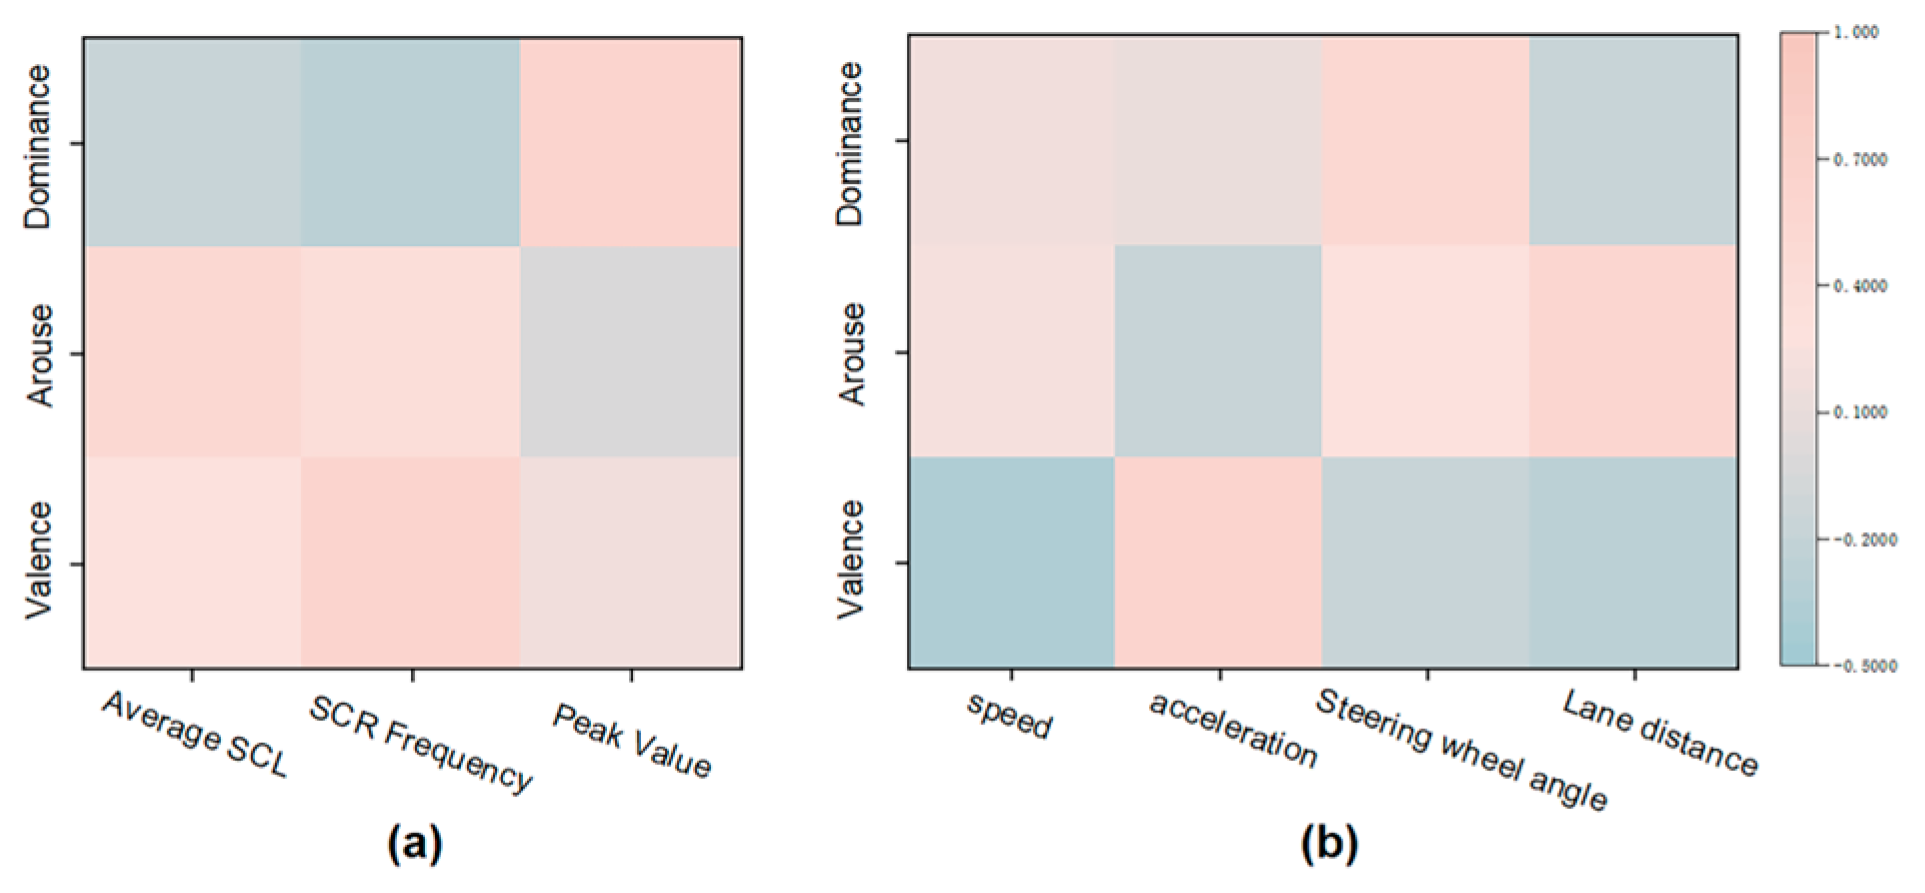
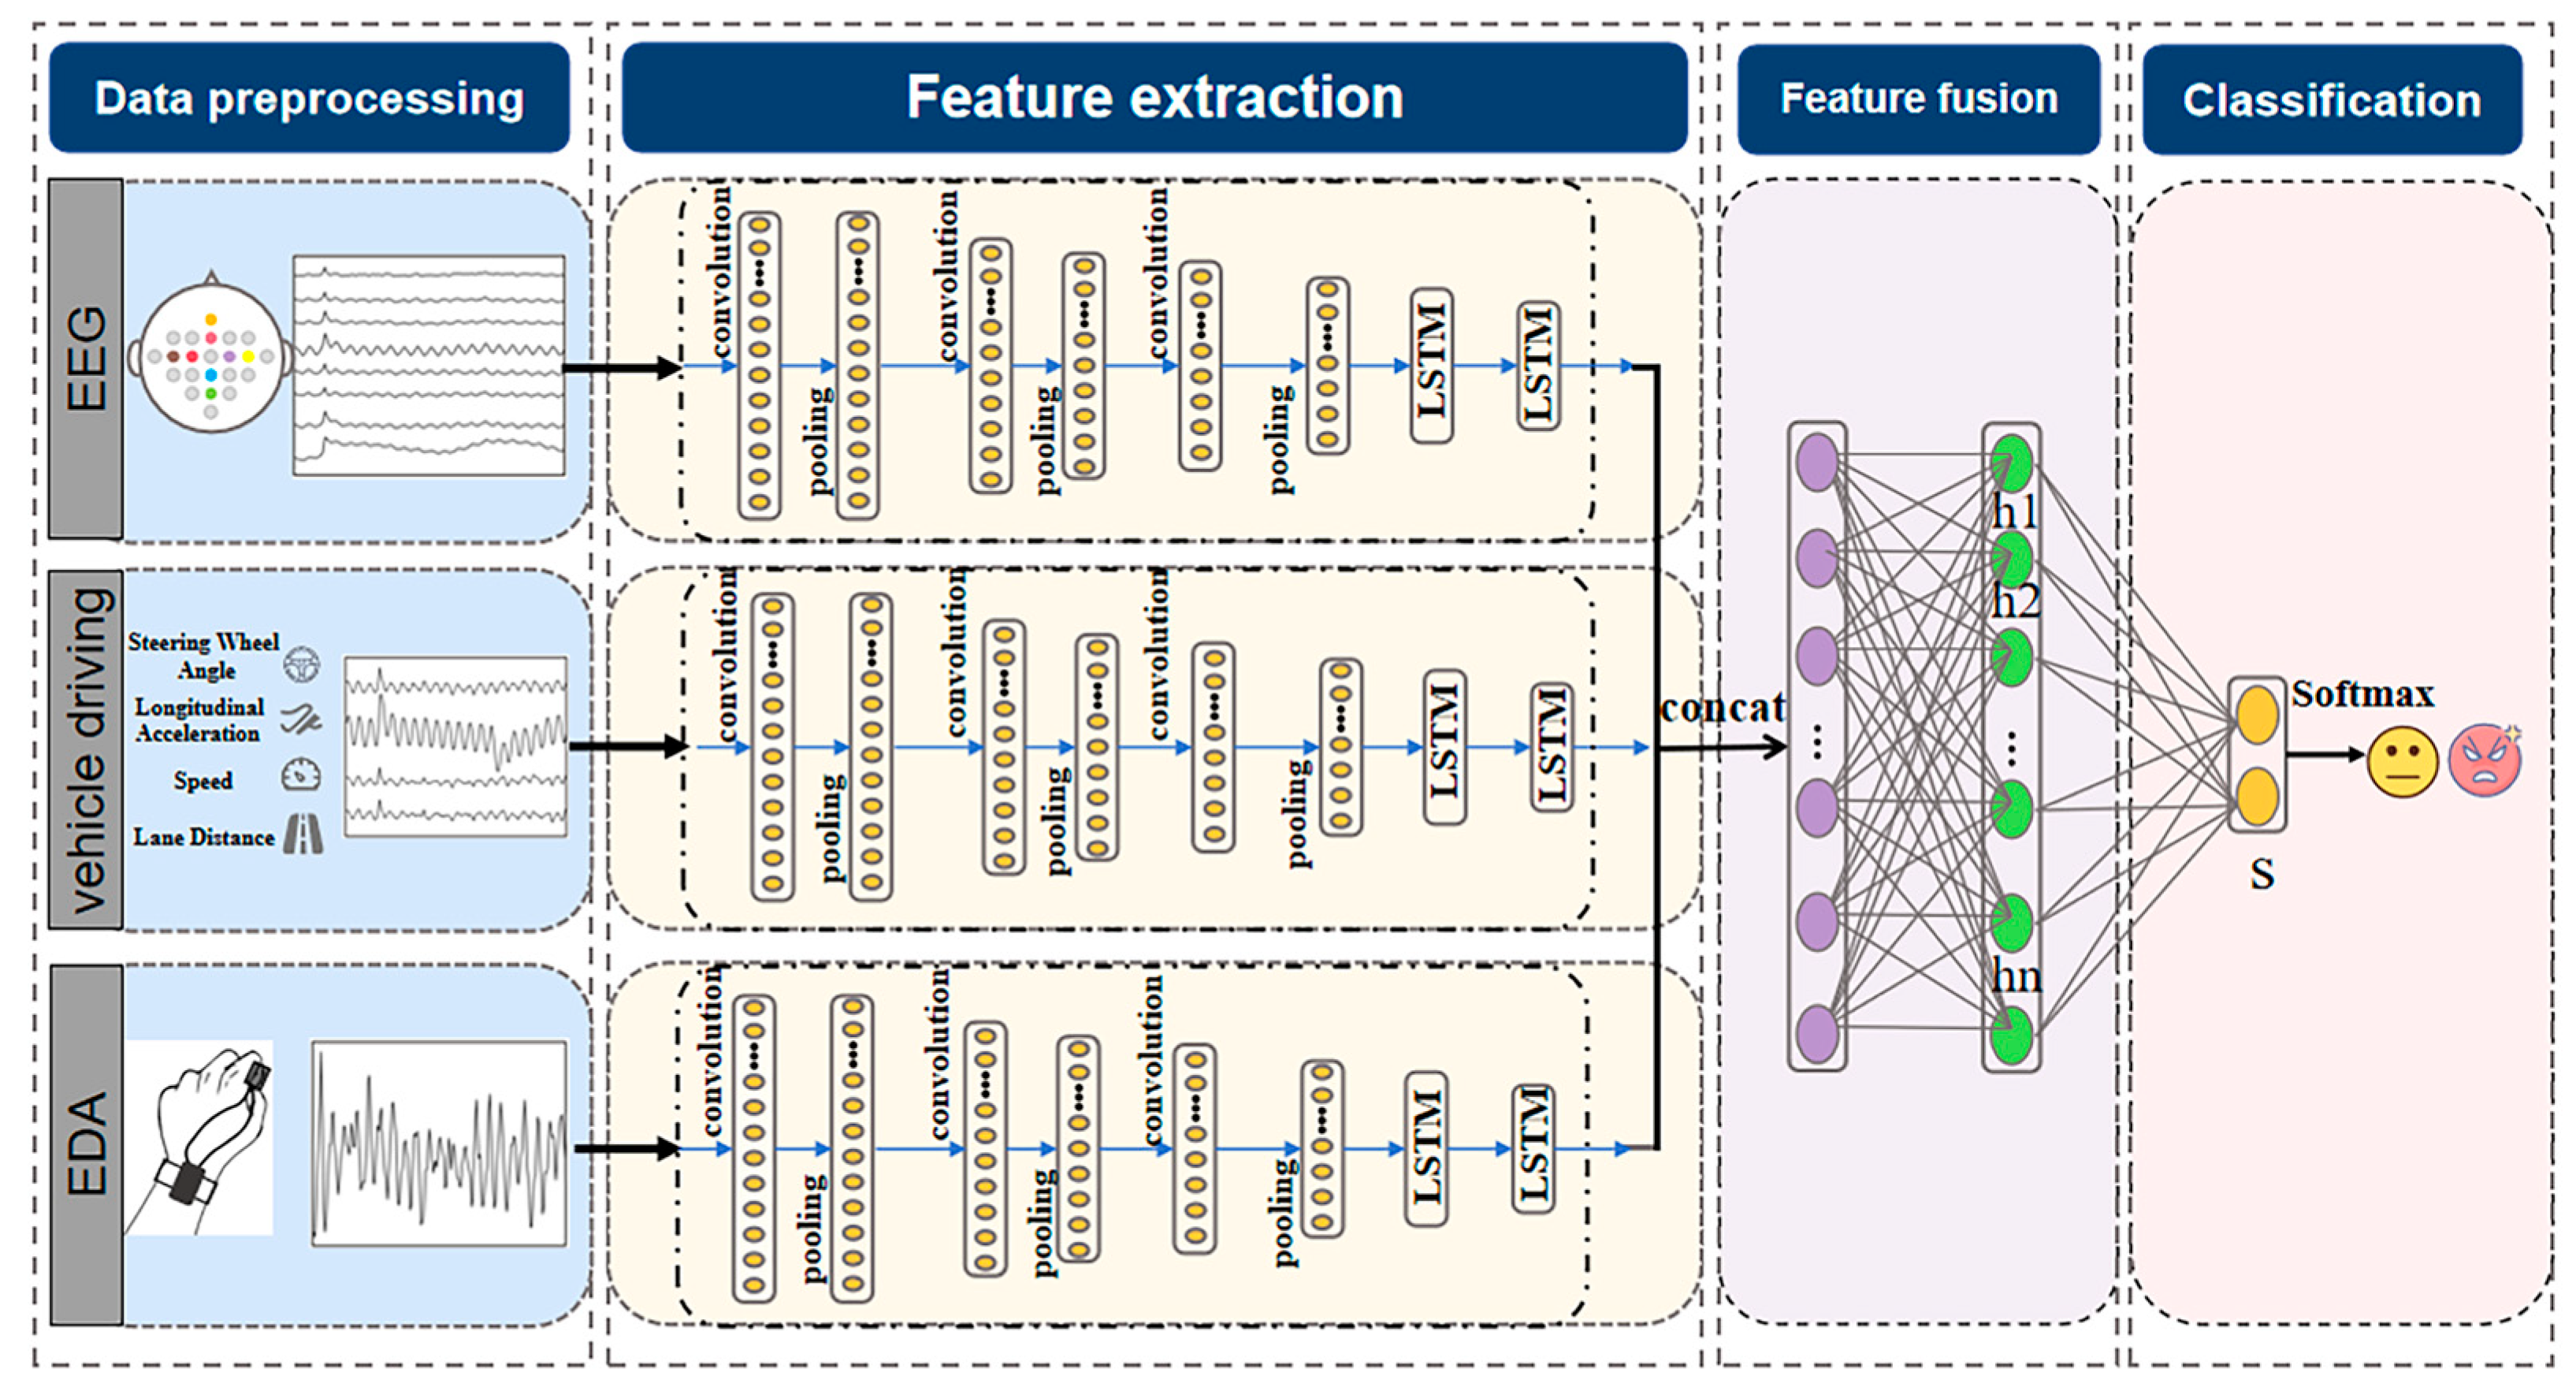
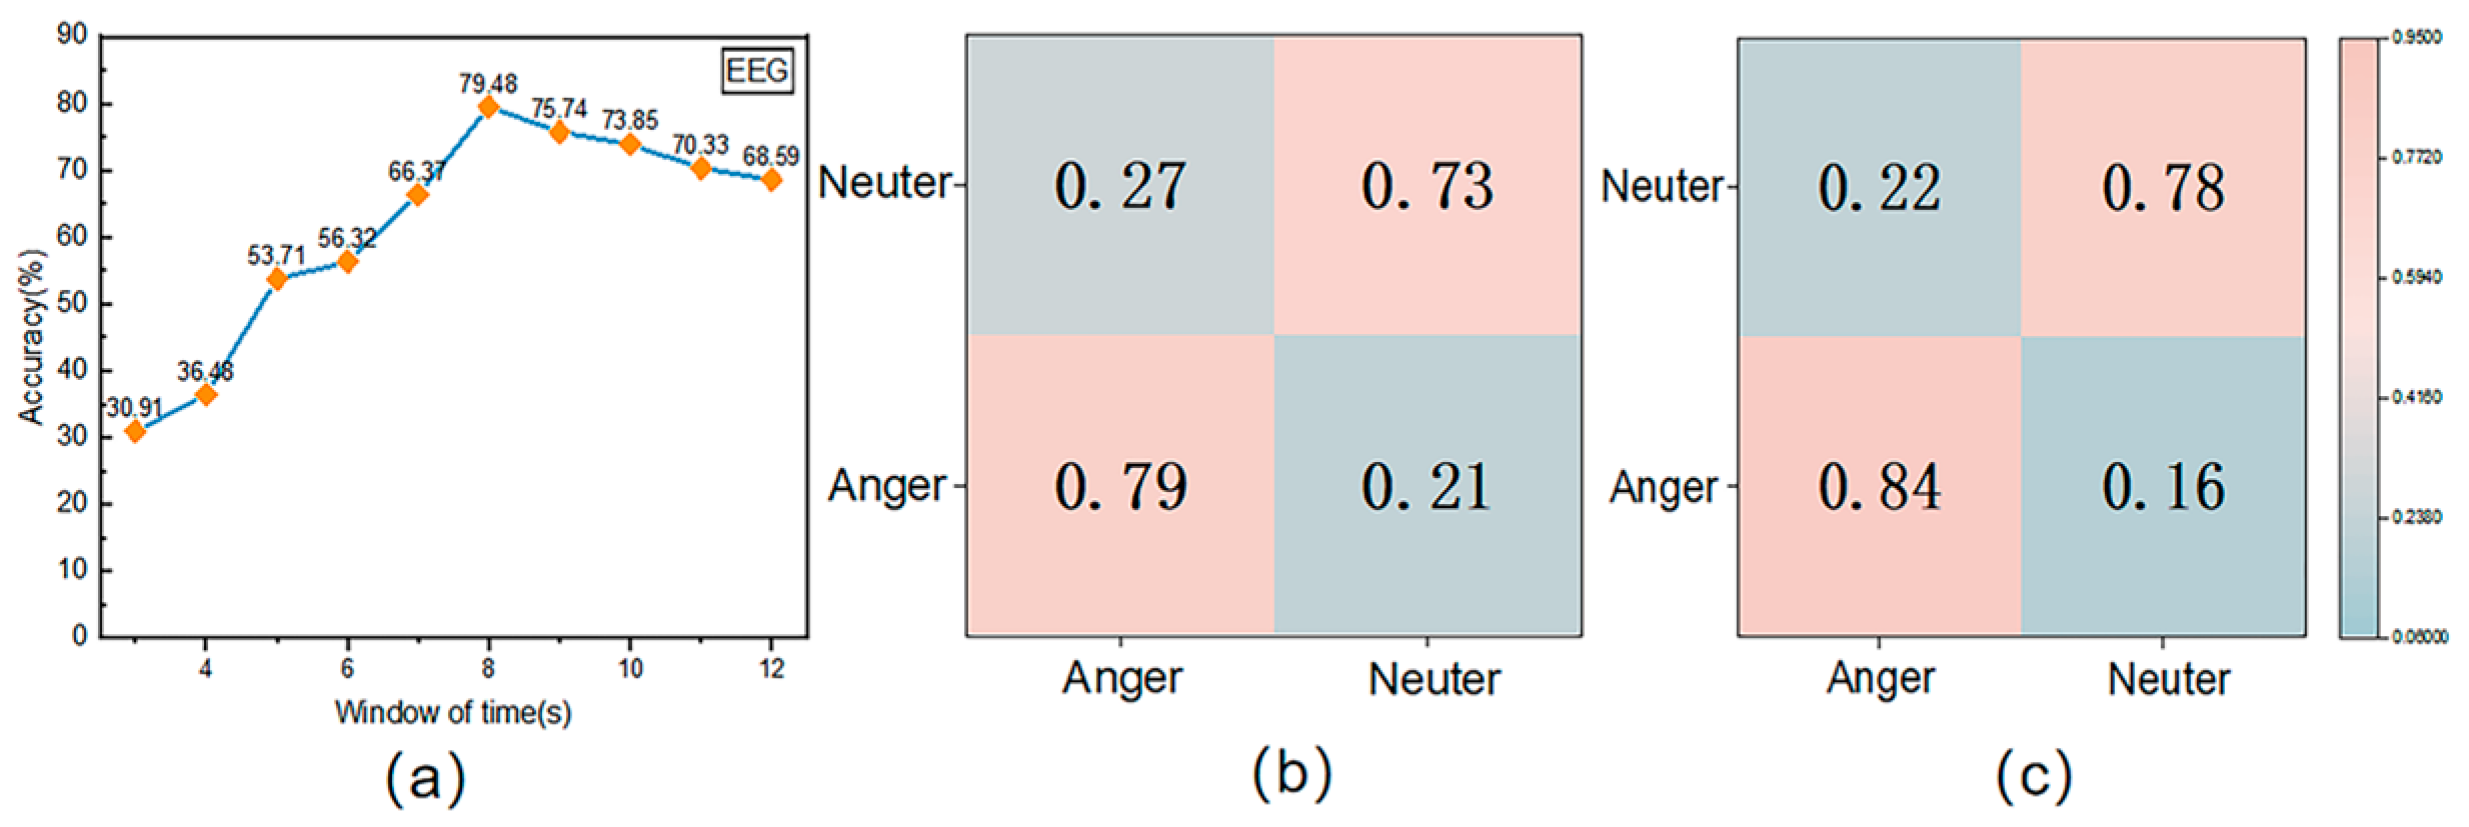
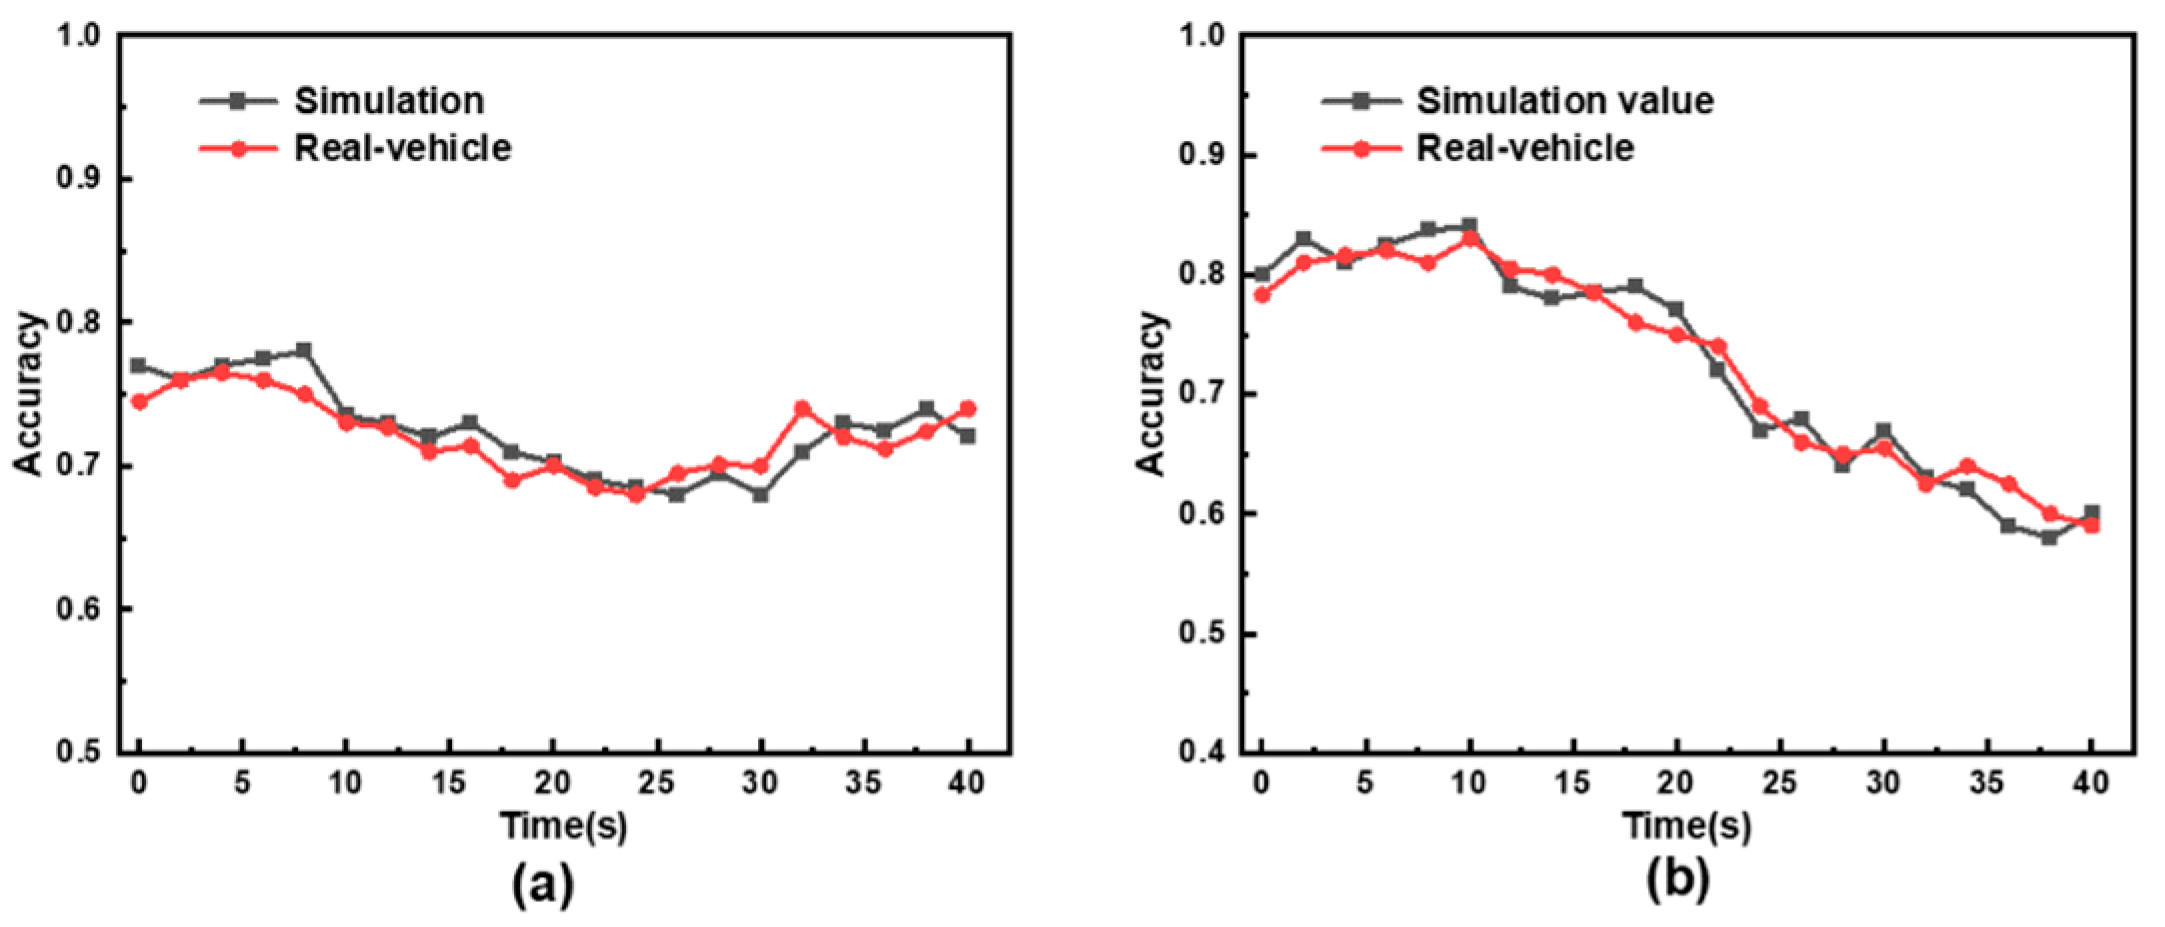
Disclaimer/Publisher’s Note: The statements, opinions and data contained in all publications are solely those of the individual author(s) and contributor(s) and not of MDPI and/or the editor(s). MDPI and/or the editor(s) disclaim responsibility for any injury to people or property resulting from any ideas, methods, instructions or products referred to in the content. |
© 2024 by the authors. Licensee MDPI, Basel, Switzerland. This article is an open access article distributed under the terms and conditions of the Creative Commons Attribution (CC BY) license (https://creativecommons.org/licenses/by/4.0/).