Article

An Extra-High Voltage Test System for Transmission Expansion Planning Studies Considering Single Contingency Conditions

Zero Emission, Realization of Optimized Energy Systems (ZEROES) Laboratory, Department of Electrical and Computer Engineering, The University of Texas at Dallas, Richardson, TX 75080, USA
*
Author to whom correspondence should be addressed.
Electronics 2024, 13(19), 3937; https://doi.org/10.3390/electronics13193937 (registering DOI)
Submission received: 12 September 2024 / Revised: 2 October 2024 / Accepted: 4 October 2024 / Published: 5 October 2024
(This article belongs to the Special Issue Monitoring and Analysis for Smart Grids)

Abstract

:
This paper presents an extra-high voltage synthetic test system that consists of 500 kV and 765 kV voltage levels, specifically designed for transmission expansion planning (TEP) studies. The test network includes long transmission lines whose series impedance and shunt admittance are calculated using the equivalent π circuit model, accurately reflecting the distributed nature of the line parameters. The proposed test system offers technically feasible steady-state operation under normal and all single contingency conditions. By incorporating accurate modeling for long transmission lines and EHV voltage levels, the test system provides a realistic platform for validating models and theories prior to their application in actual power systems. It supports testing new algorithms, control strategies, and grid management techniques, aids in transmission expansion planning and investment decisions, and facilitates comprehensive grid evaluations. Moreover, a TEP study is conducted on this test system and various scenarios are evaluated and compared economically.

1. Introduction

The global power system is undergoing a significant transformation driven by technological advancements, policy changes, and evolving energy demands [1]. This transformation is marked by a shift towards more sustainable and efficient energy sources, particularly green energy technologies such as solar photovoltaic (PV) and wind energy. This trend is crucial for addressing global warming and achieving zero-emission goals. Technological advancements have reduced the cost of renewable energy and improved grid management, while policy changes have significantly promoted the adoption of renewable energy and reduction in carbon emissions. Even with the potential of flexible demand, peak load in the United States is projected to grow by 40–60% by 2050. To accommodate this increment and move towards a zero-emission future while ensuring a reliable and sustainable energy supply, the high-voltage transmission capacity must expand to nearly triple the 2021 levels by 2050 to connect wind and solar facilities to demand centers. This expansion will require substantial capital investment, estimated at approximately USD 2.4 trillion, and necessitates extensive studies for the strategic expansion of high-voltage transmission infrastructure [2]. A synthetic (extra) high-voltage test system is needed to effectively replicate real-world power systems. This will allow planners to test and analyze multiple scenarios for infrastructure expansion, both technically and economically, and benchmark them for practical implementation, before proceeding directly with practical implementation.
The primary technologies for power transmission include overhead transmission lines, underground AC/DC cables, and HVDC systems. Research indicates that overhead HVDC transmission becomes economically viable for distances exceeding 600 km in the United States [3,4]. The growing demand for cost-effective access to remote renewable energy sources, such as offshore wind farms and desert-based solar thermal plants, has reignited interest in HVDC technology. Wide bandgap semiconductors, with their ability to operate at higher currents and voltages while minimizing losses, have the potential to reduce costs and enhance the performance of HVDC converters significantly. However, the lack of commercially available and reliable HVDC circuit breakers (CBs) remains a critical barrier to the large-scale deployment of multi-terminal HVDC (MTDC) networks [5,6,7]. Currently, HVDC systems are restricted to point-to-point connections, protected by conventional circuit breakers on the AC side of the converter. In contrast, a fully realized MTDC grid would require HVDC CBs at every segment to isolate faults rapidly and reliably. These CBs are necessary for point-to-point HVDC links to contribute effectively to transmission expansion planning. Although underground cables present an alternative transmission method, they are prohibitively expensive, costing three to ten times more than overhead lines, with the disparity growing at higher voltages. Consequently, extra-high voltage (EHV) overhead lines dominate as the most practical and cost-efficient method for bulk power transfer. Given their enduring relevance, developing an EHV transmission line test system is imperative for future expansion planning studies and broader power system research.
Because of security and liability concerns, research studies have limited access to realistic large-scale power grid models to test and validate new planning, operation, and validation methodologies. There are many synthetic test systems at the transmission voltage levels in the power system studies that have been used for transmission expansion planning studies. Examples include the HRP-38 Bus System for realistic TEP studies for regions with renewable energy integration and economic constraints [8]; the 46-bus Southern Brazilian System for the large-scale planning for the expansion and system reliability [9,10]; the 87-bus Brazilian Northeastern Network for large-scale TEP studies and reliability research [11,12]; the Columbia Power System with 93 nodes for the TEP in regions with hydroelectric power [13]; and the WECC 300-node system, used for the application of large-scale TEP, wide-area reliability, and grid stability in the western US [14]. These large-scale test systems contain extra-high voltage levels of up to 500 kV and also have long transmission lines. However, details on these systems are not publicly available and may require collaboration with the research group or institutions that developed them. There are some other test systems, such as the 6-bus Garver Test system designed for early-stage research in TEP and optimization [15], the IEEE 24-bus system specifically for economic dispatch, reliability studies, and security analysis but also widely used for both educational TEP research [16]; the IEEE 118-bus test system, which is one of the used systems for benchmarking TEP methodologies, security constraints economic dispatch, and reliability studies [17]; and the IEEE 300-bus test system for academic research, benchmarking, and testing TEP and power flow [18]. However, these test systems are only for transmission voltage levels of up to 345 kV voltage level, and it is unknown whether they can operate under both normal condition and all single contingencies under different loading conditions or not.
Other very large-scale synthetic test systems are publicly available. These include the synthetic Illinois 200-bus power system model for voltage levels up to 230 kV transmission voltage level and the South Carolina 500-bus system designed with a 138 kV and 345 kV transmission voltage level to serve demand that roughly mimics the actual population of its demographic footprint for steady-state stability analysis [19]. Others include the UIUC 150-bus system, which contains substation geographic coordinates and other parameters useful for geomagnetic disturbances (GMD) studies [20]; the synthetic Texas 2000-bus power system model geographically situated in the state of Texas in the US [19]. In addition, there is the 10k-bus synthetic grid from the transmission voltage levels from 115 kV to up to the transmission voltage level 765 kV on the footprint of the western United States for the purpose of load flow studies, transient analysis, and geomagnetic disturbance (GMD) studies [19,21,22]; the Synthetic 25k-bus grid on the footprint of the northeastern United States with a voltage level from 69 kV to 765 kV with power flow, transient stability and geomagnetic disturbance studies data [19,21,22]; the synthetic eastern US 70k-bus power system; and the combined synthetic east and west 80k-bus system with a synchronously interconnected synthetic eastern and western United States model [19,23]. While these test systems offer features more aligned with real power systems in size and complexities, they predominantly cater to single loading conditions, lacking specificity regarding various load conditions or other potential contingencies. Additionally, uncertainties persist regarding the capacity of these existing test systems to operate effectively under all single contingency conditions. Moreover, these synthetic test systems do not provide comprehensive information about the length of transmission lines in the power network and their parameters. Distances between buses or the lengths of lines within these test systems are crucial to accurately estimating the distances between buses intended for integration. Achieving accurate replication of real-world power system conditions and facilitating successful transmission expansion planning depends on these factors.
Besides large-scale wind and solar power plants/farms needing TEP studies to integrate into existing transmission networks, this is the case for emerging loads like electrified transportation. Low-carbon emission transportation, such as the electrified railway system, is attracting global attention to achieve the zero-emission goal. The electrified railway networks need a different power system infrastructure, called electric railway power systems (ERPSs). Electric railway power systems (ERPSs) have been introduced to the market from the beginning of the 20th century to support the medium of electric transportation [24]. Given the priority to electrical transportation as a means of green transportation, the electric railway’s power system is becoming one of the largest and highest consumption end users. To accommodate the growing demand for large-scale, high-speed railway networks, ERPSs must evolve and significantly expand their multi-node network architecture to ensure efficient and resilient power distribution. Currently, thousands of kilometers of high-speed railway lines are powered by ERPSs globally, and many large ERPSs need to be planned for future construction to supply for the upcoming electric railways, which demands supply from the multiple nodes throughout the considered length. As a result, there is a critical need for the expansion of high-voltage transmission systems to support the energy demands of these railway traction networks over long distances. Moreover, extensive research has been conducted on integrating distributed energy resources (DERs) into high-speed railway systems and transitioning ERPSs towards Smart Grids (SG) [25,26]. This transition, leveraging renewable energy sources (RESs), energy storage systems (ESSs), and interconnected primary grids, aims to enhance the stability, robustness, and efficiency of railway power systems [26].
Different test systems with multiple loading conditions having only one voltage level (500 kV) that can operate normally under normal and all single contingency conditions are presented in our previous studies [27,28,29] and have been implemented for different transmission expansion planning [30,31]. This paper presents the test system, which includes an extra-high-voltage transmission line with 500 kV and 765 kV voltage levels, which can operate under normal conditions and all single contingencies (single line and transformer outage) at peak loading conditions. It gives all the necessary information about the test system in one paper. In addition, the proposed test system is used for transmission expansion planning to supply the increased load for a five-year planning horizon by adding a new renewable generation source, the wind power plant/farm, positioned at new locations. In this process, multiple TEP scenarios are studied, and the technically feasible and economically optimized scenario is selected for network expansion.
The remainder of this article is organized as follows: Section 2 provides an overview of the test system. Section 3 outlines the problem formulation for load flow analysis, testing, and validation of the test system. Section 4 details the steady-state operational study of the test system, followed by Section 5, which discusses the transmission expansion planning case study. Finally, Section 6 presents the conclusions of the paper.

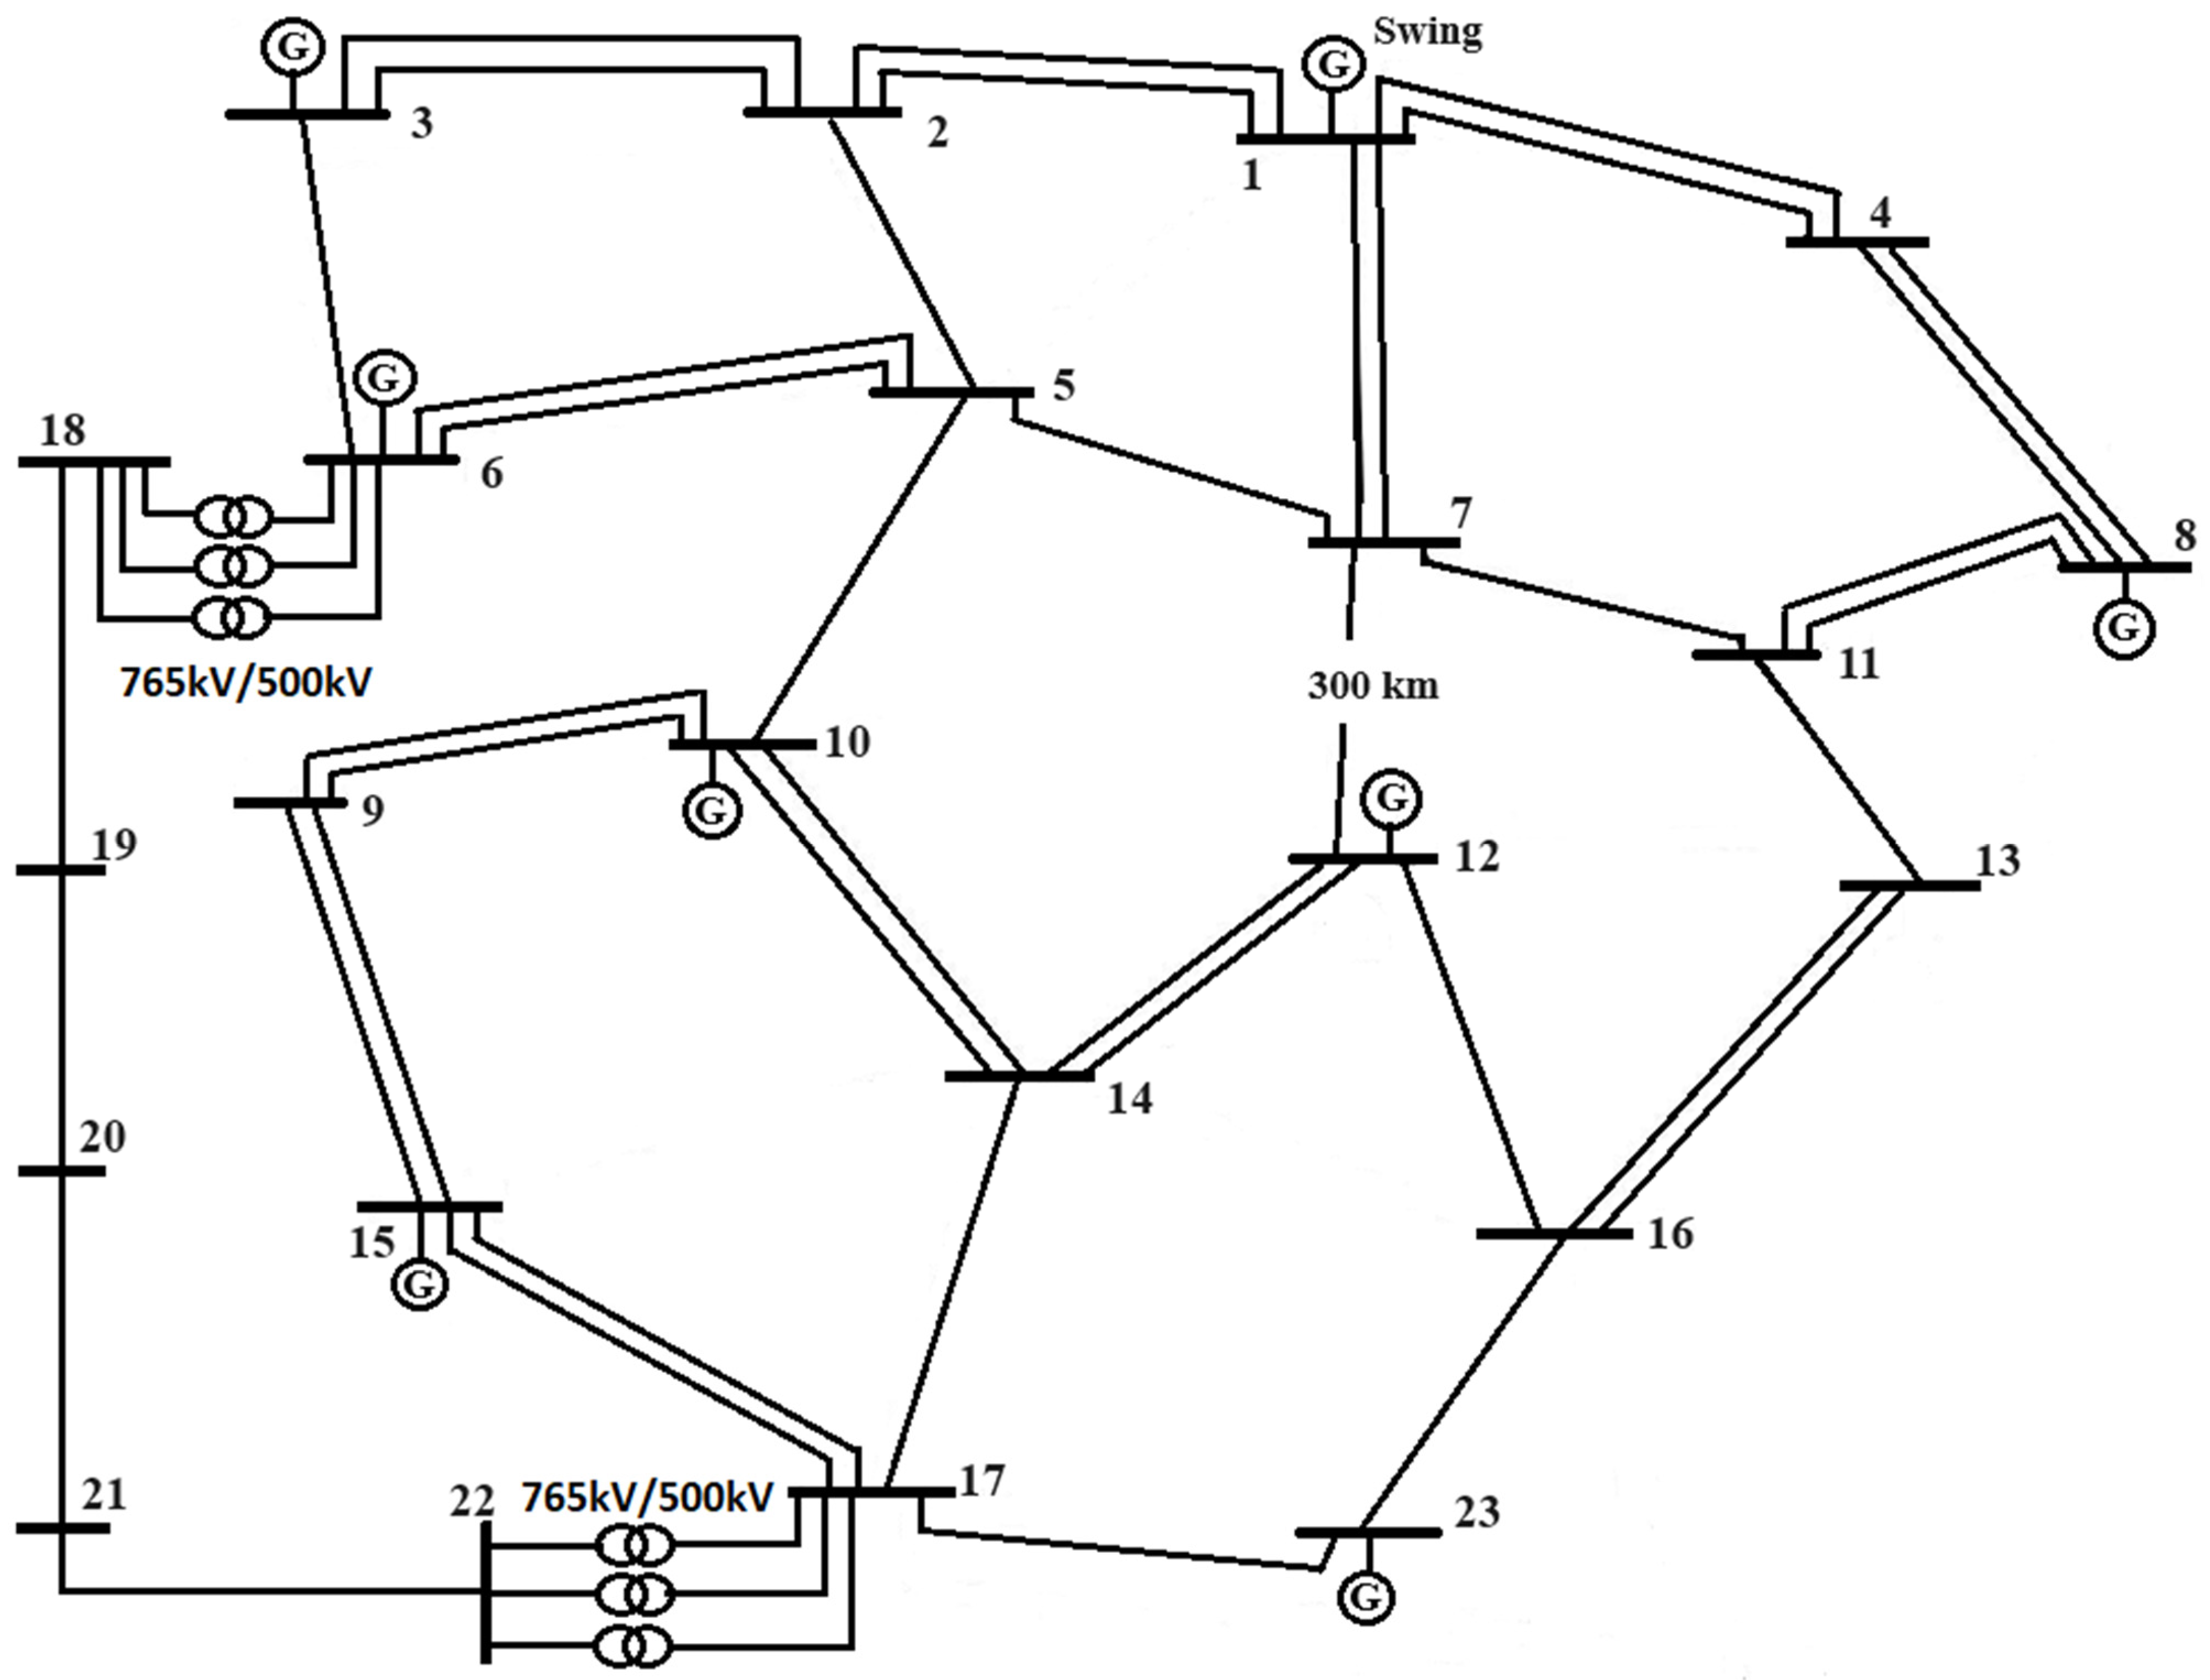
2. Overview of the Test System

2.1. Network Information

The single-line diagram of the test system is shown in Figure 1. The test system comprises two voltage levels, 500 kV and 765 kV voltage levels. Bus 1 is assigned as the slack bus, while buses 3, 6, 8, 10, 12, 13, 15, and 23 are categorized as voltage-regulated buses. The remaining other buses function as load buses. The placement of generator and load buses across the network are hypothetical estimates and are randomly distributed, with distances ranging from approximately 260 to 460 km. To estimate the distances between buses, we used the distance between bus 7 and bus 12 (assumed to be 300 km) as a reference. Using this established measurement as a geometric baseline, we calculated the distances of all other transmission lines by scaling their lengths proportionally. This approach ensures consistency in distance estimations across the entire network. Generating units are situated at least 300 km apart, with some extending beyond 600 km.
Detailed information about buses in the test system including the generating units, loads, shunt compensating devices connected to buses, and their capacities are shown in Table 1. The bus types, the scheduled voltage, active power generation, and reactive power generation limit of each generating unit connected buses are also indicated in Table 1. The base kV of each bus, the load capacity, and the location of shunt compensating devices in buses and their corresponding capacities are also indicated in Table 1. All loads are operating at 0.9 lagging power factor.
Detailed information regarding the transmission line and transformers is shown in Table 2. This information contains the number of line-connected buses, the number of lines, the line lengths, the transformer-connected buses, and the number of transformers connected between buses to step up/step down the voltage. For a 765 kV transmission line over 400 km, intermediate substations are added between the two terminals of that line each 200 km to 300 km. These intermediate substations are added to control the bus voltage in the transmission line. The length of line 18–22 is 920 km, and three intermediate substations are added in between the two terminals of the line in an equal span of 230 km.

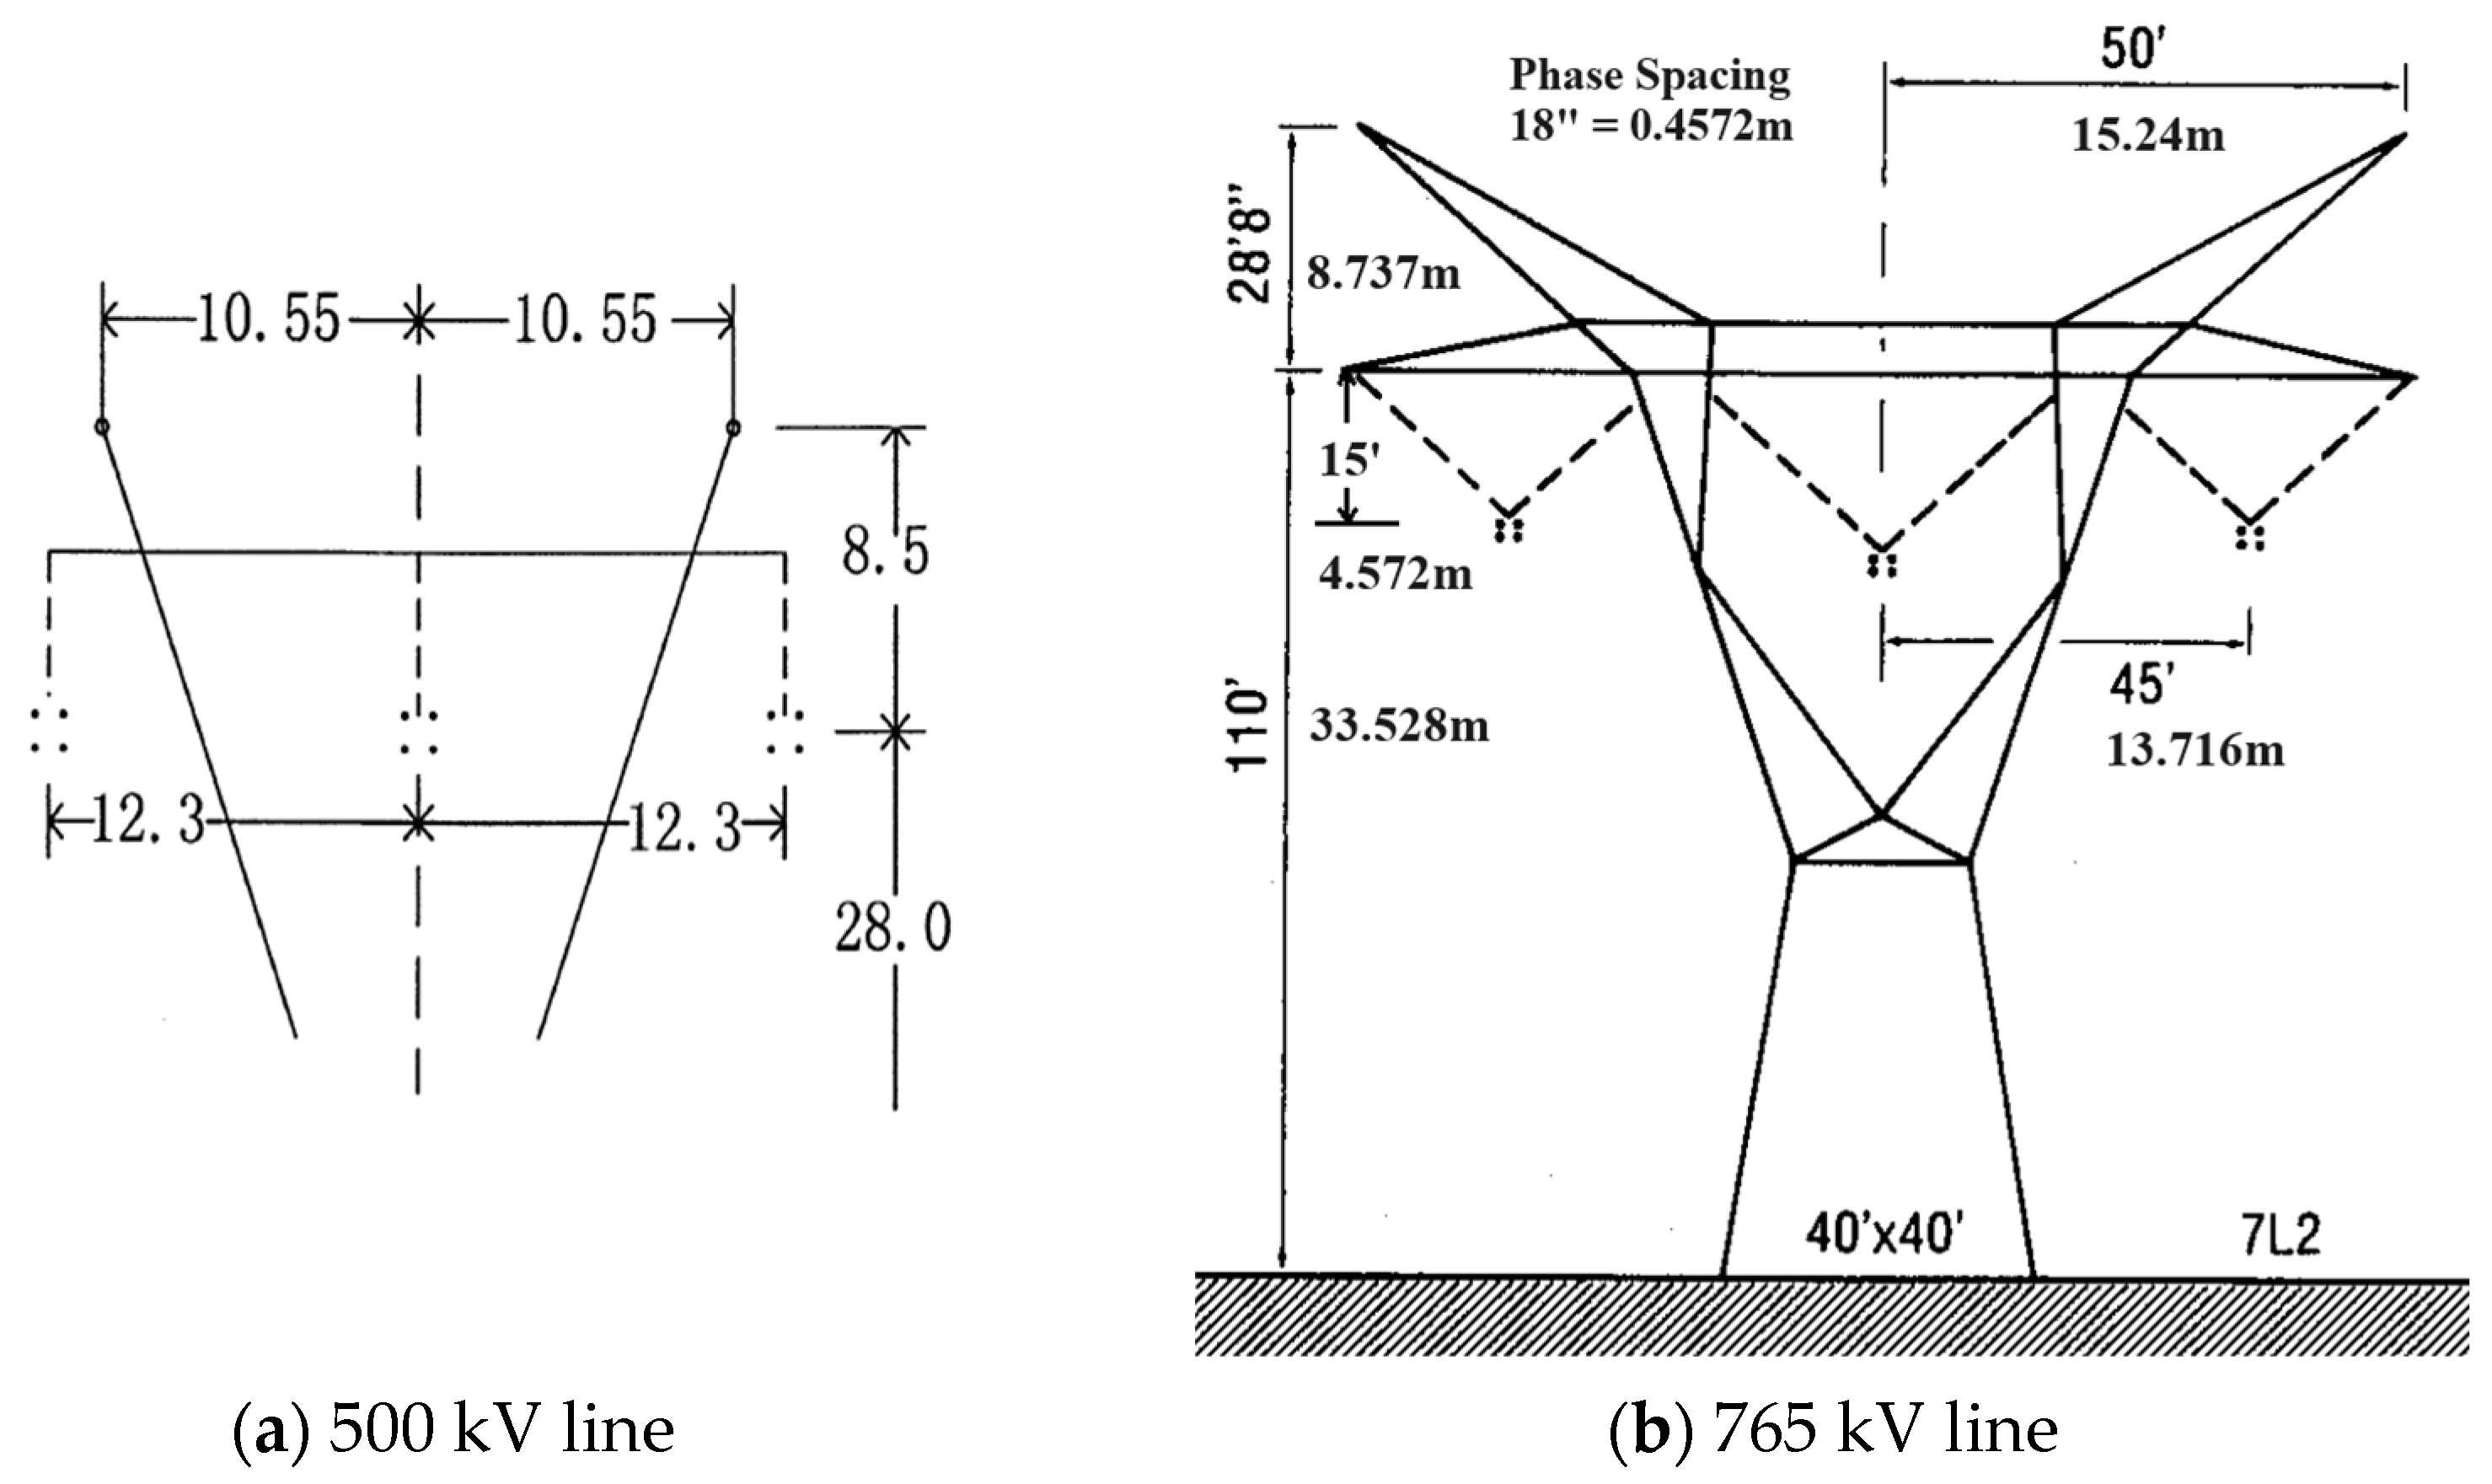
2.2. Transmission Line Configuration and Line Parameter

Figure 2a is the line configuration for the 500 kV conventional line configuration that has been used in the test system [32]. This line has a horizontal configuration with phase spacing of 12.3 m, with four sub-conductors per bundle situated at a height of 28 m from the ground surface. The bundle configuration is arranged in a circular formation with a sub-conductor spacing of 0.457 m. The used sub-conductor for this line configuration is the Macaw conductor, which has a 2.6797 cm outer diameter. Figure 2b is the line configuration for the 765 kV conventional transmission line [33]. This line also has a horizontal configuration with phase spacing of 13.71 m and four sub-conductors per bundle located at 28.956 m from ground level. The bundle configuration for this line is also arranged in a circular formation with a conductor spacing of 0.457 m. The conductor used for this line configuration is a Dipper conductor with an outer diameter of 3.518 cm. The information on used conductors in 500 kV and 765 kV transmission lines is indicated in Table 3. For the double circuit line in each case, 500 and 765 kV transmission lines, each circuit maintains the same line configuration. For example, the two lines connecting Bus 1 and Bus 2 are positioned on two distinct towers, each with an identical configuration.
The line parameters of transmission lines define the electrical characteristics governing their performance in power transmission. For a given number of bundle conductors per phase, denoted as b, these parameters can be calculated as follows:
R e q = R b       Ω / k m
x = 2 π f × 2 × 10 7 ln G M D r     Ω / k m
y = 2 π f 2 π ε 0 ln G M D r 0               S / k m
where f represents the system frequency, ε 0 denotes the permittivity of free space, and G M D stands for the geometric mean distance. For bundled conductors, the parameters r and r 0 should be replaced with the equivalent bundle radii for inductance and capacitance calculations, respectively. The per unit length line parameters and surge impedance loading (SIL) for considered transmission line structures are given in Table 4.

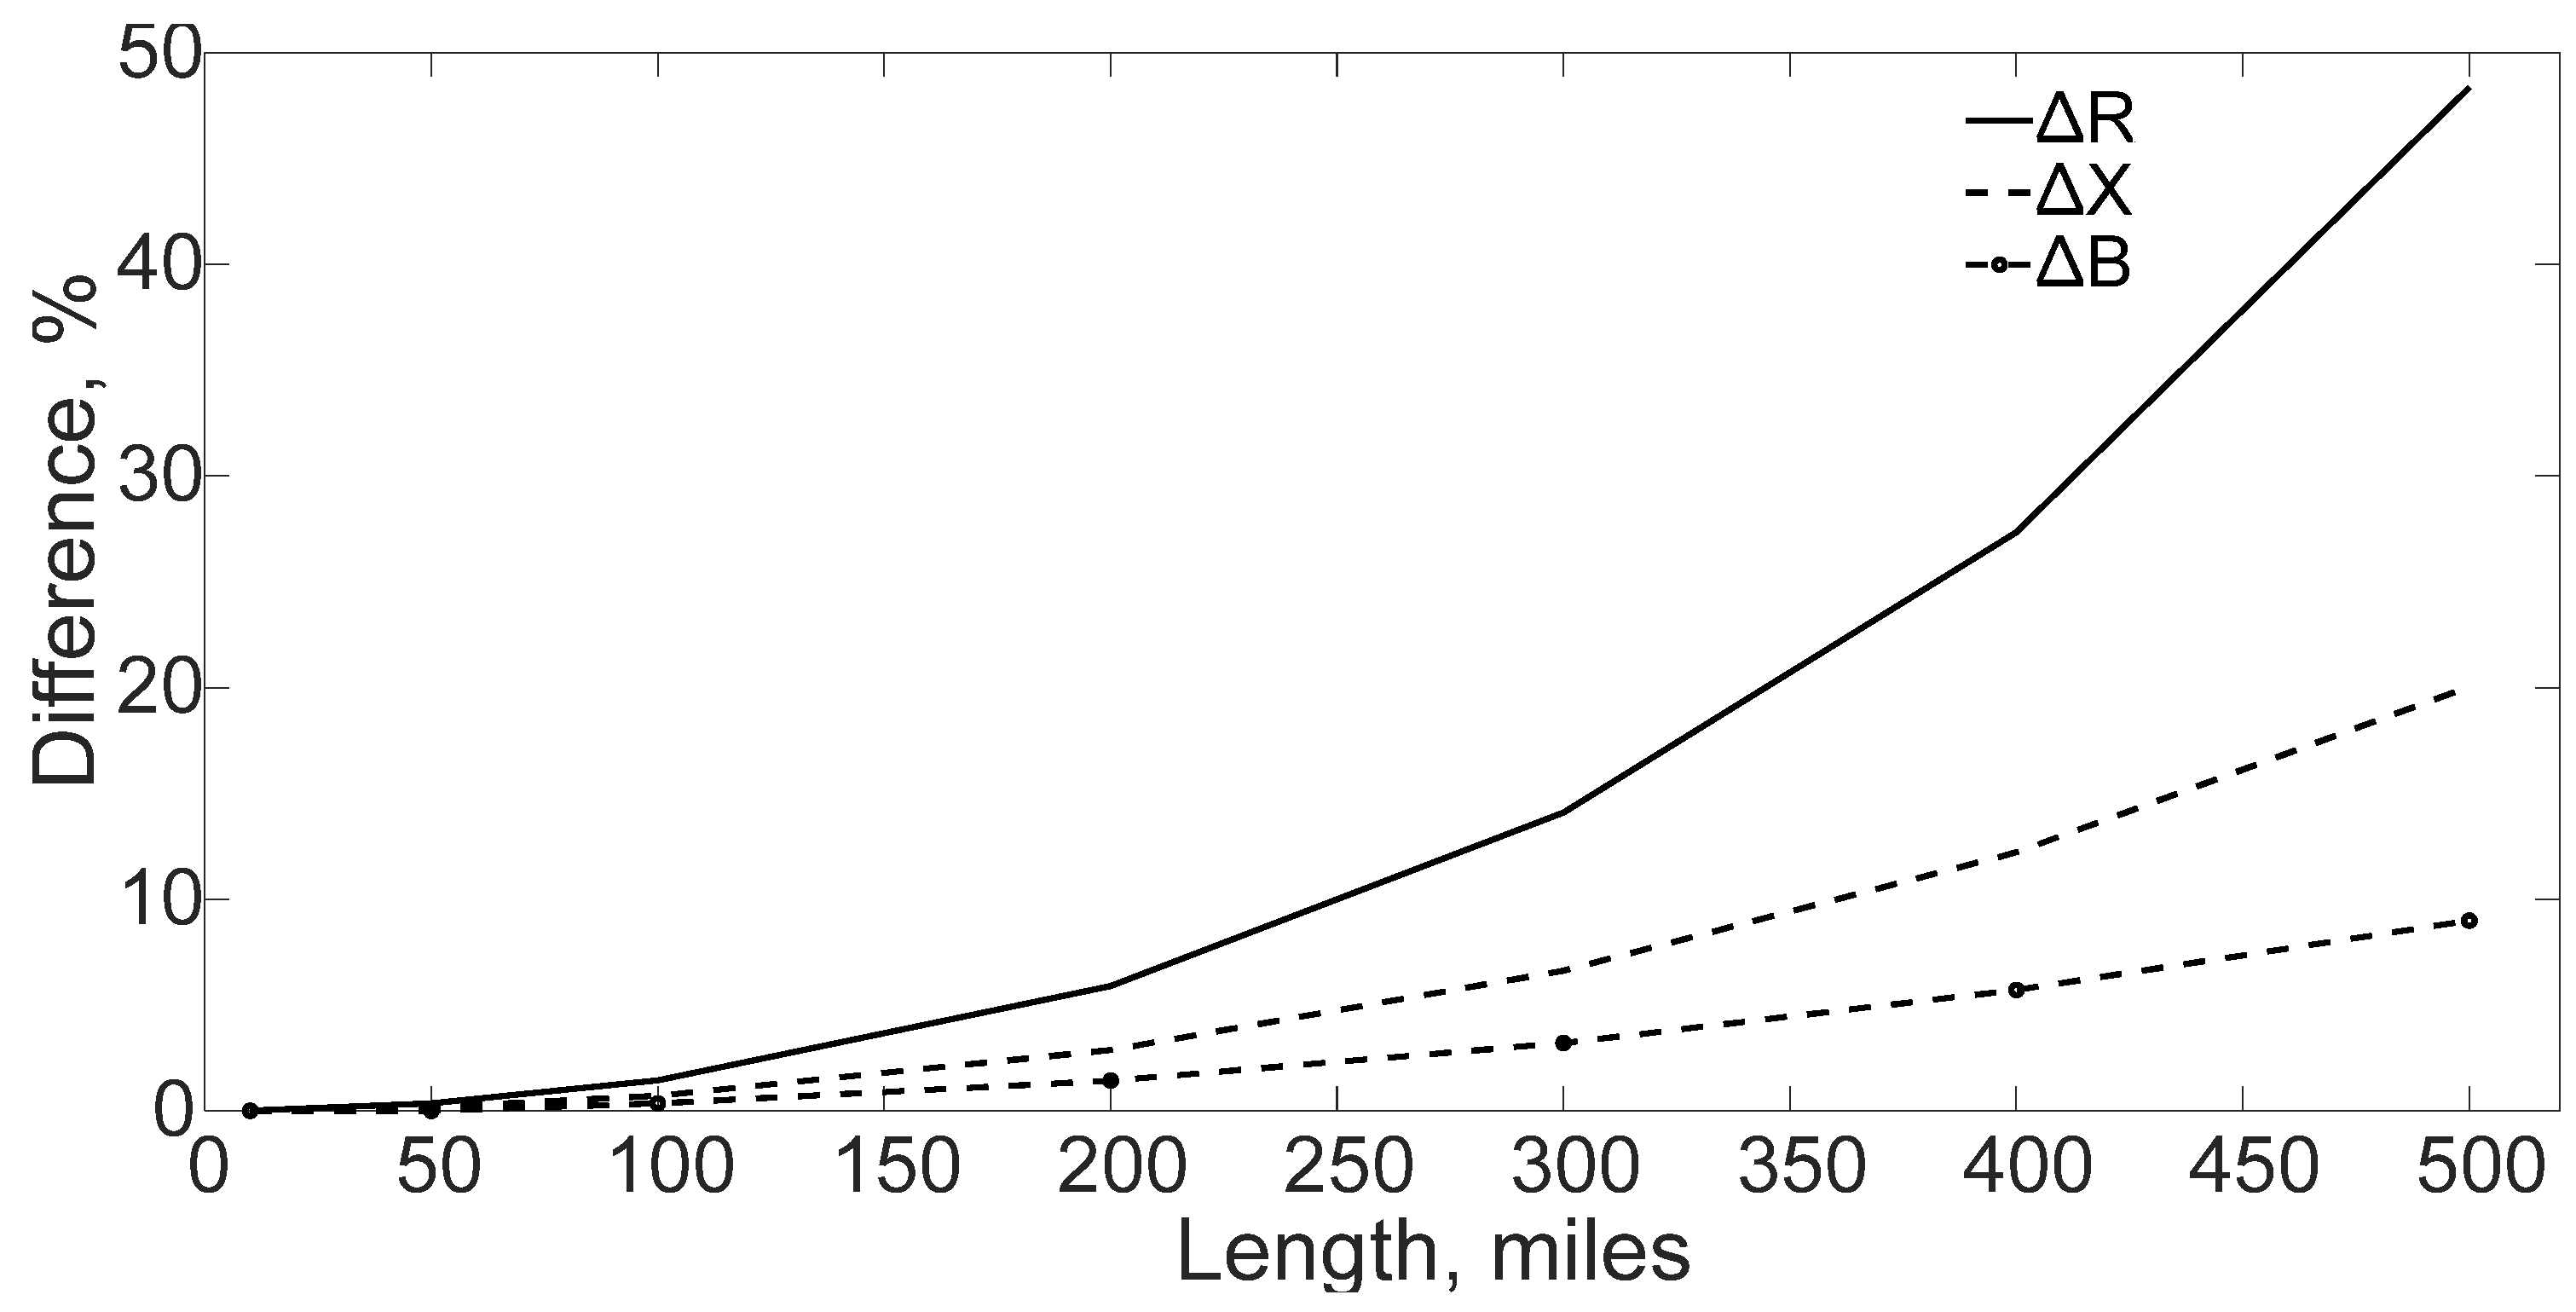
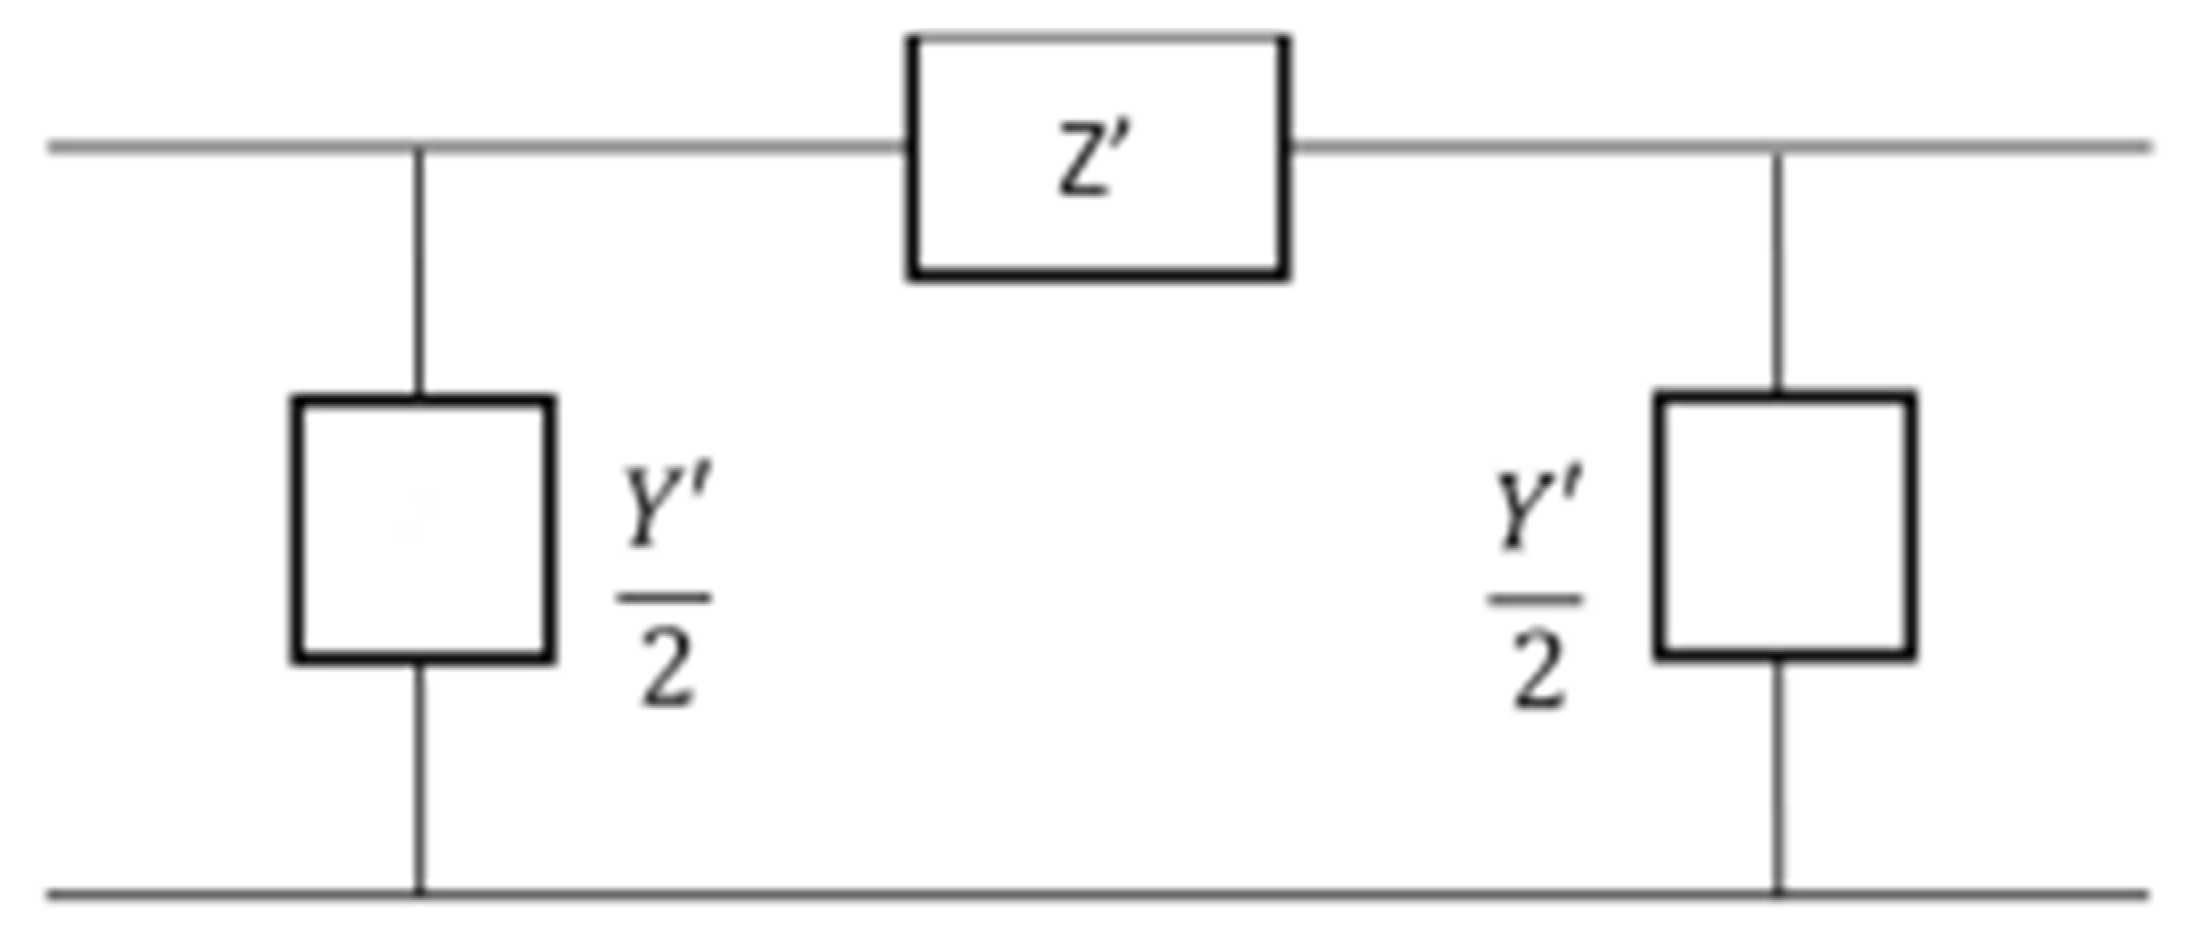
2.3. Transmisison Line Modeling

For long transmission lines, calculating the total impedance and shunt admittance by scaling per-unit-length parameters proportionally to line length often results in inaccuracies. As the transmission line length increases, the errors in these estimations become more pronounced. Figure 3 demonstrates the percentage differences in resistance, reactance, and susceptance obtained from this scaling method compared to the actual parameters, with the most significant discrepancies observed in resistance and inductive reactance for lines exceeding 150 miles.
Accurate modeling of long transmission lines necessitates consistent distribution of line parameters over the entire length, which introduces computational complexity when employing distributed parameter models. The equivalent π model offers a more efficient alternative by lumping distributed parameters into discrete elements, providing a simplified yet precise representation of long transmission lines. The equivalent π model, depicted in Figure 4, denotes the series impedance as Z′ and the shunt admittance as Y′.
Similar to the nominal π model, the equivalent π model includes a series impedance and shunt admittances, but it incorporates corrections to capture the cumulative effects of the distributed nature of line parameters. The equivalent π model is derived by integrating the more accurate long line’s differential equations, which consider that the line’s inductance, resistance, capacitance, and conductance are distributed throughout the line, and converting them into lumped elements while maintaining fundamental transmission line properties such as voltage drops, current distributions, and phase angle differences. The equivalent series impedance and shunt charging admittance for this modeling can be computed as:
Z = z l s i n h ( γ l ) γ l
Y = y l t a n h ( γ l / 2 ) ( γ l / 2 )
where γ represents the propagation constant given by γ = z y . The l is the length of the transmission line, while z and y are the series impedance and shunt admittance per unit length, respectively.
The equivalent π model offers more precise estimates for voltage profiles, power flow, and line losses by accounting for phase shifts and attenuation occurring along long lines. While the fully distributed model offers more detail for transient and high-frequency studies, the equivalent π model is preferred for its balance of simplicity, accuracy, and computational efficiency, making it ideal for steady-state analysis, contingency analysis, and transmission expansion planning (TEP). It is also a faster and more practical option for large-scale power system studies.
The thermal limit of a transmission line, represented as MVAmax, can be calculated based on the line voltage, maximum allowable current, and the number of sub-conductors per phase, as expressed in Equation (6). The maximum line loading limit, S i n m a x , is considered to be 80% of the thermal limit.
M V A m a x = 3 × V l i n e × I m a x × b

3. Problem Formulation for Load Flow Analysis

Power flow analysis is crucial for efficient power system operation, allowing us to predict issues like overloading, voltage violations, and congestion. To ensure the technical viability of the proposed test system, a detailed load flow analysis must be performed under normal conditions and various single contingency scenarios across different loading levels. The power flow analysis problem can be formulated as:
P i = V i n = 1 N V n ( G i n c o s δ i δ n + B i n s i n ( δ i δ n ) )
Q i = V i n = 1 N V n ( G i n s i n δ i δ n B i n c o s ( δ i δ n ) )
where P i and Q i are active and reactive power injections at bus i ; V i and δ i are voltage magnitude and angle at bus i ; and G i n and B i n are the real and imaginary components of the admittance between buses i and n .
The power flow problem is subject to the following constraints:
Normal   condition :   0.95 V i 1.05   p . u .
Contingency   condition :   0.90 V i 1.05   p . u .
0.3 P g i Q g i 0.6 P g i
S i n S i n m a x
Equations (9) and (10) represent constraints designed to keep the voltage magnitudes at all buses within acceptable boundaries during both normal operation and under any single contingency scenario. Equation (11) guarantees that the reactive power generated by all generators connected to the PV bus stays within the predefined limits, reflecting the practical operational considerations of synchronous generators. The constraint defined in Equation (12) ensures that the power flow between two buses through a transmission line does not exceed its maximum capacity, which is determined by the thermal limit.

4. Load Flow Result and Analysis

The power flow study utilized the Newton–Raphson method within PSS/E 35.4 software. The generation and load data, representing peak demand conditions as outlined in Table 1 and the network configuration as illustrated in Table 2, were used for the analysis. Simulations were conducted under both normal operating conditions and various single contingency scenarios at peak loading condition. Detailed results are provided in this section. The system frequency is considered to be 60 Hz.

4.1. Normal Operating Situation

At first, a load flow analysis was conducted under peak loading condition during normal operation. The detailed result of this analysis is illustrated in Figure 5, where the blue color denotes the 500 kV voltage level, and the green color represents the 765 kV voltage level. This load flow diagram provides comprehensive information regarding the voltage magnitudes and angles at various buses, the active and reactive power flows in transmission lines and transformers, and each generating unit’s active and reactive power generation. In the load flow diagram, positive values of active and reactive power along the transmission lines indicate outgoing power from the buses into lines, and negative values show incoming power into buses from lines. The value with the notation ‘R’ for generating units denotes the reactive power information, a positive sign indicates reactive power generation, and a negative sign signifies reactive power consumption. Power flow results show a minimum voltage of 0.997 p.u. at bus 20, while the maximum bus voltage of 1.05 p.u. was recorded at multiple buses. Reactive power generation remains within the limits specified by Equation (11), and all line loadings are well within their respective thermal limits. The total power loss at the operation under normal operating condition is 395.40 MW.

4.2. Contingency Operation

Operating power systems during contingency events presents significant challenges, particularly in systems that have extra-high voltage (EHV) transmission lines. EHV transmission lines transfer bulk power and failure introduces complex operational issues, needing other transmission lines to have sufficient capacity to redistribute the power flow effectively. Moreover, the disconnection of a long EHV transmission line can cause substantial changes in reactive power within the system for the same active power demand. While generating units are expected to manage both active and reactive power, they are often constrained in their ability to generate or absorb large quantities of reactive power. For a system to be deemed reliable, it must be capable of meeting demand while adhering to all technical specifications, even under N-1 contingency scenarios.
This test system is designed to operate under all single-line and transformer outage contingencies. The summarized load flow analysis of the test system at peak loading under all single contingency conditions is presented in Table 4. In the summarized results, the outage of each line is indicated in each row, and the minimum system voltage, its related bus, and the maximum loaded line for each contingency condition are noted. For example, in the first row, the considered contingency condition is the outage of one line 1–2. For this contingency condition, the minimum voltage occurs at bus #2 with a voltage magnitude of 0.987 p.u., and the maximum loaded line is line 1–7 with a loading percentage of 44.12%. The results show that the system operates normally, meeting all technical requirements mentioned in Equations (10)–(12) for all single contingency conditions. For the system to operate successfully under normal and all single contingency conditions at peak loading condition, a cumulative capacity of 2300 Mvar shunt capacitor at 500 kV voltage level and 1550 Mvar shunt reactor at 765 kV voltage level needs to be connected to the system. The distribution of these shunt-compensating devices is presented in Table 1.
Figure 6 shows the detailed load flow analysis result for the outage of the 765 kV line connecting bus 18 to bus 22, the last row in Table 5. Under this condition, the minimum voltage occurred in bus 5 with a voltage magnitude of 0.917 p.u., and the maximum loaded line is line 1–7 with a loading percentage of 46.40%. Even during this 765 kV line outage, the power carried by this line is successfully diverted through other lines, meeting all technical requirements.

5. Transmission Expansion Planning (TEP)

Power networks must update their TEP within a specific time frame to ensure the grid evolves with changing needs. Transmission planning is a systematic process to ensure that the electrical transmission network can reliably and efficiently transport power from generation sources to end-users, meeting current and future demand. It involves assessing system adequacy, determining expansion needs, and designing a robust network. The TEP problem considered for this analysis is reinforcing the transmission network to supply the load after five years through a new generating station where the total load is supposed to be increased by 5%, which amounts to 1485 MW. As the power globe is diverging towards zero-emissions technologies for energy generation, it needs to have renewable energy sources, such as wind, instead of conventional fossil fuel-based sources to supply the increased load. The generation capacity assumed for the wind resource in this paper is 1750 MW, meaning we are dealing with large-scale or utility-scale wind farms. The powers generated by wind turbines in these wind farms are collected by their internal medium or low voltage systems and finally needs to be integrated into the existing power grid. Large-scale wind farms are often far from load centers, and high-voltage transmission systems are needed to transfer that massive power over long distances efficiently. The new energy source considered is wind farm energy with an installed capacity of 1750 MW, located 600 km from Bus 17 and 650 km from Bus 23. The Federal Energy Regulatory Commission (FERC) has stated that wind generation plants are required to supply power with a 0.95 lag to 0.95 lead power factor at the point of interconnection [34]. Therefore, the power factor of the wind power plant is considered as stated in the FERC standard. The expansion of the transmission network is essential to accommodate the increasing load demand and effectively integrate new generation sources into the grid.
To facilitate this expansion, evaluating multiple candidate scenarios across varying transmission voltage levels is necessary, focusing on selecting the economically and technically optimal configuration. This process involves conducting detailed load flow analysis under both normal operating conditions and all single contingency scenarios to assess the reliability and robustness of each candidate. A comprehensive economic assessment is also required to determine the most cost-effective solution. This study considers two extra-high voltage (EHV) levels of transmission lines—500 kV and 765 kV—as potential options for the expansion of the system’s infrastructure.
Initially, we conducted a detailed load flow analysis for several possible potential TEP scenarios and verified which scenarios consistently meet requirements under normal and in the event of any single contingency. These scenarios are being considered as candidates for the TEP. The candidate scenarios that can effectively handle the increased load and integrate the additional generation at new locations at the point of interconnection, named bus 24, under normal and all single contingencies are as follows:
With 500 kV voltage level transmission lines:
  • Candidate I: Three-line connections to bus 17 from bus 24.
  • Candidate II: Three-line connections to bus 23 from bus 24 and one additional line connection between bus 17 and bud 23
  • Candidate III: Two-line connections to bus 17 and one-line connection to bus 23 from bus 24
  • Candidate IV: One-line connections to bus 17 and two-line connections to bus 23 from bus 24.
With the 765 kV voltage level transmission line:
  • Candidate V: Two-line connection from bus 24 to bus 22 with an intermediate substation at the middle of the line.
The system configuration requirement for each TEP candidate scenario and the total power loss in each scenario have been summarized in Table 6. Scenarios I to IV are TEP candidates for a 500 kV transmission line, and V is the candidate with a 765 kV transmission line. For candidate V, with a 765 kV transmission voltage level, an intermediate substation, bus 25, is required at the middle of the line. The voltage needs to be controlled at this intermediate bus, and we also need to add two additional 765/500 kV, 500 MVA power transformers (22–17). The required numbers of additional bays with breaker and half characteristics for each voltage level and the total cumulative capacity of shunt compensation are indicated in Table 6. For all 500 kV TEP candidates (I to IV), the total power losses in the network, following new generation integration and network expansion, surpass those of the base case. In contrast, TEP candidate V demonstrates reduced power losses compared to the base case after network expansion and generation addition.

5.1. Cost Analysis of TEP Candidates

We need to find the most economically viable scenario among these candidates’ lines for the TEP problem. For the detailed cost analysis, we need to consider the capital cost of transmission lines, additional shunt reactors, and additional bays, as well as the operation and maintenance costs of transmission lines and the cost of additional power loss. After finding the cost of each alternative, the optimal TEP scenario can be selected. The Midcontinent Independent System Operator (MISO) Transmission Expansion Plan (MTEP) for the year 2024, named the Transmission Cost Estimation Guide for MTEP24, provides the cost of transmission lines per unit length, the cost of transformers, the cost of shunt compensation, such as shunt reactors and shunt capacitors per Mvar capacity, and the cost of bays with different characteristics [35]. The average cost of transmission lines across the different states of the US, the per Mvar cost of shunt inductor or capacitor, the bay cost with breaker and half characteristics, and the cost of 500/765 kV transformer are shown in Table 7.
References [36,37] show that the maintenance cost of the transmission line is about 1 to 2% of the capital cost per annum. Based on this reference, the maintenance cost of the transmission line is considered to be 1% of the capital cost per annum for the 500 kV transmission. Due to the higher voltage and complex structure, the maintenance cost of the 765 kV transmission line is higher and is considered to be 1.5% of the capital cost per annum. To calculate the present value of the O&M cost of the transmission line, Equation (13) can be employed.
P r e s e n t   v a l u e   o f   C O M = ( 1 + i ) n 1 i ( 1 + i ) n C O M
where i is the discount rate (considered 7%), n is the considered lifetime of the transmission line, and C O M is the annual maintenance cost of the transmission.
In transmission expansion planning, a thorough economic evaluation of power losses due to TEP is essential to accurately capture their contribution to the total cost of transmission infrastructure to ensure the planning decisions are economically sound and technically optimized. These losses in the system need to be compensated for by increased generation output. Therefore, the cost of the power losses can be calculated in terms of the generation cost for the amount of energy that is equivalent to making up for the additional lost energy because of TEP.
According to Reference [38], the average capital cost for natural gas-fired combined cycle power plants in the US is approximately USD 1.04 million per MW of installed capacity. Additionally, reference [39] reports that the fixed operational and maintenance (O&M) cost for such plants is USD 30,000 per MW annually, with a variable O&M cost of USD 1.92 per MWh. Therefore, the total annual O&M cost for 1 MW of power generation is USD 0.046819 million. In 2023, the average price of natural gas is reported to be USD 2.665 per MMBtu [40], with a heat rate of 6.30 MMBtu/MWh [39]. Based on these figures, the annual fuel cost for a 1 MW power plant amounts to USD 0.147076 million.
Assuming a 30-year lifespan for the transmission line, with constant operation and maintenance (O&M) and fuel costs over this period, the total cost of each TEP candidate has been calculated and is shown in Table 8. The cost calculation includes the expenses associated with the capital cost of additional lines, additional bays and substations, additional shunt compensations, and additional power transformers and maintenance costs. It also includes the cost of additional power losses in the system throughout the considered life span of the transmission line for planned expansion for next five years with 5% increased load and the addition of a new generation considered at the new location. The cost analysis result shows that for the network expansion with a 500 kV transmission line, the optimal scenario is candidate #I, the three-line connection from bus 24 to bus 17, since it incurs the minimum total cost (the capital investment and the operational and maintenance cost throughout the life span of the transmission line) compared to the other candidates at this voltage level. Candidate V has less power loss even in the case of the base test system. Despite having a higher voltage line and requiring more shunt compensations capacity, an intermediate substation, and two additional transformers, it requires only two-line connections and also reduces power loss costs. The key cost benefits can be summarized as:
  • Higher Power Transfer Capacity: The 765 kV transmission lines allow for significantly higher power transfer capacity over long distances compared to 500 kV lines, which means a higher steady-state stability limit. This reduces the number of transmission lines required to connect remote wind farms, lowering the overall infrastructure costs.
  • Reduced Power Losses: The 765 kV lines exhibit lower power losses compared to the 500 kV lines, leading to more efficient energy transmission. This results in long-term operational cost savings, especially for power plants located far from demand centers.
  • Fewer Transmission Lines: Despite the higher upfront capital cost of 765 kV lines per circuit, it reduces the required number of transmission lines, which translates into fewer bays and transformers, further lowering the overall cost of grid expansion.
  • Lower Lifetime Costs: Over 30 years, the savings from reduced power losses and infrastructure requirements make integrating via 765 kV lines the most cost-effective option, demonstrating the lowest total cost compared to integrating via 500 kV lines.
Therefore, the expansion with a 765 kV voltage level transmission line has a minimum total cost compared to other candidates and is the best choice for the transmission expansion for the considered planning.

5.2. Detailed Load Flow Analysis of Optimal TEP Scenario

As illustrated in the detailed cost analysis in Table 8, candidate V is the economically optimal TEP option. Figure 7 shows the single-line diagram and detailed load flow analysis during normal operating conditions for candidate V.
The single-line diagram illustrates information about generations, loads, line connections, and shunt-compensating devices. The blue color in the network denotes the 500 kV voltage level and the green color symbolizes the 765 kV voltage level. Bus 24 serves as the point of interconnection for new generation and bus 25 acts as the intermediate substation for lines connecting bus 24 and 22. The results demonstrate that the system satisfies bus voltage, line flow, and reactive power requirements under normal operating condition. This system can also operate reliably in the event of all single contingency conditions where the contingency components are transmission lines and transformers.
As the newly added generation unit at bus 24 is considered a renewable energy source, wind generation, the power output from this source is highly intermittent and unpredictable. Sometimes it can generate at its full capacity and sometimes it drops to zero. A robust power system must accommodate these fluctuations while maintaining system reliability. The proposed TEP, featuring two 765 kV line connections, can withstand this variability effectively. During periods of minimal generation, one line between Bus 24 and Bus 25 can be switched off, while both lines remain fully operational during periods of maximum output.
In large-scale transmission expansions, as examined in this paper, environmental and social considerations, such as land use, biodiversity conservation, and public opposition, are pivotal in shaping transmission expansion planning (TEP) scenarios. These factors can significantly influence the selection of optimal routes, technologies, and designs by requiring planners to balance technical efficiency and economic benefits with minimizing ecological disruption and social resistance. For instance, public opposition to new transmission corridors or potential impacts on protected ecosystems may compel the adoption of more compact and high-power density designs, underground lines if applicable, or alternative routes that avoid sensitive areas. Moreover, regulatory frameworks often mandate environmental impact assessments, requiring layers of approval, potentially leading to reshaping or modifying the transmission route. Proactively addressing these concerns in the early stages of planning is essential to ensure that transmission lines are technically and economically viable, environmentally sustainable, and socially acceptable. This is in line with the TEP study carried out above, which concluded that a lower number of transmission lines would in turn reduce the negative environmental and social impact.

6. Conclusions

This study introduced an extra-high voltage (EHV) synthetic test system designed for transmission expansion planning (TEP) studies and other steady-state analyses of power systems, incorporating both 500 kV and 765 kV voltage levels. The test system includes long transmission lines accurately modeled using the π model. Through detailed load flow analysis under both normal and all single contingency conditions, the system demonstrated its ability to maintain reliable and stable operation, adhering to all technical requirements. By simulating realistic operational conditions, this test system enhances the capacity for rigorous testing and validation of emerging TEP methodologies, ultimately supporting the development of resilient and efficient power networks in response to growing energy demands and the integration of renewable resources.
A transmission expansion planning (TEP) study was conducted on this test system for the next five years, accounting for a 5% increase in load, which is to be met by zero-emission technologies from a wind power plant/farm located remotely from the existing network. Several potential TEP scenarios were evaluated, and the most technically feasible and economically optimal option was selected to accommodate the increased load and integrate the new energy source. This study demonstrates the effectiveness of the proposed test system in facilitating transmission expansion planning studies for future power grids, which are transitioning towards zero-emission-based renewable energy sources that necessitate extensive planning in the transmission systems.

Author Contributions

Conceptualization, B.D. and M.G.; methodology, B.D. and M.G.; software, B.D. and M.G.; validation, B.D. and M.G.; formal analysis, B.D. and M.G.; investigation, B.D. and M.G.; writing—original draft preparation, B.D.; writing—review and editing, M.G.; supervision, M.G.; project administration, M.G.; funding acquisition, M.G. All authors have read and agreed to the published version of the manuscript.

Funding

This research was supported in part by the National Science Foundation (NSF) under Award 2306098.

Data Availability Statement

Data are contained within the article.

Conflicts of Interest

The authors declare no conflicts of interest.

References

  1. International Energy Outlook–U.S. Energy Information Administration (EIA). Available online: https://www.eia.gov/outlooks/ieo/data.php (accessed on 16 July 2023).
  2. Larson, E.; Greig, C.; Jenkins, J.; Mayfield, E.; Pascale, A.; Zhang, C.; Drossman, J.; Williams, R.; Pacala, S.; Socolow, R.; et al. Net-Zero America: Potential Pathways, Infrastructure, and Impacts; interim report; Princeton University: Princeton, NJ, USA, 2020. [Google Scholar]
  3. Kissling, F.; Nefzger, P.; Nolasco, J.F.; Kaintzyk, U. Overhead Power Lines, Planning, Design, Construction; Springer: Berlin/Heidelberg, Germany, 2003; pp. 154–196. [Google Scholar]
  4. Glover, J.D.; Sarma, M.S.; Overbye, T.J. Power System Analysis and Design, 5th ed.; Cengage Learning: Stamford, CT, USA, 2012. [Google Scholar]
  5. Franck, C.M. HVDC circuit breakers: A review identifying future research needs. IEEE Trans. Power Del. 2011, 26, 998–1007. [Google Scholar] [CrossRef]
  6. Effah, F.B.; Watson, A.J.; Ji, C.; Amankwah, E.; Johnson, C.M.; Davidson, C.; Clare, J. Hybrid HVDC circuit breaker with self-powered gate drives. IET Power Electron. 2016, 9, 228–236. [Google Scholar] [CrossRef]
  7. Bucher, M.K.; Franck, C.M. Fault current interruption in multiterminal HVDC networks. IEEE Trans. Power Del. 2016, 31, 87–95. [Google Scholar] [CrossRef]
  8. Zhuo, Z.; Zhang, N.; Yang, J.; Kang, C.; Smith, C.; O’Malley, M.J.; Kroposki, B. Transmission expansion planning test system for AC/DC hybrid grid with high variable renewable energy penetration. IEEE Trans. Power Syst. 2020, 35, 2597–2608. [Google Scholar] [CrossRef]
  9. Dechamps, C.; Jamoulle, E. Interactive computer program for planning the expansion of meshed transmission networks. Int. J. Electr. Power Energy Syst. 1980, 2, 103–108. [Google Scholar] [CrossRef]
  10. Meneses, M.; Nascimento, E.; Macedo, L.H.; Romero, R. Transmission network expansion planning considering line switching. IEEE Access 2020, 8, 115148. [Google Scholar] [CrossRef]
  11. Rahmani, M. Study of New Mathematical Models for Transmission Expansion Planning Problem. Ph.D. Thesis, Ilha Solteira UNESP, São Paulo, Brazil, 2013. [Google Scholar]
  12. Romero, R.; Monticelli, A.; Garcia, A.; Haffner, S. Test systems and mathematical models for transmission network expansion planning. IEE Proc. Gener. Transm. Distrib. 2002, 149, 27. [Google Scholar] [CrossRef]
  13. Sierra, J.E.; Giraldo, E.A.; Lopez-Lezama, J.M. Weighting transmission loading relief nodal indexes for the optimal allocation of distributed generation in power systems. Contemp. Eng. Sci. 2018, 11, 2601–2611. [Google Scholar] [CrossRef]
  14. Xu, Q.; Hobbs, B.F. Value of model enhancements: Quantifying the benefit of improved transmission planning models. IET Gener. Transm. Distrib. 2019, 13, 2836–2845. [Google Scholar] [CrossRef]
  15. Haffner, S.; Monticelli, A.; Garcia, A.; Mantovani, J.; Romero, R. Branch and bound algorithm for transmission system expansion planning using a transportation model. IEE Proc. Gener. Transm. Distrib. 2000, 147, 149. [Google Scholar] [CrossRef]
  16. Mutlu, S.; Şenyiğit, E. Literature review of transmission expansion planning problem test systems: Detailed analysis of IEEE-24. Electr. Power Syst. Res. 2021, 201, 107543. [Google Scholar] [CrossRef]
  17. Pena, I.; Martinez-Anido, C.B.; Hodge, B.-M. An extended IEEE 118-bus test system with high renewable penetration. IEEE Trans. Power Syst. 2018, 33, 281–289. [Google Scholar] [CrossRef]
  18. Power Systems Test Cases Archive. Available online: https://labs.ece.uw.edu/pstca/ (accessed on 16 August 2024).
  19. Birchfield, A.B.; Xu, T.; Gegner, K.M.; Shetye, K.S.; Overbye, T.J. Grid Structural Characteristics as Validation Criteria for Synthetic Networks. IEEE Trans. Power Sys. 2017, 32, 3258–3265. [Google Scholar] [CrossRef]
  20. Birchfield, A.B.; Xu, T.; Gegner, K.M.; Shetye, K.S.; Overbye, T.J. Statistical Considerations in the Creation of Realistic Synthetic Power Grids for Geomagnetic Disturbance Studies. IEEE Trans. Power Syst. 2017, 32, 1502–1510. [Google Scholar] [CrossRef]
  21. Birchfield, A.B.; Xu, T.; Gegner, K.M.; Shetye, K.S.; Overbye, T.J. Application of Large-Scale Synthetic Power System Models for Energy Economic Studies. In Proceedings of the 2017 50th Hawaii International Conference on System Sciences (HICSS), Koloa, HI, USA, 4–7 January 2017. [Google Scholar]
  22. Birchfield, A.B.; Xu, T.; Gegner, K.M.; Shetye, K.S.; Overbye, T.J. Building synthetic power transmission networks of many voltage levels, spanning multiple areas. In Proceedings of the 2018 51st Hawaii International Conference on System Sciences (HICSS), Koloa, HI, USA, 3–6 January 2018. [Google Scholar]
  23. Birchfield, A.B.; Xu, T.; Overbye, T.J. Power Flow Convergence and Reactive Power Planning in the Creation of Large Synthetic Grids. IEEE Trans. Power Syst. 2018, 33, 6667–6674. [Google Scholar] [CrossRef]
  24. Aguado, J.A.; Racero, A.J.S.; De La Torre, S. Optimal operation of electric railways with renewable energy and electric storage systems. IEEE Trans. Smart Grid 2018, 9, 993–1001. [Google Scholar] [CrossRef]
  25. Ahmadi, M.; Jafari Kaleybar, H.; Brenna, M.; Castelli-Dezza, F.; Carmeli, M.S. Integration of Distributed Energy Resources and EV Fast-Charging Infrastructure in High-Speed Railway Systems. Electronics 2021, 10, 2555. [Google Scholar] [CrossRef]
  26. Brenna, M.; Foiadelli, F.; Kaleybar, H.J. The Evolution of Railway Power Supply Systems Toward Smart Microgrids: The concept of the energy hub and integration of distributed energy resources. IEEE Electrif. Mag. 2020, 8, 12–23. [Google Scholar] [CrossRef]
  27. Dhamala, B.; Ghassemi, M. A Test System Meeting Requirements under Normal and Contingency Conditions at Multiple Loadings for Transmission Expansion Planning. In Proceedings of the IEEE Dallas Circuits and Systems Conference (DCAS), Dallas, TX, USA, 19–21 April 2024. [Google Scholar]
  28. Dhamala, B.; Ghassemi, M. A High Voltage Test System Meeting Requirements Under Normal and All Single Contingencies Conditions of Peak, Dominant, and Light Loadings for Transmission Expansion Planning Studies. In Proceedings of the 2024 IEEE Texas Power and Energy Conference (TPEC), College Station, TX, USA, 12–13 February 2024. [Google Scholar]
  29. Dhamala, B.; Ghassemi, M. A Test System for Transmission Expansion Planning Studies. Electronics 2024, 13, 664. [Google Scholar] [CrossRef]
  30. Dhamala, B.; Ghassemi, M. Smart Transmission Expansion Planning Based on the System Requirements: A Comparative Study with Unconventional Lines. Energies 2024, 17, 1912. [Google Scholar] [CrossRef]
  31. Dhamala, B.; Ghassemi, M. Comparative Study of Transmission Expansion Planning with Conventional and Unconventional High Surge Impedance Loading (HSIL) Lines. In Proceedings of the IEEE PES General Meeting, Seattle, WA, USA, 21–25 July 2024. [Google Scholar]
  32. Wei-Gang, H. Study on conductor configuration of 500 kV Chang-Fang compact line. IEEE Trans. Power Deliv. 2003, 18, 1002–1008. [Google Scholar] [CrossRef]
  33. Ellert, F.J.; Miske, S.A.; Truax, C.J. EPRI Transmission Line Reference Book: 345 kV and Above, 2nd ed.; Electric Power Research Institute: Washington, DC, USA, 1982; pp. 11–62. [Google Scholar]
  34. Reactive Power Capability and Interconnection Requirements for PV and Wind Plants. Sandia National Laboratories. Available online: http://www.esig.energy/wiki-main-page/reactive-power-capability-and-interconnection-requirements-for-pv-and-wind-plants/#cite_note-1 (accessed on 4 August 2024).
  35. Transmission Cost Estimation Guide for MTEP23. Midcontinent Independent System Operator (MISO). May 2024. Available online: https://cdn.misoenergy.org/MISO%20Transmission%20Cost%20Estimation%20Guide%20for%20MTEP24337433.pdf (accessed on 4 August 2024).
  36. Madigan, G.; Lee, C.; Dixit, A.; Zhong, X.; Saha, T.; Ashworth, P. Comparing High Voltage Overhead and Underground Transmission Infrastructure: Cost and Economic Aspects. September 2023. Available online: https://s37430.pcdn.co/ciet/wp-content/uploads/sites/16/2023/11/04_Cost_Economics_Aspects.pdf (accessed on 4 August 2024).
  37. Teegala, S.K.; Singal, S.K. Economic Analysis of Power Transmission Lines using Interval Mathematics. J. Electr. Eng. Technol. 2015, 10, 1471–1479. [Google Scholar] [CrossRef]
  38. CPV Three Rivers Energy Center, Illinois, US. Power Technology. Available online: https://www.power-technology.com/projects/cpv-three-rivers-energy-center-illinois-us/ (accessed on 4 August 2024).
  39. Technologies | Electricity | 2023 | ATB | NREL. Available online: https://atb.nrel.gov/electricity/2023/technologies (accessed on 4 August 2024).
  40. Natural Gas Futures Contract 1 (Dollars per Million Btu). Available online: https://www.eia.gov/dnav/ng/hist/rngc1M.htm (accessed on 4 August 2024).
Figure 1. Single-line diagram of the test system.
Electronics 13 03937 g001
Figure 2. Line configuration for 500 kV and 765 kV line configuration.
Electronics 13 03937 g002
Figure 3. Difference in the line parameters with distributed and lumped modeling.
Electronics 13 03937 g003
Figure 4. Equivalent π model of long transmission line.
Electronics 13 03937 g004
Figure 5. The load flow result of the test system at peak loading condition under normal operating condition.
Electronics 13 03937 g005
Figure 6. Load flow analysis result of the test system at peak load condition for the outage of the 765 kV line.
Electronics 13 03937 g006
Figure 7. Load flow analysis results at normal operating conditions of the system for optimal TEP option: candidate V.
Electronics 13 03937 g007
Table 1. Bus information of the test system.
BusBus
Type
V s c (p.u.)Base kVPg (MW) Q g m i n (Mvar) Q g m a x
(Mvar)
PL (MW)QL (MW)Shunt Compensation
1Slack1.00500
2PQ-500---1700.00823.34300 Mvar (Capacitor)
3PV1.005003600−1080 21601700.00823.34-
4PQ-500---1600.00774.91150 Mvar (Capacitor)
5PQ-500---1700.00823.34250 Mvar (Capacitor)
6PV1.005003600−1080 21601700.00823.34-
7PQ-500---1900.00920.21350 Mvar (Capacitor)
8PV1.005003600−1080 21601600.00774.92-
9PQ-500---1700.00823.34200 Mvar (Capacitor)
10PV1.005003500−1080 21601800.00871.78-
11PQ-500---1700.00823.34350 Mvar (Capacitor)
12PV1.005003300−1080 21601600.00774.92-
13PV1.005003500−1080 21601800.00871.77-
14PQ-500---2100.001017.00300 Mvar (Capacitor)
15PV1.005003000−105021001700.00823.34-
16PQ-500---1800.00871.77400 Mvar (Capacitor)
17PQ-500---2000.00968.64-
18PQ-765 ------
19PQ-765 -----600 Mvar (Reactor)
20PQ-765 -----600 Mvar (Reactor)
21PQ-765 -----550 Mvar (reactor)
22PQ-765 ------
23PV-500 2200--1600.00774.91-
Table 2. Information on line length and line connection.
FromToNo. CircuitLine Length (km)FromToNo. CircuitLine Length (km)
122410.33142426.78
171370.92232436.70
252294.56362349.56
482416.14571435.50
5101376.357122300.05
8112349.109102447.28
9152398.2010142392.74
11131261.3012161406.46
13162417.2714151458.18
14171403.6415172402.16
16231324.5417231341.84
5183Transformer22173Transformer
1829123019201230
2021123021221230
Table 3. Information about used conductors for 500 kV and 765 kV transmission lines.
Voltage Level Conductor TypeStrandingDiameter (cm)Sub-Conductor Spacing (m)Res. At 75 Deg
(Ohm/km)
Ampacity of Single con. (A)
500 kV4 × Macaw42/72.67970.4572*0.45720.09744870
765 kV4 × Dipper 45/73.51800.4572*0.45720.05446 1210
Table 4. Information on line parameters and transformer (765/500 kV).
Line ConstraintsCapacity
r (p.u./km)x (p.u./km)y (p.u./km)
500 kV line9.1600 × 10−61.3240 × 10−40.01223SIL = 960 MW
765 kV line2.32645 × 10−65.6975 × 10−50.02863SIL = 2230 MW
Transformer 0.001290 p.u.0.025740 p.u.-500 MVA
Table 5. Summarized load flow analysis result of the test system at contingency conditions.
Line OutageLowest VoltageThe Highest Line Loading
V p.u. Bus#%LoadingLine
1–2 (1 line)0.987244.12%1–7
1–4 (1 line)0.931443.70%1–7
1–7 (1 line)0.921757.39%1–7
2–3 (1 line)0.968244.50%2–3
2–50.968746.41%1–7
3–60.983243.84%1–7
4–8 (1 line)0.947439.46%1–7
5–60.966542.73% 5–6
5–70.949740.22%1–7
5–100.9742041.42%1–7
7–110.9471140.51%1–7
7–120.972739.94%1–7
8–11 (1 line)0.9081146.61%8–11
9–100.918940.95%1–7
9–150.933940.72%1–7
10–14 (1 line)0.9852041.11% 1–7
11–13 0.9491139.83%1–7
12–14 (1 line)0.9772044.19%12–14
12–16 (1 line)0.9441639.80% 1–7
13–16 (1 line)0.9001647.72% 13–16
14–17 0.9241740.70%1–7
15–17 (1 line)0.9331740.80%1–7
16–230.9582340.76%1–7
17–230.9151740.72%1–7
18–220.917546.40%1–7
Table 6. System configuration requirements for each TEP candidate that operates normally, ensuring requirements are met under normal and single contingency conditions.
TEP
Candidate
No. of Lines from 24 to 17 or 22No. of
Lines from 24 to 23
No. of Lines from 17 to 23Power LossNo. of Additional BaysNo. of Additional TransformerRequired Total Shunt
Compensations
500 kV765 kV500 kV765 kV
I3--396.85 MW71-2300 Mvar Cap.
550 Mvar Ind.
2300 Mvar Ind.
II-31432.68 MW9--2300 Mvar Cap.
550 Mvar Ind.
1900 Mvar Ind.
III21-417.66 MW71-2300 Mvar Cap.
450 Mvar Ind.
2150 Mvar Ind.
IV12-417.26 MW7--2300 Mvar Cap.
2200 Mvar Ind.
1800 Mvar Ind.
V2(765 kV)--381.32 MW2132 (500 MVA, 500/765 kV)2300 Mvar Cap.
800 Mvar Ind.
3350 Mvar Ind.
Table 7. Cost of transmission line, shunt capacitor and reactor, and bay based on MISO Transmission Expansion Plan 2024 (MTEP24).
Voltage LevelAverage Cost of Line in the U.S.Shunt ReactorShunt CapacitorCost of Bay
(Breaker and Half)
Cost of 500/765 kV Power Transformer
500 kVUSD 2.8003 Million/kmUSD 24,806/MvarUSD 11,873/MvarUSD 7.3 MillionUSD 12,510/MVA
765 kVUSD 3.5211 Million/kmUSD 35,831/MvarUSD 11,873/MvarUSD 21.9 Million
Table 8. Cost analysis of each TEP candidate.
TEP CandidateCost of Line, Bay/Substation, and Shunt CompensationMaintenance CostOperation Cost: Cost of Power LossTotal Cost of TEP
USD (Million)
Line Cost USD
(Million)
Bay/Subst-Ation Cost USD (Million)Additional Reactor Cost USD (Million)500/765 kV Transformer USD (Million)Capital Investment USD (Million)Fuel Cost USD (Million)O&M cost
USD (Million)
I5040.5473.040.51655-625.48261.5082.0366276.3978065789.4816
II6417.839665.726.18415-796.392338.771252.36237164.48987561.7394
III5180.5557332.6613-642.857223.150431.2657398.2173536081.7069
IV5320.5751.118.88015-660.231722.734430.703996.4524416200.6726
V4225.32299.391.506812.51786.4825-−19.7763 (Saving)−62.1249
(Saving)
5333.2180
Disclaimer/Publisher’s Note: The statements, opinions and data contained in all publications are solely those of the individual author(s) and contributor(s) and not of MDPI and/or the editor(s). MDPI and/or the editor(s) disclaim responsibility for any injury to people or property resulting from any ideas, methods, instructions or products referred to in the content.

