Abstract
Electrocardiograms (ECGs) play a pivotal role in the diagnosis and prediction of cardiovascular diseases (CVDs). However, traditional methods for ECG classification involve intricate signal processing steps, leading to high design costs. Addressing this concern, this study introduces the Multiscale Convolutional Causal Attention network (MSCANet), which utilizes a multiscale convolutional neural network combined with causal convolutional attention mechanisms for ECG signal classification from the PhysioNet MIT-BIH Arrhythmia database. Simultaneously, the dataset is balanced by downsampling the majority class and oversampling the minority class using the Synthetic Minority Oversampling Technique (SMOTE), effectively categorizing the five heartbeat types in the test dataset. The experimental results showcase the classifier’s performance, evaluated through accuracy, precision, sensitivity, and F1-score and culminating in an overall accuracy of 99.35%, precision of 96.55%, sensitivity of 96.73%, and an F1-recall of 96.63%, surpassing existing methods. Simultaneously, the application of this innovative data balancing technique significantly addresses the issue of data imbalance. Compared to the data before balancing, there was a significant improvement in accuracy for the S-class and the F-class, with increases of approximately 8% and 13%, respectively.
1. Introduction
Cardiovascular diseases remain a major threat to human health [1], constituting 30% of global deaths according to a study by the World Health Organization [2]. Among these, arrhythmias are a common pathophysiological process within the cardiovascular system, characterized by irregularities in the rhythm and frequency of heartbeats due to disruptions in the conduction of cardiac electrical activity [3]. Hence, the development of accurate cardiac diagnostics for timely medical intervention is crucial to saving lives [4,5].
Currently, electrocardiogram (ECG) analysis stands out as the most direct and effective method for diagnosing cardiac abnormalities [6]. An ECG records the waveform of surface electrical signals, typically composed of P-waves, QRS complexes, and T-waves [7]. The electrocardiogram, as a graphical representation of cardiac electrical activity, encompasses a series of crucial mathematical features, spanning both temporal and spatial dimensions. In terms of temporal features, the intervals between P-waves, QRS complexes, and T-waves provide valuable information about the duration of different cardiac phases, aiding in the assessment of cardiac rhythm and stability. The width of the QRS complex becomes a pivotal indicator for evaluating ventricular conduction velocity, playing a vital role in understanding cardiac electrical activity. Concerning spatial features, the ST segment in the ECG reflects the cardiac state between contraction and relaxation, with its slope providing crucial information about myocardial ischemia or injury. The electrical axis of the heart, as a mathematical feature, describes the direction of cardiac signal propagation, while the amplitude and shape of the T-wave delve into deeper aspects of cardiac electrical activity, particularly those related to myocardial status. A thorough analysis of temporal and spatial features provides a profound understanding of cardiac electrical activity, forming the basis for arrhythmia detection and comprehension. Changes in electrophysiological characteristics can alter the propagation patterns, leading to different types of arrhythmias, manifested as noticeable variations in ECG waveform patterns [8,9]. While ECG serves as a non-invasive and cost-effective detection tool that is widely used in the clinical diagnosis of heart diseases, the increasing volume of data and complexity of ECG signals have rendered traditional manual analysis methods inadequate. In this context, the rise of deep learning technology presents a new paradigm for the automatic classification of ECG signals, holding the potential for revolutionary changes in clinical medicine.
With the continuous advancement of artificial intelligence technology, deep learning techniques have found widespread applications in the detection and classification of ECG signals, achieving notable success [10,11]. However, despite these accomplishments, a comprehensive analysis of numerous studies on ECG signal classification reveals persistent challenges. Notably, existing ECG network models often have large parameter sizes, resulting in a high model complexity that is unfavorable for training and application in resource-constrained environments. Furthermore, the training of these deep learning models may encounter difficulties due to the requirement for substantial annotated data and high computational power. Addressing these challenges is crucial to enhancing the performance and generalization ability of deep learning models in the field of ECG signal classification.
The imbalance in datasets on ECG (electrocardiogram) poses a common challenge for deep learning in arrhythmia classification. An imbalanced dataset refers to a situation where the number of samples in the arrhythmia categories is significantly lower than that in the normal category. Rajesh K. N. and Dhuli R [12] proposed a method using resampling techniques and an AdaBoost ensemble classifier to address the issue of a sparse number of arrhythmia samples in ECG datasets. Through resampling techniques, they aimed to balance the distribution of samples across different categories and improved the classification accuracy through the AdaBoost ensemble classifier, providing an effective strategy for handling imbalanced datasets. Niu et al. [13] explored the use of representative notations and convolutional neural networks from various viewpoints for ECG classification. By introducing representative notations, they sought to enhance the sensitivity to individual differences in ECG signals, potentially improving the accuracy of classification. In the study by Sharma et al. [14], a multiresolution wavelet transformation method was employed for accurate detection of the starting position of heartbeats and QRS waves in ECG signals. Feature extraction from each wavelet segment was implemented for data augmentation, aiming to enhance the adaptability of the model to changes in the QRS waveform morphology.
Current research extensively applies machine learning algorithms to identify arrhythmias from electrocardiogram (ECG) data. Methods include random forests [15], artificial neural networks [16], and support vector machines [17]. However, these traditional machine learning techniques require feature extraction before application, involving the manual extraction of various handcrafted features that influence classification outcomes [18,19]. The manual feature extraction process is time-consuming, underutilizes the underlying information in the database, and is prone to overfitting issues [20]. In traditional ECG signal classification studies, manual feature extraction is essential, involving the manual extraction of signal morphology and the design of feature engineering processes. These methods typically rely on features such as ECG R-R interval changes and waveform morphology [21], but their adaptability is limited in the presence of dynamic ECG data and significant noise interference. Contrastingly, the use of traditional machine learning algorithms such as SVM and decision trees [22] performs well on specific sample training and testing sets. However, when faced with a large amount of unknown test data, challenges arise, including the need for manual feature extraction and a poor generalization ability. The introduction of deep learning offers new possibilities for addressing these issues. By automatically learning high-level representations of the data, deep learning is expected to enhance the performance and generalization ability of classification algorithms.
Presently, deep learning has taken significant strides in the field of medical image analysis, particularly in data analysis [23]. Additionally, some studies explore the application of deep learning to the classification of electrocardiogram (ECG) data. Xia et al. proposed a novel wearable ECG classification system using convolutional neural networks and active learning [24]. Hannun et al. achieved arrhythmia detection and classification in long-term dynamic ECG that is comparable to the level of cardiac experts using deep neural networks [25]. In terms of heartbeat classification, Xiang et al. employed a two-level convolutional neural network and RR interval differences for ECG heartbeat classification [26]. Mathews et al. utilized deep learning for single-lead ECG classification, demonstrating its potential in medical imaging [27]. Furthermore, Saadatnejad et al. introduced an ECG classification based on long short-term memory networks (LSTM) that is suitable for continuous monitoring on personal wearable devices [28]. Kiranyaz et al. implemented real-time patient-specific ECG classification using one-dimensional convolutional neural networks [29]. Tan et al. enhanced the recognition accuracy of coronary artery disease ECG signals by combining convolutional and long short-term memory networks [30]. He et al. achieved automatic cardiac arrhythmia classification using a combination of deep residual networks and bidirectional LSTM [31]. Rajpurkar et al. demonstrated cardiologist-level arrhythmia detection with convolutional neural networks [32]. Cui et al. proposed a deep learning-based multidimensional feature fusion method for the classification of ECG arrhythmia [33]. Additionally, some studies have focused on the application of deep learning in the automatic interpretation of multiview echocardiograms for congenital heart disease [34]. These studies emphasize the extensive and promising potential for deep learning in image analysis and the classification of ECG data.
Drawing inspiration from the advancements in electrocardiogram (ECG) classification outlined above, we have developed an ECG classification mechanism employing multiscale convolution and causal attention. This study brings forth the following notable contributions:
- We devised a deep learning model that eliminates the necessity for a distinct feature extraction program. Instead, it consistently employs deep learning techniques to extract resilient features from the input ECG signal. This approach permits direct training and classification of the preprocessed ECG signal, thereby curtailing classification expenses.
- To address data imbalances, we employed mixed sampling techniques. Most classes underwent downsampling, while a few classes underwent SMOTE oversampling. This strategy balanced the dataset, narrowing the sample size disparity across all five heartbeat categories and heightening classification accuracy.
- We introduced a Multiscale Convolutional Causal Attention network for ECG classification. This network leverages multiscale convolution for spatial feature extraction from signals. Furthermore, the causal convolution attention extraction module captures temporal features, culminating in precise ECG signal categorization and enhancing classification performance. This advancement not only elevates accuracy but also streamlines the model’s complexity.
2. Materials and Methods
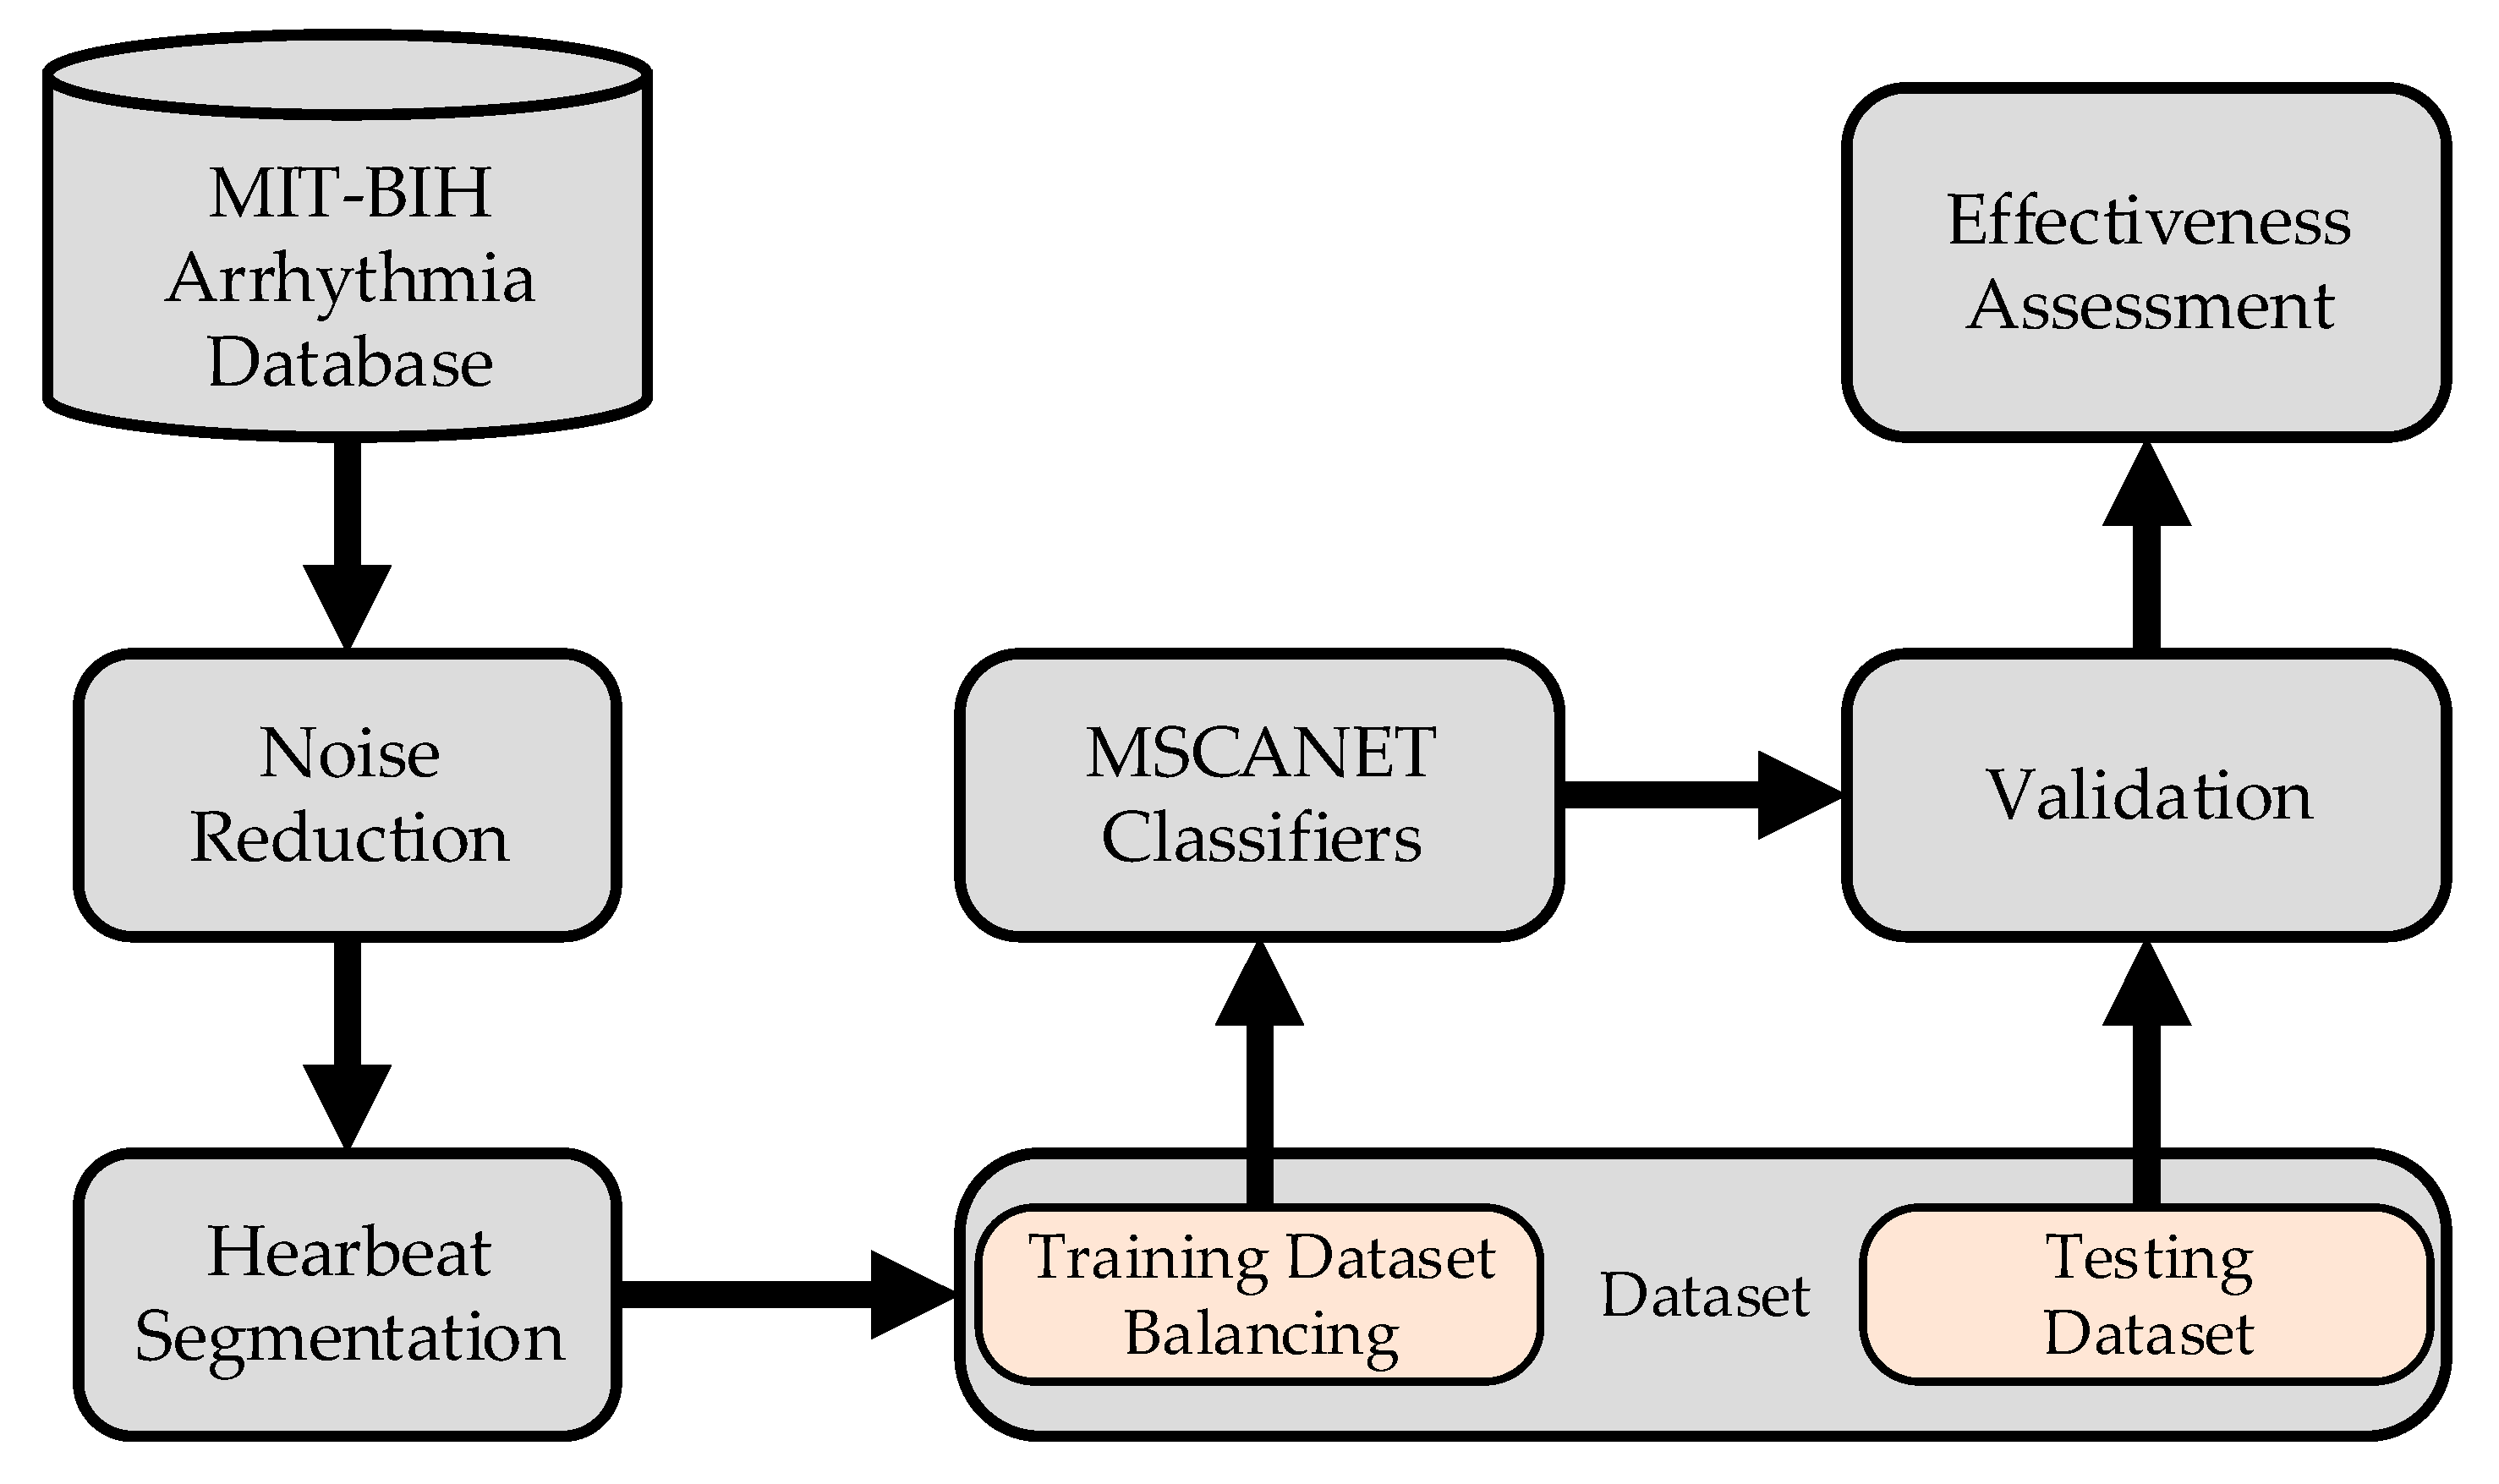
The process of arrhythmia classification is illustrated in Figure 1: The initial step involves preprocessing the raw signals. This begins with noise reduction, followed by heart beat segmentation, where lengthy sequential signals are divided into individual ones. Subsequently, the imbalanced dataset is addressed through mixed sampling based on labels. The balanced dataset is then divided into training and testing sets, which are fed into the model for processing. Ultimately, this leads to the classification of heart arrhythmias.
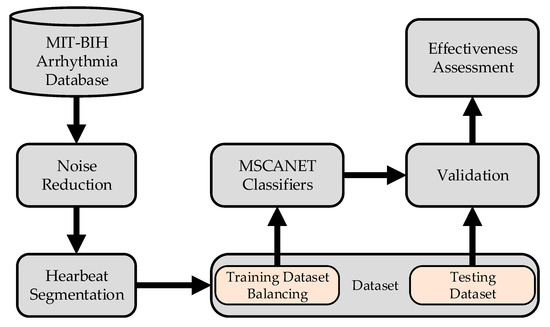
Figure 1.
Main procedure involved in the classification of ECG.
2.1. Data Preprocessing
The MIT-BIH database comprises several subdatabases that record specific types of electrocardiogram (ECG) signals. We utilized the PhysioNet MIT-BIH Arrhythmia Database [35], a widely used and freely available dataset for assessing the performance of various ECG classification algorithms. This ECG database consists of 48 dual-channel ECG signal recordings from 47 observed individuals. The recorded data have lengths and sampling rates of 30 min and 360 Hz, respectively. In the case of ANSI/AAMI [36] pacing beats are identified in the subject files 102, 104, 107, and 217, following the standard method for recording arrhythmias. Therefore, these traces are not included in the evaluation database. Furthermore, in accordance with the ANSI/AAMI standard, the types of heartbeats in the MIT-BIH Arrhythmia Database are reorganized into 5 distinct categories, totaling 15 categories. Table 1 illustrates the relationship between the categories in the AAMI standard heartbeat database and the categories in the MIT-BIH Arrhythmia Database.

Table 1.
Correspondence between 5 classifications under AAMI standard and 15 classifications in MIT-BIH.
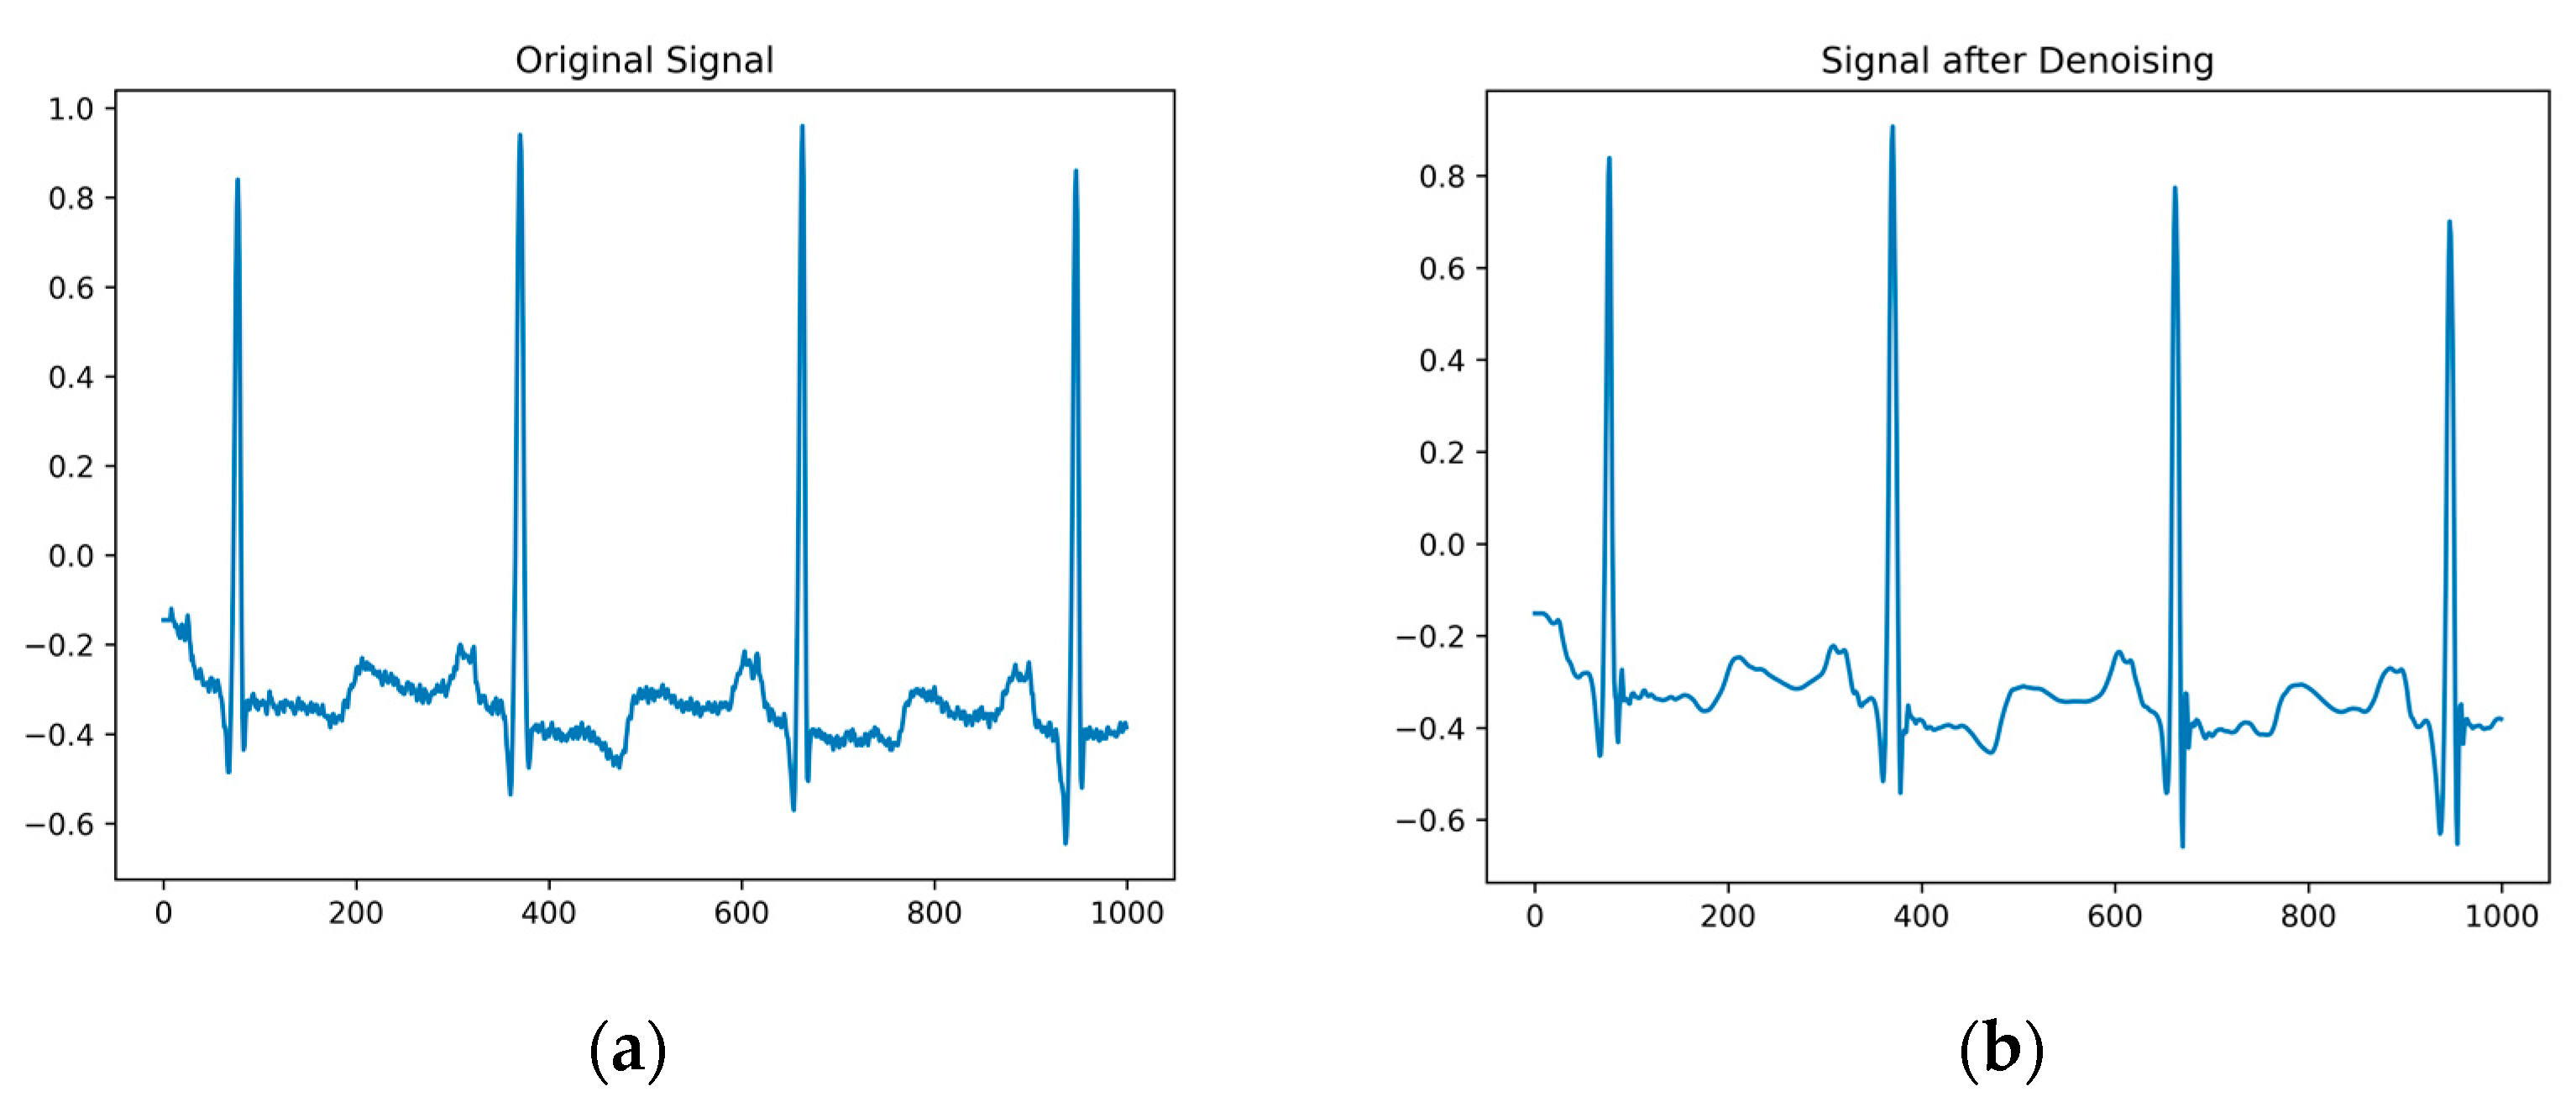
Original electrocardiogram signals often contain noise such as baseline drift, power-line interference, and electromyographic interference, which can to some extent affect the accuracy of the ECG classification. To suppress this noise, the wavelet soft threshold denoising algorithm [37] is employed. After performing a multiscale decomposition on the wavelet, thresholding and denoising are applied to the high-frequency coefficients of each layer. The denoised signal is obtained by performing wavelet reconstruction on each layer in sequence using inverse wavelet transform, as shown in Figure 2a. Comparing the original electrocardiogram signal with the denoised signal, as depicted in Figure 2b, it becomes evident that the wavelet soft threshold denoising algorithm effectively eliminates noise. The denoised signal appears smoother and retains the essential information.
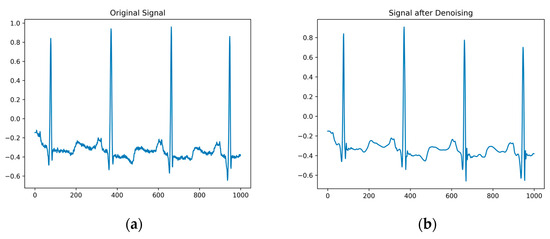
Figure 2.
(a) is the original signal diagram; (b) is a denoised signal graph.
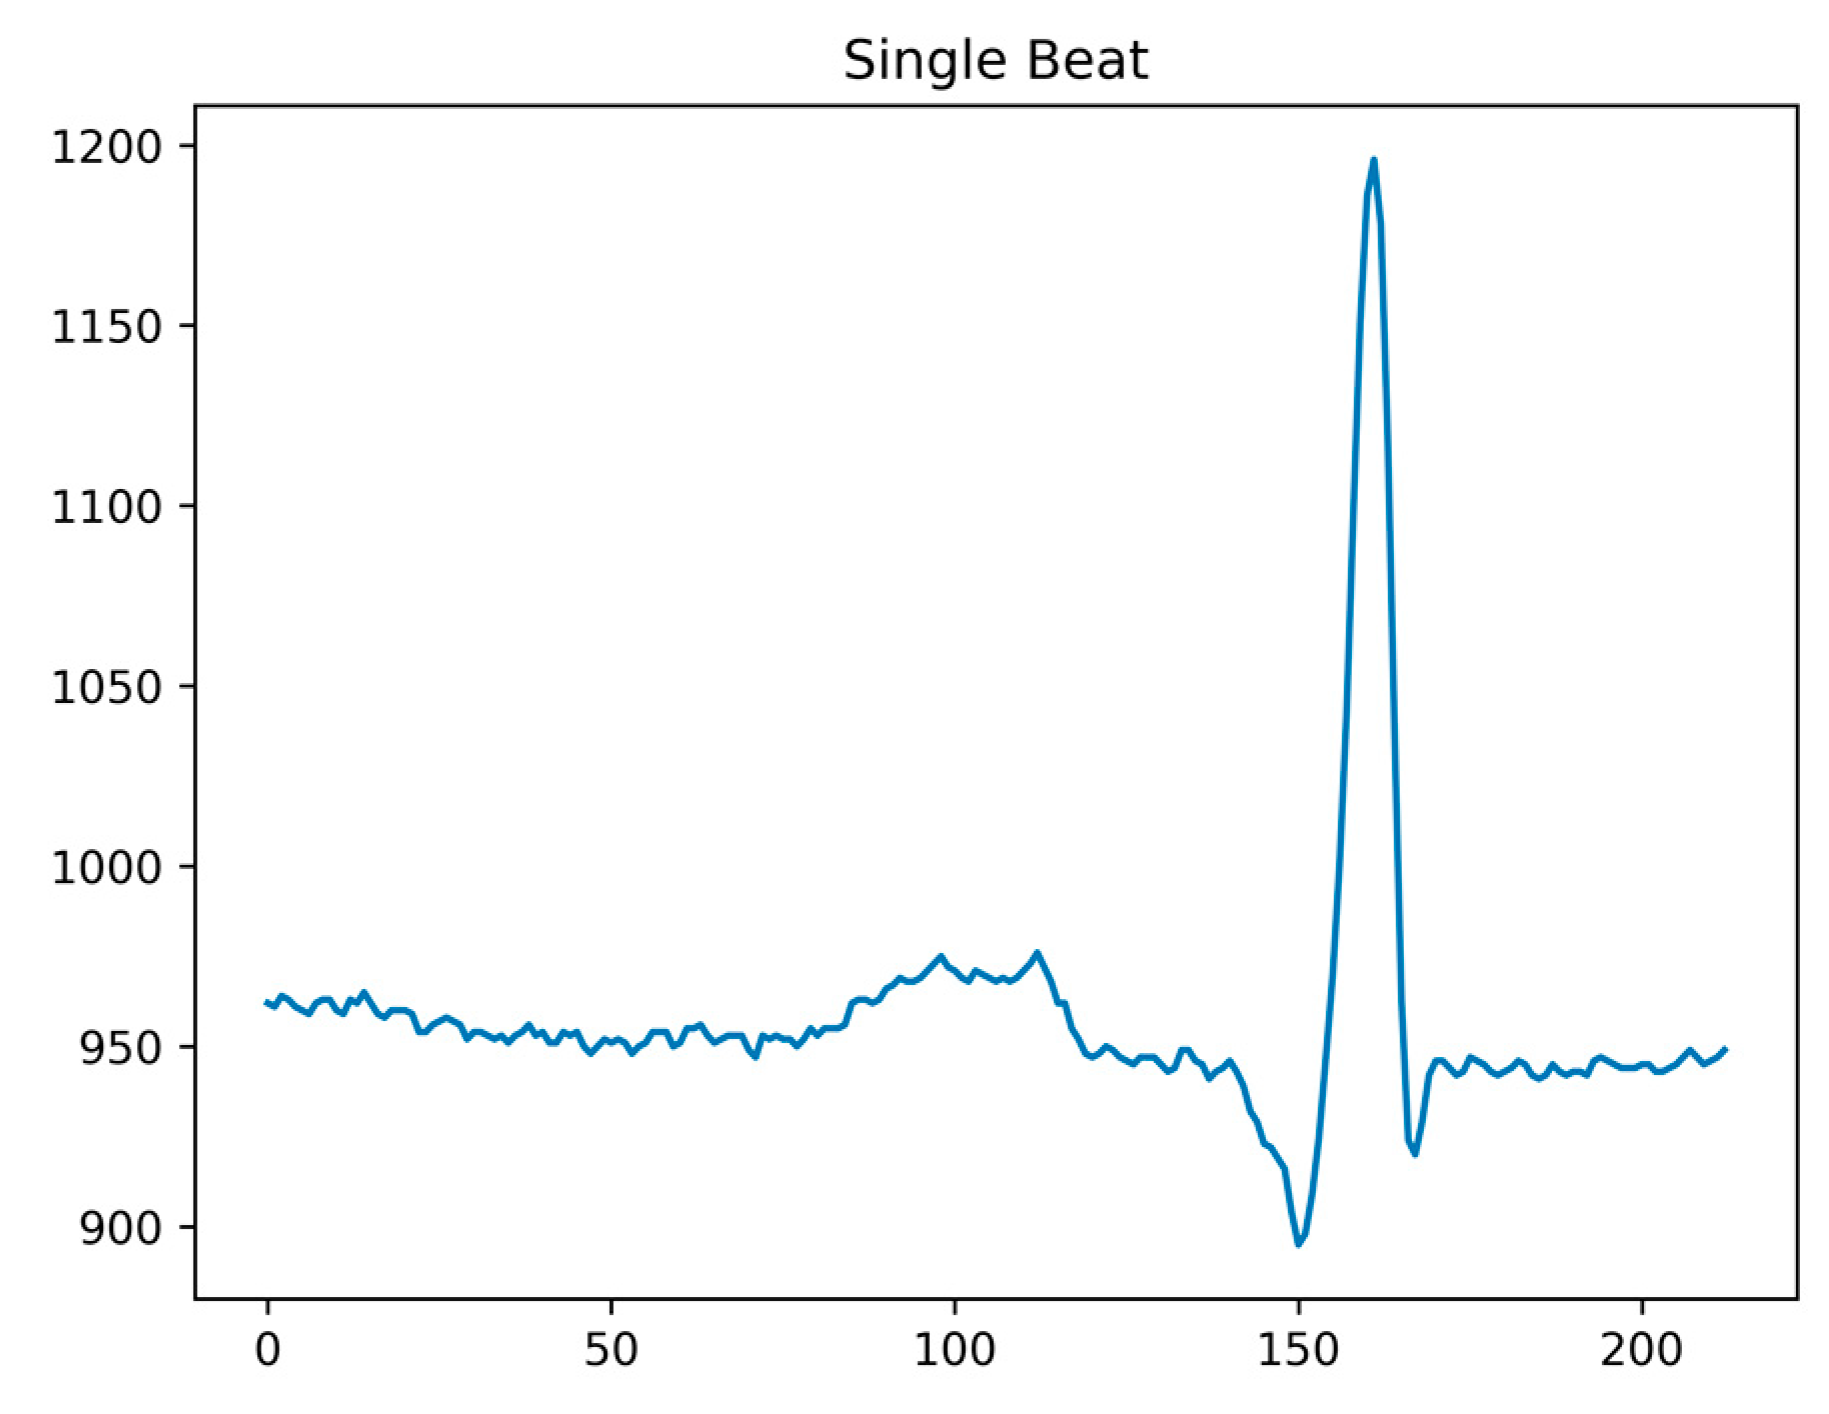
As our classification method in this paper focuses on heartbeat data, post denoising, it is essential to perform ECG signal heartbeat segmentation. Following the QRS complex annotations provided by the MIT-BIH Arrhythmia Database, continuous ECG signals can be divided into individual heartbeat data points. Considering the characteristics of ECG signals, the position of the R-wave peak tends to be closer to the P-wave, rather than in the center of the heartbeat. Taking the R-wave peak as a reference point, we extract a complete heartbeat by taking 160 data points before and 180 data points after the peak. This segmentation ensures that a full heartbeat is captured, as shown in Figure 3.

Figure 3.
Single shot signal after segmentation.
2.2. Data Balancing
In accordance with ANSI-AAMI standards, approximately 80% of heartbeats fall under the N class, leaving the remaining 20% for the V, S, F, and Q classes. This significant disparity in sample distribution leads to a highly imbalanced heartbeat dataset within MIT-BIH. This class imbalance can lead to misclassification as the decision making process becomes biased towards the majority class. Addressing the challenge of class imbalance involves various methods, including balancing at the algorithmic level and the data level, employing cost-sensitive techniques, and using integration methods [38]. Due to the algorithm-independent nature and simplified operations, data-level approaches are widely adopted. These methods primarily involve resampling, encompassing both oversampling and undersampling techniques. Among the fundamental resampling methods are random oversampling (ROS) and random undersampling (RUS). Additionally, more advanced resampling techniques like EasyEnsemble [39], KNNOR [40], and SMOTE [41] are also utilized to mitigate the class imbalance challenge.
The Synthetic Minority Oversampling Technique (SMOTE) generates new synthetic minority samples without duplication. The following equation can be utilized for generating synthetic data:
In this scenario, is randomly selected from the K nearest neighbors of the minority class instance , where represents the minority class instance under consideration, and is a random value from the interval (0, 1). It is crucial to emphasize that is uniformly distributed. The newly synthesized instance, , is generated by combining and . This approach helps alleviate overfitting issues and creates a balanced dataset.
According to the AAMI standard, ECG signal databases are categorized into five classes: Normal, Supraventricular, Ventricular, Fusion, and Unknown. To ensure that each category (S, V, F, and Q) contains a proportionate number of samples compared to class N, we employ oversampling for these categories. Simultaneously, we perform random undersampling of the majority class N to mitigate its impact. Table 2 below illustrates the changes in sample numbers within the training dataset after generating synthetic data, achieving a balanced dataset.
Table 2.
The number and proportion of various ECG signals after data balancing.
2.3. ECG Classification Using a Multiscale Convolutional Causal Attention Network
2.3.1. Framework of the Proposed Scheme
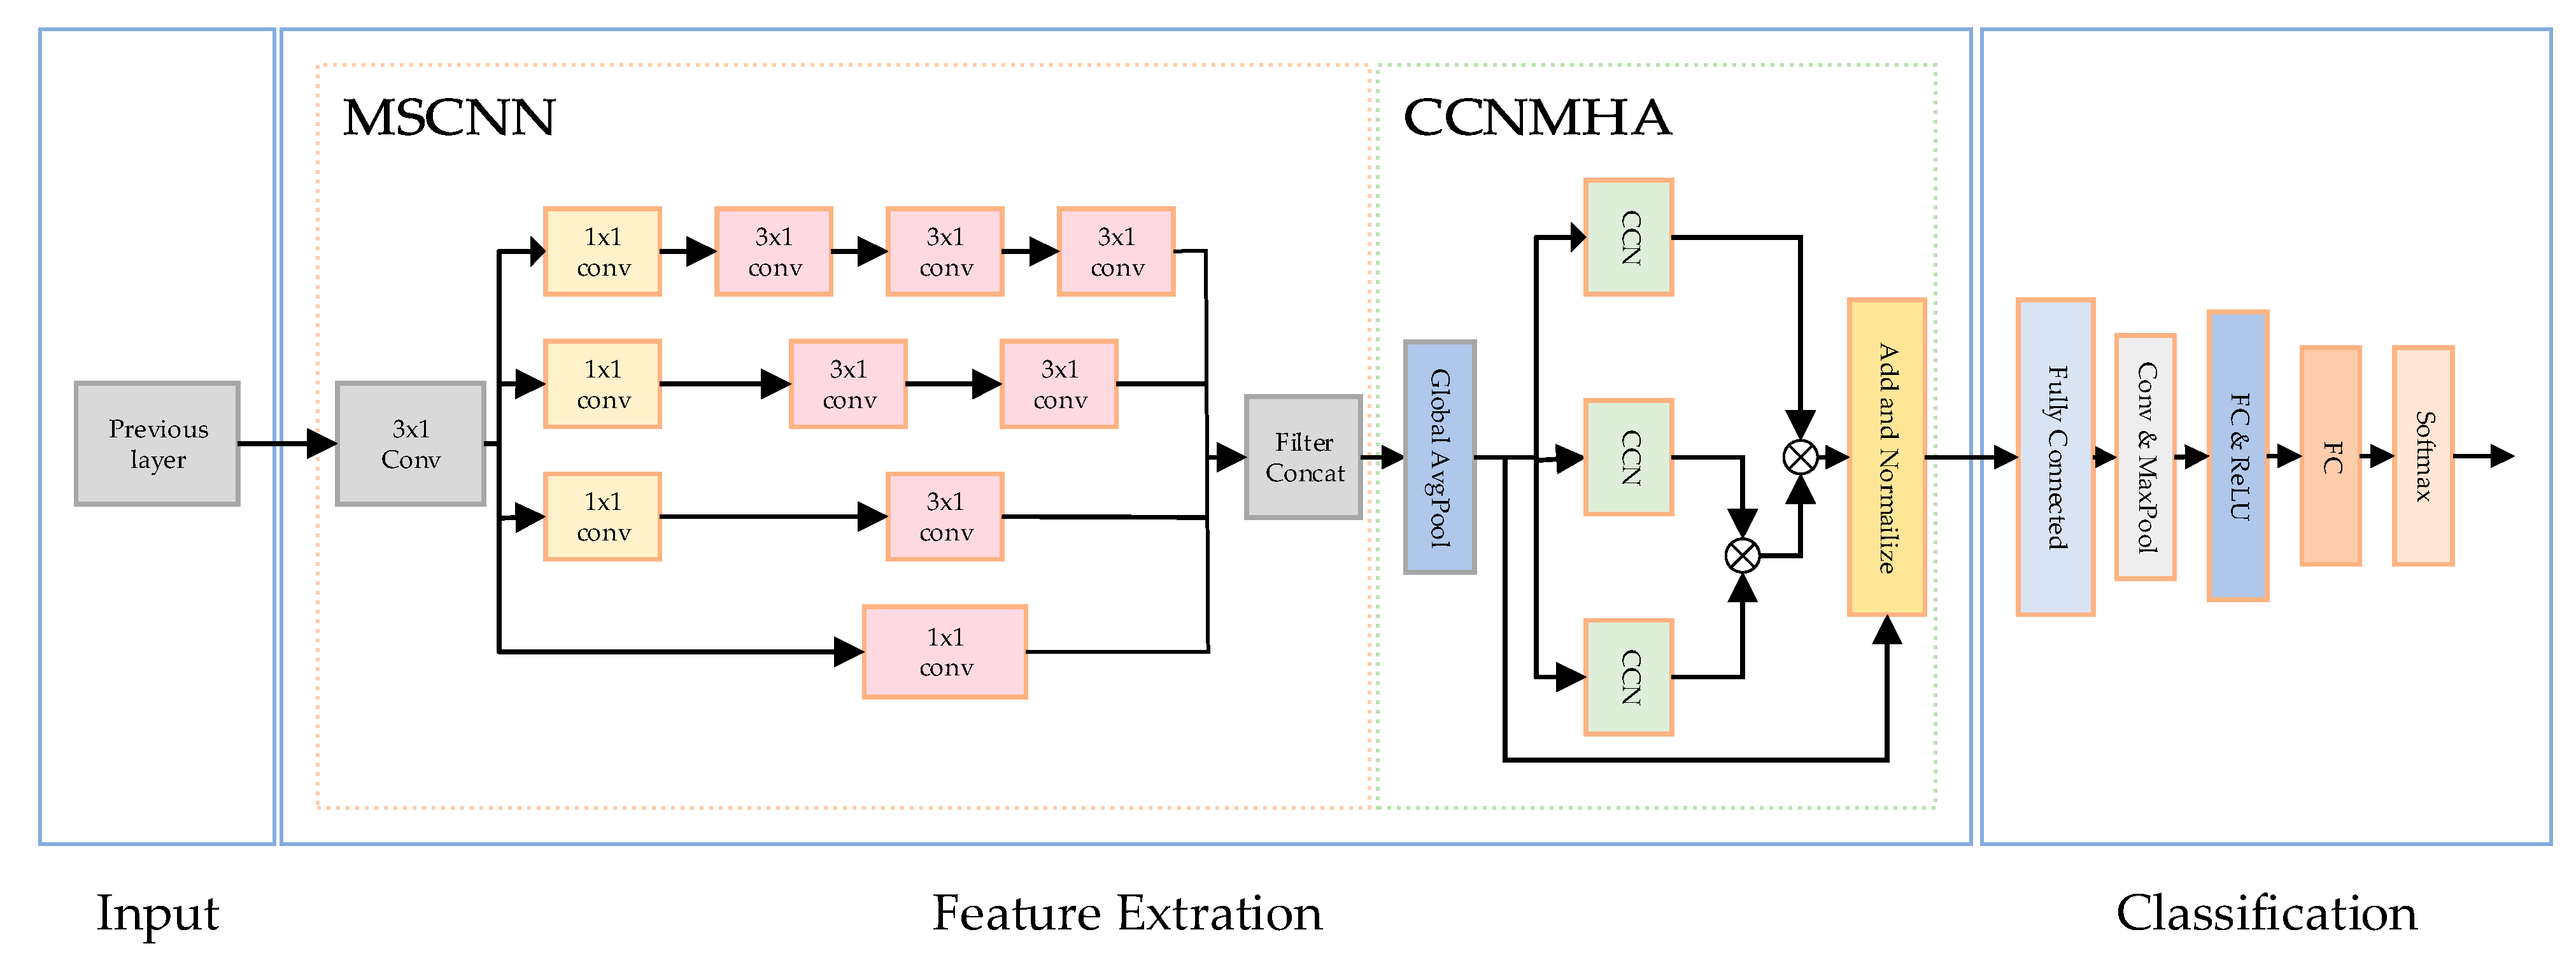
The overall structure of the arrhythmia classification network is shown in Figure 4. The spatial characteristics of multiscale convolution extraction signals and the temporal characteristics of signals extracted by the causal convolution injection extraction module finally determine the type of ECG signals.
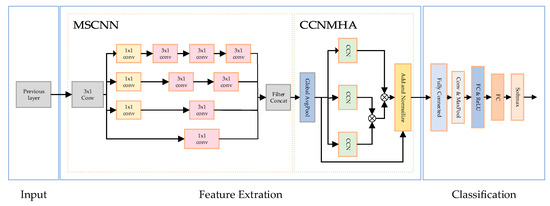
Figure 4.
Proposed MSCANet structure.
2.3.2. MultiScale Convolutional Neural Network
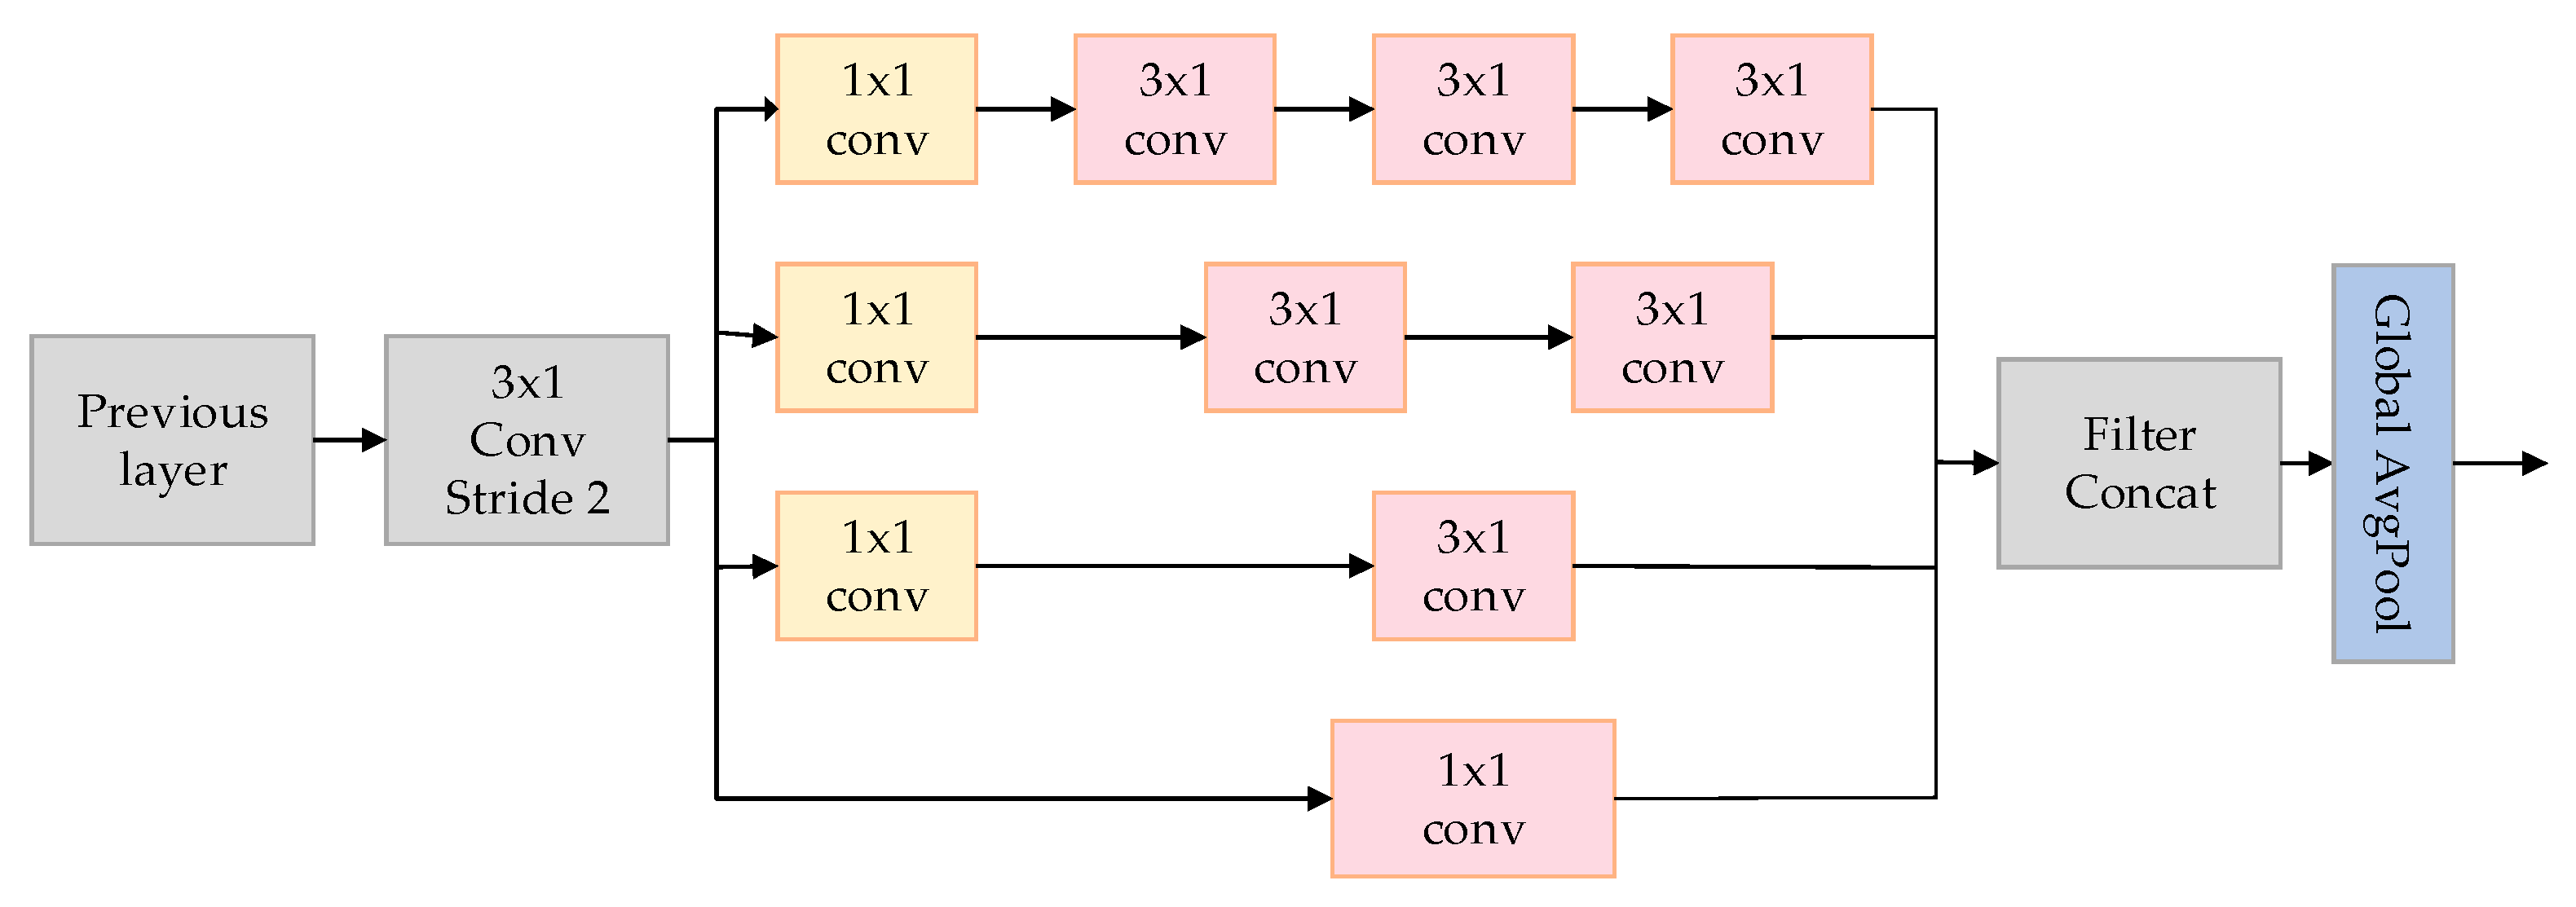
This paper introduces a model called the MultiScale Network (MSNet), aimed at improving the classification accuracy of arrhythmias, particularly in extracting spatial features from electrocardiogram (ECG) signals. As depicted in Figure 5, the utilized MSNet comprises multiple multiscale modules and a Global Average Pooling (GAP) layer.
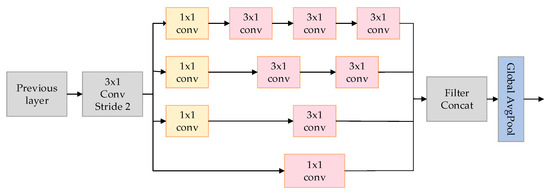
Figure 5.
The MSNET structure used in the article.
The crucial component of MSNet is the multiscale module, depicted on the left side of Figure 2. This module employs convolutions of varying sizes to capture information at different scales. Initially, a 3 × 1 convolutional layer C is utilized with a stride of 2. The purpose is to reduce feature dimensions without sacrificing spatial information, addressing potential issues that might arise from pooling operations.
Following this, four channels of convolutional layers, denoted as (where = 1, 2, 3, 4), employ various sizes of convolutional kernels to extract feature information from different scales of ECG signals. The specifications of these kernels are = 1 × 1, = 3 × 1, = 2 × 3 × 1, and = 3 × 3 × 1, with each branch further utilizing a 1 × 1 convolutional layer for information aggregation. These parallel convolutional modules increase the network’s width and enhance its ability to capture insights from multiple scales. The formula for the MS module is given by
where represents the input features of the module, and represents the output of the convolution. The design of the MS module was inspired by the Inception module in GoogLeNet [42], with the addition of a 7 × 1 large convolutional kernel to extract more extensive spatial features from the signal.
Conceptually, a large kernel can be likened to a stack of smaller kernels. For instance, a 7 × 1 kernel is equivalent to three layers of 3 × 1 kernels, i.e., [43]. Nevertheless, deep layers employing smaller kernels might not capture multiscale information. Furthermore, within the model, the role of max pooling is replaced by the use of convolutions of different sizes and batch normalization.
Due to the incorporation of multiscale convolutional layers, the model excels in learning prominent features, thereby improving classification accuracy by mitigating variations between different classes. However, owing to an intra-class data imbalance, the extracted features may lack sufficient discriminative power. On the right side of Figure 4, we introduce an additional component named center loss to enhance the learning of discriminative features. This loss function works by minimizing the distance between extracted features, thereby reducing information variance. Ultimately, our model exhibits enhanced capability in extracting multiscale spatial information from ECG signals for the task of abnormal heart rate classification.
2.3.3. Convolutional Causal Attention Network
The Multihead Attention mechanism is an important attention mechanism in deep learning that was originally widely used in natural language processing (NLP) tasks, especially gaining prominence in the Transformer model [44]. It allows models to simultaneously focus on different feature subspaces, thereby enhancing the model’s expressive power and performance. At its core, the attention mechanism is a way to calculate weighted values for different positions in a sequence, enabling selective emphasis on important parts when processing sequence data. The Multihead Attention mechanism further extends this idea by introducing multiple parallel attention “heads” to capture different semantic information. The key concepts of the Multihead Attention mechanism are as follows:
- Head Construction: In Multihead Attention, input features are linearly transformed to generate multiple representations for queries, keys, and values. This allows each head to focus on the input from different perspectives.
- Attention Weight Calculation: For each attention head, attention weights are computed by measuring the similarity between queries and keys. This is often achieved by using a dot product or similar similarity metrics, followed by a scaling operation and the application of the softmax function to map similarities to a probability distribution.
- Weighted Summation: By using the computed attention weights, each value is multiplied by its corresponding attention weight, and the weighted values are summed to obtain the attention output for each head.
- Head Fusion: Finally, the attention outputs from each head are concatenated or parallelly concatenated and then fused through another linear transformation, resulting in the final output of the Multihead Attention mechanism.
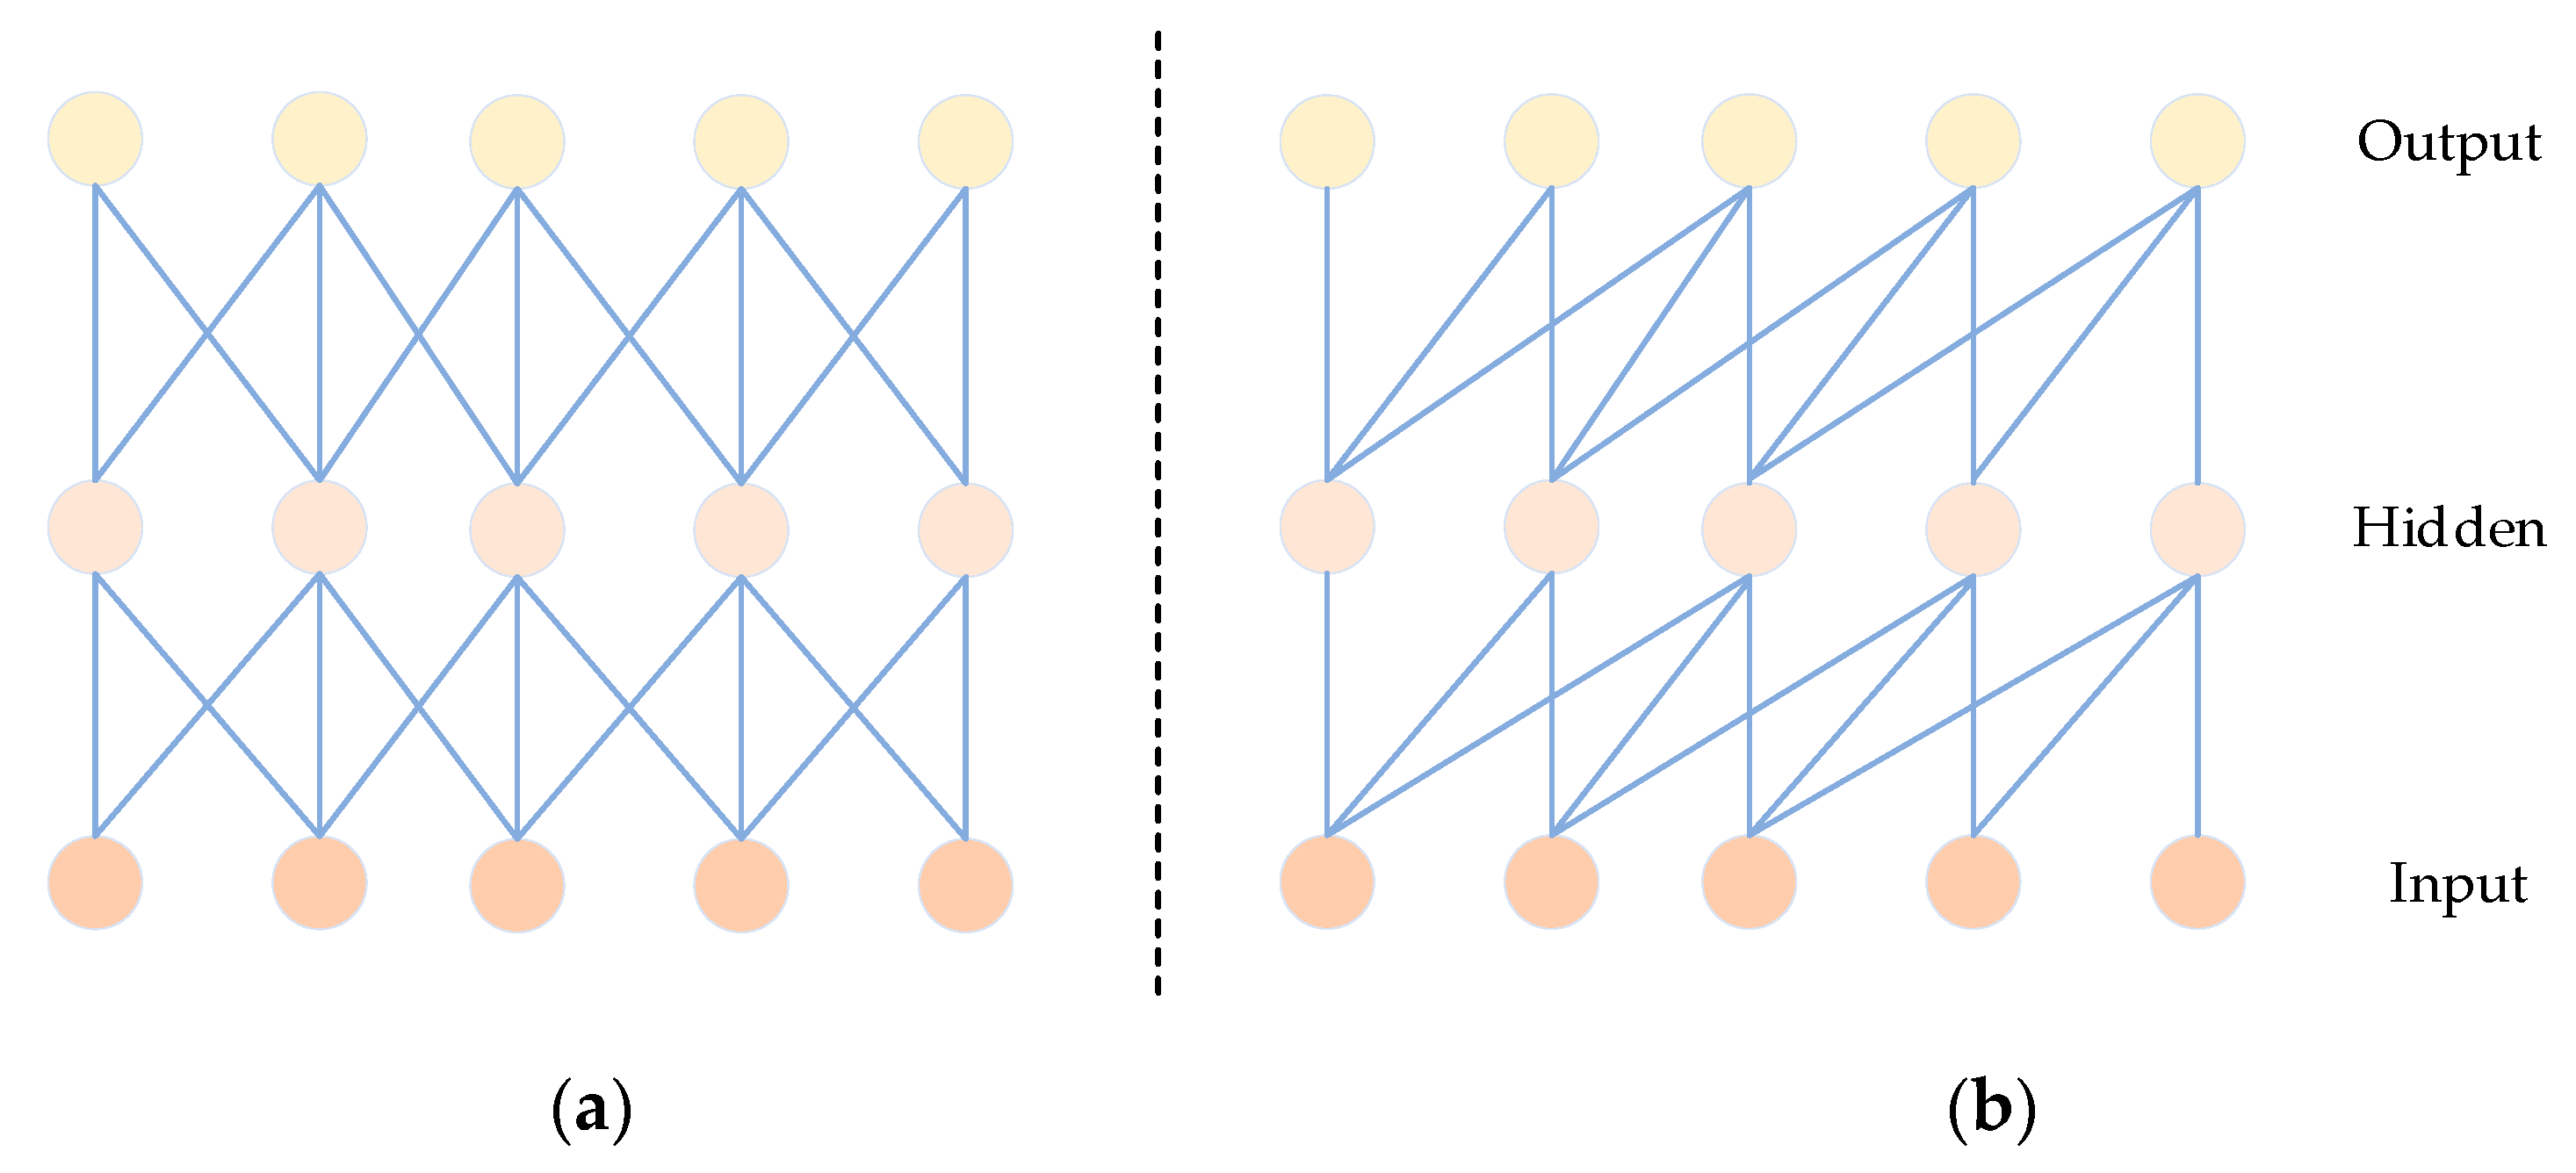
Causal convolution has been introduced as an effective method for extracting features in time signals [45]. Unlike traditional CNNs, as depicted in Figure 6, causal convolution specifically considers features from past time data. Importantly, it excludes features from future data, ensuring that the analysis of the current data is not influenced by predictions of future values. In sequence-based problems, the goal is to predict the value of based on historical data , , …, and previously observed target values , , …, . The predictive model employed aims to make closely approximate the actual value. Here, x represents the feature values, and y represents the target values [46].
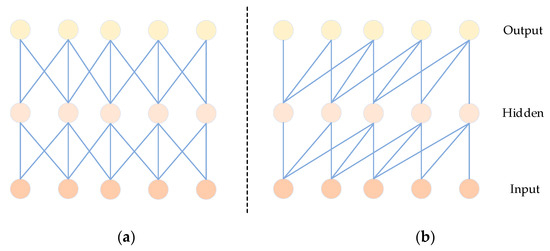
Figure 6.
Comparison diagram of CNN (a) and CCN (b) structures.
In our enhanced Multihead Attention (MHA) submodule, we incorporate causal convolution to obtain local temporal relationships and encode the positional information of the input. The role of causal convolution is to maintain the sequential order of input signals.
Moreover, causal convolution, similar to traditional convolutional neural networks (CNNs), possesses properties that enable it to serve the roles of the fully connected layer and positional encoding in the original model [45]. In comparison to the original approach, this substitution significantly reduces the computational load of the model. As depicted in Figure 7, the model takes the output of the fully connected layer as the input for the Multihead Attention module, employing causal convolution with a lower number of parameters in each channel. Causal convolutions generate Q, K, and V from Y, specifically, Q = φ1(Y), K = φ2(Y), and V = φ3(Y). Here, φ1, φ2, and φ3 represent causal convolutions for the three branches. Q = {,…, }, K = {,…, }, and V = {,…, }, where , , and are of size , with 1 ≤ ≤ . Within each subspace , the attention head is computed as follows:
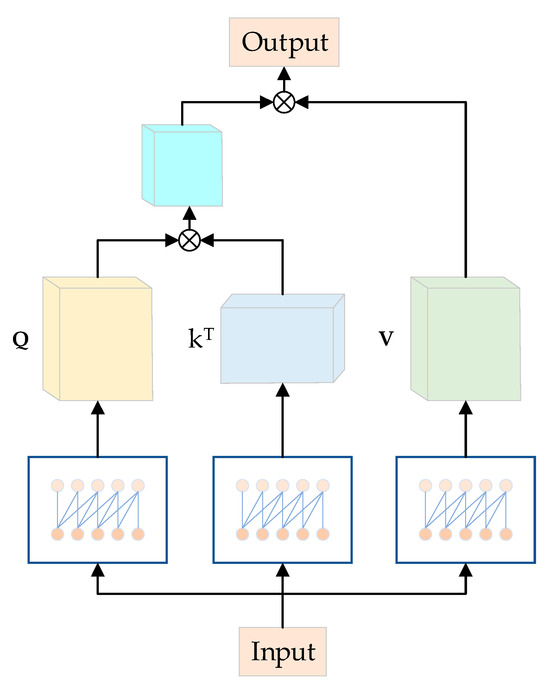
Figure 7.
Causal convolutional MHA structure diagram.
In the given equation, represents the process of multiplication, “” indicates the feature dimension of the query matrix “Q”, and serves as a normalization factor to prevent the dot product values from becoming overly large. Subsequently, all “H” representations, which correspond to the different attention heads, are concatenated to generate the Multihead Attention (MHA) output as described below:
Then, we obtain the output of the module:
Next, the output of the causal Multihead Attention module is processed through an “add and normalize” operation before being reaching the FC layer. This step aims to accelerate the convergence of data and enhance training stability in the process of educating neural networks with deep architectures. Following this, the processed results are then forwarded to the FC layer. The ReLU activation function is employed to introduce non-linearity into the model and capture interactions among potential dimensions. Residual connections are utilized between different layers [47] to address gradient propagation issues. This design facilitates the easier propagation of gradients through residual connections, thereby alleviating the vanishing gradient problem and aiding the training of deeper networks. The formula for residual connections is as follows:
In this phase, we are able to effectively extract temporal features from ECG signals while simultaneously reducing the number of model parameters during training. This approach also alleviates the challenges of gradients vanishing and exploding, contributing to an accelerated training process.
3. Experimental Setup and Results
3.1. Experimental Setup and Evaluation Criteria
The experimental setup utilized a 64-bit Windows 10 system with an NVIDIA 3060 graphics card and an AMD Ryzen 5 5600X CPU. The algorithms presented in this paper were implemented using the Keras 2.6 and TensorFlow 2.6 frameworks within the Python 3.7 environment. Our code is released at https://github.com/hdeke/MSCANet (accessed on 10 December 2023).
ECG signal data often exhibit imbalanced class distributions, where the sample quantities of certain types of cardiac arrhythmias are significantly smaller than others. This imbalance can lead the model to favor predicting the majority classes, thereby neglecting the minority classes and impacting classification performance. Focal Loss is a loss function specifically designed for addressing imbalanced data scenarios [48]. Its fundamental concept involves reducing the weight of the majority class while simultaneously increasing the weight of challenging-to-classify instances. When applying focal loss to a multiclass problem, it is necessary to compute the focal loss separately for each class and then aggregate them with appropriate weights. To determine the focal loss weights for each class, consideration can be given to the importance or imbalance of that particular class. For samples with lower accuracy rates, we retain a significant portion of their cross-entropy loss. Conversely, for samples with higher prediction accuracy, we reduce their cross-entropy loss. This approach directs the learning focus of the model towards difficult-to-classify samples, which is particularly crucial for ECG signal data due to the limited number of samples in certain arrhythmia categories. Introducing Focal Loss allows the model to focus more on those cardiac arrhythmia samples that are harder to classify during training, thereby enhancing the classification performance for the minority classes. This strategy helps improve the model’s performance on imbalanced datasets, mitigating the issue of bias towards majority classes during prediction and ultimately enhancing the accuracy of classifying imbalanced ECG signal data.
For all the conducted experiments, we will employ a comprehensive set of evaluation metrics, including overall accuracy (OA), specificity (Spe), sensitivity (Sen), precision (Pre), and macro-F1 score (Macro-F1). The specific methodologies for computing these metrics are detailed as follows, drawing from references:
In the equations, true positives (TPs) represent the count of positive samples that are correctly predicted as positive, while true negatives (TNs) indicate the count of negative samples that are correctly predicted as negative. False negatives (FNs) refer to the count of positive samples that are inaccurately predicted as negative, and false positives (FPs) denote the count of negative samples that are erroneously predicted as positive. Accuracy is determined by dividing the count of correctly classified samples by the total number of samples. Specificity quantifies the proportion of true negatives in relation to the sum of true negatives and false positives. Sensitivity calculates the proportion of true positives in relation to the sum of true positives and false negatives. Precision assesses the proportion of true positives to the total of true positives and false positives.
The F1 score is calculated using a harmonic mean formula involving precision and sensitivity. Overall accuracy gauges the correct classification ratio across the entire sample set. Specificity gauges the model’s ability to accurately identify actual negatives, representing the proportion of correctly excluded negative samples by the model. Sensitivity evaluates the model’s capacity to accurately identify actual positives, representing the proportion of successfully captured positive samples by the model. Precision reflects the model’s precision in identifying true positives against all classified positives. Lastly, the macro-F1 score offers an average F1 value, presenting an integrated assessment of the model’s performance across various categories. This array of metrics, accompanied by their corresponding calculation methodologies, furnishes a robust quantitative framework for evaluating the model’s effectiveness and its performance nuances across different class categories.
3.2. Results
The achievement of optimal accuracy in automated electrocardiogram (ECG) classification is significantly influenced by the choice of learning rate and batch size. After conducting several rounds of experimentation, it was determined that a learning rate of 0.001, a batch size of 64, and an epoch count of 100 yielded the best results. During the experimental process, the average training time per epoch was 25 s, and prediction took 2 s. The model has a parameter count of 34 k, with the main contributions being 4.1 k from convolution and 28.8 k from the attention mechanism. These parameters were selected in combination with the Adam optimizer. The learning rate plays a pivotal role in controlling the step size during gradient descent, influencing how quickly the model converges. On the other hand, the batch size affects the trade-off between computational efficiency and model generalization. In this context, the chosen values of learning rate and batch size were arrived at through systematic tuning, achieving a harmonious trade-off between the speed of convergence and the stability of the model.
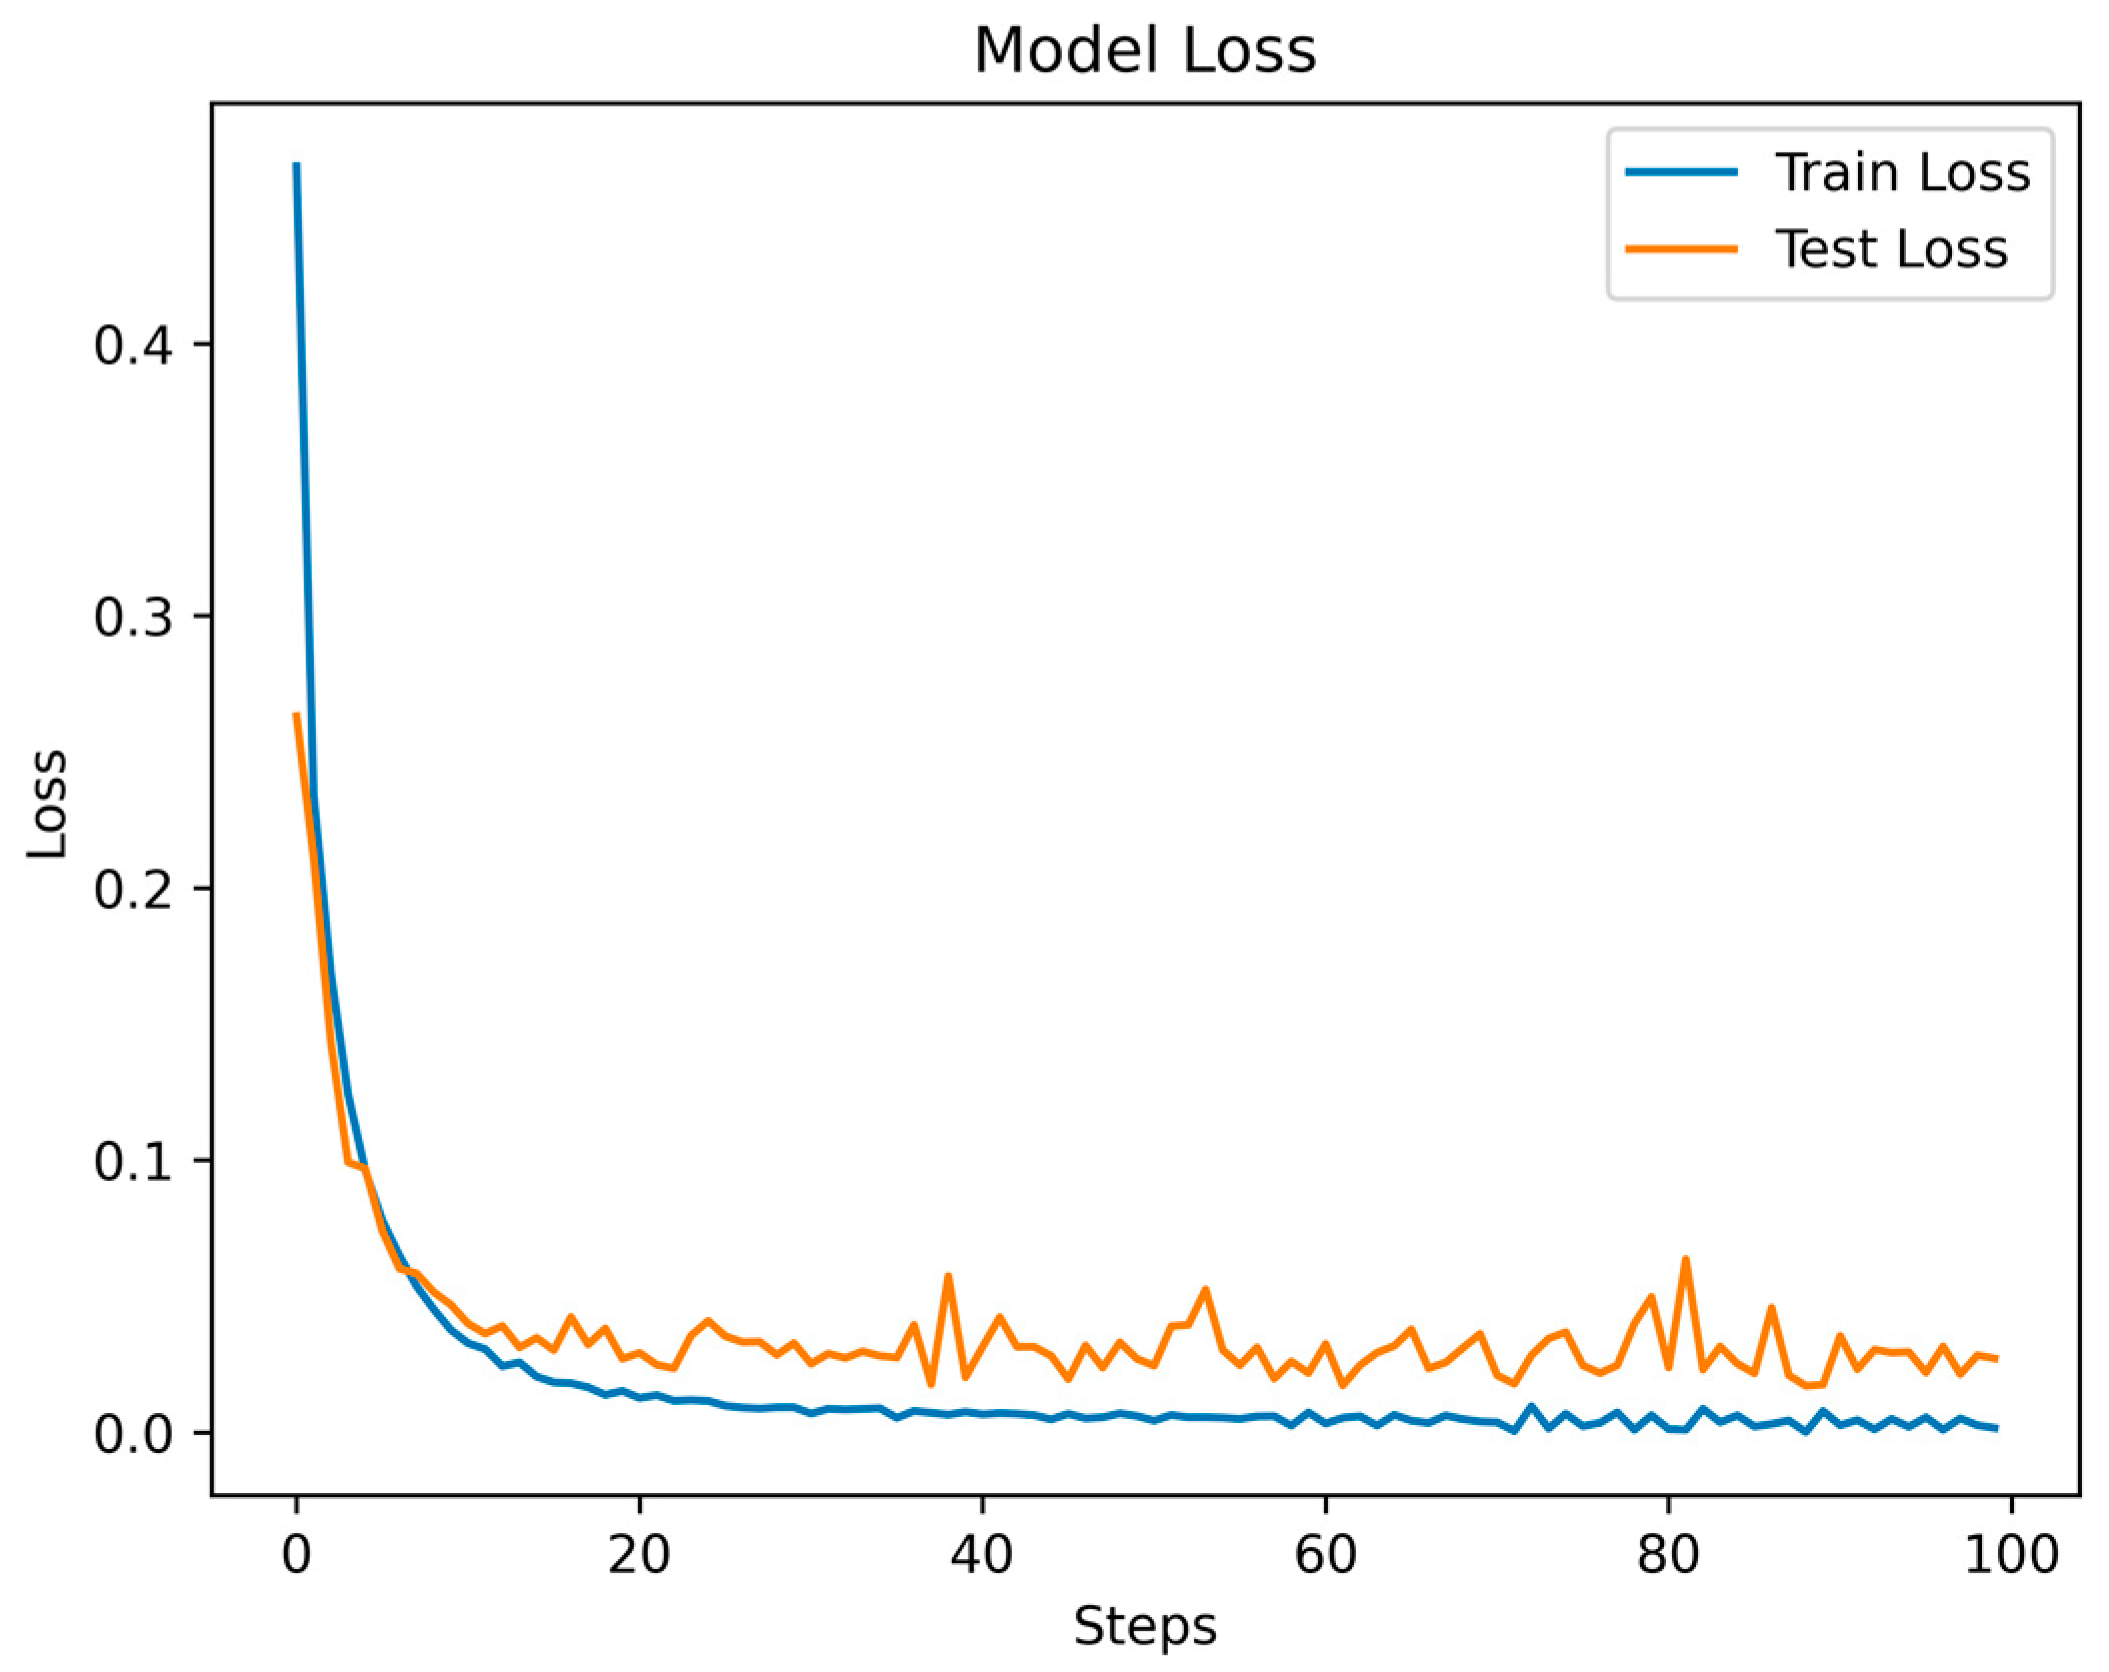
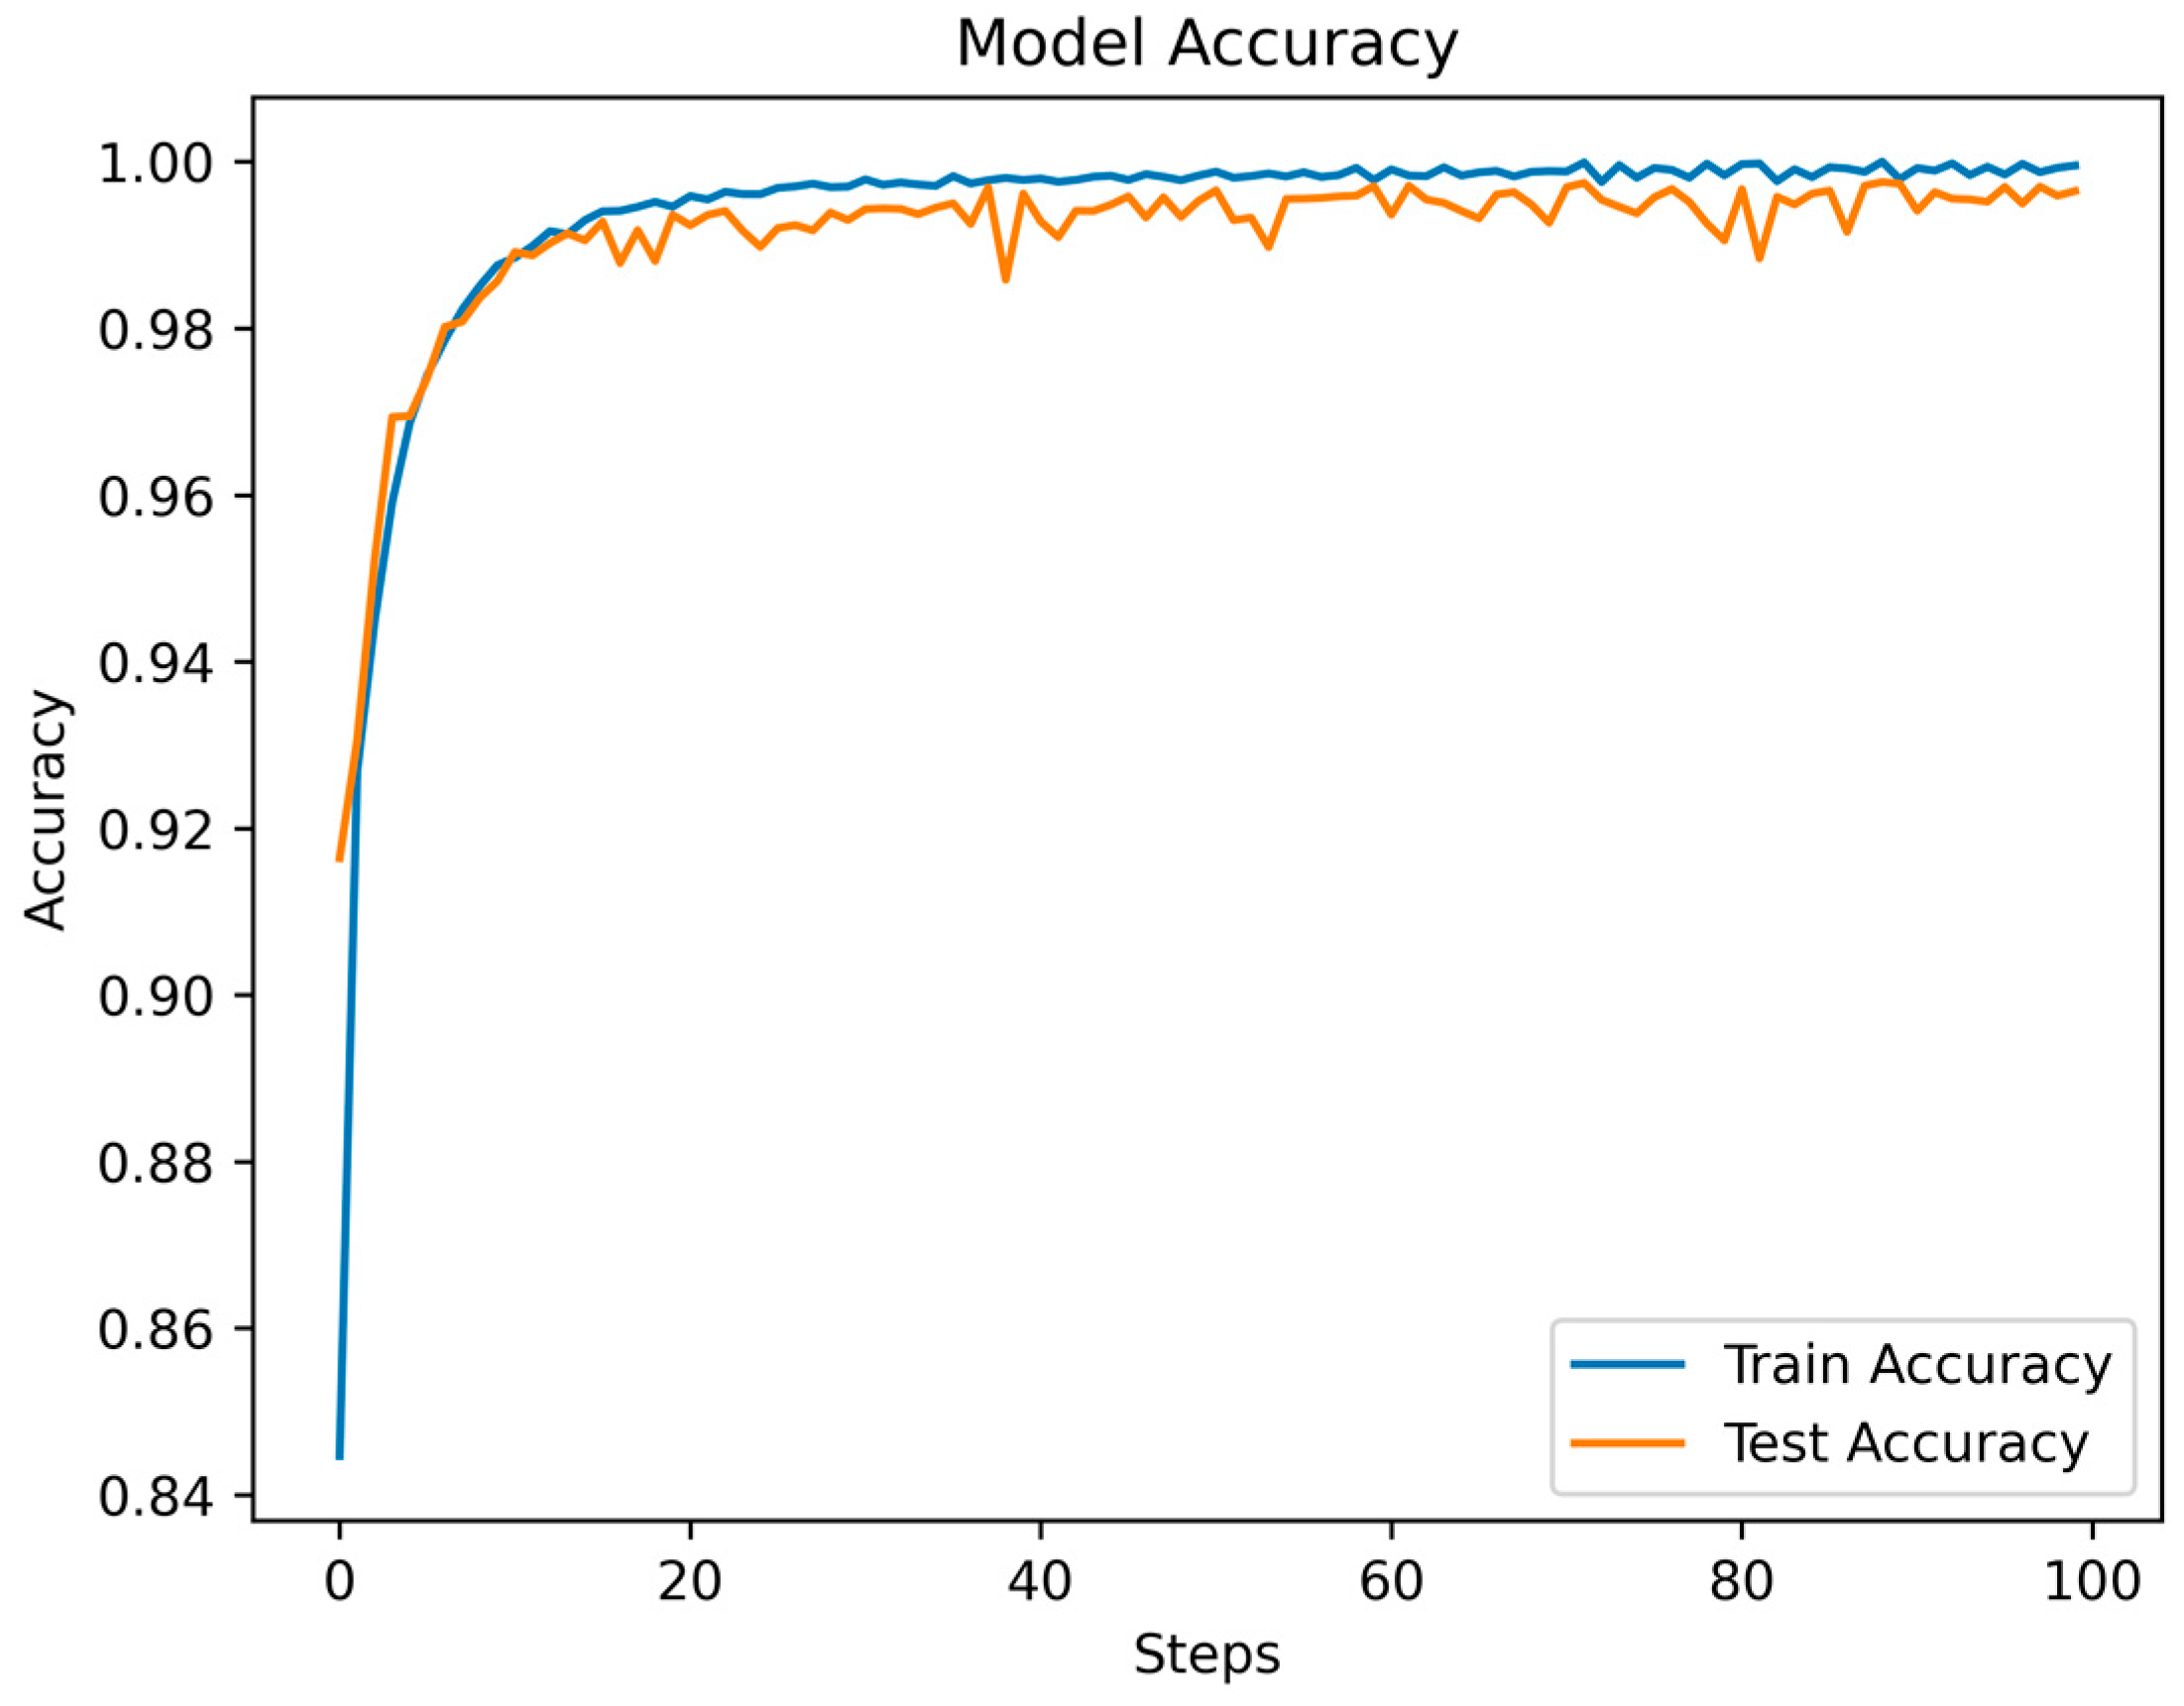
Throughout the training and testing phases of the MSCANet model, we closely monitored the variations in the loss function and accuracy curves to assess the model’s performance and convergence. The curves depicting the changes in training and testing losses reflect the model’s behavior during both the training and testing phases. Specific data are illustrated in Figure 8. As training progressed, we observed a gradual reduction in the training loss, indicating that the model is gradually learning the features and patterns of the training data. Conversely, after a certain point, the testing loss stabilizes, showcasing the model’s effectiveness on unseen data. This is apparent in the initial fluctuations in the loss curves, which tend to converge and stabilize after the 16th epoch. Simultaneously, the accuracy curve illustrates how the model’s accuracy changes across different stages. During the early stages of training, due to the model’s process of learning data features, accuracy might be relatively low. However, with continued training, accuracy gradually improves, indicating an enhanced understanding of the data and improved classification ability by the model. The accuracy during the testing phase is also a pivotal metric, as it reflects the model’s performance in real-world scenarios. As depicted in Figure 9, the accuracy experiences some fluctuations in the initial epochs but later stabilizes. A small gap between the training and testing accuracies implies that the learned features are effectively generalizing to new data, highlighting the model’s strong generalization capability. Ultimately, we achieved an overall accuracy of 99.35%, showcasing the significant role of MSCANet in classifying cardiac arrhythmias from ECG signals. By analyzing the loss and accuracy curves, we could ascertain whether the model converges properly, identify potential overfitting or underfitting issues, and determine the point during training where the model achieves its best performance. Such insights are crucial for optimizing the model and driving further improvements, aiding us in better understanding and utilizing the characteristics of the MSCANet model.
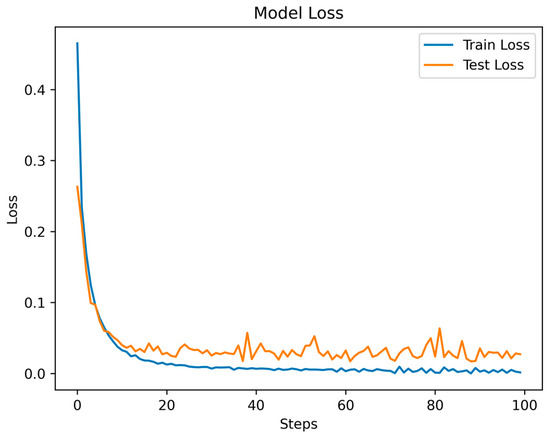
Figure 8.
The Loss function of MSCANet model on MIH-BIH dataset.
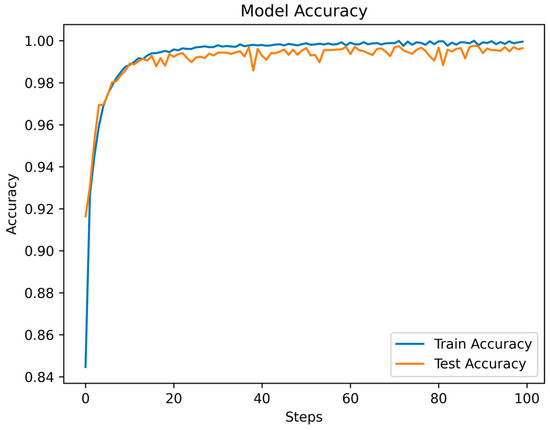
Figure 9.
The accuracy of MSCANet models on the MIH-BIH dataset.
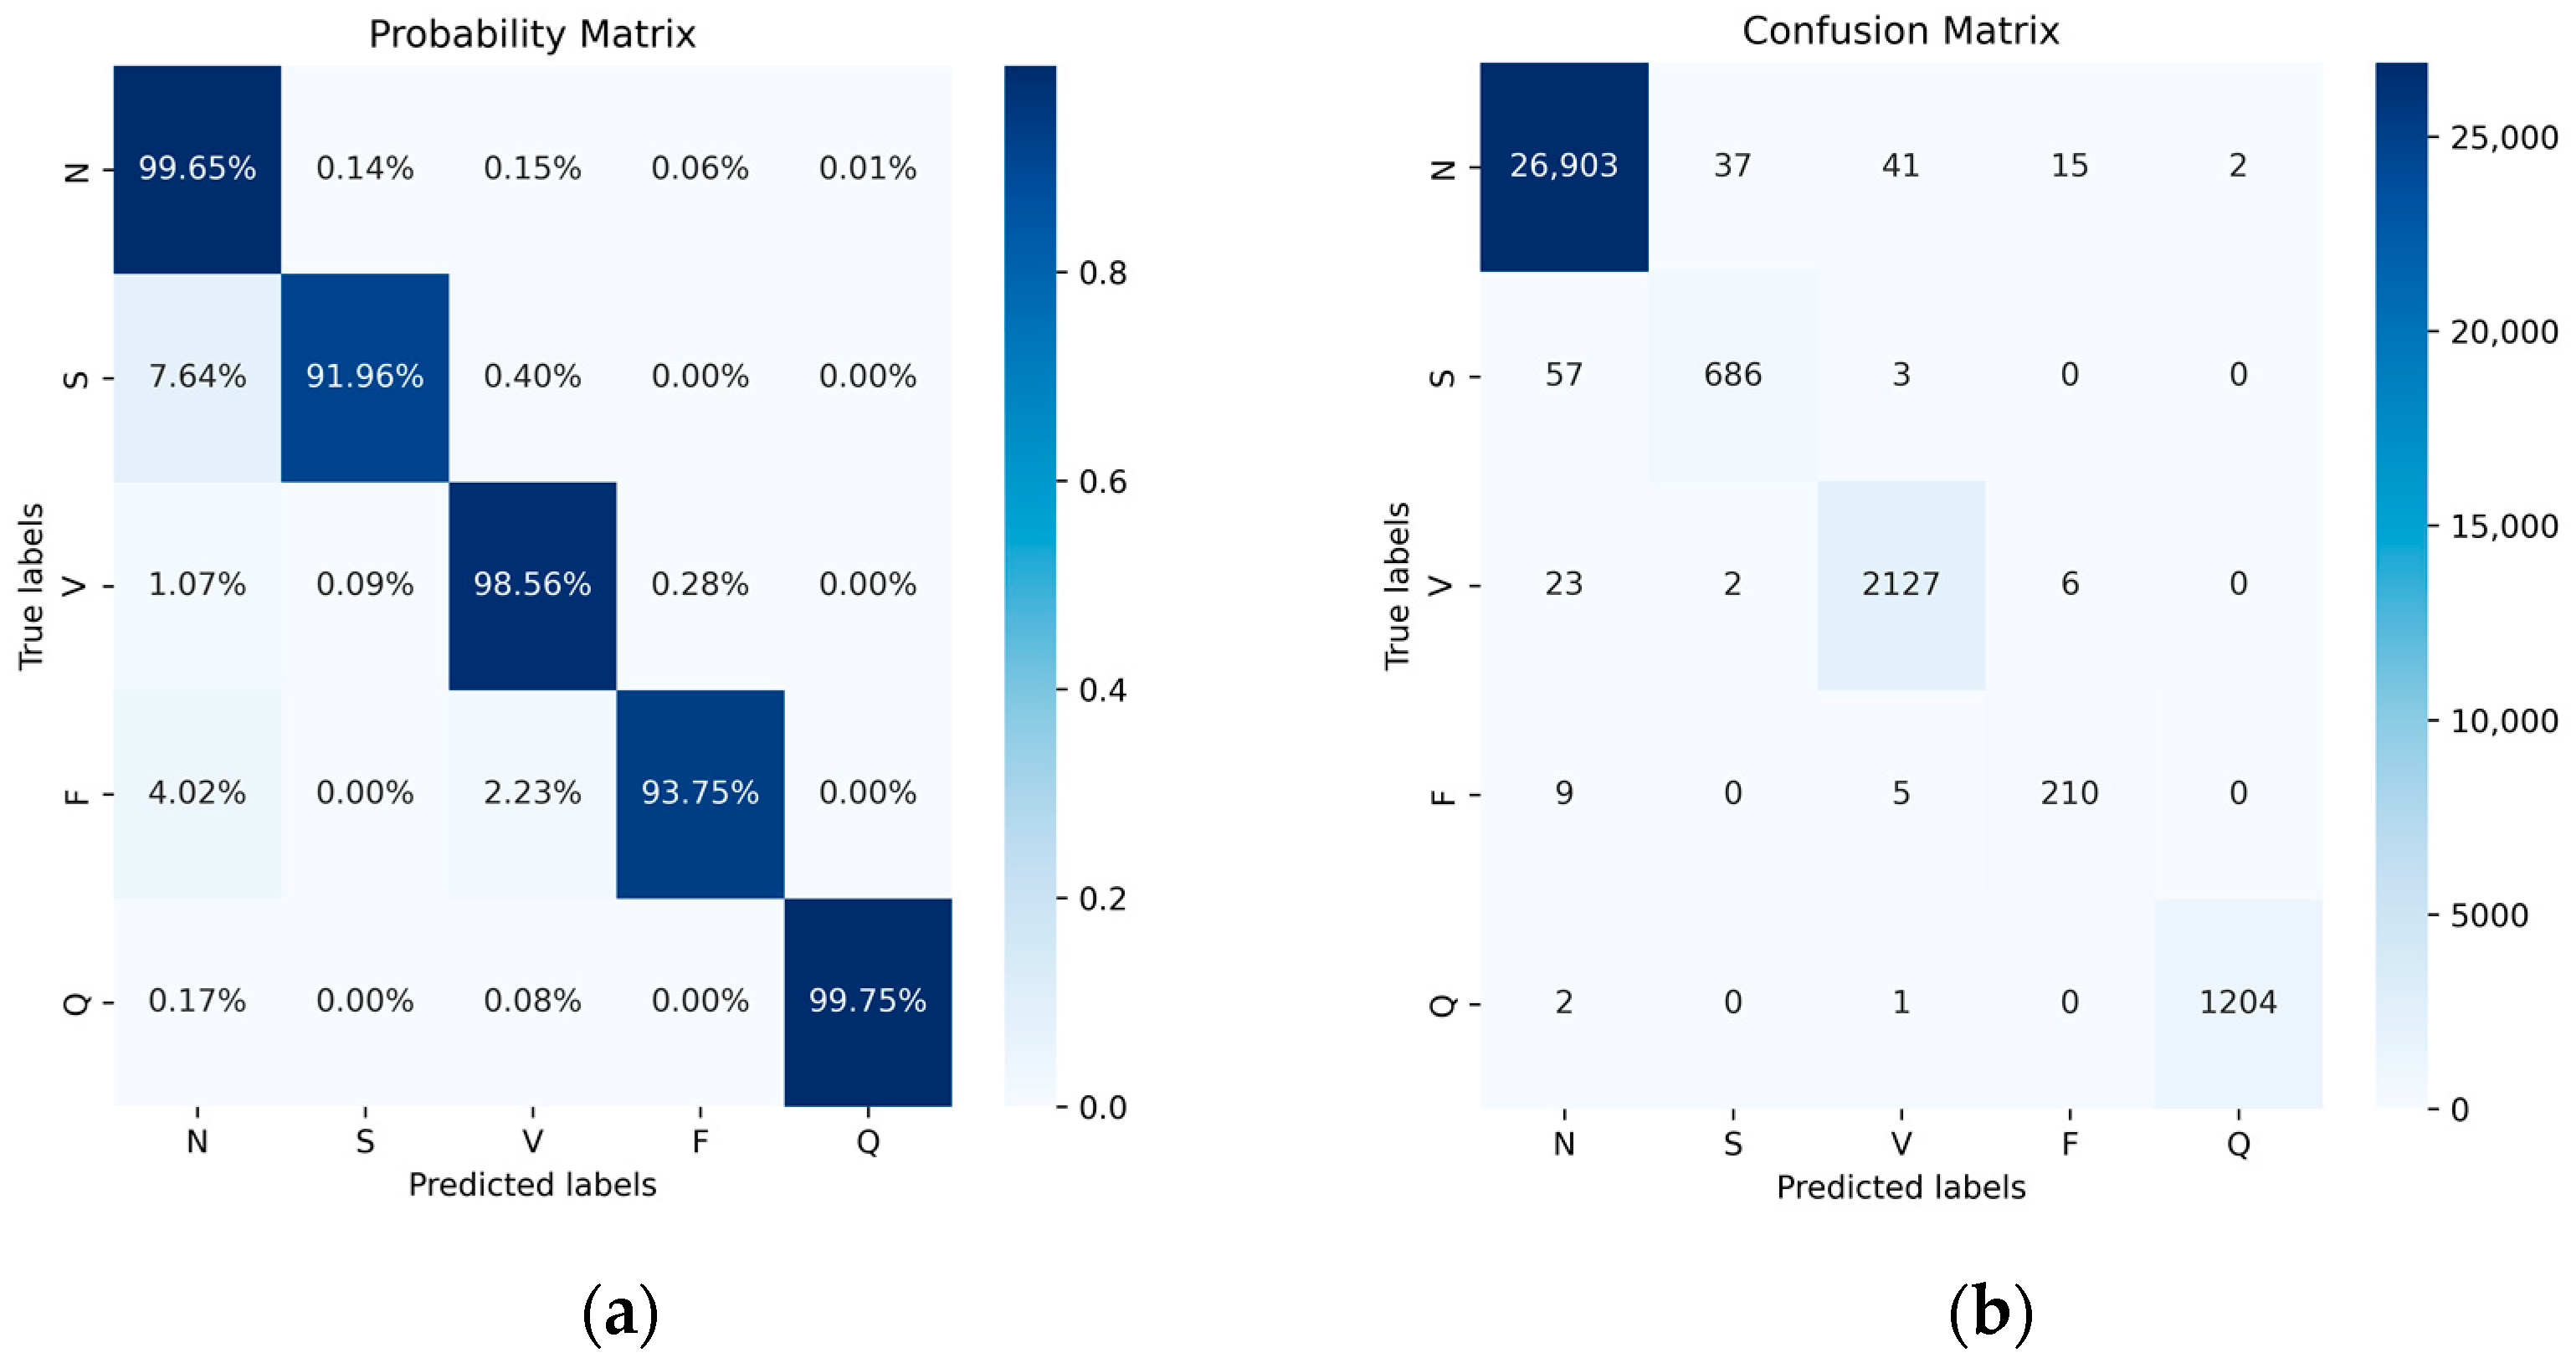
Figure 10 illustrates the performance of the five categories with and without normalization using a confusion matrix. The elements on the diagonal represent the successfully classified categories, while the off-diagonal elements indicate misclassifications. In the normalized confusion matrix, the average of the diagonal values provides the system’s average accuracy. Ultimately, we achieved accuracies of 99.65% for class N, 91.96% for class S, 98.56% for class V, 93.75% for class F, and 99.75% for class Q. Additionally, we observed cases where one class was incorrectly recognized as another. As class N constitutes the majority, it demonstrates the highest recognition accuracy, and misclassified samples from other classes are inclined to be assigned to the N class.

Figure 10.
Probability matrix (a) and confusion matrix (b) of MIT-BIH Dataset after data balance.
We compared the accuracy and other metrics (such as specificity, sensitivity, precision, F1 score, and overall accuracy of each class classification) before and after data balancing. Figure 11 illustrates the normalized confusion matrix before and after data augmentation. Overall, there was an improvement in accuracy, particularly for the classes with fewer samples, namely, the S-class and F-class. Their accuracy increased from 84.05% and 80.36% to 91.96% and 93.75%, respectively. Although the number of samples in the most abundant class, the N-class, decreased after data balancing, its accuracy remained largely unchanged. Similarly, there were improvements in other classes such as the V-class and Q-class, though not as pronounced as in the S-class and F-class. This outcome underscores the significance of data balancing in enhancing classification results for minority classes. Additionally, despite the reduction in the number of N-class samples, its accuracy remained steady, further affirming the effectiveness of data balancing.
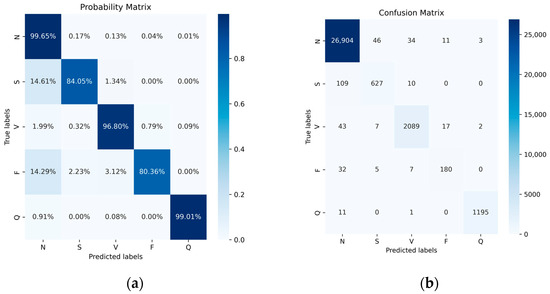
Figure 11.
The MIT-BIH dataset does not use data-balanced probability (a) and confusion (b) matrices.
When considering specific metrics such as specificity, sensitivity, precision, F1 score, and overall accuracy for each class (as shown in Table 3 and Table 4), we conducted a comprehensive analysis and compared the performance before and after data augmentation to reveal changes and improvements in model performance. We observed improvements in the specificity for all classes after data augmentation. This indicates an increased accuracy of the model in recognizing negative class samples, leading to an enhancement in overall performance. Sensitivity is an indicator of the model’s accurate identification of positive class samples. After data augmentation, especially for classes with fewer samples (such as the S class and N class), sensitivity notably improved. This suggests that data augmentation positively contributes to enhancing the model’s recognition ability for minority classes. Following data augmentation, precision increased, indicating a reduction in erroneous positive predictions and an improved accuracy of positive predictions. The F1 score combines precision and sensitivity. After data augmentation, the F1 scores for various classes exhibited an upward trend, further substantiating the enhancement of the overall proficiency of the algorithm. In the analysis of the overall accuracy for each class, data augmentation effectively addressed the issue of class imbalance, resulting in increased accuracy for all classes, particularly for classes with fewer samples. Although the class with the most samples (the N class) experienced a reduction in sample count after data balancing, its accuracy remained largely unchanged, further validating the effectiveness of data augmentation. In conclusion, the data augmentation strategy significantly improved the model’s performance across various metrics. This improvement was particularly pronounced for classes with fewer samples. The enhancements in specificity, sensitivity, precision, F1 score, and overall accuracy collectively highlight the efficacy of data augmentation in optimizing classification outcomes.
Table 3.
MSCANet classification performance metrics on raw data.
Table 4.
MSCANet classification performance metrics on data augmentation datasets.
To validate the effectiveness of the multiscale convolutional module and causal convolutional attention module, we conducted a series of ablation experiments, and the results are presented in Table 5. These experiments were designed to systematically analyze the impact and contributions of each module to the overall performance of the model. The experimental data indicate that, compared to traditional CNNs, MSCNN demonstrates an overall accuracy improvement of approximately 1%. Due to the multiscale convolution enhancing the model’s perceptual ability for features at different scales in the input data, MSCNN exhibits superior performance in utilizing spatial information such as T-waves’ amplitude and ST-wave’s slope in electrocardiograms. Furthermore, when MSCNN is combined with the causal convolution attention module, the model demonstrates superior performance in accuracy and other metrics. This enhancement is attributed to the causal convolution attention module, enabling the model to focus on temporal features like the duration and interval times of segments within the electrocardiogram signals. With the incorporation of causal convolution, the causal convolution attention module is more effective in capturing temporal relationships and features within the input sequences compared to traditional attention modules. By comprehensively considering temporal and spatial information in electrocardiograms, our proposed model achieves favorable results in the task of classifying cardiac arrhythmias. These findings highlight the effectiveness of our model in capturing and leveraging both temporal and spatial features of electrocardiographic signals, leading to improved performance in arrhythmia classification tasks.
Table 5.
The performance metrics of different models on data augmentation datasets.
4. Discussion
In previous studies, researchers have extensively explored the MIT-BIH Arrhythmia Database (MIT-BIH AD) to develop enhanced machine learning and artificial neural network approaches for arrhythmia classification. In recent years, various deep learning techniques have been employed for arrhythmia categorization, such as CNN+LSTM [49] and UNET [50], among others. Table 6 presents a performance comparison of various ECG classification algorithms published in the literature, including overall accuracy (OA), specificity (Spe), sensitivity (Sen), and Macro F1. All of these studies utilized the MIT-BIH AD, and the methods proposed in this section outperform many others regarding OA and Spe. In terms of parameter quantity, our proposed model falls within a moderate scale compared to similar studies. Successfully achieving a strong classification performance without excessively increasing the parameter count highlights the efficiency of our model. From the results of the MSCA model, the following conclusions can be drawn: The proposed MSCA model excels at extracting features from ECG signals and effectively utilizing them for arrhythmia classification according to the AAMI criteria. This improvement can be attributed to the multiscale convolutional module and causal convolutional attention module that are employed in MSCANet. Compared to previous models, these two components better capture signal features. Moreover, the data balancing technique used in the study plays a significant role in enhancing arrhythmia classification during the process.
Table 6.
Comparison results with existing models.
5. Conclusions
In this study, we introduced a novel approach named MSCANet for ECG signal classification. This method effectively automates the extraction of both temporal and spatial features from ECG signals, simultaneously reducing computational complexity. Utilizing the ANSI-AAMI criteria, the proposed model categorizes ECG signals into five distinct groups. Leveraging the MIT-BIH ECG database, we developed and evaluated a deep learning classification model for training and testing. Moreover, we addressed the issue of data imbalance using a hybrid sampling technique, which significantly improved the accuracy of arrhythmia classification. The achieved results demonstrated a remarkable balanced accuracy of 99.35%, outperforming other models across various metrics. The proposed method is employed for the classification of individual heartbeats, with the final analysis of ECGs remaining the task of healthcare professionals. Looking ahead, we aim to explore different datasets and further optimize the model’s complexity while maintaining its accuracy, with the ultimate goal of enhancing its applicability in the clinical diagnosis and treatment of cardiovascular diseases.
Author Contributions
Conceptualization, C.G.; methodology, C.G.; software, C.G.; validation, C.G. and J.H.; formal analysis, C.G.; investigation, C.G. and J.H.; resources, C.G.; data curation, C.G.; writing—original draft preparation, C.G.; writing—review and editing, C.G. and J.H.; visualization, C.G.; supervision, B.Y.; project administration, B.Y.; funding acquisition, B.Y. All authors have read and agreed to the published version of the manuscript.
Funding
This research was funded by the National natural science foundation of China under Grant 61972367.
Data Availability Statement
Data are contained within the article.
Conflicts of Interest
The authors declare no conflicts of interest.
References
- Mc Namara, K.; Alzubaidi, H.; Jackson, J.K. Cardiovascular disease as a leading cause of death: How are pharmacists getting involved? Integr. Pharm. Res. Pract. 2019, 8, 1–11. [Google Scholar] [CrossRef] [PubMed]
- Feng, K.; Pi, X.; Liu, H.; Sun, K. Myocardial Infarction Classification Based on Convolutional Neural Network and Recurrent Neural Network. Appl. Sci. 2019, 9, 1879. [Google Scholar] [CrossRef]
- Timmis, A.; Townsend, N.; Gale, C.; Grobbee, R.; Maniadakis, N.; Flather, M.; Wilkins, E.; Wright, L.; Vos, R.; Bax, J.; et al. European Society of Cardiology: Cardiovascular Disease Statistics 2017. Eur. Heart J. 2018, 39, 508–579. [Google Scholar] [CrossRef] [PubMed]
- Yao, B. Spatiotemporal modeling and optimization for personalized cardiac simulation. IISE Trans. Healthc. Syst. Eng. 2021, 11, 145–160. [Google Scholar] [CrossRef]
- Yao, B.; Yang, H. Physics-driven Spatiotemporal Regularization for High-dimensional Predictive Modeling: A Novel Approach to Solve the Inverse ECG Problem. Sci. Rep. 2016, 6, 39012. [Google Scholar] [CrossRef] [PubMed]
- Sayadi, O.; Shamsollahi, M.B. ECG Denoising and Compression Using a Modified Extended Kalman Filter Structure. IEEE Trans. Biomed. Eng. 2008, 55, 2240–2248. [Google Scholar] [CrossRef] [PubMed]
- Hurst, J.W. Naming of the Waves in the ECG, with a Brief Account of Their Genesis. Circulation 1998, 98, 1937–1942. [Google Scholar] [CrossRef] [PubMed]
- Garabelli, P.; Stavrakis, S.; Albert, M.; Koomson, E.; Parwani, P.; Chohan, J.; Smith, L.; Albert, D.; Xie, R.; Xie, Q.; et al. Comparison of QT Interval Readings in Normal Sinus Rhythm between a Smartphone Heart Monitor and a 12-Lead ECG for Healthy Volunteers and Inpatients Receiving Sotalol or Dofetilide. J. Cardiovasc. Electrophysiol. 2016, 27, 827–832. [Google Scholar] [CrossRef]
- Borleffs, C.J.W.; Scherptong, R.W.C.; Man, S.-C.; van Welsenes, G.H.; Bax, J.J.; van Erven, L.; Swenne, C.A.; Schalij, M.J. Predicting Ventricular Arrhythmias in Patients with Ischemic Heart Disease. Circ. Arrhythmia Electrophysiol. 2009, 2, 548–554. [Google Scholar] [CrossRef]
- Wang, J.; Qiao, X.; Liu, C.; Wang, X.; Liu, Y.; Yao, L.; Zhang, H. Automated ECG classification using a non-local convolutional block attention module. Comput. Methods Programs Biomed. 2021, 203, 106006. [Google Scholar] [CrossRef]
- Movassaghi, S.; Abolhasan, M.; Lipman, J.; Smith, D.; Jamalipour, A. Wireless Body Area Networks: A Survey. IEEE Commun. Surv. Tutor. 2014, 16, 1658–1686. [Google Scholar] [CrossRef]
- Rajesh, K.N.V.P.S.; Dhuli, R. Classification of imbalanced ECG beats using re-sampling techniques and AdaBoost ensemble classifier. Biomed. Signal Process. Control 2018, 41, 242–254. [Google Scholar] [CrossRef]
- Niu, J.; Tang, Y.; Sun, Z.; Zhang, W. Inter-Patient ECG Classification with Symbolic Representations and Multi-Perspective Convolutional Neural Networks. IEEE J. Biomed. Health Inform. 2020, 24, 1321–1332. [Google Scholar] [CrossRef] [PubMed]
- Sharma, A.; Patidar, S.; Upadhyay, A.; Rajendra Acharya, U. Accurate tunable-Q wavelet transform based method for QRS complex detection. Comput. Electr. Eng. 2019, 75, 101–111. [Google Scholar] [CrossRef]
- Reddy, G.T.; Reddy, M.P.K.; Lakshmanna, K.; Rajput, D.S.; Kaluri, R.; Srivastava, G. Hybrid genetic algorithm and a fuzzy logic classifier for heart disease diagnosis. Evol. Intell. 2019, 13, 185–196. [Google Scholar] [CrossRef]
- Gadekallu, T.R.; Khare, N.; Bhattacharya, S.; Singh, S.; Maddikunta, P.K.R.; Ra, I.-H.; Alazab, M. Early Detection of Diabetic Retinopathy Using PCA-Firefly Based Deep Learning Model. Electronics 2020, 9, 274. [Google Scholar] [CrossRef]
- Basheer, S.; Bhatia, S.; Sakri, S.B. Computational Modeling of Dementia Prediction Using Deep Neural Network: Analysis on OASIS Dataset. IEEE Access 2021, 9, 42449–42462. [Google Scholar] [CrossRef]
- Dev, K.; Khowaja, S.A.; Bist, A.S.; Saini, V.; Bhatia, S. Triage of potential COVID-19 patients from chest X-ray images using hierarchical convolutional networks. Neural Comput. Appl. 2021, 35, 23861–23876. [Google Scholar] [CrossRef]
- Guo, J.; Li, C.; Zhang, G.; Sun, Y.; Bie, R. Blockchain-enabled digital rights management for multimedia resources of online education. Multimed. Tools Appl. 2019, 79, 9735–9755. [Google Scholar] [CrossRef]
- Pandey, S.K.; Janghel, R.R. Recent Deep Learning Techniques, Challenges and Its Applications for Medical Healthcare System: A Review. Neural Process. Lett. 2019, 50, 1907–1935. [Google Scholar] [CrossRef]
- Zidelmal, Z.; Amirou, A.; Adnane, M.; Belouchrani, A. QRS detection based on wavelet coefficients. Comput. Methods Programs Biomed. 2012, 107, 490–496. [Google Scholar] [CrossRef] [PubMed]
- Asl, B.M.; Setarehdan, S.K.; Mohebbi, M. Support vector machine-based arrhythmia classification using reduced features of heart rate variability signal. Artif. Intell. Med. 2008, 44, 51–64. [Google Scholar] [CrossRef] [PubMed]
- Kamiya, N. Deep Learning Technique for Musculoskeletal Analysis. In Deep Learning in Medical Image Analysis: Challenges and Applications; Lee, G., Fujita, H., Eds.; Advances in Experimental Medicine and Biology; Springer: Cham, Switzerland, 2020; Volume 1213, pp. 165–176. [Google Scholar]
- Xia, Y.; Xie, Y. A Novel Wearable Electrocardiogram Classification System Using Convolutional Neural Networks and Active Learning. IEEE Access 2019, 7, 7989–8001. [Google Scholar] [CrossRef]
- Hannun, A.Y.; Rajpurkar, P.; Haghpanahi, M.; Tison, G.H.; Bourn, C.; Turakhia, M.P.; Ng, A.Y. Cardiologist-level arrhythmia detection and classification in ambulatory electrocardiograms using a deep neural network. Nat. Med. 2019, 25, 65–69. [Google Scholar] [CrossRef] [PubMed]
- Xiang, Y.; Luo, J.; Zhu, T.; Wang, S.; Xiang, X.; Meng, J. ECG-Based Heartbeat Classification Using Two-Level Convolutional Neural Network and RR Interval Difference. IEICE Trans. Inf. Syst. 2018, 101, 1189–1198. [Google Scholar] [CrossRef]
- Mathews, S.M.; Kambhamettu, C.; Barner, K.E. A novel application of deep learning for single-lead ECG classification. Comput. Biol. Med. 2018, 99, 53–62. [Google Scholar] [CrossRef] [PubMed]
- Saadatnejad, S.; Oveisi, M.; Hashemi, M. LSTM-Based ECG Classification for Continuous Monitoring on Personal Wearable Devices. IEEE J. Biomed. Health Inform. 2020, 24, 515–523. [Google Scholar] [CrossRef]
- Kiranyaz, S.; Ince, T.; Gabbouj, M. Real-Time Patient-Specific ECG Classification by 1-D Convolutional Neural Networks. IEEE Trans. Biomed. Eng. 2016, 63, 664–675. [Google Scholar] [CrossRef]
- Tan, J.H.; Hagiwara, Y.; Pang, W.; Lim, I.; Oh, S.L.; Adam, M.; Tan, R.S.; Chen, M.; Acharya, U.R. Application of stacked convolutional and long short-term memory network for accurate identification of CAD ECG signals. Comput. Biol. Med. 2018, 94, 19–26. [Google Scholar] [CrossRef]
- He, R.; Liu, Y.; Wang, K.; Zhao, N.; Yuan, Y.; Li, Q.; Zhang, H. Automatic Cardiac Arrhythmia Classification Using Combination of Deep Residual Network and Bidirectional LSTM. IEEE Access 2019, 7, 102119–102135. [Google Scholar] [CrossRef]
- Rajpurkar, P.; Hannun, A.Y.; Haghpanahi, M.; Bourn, C.; Ng, A.Y. Cardiologist-Level Arrhythmia Detection with Convolutional Neural Networks. arXiv 2017, arXiv:1707.018369. [Google Scholar]
- Cui, J.; Wang, L.; He, X.; De Albuquerque, V.H.C.; AlQahtani, S.A.; Hassan, M.M. Deep learning-based multidimensional feature fusion for classification of ECG arrhythmia. Neural Comput. Appl. 2021, 35, 16073–16087. [Google Scholar] [CrossRef]
- Wang, J.; Liu, X.; Wang, F.; Zheng, L.; Gao, F.; Zhang, H.; Zhang, X.; Xie, W.; Wang, B. Automated interpretation of congenital heart disease from multi-view echocardiograms. Med. Image Anal. 2021, 69, 101942. [Google Scholar] [CrossRef] [PubMed]
- Goldberger, A.L.; Amaral, L.A.N.; Glass, L.; Hausdorff, J.M.; Ivanov, P.C.; Mark, R.G.; Mietus, J.E.; Moody, G.B.; Peng, C.-K.; Stanley, H.E. PhysioBank, PhysioToolkit, and PhysioNet. Circulation 2000, 101, e215–e220. [Google Scholar] [CrossRef] [PubMed]
- Luz, E.J.d.S.; Schwartz, W.R.; Cámara-Chávez, G.; Menotti, D. ECG-based heartbeat classification for arrhythmia detection: A survey. Comput. Methods Programs Biomed. 2016, 127, 144–164. [Google Scholar] [CrossRef] [PubMed]
- Zhang, M.; Lu, C.; Liu, C. Improved double-threshold denoising method based on the wavelet transform. Osa Contin. 2019, 2, 2328–2342. [Google Scholar] [CrossRef]
- Leevy, J.L.; Khoshgoftaar, T.M.; Bauder, R.A.; Seliya, N. A survey on addressing high-class imbalance in big data. J. Big Data 2018, 5, 42. [Google Scholar] [CrossRef]
- Galar, M.; Fernandez, A.; Barrenechea, E.; Bustince, H.; Herrera, F. A Review on Ensembles for the Class Imbalance Problem: Bagging-, Boosting-, and Hybrid-Based Approaches. IEEE Trans. Syst. Man Cybern. Part C Appl. Rev. 2012, 42, 463–484. [Google Scholar] [CrossRef]
- Islam, A.; Belhaouari, S.B.; Rehman, A.U.; Bensmail, H. KNNOR: An oversampling technique for imbalanced datasets. Appl. Soft Comput. 2022, 115, 108288. [Google Scholar] [CrossRef]
- Ishaq, A.; Sadiq, S.; Umer, M.; Ullah, S.; Mirjalili, S.; Rupapara, V.; Nappi, M. Improving the Prediction of Heart Failure Patients’ Survival Using SMOTE and Effective Data Mining Techniques. IEEE Access 2021, 9, 39707–39716. [Google Scholar] [CrossRef]
- Szegedy, C.; Liu, W.; Jia, Y.; Sermanet, P.; Reed, S.; Anguelov, D.; Erhan, D.; Vanhoucke, V.; Rabinovich, A. Going Deeper with Convolutions. In Proceedings of the IEEE Conference on Computer Vision and Pattern Recognition (CVPR), Boston, MA, USA, 7–12 June 2015; pp. 1–9. [Google Scholar]
- Szegedy, C.; Vanhoucke, V.; Ioffe, S.; Shlens, J.; Wojna, Z. Rethinking the Inception Architecture for Computer Vision. In Proceedings of the 2016 IEEE Conference on Computer Vision and Pattern Recognition (CVPR), Las Vegas, NV, USA, 27–30 June 2016; pp. 2818–2826. [Google Scholar]
- Trengove, M.; Vandersluis, R.; Goetz, L. Response to “Attention is not all you need: The complicated case of ethically using large language models in healthcare and medicine”. EBioMedicine 2023, 93, 104671. [Google Scholar] [CrossRef] [PubMed]
- Kim, S.; Lee, S.-G.; Song, J.; Kim, J.; Yoon, S. FloWaveNet: A Generative Flow for Raw Audio. In Proceedings of the 36th International Conference on Machine Learning (ICML), Long Beach, CA, USA, 9–15 June 2019. [Google Scholar]
- Mariani, S.; Rendu, Q.; Urbani, M.; Sbarufatti, C. Causal dilated convolutional neural networks for automatic inspection of ultrasonic signals in non-destructive evaluation and structural health monitoring. Mech. Syst. Signal Process. 2021, 157, 107748. [Google Scholar] [CrossRef]
- Shafiq, M.; Gu, Z. Deep Residual Learning for Image Recognition: A Survey. Appl. Sci. 2022, 12, 8972. [Google Scholar] [CrossRef]
- Lu, Y.; Jiang, M.; Wei, L.; Zhang, J.; Wang, Z.; Wei, B.; Xia, L. Automated arrhythmia classification using depthwise separable convolutional neural network with focal loss. Biomed. Signal Process. Control 2021, 69, 102843. [Google Scholar] [CrossRef]
- Oh, S.L.; Ng, E.Y.K.; Tan, R.S.; Acharya, U.R. Automated diagnosis of arrhythmia using combination of CNN and LSTM techniques with variable length heart beats. Comput. Biol. Med. 2018, 102, 278–287. [Google Scholar] [CrossRef]
- Shi, H.; Qin, C.; Xiao, D.; Zhao, L.; Liu, C. Automated heartbeat classification based on deep neural network with multiple input layers. Knowl. Based Syst. 2020, 188, 105036. [Google Scholar] [CrossRef]
- Acharya, U.R.; Oh, S.L.; Hagiwara, Y.; Tan, J.H.; Adam, M.; Gertych, A.; Tan, R.S. A deep convolutional neural network model to classify heartbeats. Comput. Biol. Med. 2017, 89, 389–396. [Google Scholar] [CrossRef]
- Kachuee, M.; Fazeli, S.; Sarrafzadeh, M.; Soc, I.C. ECG Heartbeat Classification: A Deep Transferable Representation. In Proceedings of the 6th IEEE International Conference on Healthcare Informatics (ICHI), New York, NY, USA, 4–7 June 2018; pp. 443–444. [Google Scholar]
- Pandey, S.K.; Janghel, R.R. Automatic detection of arrhythmia from imbalanced ECG database using CNN model with SMOTE. Australas. Phys. Eng. Sci. Med. 2019, 42, 1129–1139. [Google Scholar] [CrossRef]
- Yildirim, O.; Baloglu, U.B.; Tan, R.-S.; Ciaccio, E.J.; Acharya, U.R. A new approach for arrhythmia classification using deep coded features and LSTM networks. Comput. Methods Programs Biomed. 2019, 176, 121–133. [Google Scholar] [CrossRef]
- Xu, X.; Jeong, S.; Li, J. Interpretation of Electrocardiogram (ECG) Rhythm by Combined CNN and BiLSTM. IEEE Access 2020, 8, 125380–125388. [Google Scholar] [CrossRef]
- Luo, X.; Yang, L.; Cai, H.; Tang, R.; Chen, Y.; Li, W. Multi-classification of arrhythmias using a HCRNet on imbalanced ECG datasets. Comput. Methods Programs Biomed. 2021, 208, 106258. [Google Scholar] [CrossRef] [PubMed]
- Xiaolin, L.; Xiang, F.; Panicker, R.C.; Cardiff, B.; John, D. Classification of ECG based on Hybrid Features using CNNs for Wearable Applications. In Proceedings of the 2023 IEEE 5th International Conference on Artificial Intelligence Circuits and Systems (AICAS), Hangzhou, China, 11–13 June 2023; IEEE: Piscataway, NJ, USA; pp. 1–4. [Google Scholar]


Disclaimer/Publisher’s Note: The statements, opinions and data contained in all publications are solely those of the individual author(s) and contributor(s) and not of MDPI and/or the editor(s). MDPI and/or the editor(s) disclaim responsibility for any injury to people or property resulting from any ideas, methods, instructions or products referred to in the content. |
© 2024 by the authors. Licensee MDPI, Basel, Switzerland. This article is an open access article distributed under the terms and conditions of the Creative Commons Attribution (CC BY) license (https://creativecommons.org/licenses/by/4.0/).