Abstract
While current video quality assessment research predominantly revolves around resolutions of 4 K and beyond, targeted at ultra high-definition (UHD) displays, effective video quality for mobile video streaming remains primarily within the range of 480 p to 1080 p. In this study, we conducted a comparative analysis of the quality of experience (QoE) for widely implemented video codecs on mobile devices, specifically Advanced Video Coding (AVC), its successor High-Efficiency Video Coding (HEVC), and Google’s VP9. Our choice of 720 p video sequences from a newly developed database, all with identical bitrates, aimed to maintain a manageable subjective assessment duration, capped at 35–40 min. To mimic real-time network conditions, we generated stimuli by streaming original video clips over a controlled emulated setup, subjecting them to eight different packet-loss scenarios. We evaluated the quality and structural similarity of the distorted video clips using objective metrics, including the Video Quality Metric (VQM), Peak Signal-to-Noise Ratio (PSNR), Video Multi-Method Assessment Fusion (VMAF), and Multi-Scale Structural Similarity Index (MS-SSIM). Subsequently, we collected subjective ratings through a custom mobile application developed for Android devices. Our findings revealed that VMAF accurately represented the degradation in video quality compared to other metrics. Moreover, in most cases, HEVC exhibited an advantage over both AVC and VP9 under low packet-loss scenarios. However, it is noteworthy that in our test cases, AVC outperformed HEVC and VP9 in scenarios with high packet loss, based on both subjective and objective assessments. Our observations further indicate that user preferences for the presented content contributed to video quality ratings, emphasizing the importance of additional factors that influence the perceived video quality of end users.
1. Introduction
The affordability of handheld mobile devices with internet availability has resulted in the tremendous growth of multimedia traffic. More brands are turning towards content creators for the promotion of their products, and the quality of content with good end-user experience is the key to success due to severe competition among monetized offerings. The anticipated global monthly data usage is 19 GB in 2023 as per the latest mobile data traffic forecasts [1,2]. There is a shift towards the consumption of multimedia, especially video streaming and gaming, on mobile devices. The global mobile-gaming market has already reached around 185 billion US dollars as of 2022 and is expected to grow three-fold by the end of 2027 [3,4,5]. The ascent of multimedia and gaming on mobile phones is emblematic of a transformative shift in how individuals engage with digital content and entertainment. The convergence of powerful hardware, intuitive user interfaces, and a thriving app ecosystem has turned mobile devices into multifunctional entertainment hubs. This paradigm shift can be attributed to several key factors. Firstly, the increasingly sophisticated mobile hardware, equipped with high-resolution displays, robust processors, and advanced graphics capabilities, has created an ideal platform for delivering visually immersive multimedia and gaming experiences [6,7]. Secondly, the availability of high-speed internet connectivity, particularly the widespread deployment of 4G and the emergence of 5G networks, has ensured seamless streaming and online multiplayer gaming experiences [8,9]. Moreover, app marketplaces, such as Apple’s App Store and Google Play, have fostered an environment where developers can innovate and publish an extensive array of multimedia and gaming applications, meeting diverse user preferences. As a result, mobile phones have become a primary medium for entertainment consumption, reshaping the dynamics of the media and gaming industries [10,11]. Thus, the success of any social media application with video at its core relies on choosing the correct platform, codecs, and optimizations to adapt to end-to-end network quality parameters.
Taking into consideration the aforementioned factors, we conducted an analysis of the performance of the most widely employed video codecs across diverse hardware and software platforms, particularly in the context of video streaming and mobile gaming. Video codecs are fundamental in the compression and transmission of digital video content, and the comparison between the AVC (Advanced Video Coding, H.264), HEVC (High-Efficiency Video Coding, H.265), and VP9 codecs has attracted significant attention. While HEVC and VP9 may indeed offer superior coding efficiency with respect to compression, AVC maintains a dominant market share of nearly 80% in the mobile device sector [12]. This prevalence can be attributed to its lower processing overhead, resulting in reduced computational demands—a vital consideration for mobile devices. This paper presents a comprehensive codec comparison, evaluating both objective and subjective quality of experience (QoE) metrics to gauge user perception. Additionally, we analyzed the impact of human-influencing factors, such as user contentment with the displayed material, on video quality assessments. Beyond the conventional mean opinion score (MOS), we incorporated the Good or Better (GoB) and Poor or Worse (PoW) metrics, which are highly recommended for delivering a more transparent and well-rounded assessment of user ratings [13,14]. Our findings affirm that, regardless of its age, AVC demonstrated a superior performance, at least on mobile devices, owing to its optimization and lower computational demands. Moreover, our results underscore the significance of human-influencing factors and their potential to impact video quality ratings.
The paper is structured as follows: In Section 2, we offer an overview of the background and a concise exploration of relevant technologies. Section 3 provides comprehensive details of the experimental setup, including all of the parameters. Section 4 presents the assessment outcomes, accompanied by essential explanations. Lastly, Section 5 outlines the conclusions drawn from our study.
2. Background
In this section, we focus on the video codec standards, the QoE perspective for quality comparison, and the role of additional impact factors. A summary of previous work relevant to this paper is also discussed.
Significant research has been conducted to evaluate the performance disparities between HEVC, VP9 and AVC across various scenarios encompassing bitrate, quality optimization, and computational overhead. These investigations spanned from QoE assessments on high-definition displays to crowdsourced studies. Several widely-used databases are currently available employing emulated testbeds, although their focus predominantly centers on HTTP adaptive streaming [15,16,17]. Therefore, a noticeable research gap exists regarding the impact of these codecs’ performance specifically on mobile devices, utilizing a database obtained within an emulated network, employing the conventional RTSP/UDP approach for prospective benchmarking purposes.
Song et al. [18] modeled the performance of AVC, HEVC, and VP9, observing that VP9 and HEVC exhibited a superior bitrate performance of 33% to 44%, respectively, across multiple resolutions compared with AVC. However, the database used in their study was solely comprised of encoded videos generated locally, lacking consideration of computational overhead. Casas et al. [19] measured QoE provision on smartphones, employing lab-based assessments and user ratings garnered through crowdsourcing. Their evaluation encompassed platforms like YouTube, WhatsApp, and Facebook accessed via Chrome and Google Maps. Notably, this study did not delve into the analysis of underlying codecs or specialized applications for quality assessment. Some other research studies have focused on codec performance within vehicular networks and live video broadcasting on mobile devices, exploring platforms such as Periscope and Facebook Live. These studies emphasized the performance evaluation of communication protocols like Real-time Messaging Protocol (RTMP) and HTTP Live Streaming (HLS), and were not focused on underlying codec performance [20,21,22].
2.1. Video Codecs
Video coding standards are primarily evaluated based on compression performance alongside the ability to maintain video quality. The implementation of coding standards within an application is extremely important by maintaining the defined syntax of bit-stream and the decoding process, while encoders generate standard-compliant bitstream and thus determine compression performance. This is primarily the reason that old codec with a relatively higher degree of optimizations within an application, over the years, may outperform the new codec with better theoretical compression efficiency.
2.1.1. AVC and HEVC
H.264/MPEG-4-AVC [23] was launched back in 2004 and is still a widely used video coding standard over diverse platforms. According to Bitmovin’s Video Developer Report, H.264 (AVC) is the world’s most popular codec with an estimated 90% of videos using it. Most modern devices with a heterogeneous platform support AVC, and due to the low computational overhead as compared to its rivals, this makes it a first choice for mobile-based applications [12]. AVC leverages both spatial and temporal redundancy reduction techniques to compress video data effectively. Spatial compression is facilitated through intra-frame coding, which encodes each frame independently. Temporal compression, on the other hand, is achieved through inter-frame prediction, where subsequent frames are predicted based on preceding frames, and only the differences (residuals) are encoded. Additionally, AVC employs predictive coding, which involves predicting pixel values based on neighboring pixels, thereby reducing the amount of information that needs to be transmitted. The codec also features advanced entropy coding techniques, such as context-adaptive binary arithmetic coding (CABAC), which adaptively encodes symbols based on the context, resulting in more efficient coding. AVC’s versatility is evident in its support for a wide range of video resolutions and bit rates, rendering it suitable for diverse applications, from low-resolution video conferencing to high-definition video streaming [24,25].
HEVC, also known as H.265, represents a significant advancement in video compression standards. Developed through a collaborative effort between the ITU-T Video Coding Experts Group (VCEG) and the ISO/IEC Moving Picture Experts Group (MPEG), HEVC was introduced to address the growing demand for more efficient video compression while maintaining high-quality video [26]. HEVC introduces coding tree units (CTUs), enabling more flexible partitioning of coding units and improving compression efficiency. It employs quad-tree block partitioning, variable block sizes, and a wider range of prediction directions, enhancing its ability to capture intricate motion in video [27]. HEVC’s advanced compression capabilities make it well-suited for ultra-high-definition (UHD) video content, as it can deliver the same quality video at approximately half the bit rate of its predecessor, H.264.
2.1.2. VP9
Google’s VP9 is an open-source video codec that has emerged as a significant player in the domain of video compression, particularly in web-based video streaming and mobile gaming. Designed as a royalty-free alternative to established standards like H.264 and H.265, VP9 is part of Google’s WebM project, which aims to provide efficient and high-quality video codecs for web applications. VP9 employs a variety of advanced techniques to achieve its compression goals. These include both intra-frame and inter-frame coding, enabling efficient compression by encoding individual frames independently and using inter-frame prediction to reduce redundancy. The codec supports a range of block sizes, allowing it to adapt to various types of video content. A notable advantage of VP9 is its capability to handle higher resolutions and bit depths, making it particularly suited for ultra-high-definition (UHD) content [28,29]. This feature, combined with its open-source nature, has made VP9 a popular choice for streaming and web video applications like YouTube. However, the codec may face challenges related to hardware decoder support on different devices, as Apple devices do not support VP9. Despite this, VP9 remains a significant contender in the landscape of video codecs, offering efficient compression while avoiding licensing costs, which is particularly advantageous for web-based video streaming.
2.2. QoE Perspective
The term QoE is defined by ITU-T as “The degree of delight or annoyance of the user of an application or service” [30], with reference to the full definition, which continues with “It results from the fulfillment of his or her expectations with respect to the utility and/or enjoyment of the application or service in the light of the user’s personality and current state” [31]. QoE offers a spectrum of objective metrics aimed at gauging user perception regarding video quality through various tools. However, the most dependable measure resides in direct user interaction, achieved by conducting subjective assessments.
2.3. Objective Metrics
Evaluations of video quality can be categorized as full-reference, reduced-reference, or no-reference, contingent upon the accessibility of original videos for reference. The complexities inherent in aggregating video databases and the limited availability of full-reference necessitate the development of diverse methodologies for gauging no-reference bitstream data such as progressive downloads, image quality assessments, and adaptive video streaming [32,33,34]. Our research focuses on mobile devices, prioritizing lifelike resolutions for video streaming. We have constructed a video stimuli database within an emulated network environment, guaranteeing the availability of extensive full-reference data for our evaluations. The objective metrics employed in evaluating QoE span various families, such as structural similarity metrics encompassing methodologies like the Multi-Scale Structural Similarity Index (MS-SSIM), among others. Additionally, within the realm of principle quality metrics, notable members include the Peak Signal-to-Noise Ratio (PSNR) and Video Multi-method Assessment Fusion (VMAF), etc. [35]. These full-reference metrics primarily function to measure the disparity between the original frames and those received, constituting the video stream. Notably, different video codecs tend to yield distinct distortions, posing a challenge for these metrics. This study integrates MS-SSIM, VMAF, PSNR, and Video Quality Metric (VQM) methodologies to ascertain video quality, considering the nuanced implications of codec-induced distortions.
2.3.1. PSNR and MS-SSIM
SSIM and PSNR are the prevailing objective metrics for quantifying image and video quality owing to their computational simplicity and extensive historical benchmarking, among other factors. A multitude of scientific publications have evaluated the merits and demerits of these metrics. A comprehensive synthesis of these deliberations is available via the MSU Graphics and Media Lab Video Group link, drawing insights from an analysis encompassing 378 articles [36]. MS-SSIM is an enhancement of the traditional structural similarity index by using sub-sampling on multiple stages and involves structural distortion measurement instead of the error [37]. The MS-SSIM is defined as follows:
where:
2.3.2. VQM and VMAF
VQM assesses the perceptual impact of video distortions, encompassing aspects such as blurring, irregular motion, global noise, block distortion, and color aberrations, combining these factors into a unified metric. Empirical testing outcomes demonstrate a strong alignment between VQM scores and subjective evaluations of video quality, leading to its adoption by ANSI as a benchmark for objective video quality assessment [35,38].
VMAF is a video quality metric developed by Netflix in collaboration with multiple research groups, notably the Laboratory for Image and Video Engineering (LIVE) at The University of Texas. The metric measures information fidelity loss, loss of details, impairments, and temporal difference based on luminance [39]. It tends to outperform other metrics in both Netflix tests and other video quality tool benchmarks [40,41].
2.4. Subjective Metrics
The Mean Opinion Score (MOS) serves as the prevailing subjective metric employed to quantize user perception regarding a stimulus and has found extensive adoption within the industry for assessing speech and video quality [30]. Several studies delve into the efficacy of MOS, debating whether the disparity between ratings like “Good” and “Excellent” equates to the difference observed between “Poor” and “Bad”. Conversely, other research explores the relevance of MOS in accurately predicting user perception towards stimuli, highlighting its potential in assessing acceptability [42,43,44]. On the other hand, many factors can influence user ratings, like the user background and test environment. The term influence factor (IF) is defined as “any characteristic of a user, system, service, application, or context whose actual state or setting may have influence on the Quality of Experience for the user” [31].
In this paper, we analyzed the impact of user liking (delight) towards the shown content on her video quality ratings, which resulted in multiple sub-groups. So, apart from standard statistical computations, we calculated one-way ANOVA to analyze the difference and statistical relevance of our results when there were more than three sub-categories. One-way ANOVA can be easily calculated from the mean-squared error and is commonly derived as shown below:
where N is the total number of observations. k is the number of groups or treatments. is the number of observations in the i-th group. We can compute the overall sample mean and the between-group variability, also known as the Mean Squared Treatment MST, is provided by the following:
The test statistic for one-way ANOVA is the ratio of the between-group variability to within-group variability, known as the F-statistic:
Under the null hypothesis, the F-statistic follows an F-distribution with degrees of freedom. We can compare the calculated F-statistic to the critical value from the F-distribution table to make a decision. If , we reject the null hypothesis in favor of the alternative.
3. Experimental Setup
This section describes the reasons for the choice of video stimuli for this paper, the details about the emulated network, induced transmission impairments, and the methodology used for conducting the subjective assessment.
3.1. Video Selection
Drawing from our prior experiences and ongoing discussions pertaining to prolonged subjective assessments involving numerous video stimuli lasting a few seconds each [45,46], it was observed that users tend to become bored and start losing focus, which may affect their ratings. Consequently, we created a database by selecting four original video clips from the xiph.org test suite, resulting in a database of 112 video stimuli after distortions to maintain a reasonable duration for the subjective assessment process. The technical specifications of these videos are available in Table 1.

Table 1.
Reference video specifications.
The source video sequences are in color-sensitive raw format, i.e., YUV4Mpeg (.y4m). All four videos belong to YUV 4:2:0 color space with three different temporal and spatial characteristics, as per ITU-T P.910 recommendations [47]. All four videos are different from each other in terms of spatial characteristics. The spatial and temporal details of these videos can be found in these articles [48,49,50]. AVC and HEVC videos were encoded using libx264 and libx265 video coding libraries, respectively, with Matroska [51] as the container, whereas the VP9 videos were encoded using the libvpx-vp9 library and WEBM [28] as the container. Although the most common resolution for video streaming over mobile devices was still hovering around 480 p, we chose the 720 p resolution, which was the most common resolution for video streaming on mobile devices for applications like YouTube over high-speed 4G/5G networks or Wifi [52,53].
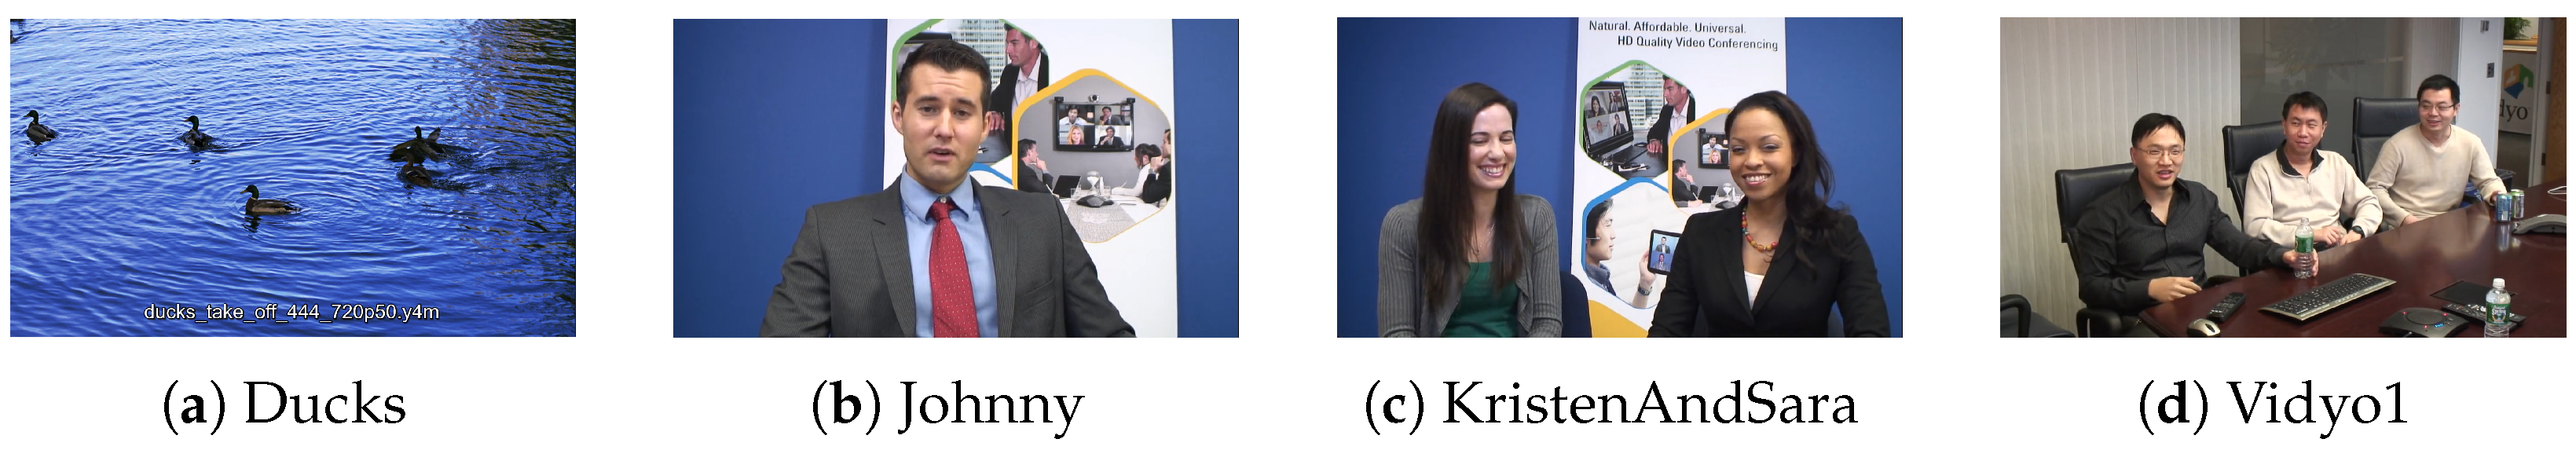
The sample frames from the original source sequences are shown in the Figure 1.

Figure 1.
Frames from reference videos.
As the focus of the research was on additional influencing factors and to remain focused on the benchmarking of objective and subjective metrics, apart from the Ducks video, the remaining three videos fell in the low temporal index. The Ducks video had medium spatial and temporal effects, while Johnny, KristenAndSara, and Vidyo1 belonged to different categories in terms of their spatial index.
3.2. Emulated Testbed and Network Impairments
The experimental setup used for collecting the video stimuli can be categorized into four groups [44]:
- to compress the test media using different codecs, resolutions, bps, and frame rates into the local machine. The benchmarking of the resultant video and compression efficiency is used to determine the quality of the video codec.
- to use the real-time network and streaming videos using different parameters mentioned above and collecting the stimuli on the end-devices.
- to use simulation software to stream stimuli with different codec settings on a depicted network with varying transmission impairments.
- to use an emulated testbed for real network experience with an opportunity for repeatable results.
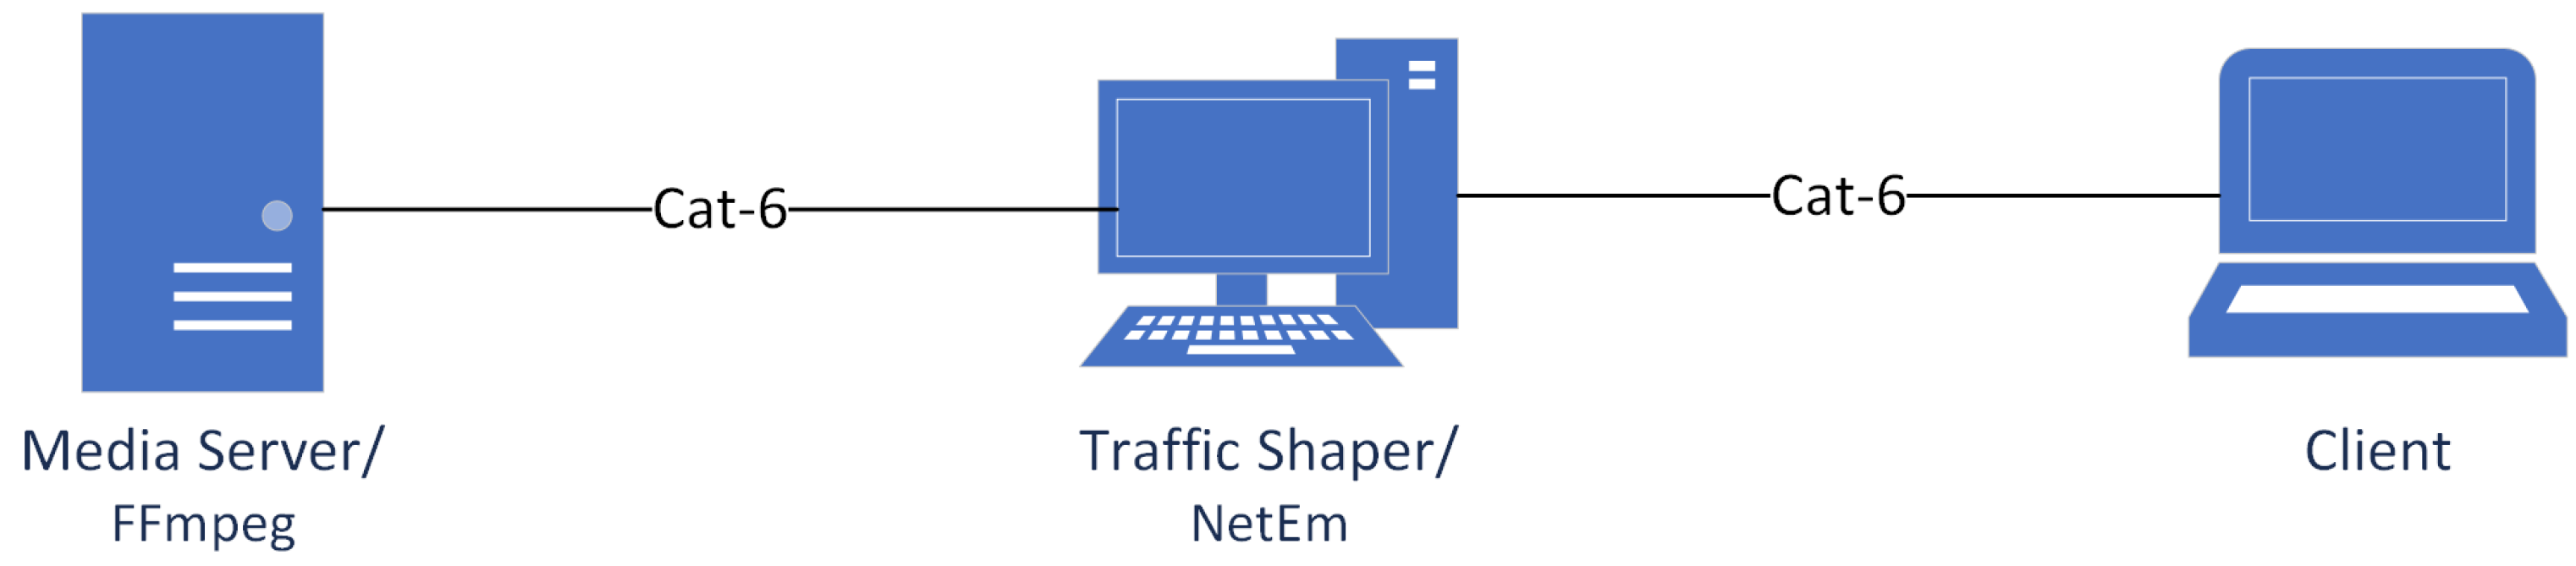
We adopted the emulated network approach to replicate the real network conditions and manage issues like priorities associated with video packets in a repeatable environment. The setup used for establishing the emulated network is shown in the Figure 2.

Figure 2.
Video streaming setup: emulated approach.
The emulated testbed consists of a streaming media server, a network emulator, and a client. The test network is designed to identify the effect of packet loss on the quality of videos encoded in H.264, H.265, and VP9. The apparatus is designed to stream HD videos from the FFmpeg [54] streaming server to a client encoded with different video codecs using RTSP protocol through a network emulator (NetEm) [55], where different network impairments have been imposed on the passing traffic and the distorted video stream is captured by the client. FFmpeg supports all of the latest codecs, including H.264, H.265, and VP9. It also supports all types of UDP and TCP streaming protocols. Another notable advantage of this testbed lies in its capacity for adaptation to facilitate the deployment and exploration of forthcoming codecs, such as Versatile Video Coding (VVC) [56] once they attain stable implementations and become officially available on open-source platforms like FFmpeg. NetEm is responsible for routing between the server and client using multiple network interfaces; hence, it acts as an interface between the media server and streaming client. The details of the used hardware/software can be found in Table 2.
Table 2.
Hardware Specifications for the emulated testbed.
We chose nine packet loss scenarios ranging from 0% to 10% for streaming videos on the emulated setup. There was no delay or jitter associated with the video stimuli used in this experiment. The main reason for this choice was the length of the subjective assessment due to the benchmarking of three codecs. To obtain the objective metrics mentioned in Section 2.3. we used the MSU Video Quality Measurement Tool (VQMT) 13.1 free version, which has some limitations compared with the Pro version but provides correct results, unlike the Demo version [57].
3.3. Subjective Assessment
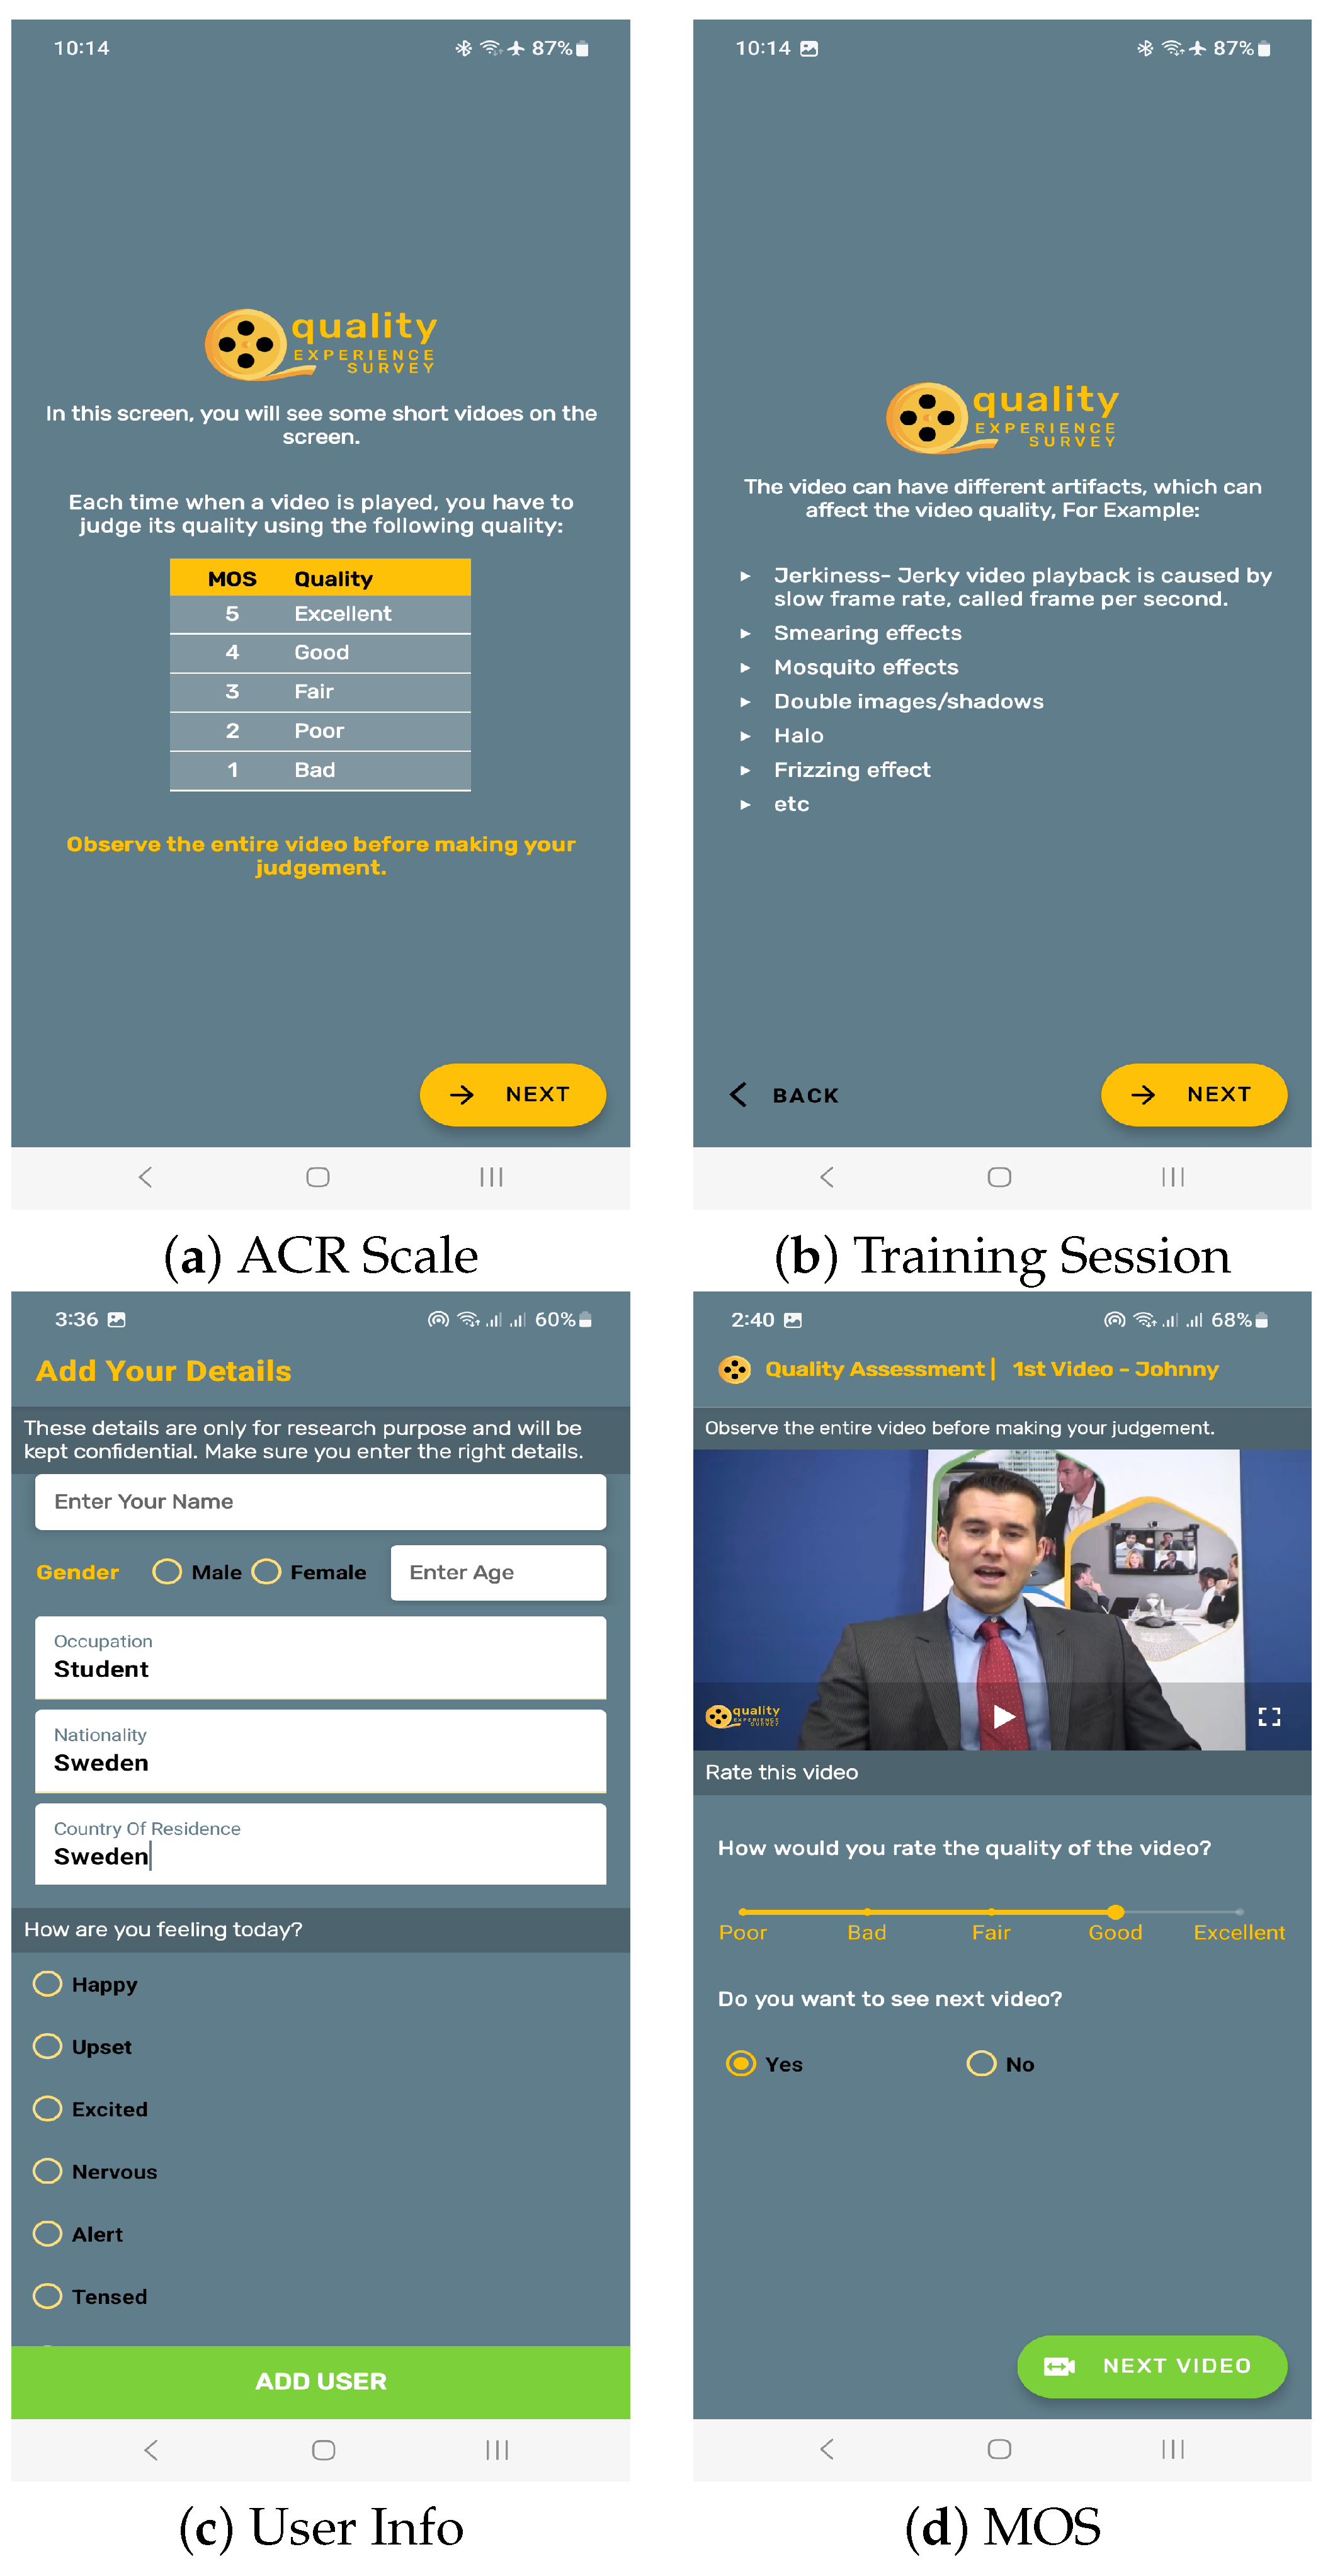
While we analyzed the codecs with both objective and subjective metrics along with the additional influence factor of delight on a mobile device, we developed an Android application for conducting the subjective assessment and Google Firebase [58] was used for the collection of results. The assessments were conducted on a Samsung Note 10 Lite (SM-N770F/DS) mobile with 8 GB of RAM. Because of the nature of the experiment, it was not possible to conduct the assessment in the perceptual lab, but the methods for conducting the individual assessments and rating scales were used as per the ITU-T P.910 [47] and ITU-R BT.500-14 [59] recommendations. Prior to each assessment, a training session was conducted wherein users received comprehensive instructions, both verbally and in written form, as illustrated in Figure 3. Moreover, subjective assessments were carried out in accordance with the research ethics principles outlined by the Swedish Research Council [60]. In the next step, test media without distortions were shown to the user, and they were asked whether they liked it or not based on a binary scale of “Yes” or “No”. The users were also requested to provide their ranking of the content based on their delight towards the shown content on a 1–9 point scale. These ratings were scaled down to five-point scale with a step size of 0.5 using the formula , where R stands for delight rating on the nine-point scale. This conversion helped us in comparing the effect of content delight with corresponding MOS. This categorization also helped us increase the number of users in each sub-category. The basic user data along with influence factors were taken from the users, as shown in Figure 3. The stimuli encoded with different codecs and packet loss ratios but belonging to the same group, i.e., Johnny, etc., were shown randomly to the subjects. The users were provided the choice to take a break after watching the first two sets of videos and the majority of users took a 3–5 min break. The user ratings for video quality were obtained using the Single-Stimulus method on a five-point Absolute Category Rating (ACR) scale.

Figure 3.
Mobile App for subjective assessment.
The selection of test media for this paper comprised a total of 112 videos, including the originals, resulting in a total assessment time of around 35–40 min. A total of 51 participants rated the test media, resulting in the compilation of 5712 assessments. During post-evaluation, three outliers were detected and subsequently excluded from the dataset. Out of the remaining 48 subjects, 20 males and 28 females participated, with a mean age of 22.52 and mode 21. The majority of participants were Bachelor’s students of information technology and were aware of the issues related to the quality of multimedia streaming.
4. Results and Discussion
The foremost thing to mention is the encoding delay experienced by the streaming server. As the processing of videos was conducted in batches, we noticed that AVC had the least computing overhead compared with HEVC and VP9. In our experience, the encoding delay of HEVC was 3–4 times higher than the AVC. The time taken for VP9 was slightly better than HEVC, but still far greater than that for AVC. This may be one of the foremost reasons for the resilience of AVC for low computing devices nowadays. The dataset of the streamed videos was analyzed before the subjective assessment. It was noted that because of the high temporal and spatial effects of the Ducks video, the results were not consistent with the other three videos with somewhat similar characteristics. It is important to mention that some videos like Duck_AVC at 0.7%, Johnny_VP9 at 0.5%, KristenAndSara_AVC at 0.7%, and Vidyo1_HEVC at 0.1% were of a low quality compared with the proceeding high-loss video. This shows the effect of high-priority packet loss associated with different types of encoding frames.
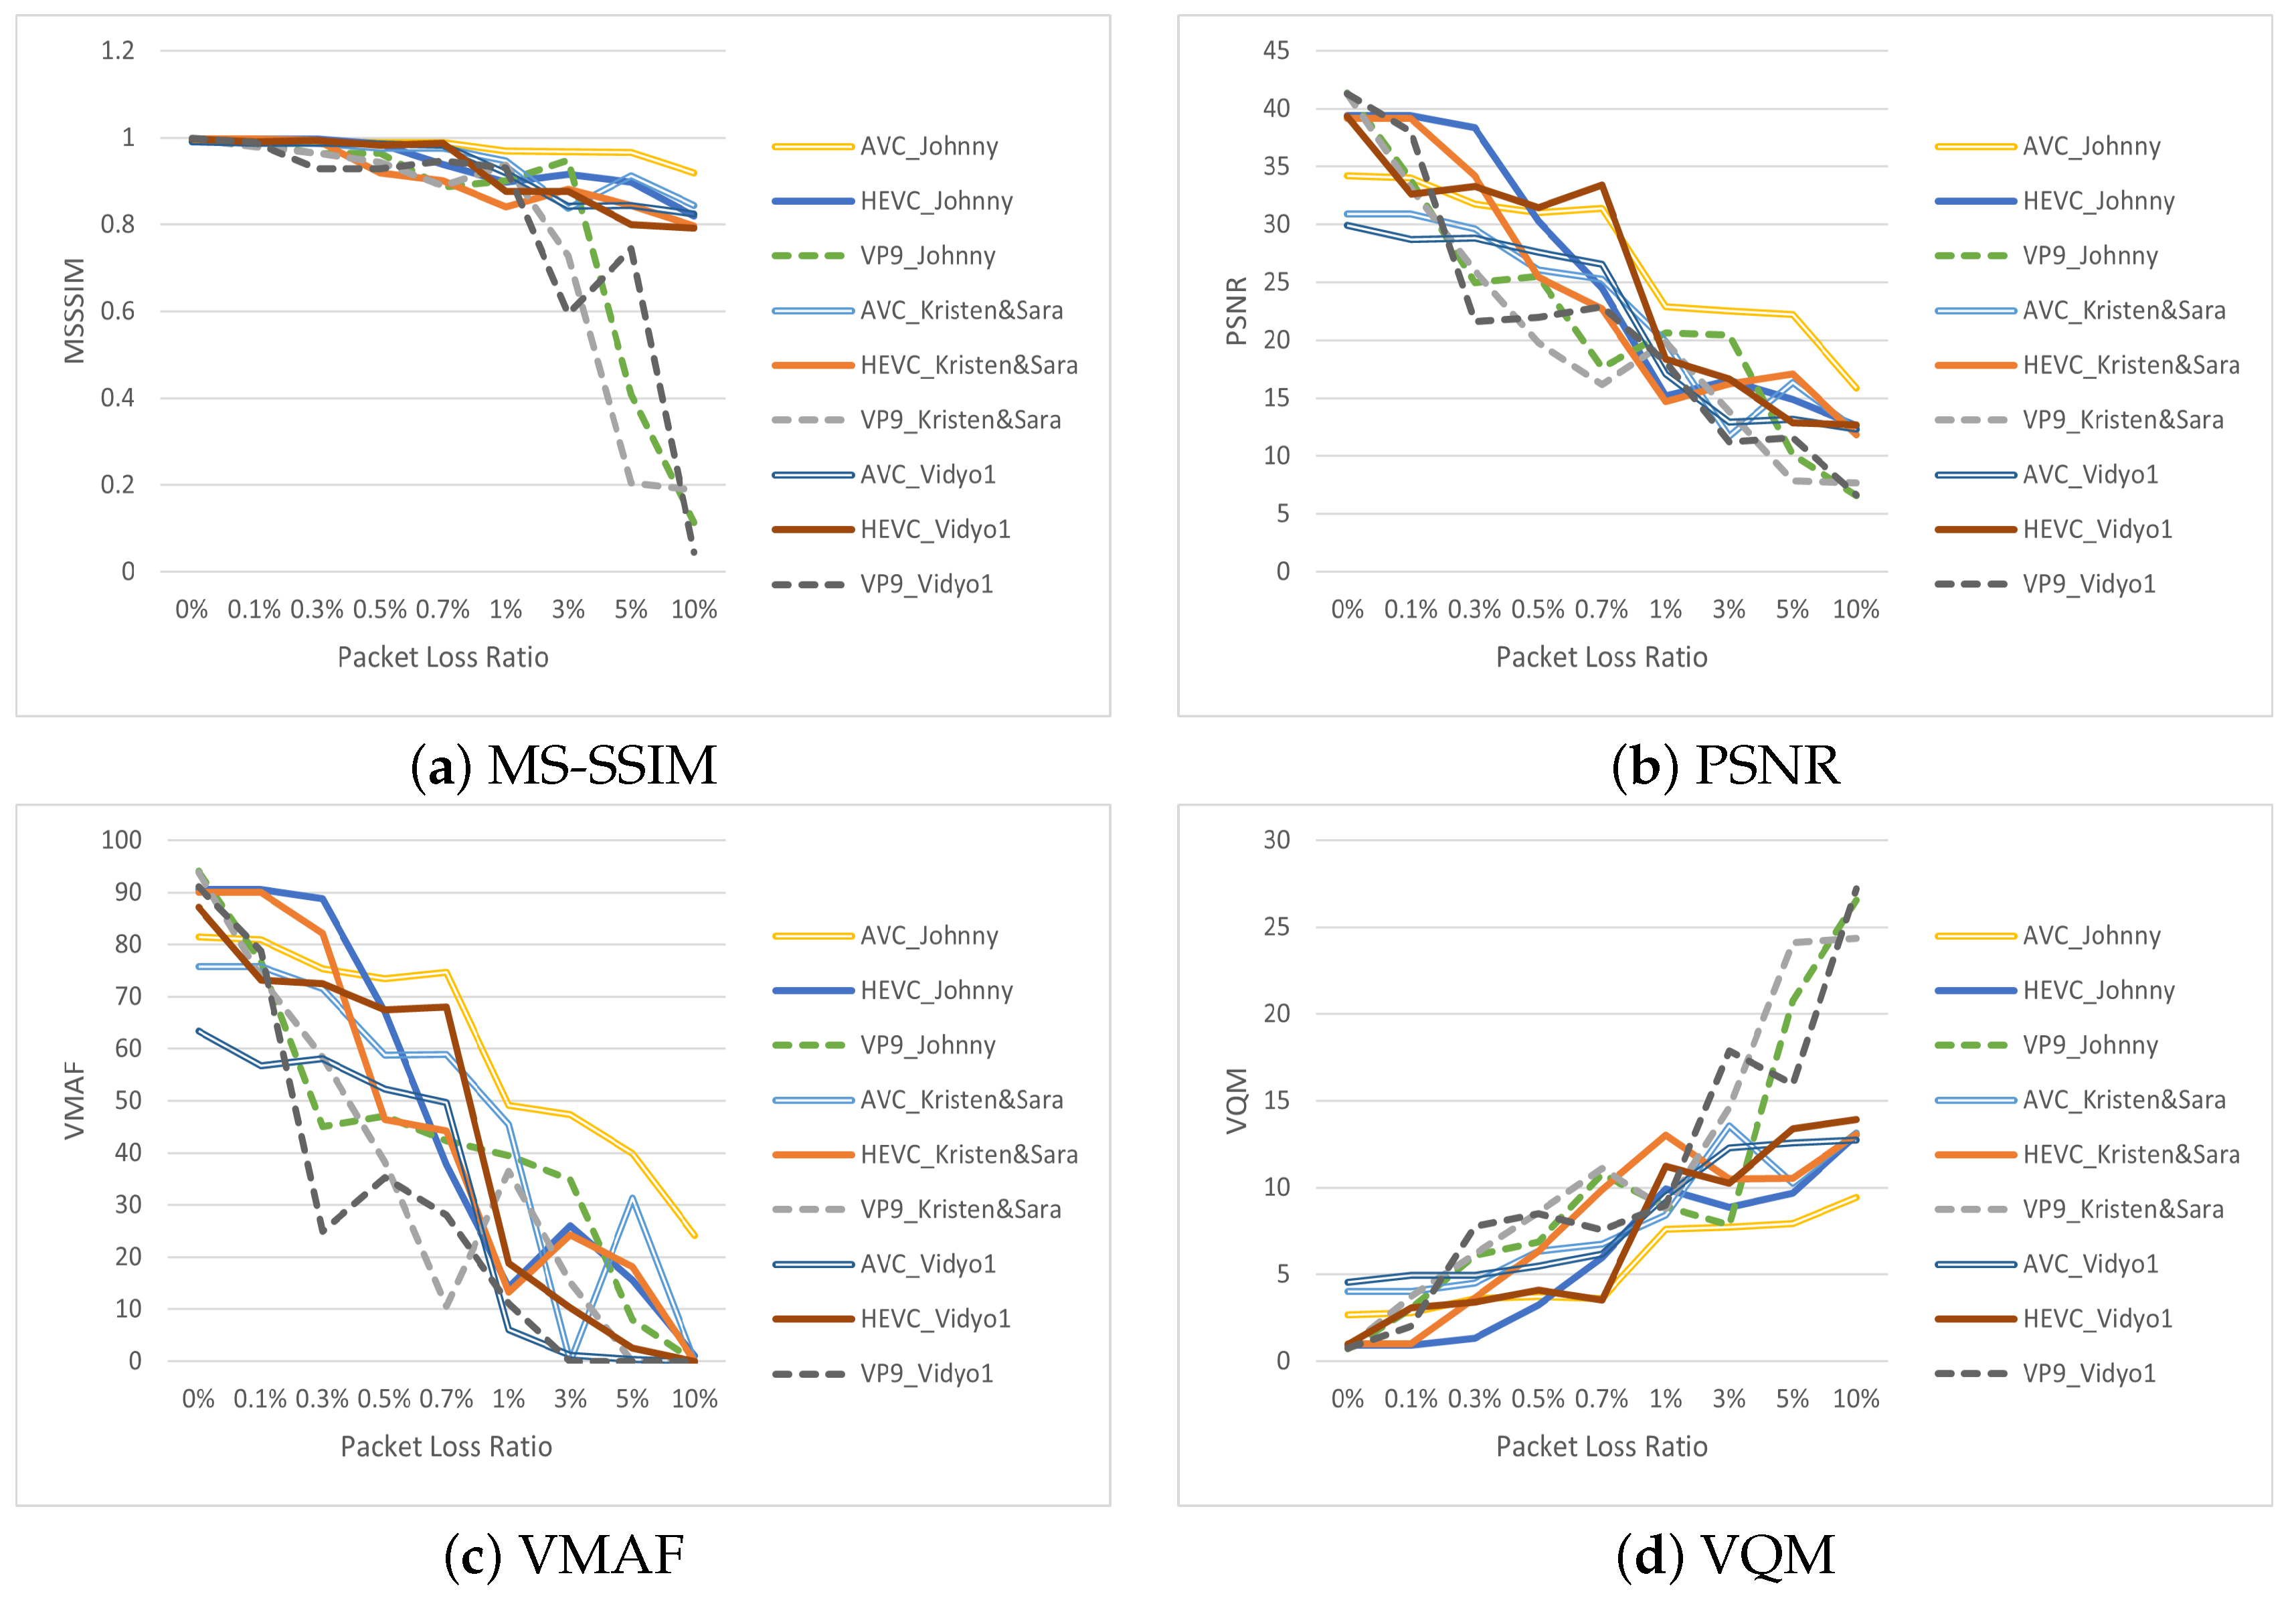
4.1. Objective Assessment
The results of the objective metrics are shown in Figure 4. AVC outperformed VP9 and was slightly better or on par with HEVC for most of the cases. When considering video quality evaluation and benchmarking through subjective assessments, it is crucial to note that the VMAF metric offered the most dependable estimation of video quality compared with the other metrics. Our findings reveal that because of the nature of the stimuli, MS-SSIM stood out as the least reliable metric. It encountered challenges in accurately quantifying video degradation across various packet loss scenarios, leading to predominantly consistent and flat trends in results, as illustrated in Figure 4. In the case of KristenAndSara_AVC at 0.7% and Vidyo1_HEVC at 0.1%, we observed that VMAF could correctly depict the change compared with both PSNR and VQM. We can easily say that within the context of the VQMT implementation used in this paper, VMAF emerged as the optimal metric for quantifying video quality in multimedia streaming. Moreover, these findings were in harmony with related research [40,61].
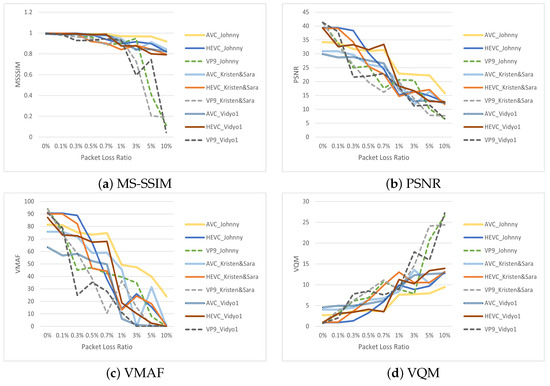
Figure 4.
Ratings of objective metrics.
4.2. Subjective Ratings
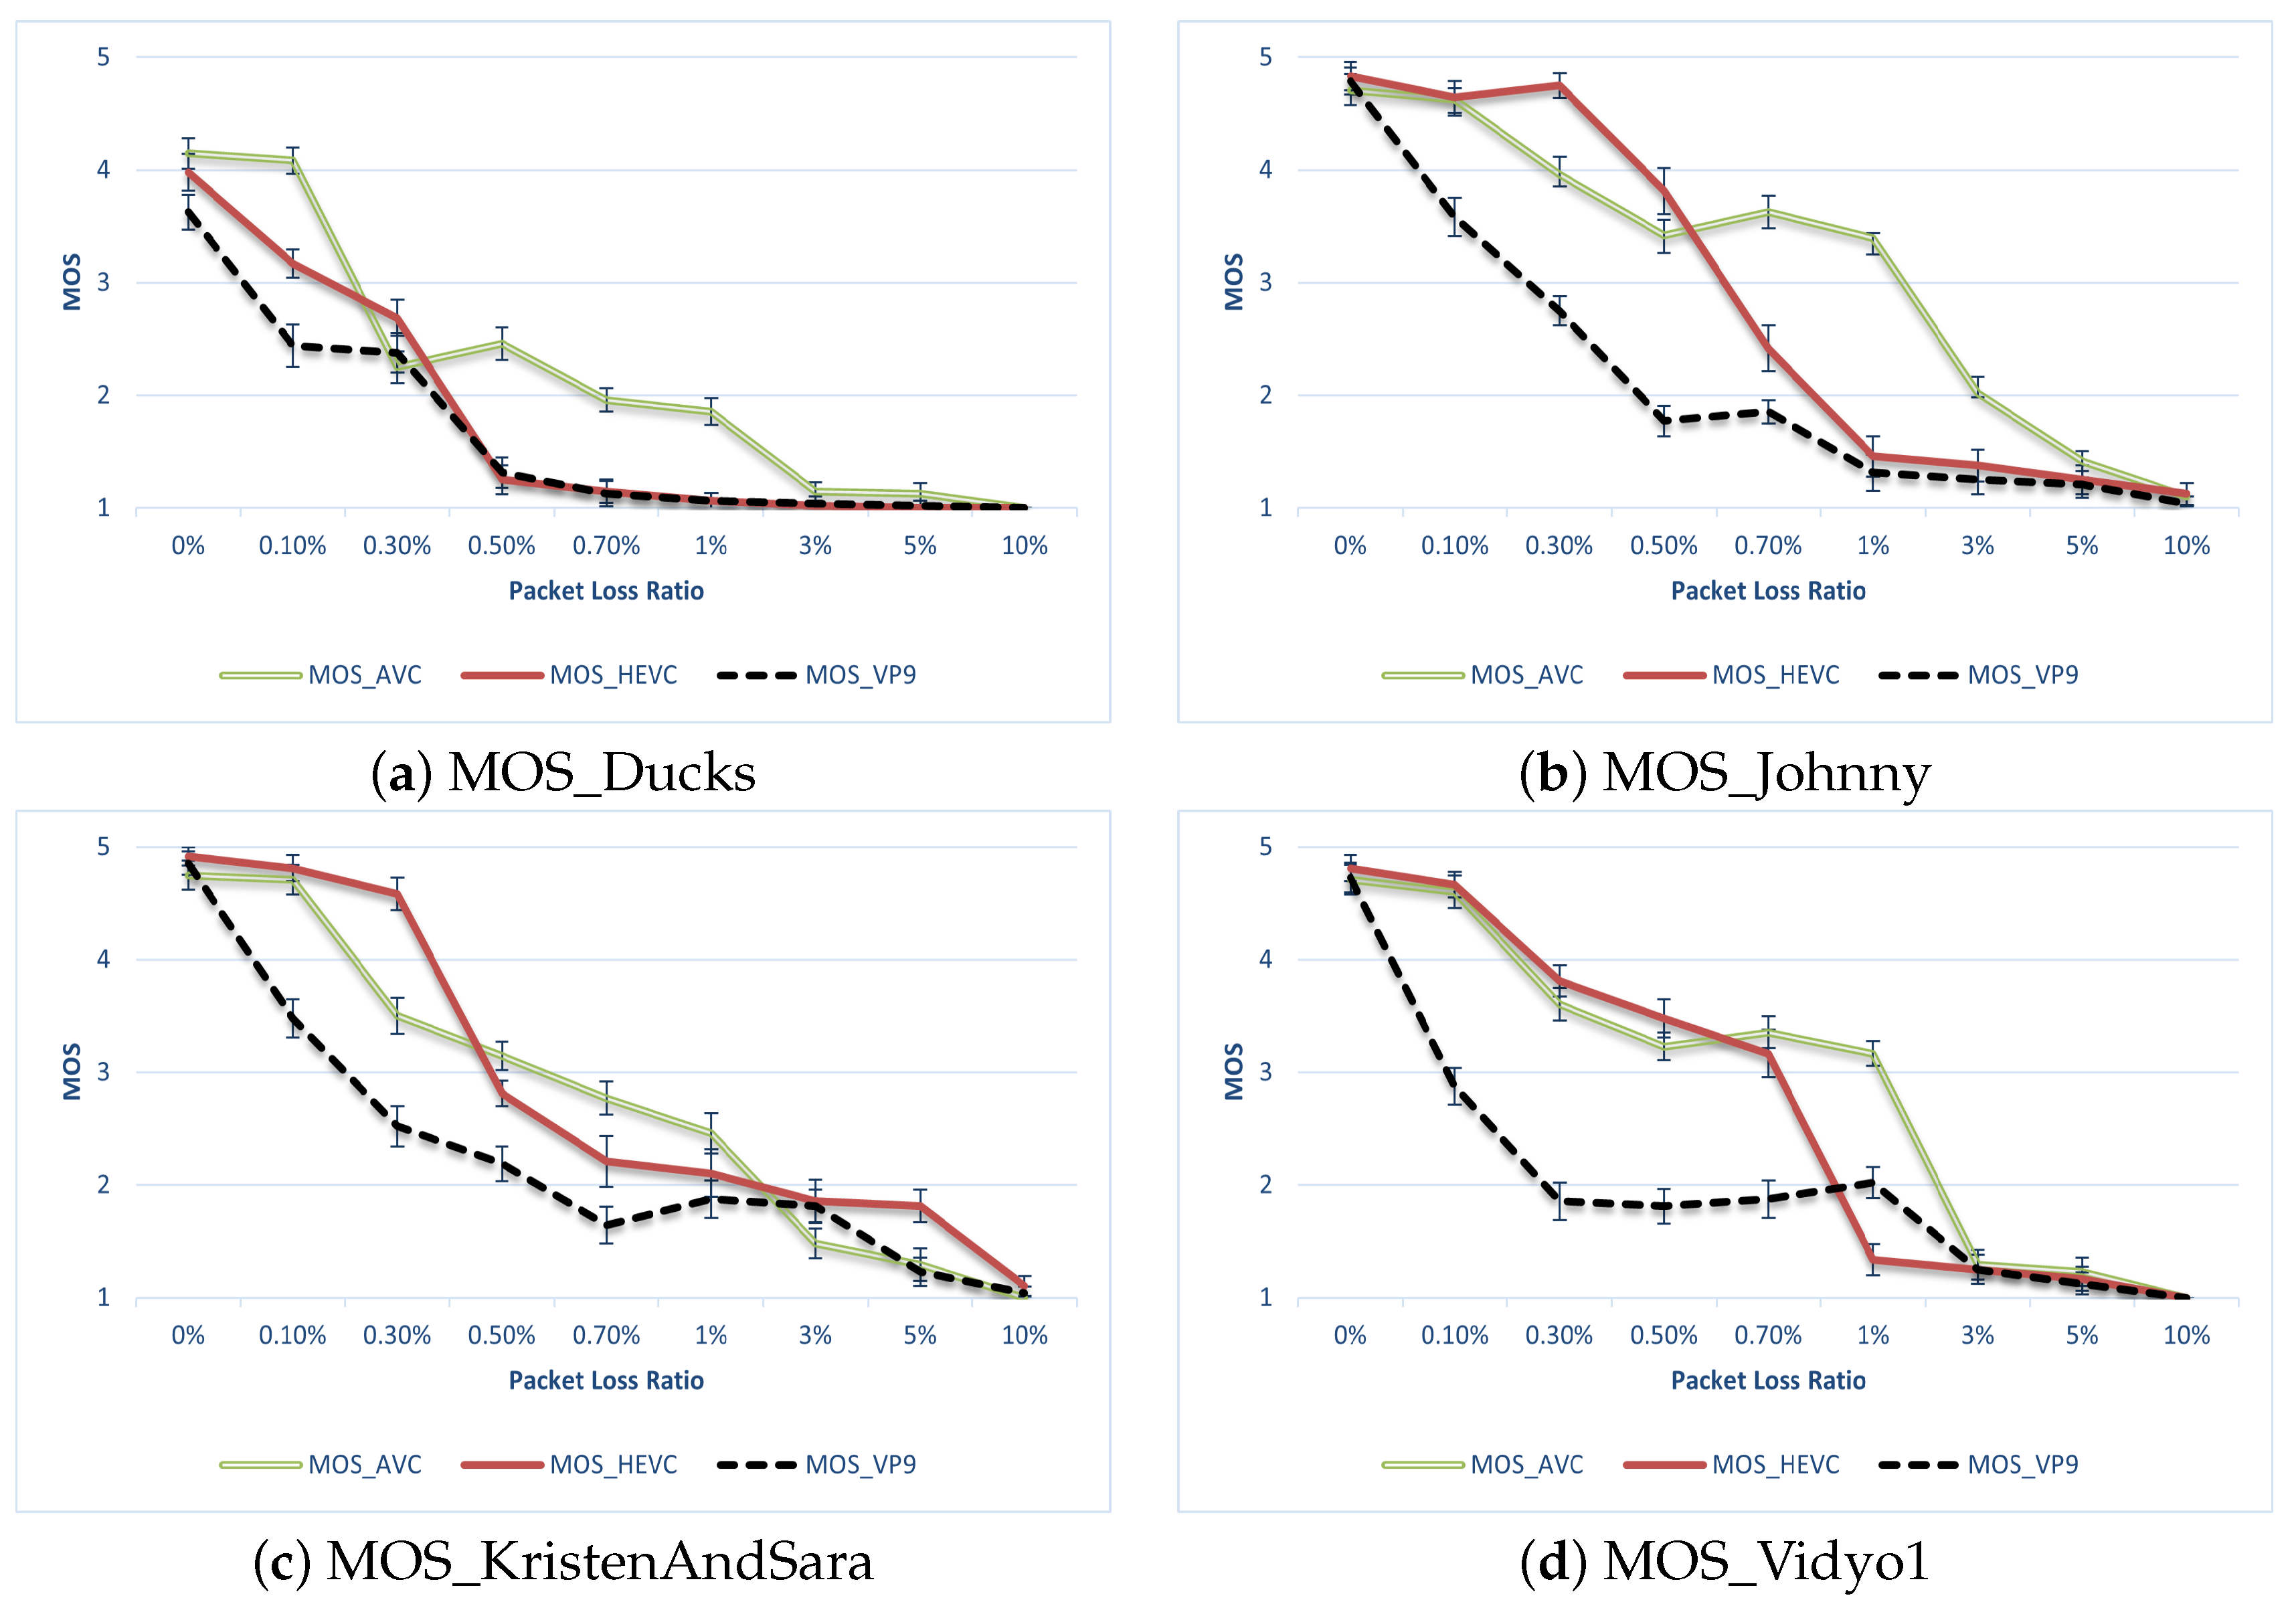
A comparison of the three codecs for packet loss concerning MOS is shown in Figure 5. There are three major observations from the results:
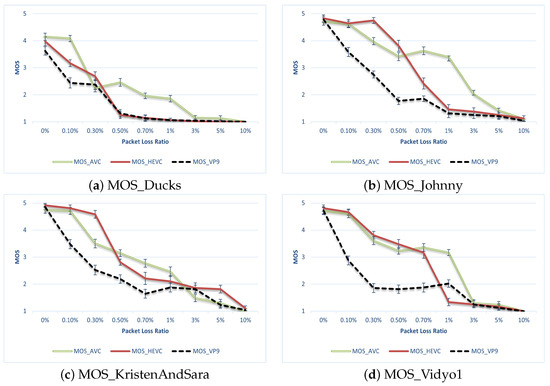
Figure 5.
MOS of subjective assessment.
- Overall, AVC outperformed both HEVC and VP9 in terms of human ratings.
- HEVC outperformed AVC or was on par in low packet-loss scenarios, but its performance deteriorated when the packet loss reached around 0.7%.
- VP9 tended to perform better in a higher packet-loss environment, but still could not match the ITU-T codecs.
When comparing the objective and subjective results, a significant observation arose: the MOS ratings notably mirrored the genuine degradation of video quality, particularly evident at low packet-loss ratios, in contrast with the majority of objective metrics discussed in the previous section. Considering the computational overhead associated with HEVC and VP9, as outlined in Section 4, it becomes apparent that the performance gains for HEVC were not substantial. This lack of significant performance improvement was among the reasons for the enduring popularity and resilience of AVC on mobile platforms as of 2023. Moreover, it also shows that for mobile devices with the requirements of computational and power efficiency, AVC will remain the most popular codec in the near future. The values of GoB and PoW metrics are shown in Table 3.
Table 3.
GoB and PoW metrics.
It is evident that the GoB percentage remained satisfactory up to a 0.5% packet loss. Additionally, the figures revealed a significant degradation in video quality when using the VP9 implementation in our testbed, even at low packet-loss ratios. These metrics offer a more meaningful and comprehensible insight compared with MOS values in our evaluation.
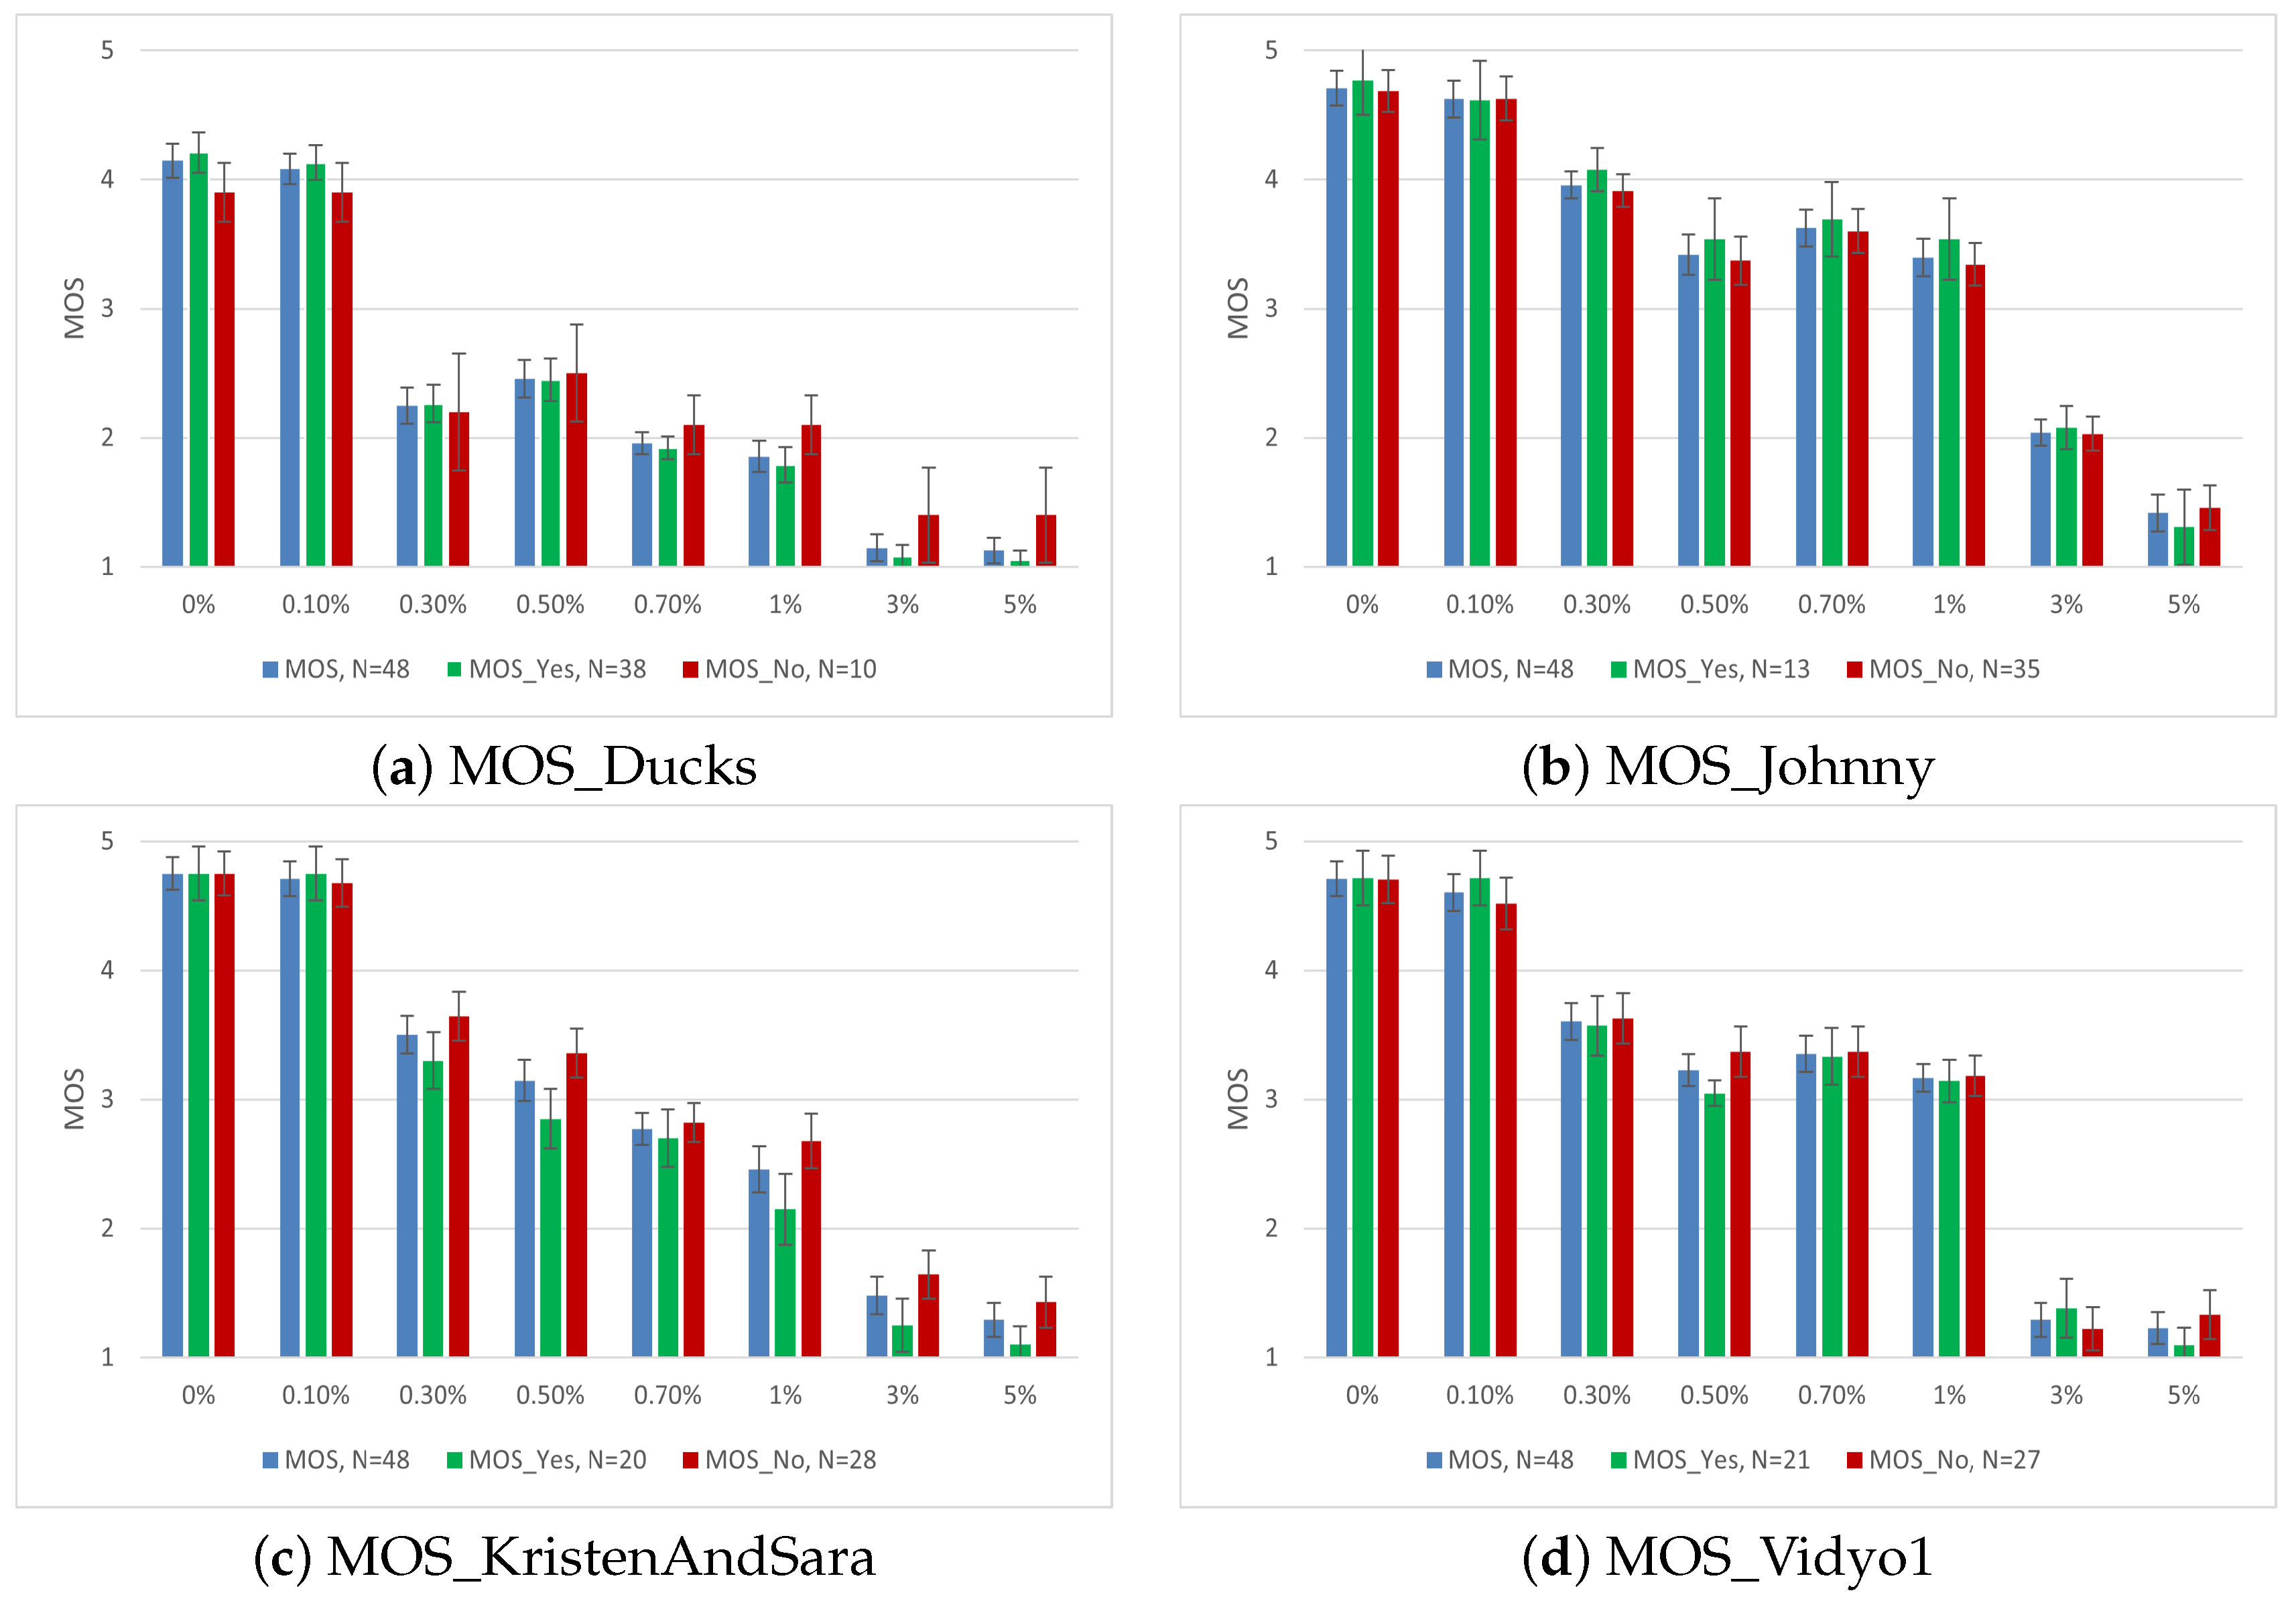
4.3. Impact of Delight of Shown Video Content
Apart from video quality, numerous human and system influence factors may affect user ratings [62,63]. We used the input from the users towards their delight for the shown content on a binary and ordinal scale, as described in Section 2. The results of the MOS values based on user delight with error bars are shown in Figure 6.
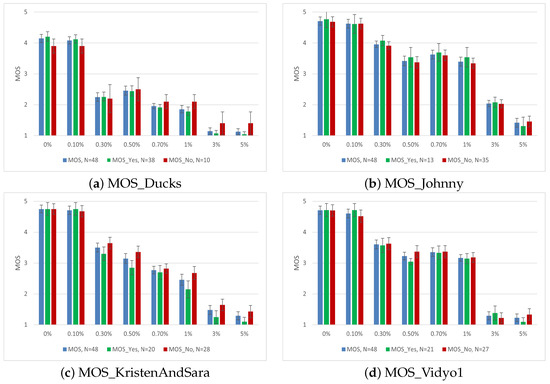
Figure 6.
MOS of subjective assessment based on Delight for AVC.
The effect of delight on the shown content and its impact on MOS was evident. Although there were only two groups of results for the binary scale, we calculated one-way ANOVA to observe the statistical relevance of the results. In the case of the Ducks video for AVC, apart from packet loss ratios of 0.3 and 0.5%, the remaining ratings are either statistically relevant or very close to being relevant, i.e., = 0.05. It is very important to mention that for the Johnny video, where the majority of subjects did not like the content, the impact was negligible for most of the scenarios. In the case of KristenAndSara and Vidyo1, with almost the same amount of delight, the impact was statistically significant for some medium and high packet-loss ratios. These results were in line with our previous work, where we observed that people showing delight towards a particular content were more critical if the video quality was degraded to a level where their viewing experience was disturbed [64]. To investigate this behavior, we also used the user ratings towards the shown content on a 1–9 ordinal scale. The results for the Ducks video for HEVC and VP9 are shown in Table 4.
Table 4.
One way ANOVA for Ducks Video.
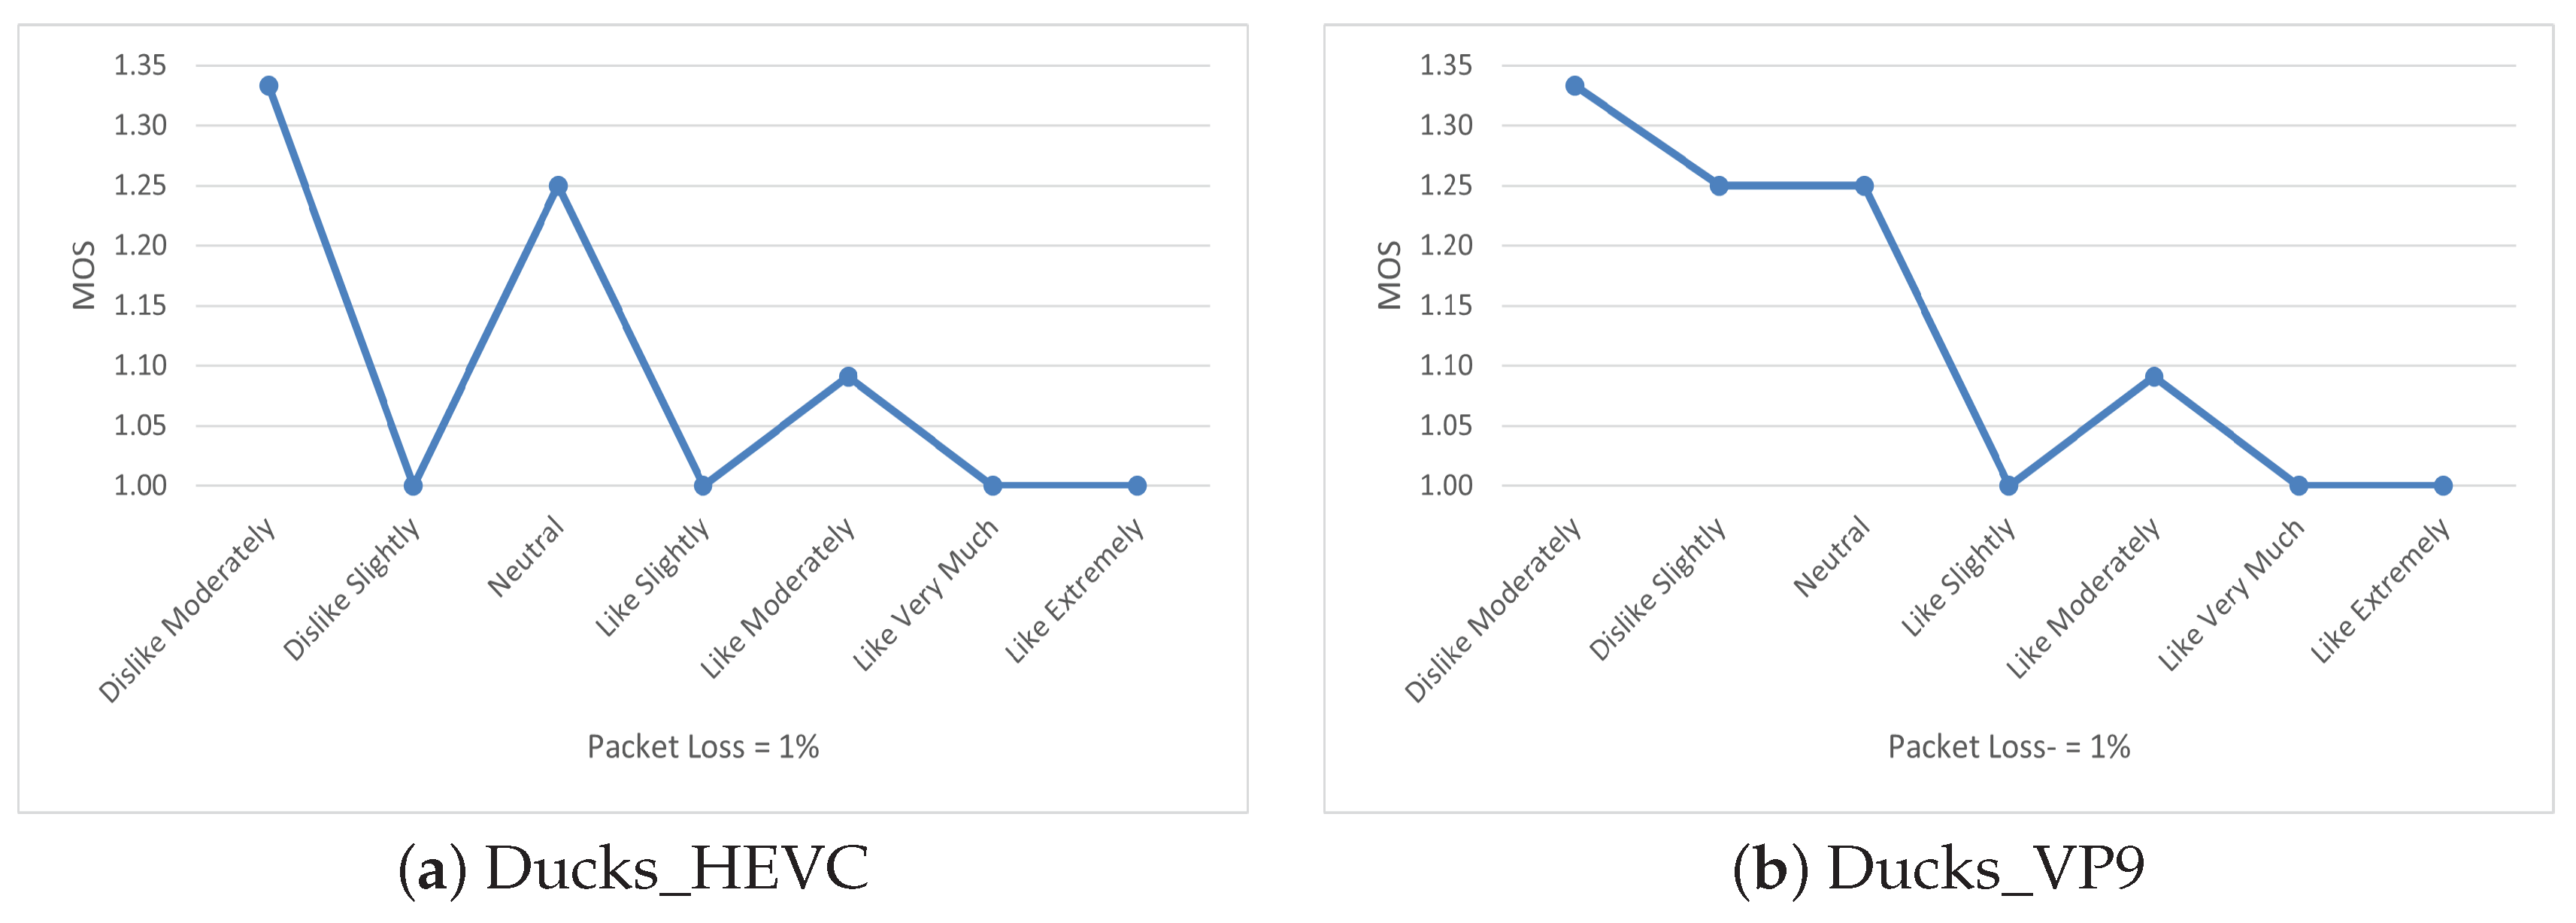
The issue here was a smaller number of subjects in each group due to the nine subgroups, i.e., Dislike Extremely, Dislike Very Much, Dislike Moderately (n = 3), Dislike Slightly (n = 4), Neutral (n = 4), Like Slightly (n = 5), Like Moderately (n = 11), Like Very Much (n = 10), and Like Extremely (n = 11) where n shows the number of users within the each group. Because of such a small sample size, we observed higher values of alpha for most of the scenarios, which were significant on the binary scale in terms of user’s delight. So, to highlight the impact of delight towards the shown content, we plotted the mean values for the user ratings of one scenario where we found a higher significance level compared with the binary scale, i.e., packet loss at 1%. The results are shown in Figure 7.
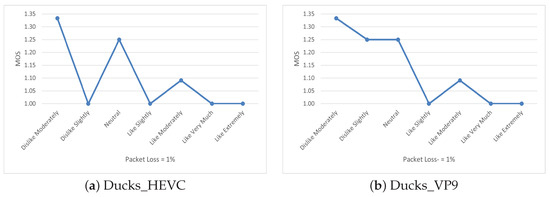
Figure 7.
Mean plot of delight for Ducks video.
It is observed that the users who showed extreme delight regarding the content were more critical when the quality degraded below a certain level. It is important to mention that this trend was consistent in most of the results, with varying significance. This shows that delight towards the content can influence user ratings and people are more sensitive to the video quality of the content they particularly enjoy.
5. Conclusions
In this study, we conducted performance benchmarking of the AVC, HEVC, and VP9 codecs on a mobile device. This evaluation encompassed both objective metrics and subjective assessments, considering various packet loss ratios within an emulated network environment. Our analysis focused on the prevailing video streaming resolution for high-speed networks on handheld devices. Our findings revealed that videos streamed using the AVC codec exhibited superior quality and greater resilience to transmission impairments. While HEVC occasionally matched or surpassed the AVC performance under low packet-loss conditions, its substantial computational overhead and subsequent power consumption offset this advantage. Conversely, VP9 consistently underperformed in comparison with other codecs across the spectrum of test scenarios. Additionally, we observed limitations in the accuracy of objective metrics, with VMAF emerging as the most reliable metric in our study.
In line with existing research, we found that user delight played a significant role in the user ratings of the shown video. Statistical significance was evident in most cases, and users exhibited heightened scrutiny of video quality degradation once they had a strong affinity for the content. This underscores the significance of human-related factors and the necessity for collecting user input beyond conventional MOS ratings. Ultimately, our work highlights the importance of incorporating these user-related influences into future models to enhance the accuracy of user-perception predictions.
Author Contributions
Conceptualization, O.N. and M.F.; Methodology, O.N., M.F. and S.K.; Software, O.N.; Validation, M.F. and S.K.; Writing—original draft, O.N.; Writing—review & editing, M.F.; Supervision, M.F. and S.K. All authors have read and agreed to the published version of the manuscript.
Funding
This research received no external funding.
Institutional Review Board Statement
Not applicable.
Informed Consent Statement
Subjective assessments were carried out following the research ethics principles outlined by the Swedish Research Council.
Data Availability Statement
Data are contained within the article. The video database can be obtained by contacting the authors and under the fair use policy. Any publication using the database should acknowledge the DITE, Blekinge Tekniska Högskola, Karlskona, Sweden. The current article needs to be cited in the bibliography.
Acknowledgments
This paper is part of the work carried out at the Video Quality Assessment Group at PUCIT headed by the 1st author of this paper. The authors would especially like to thank Usman Aamer and Aqsa Aslam for their contributions during the experimental setup and mobile application development. The authors would also like to acknowledge the contribution of Muhammad Armaghan Rashid (Aitchison College) during the subjective assessments.
Conflicts of Interest
The authors declare no conflict of interest.
Abbreviations
The following abbreviations are used in this manuscript:
| QoE | Quality of Experience |
| AVC | Advanced Video Coding |
| HEVC | High-Efficiency Video Coding |
| VQM | Video Quality Metric |
| PSNR | Peak Signal-to-Noise Ratio |
| VMAF | Video Multi-Method Assessment Fusion |
| MS-SSIM | Multi-Scale Structural Similarity Index |
| MOS | Mean Opinion Score |
| GoB | Good or Better |
| PoW | Poor or Worse |
| VQMT | Video Quality Measurement Tool |
| ACR | Absolute Category Rating |
References
- Cisco Annual Internet Report-Cisco Annual Internet Report (2018–2023) White Paper. Available online: https://www.cisco.com/c/en/us/solutions/collateral/executive-perspectives/annual-internet-report/white-paper-c11-741490.html (accessed on 1 February 2023).
- Ericsson Mobility Report November 2022. Available online: https://www.ericsson.com/en/reports-and-papers/mobility-report/reports/november-2022 (accessed on 21 January 2023).
- Precedence Research: Mobile Gaming Market Size. Available online: https://www.precedenceresearch.com/mobile-gaming-market (accessed on 16 September 2023).
- Most Used Devices for Digital Videos in the U.S. 2023. Available online: https://www.statista.com/forecasts/997109/most-used-devices-for-digital-videos-in-the-us (accessed on 13 September 2023).
- World Telecommunication/ICT Indicators Database. Available online: https://www.itu.int:443/en/ITU-D/Statistics/Pages/publications/wtid.aspx (accessed on 13 September 2023).
- Sattarov, A.; Khaitova, N. Mobile Learning As New Forms and Methods of Increasing the Effectiveness of Education. Eur. J. Res. Reflect. Educ. Sci. 2019, 7, 1169–1175. [Google Scholar]
- Zerman, E.; Kulkarni, R.; Smolic, A. User Behaviour Analysis of Volumetric Video in Augmented Reality. In Proceedings of the 2021 13th International Conference on Quality of Multimedia Experience (QoMEX), Montreal, QC, Canada, 14–17 June 2021; pp. 129–132. [Google Scholar] [CrossRef]
- Shangguan, Z. The impacts of 5G technology and cloud computing on the gaming accessories industry. In Proceedings of the International Conference on Electronic Information Engineering and Computer Technology (EIECT 2021), Kunming, China, 30 October–1 November 2021; Volume 12087, pp. 272–275. [Google Scholar] [CrossRef]
- Huang, H.S.; Su, Y.S. A Practical Study of QoE on Cloud Gaming in 5G Networks. In Proceedings of the 2023 International Wireless Communications and Mobile Computing (IWCMC), Marrakesh, Morocco, 19–23 June 2023; pp. 638–643. [Google Scholar] [CrossRef]
- Twenge, J.M.; Martin, G.N.; Spitzberg, B.H. Trends in U.S. Adolescents’ media use, 1976–2016: The rise of digital media, the decline of TV, and the (near) demise of print. Psychol. Pop. Media Cult. 2019, 8, 329–345. [Google Scholar] [CrossRef]
- Newzoo Global Games Market Report 2022|Free Version. Available online: https://newzoo.com/resources/trend-reports/newzoo-global-games-market-report-2022-free-version (accessed on 12 September 2023).
- Bitmovin’s 4th Annual Video Developer Report 2020. Available online: https://go.bitmovin.com/video-developer-report-2020 (accessed on 29 January 2023).
- Hoßfeld, T.; Heegaard, P.E.; Varela, M.; Möller, S. QoE beyond the MOS: An in-depth look at QoE via better metrics and their relation to MOS. Springer Qual. User Exp. 2016, 1, 2. [Google Scholar] [CrossRef]
- Hoßfeld, T.; Heegaard, P.E.; Skorin-Kapov, L.; Varela, M. Deriving QoE in systems: From fundamental relationships to a QoE-based Service-level Quality Index. Springer Qual. User Exp. 2020, 5, 7. [Google Scholar] [CrossRef]
- Duanmu, Z.; Rehman, A.; Wang, Z. A Quality-of-Experience Database for Adaptive Video Streaming. IEEE Trans. Broadcast. 2018, 64, 474–487. [Google Scholar] [CrossRef]
- Yu, X.; Ying, Z.; Birkbeck, N.; Wang, Y.; Adsumilli, B.; Bovik, A.C. Subjective and Objective Analysis of Streamed Gaming Videos. Available online: http://arxiv.org/abs/2203.12824 (accessed on 4 January 2024).
- Mok, R.K.P.; Luo, X.; Chan, E.W.W.; Chang, R.K.C. QDASH: A QoE-aware DASH system. In Proceedings of the 3rd Multimedia Systems Conference, Chapel Hill, NC, USA, 22–24 February 2012; pp. 11–22. [Google Scholar] [CrossRef]
- Song, W.; Xiao, Y.; Tjondronegoro, D.; Liotta, A. QoE Modelling for VP9 and H.265 Videos on Mobile Devices. In Proceedings of the 23rd ACM international conference on Multimedia, Brisbane, Australia, 26–30 October 2015; pp. 501–510. [Google Scholar] [CrossRef]
- Casas, P.; Seufert, M.; Wamser, F.; Gardlo, B.; Sackl, A.; Schatz, R. Next to You: Monitoring Quality of Experience in Cellular Networks From the End-Devices. IEEE Trans. Netw. Serv. Manag. 2016, 13, 181–196. [Google Scholar] [CrossRef]
- Siekkinen, M.; kämäräinen, T.; Favario, L.; Masala, E. Can You See What I See? Quality-of-Experience Measurements of Mobile Live Video Broadcasting. ACM Trans. Multimed. Comput. Commun. Appl. 2018, 14, 34:1–34:23. [Google Scholar] [CrossRef]
- Iza Paredes, C.; Mezher, A.M.; Aguilar Igartua, M. Performance Comparison of H.265/HEVC, H.264/AVC and VP9 Encoders in Video Dissemination over VANETs; Springer International Publishing: Cham, Switzerland, 2017; pp. 51–60. [Google Scholar] [CrossRef]
- Müller, C.; Lederer, S.; Timmerer, C. An evaluation of dynamic adaptive streaming over HTTP in vehicular environments. In Proceedings of the 4th Workshop on Mobile Video, Chapel Hill, NC, USA, 24 February 2012; pp. 37–42. [Google Scholar] [CrossRef]
- ITU-T Rec: H.264 Advanced Video Coding for Generic Audiovisual Services. Technical Report, ITU-T. 2021. Available online: https://www.itu.int/rec/T-REC-H.264 (accessed on 8 January 2024).
- Wiegand, T.; Sullivan, G.J.; Bjontegaard, G.; Luthra, A. Overview of the H.264/AVC video coding standard. Circuits Syst. Video Technol. IEEE Trans. 2003, 13, 560–576. [Google Scholar] [CrossRef]
- Iain, E.R. The H.264 Advanced Video Compression Standard, 2nd ed.; Wiley: Hoboken, NJ, USA, 2010. [Google Scholar]
- ITU-T Rec: H.265: High Efficiency Video Coding. Technical Report, ITU-T. 2023. Available online: https://www.itu.int/rec/T-REC-H.265 (accessed on 8 January 2024).
- Sullivan, G.J.; Ohm, J.R.; Han, W.J.; Wiegand, T. Overview of the High Efficiency Video Coding (HEVC) Standard. IEEE Trans. Circuits Syst. Video Technol. 2012, 22, 1649–1668. [Google Scholar] [CrossRef]
- The WebM Project|VP9 Video Codec Summary. Available online: https://www.webmproject.org/vp9/ (accessed on 28 January 2023).
- Ozer, J. VP9 Codec: Google’s Open-Source Technology Explained. Available online: https://www.wowza.com/blog/vp9-codec-googles-open-source-technology-explained (accessed on 18 October 2023).
- ITU-T Rec. P.10/G.100. Vocabulary for Performance, Quality of Service and Quality of Experience. Technical Report, ITU-T. 2017. Available online: https://www.itu.int/rec/T-REC-P.10 (accessed on 8 January 2024).
- Qualinet. Qualinet White Paper on Definitions of Quality of Experience, European Network on QoE in Multimedia Systems and Services; Novi Sad, Serbia; Technical Report. 2013. Available online: http://www.qualinet.eu/resources/qualinet-white-paper/ (accessed on 23 March 2023).
- Heikkilä, G.; Gustafsson, J. Video QoE: Leveraging Standards to Meet Rising Expectations. Ericsson Technology Review Articles. 2017. ISSN 0014-0171 284 23-3300|Uen. Available online: https://www.ericsson.com/en/reports-and-papers/ericsson-technology-review/articles/video-qoe-leveraging-standards-to-meet-rising-user-expectations (accessed on 8 January 2024).
- ITU-T P.1203: Parametric Bitstream-Based Quality Assessment of Progressive Download and Adaptive Audiovisual Streaming Services over Reliable Transport. Technical Report, ITU-T. 2017. Available online: https://www.itu.int/rec/T-REC-P.1203 (accessed on 8 January 2024).
- Min, X.; Gu, K.; Zhai, G.; Liu, J.; Yang, X.; Chen, C.W. Blind Quality Assessment Based on Pseudo-Reference Image. IEEE Trans. Multimed. 2018, 20, 2049–2062. [Google Scholar] [CrossRef]
- Wang, Y. Survey of Objective Video Quality Measurements; Technical Report MA 01748; EMC Corporation: Hopkinton, MA, USA, 2006. [Google Scholar]
- PSNR and SSIM: Application Areas and Criticism. Available online: https://videoprocessing.ai/metrics/ways-of-cheating-on-popular-objective-metrics.html (accessed on 14 September 2023).
- Wang, Z.; Simoncelli, E.; Bovik, A. Multiscale structural similarity for image quality assessment. In Proceedings of the The Thrity-Seventh Asilomar Conference on Signals, Systems & Computers, Pacific Grove, CA, USA, 9–12 November 2003; Volume 2, pp. 1398–1402. [Google Scholar] [CrossRef]
- Pinson, M.; Wolf, S. A new standardized method for objectively measuring video quality. IEEE Trans. Broadcast. 2004, 50, 312–322. [Google Scholar] [CrossRef]
- Netflix/VMAF · Features. Available online: https://github.com/Netflix/vmaf/blob/master/resource/doc/features.md (accessed on 12 October 2023).
- Blog, N.T. Toward A Practical Perceptual Video Quality Metric. Available online: https://netflixtechblog.com/toward-a-practical-perceptual-video-quality-metric-653f208b9652 (accessed on 29 January 2023).
- Video Quality Metrics Benchmark Methodology. Available online: https://videoprocessing.ai/benchmarks/video-quality-metrics_frm.html (accessed on 12 October 2023).
- Pinson, M.H.; Janowski, L.; Pepion, R.; Huynh-Thu, Q.; Schmidmer, C.; Corriveau, P.; Younkin, A.; Le Callet, P.; Barkowsky, M.; Ingram, W. The Influence of Subjects and Environment on Audiovisual Subjective Tests: An International Study. IEEE J. Sel. Top. Signal Process. 2012, 6, 640–651. [Google Scholar] [CrossRef]
- Streijl, R.C.; Winkler, S.; Hands, D.S. Mean Opinion Score (MOS) Revisited: Methods and Applications, Limitations and Alternatives. Multimed. Syst. 2016, 22, 213–227. [Google Scholar] [CrossRef]
- Nawaz, O. A Holistic View of QoE for Multimedia Streaming. Licentiate Dissertation, Blekinge Tekniska Högskola, Karlskrona, Sweden, 2023. [Google Scholar]
- Fröhlich, P.; Egger, S.; Schatz, R.; Mühlegger, M.; Masuch, K.; Gardlo, B. QoE in 10 s: Are short video clip lengths sufficient for Quality of Experience assessment? In Proceedings of the 2012 Fourth International Workshop on Quality of Multimedia Experience, Melbourne, VIC, Australia, 5–7 July 2012; pp. 242–247. [Google Scholar] [CrossRef]
- Nawaz, O.; Minhas, T.N.; Fiedler, M. QoE based comparison of H.264/AVC and WebM/VP8 in an error-prone wireless network. In Proceedings of the Integrated Network and Service Management (IM), 2017 IFIP/IEEE Symposium, Lisbon, Portugal, 8–12 May 2017; pp. 1005–1010. [Google Scholar]
- ITU-T Rec. P.910. Subjective Video Quality Assessment Methods for Multimedia Applications. Technical Report, ITU-T. 2023. Available online: https://www.itu.int/rec/T-REC-P.910 (accessed on 8 January 2024).
- Bender, I.; Borges, A.; Agostini, L.; Zatt, B.; Correa, G.; Porto, M. Complexity and compression efficiency analysis of libaom AV1 video codec. Springer J.-Real-Time Image Process. 2023, 20, 50. [Google Scholar] [CrossRef] [PubMed]
- Mercat, A.; Arrestier, F.; Pelcat, M.; Hamidouche, W.; Menard, D. Probabilistic Approach Versus Machine Learning for One-Shot Quad-Tree Prediction in an Intra HEVC Encoder. J. Signal Process. Syst. 2019, 91, 1021–1037. [Google Scholar] [CrossRef]
- Bender, I.; Palomino, D.; Agostini, L.; Correa, G.; Porto, M. Compression Efficiency and Computational Cost Comparison between AV1 and HEVC Encoders. In Proceedings of the 2019 27th European Signal Processing Conference (EUSIPCO), A Coruna, Spain, 2–6 September 2019; pp. 1–5. [Google Scholar] [CrossRef]
- Matroska Media Container Homepage. Available online: https://www.matroska.org/index.html (accessed on 1 February 2023).
- Hamer, A. The Ultimate Guide to YouTube Video Sizes|Descript. Available online: https://www.descript.com/blog/article/the-ultimate-guide-to-youtube-video-sizes (accessed on 21 June 2023).
- Ankita. The Best Resolution for YouTube: A Complete Guide|OFFEO. Available online: https://offeo.com/learn/best-resolution-for-youtube (accessed on 21 June 2023).
- FFmpeg (Cross-Platform Solution to Record, Convert and Stream Audio and Video). Available online: https://ffmpeg.org/ (accessed on 2 July 2023).
- NetEm-Network Emulator|The Linux Foundation. Linux/UNIX System Programming Training 2011. Available online: https://man7.org/linux/man-pages/man8/tc-netem.8.html (accessed on 12 March 2023).
- Bross, B.; Wang, Y.K.; Ye, Y.; Liu, S.; Chen, J.; Sullivan, G.J.; Ohm, J.R. Overview of the Versatile Video Coding (VVC) Standard and its Applications. IEEE Trans. Circuits Syst. Video Technol. 2021, 31, 3736–3764. [Google Scholar] [CrossRef]
- MSU Video Quality Measurement Tool (VMAF, PSNR, VQM, SSIM, NIQE, etc). Available online: http://compression.ru/video/quality_measure/video_measurement_tool.html (accessed on 3 July 2023).
- Google Firebase. Available online: https://firebase.google.com/ (accessed on 2 July 2023).
- ITU-R Rec. BT.500-14. Methodology for the Subjective Assessment of the Quality of Television Pictures. Technical Report, ITU-R. 2023. Available online: https://www.itu.int/rec/R-REC-BT.500 (accessed on 8 January 2024).
- Good Research Practice; SE-101 38; Swedish Research Council: Stockholm, Sweden, 2017; ISBN 978-91-7307-354-7.
- Bampis, C.G.; Bovik, A.C. Learning to Predict Streaming Video QoE: Distortions, Rebuffering and Memory. arXiv 2017, arXiv:1703.00633. [Google Scholar] [CrossRef]
- Nawaz, O.; Fiedler, M.; De Moor, K.; Khatibi, S. Influence of Gender and Viewing Frequency on Quality of Experience. In Proceedings of the 2020 Twelfth International Conference on Quality of Multimedia Experience (QoMEX), Athlone, Ireland, 26–28 May 2020; pp. 1–4. [Google Scholar] [CrossRef]
- Reiter, U.; Brunnström, K.; De Moor, K.; Larabi, M.C.; Pereira, M.; Pinheiro, A.; You, J.; Zgank, A. Factors Influencing Quality of Experience. In Quality of Experience: Advanced Concepts, Applications and Methods; Möller, S., Raake, A., Eds.; T-Labs Series in Telecommunication Services; Springer International Publishing: Cham, Switzerland, 2014; pp. 55–72. [Google Scholar] [CrossRef]
- Nawaz, O.; Fiedler, M.; Khatibi, S. Impact of Human and Content Factors on Quality of Experience of Online Video Streaming. In Proceedings of the 17th International Joint Conference on e-Business and Telecommunications, Lieusaint-Paris, France, 8–10 July 2020; pp. 59–66. [Google Scholar] [CrossRef]
Disclaimer/Publisher’s Note: The statements, opinions and data contained in all publications are solely those of the individual author(s) and contributor(s) and not of MDPI and/or the editor(s). MDPI and/or the editor(s) disclaim responsibility for any injury to people or property resulting from any ideas, methods, instructions or products referred to in the content. |
© 2024 by the authors. Licensee MDPI, Basel, Switzerland. This article is an open access article distributed under the terms and conditions of the Creative Commons Attribution (CC BY) license (https://creativecommons.org/licenses/by/4.0/).