Article

Comprehensive Diagnosis of Localized Rolling Bearing Faults during Rotating Machine Start-Up via Vibration Envelope Analysis

by
Jose E. Ruiz-Sarrio
1,
Jose A. Antonino-Daviu
1,* and
Claudia Martis
2
1
Instituto Tecnológico de la Energía (ITE), Universitat Politècnica de València (UPV), 46022 Valencia, Spain
2
Electrical Machines and Drives Department, Technical University of Cluj-Napoca, 400114 Cluj-Napoca, Romania
*
Author to whom correspondence should be addressed.
Electronics 2024, 13(2), 375; https://doi.org/10.3390/electronics13020375
Submission received: 28 December 2023 / Revised: 11 January 2024 / Accepted: 15 January 2024 / Published: 16 January 2024

Abstract

:
The analysis of electrical machine faults during start-up, and variable speed and load conditions offers numerous advantages for fault detection and diagnosis. In this context, diagnosing localized bearing faults through vibration signals remains challenging, particularly in developing physically meaningful, simple, and resampling-free techniques to monitor fault characteristic components throughout machine start-up. This study introduces a straightforward method for qualitatively identifying the time-frequency evolutions of localized bearing faults during the start-up of an inverter-fed machine. The proposed technique utilizes the time-frequency representation of the envelope spectrum, effectively highlighting characteristic fault frequencies during transient operation. The method is tested in an open-source dataset including transient vibration signals. In addition, the work studies the method limitations induced by the mechanical transfer path, when the bearing surroundings are not directly accessible for vibration acquisition. The proposed methodology efficiently identifies incipient localized bearing faults during inverter-fed machine start-up when the fault signature is not highly attenuated.

1. Introduction

The accurate and reliable diagnosis of rotating machinery represents an industrial challenge across many applications. These represent a key asset in many industries, and the economic cost associated with their maintenance and outages is not negligible. Particularly, electrical machines represent the core of many rotary applications, where different elements are susceptible to failure. Some industrial surveys indicate that the majority of failures are associated with the bearings and the stator winding insulation [1,2]. For low voltage machines with rolling element bearings, these normally represent the most critical element [3]. Thus, the correct diagnosis and identification of rolling bearing faults constitute a central element in predictive maintenance systems.
In the context of rotating electrical machines, the diagnosis of rolling bearings have attracted significant research attention over the last years [4]. The main methodology for detecting mechanical faults and the most standardize at an industrial level is the rough monitoring of vibration signals [5]. Several researchers attempted to develop more cost-effective monitoring techniques by utilizing electrical magnitudes. However, these only provide an indirect indication of the fault presence by relating the bearing defects with stator–rotor eccentricity [6,7,8]. A clear example is the detection of rolling bearing faults through the analysis of current signals [9] or more recently, stray flux [10]. Nevertheless, the bearing diagnosis trough the utilization of vibration signals is a widespread technique in the industrial sector and still attracts significant research attention even in the electrical machine context [11].
The field of vibration signal processing tools for bearing diagnosis purposes is broadly studied. The envelope spectrum analysis is identified as one of the historically effective tools to detect localized bearing faults [12]. This methodology includes the extraction of the analytical vibration signal by utilizing the Hilbert Transformation (HT) and a band-pass filter stage. Finally, the Fourier decomposition of the obtained signal is performed to show the characteristic failure components. Other effective signals processing tools for rolling element diagnosis include traditional spectral analysis [13], Empirical Mode Decomposition (EMD) [14], the discrete wavelet decomposition [15] or cyclostationary tools [16]. Traditionally, these techniques are utilized for fixed operating machine conditions with fixed load and speed. Advanced signal processing tools are required in order to extract valuable diagnosis information during variable load and speed operation. Nevertheless, the diagnosis through the analysis of transient signals offers interesting advantages [17]. One of the main advantages lies on the improved reliability provided by the time evolutions of the signals, which provide physical information regarding fault patterns rather than relying on a single frequency point. Another remarkable advantage is the improved adaptability to different operation regimes. This may be required for machines with non-continuous duty services with absence or sporadic steady-state operation.
The detection of bearing faults and the development of advanced signal processing tools attracted significant research attention in recent years [18]. Some of the most popular methods belong to the cyclostationary category or resampling based techniques. These exploit the locked periodicity of fault components to the rotating frequency [19]. Thus, all components are expressed both in the frequency and the angular domain, which remains valid for variable speed operation. The angular domain transformation is performed depending on the instantaneous rotating speed. Signal processing techniques depending on the instantaneous speed are known as Order Tracking (OT)-based. The instantaneous shaft speed can be measured [20] or estimated [21]. Some other resampling based techniques with OT are found in [22,23]. Resampling free techniques do not require the resampling of the vibration signal from time to angular domain. This family of methods presents broad similarities to the classical electrical magnitude fault diagnosis field (i.e., analysis of machine currents or fluxes) and are based on the time-frequency analysis of the signals. These offer some advantages such as the independence on the instantaneous shaft speed measurement and resampling accuracy. In this way, several methods exist for representing signals in the time-frequency domain for diagnostic purposes, including MUSIC [24,25], variations in EMD [26], Wigner–Ville Distributions (WVD) [27], and numerous others [28]. Techniques exploiting classical envelope analysis for detecting bearing faults by utilizing transient signals are present in the literature. In [29], an enhanced envelope analysis is suggested by utilizing spectral kurtosis emphasizing impulsive components. In [30], a general demodulation based on fault instantaneous frequencies acquisition is utilized. Other methods based on the envelope analysis of vibration signals are found, but mostly belong to the resampling-based family [31]. The literature shows a trend towards complex and physically meaningful tool development. However, approaches exploiting straight, resampling free, and linear time-frequency representations, overcome some of the difficulties posed by more complex tools while keeping physical representation of fault signatures. Simple methods such as the Short Time Fourier Transform (STFT) are fast to implement, physically meaningful and computationally efficient [32]. Moreover, the analysis of the vibration transient in a qualitative manner (i.e., by clearly identifying evolution patterns) during start-up as performed for electrical magnitudes, represents a technology gap as of yet. This is specially relevant for the study of faulty conditions during machine start-up under multi-fault and multi-sensor identification scenarios.
The present work presents a signal processing pipeline for the comprehensive diagnosis of localized bearing faults during start-up via vibration signals. The main novelty of the work lays on the combination of classical envelope spectrum analysis and the STFT. The tool is conceived to effectively track the signature of incipient localized bearing faults during the electrical machine start-up in an efficient manner. The proposed methodology is tested in the recently published open-source HUST dataset (https://data.mendeley.com/datasets/cbv7jyx4p9/3; accessed on 14 January 2024), which contains different vibration signals during an inverter-fed rotating machine start-up [33]. Moreover, the influence of the structural transfer path for bearing fault detection in electrical machine diagnosis is tested. This is performed by analyzing the well-known CWRU dataset [34], where the vibration signals are acquired in different points of the electrical machine housing. The paper is organized as follows. First, the theoretical background regarding localized bearing faults and envelope analysis is set. Then, the introduced signal processing pipeline is presented where the main concepts are developed. Next, the tool is tested in the HUST dataset to detect ball, inner, and outer race localized defects trends. The influence of the transfer path on the presented tool is tested in Section 5, where the CWRU dataset is utilized. Section 6 provides the result overview and discussion. The work is closed by laying the main conclusions and future work directions.

2. Theoretical Background

The effect of localized defects in the vibration signals is extensively explored. Rolling bearings are composed of several constructive elements. The basic components are the outer and inner races in contact with static and rotating parts, respectively, the rotating element (i.e., traditionally spherical or cylindrical), the cage bounding and spacing all rolling elements, a lubricant element to reduce mechanical friction, and the seal confining rolling elements within the races. Figure 1 shows a disassembled rolling bearing with spherical rolling elements and its assembled version. The localized defects appear in the ball, cage, and inner and outer races. When a mechanical contact between the defect and a different element takes place, impulsive mechanical energy or shocks are produced. These shocks excite the structural resonances between bearing and acquisition sensor, since their frequency content posses a broad nature. In addition, the strength of the energy impulses depends on the bearing load distribution that may vary for different applications, machine, and fault types [12]. Nevertheless, the time distance between impulses can be determined depending on the bearing geometry and characteristics. Equations (1) and (2) represent the ballpass frequency of inner and outer races, respectively (i.e., f B P F O and f B P F I ), Equation (3) represents the cage frequency f C F , and Equation (4) the ball spin frequency f B S F [35,36]. These equations are defined as:
f B P F O = n b 2 { 1 d b c o s ( θ ) d p } f r
f B P F I = n b 2 { 1 + d b c o s ( θ ) d p } f r
f C F = 1 2 { 1 d b c o s ( θ ) d p } f r
f B S F = d p 2 d b { 1 d b 2 c o s 2 ( θ ) d p 2 } f r
where n b represents the number of balls or rolling elements, d b is the ball diameter, d p is the ball pitch diameter, f r is the shaft rotation frequency, and θ is the angle of load from the radial plane or ball contact angle. Figure 2 depicts a classical rolling bearing geometry and the relevant parameters. Note that these expressions are obtained for a slip-free scenario. In reality, a random slip is found and causes the frequencies to deviate around 1–2% [35].
Theoretically, vibration signals affected by bearing localized defects are understood as amplitude modulated signals, where a high-frequency carrier signal is multiplied by a low-frequency modulation signal. This phenomenon is similar to the classical sinusoidal pulse width modulation observed in power converter operation. In the context of bearing faults or other machinery issues, the carrier signal represents the fundamental frequency associated with the rotating components, while the envelope signal reveals information about the modulations or variations in amplitude caused by faults, impacts, or other irregularities. Thus, the principle of signal demodulation is traditionally exploited to obtain information about the modulating signal minimizing the effect of the carrier signal. The initial step to achieve signal demodulation is the rectification of the signal by utilizing the HT. Let us consider a typical sinusoidal function, where f ( t ) = A c o s ( ω t ) . The HT of the signal provides a complex function with both real and imaginary part with a 90° shift as shown in Equation (5). This complex function is defined as the analytic signal. The amplitude of the analytical signal is known as the signal envelope. Figure 3 shows a frequency modulated signal with its corresponding envelope. If the envelope signal is analyzed in the frequency domain by applying a simple Fast Fourier Transform (FFT), the envelope spectrum is obtained. The analysis of the envelope spectrum provides better information about the modulating signal than a direct FFT of the combined signal, as shown in Figure 3. For this reason, envelope spectrum analysis is considered as a classical methodology for extracting diagnosis information from vibration signals that present strong modulation features.
H T { f ( t ) } = f ^ ( t ) = A [ c o s ( ω t ) + j s i n ( ω t ) ]

3. Proposed Methodology

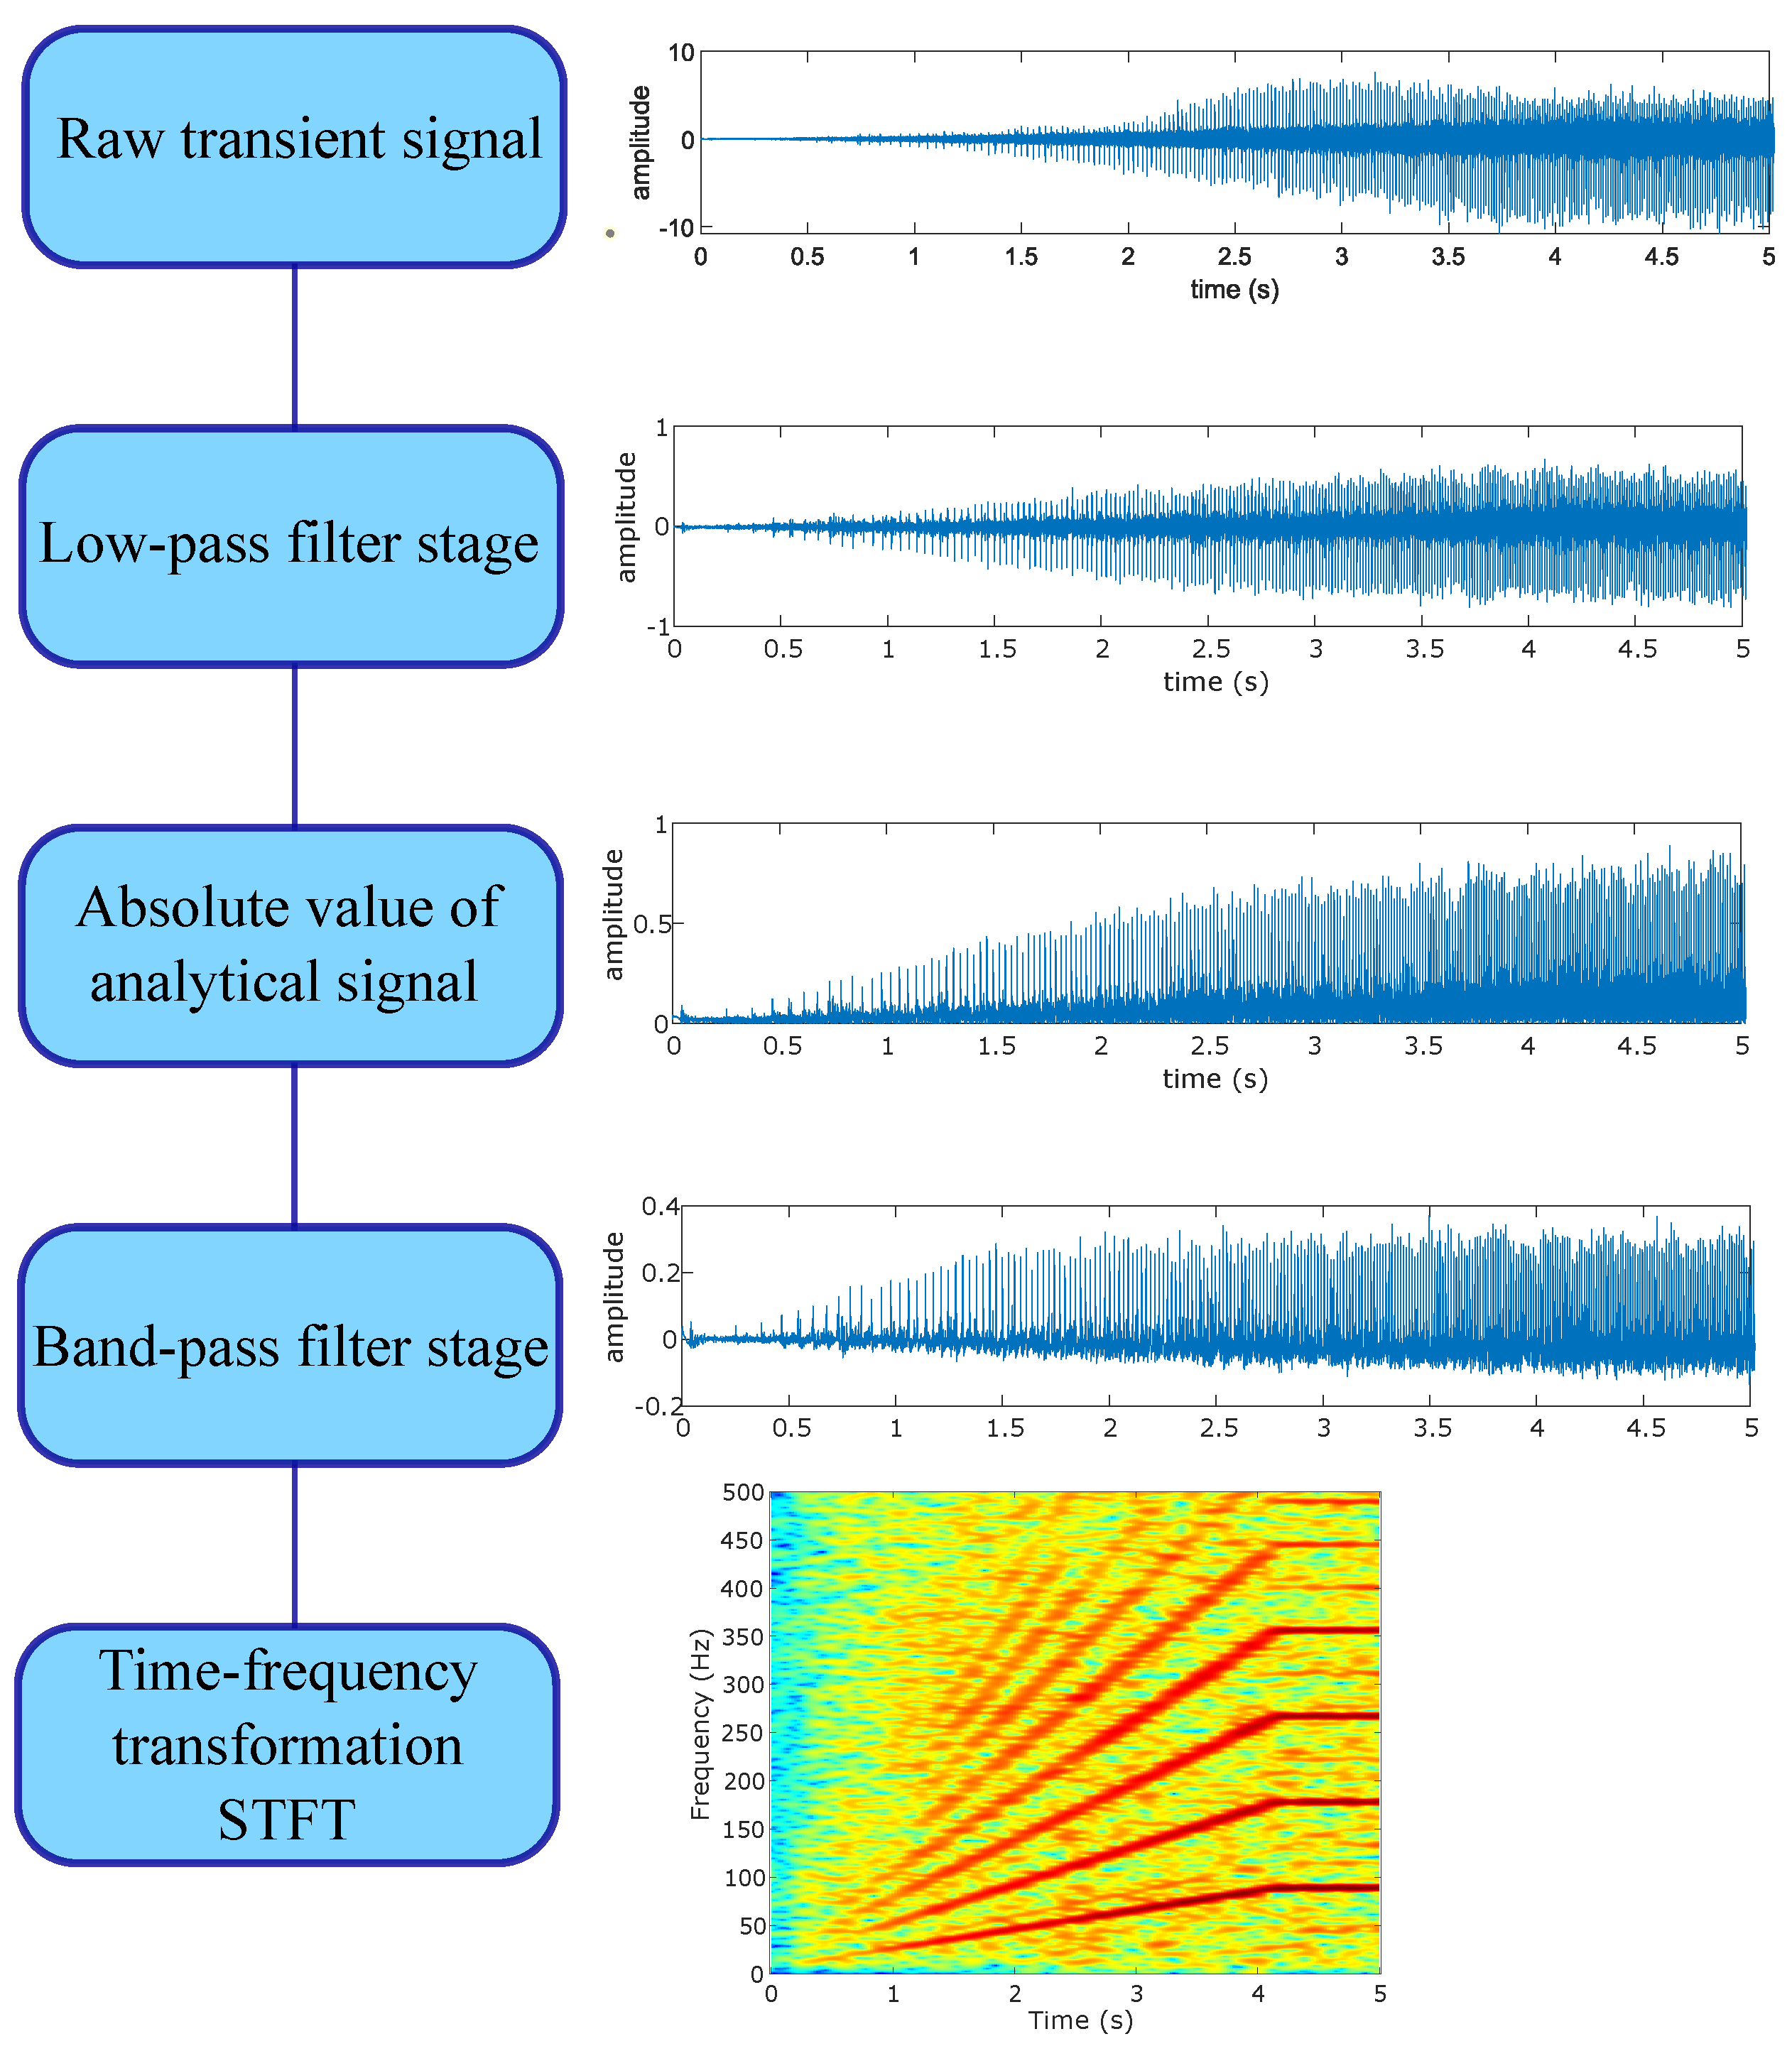
Figure 4 shows the proposed analysis methodology for the qualitative evaluation of transient vibration signals. The utilized raw signal in Figure 4 is obtained from an outer race bearing a defect.
The method is based on the direct analysis of the low-frequency localized bearing fault signature, since it can be easily obtained analytically. This enables the qualitative evaluation of the fault signature by effectively discriminating between different signal components. To this aim, classical envelope analysis is merged with a straight and efficient linear STFT. The envelope is computed by utilizing the absolute value of the analytical signal of Equation (5). The STFT is a windowed version of the FFT, which allows the analysis of varying frequencies over time. Equation (6) provides the expression defining the STFT:
S T F T { x ( t ) } = X ( τ , f ) = x ( t ) w ( t τ ) e j 2 π f t d t
where x ( t ) represents the analyzed vibration signal, w ( t τ ) is the window function where τ represents the location of the window. In this work, a Hanning window is applied to each segment/window (i.e., 0.4 s with a 95% overlap) to minimize spectral leakage. The output of the STFT application is a two-dimensional matrix where horizontal and vertical elements represent the time and frequency points, respectively. The major drawback of linear time-frequency domain tools lays on the resolution trade-off. Thus, a narrow frequency resolution can be achieved by utilizing wider time windows and vice versa.
The methodology includes two different signal filtering stages. The low-pass filter stage is aimed at eliminating the higher-frequency components, including noise. The band-pass filter stage removes components close to the DC band and above the spectrogram upper limit. The frequency range of interest for this study is set between 10 Hz and 500 Hz. The upper limit can be extended depending on the component to be tracked. For this work, it is set to observe approximately four multiples of the highest localized bearing signature normally corresponding to the inner race defect (i.e., 4BPFI) of the HUST dataset. The lower limit is set to effectively discriminate the DC component of the envelope. Figure 5 shows the effect of dual filtering on an inner race case example. The raw envelope STFT (i.e., Figure 5a) effectively identifies the characteristic BPFI, while the rotating frequency sidebands are not clearly identified. Figure 5b shows the signal without band-pass filtering, where a strong influence of the DC component is observed as well as some added noise in the sideband time-frequency space. Figure 5c elucidates the effect of the low-pass filter, where only noise reduction is observed. Finally, Figure 5d shows the proposed processing tool output where both the characteristic frequency BPFI and the rotating frequency sidebands are clearly observed.

4. Method Test in the HUST Dataset

The present section is aimed at testing the proposed tool by utilizing transient signals acquired during the machine start-up. To this aim, the HUST bearing dataset [33] is utilized. It consists of vibration data during both steady-state and machine run-up for different damaged bearings with artificially induced localized defects. Particularly, localized ball, inner, and outer race defect cases are analyzed. In addition, the influence of the load on the signal processing output is studied in detail.

4.1. Dataset Description and Estimation of Characteristic Frequencies

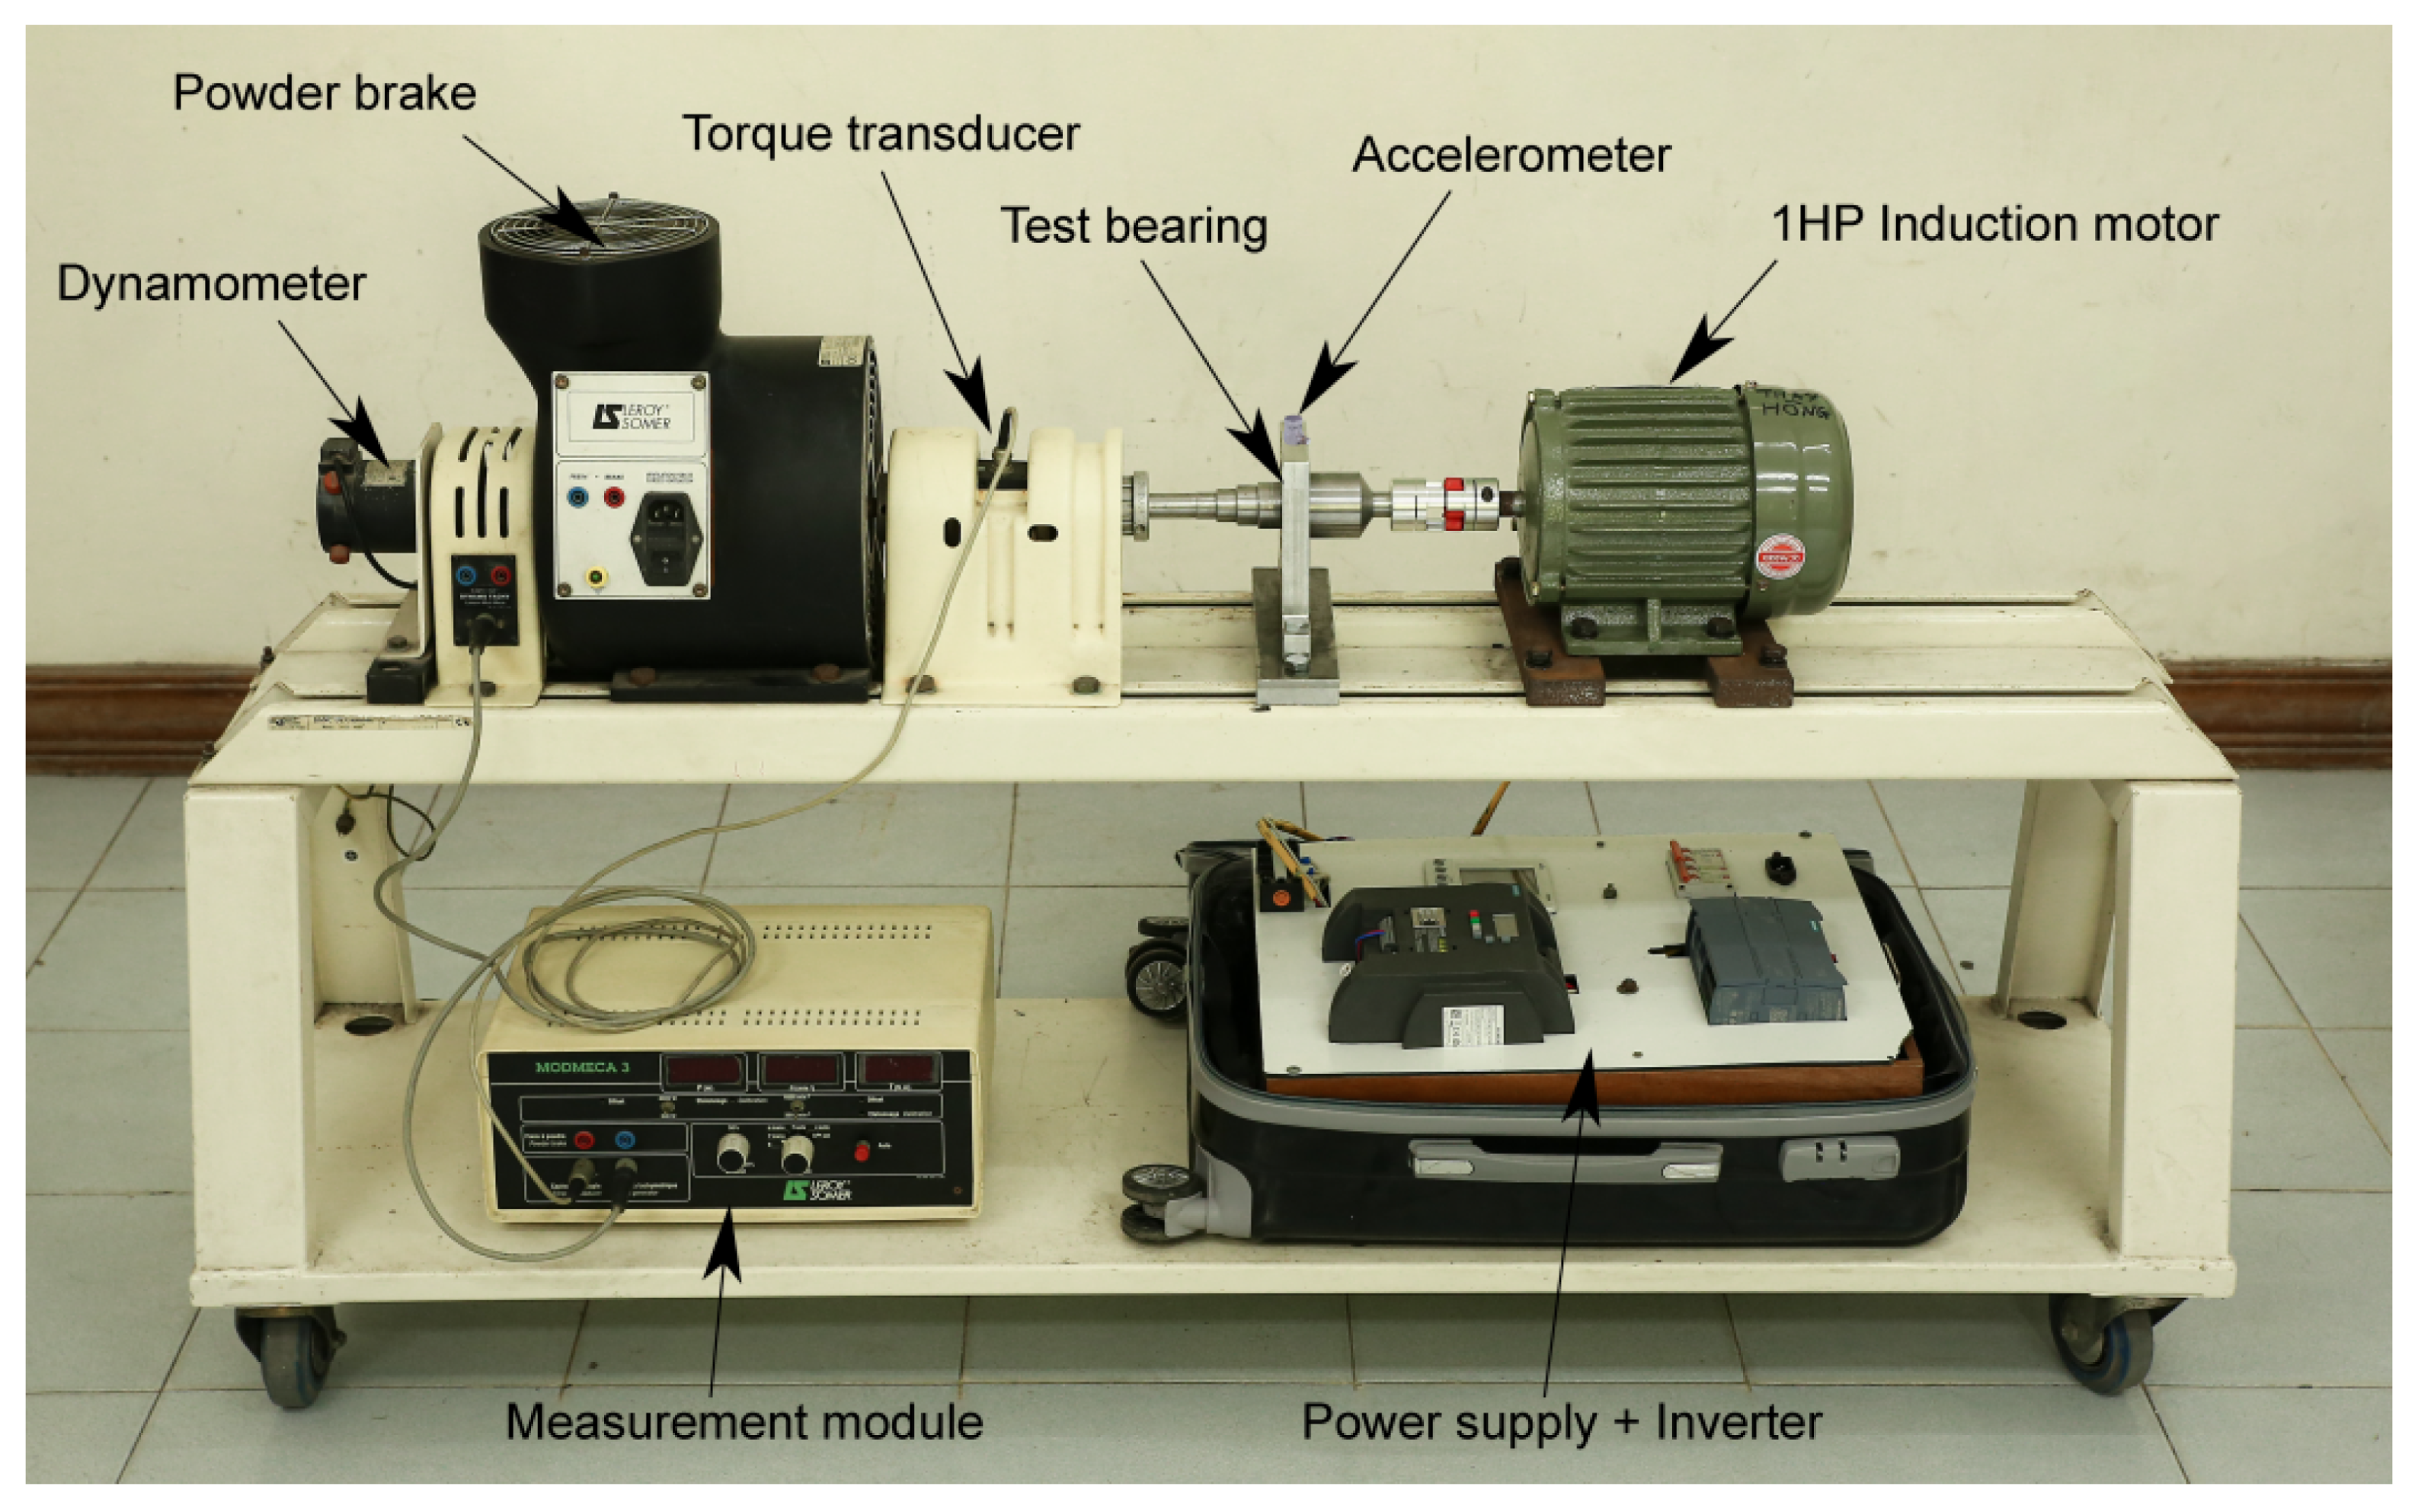
The HUST dataset laboratory setup for signal acquisition is shown in Figure 6. The bearing under test is placed in a dedicated module with an accelerometer (i.e., PCB 325C33) measuring vibration in the radial direction. The measurement is performed for three different loading points imposed by the powder brake. In addition, the set-up includes a dynamo-meter to track the speed evolution. The localized fault is artificially induced by wire-cutting the different elements creating a micro-crack of 0.2 mm. A total of five bearings from the same manufacturer are tested in the dataset. Table 1 shows the provided bearing features and the estimated geometry parameters for each bearing under test. By utilizing the geometry data and assuming θ = 0 , it is possible to estimate the characteristic fault frequencies analytically. Equations (1)–(4) provide the expressions for analytical calculation. These equations can be divided into a coefficient that depends on the geometry and the fundamental shaft frequency f r . Table 2 provides the estimated characteristic fault coefficients for each bearing under test.

4.2. Identification of Characteristic Frequencies during Transient

The present subsection is aimed at the detailed analysis of characteristic fault frequencies during machine run-up. The content is divided by the three single-localized faults (i.e., inner and outer races, and rolling element). Four bearings are analyzed due to space limitations and the poor quality of some signals in the database. The displayed signals are analyzed under zero imposed load conditions. The one-dimensional envelope spectrum is obtained by utilizing the pure steady-state signals provided in the database, while the two-dimensional spectrograms are obtained by utilizing the displayed transient time domain signal.

4.2.1. Outer Race Bearing Fault

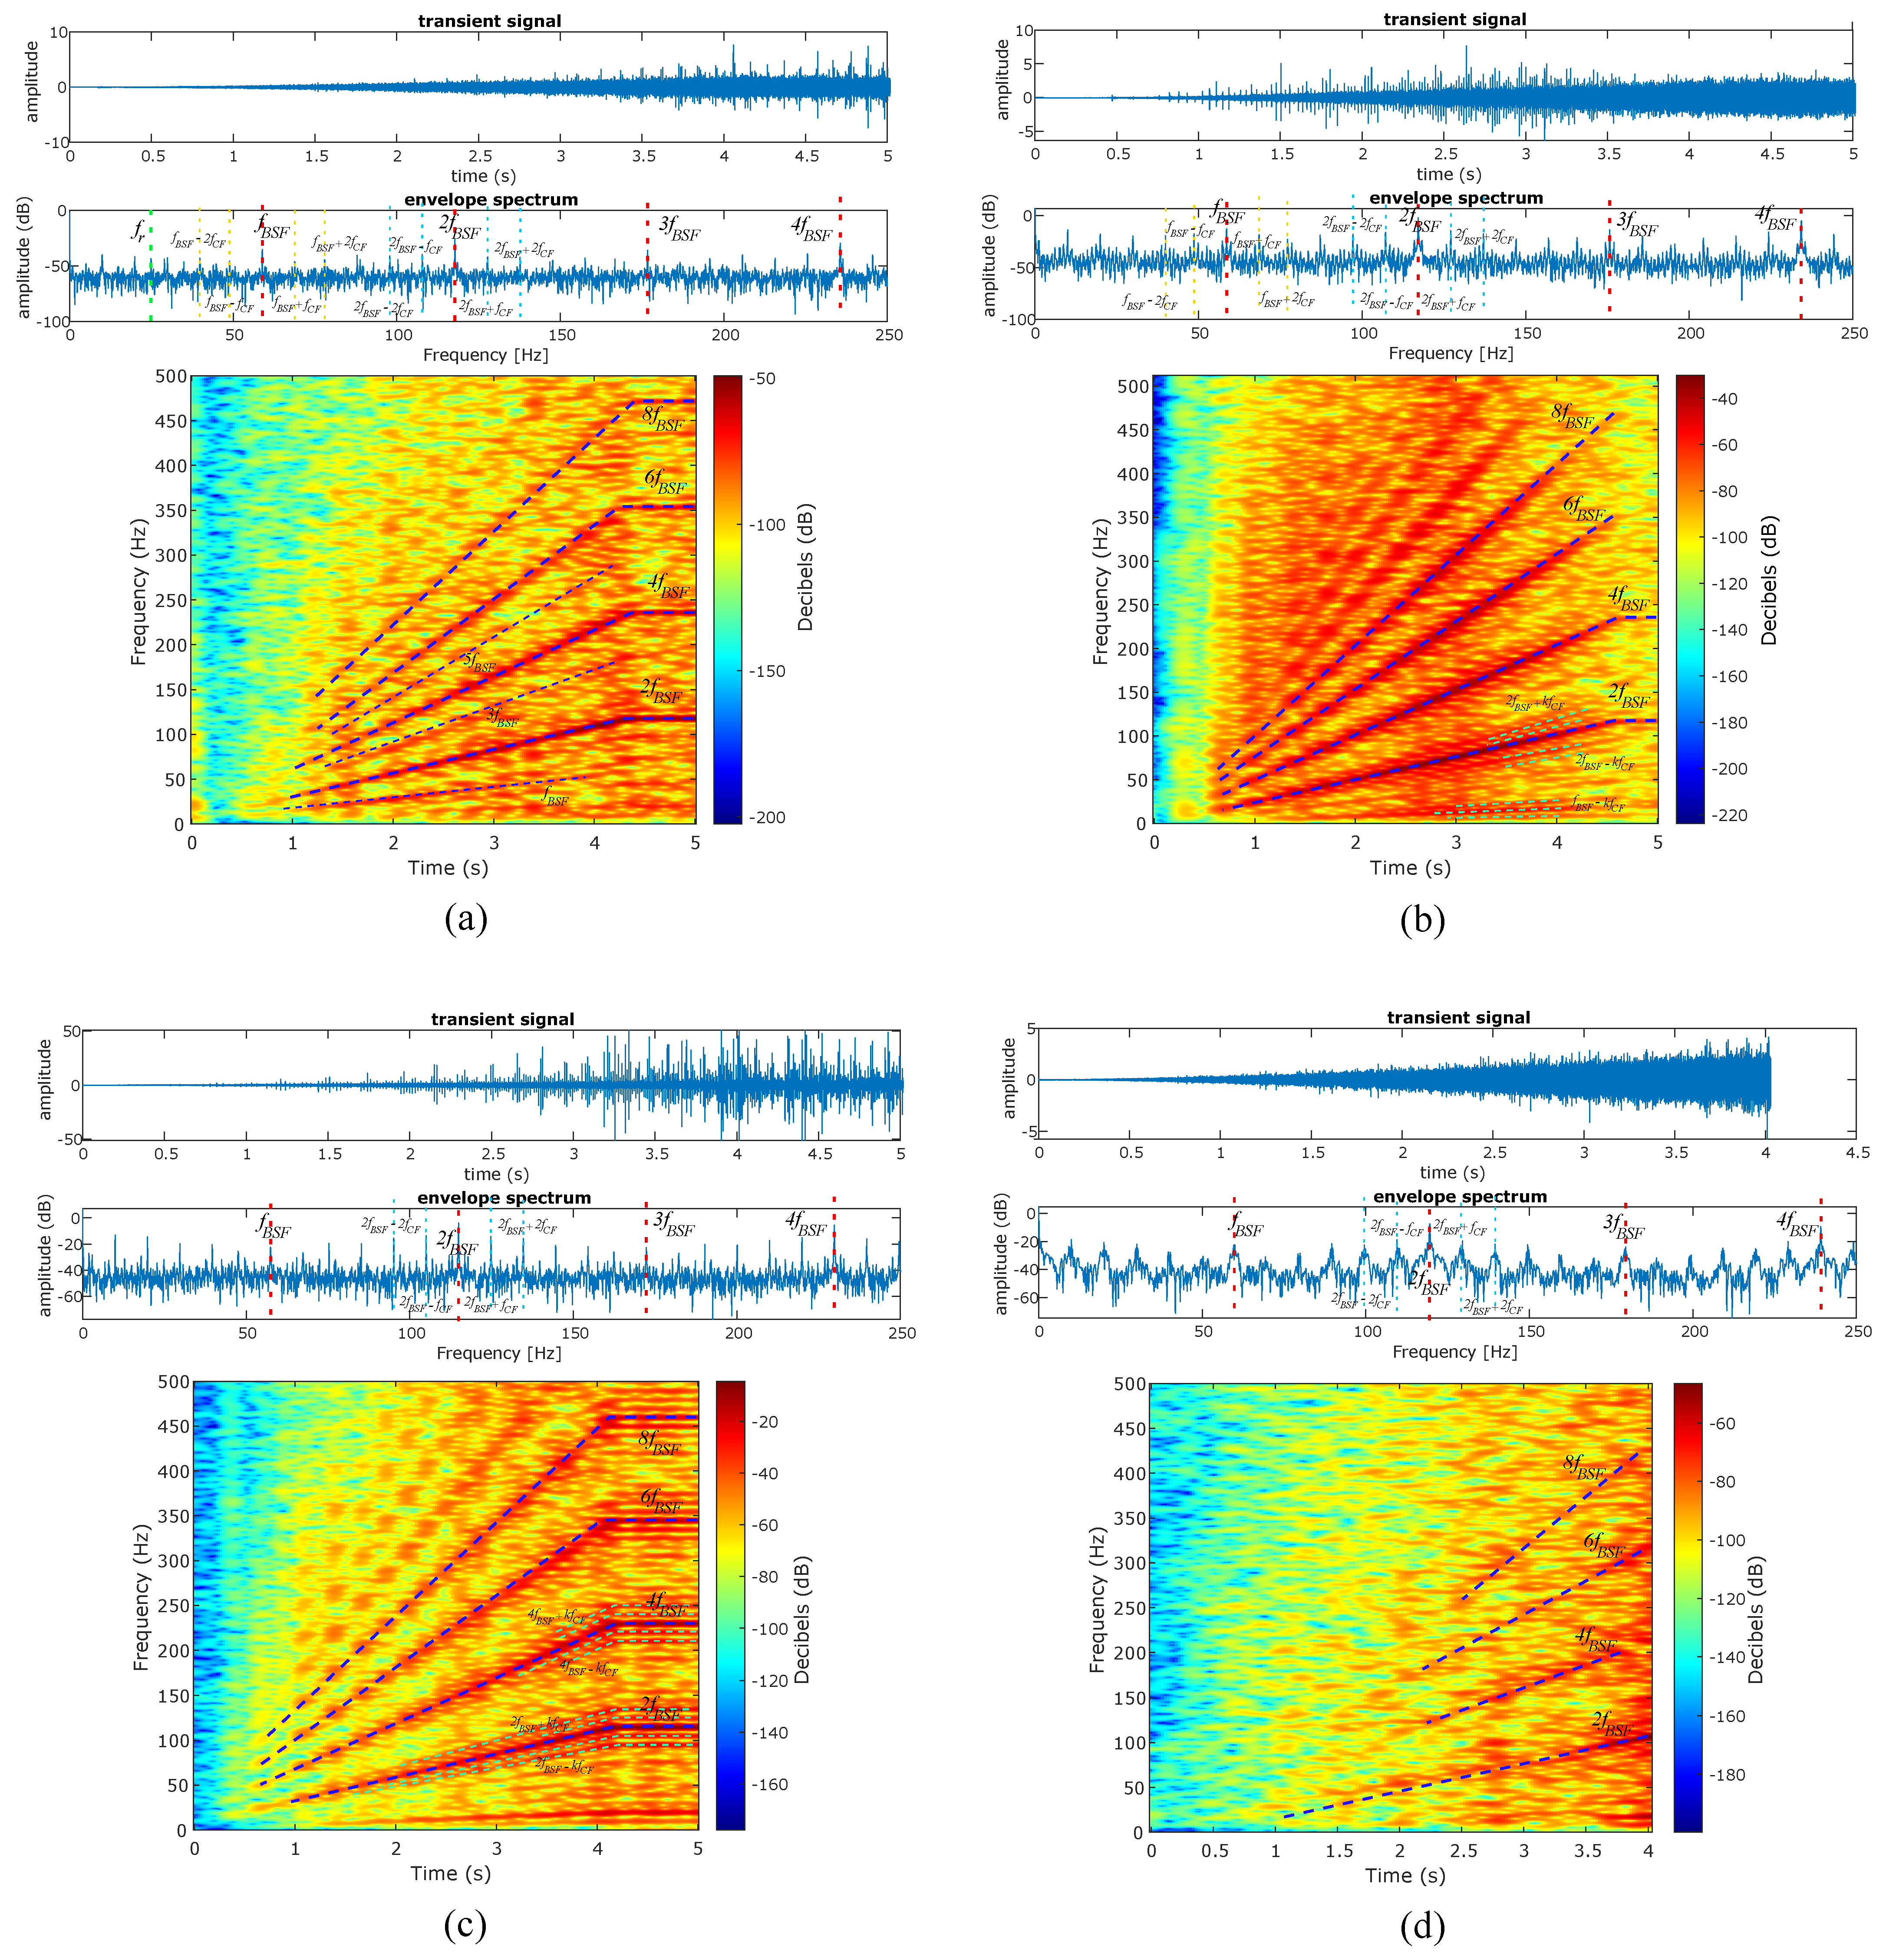
Figure 7 shows the analysis results for outer races bearing faults in different bearings. The immediate observation is the clear differentiation of the characteristic outer race fault frequency f B P F O . In addition, the rotation frequency and some of its multiples is identified for 6205 and 6205 bearing types. A lighter trend identification is observed in Figure 7c, probably due to the low amplitude of the overall signal. Figure 7d clearly shows the fault trend while the multiples of the rotating frequency are minimized.

4.2.2. Inner Race Bearing Fault

The transient trends of inner race bearing faults are observed in Figure 8. The transient analysis via STFT clearly shows the identification of the characteristic inner race fault frequency f B P F I and its side-bands provided by f B P F I ± k f r ; k = 1 , 2 , , n . The main drawback of the STFT time-frequency representation regarding side-band identification is the overlap between rotation components and these fault related frequencies. A clear example of this phenomenon is observed in Figure 8a, where the two components are coincident in the time-frequency map. However, other examples clearly differentiate between rotation and bearing fault related side-bands as observed in Figure 8b–d.

4.2.3. Rolling Element Bearing Fault

Figure 9 shows the evolution of rolling element related components during the machine run-up. The characteristic ball spin frequencies f B S F are identified for all bearings under study. Note that even multiples of this frequency show higher amplitudes, while the odd multiples are not easily observed during both steady-state and transient. The rotation frequencies are not normally observed in the case of rolling element defects, while several side-bands around f B S F are present in the time-frequency representation. These side-bands are normally given by f B S F ± k f C F ; k = 1 , 2 , , n . Note that the f C F modulation is severe in the case of localized rolling element defects as shown in Figure 9. However, these are difficult to identify during the run-up due to the proximity to f B S F . In the case of Figure 9d, the signal possess little overall energy and this hinders the identification of the ball spin frequency components.

4.3. Load Variation Effect

The variation in the mechanical load in the shaft could affect the bearing radial load distribution and affect the amplitude of the different faulty components. This subsection is devoted to address the load variation effect on the different faulty components during the machine run-up. In addition, the variation in the load will affect the rotation speed in the case of induction machine actuation and, thus, the fault signature location is shifted for different load points. Figure 10 shows the time-frequency representation during run-up for the three faults under study in three different bearings. The load does not fade the fault pattern and only influences the overall amplitude and the location of the faults. However, the color maps of the 400 W spectrograms are more intense. The reason behind is the increased contrast between maximum and minimum vales. While the maximum vales are approximately constant for all load levels, the minimum dB vale is reduced for increased load.

5. Transfer Path Influence

The present section is aimed at analyzing the effect of the mechanical transfer path on the linear time-frequency representation of localized bearing faults. The energy shocks originated in the bearing due to the contact of the different elements and the defect may be attenuated when the signal is not acquired in the bearing surroundings. This attenuation heavily depends on the mechanical transfer path, which can be described as a transfer function that amplifies or attenuates the mechanical signal between excitation and acquisition points. This is critical for machinery with no direct access to the bearing surroundings, as in the case of common electrical rotating machinery. The mechanical transfer path or function is complex and difficult to determine (e.g., the transfer function is normally determined by performing experimental modal analysis). To elucidate this issue for the proposed time-frequency representation, the well known CWRU dataset is utilized, where the signals are acquired in different points of the machine housing and base.

5.1. CWRU Dataset Description

The CWRU bearing dataset represents the baseline for many engineering applications dealing with ball bearing diagnosis [37]. It includes data for three different localized bearing faults, including ball, inner, and outer race defects. Four different fault diameters are implemented to quantify the severity of the fault. Nevertheless, only the smallest defect is utilized in this work, since it represents an incipient defect scenario. The different bearing faults are implemented by utilizing electro-discharge machining to carve the different defect diameters. Figure 11 depicts the test bench for vibration data acquisition. The sensors are placed at 12 o’clock position in the Drive End (DE) and Non-Drive End (NDE) positions. In addition, an additional sensor is placed in the base of the motor. The vibration signals utilized for this work are sampled at 12k samples per second. The present study utilizes DE faulty bearings to address the transfer path influence on the proposed time-frequency representation. The characteristic coefficients and specifications for the studied bearing are shown in Table 3. Note that the dataset only contains steady-state data and the transient evolution cannot be assessed.

5.2. Outer Race Bearing Fault

The present subsection studies the impact of the mechanical transfer path for an outer race localized bearing fault scenario. In the outer race defect case, three positions are available in the dataset since these are stationary (i.e., the defect relative position with respect the shaft is constant). The centered case is selected for the present study, since it provides a representative fault signature and is better determined analytically by utilizing Equation (1). Figure 12 shows the analysis of the outer race fault scenario for a no-load case. The raw time-domain signal, the envelope spectrum and the proposed time-frequency representation are displayed in order to analyze the fault signature. The characteristics f r and f B P F O and their multiples are clearly visible in all time-frequency maps. However, a significant amplitude attenuation is observed in the NDE and base cases as pointed out by the envelope spectrum. The effect of the attenuation in the time-frequency map is observed as increased image noise and the possible masking of f r higher multiples. In any case, the characteristic fault frequency is easily identified in all three sampling points for the present case study. Table 4 shows the quantitative comparison of the f B P F O amplitude for different levels of load depending on the sampling position. The attenuation due to the mechanical transfer path is clearly visible independently of the shaft load level.

5.3. Inner Race Bearing Fault

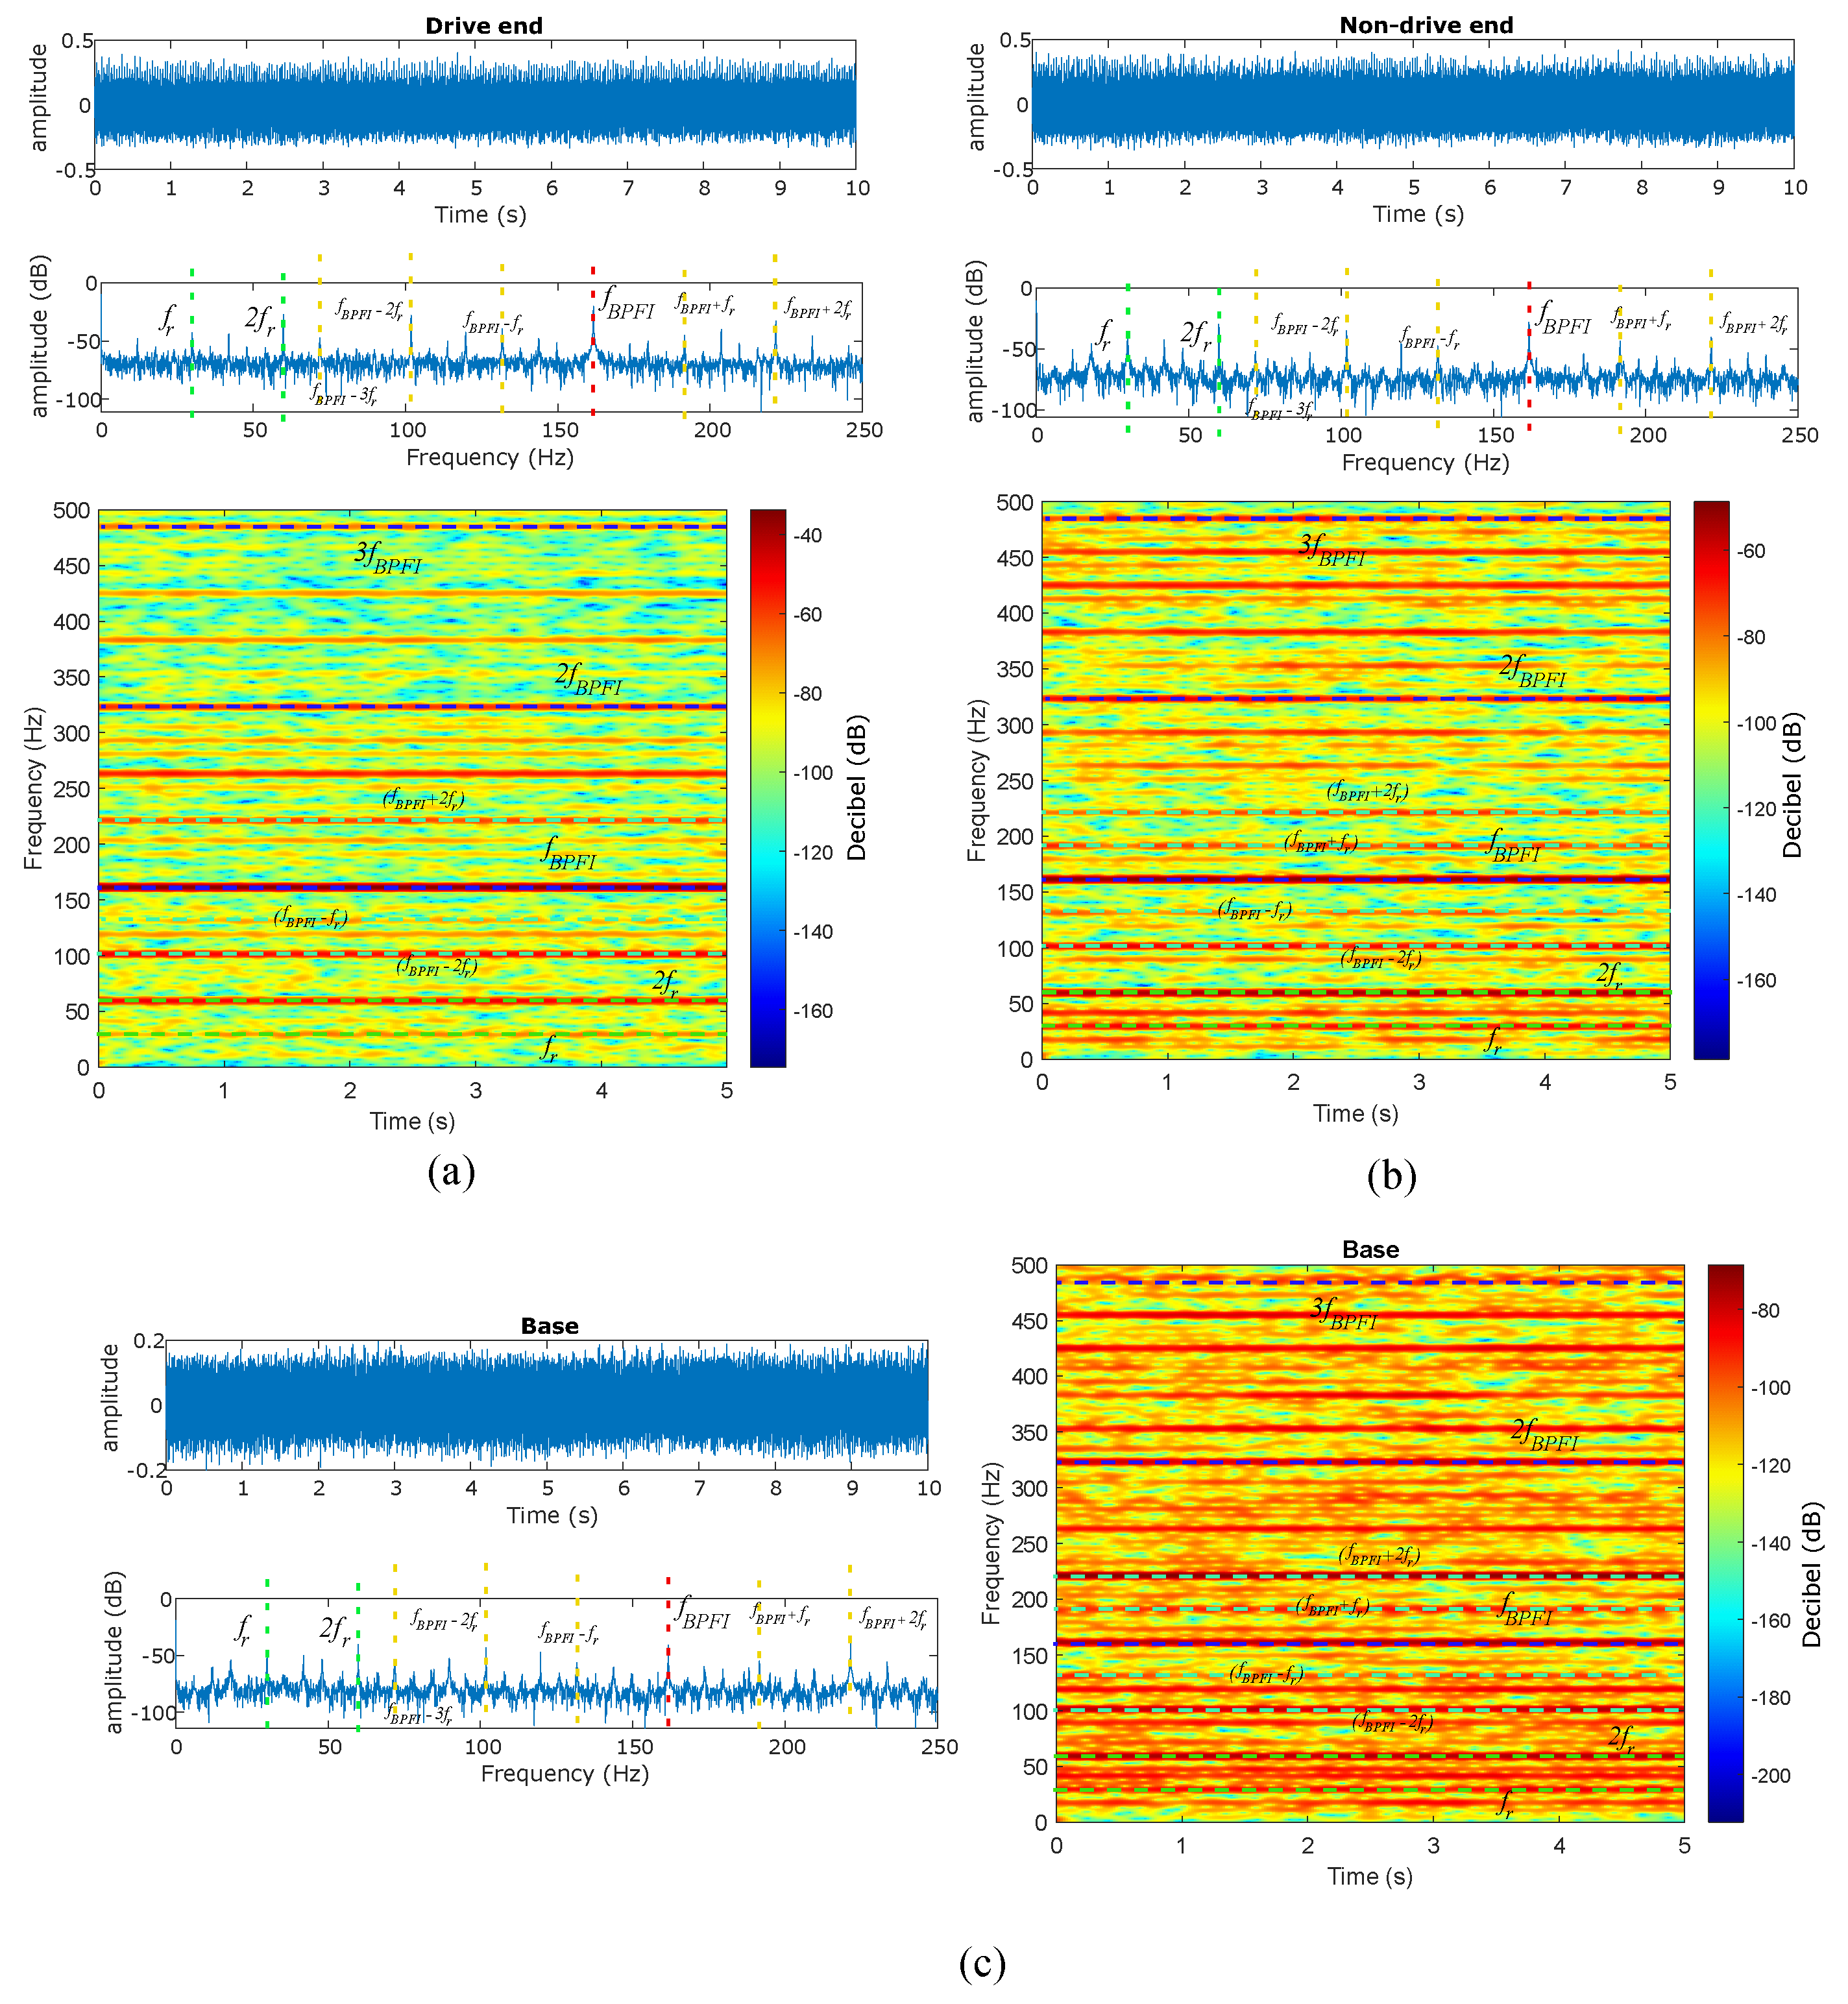
Figure 13 shows the raw time domain signal, envelope analysis and proposed time-frequency representation for a a localized inner race defect case study. The characteristic f B P F I is clearly observable independently of the sampling position. Moreover, the characteristic side-bands f B P F I ± k f r ; k = 1 , 2 , , n are also observed for all acquisition positions. The component f B P F I ± f r is more prominently discernible in remote positions, signifying that the relative amplitude of the sidebands in relation to the main frequency f B P F I is higher at these locations. This observation suggests the presence of irregular attenuation across all significant components. However, the DE spectrogram posses the best signal to noise ratio in comparison with the NDE and base acquisition cases. Table 5 shows the quantitative comparison for all acquisition points at different load levels for the main characteristic frequency f B P F I and the closest side-band f B P F I ± f r . In the DE location, the side-band components show higher amplitude levels for increased load levels, while the f B P F I shows slightly higher amplitude levels for different load levels. Thus, the side-bands will be better observed in the time-frequency domain for increased load levels. This trend is not observed for remote acquisition locations, where no evident trend is observed.

5.4. Rolling Element Bearing Fault

The rolling element localized fault signature is not properly observed in the present case study. Figure 14 shows the raw time domain signals, the envelope spectrum, and the three proposed time-frequency representations for each acquisition location. The spectrum is very flat in the case of the DE sampling point and, thus, the characteristic f B S F is not identified. Signals obtained from the NDE and base reveal the presence of rotation multiples, which are not typically associated with rolling element faults. The analysis suggests that localized rolling element defects are better detected when acquiring the signal in the bearing surroundings. Nevertheless, this can vary depending on the specific case by considering different bearing types, machine or sensors. The inability to qualitatively identify this type of defect highlights the method limitations, which highly depend on the signal quality and defect signature.

6. Discussion

The present section discusses and summarizes the presented results. In addition, it qualitatively compares the results with other literature contributions, where potential opportunities for future applications are identified. The presented signal processing pipeline properly identifies qualitative trends of localized bearing fault signatures during an electrical machine start-up when this is exited via an inverter. This statement is supported by the results presented in Figure 7, Figure 8, Figure 9 and Figure 10 for different localized bearing faults. However, the method provides satisfactory results only when the fault signature is highly present in the signal, as demonstrated by the analysis of the mechanical transfer path results.
The method offers an efficient and easy-to-implement solution in comparison with other physical time-frequency representation methodologies [24,30]. Moreover, signal resampling and, thus, the dependency on the varying speed is avoided [31]. The detailed comparison among different time-frequency representations is provided in references [28,32]. The present tool is custom designed for the identification of characteristic failure components evolutions with their sidebands/modulations during the machine start-up, which is not found in the literature to the authors’ best knowledge. Furthermore, the physical representation of the characteristic fault components presents interesting features for automatic detection. The tool may find application to generate time-frequency maps to be input in Convolutional Neural Network (CNN) architectures, as observed in works such as [38,39]. The accuracy of automatic detection algorithms is, to some extent, contingent on the careful selection of an appropriate signal processing tool, as highlighted in [40]. The computation efficiency while generating time-frequency maps of a large amount of data are critical and, thus, the present method presents an interesting trade-off between computational efficiency and physical representation of the failure phenomena.

7. Conclusions

The present work introduces and tests a straight and efficient methodology to analyze the fault signature of localized bearing faults during rotating machinery start-up via vibration signals. The method is mainly tested by utilizing the HUST dataset, where the method effectively identifies qualitative trends for inner, outer race, and ball defects. Note that this holds for electrical machines fed via inverter with smooth rotation start-up. The method is consistent for all considered load conditions. The influence of the mechanical transfer path is analyzed to further highlight the method robustness and limitations. To this aim, the well-known CWRU dataset is utilized, where the vibration signal is sampled in three different locations. This analysis emphasizes the importance of proper sensor location to enhance the defect signature in the signal. Thus, the method clearly identifies inner and outer race defects for the closest position to the faulty bearing, while the signature is weakened for more remote acquisition locations. The rolling element fault is not properly identified in the CWRU sampling points. The proposed methodology brings interesting features when the evolution of characteristic bearing faults is of interest. This is interesting for the detection of faults during the machine start-up and the differentiation between different fault signatures (e.g., discrimination between localized bearing faults, misalignments, or mass unbalances). However, the method is not sensitive to weak fault signatures, where more complex processing tools may be required. In addition, the tracking of rotation frequencies via vibration signals when the machine is directly fed or excited via soft-starter poses further challenges. The utilization of open-source datasets to perform the initial experiments for the proposed methodology enables the easy and fast replication of the presented results.
Future work on the topic includes the method test for rotating machines of different sizes, custom laboratory work with directly fed or soft-started machines, and the simultaneous analysis of different faults during the machine start-up via vibration and electrical magnitudes. Further steps also include the utilization of more complex time-frequency tools, such as MUSIC or wavelet transformations, to track bearing fault signature evolutions. In addition, the proposed method could be integrated within automatic detection algorithms, including deep learning, where features from time-frequency maps are automatically extracted.

Author Contributions

Conceptualization, J.E.R.-S. and J.A.A.-D.; methodology, J.E.R.-S.; software, J.E.R.-S.; validation, J.E.R.-S.; formal analysis, J.E.R.-S. and J.A.A.-D.; investigation, J.E.R.-S.; resources, J.E.R.-S. and J.A.A.-D.; data curation, J.E.R.-S.; writing—original draft preparation, J.E.R.-S.; writing—review and editing, J.E.R.-S., J.A.A.-D. and C.M.; visualization, J.E.R.-S.; supervision, J.A.A.-D. and C.M.; project administration, J.A.A.-D. and C.M.; funding acquisition, C.M. All authors have read and agreed to the published version of the manuscript.

Funding

This research was funded by the European Commission (HORIZON Program) within the context of the DITARTIS Project (“Network of Excellence in Digital Technologies and AI Solutions for Electromechanical and Power Systems Applications”) under the Call HORIZON-WIDERA-2021-ACCESS-03 (Grant Number 101079242).

Data Availability Statement

Dataset 1: The data presented in this study are openly available in Mendeley Data at 10.17632/cbv7jyx4p9.3 [33]. Dataset 2: Publicly available datasets were analyzed in this study. This data can be found here: https://engineering.case.edu/bearingdatacenter/download-data-file.

Conflicts of Interest

The authors declare no conflicts of interest.

References

  1. Albrecht, P.; Appiarius, J.; McCoy, R.; Owen, E.; Sharma, D. Assessment of the reliability of motors in utility applications-Updated. IEEE Trans. Energy Convers. 1986, EC-1, 39–46. [Google Scholar] [CrossRef]
  2. Nandi, S.; Toliyat, H.A.; Li, X. Condition monitoring and fault diagnosis of electrical motors—A review. IEEE Trans. Energy Convers. 2005, 20, 719–729. [Google Scholar] [CrossRef]
  3. Orlowska-Kowalska, T.; Wolkiewicz, M.; Pietrzak, P.; Skowron, M.; Ewert, P.; Tarchala, G.; Krzysztofiak, M.; Kowalski, C.T. Fault diagnosis and fault-tolerant control of PMSM drives–state of the art and future challenges. IEEE Access 2022, 10, 59979–60024. [Google Scholar] [CrossRef]
  4. Khan, M.A.; Asad, B.; Kudelina, K.; Vaimann, T.; Kallaste, A. The Bearing Faults Detection Methods for Electrical Machines—The State of the Art. Energies 2022, 16, 296. [Google Scholar] [CrossRef]
  5. ISO 10816-2:1996; Mechanical Vibration—Evaluation of Machine Vibration by Measurements on Non-Rotating Parts. ISO: Geneva, Switzerland, 1996.
  6. Schoen, R.R.; Habetler, T.G.; Kamran, F.; Bartfield, R. Motor bearing damage detection using stator current monitoring. IEEE Trans. Ind. Appl. 1995, 31, 1274–1279. [Google Scholar] [CrossRef]
  7. Benbouzid, M.E.H. A review of induction motors signature analysis as a medium for faults detection. IEEE Trans. Ind. Electron. 2000, 47, 984–993. [Google Scholar] [CrossRef]
  8. Bellini, A.; Filippetti, F.; Tassoni, C.; Capolino, G.A. Advances in diagnostic techniques for induction machines. IEEE Trans. Ind. Electron. 2008, 55, 4109–4126. [Google Scholar] [CrossRef]
  9. Haddad, R.Z.; Lopez, C.A.; Pons-Llinares, J.; Antonino-Daviu, J.; Strangas, E.G. Outer race bearing fault detection in induction machines using stator current signals. In Proceedings of the 2015 IEEE 13th International Conference on Industrial Informatics (INDIN), Cambridge, UK, 22–24 July 2015; pp. 801–808. [Google Scholar]
  10. Cureno-Osornio, J.; Zamudio-Ramirez, I.; Saucedo-Dorantes, J.J.; Osornio-Rios, R.A.; Antonino-Daviu, J.A. Outer Bearing Race Diagnosis by Means of Stray Flux Signals and Shannon Entropy. In Proceedings of the 2023 IEEE 14th International Symposium on Diagnostics for Electrical Machines, Power Electronics and Drives (SDEMPED), Chania, Greece, 28–31 August 2023; pp. 397–402. [Google Scholar]
  11. Randal, R. Vibration-Based Condition Monitoring Industrial, Aerospace and Automotive Applications; John Wiley & Sons, Ltd.: Hoboken, NJ, USA, 2011; Volume 2. [Google Scholar]
  12. McFadden, P.; Smith, J. Model for the vibration produced by a single point defect in a rolling element bearing. J. Sound Vib. 1984, 96, 69–82. [Google Scholar] [CrossRef]
  13. Ugwiri, M.A.; Mpia, I.; Lay-Ekuakille, A. Vibrations for fault detection in electric machines. IEEE Instrum. Meas. Mag. 2020, 23, 66–72. [Google Scholar] [CrossRef]
  14. Junsheng, C.; Dejie, Y.; Yu, Y. A fault diagnosis approach for roller bearings based on EMD method and AR model. Mech. Syst. Signal Process. 2006, 20, 350–362. [Google Scholar] [CrossRef]
  15. Prabhakar, S.; Mohanty, A.R.; Sekhar, A. Application of discrete wavelet transform for detection of ball bearing race faults. Tribol. Int. 2002, 35, 793–800. [Google Scholar] [CrossRef]
  16. Randall, R.B.; Antoni, J.; Chobsaard, S. A comparison of cyclostationary and envelope analysis in the diagnostics of rolling element bearings. In Proceedings of the 2000 IEEE International Conference on Acoustics, Speech, and Signal Processing. Proceedings (Cat. No. 00CH37100), Istanbul, Turkey, 5–9 June 2000; Volume 6, pp. 3882–3885. [Google Scholar]
  17. Antonino-Daviu, J. Electrical monitoring under transient conditions: A new paradigm in electric motors predictive maintenance. Appl. Sci. 2020, 10, 6137. [Google Scholar] [CrossRef]
  18. Rai, A.; Upadhyay, S.H. A review on signal processing techniques utilized in the fault diagnosis of rolling element bearings. Tribol. Int. 2016, 96, 289–306. [Google Scholar] [CrossRef]
  19. Antoni, J.; Bonnardot, F.; Raad, A.; El Badaoui, M. Cyclostationary modelling of rotating machine vibration signals. Mech. Syst. Signal Process. 2004, 18, 1285–1314. [Google Scholar] [CrossRef]
  20. Guo, Y.; Liu, T.W.; Na, J.; Fung, R.F. Envelope order tracking for fault detection in rolling element bearings. J. Sound Vib. 2012, 331, 5644–5654. [Google Scholar] [CrossRef]
  21. Coats, M.D.; Randall, R.B. Single and multi-stage phase demodulation based order-tracking. Mech. Syst. Signal Process. 2014, 44, 86–117. [Google Scholar] [CrossRef]
  22. Zhao, M.; Lin, J.; Xu, X.; Lei, Y. Tacholess envelope order analysis and its application to fault detection of rolling element bearings with varying speeds. Sensors 2013, 13, 10856–10875. [Google Scholar] [CrossRef]
  23. Liu, D.; Cheng, W.; Wen, W. Generalized demodulation with tunable E-Factor for rolling bearing diagnosis under time-varying rotational speed. J. Sound Vib. 2018, 430, 59–74. [Google Scholar] [CrossRef]
  24. Romero-Troncoso, R.; Garcia-Perez, A.; Morinigo-Sotelo, D.; Duque-Perez, O.; Osornio-Rios, R.; Ibarra-Manzano, M. Rotor unbalance and broken rotor bar detection in inverter-fed induction motors at start-up and steady-state regimes by high-resolution spectral analysis. Electr. Power Syst. Res. 2016, 133, 142–148. [Google Scholar] [CrossRef]
  25. Morinigo-Sotelo, D.; Romero-Troncoso, R.d.J.; Panagiotou, P.A.; Antonino-Daviu, J.A.; Gyftakis, K.N. Reliable detection of rotor bars breakage in induction motors via MUSIC and ZSC. IEEE Trans. Ind. Appl. 2017, 54, 1224–1234. [Google Scholar] [CrossRef]
  26. Delgado-Arredondo, P.A.; Morinigo-Sotelo, D.; Osornio-Rios, R.A.; Avina-Cervantes, J.G.; Rostro-Gonzalez, H.; de Jesus Romero-Troncoso, R. Methodology for fault detection in induction motors via sound and vibration signals. Mech. Syst. Signal Process. 2017, 83, 568–589. [Google Scholar] [CrossRef]
  27. Climente-Alarcon, V.; Antonino-Daviu, J.; Riera-Guasp, M.; Pons-Llinares, J.; Roger-Folch, J.; Jover-Rodriguez, P.; Arkkio, A. Transient tracking of low and high-order eccentricity-related components in induction motors via TFD tools. Mech. Syst. Signal Process. 2011, 25, 667–679. [Google Scholar] [CrossRef]
  28. Fernandez-Cavero, V.; Morinigo-Sotelo, D.; Duque-Perez, O.; Pons-Llinares, J. A comparison of techniques for fault detection in inverter-fed induction motors in transient regime. IEEE Access 2017, 5, 8048–8063. [Google Scholar] [CrossRef]
  29. Sierra-Alonso, E.F.; Caicedo-Acosta, J.; Orozco Gutiérrez, Á.Á.; Quintero, H.F.; Castellanos-Dominguez, G. Short-time/-angle spectral analysis for vibration monitoring of bearing failures under variable speed. Appl. Sci. 2021, 11, 3369. [Google Scholar] [CrossRef]
  30. Shi, J.; Liang, M.; Guan, Y. Bearing fault diagnosis under variable rotational speed via the joint application of windowed fractal dimension transform and generalized demodulation: A method free from prefiltering and resampling. Mech. Syst. Signal Process. 2016, 68, 15–33. [Google Scholar] [CrossRef]
  31. Mauricio, A.; Smith, W.A.; Randall, R.B.; Antoni, J.; Gryllias, K. Improved Envelope Spectrum via Feature Optimisation-gram (IESFOgram): A novel tool for rolling element bearing diagnostics under non-stationary operating conditions. Mech. Syst. Signal Process. 2020, 144, 106891. [Google Scholar] [CrossRef]
  32. Feng, Z.; Liang, M.; Chu, F. Recent advances in time–frequency analysis methods for machinery fault diagnosis: A review with application examples. Mech. Syst. Signal Process. 2013, 38, 165–205. [Google Scholar] [CrossRef]
  33. Thuan, N.D.; Hong, H.S. HUST bearing: A practical dataset for ball bearing fault diagnosis. arXiv 2023, arXiv:2302.12533. [Google Scholar] [CrossRef]
  34. Loparo, K. Bearings Vibration Data Sets; Case Western Reserve University Bearing Data Center, Case Western Reserve University: Cleveland, OH, USA, 2012; pp. 22–28. [Google Scholar]
  35. Randall, R.B.; Antoni, J. Rolling element bearing diagnostics—A tutorial. Mech. Syst. Signal Process. 2011, 25, 485–520. [Google Scholar] [CrossRef]
  36. Stack, J.R.; Habetler, T.G.; Harley, R.G. Fault classification and fault signature production for rolling element bearings in electric machines. IEEE Trans. Ind. Appl. 2004, 40, 735–739. [Google Scholar] [CrossRef]
  37. Smith, W.A.; Randall, R.B. Rolling element bearing diagnostics using the Case Western Reserve University data: A benchmark study. Mech. Syst. Signal Process. 2015, 64, 100–131. [Google Scholar] [CrossRef]
  38. Ding, A.; Qin, Y.; Wang, B.; Cheng, X.; Jia, L. An Elastic Expandable Fault Diagnosis Method of Three-Phase Motors Using Continual Learning for Class-Added Sample Accumulations. IEEE Trans. Ind. Electron. 2023. [Google Scholar] [CrossRef]
  39. Abudurexiti, Y.; Han, G.; Liu, L.; Zhang, F.; Wang, Z.; Peng, J. Graph-guided Higher-Order Attention Network for Industrial Rotating Machinery Intelligent Fault Diagnosis. IEEE Trans. Ind. Inform. 2023. [Google Scholar] [CrossRef]
  40. Chen, Z.; Mauricio, A.; Li, W.; Gryllias, K. A deep learning method for bearing fault diagnosis based on cyclic spectral coherence and convolutional neural networks. Mech. Syst. Signal Process. 2020, 140, 106683. [Google Scholar] [CrossRef]
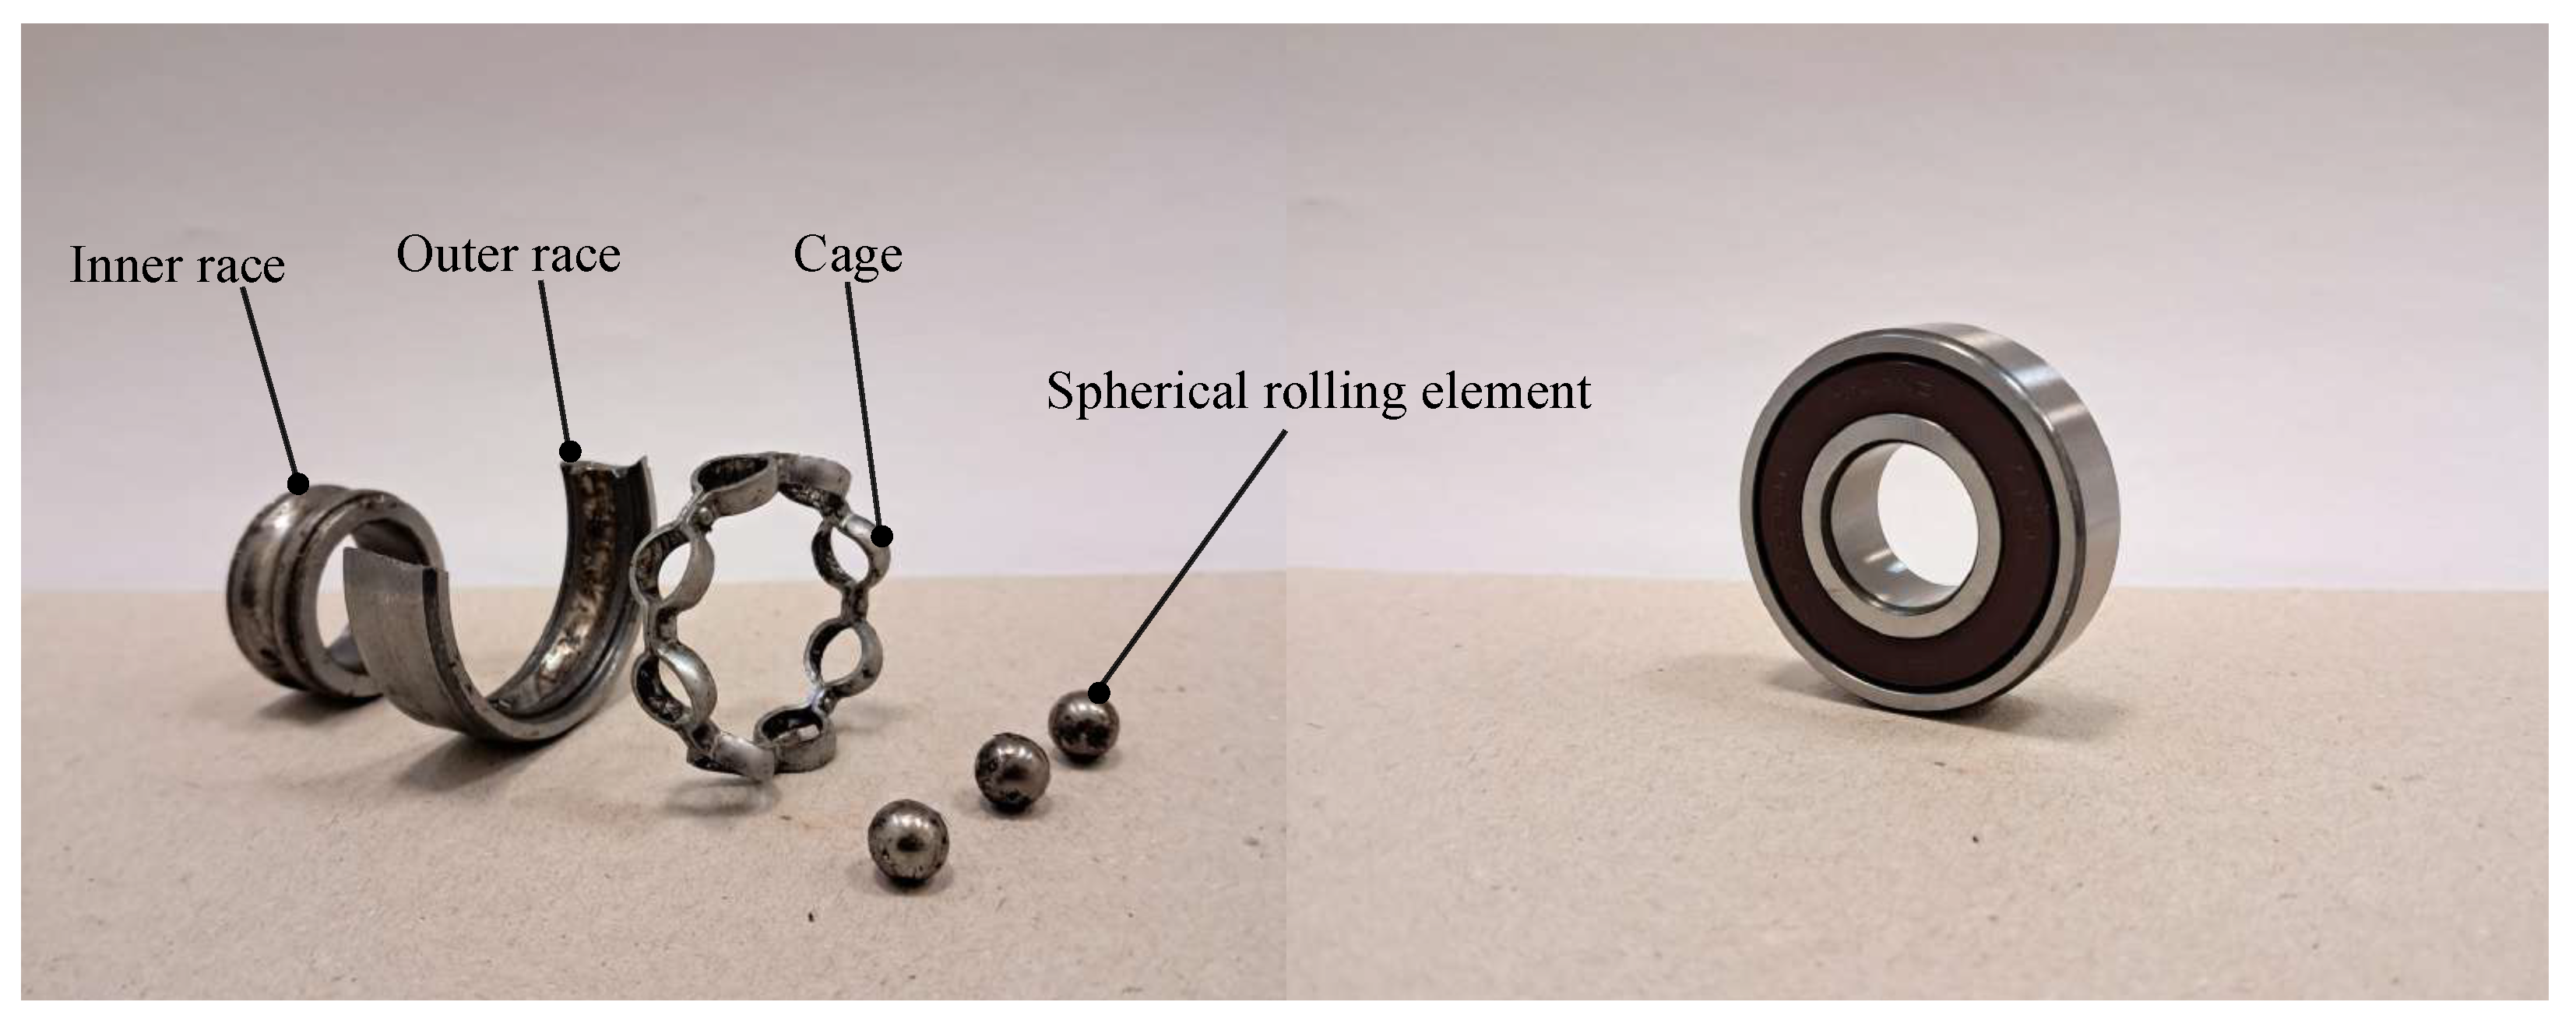
Figure 1. Real bearing disassembly including its different constructional elements and a fully assembled version.
Electronics 13 00375 g001
Figure 2. Spherical rolling element bearing with geometrical features where d i n and d o u t represent the inner and outer diameter, respectively.
Electronics 13 00375 g002
Figure 3. Modulated signal and envelope in time (a), and frequency domains (b), f c a r r = 100 Hz, f m o d = 10 Hz, A c a r r = A m o d = 1 .
Electronics 13 00375 g003
Figure 4. Proposed signal processing pipeline for the identification of localized bearing fault evolution during rotating machine start-up including signal steps for an outer race defect scenario.
Electronics 13 00375 g004
Figure 5. Filter effect description for an inner race fault scenario. (a) Raw envelope STFT, (b) absence of band-pas filter, (c) absence of low-pass filter, (d) proposed method.
Electronics 13 00375 g005
Figure 6. HUST dataset test-bench [33].
Electronics 13 00375 g006
Figure 7. Outer race localized fault discrimination during machine start-up at no-load; bearing type (a) 6204, (b) 6205, (c) 6206, (d) 6207.
Electronics 13 00375 g007
Figure 8. Inner race localized fault discrimination during machine start-up at no-load; bearing type (a) 6204, (b) 6205, (c) 6206, (d) 6208.
Electronics 13 00375 g008
Figure 9. Rolling element localized fault discrimination during machine start-up at no-load; bearing type (a) 6205, (b) 6206, (c) 6207, (d) 6208.
Electronics 13 00375 g009
Figure 10. Effect of load variation for different bearings and faults. (a) Outer race localized bearing fault in 6207, (b) inner race localized bearing fault in 6206, (c) rolling element localized bearing fault in 6207. The first, second, and third row represent the no-load, 200 W, and 400 W load, respectively.
Electronics 13 00375 g010
Figure 11. CWRU test bench for vibration data acquisition in base, Non-drived end (NDE) and Drived-end (DE). Reconstruction from [34].
Electronics 13 00375 g011
Figure 12. Outer race bearing localized fault analysis for three different sampling points, (a) DE position, (b) NDE position, (c) base position; outer race in centered position at zero load; f r = 29.93 Hz.
Electronics 13 00375 g012
Figure 13. Inner race bearing localized fault analysis for three different sampling points, (a) DE position, (b) NDE position, (c) base position; zero load; f r = 29.95 Hz.
Electronics 13 00375 g013
Figure 14. Rolling element localized fault analysis for three different sampling points, (a) DE position, (b) NDE position, (c) base position; zero load; f r = 29.93 Hz.
Electronics 13 00375 g014
Table 1. Bearing dimensions.
Bearing Type n b d in [mm] d out [mm] d b [mm] d p [mm]
6204820477.633.5
6205925527.838.5
620693062946
6207935721153.5
6208940801260
Dimensions depicted in Figure 2.
Table 2. Estimated characteristic fault coefficients assuming θ = 0 .
Bearing Type BPFO BPFI BSF CF
62043.094.912.090.39
62053.595.412.370.40
62063.625.382.460.40
62073.575.432.330.40
62083.605.402.410.40
Table 3. DE bearing dimensions and fault coefficients from CWRU dataset.
d in [mm] d out [mm] b d [mm] d p [mm]
25527.9439.04
B P F O B P F I B S F C F
3.585.422.360.40
Table 4. Quantitative comparison of f B P F O amplitude depending on the sampling position and load level.
f BPFO Amplitude (dB)No-Load1 HP Load2 HP Load3 HP Load
DE−11−14.57−14.92−12.51
NDE−23.26−26.24−27.26−22.36
Base−41.11−37.13−38.07−34.93
Table 5. Quantitative comparison of f B P F I and f B P F I ± f r amplitudes depending on the sampling position and load level.
f BPFI amplitude (dB)no-load1 HP load2 HP load3 HP load
DE−20.41−20.45−20.61−24.57
NDE−28.18−29.38−30.95−37.19
Base−41.06−38.27−36.36−39.91
f BPFI f r amplitude (dB)no-load1 HP load2 HP load3 HP load
DE−43.72−42.97−37.34−32.32
NDE−50.21−51.68−46.83−49.10
Base−56.18−66.15−60.46−55.70
f BPFI + f r amplitude (dB)no-load1 HP load2 HP load3 HP load
DE−45.12−48.67−40.16−35.13
NDE−43.86−43.10−69.59−55.18
Base−54.81−51.12−51.08−53.42
Disclaimer/Publisher’s Note: The statements, opinions and data contained in all publications are solely those of the individual author(s) and contributor(s) and not of MDPI and/or the editor(s). MDPI and/or the editor(s) disclaim responsibility for any injury to people or property resulting from any ideas, methods, instructions or products referred to in the content.