Abstract
This paper presents an innovative methodology for enhancing museum visitor experiences through personalized content delivery using a combination of explicit and implicit visitor profiling. The approach integrates Bluetooth Low Energy (BLE) smart badges to collect telemetry data, enabling precise visitor localization and dynamic group formation based on real-time proximity and shared interests. Initial profiling begins with OAuth registration and brief surveys and is then refined through the continuous tracking of exhibit interactions and the time spent at each exhibit. An AI-driven system delivers content to individual and group profiles, fostering both personalized learning and social interaction. This methodology addresses the limitations of traditional profiling by adapting to visitor behaviors in real time while maintaining a strong focus on data privacy and ethical considerations. The proposed system not only enhances engagement and satisfaction but also sets the stage for future advancements in personalized cultural experiences.
1. Introduction
In recent years, museums have transitioned from traditional repositories of artifacts to dynamic institutions providing immersive and educational experiences [1]. This transformation has been significantly influenced by advancements in technology, which have enabled museums to engage visitors through innovative methods. Personalization has become a critical element in optimizing visitor engagement, as it allows for the personalization of experiences based on individual interests, preferences, and learning styles [2].
Traditional museum experiences typically adhere to a one-size-fits-all model [3], which can lead to varying degrees of visitor satisfaction and engagement. Static exhibits and generalized information often fail to accommodate the diverse interests and backgrounds of contemporary visitors. Consequently, there is a growing demand for content delivery systems that can dynamically adapt to individual visitor preferences in real time.
Personalization strategies have shown promise in enhancing visitor experiences across various domains, including entertainment and education [4]. For museums, the ability to deliver tailored content that aligns with individual preferences can significantly improve visitor satisfaction and engagement [5]. Personalized experiences not only make visits more enjoyable but also enhance learning outcomes by presenting information that is relevant and accessible to each visitor.
User profiling plays a vital role in delivering personalized content, as it enables systems to understand and anticipate individual user preferences and behaviors. By constructing detailed user representations based on data and multi-behavioral patterns, personalized systems can tailor content to address specific needs, thereby enhancing user satisfaction and engagement. Purificato et al. [6] provide an in-depth examination of user profiling, tracing its evolution from early stereotype models to advanced deep learning techniques. The research study underscores the importance of creating precise user representations through implicit data collection and multi-behavior modeling, incorporating sophisticated approaches like graph data structures. The authors also emphasize the significance of privacy-preserving methods, explainability, and fairness in user profiling.
Visitor profiling methods, such as pre-visit surveys and basic demographic data collection, often fall short in capturing the dynamic nature of visitor preferences and behaviors [7,8]. These traditional methods, while useful for initial information, do not fully account for the nuances of how visitors interact with exhibits in real time. Consequently, there is a growing demand for sophisticated methods and technologies capable of dynamically responding to the evolving interests of visitors throughout their museum experience.
Technological advancements have enabled the collection and analysis of visitor data, facilitating the creation of personalized experiences [9,10]. Artificial Intelligence (AI) plays a crucial role in this personalized approach [11]. AI-driven systems, including museum-specific trained ChatGPT models, can generate tailored content by utilizing visitor profiles and real-time data. This ensures that the information provided is relevant, engaging, and appropriate for diverse audiences, including children, students, adults, and individuals with disabilities.
This paper aims to enhance the museum experience by addressing the limitations of traditional user profiling methods and leveraging modern technology. We propose a comprehensive personalization approach that begins with coarse visitor segmentation using OAuth user registration, which categorizes visitors into broad groups. These profiles are refined through short surveys administered during the museum tour and through implicit profiling that tracks visitor movements and interactions with exhibits. Additionally, dynamic group formation based on real-time telemetry data collected from Bluetooth Low Energy (BLE) smart badges is introduced. These innovations aim to enhance visitor engagement, provide tailored experiences, and improve overall satisfaction in museum settings.
2. Related Work
2.1. User Profiling Methods
User profiling methods are typically categorized into explicit, implicit, and hybrid approaches, each with distinct techniques for data collection and analysis. Purificato et al. [6] introduced a novel category termed pseudo-explicit profiling.
Explicit profiling, often referred to as static profiling, relies on user participation to gather data through online forms, questionnaires, or direct input of preferences. Although these techniques leverage extensive user-generated data, they are often insufficient for capturing the dynamic nature of visitor behavior and interests during museum visits.
Pseudo-explicit user profiling offers a new approach by utilizing publicly shared data from sources such as social media accounts, travel platforms, and other online services to create user profiles without requiring explicit input from users [12]. This method leverages the richness of openly shared data to generate accurate and comprehensive user profiles, enabling personalized services and recommendations while addressing challenges such as the cold start problem.
Implicit profiling, also known as dynamic profiling, gathers data based on user behavior and interactions without requiring direct input. This method includes tracking browsing history, click patterns, and time spent on activities, which offer a more detailed view of user preferences. In a museum context, implicit profiling can examine patterns like the sequence of rooms visited, the time spent at each exhibit, and other behavioral data, offering a deeper understanding of visitor interests. Implicit profiling systems, which track visitor movements, dwell times, and interaction patterns within museum spaces, have shown significant potential for enhancing visitor engagement. For instance, Yoshimura et al. [13] examined visitor mobility patterns within the Louvre Museum by using a random walk model, providing important findings on crowd dynamics and offering guidance for improving visitor flow management. Similarly, Centorrino et al. [14] employed a Lagrangian IoT-based tracking system to accurately reconstruct visitor trajectories in crowded museums, enabling better management of visitor flow and enhancing the overall experience. Behavioral analytics greatly improve visitor engagement by revealing how various visitor segments interact with exhibits.
Hybrid profiling combines explicit and implicit methods to leverage the strengths of both approaches. This technique provides a comprehensive view of users by integrating direct input with behavioral data.
Traditional methods of visitor profiling in museums, such as demographic surveys and pre-visit questionnaires, have been extensively used to categorize visitors and predict their preferences [15,16]. These approaches involve collecting data such as age, gender, educational background, and cultural interests to understand visitor demographics and tailor the museum experience accordingly [17]. However, despite the usefulness of these methods, they are often constrained by their dependence on self-reported data, which can be prone to biases and inaccuracies.
In recent years, the field of visitor profiling has seen significant advancements with the integration of explicit and implicit profiling techniques. Implicit profiling involves the direct collection of visitor information through interactive systems such as mobile apps, which can ask visitors to create profiles, state their preferences, and provide feedback in real time [18]. This method not only enriches the visitor database but also allows for the dynamic customization of the museum experience based on individual profiles.
2.2. Technologies
Modern technologies are essential to implementing effective visitor profiling methods in museums [19,20].
Bluetooth Low Energy (BLE) beacons, for example, enable the indoor positioning and tracking of visitor movements, providing valuable data on visitor flow and exhibit engagement [21]. This technology enables museums to understand how visitors engage with their environments and adapt their offerings accordingly. The integration of BLE beacons in museums has proven particularly effective in enabling location-based services, such as guiding visitors through personalized tour routes and offering real-time updates about exhibit events. Spachos and Plataniotis [22] explored the use of BLE beacons for indoor localization in smart museums, demonstrating how these beacons can deliver context-aware content related to artworks as visitors move through the museum. BLE beacons, combined with Internet of Things (IoT) technologies, offer a powerful means to track, localize, and interact with visitors, thereby enhancing their overall experience.
The IoT has further enhanced visitor experiences by creating interactive and personalized exhibits. Chianese and Piccialli [23] explored how the IoT can be integrated into museums to connect cultural heritage artifacts with digital applications, enabling features like augmented reality to provide dynamic and engaging educational experiences. Mohamed et al. [24] proposed a system that leverages IoT devices to collect data on customer behavior and preferences, enabling the creation of detailed customer profiles. Arvaniti-Bofili et al. [25] discussed a system designed to provide personalized recommendations within a museum setting by utilizing historical localization data and user interests to cluster similar users.
The use of Augmented Reality (AR), Virtual Reality (VR), and Artificial Intelligence (AI) has been transformative for museums, enabling them to create interactive and personalized experiences that bridge the gap between real and virtual environments. Augmented reality further enhances visitor experiences by overlaying digital information onto physical exhibits, contributing to visitor profiling by capturing interaction data [26]. Sepe and Marzullo [27] discussed how these technologies can enhance operational efficiency and visitor engagement by creating dynamic, interactive spaces that offer enriched educational and storytelling experiences. AI-assisted VR experiences at the MARTA Museum have shown positive results in user engagement and educational efficacy, encouraging further development of integrated VR and AI systems for cultural heritage education [28].
Machine learning (ML) algorithms are instrumental in analyzing data pertaining to visitor profiles by detecting patterns in visitor behavior, preferences, and engagement levels [29]. These data are subsequently utilized by AI systems to provide personalized recommendations and adaptive content delivery, thereby improving both operational efficiency and visitor satisfaction [30]. The adoption of these advanced technologies enables museums to develop comprehensive and dynamic visitor profiles, significantly enriching the overall visitor experience.
By integrating BLE beacons and AR, VR, AI, and IoT technologies, museums can offer tailored and immersive experiences that significantly improve visitor satisfaction and educational outcomes. These technologies not only enhance the visitor experience but also enable museums to operate more efficiently, ultimately contributing to their long-term sustainability and success.
2.3. Visitor Groups
Visitor group formation in museums significantly enhances social interaction by fostering engagement, shared experiences, and collaborative learning [31]. It plays a crucial role in enhancing the educational and social experiences in museums [32,33]. Visitors with shared interests are more likely to engage in meaningful discussions, exchange ideas, and strengthen social connections. This not only enriches the educational value of the visit but also increases overall satisfaction by creating a more interactive and enjoyable experience. The article by Fosh et al. [34] explores designing mobile museum guides that prioritize social interactions alongside personalization. The authors propose a design approach that integrates social aspects from the outset, allowing visitors to create and share personalized interpretations of exhibits with their friends and family.
In traditional museums, groups are typically formed through pre-arranged programs and guided tours led by museum staff. These guides provide context, engage visitors, and enhance the experience by using their expertise. Groups are often organized based on demographic information and pre-visit questionnaires, with data gathered from surveys or registration forms. During the visit, guides assess interests through interactions and observations, directing groups to relevant exhibits, such as educational displays for school groups or specialized collections for art enthusiasts. This approach relies on the staff’s experience and intuition to optimize the visitor experience.
In a smart museum environment, advanced technologies and data analytics enable the dynamic formation of visitor groups with similar interests. These groups can be adjusted in real time based on visitor preferences and behaviors, with apps offering personalized tours or facilitating self-guided exploration. Massarani et al. [35] found that during visits to the Museum of the Universe in Rio de Janeiro, family members primarily engage with each other and the exhibits, discussing scientific topics like astronomy, which enhances learning and group awareness. Tsiropoulou et al. [36] explored the concept of self-organizing museum visitor communities through a participatory action research approach. The study emphasized the importance of engaging visitors actively in the museum experience, allowing them to form communities based on shared interests and interactions.
2.4. Smart Badges
Smart badges use real-time data like location and interaction history to dynamically group visitors. Equipped with sensors and communication technology, these badges track movements and behaviors, enabling the system to organize visitors into groups based on proximity or shared interests, enhancing the experience and improving crowd management. Typically, smart badges incorporate Radio Frequency Identification (RFID) or Near-Field Communications (NFC) for secure access control and tracking, BLE for real-time location tracking and proximity sensing, and sensors for environmental or health monitoring.
Currently, only a few companies focus on developing smart badges, and there is limited research on their development and applications. This suggests that the technology is still emerging and not yet widely adopted or deeply explored within the industry. Vocera Smart Badges [37] are advanced communication devices used in healthcare settings to enable hands-free, real-time communication among medical staff. They integrate seamlessly with hospital systems, allowing staff to make secure voice calls, send messages, and access critical patient information efficiently. Abeeway Smart Badges [38] are portable multi-mode trackers in an ID card format that incorporate embedded sensors. These badges combine GPS, Wi-Fi sniffing, BLE, and LoRaWAN TDoA geolocation technologies to support accurate and continuous outdoor and indoor tracking. Kontakt.io Smart Badges [39] are sophisticated devices designed for versatile tracking and access control applications. By leveraging BLE technology, these badges offer features such as contactless access control, real-time location tracking, and environmental monitoring. When integrated with the Kio cloud platform, these smart badges enhance security, streamline visitor management, and improve asset tracking.
Caneschi and Ammendola [40] proposed the use of the Pin—a Bluetooth beacon equipped with a unique identification code. In the context of Museo Marino Marini, these Pins are detected by gateways distributed throughout the museum. The collected data are utilized to construct a journey profile for each Pin, documenting visitor presence in various areas, rooms, or in proximity to specific artworks. The Pin system has not yet been fully prototyped or validated. Park et al. [41] examined how interactive feedback from sociometric badges affects the creativity of group members. The study assessed whether smart technology can boost individual creativity during group discussions. Sociometric badges, which provide real-time feedback, were employed to monitor and influence the participants’ interactions. The research study revealed that participants who received real-time interactive feedback through these smart badges exhibited greater creativity compared with those who did not receive such feedback. De Jode et al. [42] explored the creation and application of digital empathy badges utilizing infrared transceiver technology. These badges were designed to promote mutual support and foster empathy among wearers. In a small pilot study, the participants wore the badges to investigate how this technology could enhance social interactions and emotional support within groups. Su et al. [43] presented the development of a smart badge using LoRa wireless technology. This badge is designed to improve the experience of museum visitors by enabling personalized, location-based interactions. The badge allows visitors to receive relevant information and content as they move through different exhibits, enhancing their engagement and learning experience.
3. System Design
The proposed user profiling methodology and service represent an advanced iteration of the ExhibitXplorer museum visitor segmentation module [44]. ExhibitXplorer is designed to deliver personalized content by using contextual geofencing and Artificial Intelligence. This updated system incorporates innovative hardware and software components to enhance visitor profiling.
3.1. Architecture
The proposed system utilizes the Kio Cloud platform by Kontakt.io Inc. (Kraków, Poland), which combines BLE devices, signal processing, and cloud-based analytics for precise real-time indoor location tracking. The Kontakt.io Location Engine Reference Architecture, an AI-based framework, provides accurate location data for both people and objects. Machine learning improves the platform by refining signal data to minimize noise and increase accuracy. It also enables predictive analytics for forecasting user movements, identifying security anomalies, and providing context to optimize space usage and facility management.
The summarized architecture of the system is shown in Figure 1.
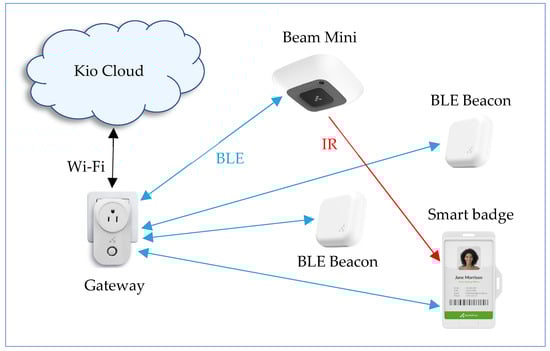
Figure 1.
System architecture.
From an infrastructure perspective, the system relies on fixed-position devices: (1) Anchor Beacons, installed in museum rooms and corridors, which provide location reference points; (2) Beam Mini BLE devices, used for room-level localization, which emit the room’s ID via an infrared (IR) transmitter; (3) Portal Light BLE-to-Wi-Fi gateways. These gateways aggregate data from the BLE devices and transmit them to the Kio Cloud for processing and analysis.
The system employs smart badges as tags, which are devices that transmit telemetry data by using BLE technology and are typically worn by individuals. These smart badges are also equipped with an infrared receiver to receive signals from the Beam Mini devices, enabling accurate room-level localization.
3.2. Methodology
The proposed methodology for dynamic visitor profiling and group formation in museums utilizes a combination of explicit and implicit profiling techniques, and smart badge technology. The methodology starts with coarse-grained profiling through OAuth registration, where visitors share basic information like age, gender, interests, etc. This profile is further refined through brief surveys conducted via a mobile app, collecting more detailed information about visitor interests and expectations.
Fine-grained profiling is achieved by monitoring how visitors interact with exhibits. This includes tracking the sequence of rooms visited and the time spent at each exhibit, offering a deeper analysis of visitor preferences and engagement. Visitors wear smart badges, which transmit telemetry data such as location and accelerometer readings, allowing for precise localization and movement tracking within the museum.
Dynamic group formation is achieved by using smart visitor badges. When a visitor starts the process, the system detects nearby visitors based on badge signal strength (RSSI). Those interested in joining the group can accept the invitation by pressing a button on their badge. Once the group is formed, a composite profile is created from the common segments of individual profiles, which is then used to tailor content to the group’s shared interests. This approach enhances the social aspect of the museum experience by enabling visitors with similar interests to connect and explore together with personalized recommendations. Additionally, the museum can provide specialized tours and experiences tailored to these groups, enriching the visitor experience further.
All collected data—from OAuth registration, mobile app surveys, tracking movements, and smart badge interactions—are integrated into a visitor profile database. This data integration and analysis process enables the museum to deliver highly personalized content and recommendations to each visitor.
The museum visitor profiling service integrates several subsystems within a distributed architecture to provide a personalized and seamless experience. Central to the system is a mobile app that handles visitor registration, authorization, and profiling through brief surveys. This app communicates with the Kio Cloud via an SDK for Android and iOS, enabling real-time data transmission. The system’s architecture ensures interoperability, scalability, and security, facilitating smooth data flow and safeguarding visitor information.
By integrating these components, the proposed methodology provides a comprehensive solution for enhancing visitor experiences through personalized content delivery and dynamic group interactions. This approach not only improves engagement but also promotes social interaction, thereby enriching the overall museum visit.
3.3. Database Design
To support hybrid museum visitor profiling, the service requires a flexible database architecture. This database captures and manages numerous data on both physical and digital visitor interactions, including individual profiles, visit histories, and metrics on engagement with exhibits. The service uses a MongoDB database, well suited for this purpose due to its flexible schema design, scalability, and robust data-handling capabilities. MongoDB’s document-oriented architecture efficiently manages complex and evolving data structures, making it ideal for handling the dynamic data.
The database consists of eleven collections. The Entity Relationship (ER) diagram of the database is shown in Figure 2.
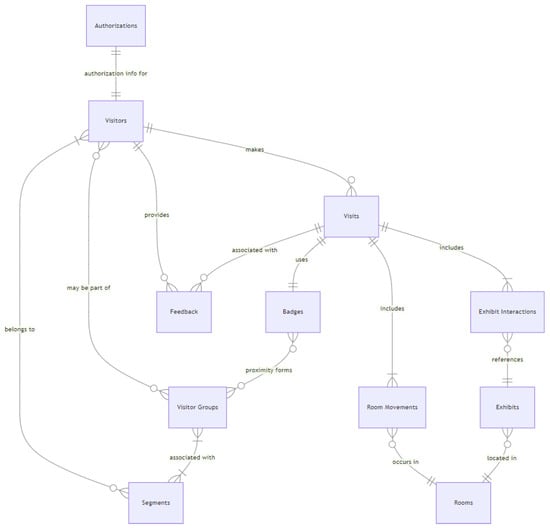
Figure 2.
ER database diagram.
The Visitors collection is a core element of the museum database, designed to hold critical information about individual visitors. Its primary properties, “profile” and “preferences”, are derived from a combination of OAuth-based pseudo-explicit registration data and explicit visitor profiling using short surveys conducted during museum visits. The “profile” property includes data obtained from the OAuth registration process, while “preferences” reflect data collected from visitor surveys and implicit profiling. This collection is essential to tracking visitor segments, enabling targeted personalization, and facilitating in-depth analysis. It includes average viewing time (e.g., 5 min), pace of visit (e.g., moderate), etc. Additionally, it records their engagement with technology, use of museum apps, preferred language, viewing habits such as time spent (e.g., Long), and group preferences (e.g., Any). It also includes information on any specific impairment types the visitor may have, which aids in accommodating their needs and enhancing their overall experience.
The Authorizations collection manages OAuth authentication details for visitors, containing key data related to their login credentials and provider information. This collection includes the following main data:
- visitor_id: A unique identifier for the visitor within the database, ensuring that authorization details are correctly associated with the visitor’s profile regardless of the social network used for authentication.
- auth: An array of objects, each representing authentication details for a specific OAuth provider. Each object includes the provider, which specifies the OAuth service provider used for authentication, such as “facebook” or “google”. The “provider_id” contains the unique identifier assigned by the provider, linking the visitor’s account to the external service. The “email” field stores the visitor’s email address associated with the specific provider, ensuring accurate identification across different platforms. The “access_token” field holds the encrypted access token provided by the OAuth service, used for authenticating the visitor. The “user_data” field stores user information obtained from the OAuth provider.
The “user_data” field encapsulates supplementary user information obtained from the OAuth provider during the authentication process. For example, when using OAuth registration through Facebook, this field can include detailed attributes such as public_profile, email, user_hometown, user_birthday, user_age_range, user_gender, user_link, user_friends, user_location, user_likes, user_photos, user_videos, and user_posts, depending on the permissions granted. These data facilitate the delivery of contextually relevant content and allow for the customization of interactions and communication based on the visitor’s personal attributes, preferences, and demographic information.
The Visits collection documents individual instances of museum visits. It tracks the total duration of each visit, the number of exhibits viewed, and the rooms visited. Each entry in this collection is associated with a specific visitor and badge, and it also records the groups to which the visitor belonged during the visit. This collection is crucial to maintaining a historical record of museum visits, enabling the analysis of visit patterns, durations, and group dynamics over time.
The Rooms collection maintains data about the museum’s physical spaces, including details for each room such as its name, capacity, floor number, and the building in which it is situated. It also tracks the IDs of the exhibits present in each room, providing a clear association between rooms and their contained exhibits. This collection is essential to the spatial analysis of visitor behavior, supporting effective museum layout planning, and optimizing space utilization.
The Room Movements collection monitors visitor movements between different rooms or areas within the museum. It records entry and exit times for each room visit and associates these visits with specific visitor trips and groups. These data are crucial to analyzing visitor flow and congestion within the museum, revealing which rooms or areas are most frequently visited.
The Exhibits collection catalogs detailed information about each exhibit within the museum. It includes data such as the exhibit’s name, artist, creation year, description, and multimedia content. Additionally, it records the exhibit’s location within the museum through a designated room ID and specific grid coordinates. The collection also tracks a popularity score for each exhibit, reflecting visitor engagement and interest. This repository is pivotal to referencing and analyzing exhibit characteristics, and it facilitates the correlation between exhibit details and visitor interactions.
The Exhibit Interactions collection records data on how visitors engage with specific exhibits. It tracks the duration and type of interaction each visitor has with an exhibit, linking these interactions to particular visits and groups. This collection also includes timestamp data, enabling the temporal analysis of visitor behavior. This information is essential to assessing exhibit popularity and effectiveness and to analyzing how different visitor segments or groups engage with exhibits.
The Badges collection oversees the physical badges issued to visitors for tracking purposes. It monitors the status of each badge (active or inactive), links badges to current visitors and their groups, and records the usage history for each badge. This collection is crucial to the proximity-based group formation feature, aiding in the management of the museum’s badge inventory and analyzing usage patterns.
The Visitor Groups collection tracks the formation and dissolution of visitor groups within the museum. It records essential details about each group, including associated visitors, badges, segments, and their current location. This collection is vital to analyzing social dynamics, such as how various group compositions interact with exhibits and each other. It shows how group size and composition impact museum experiences and helps in creating features and activities designed for groups. Understanding group behaviors, movement patterns, and exhibit preferences helps design spaces that foster social interaction and collaborative learning.
The Feedback collection is essential to refining visitor profiling and enhancing museum experiences. It records detailed input from visitors, linking feedback to specific individuals, visits, and optionally, particular exhibits. Each entry includes qualitative comments, a quantitative satisfaction rating, and a timestamp.
The Segments collection categorizes visitors into 1 or more of 18 predefined segments based on their preferences and behaviors, enabling museums to deliver personalized content and experiences. This segmentation approach helps museums tailor their exhibits and interactions to meet diverse audience needs, enhancing overall visitor satisfaction and engagement.
The segment names are chosen to be easily understood by ChatGPT. The following segments are currently used:
- Quick Visitors: Quick Visitors spend approximately 1–2 min per exhibit. They move quickly through the museum, focusing on key highlights and major attractions. They prefer quick highlights and brief overviews, favoring concise, impactful presentations. These visitors move rapidly through exhibits, focusing on the main attractions rather than in-depth exploration.
- Moderate Explorers: Moderate Movers spend about 3–5 min per exhibit. They enjoy a balanced experience that includes both quick highlights and more detailed content. Their pace is moderate, allowing them to engage with a mix of brief and moderately detailed exhibits.
- Leisurely Movers: Leisurely Movers spend approximately 6–10 min per exhibit. They engage more deeply with each exhibit, taking their time to explore detailed information and absorb the content. Their slower pace indicates a preference for thorough examination and contemplation of exhibits.
- In-Depth Movers: In-Depth Movers spend more than 10 min per exhibit. They immerse themselves extensively in the details, often revisiting exhibits and taking significant time to fully engage with and understand the content. Their extended viewing time reflects a desire for a comprehensive and immersive museum experience.
- Interactive Kids: This group consists of children aged 6 to 12 who are particularly attracted to interactive exhibits. Their visits tend to be brief, and the system should prioritize delivering content in the form of images, audio, and video to effectively engage this audience.
- Teen Trendsetters: Teen Trendsetters are teenagers aged 13–17 years who are interested in technology and interactive media. They engage with multimedia and social features and tend to move quickly through exhibits, focusing on the latest trends and interactive elements.
- Young Professionals: Young Professionals are individuals aged 18–30 years who are attracted to contemporary art, innovative exhibits, and social media. They prefer fast-paced exploration of trending exhibits and are often interested in the intersection of technology and art.
- Midlife Explorers: Midlife Explorers are adults aged 31–50 who are deeply engaged with historical artifacts, detailed exhibitions, and educational content. They seek meaningful and in-depth experiences that reflect their mature perspective and extensive life experience.
- Senior Art Connoisseurs: Senior Art Connoisseurs are visitors aged 51 and older who appreciate classic art, historical narratives, and in-depth stories. They enjoy leisurely visits with detailed explanations, taking their time to fully understand and reflect on the exhibits.
- Mobility-Friendly Visitors: Mobility-Friendly Visitors are individuals with mobility impairments who need accessible routes and interactive aids. They are interested in exhibits with accessibility features and may prefer guided tours that accommodate their needs.
- Sensory-Sensitive Visitors: This group includes individuals with sensory sensitivities, such as visual or hearing impairments. Visitors with visual impairments should be provided with audio content tailored to their needs. In contrast, visitors with hearing impairments should primarily receive visual content to ensure an accessible and engaging experience.
- Language-Specific Aficionados: Language-Specific Aficionados are visitors who prefer or require exhibits in specific languages. They seek out exhibits with multilingual information or content available in their native or preferred language. They are interested in ensuring that their museum experience is accessible and comprehensible in their chosen language.
- Group Collaborators: Group Collaborators are visitors who are willing to form a group. They enjoy collaborative and group-oriented exhibits and activities, valuing interactive and social experiences that allow them to engage with others.
- Family Visitors: Family Visitors include groups consisting of parents and children or extended family members. They are interested in exhibits that are engaging for all age groups and may seek out interactive, educational, and family-friendly activities. They prefer exhibits that offer something for everyone and provide opportunities for family interaction and learning.
- Solo Navigators: Solo Navigators prefer visiting the museum alone. They are interested in self-guided tours and personal reflection exhibits. These visitors value independence and personal space during their museum experience.
- Art and Cultural Enthusiasts: Art and Cultural Enthusiasts are deeply interested in art history, cultural exhibits, and historical artifacts. They engage thoroughly with exhibits related to art and culture, seeking detailed narratives and rich historical context.
- First-Time Explorers: First-Time Explorers are new visitors to the museum who seek a broad introduction to its offerings. They are interested in general overviews and introductory exhibits and may look for guidance or highlights to help them get acquainted with the museum.
- Frequent Visitors: Frequent Visitors are regular patrons of the museum who come often to see new and changing exhibits, explore special collections, and access behind-the-scenes content. They appreciate the opportunity to engage with fresh displays and exclusive material.
3.4. Software Architecture
The Museum Visitor Profiling module within the ExhibitXplorer service employs a microservice-based architecture to ensure scalability, flexibility, and maintainability. This architecture is designed to handle visitor data efficiently while providing a seamless and personalized museum experience.
Figure 3 shows a summary diagram of the microservices used that are directly or indirectly related to museum visitor profiling.
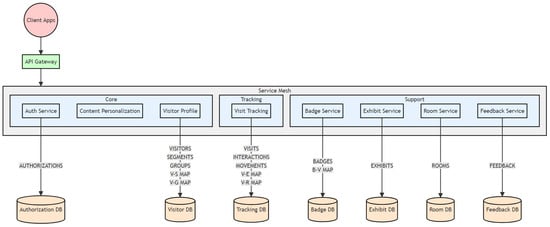
Figure 3.
Software architecture.
Visitors interact with the museum’s services through a mobile application. This app interfaces with the backend infrastructure through an API Gateway.
The API Gateway serves as the main entry point for all client interactions. It is responsible for routing incoming requests to the appropriate microservices, handling load balancing, and managing security aspects such as authentication and rate limiting. This centralized access point ensures that external communications are streamlined and secure.
The Service Mesh orchestrates communication between microservices within the system. A service mesh is an architectural layer that manages communication between microservices in a distributed application. It provides a dedicated infrastructure for handling service-to-service interactions, which allows developers to focus on business logic without having to manage communication concerns directly. The service mesh ensures these services communicate efficiently and securely while also providing tools for monitoring and managing their interactions. Within this mesh, several modules operate.
The Core Modules are essential components for the system’s operation, encompassing the following microservices:
- The Auth Service plays a critical role by managing user access, ensuring that only authorized individuals can interact with the system. It handles tasks such as registration, login, permission checks, and security protocols.
- The Visitor Profile microservice maintains profiles for each visitor. This service manages the core visitor data, including the VISITORS, SEGMENTS, and VISITOR_GROUPS collections. It is responsible for handling visitor profiles, implementing visitor segmentation, and managing visitor groups. The service also maintains two mapping collections: VISITOR_SEGMENT_MAPPING (V-S MAP) and VISITOR_GROUP_MAPPING (V-G MAP). In a microservice architecture, “mapping collections” are database collections specifically designed to manage the relationships or associations among different entities. These collections are essential when different services need to know about relationships without directly accessing each other’s primary data collections. They store references to the IDs of the entities they link, providing a way to look up connections efficiently. In our case, mapping collections allow for flexible associations between visitors and their segments or groups without tightly coupling the data.
- The Content Personalization Service utilizes visitor profile data to customize recommendations and content for individual visitors. Functioning as both an aggregator and analyzer, this microservice integrates data from various other microservices to create tailored content suggestions. This service uses a Chatbot service from ExhibitExplorer to interact with ChatGPT. It transmits requests to the Chatbot service that encompass detailed information about all current visitor segments. By using this information, ChatGPT delivers highly relevant and personalized exhibit recommendations, precisely aligned with each visitor’s specific interests and preferences.
The Tracking Modules are designed to capture and analyze data related to visitor behavior and interactions within the museum:
- The Visit Tracking microservice monitors and records how visitors engage with exhibits and navigate through the museum. It tracks movements, interactions, and other visit-related activities to enhance visitor experiences and optimize exhibit placements. It manages the VISITS, EXHIBIT_INTERACTIONS, and ROOM_MOVEMENTS collections. To maintain relationships between visits and specific interactions or movements, it also includes two mapping collections: VISIT_EXHIBIT_MAPPING (V-E MAP) and VISIT_ROOM_MAPPING (V-R MAP). These mapping collections allow the service to efficiently record and query a visitor’s journey through the museum, including which exhibits they interacted with and how they moved between rooms.
The Support Modules provide additional functionalities that support and enhance the core services:
- The Badge Service manages visitor badges, which are used for access control and personalized experiences. It handles badge issuance, tracking, and associated data. It maintains the BADGES collection and includes a BADGE_VISITOR_MAPPING (B-V MAP) collection. This mapping collection is crucial to implementing proximity-based group formation, as it allows the service to quickly determine which visitors are associated with which badges at any given time. The Badge Service provides APIs for assigning badges to visitors and querying badge–visitor associations.
- The Exhibit Service maintains detailed information about museum exhibits, including their descriptions and attributes, ensuring that accurate and up-to-date information is available. It maintains the EXHIBITS collection, storing details about each exhibit such as its description, location, and any multimedia content associated with it. The Exhibit Service provides APIs for retrieving exhibit information.
- The Room Service manages data related to the museum’s physical layout, including room configurations and features. It maintains the ROOMS collection. The Room Service offers APIs for querying room information, which can be used in conjunction with the Visit Tracking Service to analyze visitor movement patterns.
- The Feedback Service collects and processes visitor feedback, which is crucial to assessing visitor satisfaction and making improvements to exhibits and services. It maintains the FEEDBACK collection, storing comments, ratings, and other forms of feedback provided by visitors. The Feedback Service offers APIs for submitting new feedback and retrieving existing feedback, which can be used to improve the museum experience and contribute to visitor profiling.
Together, these modules form a system that facilitates efficient visitor profiling.
3.5. Methods
3.5.1. Group Profiling
This subsection describes the implementation of the visitor group profiling algorithm. This algorithm aims to categorize each newly formed group into relevant segments. When a new group is created or an existing visitor profile is updated, the Visitor Profile microservice activates the algorithm to analyze the segments within the group’s profiles. The group profile is then generated by aggregating segments that appear more frequently than a predefined threshold, which is set as an environmental variable.
To implement the visitor group profiling algorithm, we use the aggregation capabilities of MongoDB.
Figure 4 shows an example aggregation pipeline that is used to obtain segment statistics—how many times segments occur in the profiles of visitors from a selected group. The pipeline starts by filtering documents that match the given “group_id” (operator $match). It then deconstructs the segments array in each document, creating separate documents for each segment ($unwind). Next, it groups these segments by their value and counts how often each segment appears ($group). The pipeline then sorts the segments by their count in descending order ($sort). Subsequently, the pipeline re-groups all segments into a single array, where each entry contains the segment’s ID and its count ($group). Finally, the pipeline projects the result, outputting only the segments array without the “_id” field ($project).

Figure 4.
Segment statistics—aggregation pipeline.
Possible methods for setting a threshold for segment selection include absolute value thresholds, percentage-based thresholds, percentile-based thresholds, and statistical techniques. Absolute value thresholds involve setting a fixed numerical value, such as retaining only segments with counts exceeding a specific number. This method is straightforward but does not consider the variability within the data. Percentage-based thresholds use a proportion of the total count or maximum value, such as retaining segments that account for at least 20% of the total. While this method scales with the dataset, it can still be somewhat arbitrary. Percentile-based thresholds use statistical percentiles, such as the 75th percentile, to determine the cutoff for segment selection. This approach considers the relative position of segments within the distribution, ensuring that only those above a certain rank are kept. On the other hand, statistical techniques like Z-scores standardize data by converting counts into a common scale where the mean is 0 and the standard deviation is 1:
where is the segment count, is the mean, and is the standard deviation. By calculating the Z-scores, the number of standard deviations a segment’s count deviates from the mean can be quantified. For instance, retaining segments with Z-scores greater than 1 involves selecting those that deviate significantly from the average, providing a statistically rigorous approach to identifying meaningful deviations.
When there are only a few visitors in a group, it is possible that no segments will have a Z-score greater than 1. In such cases, the algorithm aggregates the segments of all visitors. However, four segments are always prioritized when delivering content due to their significance: “Mobility-Friendly Visitors”, “Sensory-Sensitive Visitors”, “Language-Specific Aficionados”, and “Interactive Kids”. These segments are consistently considered when delivering content, regardless of whether the visitor is part of a group or visiting alone.
3.5.2. Visitor Similarity Estimates
Delivering personalized content by using ChatGPT requires significant time and resources. To reduce requests to the Chatbot microservice, Redis is used as a content caching server. When a request for custom content is made, the system checks if the desired information is already cached. This involves searching the cache for data related to the exhibit that were obtained for visitors with similar profiles. Jaccard’s algorithm is used for this purpose. The Jaccard similarity measures the similarity between two sets by calculating the proportion of shared elements relative to the total number of distinct elements in both sets. It is calculated by dividing the size of the intersection of the two sets by the size of their union:
where is the set of segments associated with visitor ; is the set of segments associated with visitor ; is the intersection of the two sets (i.e., the segments that both visitors share); is the union of the two sets (i.e., all the segments that either visitor belongs to); and the fraction represents the proportion of shared segments out of the total segments across both visitors. is the probability that visitor and visitor have similar profiling. The similarity coefficient is a number in the interval [0, 1]. indicates perfect similarity (the sets are identical), and indicates no similarity (the sets have no elements in common).
The Jaccard algorithm is highly efficient when comparing sets that are relatively small- to medium-sized. The time complexity of computing the Jaccard similarity between two sets is , where and are the sizes of the sets. Given that the sets in our case have a maximum size of 18 segments, the Jaccard algorithm is inherently efficient due to the small size of the sets, making the intersection and union operations computationally lightweight. To further optimize performance, particularly when managing frequent queries or larger data volumes, MongoDB’s built-in operators, such as set intersection and set union, are utilized. These operators allow set operations to be performed directly within the database, reducing the need to transfer data to the application layer. This approach ensures that the similarity calculations are both fast and scalable, maintaining high efficiency even as the application grows.
There are two distinct strategies for retrieving cached content, each with its own approach to leveraging stored information:
- Exhibit-Centric Strategy: This strategy starts by querying the cache to check for content related to the desired exhibit. If cached content is available, the system retrieves the identifiers of the visitors for whom this content was created. It then compares the visitor’s segments with those of the cached visitors to assess similarity. If a visitor with a sufficiently similar profile is found, the corresponding cached content is retrieved. If no similar profile is found or no cached content exists, the system will generate new content by using ChatGPT.
- Profile-Centric Strategy: This strategy begins by identifying visitors in the database whose profiles resemble that of the current visitor. Once similar profiles are identified, the system checks the cache for any content related to the desired exhibit that was generated for these visitors. If relevant cached content is found, it is retrieved. If no suitable cached content is available, the system defaults to generating new content by using ChatGPT.
In this development, the Profile-Centric Strategy is employed. This approach is favored due to its efficiency; it significantly reduces the time required to retrieve the desired information. Specifically, by identifying similar visitor profiles before querying the cache, the system effectively reduces the search space and minimizes redundant operations. As a result, extracting the required content by using the Profile-Centric Strategy is accomplished in approximately half the time compared with the Exhibit-Centric Strategy, thereby optimizing the overall performance and responsiveness of the content retrieval process.
Figure 5 illustrates an example aggregation pipeline employed to implement the Jaccard algorithm in this process. This MongoDB aggregation pipeline identifies visitors whose segment data closely match a target visitor’s segments. It first excludes the target visitor (“target_visitor_id”) from the results with the $match stage.
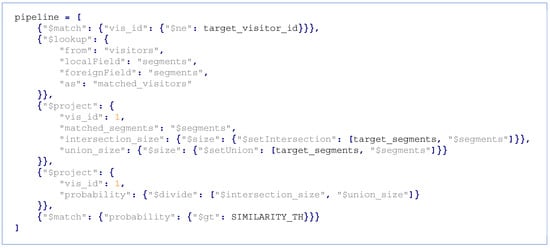
Figure 5.
Jaccard algorithm—aggregation pipeline.
Then, it performs $lookup to find other visitors who share any segments with the target visitor, creating a list of matched visitors. The pipeline then computes the intersection and union sizes between the target visitor’s segments (“target_segments”) and each matched visitor’s segments by using $setIntersection and $setUnion, respectively. The Jaccard similarity, representing the proportion of shared segments, is calculated by dividing the intersection size by the union size. Finally, it filters out the results to include only those visitors whose similarity score exceeds a predefined threshold (“SIMILARITY_TH”).
4. Results
This section details the results of implementing advanced visitor profiling through smart badges in a museum setting. The proposed methodology and service for dynamic museum visitor profiling were pilot-tested in an open-air ethnographic museum. This museum features historical buildings, including craft workshops, traditional houses, water facilities, and various other outdoor exhibits, all functioning as museum displays. The service is designed to provide personalized content to visitors based on their individual profiles. As visitors approach each exhibit, they receive customized information through push notifications triggered by their proximity to the exhibit.
4.1. Selection of Test Participants
For the pilot testing of the service, 20 visitors from different age groups were invited to participate. Each participant was provided with a comprehensive explanation of the experiment’s objectives, detailed instructions for installing the mobile app, and guidance on using the smart badges, including their specific functions. Informed consent was obtained from participants, who then completed a brief electronic survey designed to assess the service’s usability and the effectiveness of the profiling module after viewing the exhibits. Out of the 20 invited visitors, 16 agreed to participate in the test.
4.2. Mobile Application
To access the Profiling Service and deliver personalized content, museum visitors must install a mobile app that implements (1) a user interface, (2) communication with business logic deployed in a cloud infrastructure, (3) access to beacon and smart badge data via the Kio Cloud SDK, and (4) the receiving of push notifications. The mobile app can be installed after scanning a QR code placed in visible locations at the museum entrances. At this stage, the app works with Android devices.
4.3. Visitor Registration and Login
The system uses OAuth 2.0 for visitor registration and authorization. OAuth 2.0 is a widely adopted framework that allows users to grant third-party applications access to their resources on other platforms without exposing their credentials [45]. For user registration and login, OAuth 2.0 enables authentication through social networks. Users are redirected to the authorization server of the chosen service, where they authenticate with their existing credentials. After successful authentication, users grant the application specific permissions, such as access to their basic profile information. The application then receives an access token to retrieve the authorized data and complete the registration or login process.
The mobile app allows visitors to register through a variety of social media such as Google, Facebook, LinkedIn, X, Instagram, and GitHub. To integrate OAuth 2.0 for user authentication with social media platforms, developers must create and configure applications specific to each platform. This process involves registering the application with the social media platform, which is a necessary step to obtain the credentials required for OAuth 2.0 authorization flows.
In our scenario, visitors register by using their Facebook account. By default, Facebook provides access to the user’s ID and name. To obtain additional information, a request must be made through a specially designed Facebook application. For example, these additional data from Facebook can include the user’s email address, location (country and city), gender, birthday, age range, friends, likes, posts, and other relevant details.
Figure 6 shows the “Authorizations” collection document that is generated after the visitor registers. Since this is a new user to the service, a unique identifier is generated for this user. User data is limited to the visitor’s name, email address, gender and location. This information will form the basis of visitor profiling. A new document is created in the Visitors collection for the new user. Next, the fields of the “profile” property are initialized with the data obtained during registration.
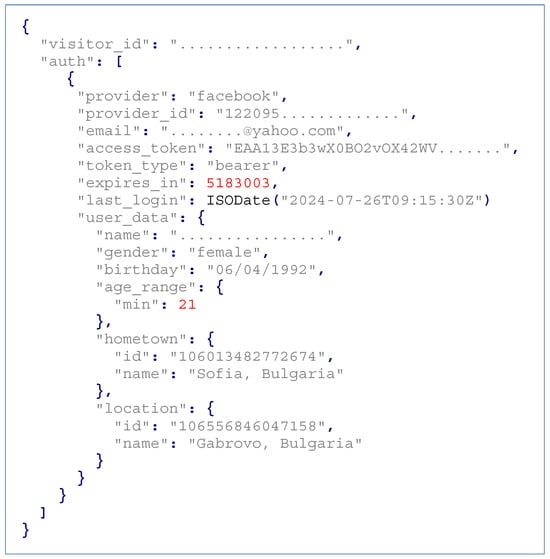
Figure 6.
Visitor authorization document.
A new document is created within the Visits collection to comprehensively detail all aspects of the current visit and the associated visitor. This document captures the start and end times of the visit, the sequence of rooms entered, the order of exhibits viewed, and the dwell time at each exhibit.
4.4. Visitor Demographics and Location
Demographic segmentation divides users based on characteristics such as age, gender, income, education, and occupation. This method is widely used due to its simplicity and effectiveness in targeting broad audience segments. Geographic segmentation categorizes visitors based on their location, such as country, region, or city. Museums can use a combination of demographic information and real-time location data to provide personalized tours and exhibits.
Demographic data for the test participants were collected following their OAuth registration through social network profiles. Most participants registered via Facebook (13), with the remaining users registering through X (2) and LinkedIn (1). The service analyzes the following demographic attributes: gender, age range, and hometown. These details are summarized in Table 1.

Table 1.
Visitor demographics and location.
Figure 7 presents statistics on the distribution of visitors by gender and age range.
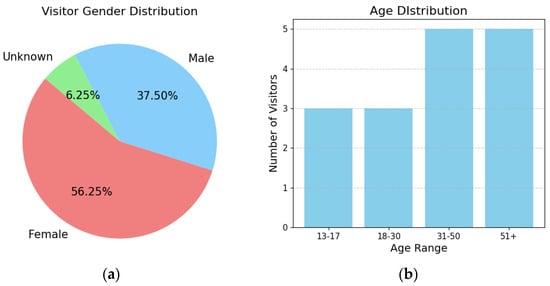
Figure 7.
Visitor demographics: (a) gender distribution; (b) age distribution.
At this stage, the service is designed to be gender-neutral. Experimental results indicate that the generative AI used does not produce significantly different content when gender is included in query prompts. If available, visitors’ birthdates are used to categorize them into one of five age-based ranges. Additionally, location data are used to identify the most appropriate language for content delivery.
4.5. Visitor Segmentation
The information collected during visitor registration is inadequate for detailed visitor segmentation. To address this limitation, static profiling is conducted through surveys administered via the mobile application. These surveys are customized for each visitor to fill in specific gaps in their profile information. The Visitor Profile microservice supports polling by sending short surveys to visitors via push notifications. The questions are designed to be direct and concise, with follow-up questions used only when necessary to refine categorization. This approach ensures that the survey remains user-friendly while effectively collecting the information needed to assign visitors to the appropriate segments. Dynamic profiling is continuously active while a visitor is within the museum, utilizing Kio Cloud Real-time Locating Systems (RTLS) to track their real-time location.
Each participant’s profile was analyzed to evaluate the effectiveness of both explicit and implicit visitor profiling algorithms. Table 2 presents a summary of the results obtained from the database analysis. This analysis includes visitor segmentation at various stages, such as pseudo-explicit segmentation following OAuth registration, as well as static and dynamic segmentation.
Table 2.
Visitor segmentation.
Pseudo-explicit segmentation, derived from OAuth registration data, provides basic demographic information, categorizing visitors by age and location. This method creates broad segments like “First-Time Explorers” and “Midlife Explorers”, offering a general profile without detailed behavioral insights.
Explicit segmentation, gathered through surveys, offers a deeper understanding of visitor preferences and experiences. It captures detailed feedback on interests and satisfaction, leading to segments like “Art and Cultural Enthusiasts” and “Language-Specific Aficionados”, which provide a richer view of visitor preferences.
Implicit segmentation, based on tracking visitor movements and exhibit viewing times, reveals behavioral patterns. This method identifies segments such as “Leisurely Movers” and “Quick Visitors”, reflecting how visitors interact with the museum environment.
Four of the test participants with id from 8 to 11 opted not to use smart badges, which excluded them from being included in the formation of interest groups. For these individuals, dynamic profiling was instead carried out by using GPS-based geofencing.
During their visit to the museum, seven of the participants were organized into the following groups:
- Group 1—included participants 1 and 2.
- Group 2—included participants 3 and 4.
- Group 3—included participants 5, 6, and 7.
For groups of visitors, Z-score analysis standardizes segment popularity by measuring deviations from the mean frequency across all visitors. Higher positive Z-scores indicate more common segments, while negative z-scores suggest less frequent ones.
Final segmentation is evaluated by its consistency with pseudo-explicit, explicit, and implicit segments. The “Final” column lists all segments associated with each visitor, irrespective of group membership. For segments linked to specific groups, the Z-score values used to determine segment assignments are provided in parentheses. Due to the small number of visitors per group (two or three), Z-scores above 1 were not observed. As a result, all visitor segments within a group are assigned to that group, excluding any special segments, if applicable. Special segments are excluded from the Z-score calculation unless every visitor in the group shares this special segment. An exceptional case is noted in Group 2, where the segments for the two visitors align perfectly, resulting in a Z-score approaching infinity due to zero variance.
In summary, each segmentation method contributes to a comprehensive understanding of museum visitors. Pseudo-explicit segmentation offers a broad demographic overview, explicit segmentation captures detailed preferences, and implicit segmentation uncovers behavioral patterns. Analyzing Z-scores enables the content delivery service to effectively leverage these data, optimizing visitor experiences and tailoring museum offerings to diverse visitor needs.
4.6. User Experience Analysis
This study aims to evaluate user experience with a personalized content delivery service by integrating explicit and implicit profiling methods, in conjunction with smart badges to monitor visitors and form interest groups. To gather precise and actionable feedback, a questionnaire was designed, focusing on the following key areas:
- Content delivery: It evaluates the efficiency and timeliness of content delivery.
- Interaction with smart badges: It assesses the complexity involved in associating smart badges to visitor profiles and forming interest groups.
- Group profile content delivery: It measures visitor satisfaction with the content delivered to group profiles.
- Explicit profiling: It examines the effectiveness of visitor surveys for profiling.
- Overall visitor satisfaction: It evaluates the general satisfaction of visitors with the personalized content delivery service.
The user experience analysis is based on responses to the following statements:
- The content was delivered promptly and at the appropriate time—1 (Strongly Disagree) to 5 (Strongly Agree).
- It was easy to associate the smart badge with my profile—1 (Strongly Disagree) to 5 (Strongly Agree).
- The process of forming interest groups was straightforward—1 (Strongly Disagree) to 5 (Strongly Agree).
- The content delivered to my group was relevant to our shared interests and enhanced my overall experience—1 (Strongly Disagree) to 5 (Strongly Agree).
- The questions in the survey were easy to understand and accurately captured my preferences and interests—1 (Strongly Disagree) to 5 (Strongly Agree).
- I am satisfied with my overall experience with the personalized content delivery service—1 (Strongly Disagree) to 5 (Strongly Agree).
- I would recommend this personalized content delivery service to others—1 (Strongly Disagree) to 5 (Strongly Agree).
Statement 2, concerning the use of smart badges, was answered by all visitors except those numbered 8 to 11. Statements 3 and 4, related to the setup of interest groups, were answered only by visitors numbered 1 to 7.
The user experience study was designed to evaluate the effectiveness of a personalized content delivery system in a museum setting, aiming to enhance visitor engagement through tailored content based on individual interests. Participants completed a survey, rating seven statements on a 5-point Likert scale, where 1 represented “Strongly Disagree” and 5 represented “Strongly Agree”. The results, detailed in Figure 8, Figure 9 and Figure 10, offer insights into various aspects of the service, including content delivery efficiency, the user-friendliness of smart badges, the process of forming interest groups, and overall visitor satisfaction.

Figure 8.
Visitor responses to statements.
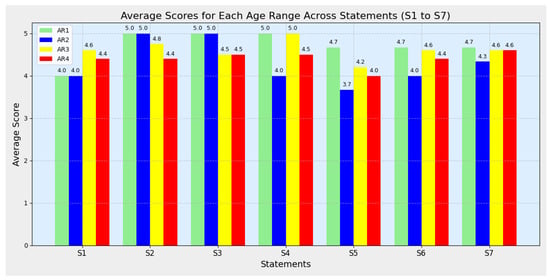
Figure 9.
Average scores for each age range across statements.

Figure 10.
Average ratings for visitors with and without smart badges.
Figure 8 presents the individual responses of 16 visitors to the seven survey statements.
The first statement, assessing the timeliness and appropriateness of content delivery, received predominantly high ratings, with most participants scoring it as either 4 or 5. This generally indicates that visitors found the content to be delivered both promptly and appropriately. However, some variation was noted, with a few participants rating it as 3. This suggests that not all visitors experienced uniformly positive content delivery, potentially reflecting occasional delays or mismatches between content relevance and individual expectations. Further investigation may be needed to address these discrepancies.
The second statement, which evaluated the ease of associating smart badges with profiles, was answered by 12 visitors. Most respondents gave high ratings (4 or 5), indicating that using the smart badges was generally straightforward.
Statements 3 and 4, which evaluated the process of forming interest groups and the relevance of the content delivered to these groups, were answered by only seven visitors. Most of these responses were positive, with ratings of 4 or 5, indicating that those who engaged with the interest group feature found it user-friendly and relevant to their shared interests.
The fifth statement assessed the clarity and accuracy of the survey used for explicit profiling. It received mostly high ratings, except for one participant (visitor 15), who rated it as 2. This outlier suggests that while most visitors found the survey effective, there may be elements of its design that did not resonate with all participants. This discrepancy indicates that some survey questions might not have been equally clear or relevant to all respondents.
The sixth and seventh statements evaluated overall satisfaction with the personalized content delivery service and the likelihood of recommending it to others. Responses were predominantly positive, with nearly all participants rating their satisfaction as 4 or 5. This high level of approval indicates strong overall satisfaction with the service and suggests that most visitors would recommend it to others. The elevated satisfaction is likely due to the personalized nature of the content, which appears to have significantly enhanced the museum experience for most visitors.
The analysis of Figure 9 reveals how different age groups rated their experience with the personalized content delivery service, highlighting trends in visitor satisfaction across various demographics.
The 18–25 age group (AR1) reported the highest average score, 4.5, indicating that younger visitors found the personalized content delivery service highly engaging and well suited to their needs. Their greater familiarity with technology likely contributed to a more intuitive and enjoyable experience, resulting in higher satisfaction.
The 26–35 age group (AR2) had an average score of 4.2. Although still positive, this score is slightly lower than that of the younger group, suggesting that while these visitors appreciated the service, their expectations or preferences might not have been fully met.
The 36–50 age group (AR3) reported an average score of 4.0. This decline may reflect differences in content consumption habits or varying levels of comfort with technology. While this group generally found the service useful, minor issues or frustrations might have affected their overall satisfaction.
The lowest average score of 3.8 was given by the 51 and above age group (AR4). This suggests that older visitors experienced moderate satisfaction, potentially due to challenges with the technology or a preference for more traditional museum experiences. The lower score may also indicate that the content was less aligned with their interests or that the technology was less user-friendly for this demographic.
Overall, while the personalized content delivery service was positively received across all age groups, it was rated higher by younger visitors. This trend suggests that the service was more effective for younger audiences and highlights the need to enhance accessibility and appeal for older visitors.
Figure 10 compares the average ratings of visitors who used smart badges with those who did not, providing insights into the effectiveness of the smart badge system in enhancing the museum experience.
Visitors who used smart badges reported a higher average score of 4.6, indicating that the smart badge system significantly enhanced their experience. This higher satisfaction suggests that the badges improved content delivery by making it more relevant, timely, and personalized based on individual interactions, thereby making the content more engaging and tailored to users’ specific interests.
In contrast, visitors who did not use smart badges had a lower average score, 4.0. Although this score is still positive, it is lower than that of badge users, suggesting a less personalized or engaging experience. Without the smart badges, content delivery likely relied on more generalized approaches, which may not have aligned as closely with these visitors’ specific interests.
The variation in scores for Statement 1 (S1), which assesses the timeliness of content delivery, can be attributed to the different technologies used for content triggering. Visitors without smart badges relied on GPS geofencing, which updates location data every 10 s in the mobile app’s background mode. This relatively slow update interval can cause delays, resulting in content being delivered after visitors have reached the exhibit. These delays disrupt the intended flow of the experience and likely contributed to lower satisfaction scores, as visitors perceived the content delivery as untimely. In contrast, visitors with smart badges received content through infrared (IR) emitters, which update location data every 1.5 s. This faster update rate allows for nearly instantaneous content delivery as visitors approach an exhibit, ensuring that information is provided precisely when needed. The greater accuracy and immediacy of content delivery for badge users likely resulted in higher satisfaction scores, as the system more effectively met their expectations for prompt and relevant information.
The difference in average scores between the two groups highlights the positive impact of the smart badge system. Visitors with smart badges experienced a more tailored and engaging visit, leading to significantly higher overall satisfaction. In contrast, while visitors without badges still had a positive experience, it was less personalized. This suggests that while the base service was effective, the additional customization provided by the smart badge system greatly enhanced the overall experience. These results underscore the importance of the smart badge system in the personalized content delivery service. The higher ratings from badge users suggest that expanding the use of smart badges or enhancing their accessibility and appeal could further improve the museum experience for all visitors.
5. Discussion
The implementation of advanced visitor profiling using telemetry-driven smart badges in museums offers several benefits but also presents challenges that warrant further exploration. This discussion will address the key findings, potential limitations, ethical considerations, and implications for future research.
5.1. Key Findings
The proposed system enhances the acquisition of museum visitors’ preferences through a combination of explicit and implicit profiling methods, delivering dynamically personalized content. Smart badges and BLE beacons facilitate the real-time tracking of visitor movements and interactions, allowing the system to continuously refine visitor profiles. This represents a significant advancement over traditional methods, which rely on static data and fail to adapt to changing visitor interests. By integrating AI-driven content personalization, the system adjusts exhibits to suit the preferences of both individual visitors and dynamically formed groups, creating a more engaging and educational experience.
The badge association method in this solution is highly effective due to its simplicity and reliability. The mobile app uses BLE scanning to detect nearby badges and displays them based on signal strength, creating an intuitive and user-friendly process. Visitors can easily identify their badge by pressing the blue button, which highlights their badge in blue on the app. This visual confirmation reduces errors and ensures accurate badge selection. The process is quick, requires minimal user input, and offers immediate feedback, making it an efficient and reliable method for associating a badge with a user profile. The implementation of smart badges substantially improved the visitor experience. Visitors equipped with smart badges reported higher satisfaction levels, with an average score of 4.6 out of 5, compared with 4.0 for those not using the badges. This difference is likely due to the more precise and timely content delivery enabled by infrared emitters, which update every 1.5 s, in contrast to the less frequent GPS-based geofencing updates for non-badge users. The smart badge system’s capacity to provide personalized, real-time content highlights its effectiveness in enhancing museum interactions.
Another key contribution of this research is its innovative approach to group formation. Unlike conventional methods that pre-organize groups based on demographics or pre-visit questionnaires, the proposed system dynamically forms groups based on real-time proximity and shared interests. This approach enhances social interaction among visitors and allows the museum to offer more relevant and meaningful experiences tailored to these dynamically formed groups.
The microservice architecture further enhances the system’s robustness by allowing for the independent development, deployment, and scaling of individual components. This modularity ensures that the system can efficiently manage increased demand, whether through adding more visitors, expanding museum content, or integrating additional data sources. The architecture supports seamless updates and maintenance, minimizing downtime and ensuring a consistently high-quality visitor experience.
5.2. Limitations and Challenges
Preliminary experiments indicate that the profiling system shows potential for improving visitor engagement and satisfaction. Nevertheless, several limitations must be addressed. The accuracy of tracking by using BLE beacons and smart badges can be compromised by physical obstructions, signal interference, and large crowds, which may affect the quality of personalized content. Currently, the system depends on Kio Cloud’s AI-based localization algorithms, which necessitates the strategic deployment of beacons in various rooms and hallways. Beacons can be placed at specific points of interest, such as exhibits, to minimize the number of required devices, although this approach may result in reduced accuracy. Conversely, establishing a grid of beacons can enhance accuracy to within two meters but involves higher infrastructure costs.
A challenge arises when a museum visitor’s smart badge inadvertently rotates, causing the IR sensor to face the visitor’s body. This misalignment obstructs the IR sensor from receiving room identifier signals from ceiling-mounted IR emitters (Beam Mini), leading to inaccuracies or failures in location tracking at the room level. Given that the badge may be worn either vertically or horizontally, it is essential to ensure the IR sensor remains correctly oriented and unobstructed by the visitor’s body to maintain accurate tracking. To mitigate this issue, the badge should be securely affixed to the visitor’s clothing to reduce the likelihood of accidental flipping or rotation. Furthermore, the embedded accelerometer within the badge can be utilized for real-time orientation monitoring. By analyzing acceleration data along the x-, y-, and z-axes, the system can detect improper orientation. Specifically, if the acceleration along the z-axis becomes negative, indicating that the IR sensor is facing the visitor’s body, the mobile application can issue an audible alert to prompt the visitor to adjust the badge. This method helps ensure reliable location tracking within the museum environment.
The collection and utilization of personal data for visitor profiling entail substantial ethical considerations concerning privacy and consent. Visitors may express concerns about continuous tracking and behavior analysis, despite the intended benefits for enhancing their experience. Upon registration, visitors are informed that their navigation and interactions with exhibits will be stored and analyzed within a cloud infrastructure. Additionally, visitors are given the choice to decline participation in implicit profiling and the use of smart badges. For those who opt out, personalized content will be created by using explicit and pseudo-explicit profiling methods.
The study identified a trend in user satisfaction across different age groups, with younger visitors (ages 18–25) reporting the highest satisfaction (average score of 4.5) and older visitors (ages 51 and above) reporting the lowest (3.8). This pattern suggests that while the system was generally well received, it may be more intuitive or engaging for younger audiences. The decline in satisfaction with the increase in age highlights the need for further refinements to ensure the system effectively serves all age groups, possibly through more user-friendly interfaces or content tailored to diverse generational preferences.
5.3. Future Research
The implementation of advanced visitor profiling using telemetry-driven smart badges in museums presents several opportunities for future research.
5.3.1. Enhancing Localization Accuracy
Future research should focus on enhancing the accuracy of visitor localization technologies. Kio Cloud offers a streaming API for real-time data transmission from infrastructure devices and tags to third-party streaming platforms. This functionality supports integration with services such as AWS Kinesis, Azure Event Hub, and IBM Watson.
Future initiatives are anticipated to concentrate on Azure Event Hub, an advanced real-time data streaming and processing platform designed to handle millions of events per second with minimal latency. Its compatibility with Apache Kafka further enhances its function as a message broker, optimizing Kafka workloads for improved performance and cost efficiency. Streaming data to these platforms will facilitate the development and deployment of advanced algorithms for processing telemetry and location data.
Future research should assess the cost efficiency and operational management of Azure Event Hub relative to other streaming services. This evaluation should include a detailed analysis of the financial implications related to data processing, storage, and bandwidth usage. Additionally, it is crucial to investigate operational aspects such as setup complexity, maintenance requirements, and scalability to fully understand the platform’s value proposition. Research should also explore strategies to optimize costs while maintaining high performance and reliability.
5.3.2. Data Privacy and Security
With the integration of real-time streaming data platforms, addressing data privacy and security concerns becomes increasingly important. Research should focus on developing secure data transmission and storage practices, ensuring compliance with privacy regulations, and implementing robust encryption methods.
5.3.3. Assessing Impact on Visitor Experience
Evaluating the long-term impact of telemetry-driven smart badges on visitor experience and museum operations is another critical area for future research. This includes assessing how personalized content affects visitor engagement, learning outcomes, and overall satisfaction. Additionally, research should explore the operational implications for museums, such as the integration of these technologies with existing systems, the potential for increased operational costs, and the training requirements for museum staff. Understanding these factors will help museums make informed decisions about adopting and scaling such technologies.
6. Conclusions
The integration of advanced telemetry-driven smart badges in museums, along with real-time data streaming via platforms like Kio Cloud, marks a substantial advancement in visitor engagement and experience enhancement. Capturing and analyzing real-time telemetry and location data provides unparalleled opportunities for delivering personalized and dynamically adaptive content. This method exceeds traditional static profiling techniques by continuously updating visitor profiles based on actual interactions and preferences.
Key findings underscore the significant advantages of employing smart badges and real-time streaming technologies, including enhanced accuracy in visitor profiling, increased engagement through personalized content, and the potential for more meaningful social interactions via dynamically formed groups. However, the implementation of these technologies also presents several challenges. Addressing issues such as signal interference, badge orientation, and privacy concerns is crucial to ensuring system effectiveness and maintaining visitor trust. Ongoing research and development in these areas will drive innovation and contribute to the creation of more engaging, personalized, and efficient museum environments.
In conclusion, the personalized content delivery system, using smart badges and detailed visitor profiling, shows significant promise for improving museum experiences. While challenges remain, especially in maintaining consistent satisfaction across different age groups, the generally positive feedback indicates that this method could be an effective tool for museums seeking to offer more engaging and tailored visitor interactions.
Funding
This research study was funded by the Bulgarian Ministry of Education and Science, project No. 2409E/2024.
Data Availability Statement
The data are not publicly available due to research data ownership issues.
Acknowledgments
The author would like to thank the Centre of Competence “Intelligent Mechatronic, Eco and Energy Saving Systems and Technologies”, Project BG05M2OP001-1.002-0023, for technical support.
Conflicts of Interest
The author declares no conflicts of interest.
References
- Ye, B.H.; Ye, H.; Law, R. Systematic Review of Smart Tourism Research. Sustainability 2020, 12, 3401. [Google Scholar] [CrossRef]
- Rodney, S. The Personalization of the Museum Visit. Art Museums, Discourse, and Visitors; Routledge: London, UK, 2019. [Google Scholar]
- Fogli, D.; Arenghi, A. “Design for All” versus “One-Size-Fits-All”: The Case of Cultural Heritage. In Proceedings of the CEUR Workshop Proceedings, Ceske Budejovice, Czech Republic, 1–3 June 2018; Volume 2101, pp. 89–96. [Google Scholar]
- Ifraheem, S.; Rasheed, M.; Siddiqui, A. Transforming Education Through Artificial Intelligence: Personalization, Engagement, and Predictive Analytics. J. Adv. Distrib. Syst. 2024, 13, 22. [Google Scholar] [CrossRef]
- Fernández-Hernández, R.; Vacas-Guerrero, T.; García-Muiña, F.E. Online Reputation and User Engagement as Strategic Resources of Museums. Mus. Manag. Curatorship 2021, 36, 553–568. [Google Scholar] [CrossRef]
- Purificato, E.; Boratto, L.; De Luca, E.W. User Modeling and User Profiling: A Comprehensive Survey. arXiv 2024, arXiv:2402.09660. [Google Scholar]
- Eke, C.I.; Norman, A.A.; Shuib, L.; Nweke, H.F. A Survey of User Profiling: State-of-the-Art, Challenges, and Solutions. IEEE Access 2019, 7, 144907–144924. [Google Scholar] [CrossRef]
- Mokatren, M.; Wecker, A.; Bogina, V.; Kuflik, T. A Museum Visitors Classification Based on Behavioral and Demographic Features. In Proceedings of the ACM UMAP 2019 Adjunct–Adjunct Publication of the 27th Conference on User Modeling, Adaptation and Personalization, Larnaca, Cyprus, 9–12 June 2019; pp. 383–386. [Google Scholar]
- Hijazi, A.N.; Baharin, H. The Effectiveness of Digital Technologies Used for the Visitor’s Experience in Digital Museums. A Systematic Literature Review from the Last Two Decades. Int. J. Interact. Mob. Technol. 2022, 16, 142–159. [Google Scholar] [CrossRef]
- Li, J.; Wider, W.; Ochiai, Y.; Fauzi, M.A. A Bibliometric Analysis of Immersive Technology in Museum Exhibitions: Exploring User Experience. Front. Virtual Real. 2023, 4, 1240562. [Google Scholar] [CrossRef]
- Saihood, G.S.W.; Haddad, A.T.H.; Eyada, F. Personalized Experiences Within Heritage Buildings: Leveraging AI for Enhanced Visitor Engagement. In Proceedings of the 2023 International Conference on Data Science and Engineering (DeSE), Istanbul, Turkey, 18–20 December 2023; p. 10468984. [Google Scholar] [CrossRef]
- Wu, W.; Ghazali, M.; Huspi, S.H. A Review of User Profiling Based on Social Networks. IEEE Access 2024, 12, 122642–122670. [Google Scholar] [CrossRef]
- Yoshimura, Y.; Sinatra, R.; Krebs, A.; Ratti, C. Analysis of Visitors’ Mobility Patterns through Random Walk in the Louvre Museum. J. Ambient. Intell. Humaniz. Comput. 2024, 15, 1643–1658. [Google Scholar] [CrossRef]
- Centorrino, P.; Corbetta, A.; Cristiani, E.; Onofri, E. Managing Crowded Museums: Visitors Flow Measurement, Analysis, Modeling, and Optimization. J. Comput. Sci. 2021, 53, 101357. [Google Scholar] [CrossRef]
- Brida, J.G.; Meleddu, M.; Pulina, M. Understanding Museum Visitors’ Experience: A Comparative Study. J. Cult. Herit. Manag. Sustain. Dev. 2016, 6, 47–71. [Google Scholar] [CrossRef]
- Gupta, R.; Dubey, A.K. Analysing Demographic Trends and Visitors’ Satisfaction at The National Museum, Delhi. PUSA J. Hosp. Appl. Sci. 2024, 10, 8–18. [Google Scholar] [CrossRef]
- Kuflik, T.; Wecker, A.J.; Lanir, J.; Stock, O. An Integrative Framework for Extending the Boundaries of the Museum Visit Experience: Linking the Pre, during and Post Visit Phases. Inf. Technol. Tour. 2015, 15, 17–47. [Google Scholar] [CrossRef]
- Antoniou, A.; Katifori, A.; Roussou, M.; Vayanou, M.; Karvounis, M.; Kyriakidi, M.; Pujol-Tost, L. Capturing the Visitor Profile for a Personalized Mobile Museum Experience: An Indirect Approach. In Proceedings of the CEUR Workshop Proceedings, Ljubljana, Slovenia, 13–17 June 2016. [Google Scholar]
- Gargiulo, R.; Carignani, F. Novel Approaches in Profiling in Museums. In Handbook of Research on Museum Management in the Digital Era; IGI Global: Pennsylvania, PA, USA, 2022; pp. 228–247. [Google Scholar]
- Taormina, F.; Baraldi, S.B. Museums and Digital Technology: A Literature Review on Organizational Issues. In Rethinking Culture and Creativity in the Digital Transformation; Routledge: London, UK, 2023; pp. 69–87. [Google Scholar]
- Verde, D.; Romero, L.; Faria, P.M.; Paiva, S. Indoor Content Delivery Solution for a Museum Based on BLE Beacons. Sensors 2023, 23, 7403. [Google Scholar] [CrossRef] [PubMed]
- Spachos, P.; Plataniotis, K.N. BLE Beacons for Indoor Positioning at an Interactive IoT-Based Smart Museum. IEEE Syst. J. 2020, 14, 3483–3493. [Google Scholar] [CrossRef]
- Chianese, A.; Piccialli, F. Designing a Smart Museum: When Cultural Heritage Joins IoT. In Proceedings of the 8th International Conference on Next Generation Mobile Applications, Services and Technologies, NGMAST 2014, Oxford, UK, 10–12 September 2014; pp. 300–306. [Google Scholar]
- Mohamed, S.; Sethom, K.; Namoun, A.; Tufail, A.; Kim, K.H.; Almoamari, H. Customer Profiling Using Internet of Things Based Recommendations. Sustainability 2022, 14, 11200. [Google Scholar] [CrossRef]
- Arvaniti-Bofili, M.; Gkouskos, S.; Kalampokis, K.; Papaioannou, G.; Gogolos, G.; Chaldeakis, I.; Petridis, K.; Magoutis, K. Towards Personalized Recommendations in an IoT-Driven Tour Guide Platform. In Proceedings of the Communications in Computer and Information Science, Virtual Event, 8–10 July 2020; Volume 1310, pp. 3–11. [Google Scholar]
- Ronco, F. Smart Technologies in the Museum Environment: AR Experiments on Physical Models at the Museum of Oriental Art in Turin. In Proceedings of the 2024 Conference on Human-Computer Interaction in Museums, Honolulu, Hawaii, 11–16 May 2024; p. 17472. [Google Scholar]
- Sepe, F.; Marzullo, M. Making Smarter Museums Through New Technologies. In Handbook of Research on Museum Management in the Digital Era; IGI Global: Pennsylvania, PA, USA, 2022; pp. 75–98. [Google Scholar]
- Carolis, B.D.; Macchiarulo, N.; Bochicchio, M.A. AI-Assisted Virtual Reality for Cultural Heritage Education: The Experience of the MARTA Museum. In Proceedings of the 2023 IEEE Conference on Experimental Technology and Digital Humanities, Marina Bay Sands, Singapore, 20–22 June 2023. [Google Scholar]
- Ferrato, A.; Limongelli, C.; Mezzini, M.; Sansonetti, G. Using Deep Learning for Collecting Data about Museum Visitor Behavior. Appl. Sci. 2022, 12, 533. [Google Scholar] [CrossRef]
- Yan, T. Research and Application of AI-Based Interactive Exhibits in Wuhan Museum of Science and Technology. J. Educ. Res. Appl. 2024, 8, 6091. [Google Scholar] [CrossRef]
- Blud, L.M. Social Interaction and Learning Among Family Groups Visiting a Museum. Mus. Manag. Curatorship 1990, 9, 43–51. [Google Scholar] [CrossRef]
- Tolmie, P.; Benford, S.; Greenhalgh, C.; Rodden, T.; Reeves, S. Supporting Group Interaction in Museum Visiting. In Proceedings of the Proceedings of the ACM Conference on Computer Supported Cooperative Work, CSCW, Baltimore, MD, USA, 15–19 February 2014; pp. 1049–1059. [Google Scholar]
- Shaby, N.; Assaraf, O.B.Z.; Koch, N.P. Students’ Interactions During Laboratory Group Activity in a Science Museum. Int. J. Sci. Math. Educ. 2024, 22, 703–720. [Google Scholar] [CrossRef]
- Fosh, L.; Lorenz, K.; Benford, S.; Koleva, B. Personal and Social? Designing Personalized Experiences for Groups in Museums. In Proceedings of the MW2015: Museums and the Web, Chicago, IL, USA, 8–11 April 2015. [Google Scholar]
- Massarani, L.; Norberto Rocha, J.; Scalfi, G.; Silveira, Y.; Cruz, W.; Lage dos Santos Guedes, L. Families Visit the Museum: A Study on Family Interactions and Conversations at the Museum of the Universe-Rio de Janeiro (Brazil). Front. Educ. 2021, 6, 669467. [Google Scholar] [CrossRef]
- Tsiropoulou, E.E.; Thanou, A.; Paruchuri, S.T.; Papavassiliou, S. Self-Organizing Museum Visitor Communities: A Participatory Action Research Based Approach. In Proceedings of the 12th International Workshop on Semantic and Social Media Adaptation and Personalization, SMAP, Bratislava, Slovakia, 9–10 July 2017; pp. 101–105. [Google Scholar]
- Stryker Co. Vocera V. Series Smartbadge User Guide. Available online: https://pubs.vocera.com/device/vseries/production/docs/vseries_v5000_user_guide.pdf (accessed on 14 August 2024).
- Abeeway Co. Datasheet DEABE3XX v1.7. Available online: https://www.abeeway.com/wp-content/uploads/2021/03/Abeeway_Badge-data-sheet_14.pdf (accessed on 14 August 2024).
- Kontakt.io Inc. Smart Badge Technical Specification. Available online: https://kontakt.io/app/uploads/2023/11/Technical-Specifications-Smart-Badge.pdf (accessed on 14 August 2024).
- Caneschi, F.; Ammendola, G. Pin: A Smart Wearable Badge to Track and Augment Your Museum Experience; Museo Marino Marini: Firenze, Italy, 2019; pp. 1–16. [Google Scholar]
- Park, G.; Oh, H.; Lim, B.C.; Khoo, B.L.Z. Can Smart Technology Make Group Members More Creative? The Effect of Interactive Feedback Using Sociometric Badges on Members’ Creativity. Behav. Inf. Technol. 2023, 42, 2452–2466. [Google Scholar] [CrossRef]
- De Jode, M.; Hudson-Smith, A.; Mavros, P.; Coulton, P.; Huck, J.; Roberts, J.; Powell, P. Showing Mutual Support Through Digital Empathy Badges. In Proceedings of the UbiComp and ISWC 2015—Proceedings of the 2015 ACM International Joint Conference on Pervasive and Ubiquitous Computing and the Proceedings of the 2015 ACM International Symposium on Wearable Computers, Osaka, Japan, 9–11 September 2015; pp. 1–4. [Google Scholar]
- Su, C.M.; Shi, C.Y.; Wu, Y.L.; Lee, H.C. Demo Abstract: A LoRa Wireless Smart Badge for Enhancing Museum Visitors’ Experience. In Proceedings of the 2017 16th ACM/IEEE International Conference on Information Processing in Sensor Networks, IPSN 2017, Pittsburgh, PA, USA, 18–21 April 2017; pp. 261–262. [Google Scholar]
- Ivanov, R. ExhibitXplorer: Enabling Personalized Content Delivery in Museums Using Contextual Geofencing and Artificial Intelligence. ISPRS Int. J. Geo-Inf. 2023, 12, 434. [Google Scholar] [CrossRef]
- Harisha, A.; Salian, L.; Yermal, A.; Shastry, C.G.A. Open Standard Authorization Protocol: OAuth 2.0 Defenses and Working Using Digital Signatures. In Advancements in Cybercrime Investigation and Digital Forensics; Apple Academic Press: Palm Bay, FL, USA, 2023; pp. 319–344. ISBN 9781000840834. [Google Scholar]
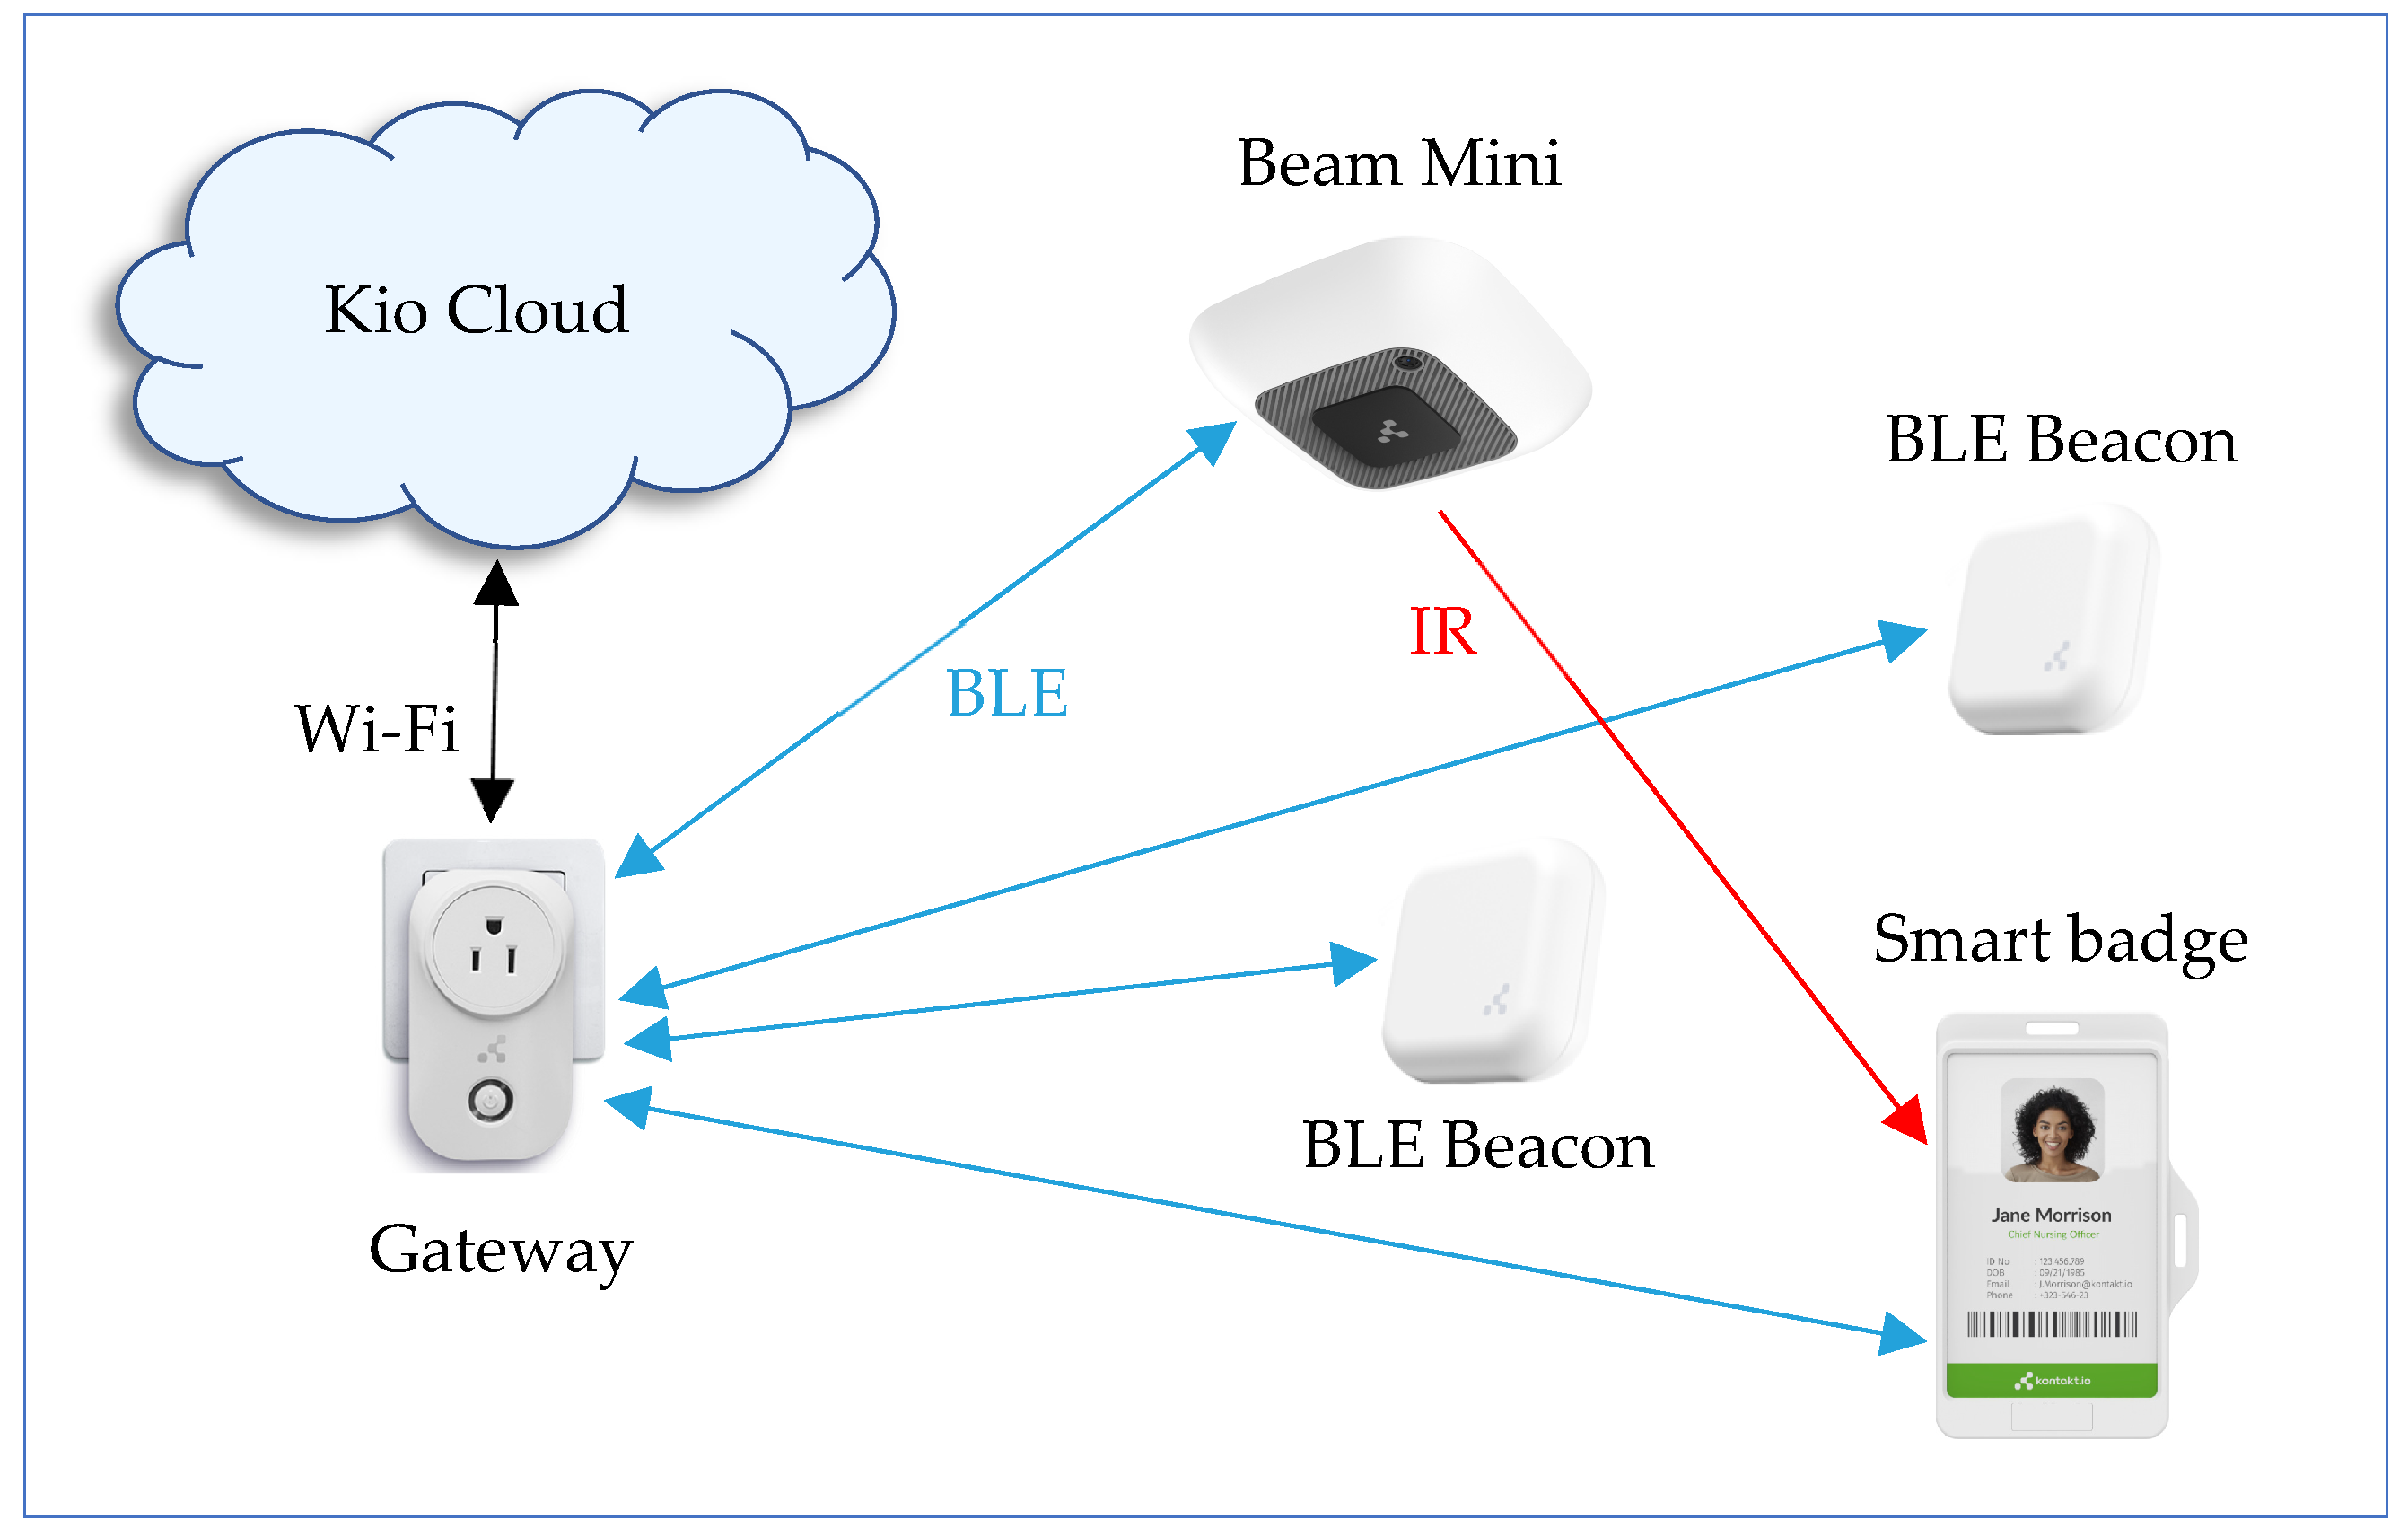
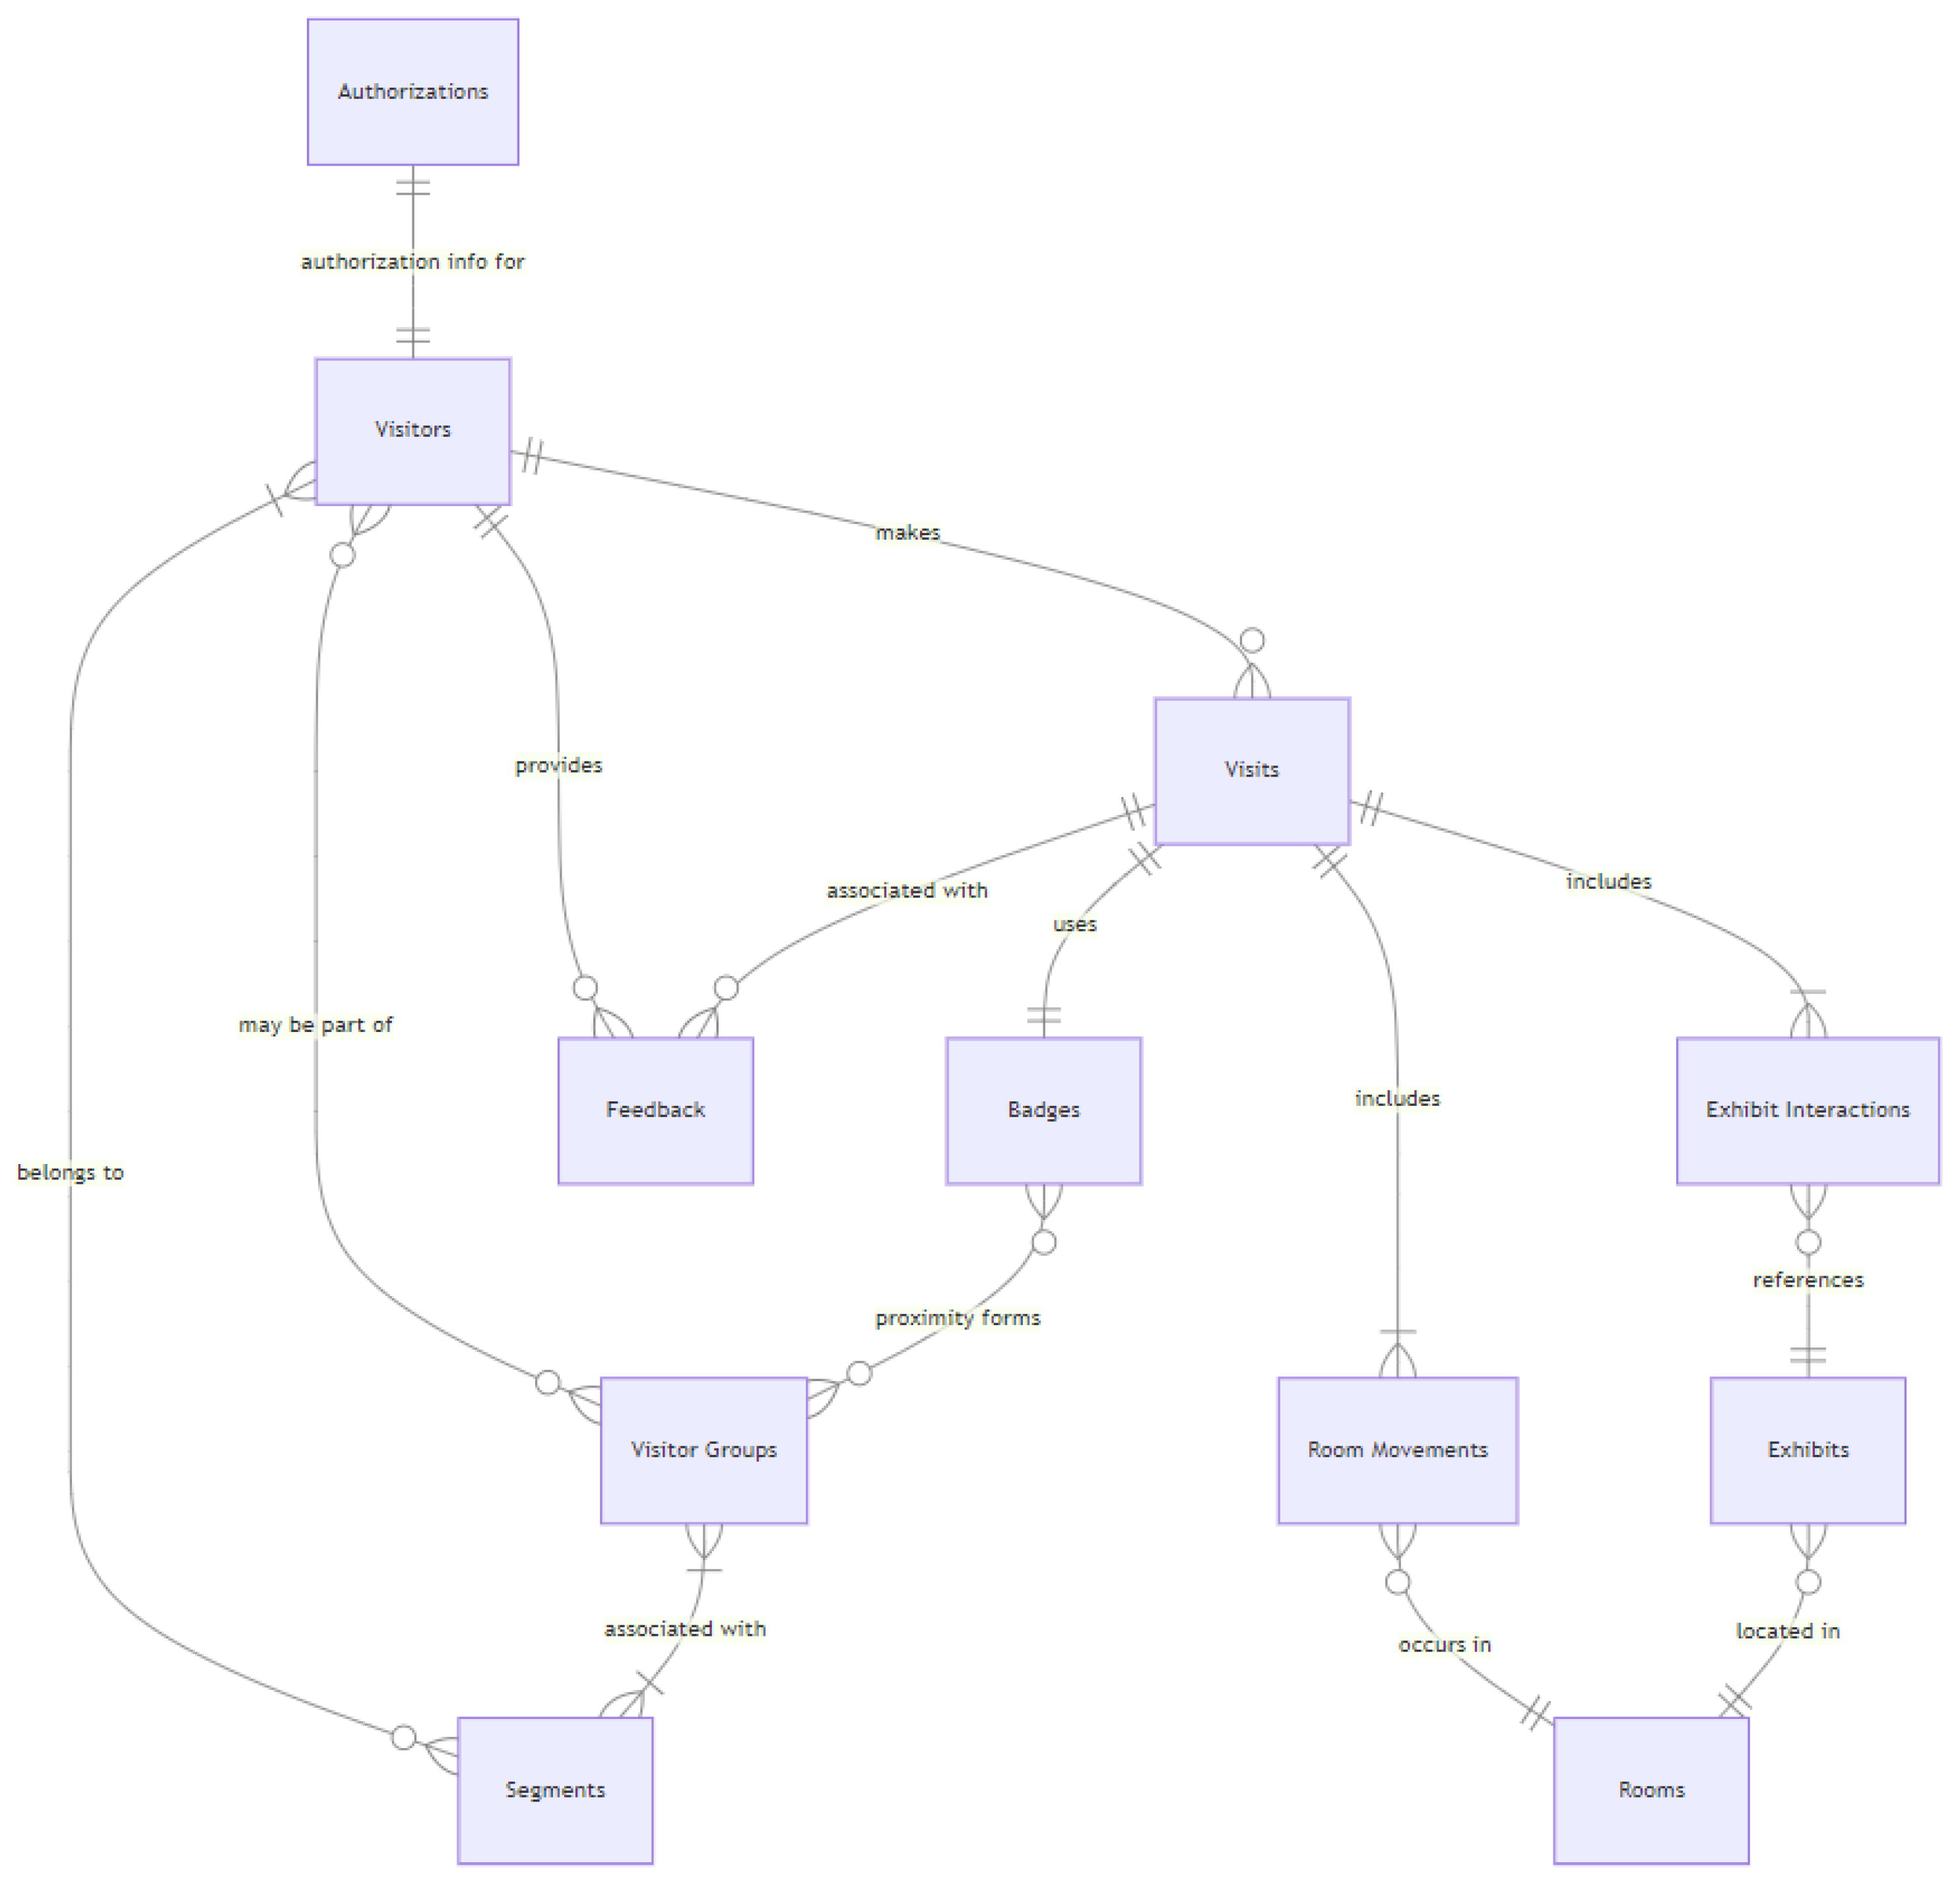
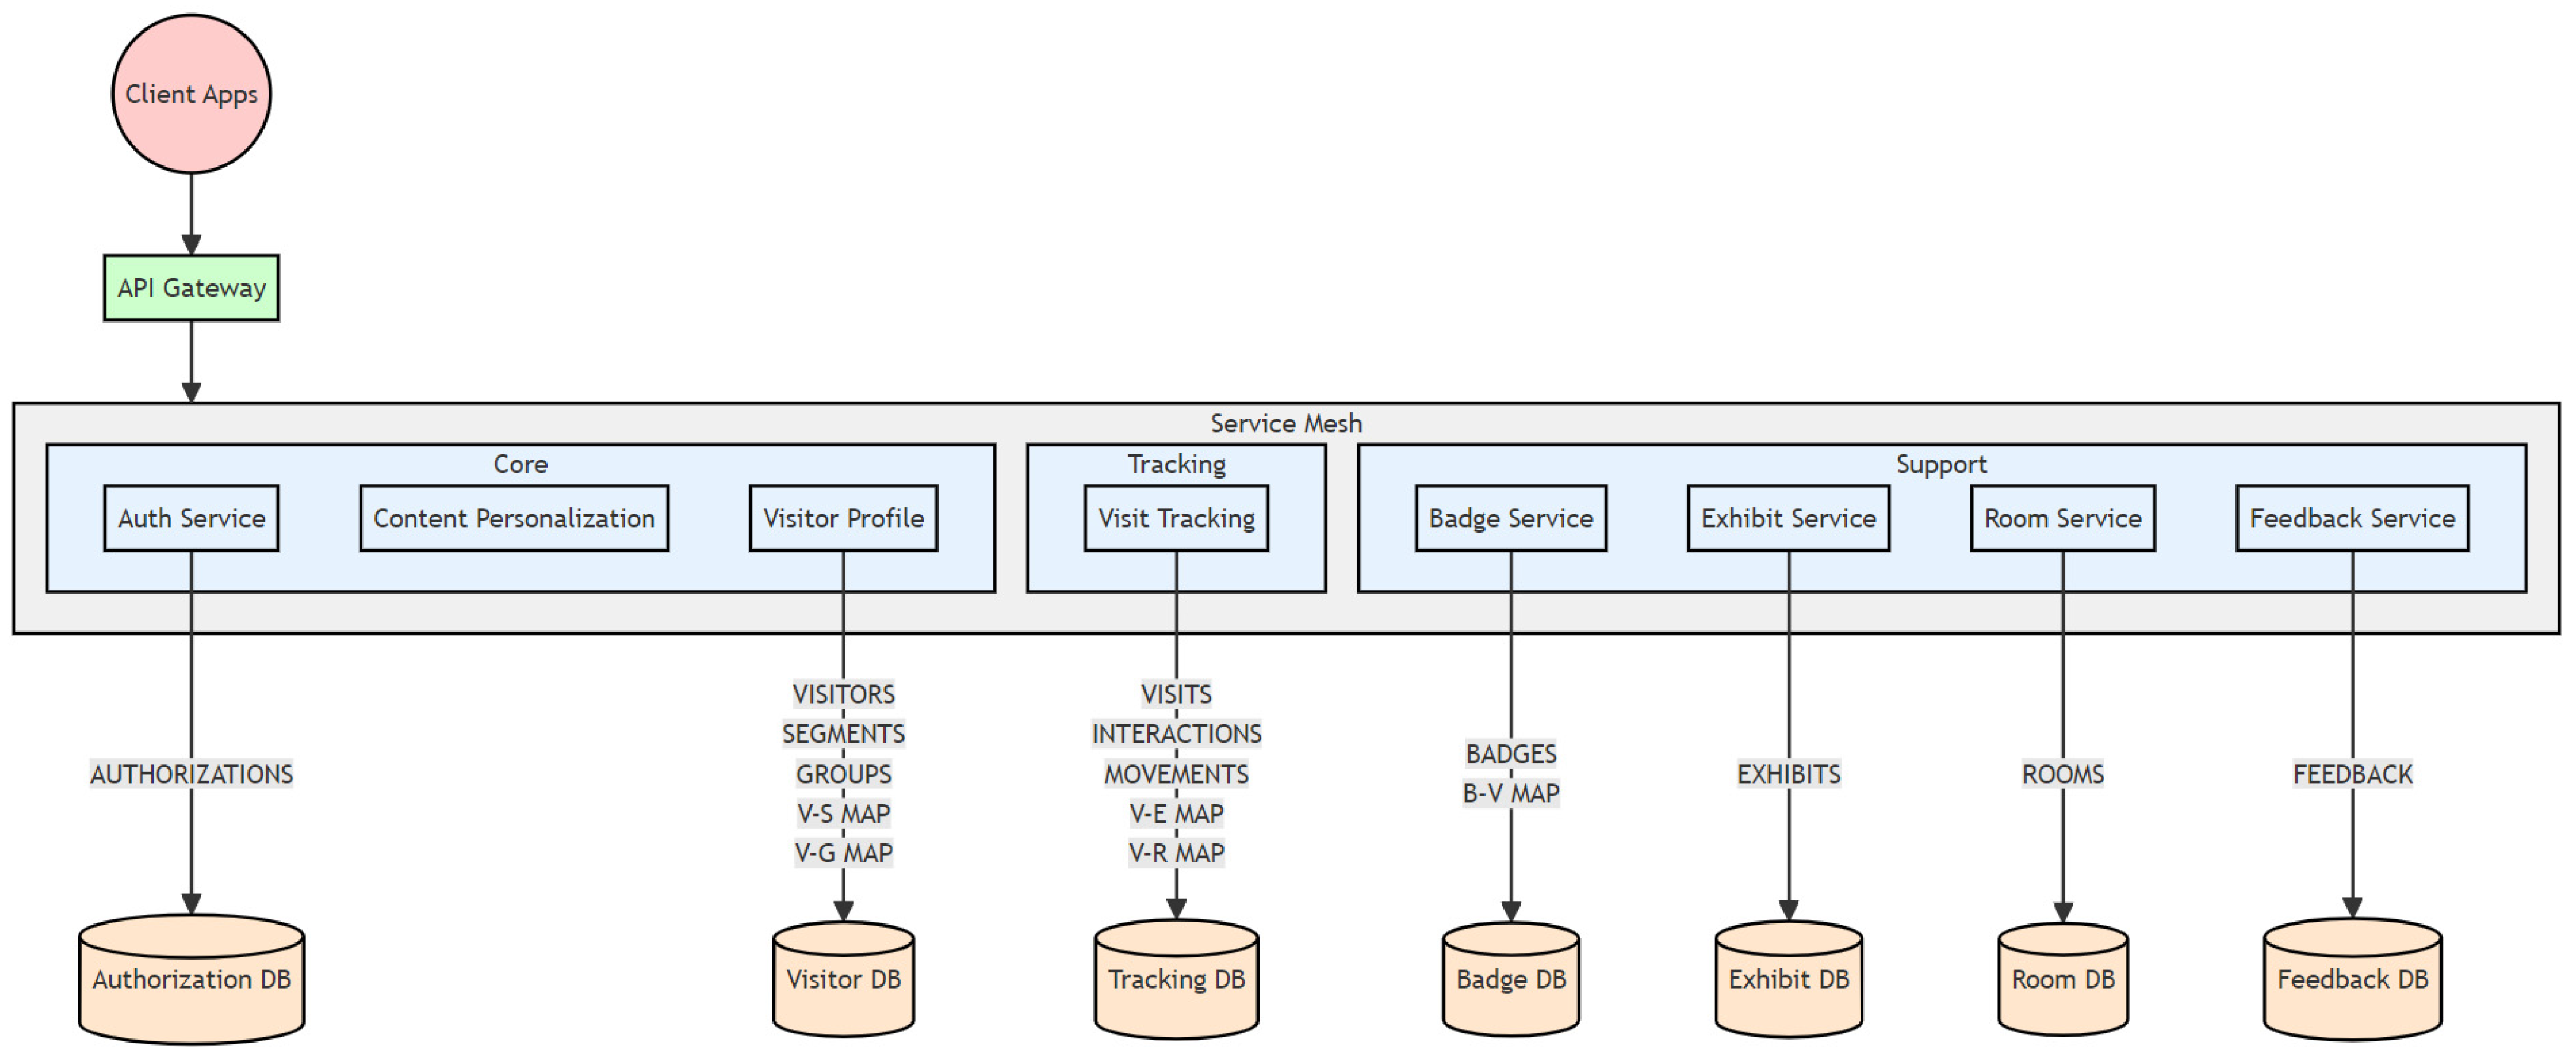
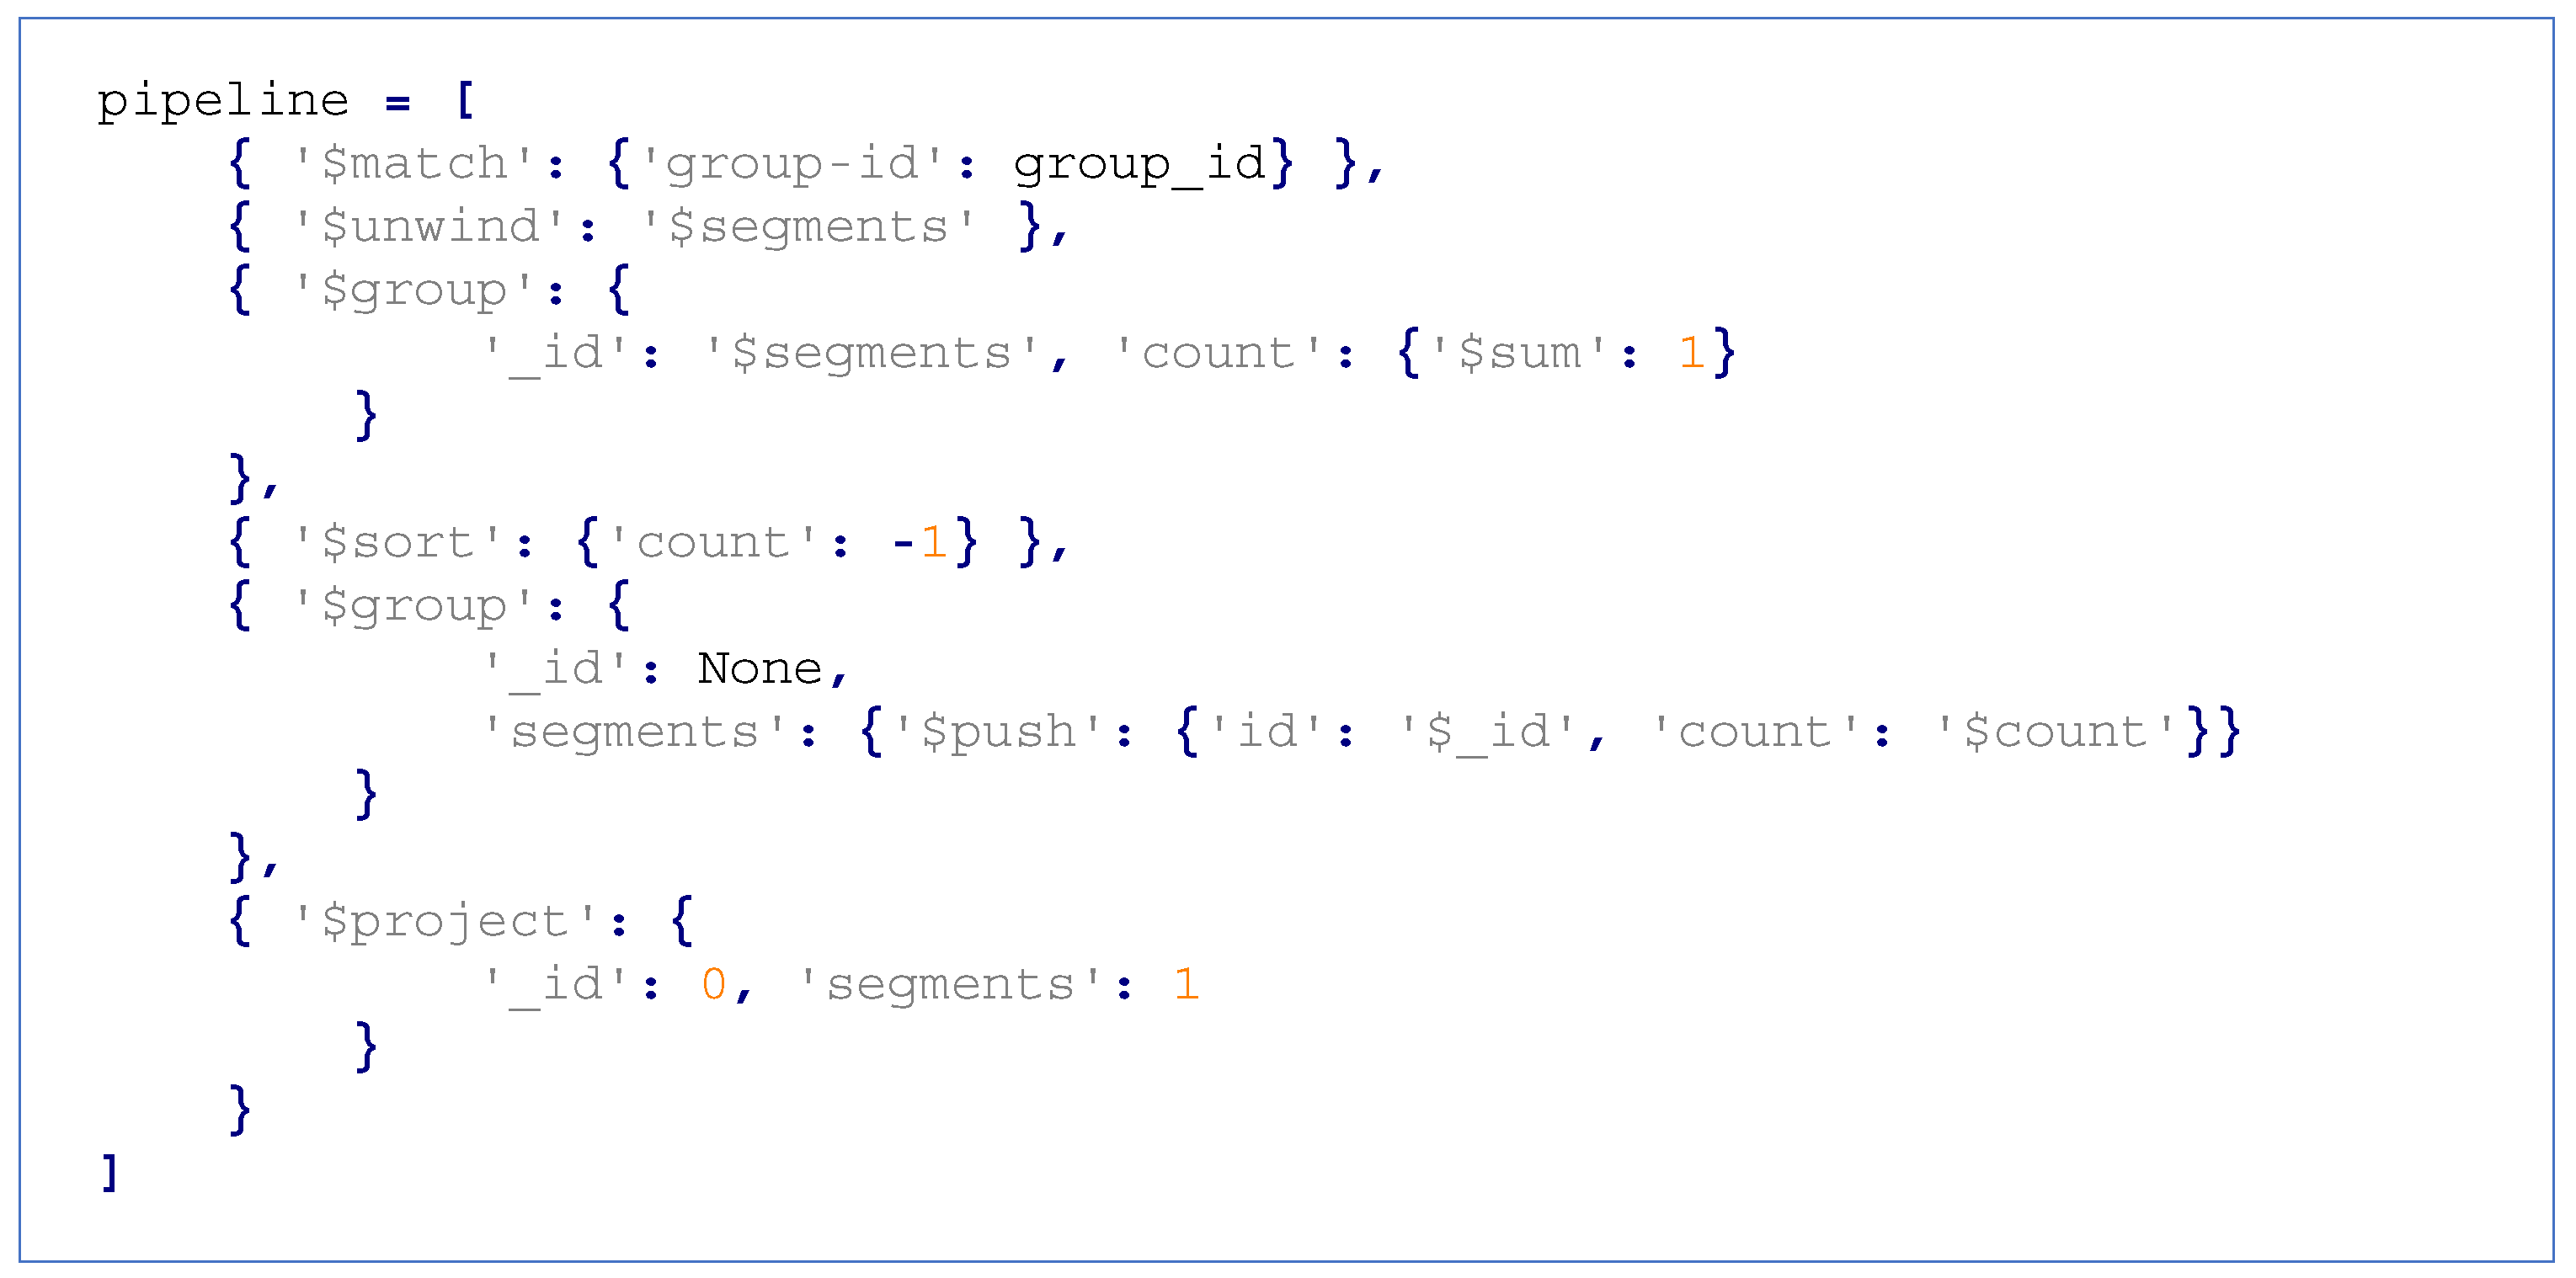
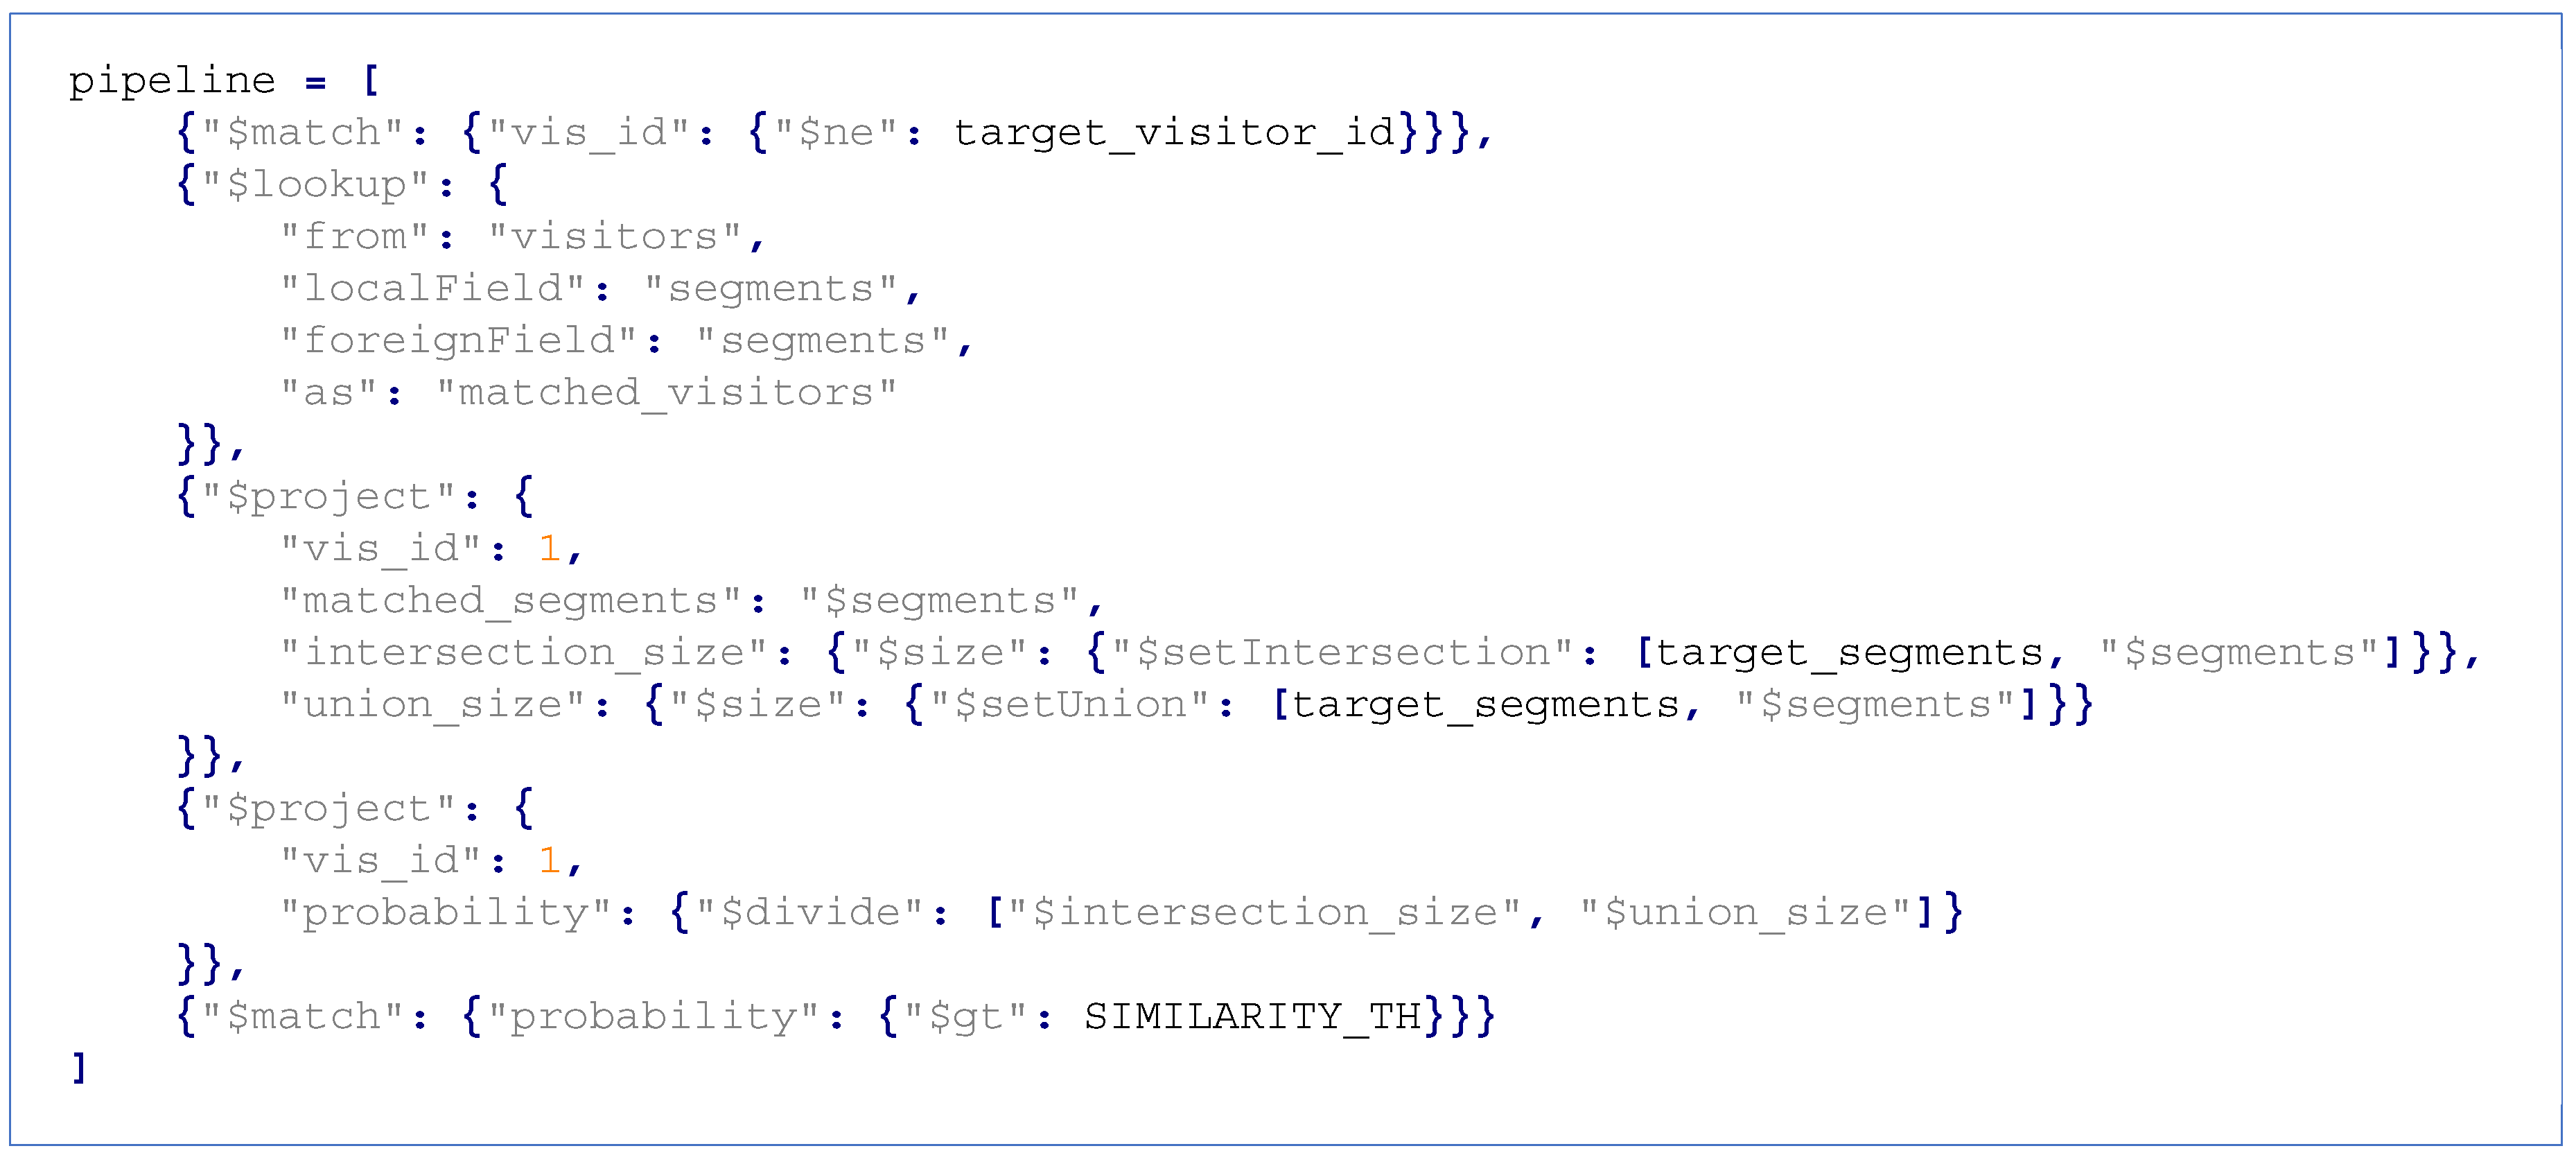
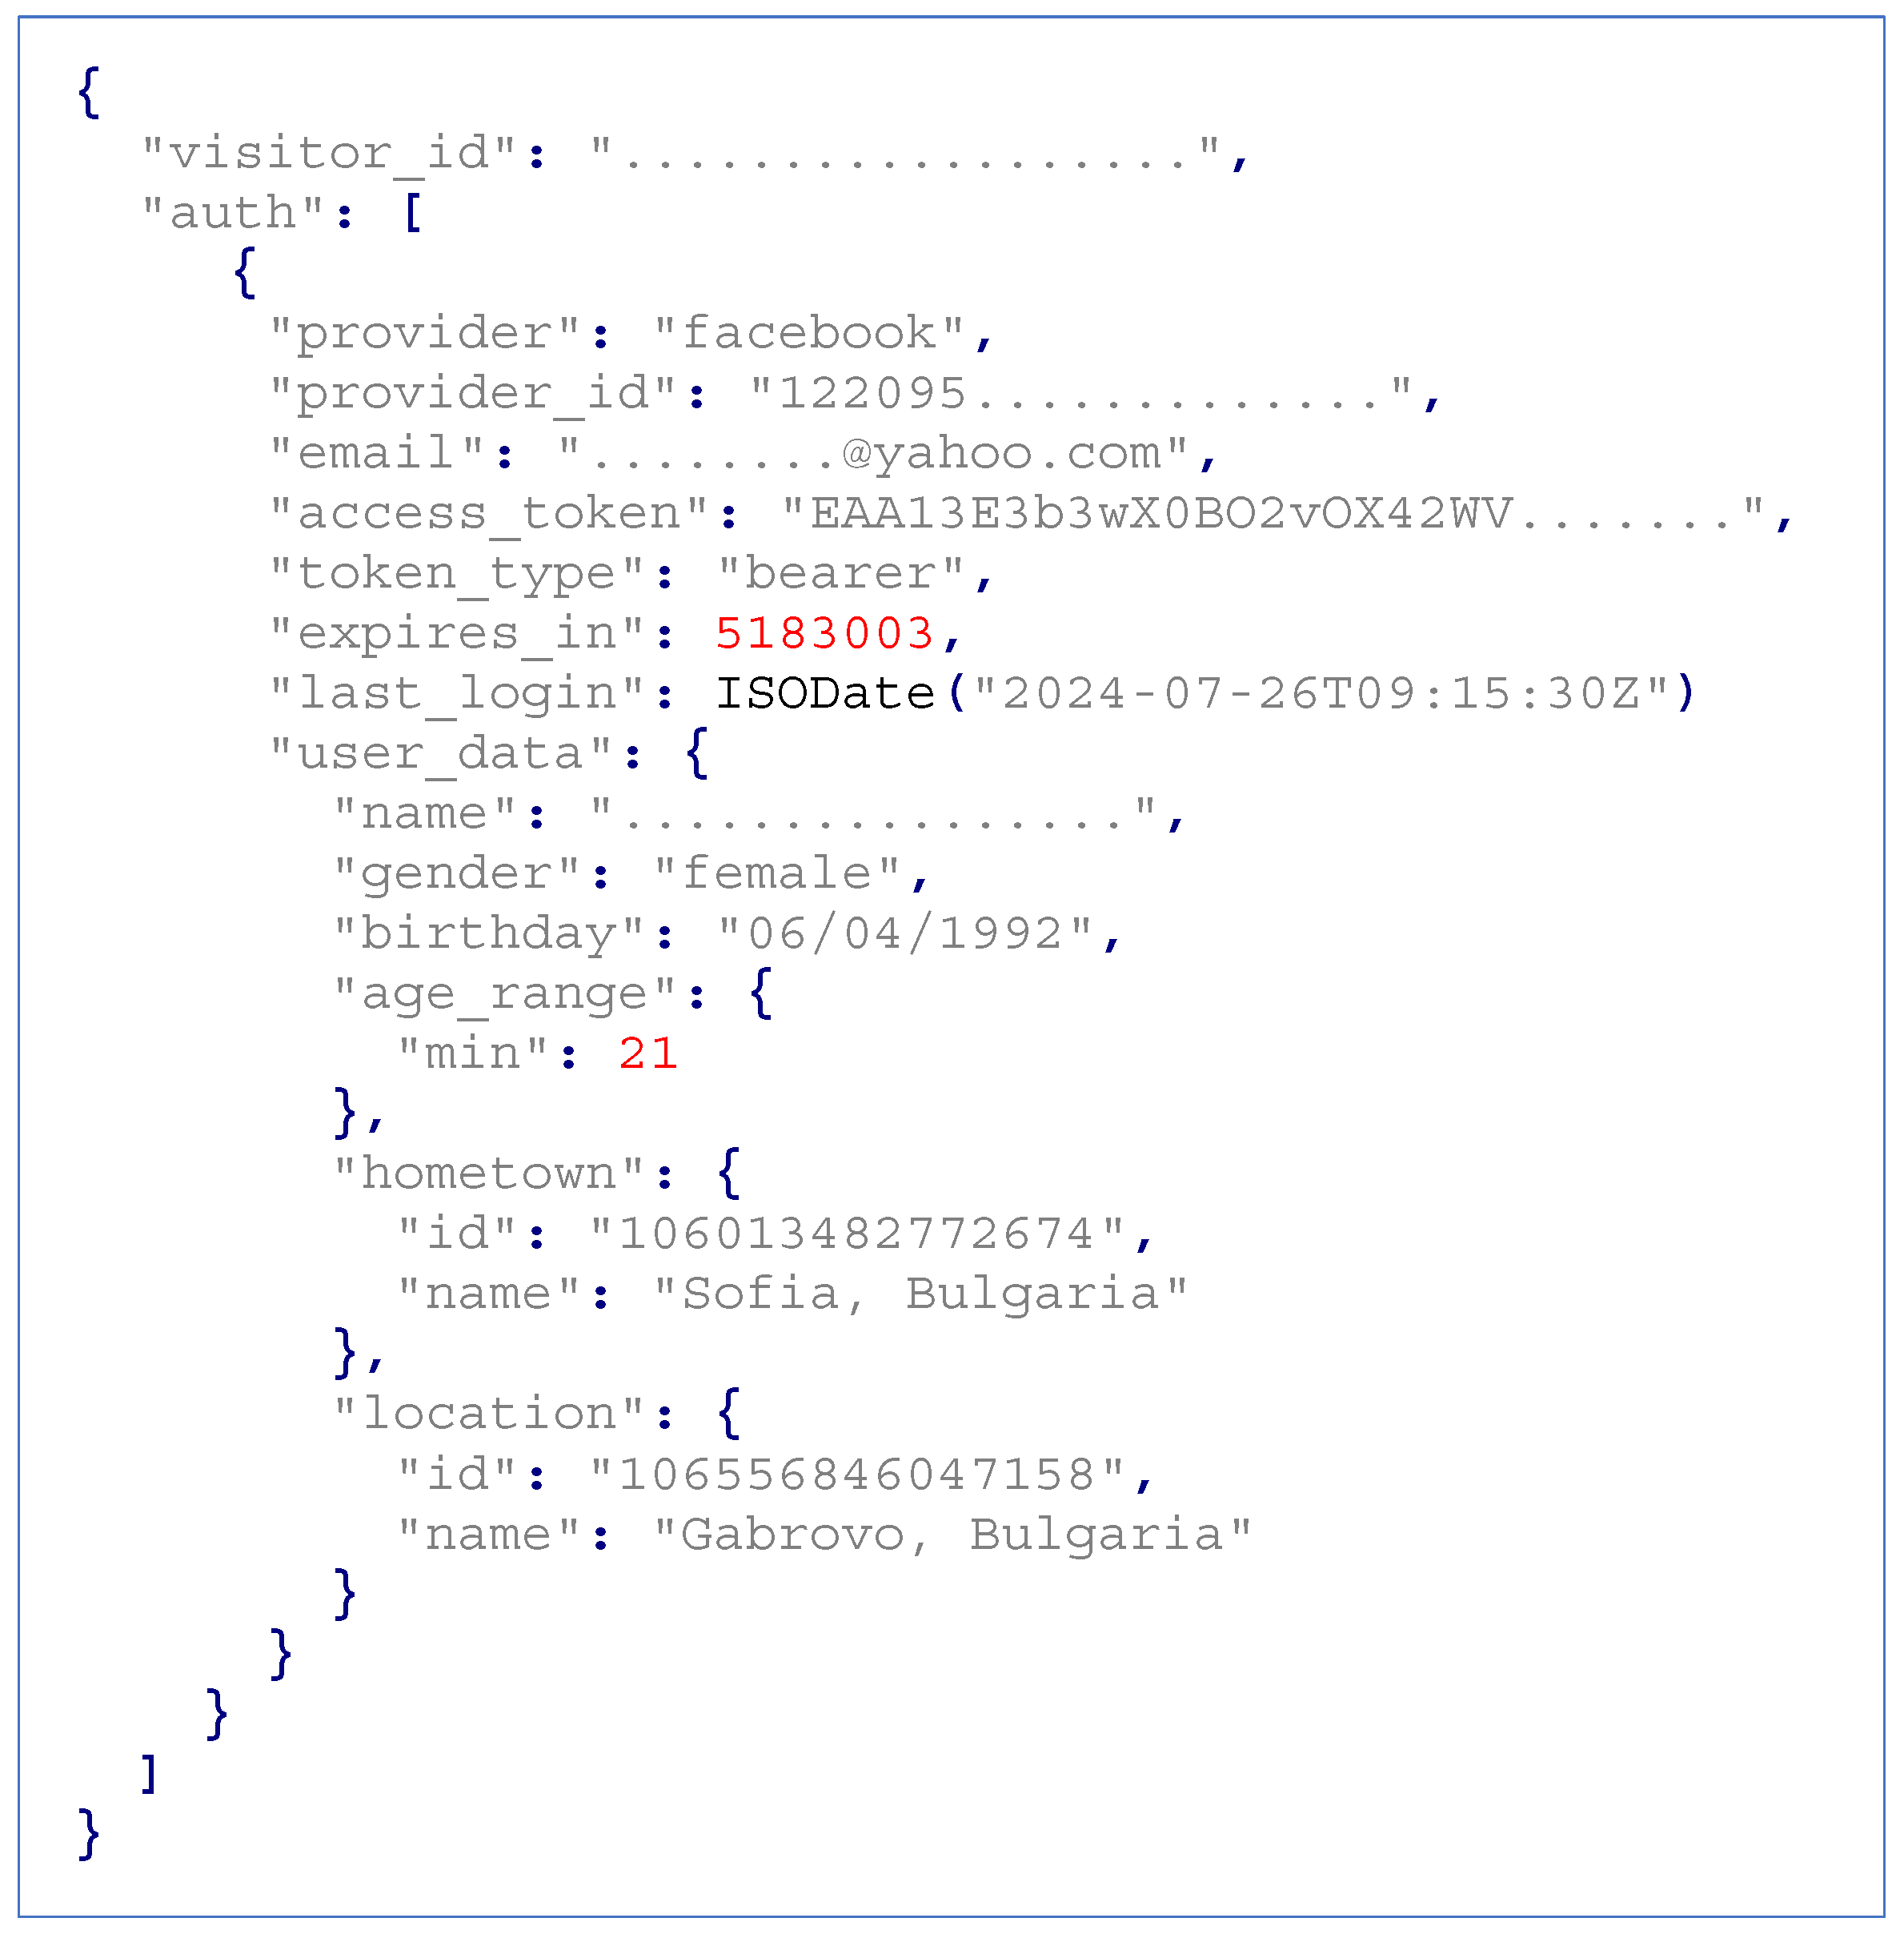

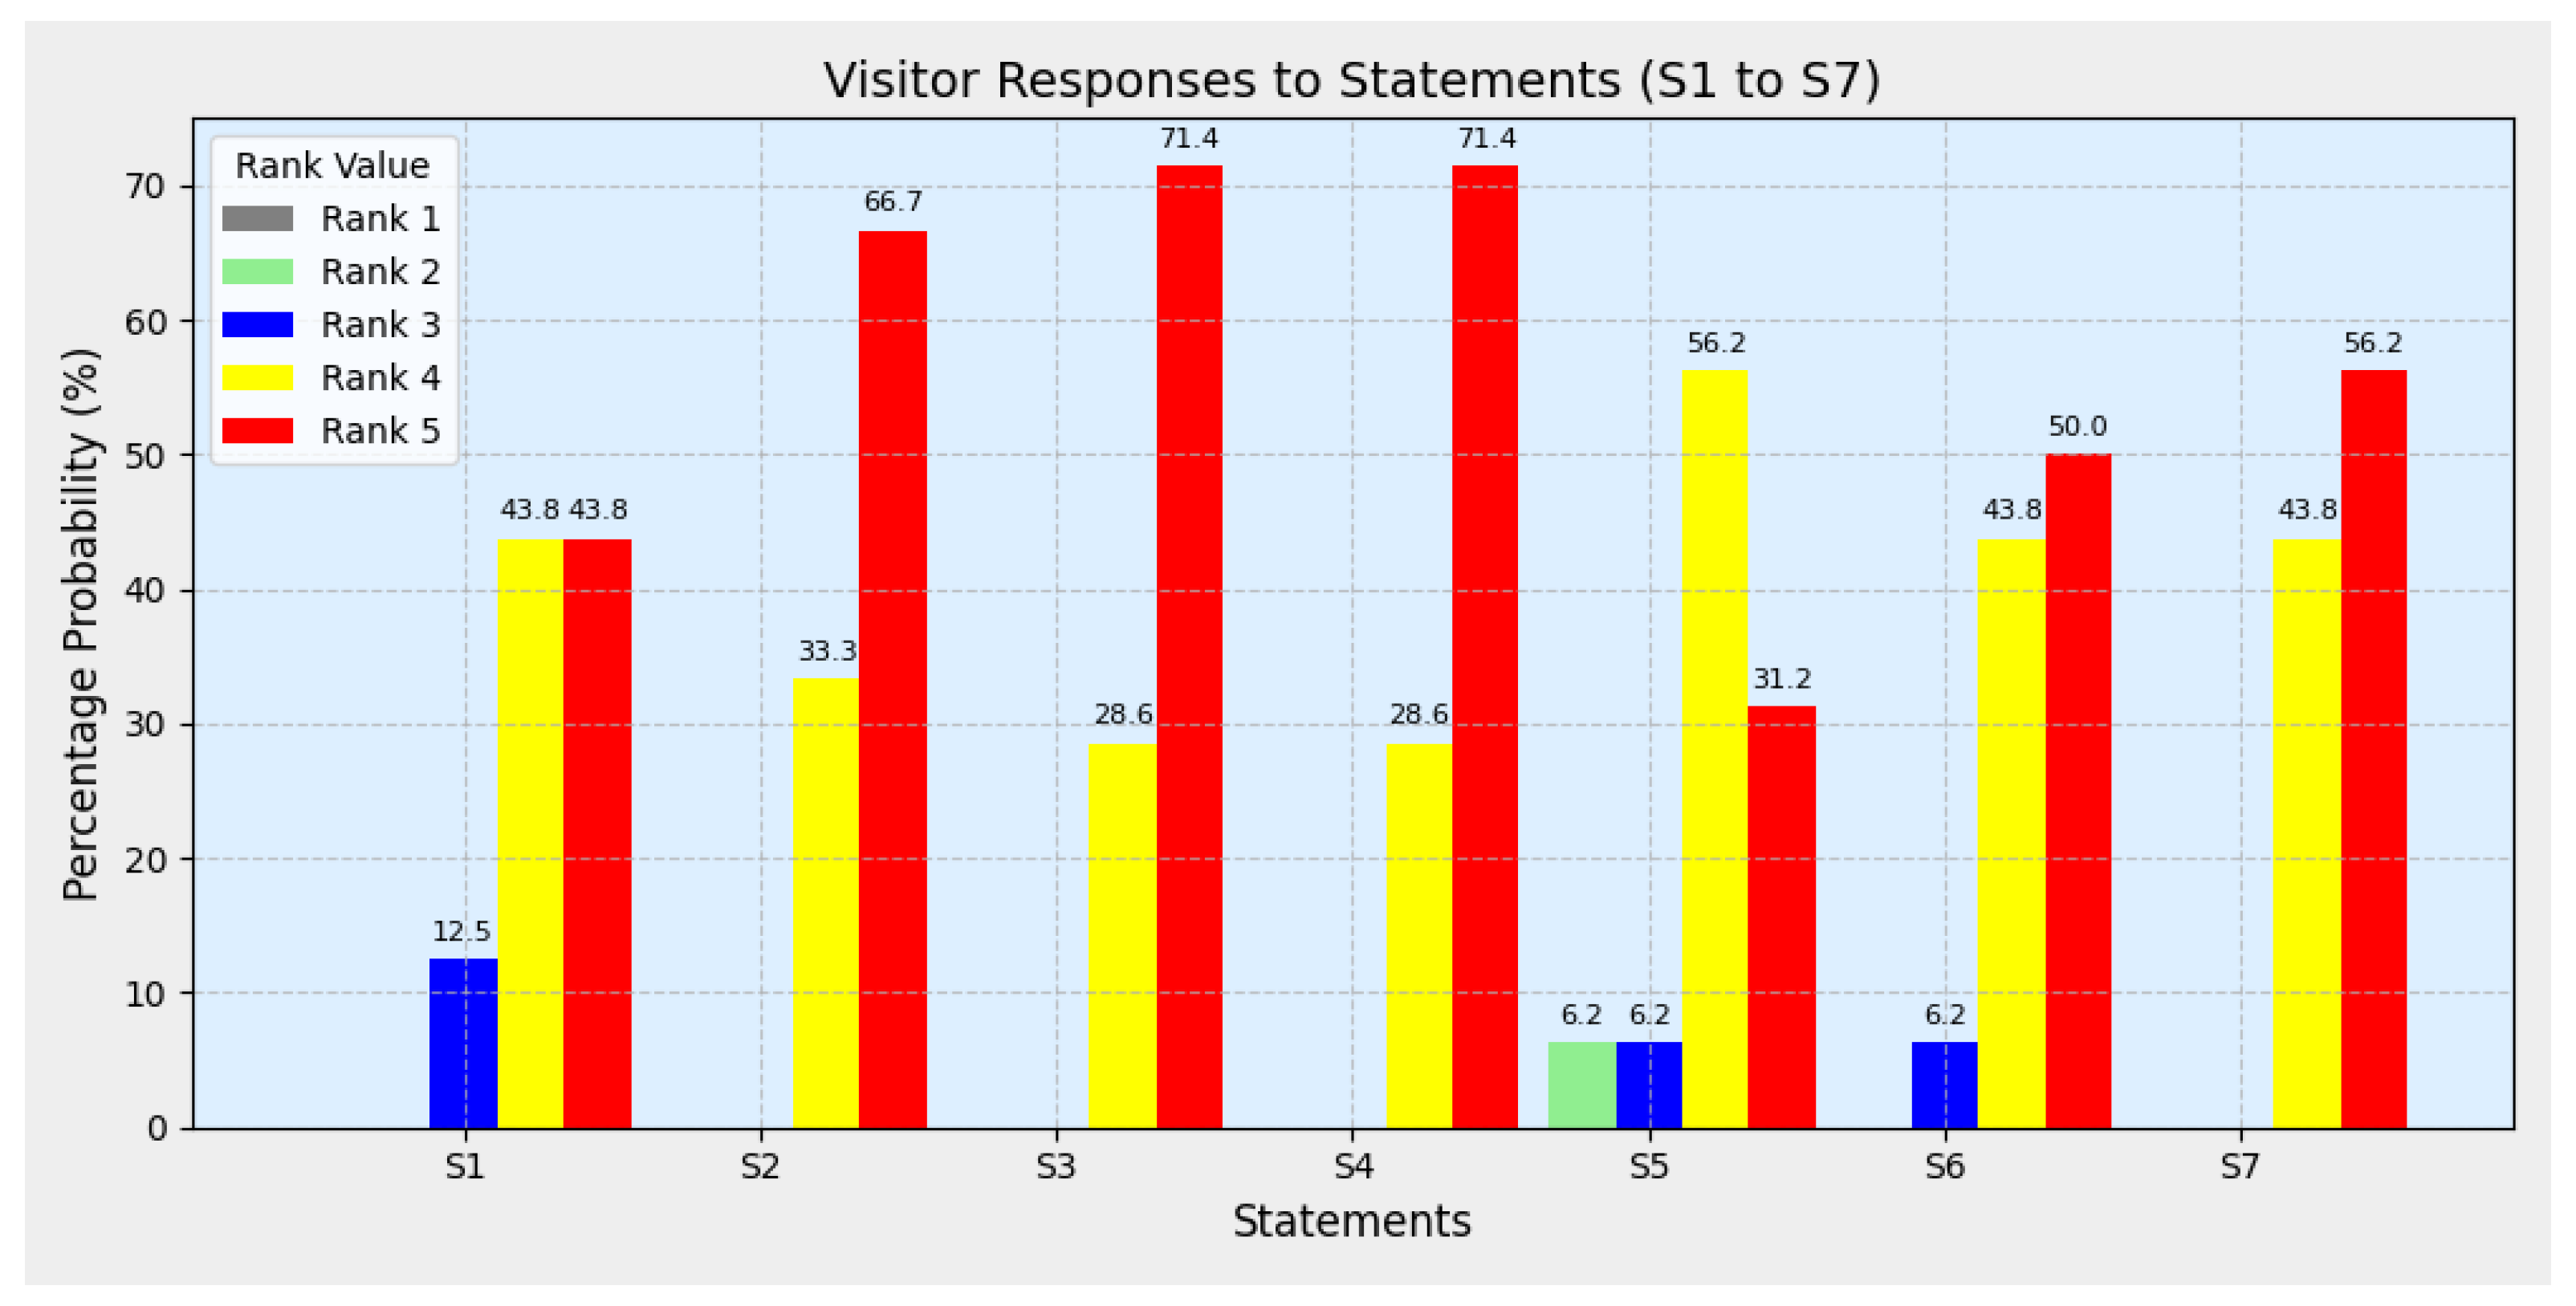
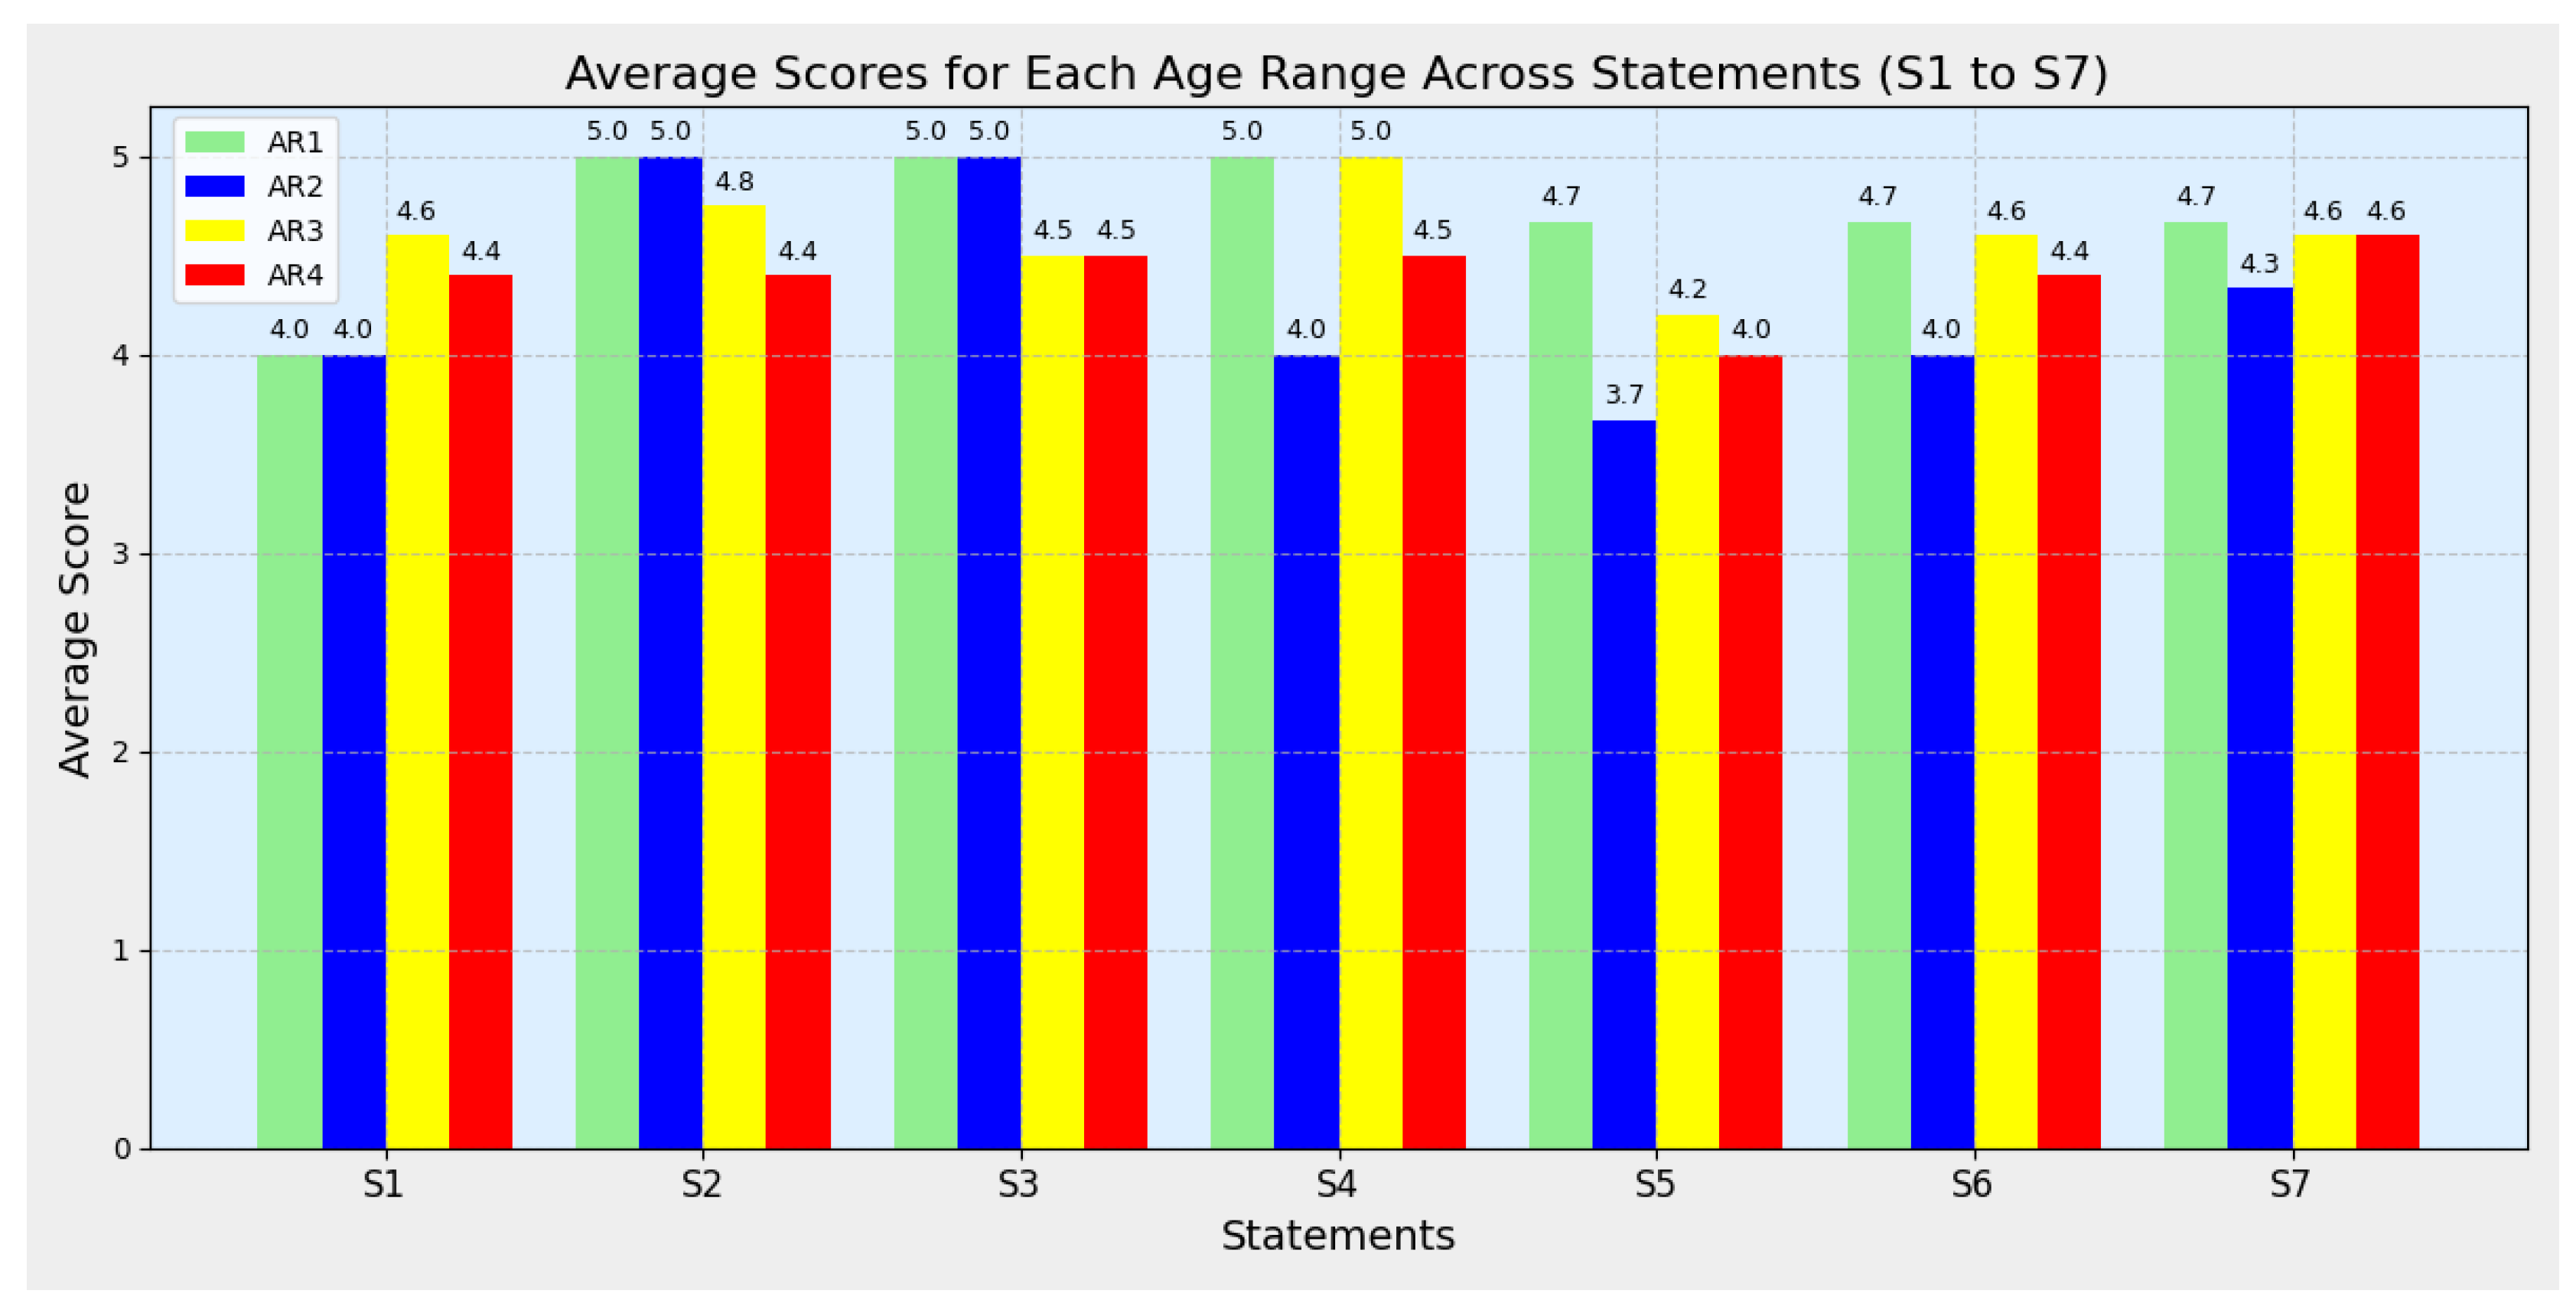
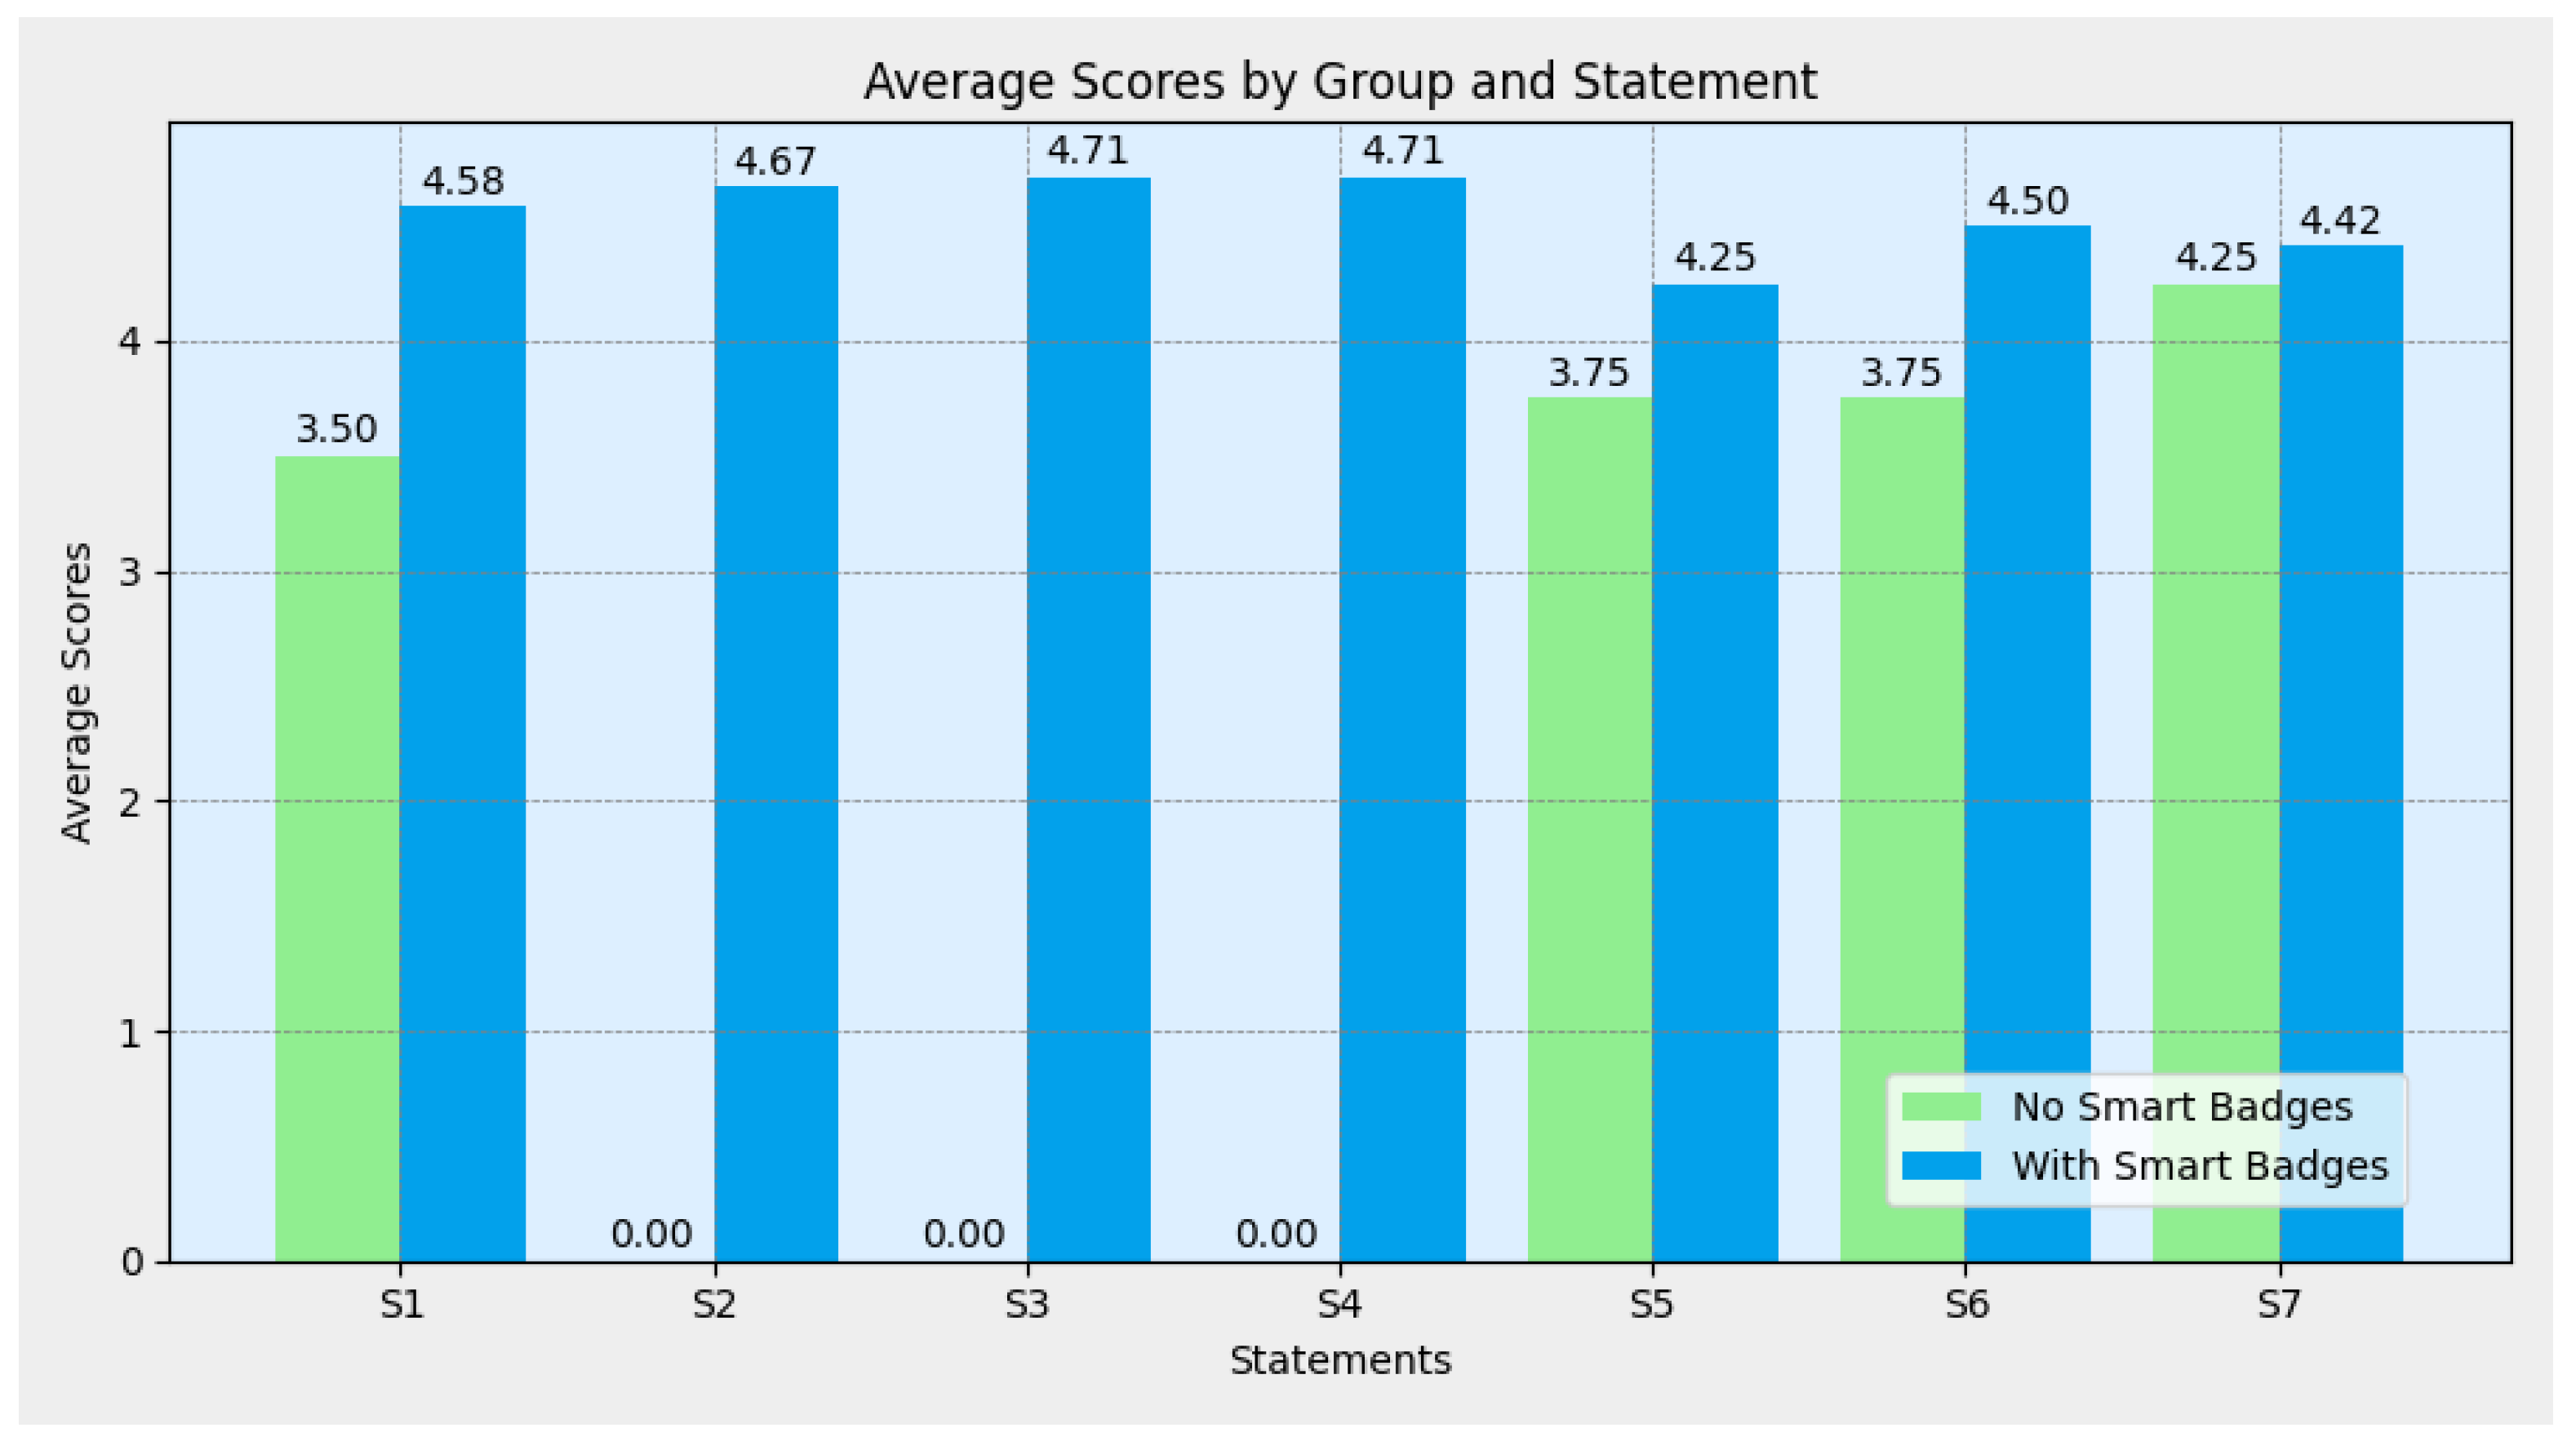
Disclaimer/Publisher’s Note: The statements, opinions and data contained in all publications are solely those of the individual author(s) and contributor(s) and not of MDPI and/or the editor(s). MDPI and/or the editor(s) disclaim responsibility for any injury to people or property resulting from any ideas, methods, instructions or products referred to in the content. |
© 2024 by the author. Licensee MDPI, Basel, Switzerland. This article is an open access article distributed under the terms and conditions of the Creative Commons Attribution (CC BY) license (https://creativecommons.org/licenses/by/4.0/).