Abstract
As the proportion of renewable energy in energy use continues to increase, to solve the problem of line impedance mismatch leading to the difference in the state of charge (SOC) of each distributed energy storage unit (DESU) and the DC bus voltage drop, a distributed energy storage system control strategy considering the time-varying line impedance is proposed in this paper. By analyzing the fundamental frequency harmonic components of the pulse width modulation (PWM) signal carrier of the converter output voltage and output current, we can obtain the impedance information and, thus, compensate for the bus voltage drop. Then, a novel, droop-free cooperative controller is constructed to achieve SOC equalization, current sharing, and voltage regulation. Finally, the validity of the system is verified by a hardware-in-the-loop experimental platform.
1. Introduction
The renewable energy in energy use is increasing, with the renewable energy in the global electricity mix rising from the current 30 per cent to nearly 50 per cent by 2030. Microgrids can be an effective model for load management, renewable energy management, and energy storage system (ESS) management [1,2]. For the past few years, DC microgrids have been investigated because they integrate DC loads and DC sources more efficiently and easily than AC microgrids [3]. In DC microgrids, various energy storage systems can improve power quality and overcome the intermittency of renewable energy sources [4,5,6]. However, in the case of an unbalanced state of charge (SOC), ESS may experience overcharging or deep discharge, which may affect the battery’s lifespan [7]. Therefore, it is necessary to consider SOC issues to ensure SOC balance.
Therefore, many researchers have proposed various approaches to cope with the problem of SOC balance. References [8,9] proposes an adaptive droop control method in which the droop coefficient is related to the SOC so that each energy storage output power is allocated according to its SOC and battery capacity, thus achieving SOC equalization. The method proposed in [10] equalizes the change slope of SOC. However, when the SOC initial value is different, the equalization control of SOC cannot be realized, which is lack of universality. Reference [11] proposes an accurate power sharing scheme for distributed energy storage systems (DESS), which achieves SOC balancing through improved sag control and introduction of a virtual power rating, and maintains the output voltage average of the DESS at the nominal value through a voltage restoration approach. Reference [12] proposes the use of a consistency algorithm to achieve SOC equalization and incorporates sliding mode control to improve the reliability of the control strategy. Reference [13] designed a multi-agent sliding mode algorithm to charge and discharge the energy storage unit (ESU) with a large charge state and the ESU with a small charge state together, which can quickly achieve SOC equalization of the ESU, but it is still unable to avoid the overcharging and discharging of the ESU when the transient output power is large. Exponential function was used to adjust the dynamic consistency algorithm in [14] to improve its ability to identify the difference of state variables, which can accelerate the SOC convergence speed.
In the equalization control strategy proposed in the above study, the ideal control effect cannot be achieved without considering the effect of line impedance. Virtual impedance has been added to the control to simulate the effect of impedance on the droop control in [15], thus counteracting the effect of line impedance on load distribution and giving a better equalization effect. In [16], the line resistance is compensated to the droop control, and a communication interruption control formula is additionally set to guarantee the control effect, but its control algorithm is relatively complex. A new parameter, ‘virtual voltage drop’, is defined from the droop coefficient and line resistance in [17]; meanwhile, the DC bus voltage does not need to be used as a feedback signal. Reference [18] injects a short-time small voltage perturbation on the DC bus reference voltage and uses a closed-loop estimation algorithm to estimate the line impedance value associated with the DC/DC converter in the DC microgrid. Reference [19] proposes a dynamic droop coefficient correction control, dynamically adjusting each converter’s droop coefficient to cope with the impact of uncertain line impedance. Reference [20] proposed using a recursive least squares algorithm for online estimation of feeder resistance, eliminating the need to test the actual feeder resistance at the design stage.
In the above research content, references [9,12,13,14] are verified based on simulation software, references [8,16,17] are verified by a hardware-in-the-loop experimental platform, and references [10,11,15,18,19,20] are verified by building hardware models. For comprehensive consideration, this paper carries out experimental verification based on the hardware-in-the-loop experimental platform.
In summary, the above methods are based on the analysis of droop control, which may bring some new problems, affecting system stability.
A control strategy for DESS considering time-varying line impedance is proposed. The main contributions are:
- (1)
- The proposed strategy can achieve impedance detection without additional hardware, which is more stable and practical. The strategy effectively utilizes high-frequency ripple, a characteristic of power electronic converters. The calculation of line impedance values using characteristics and microgrid topology compensates for bus voltage drops caused by line impedance.
- (2)
- An inverse tangent function is introduced as an SOC information state factor. By adjusting one parameter of the function, the accuracy and speed of SOC balance can be improved, thereby simplifying the complexity of the design.
The rest of the paper is organized as follows. Section 2 analyzes the structure and control of the DC microgrid. Detailed analysis was conducted on the proposed scheme in Section 3. Section 4 analyzes the system’s stability. Section 5 obtains the parameter range, keeping the system running stably via the simulation result. Section 6 presents the experimental results to confirm the feasibility of the proposed scheme. Section 7 concludes the paper.
2. DC Microgrid Droop Control
2.1. Structure of Island Microgrid
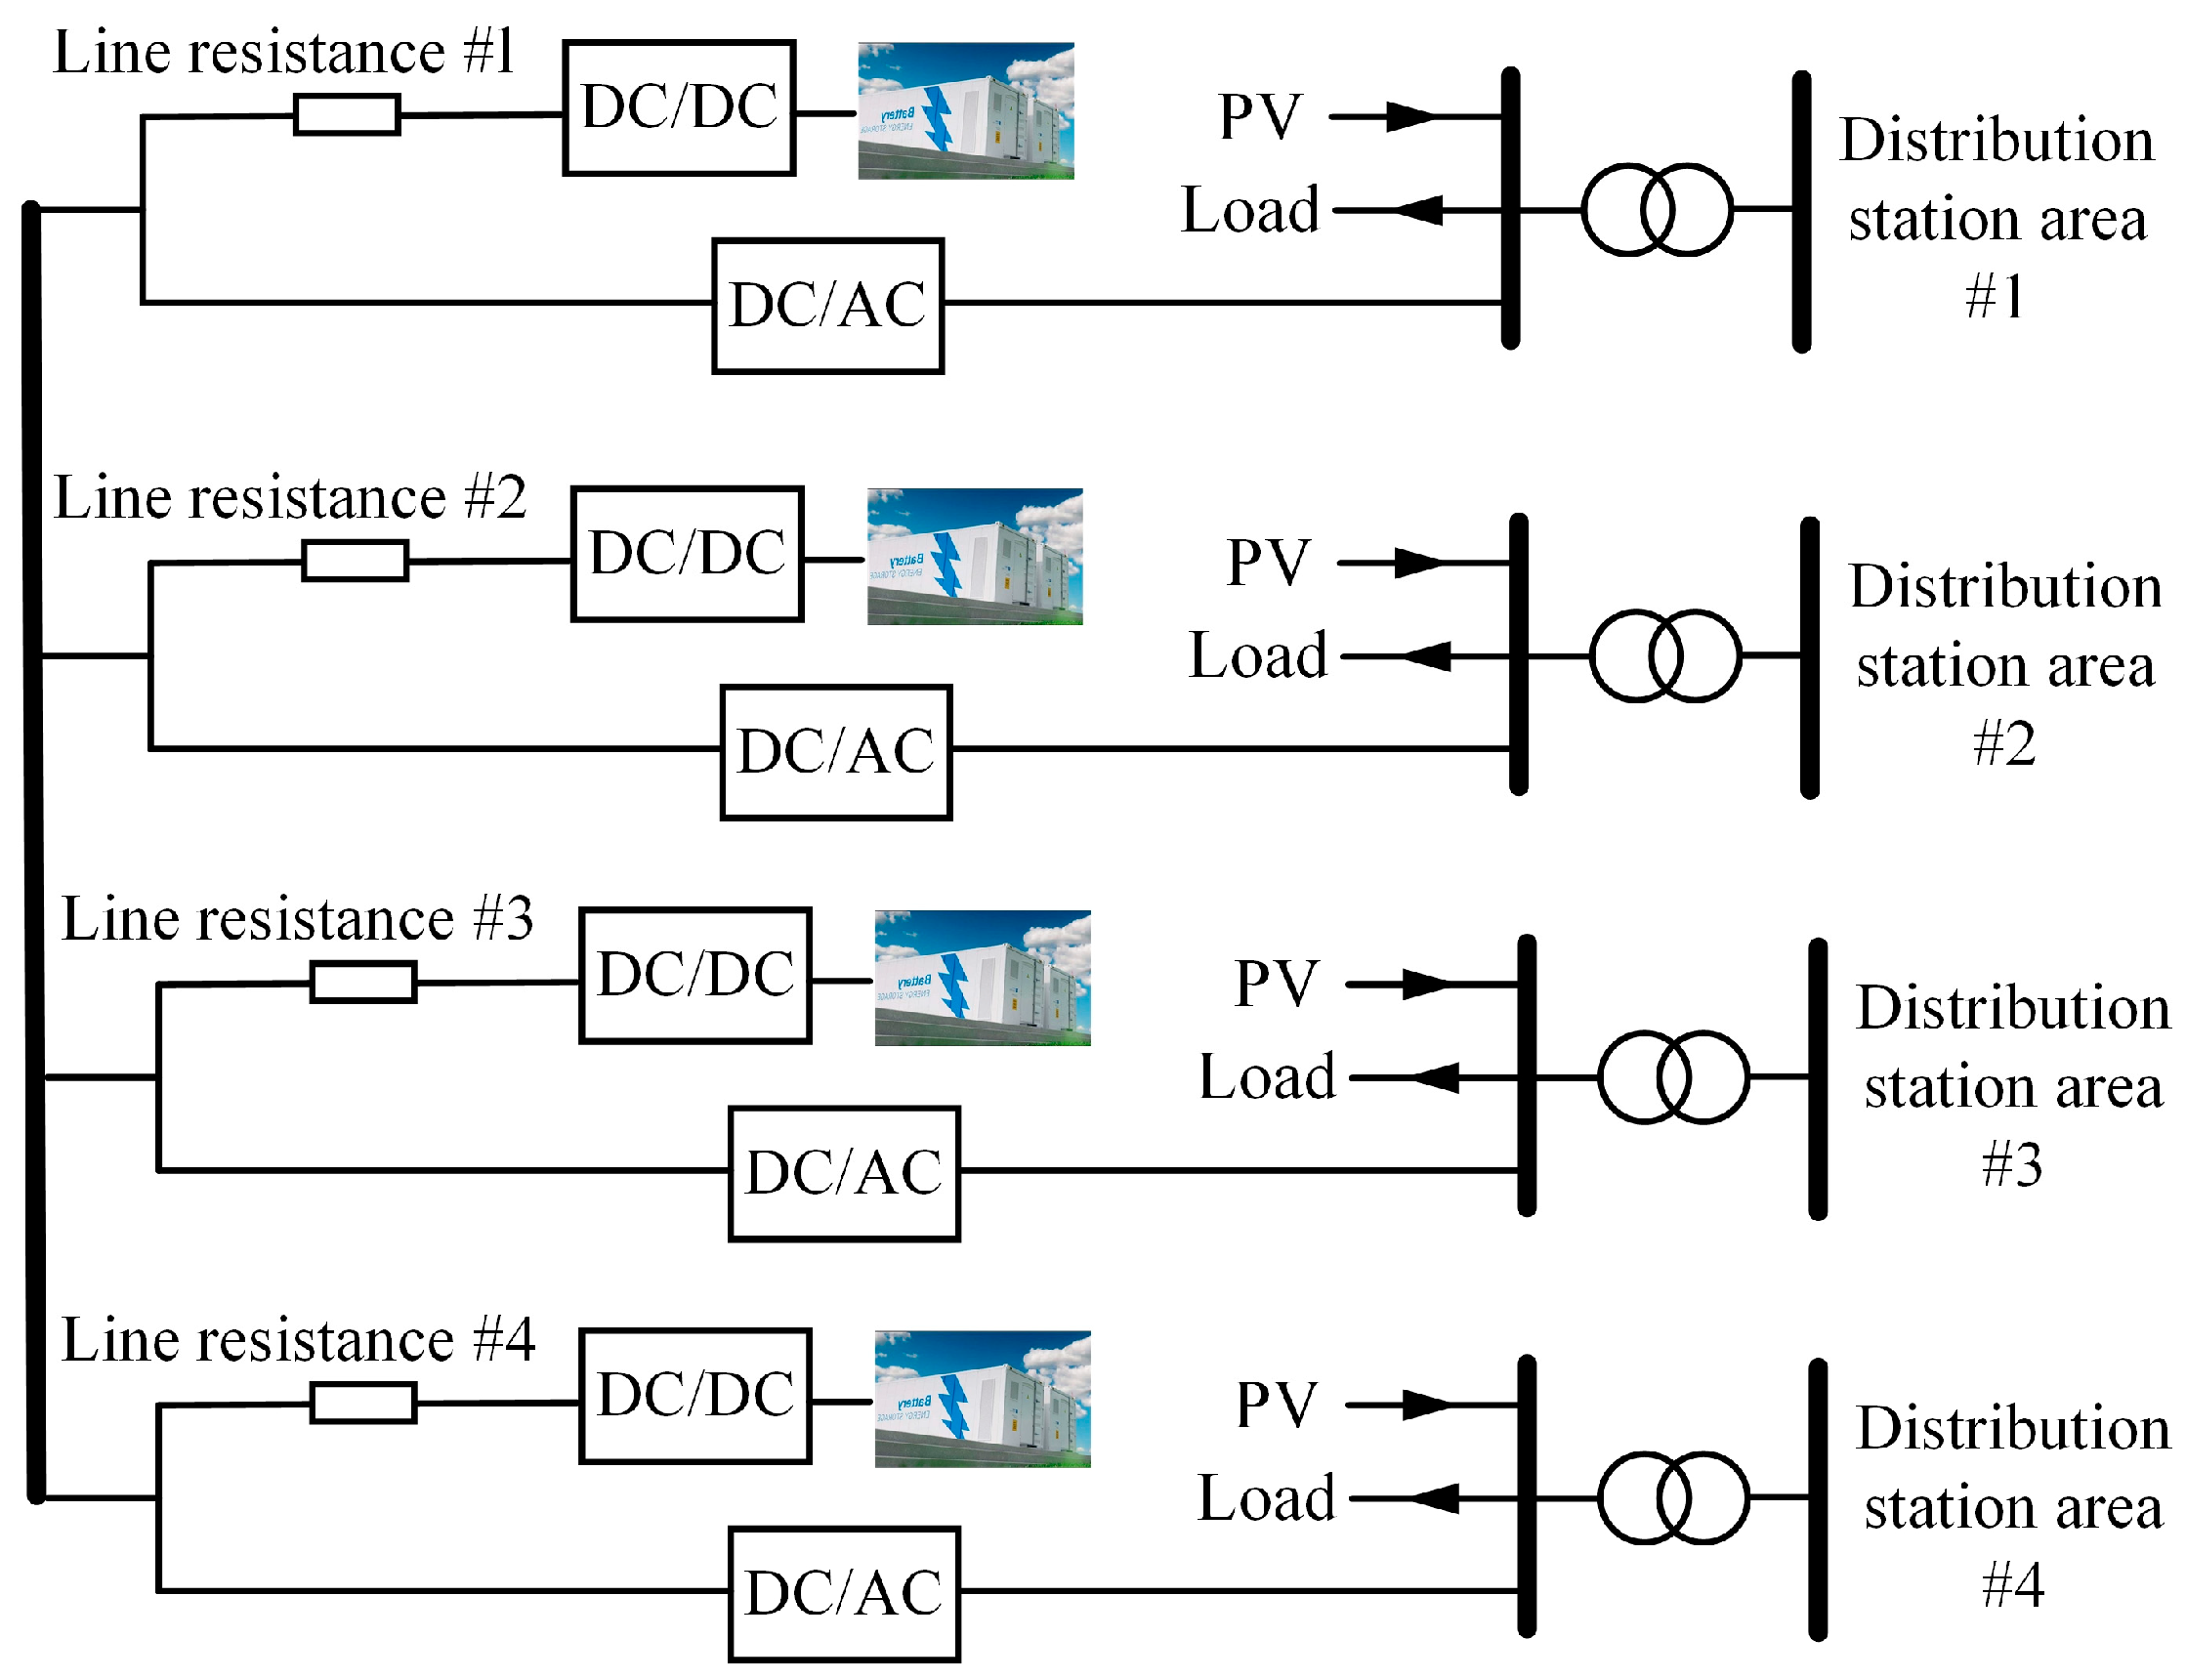
Figure 1 shows a typical island microgrid structure composed of renewable energy, load, distributed energy storage systems, and a distribution station area.
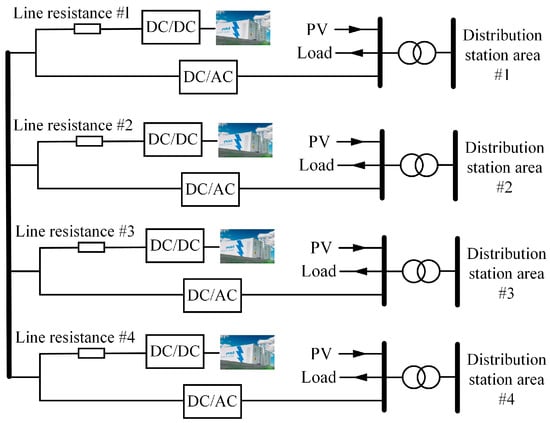
Figure 1.
Structure of DC microgrid.
2.2. Downsides of Droop Control
The current distribution method usually adopts droop control in traditional DC microgrids. To reflect the correlation characteristics of the DC voltage and DC current of the ESU, this paper adopts the U-I droop control, whose expression is:
where: uo is the voltage of the ESU, uref is the reference voltage, io is the current of the ESU, and R is the droop coefficient of the ESU.
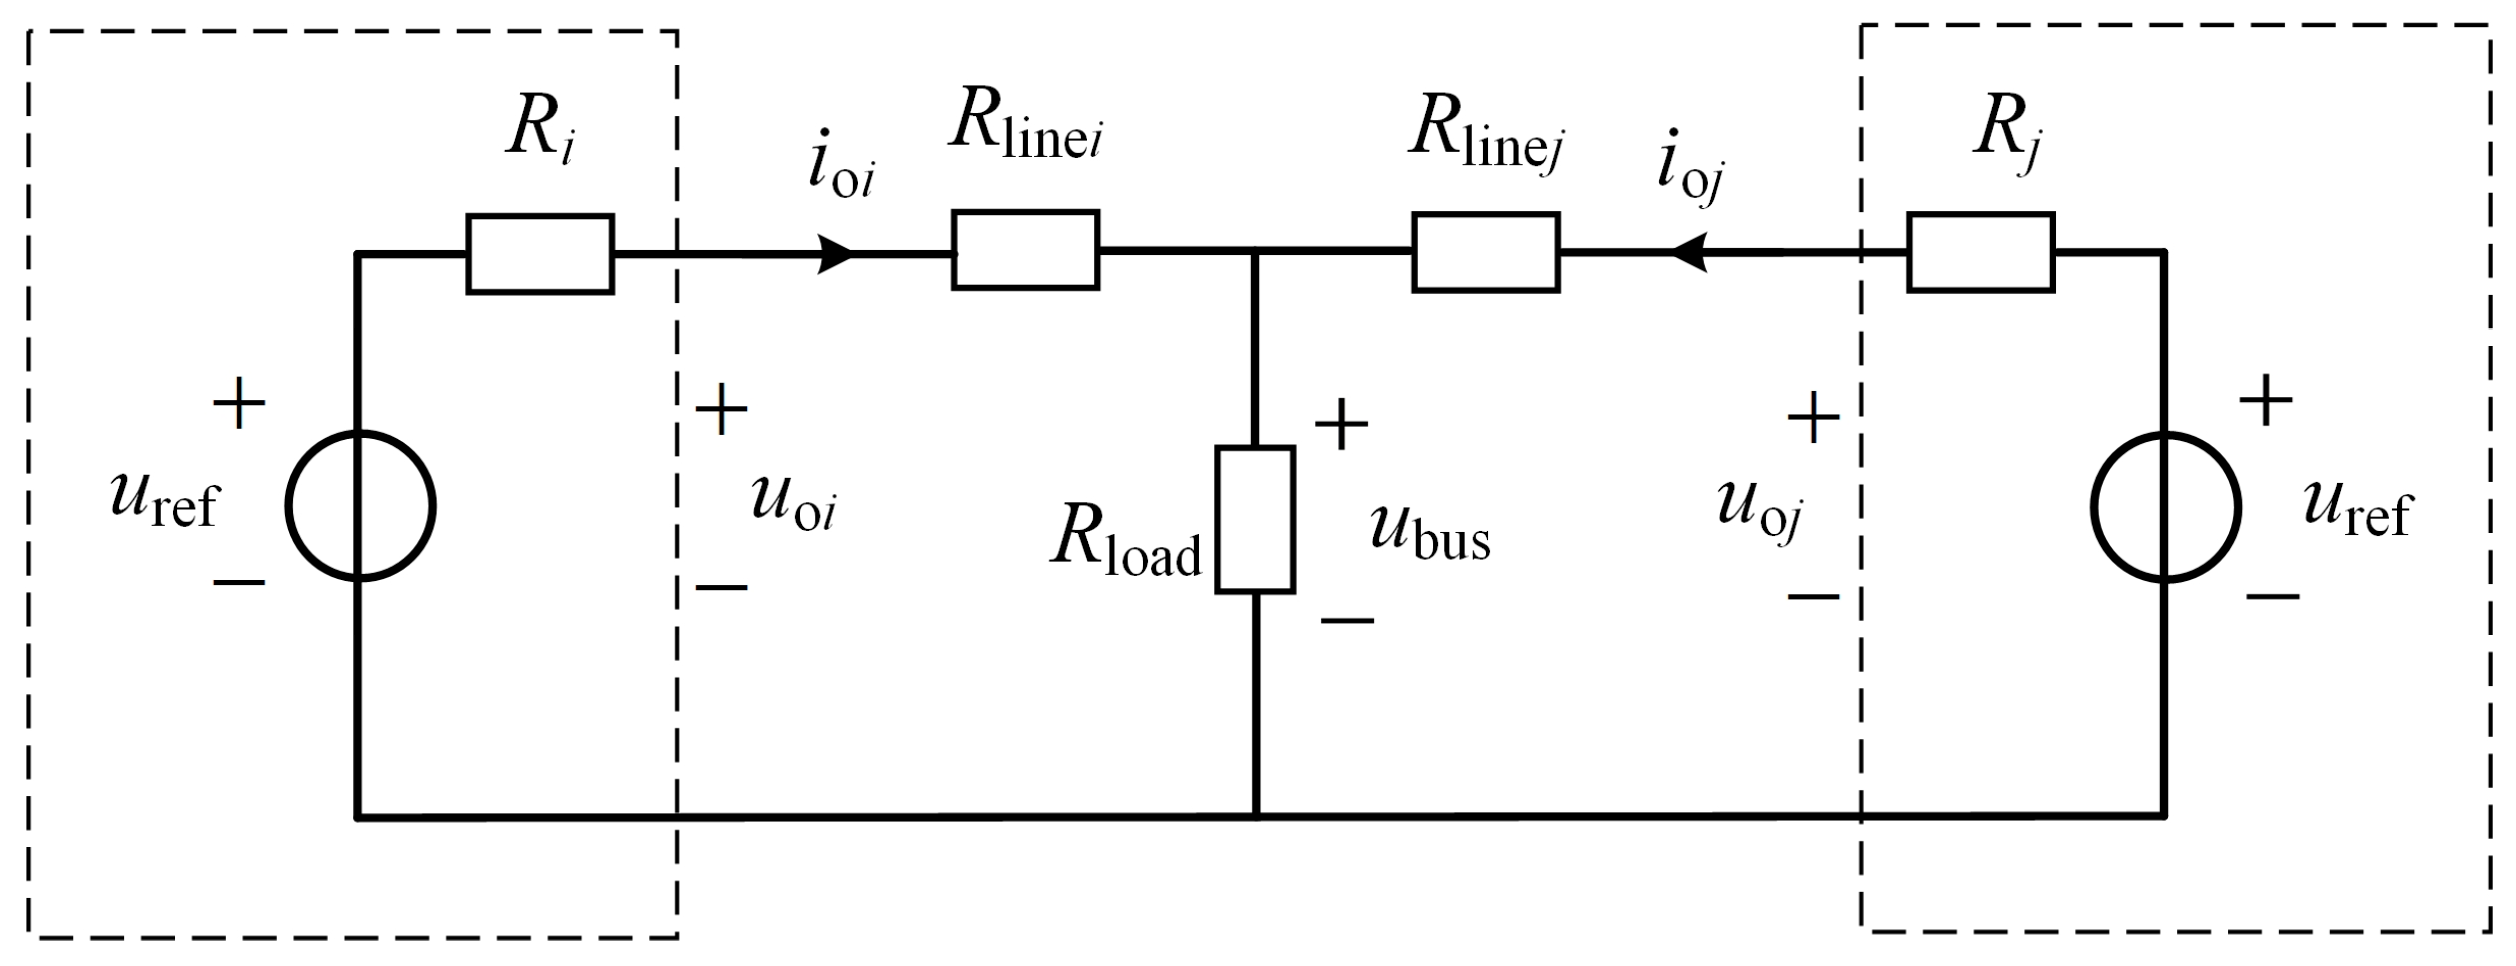
For ease of analysis, this paper uses an example of a system model with two ESUs of the same capacity connected in parallel, as shown in Figure 2. The bus voltage expression is:
where: uoi represents the voltages of the ith ESU, ioi represents the currents of the ith ESU, Rlinei denotes the line impedance of the ith ESU, and ubus is the bus voltage.
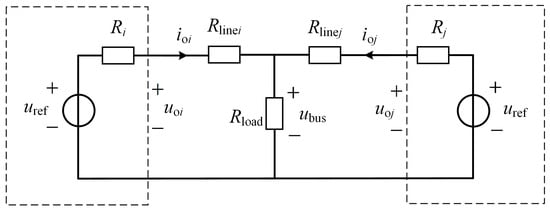
Figure 2.
Parallel equivalent circuit model of DC microgrid.
The output current expression is:
At the same time, the SOCi [21] is:
where: SOCi and SOCi0 are the current SOC value and initial SOC value, and Cbati is the rated capacity.
Through derivation of Equation (4), we can obtain:
Based on Equations (1)–(5), the ratio of SOC derivatives of any two ESUs is:
To complete the appropriate control objectives, the difference between the ESU capacity and the line impedance must be taken into account. However, the conventional droop control has a fixed droop coefficient and can only allocate power according to a fixed value, so it is not possible to adaptively adjust the droop coefficient and maintain the SOC equilibrium of the DESUs. In addition, due to the existence of line impedance, the bus voltage will deviate from the reference, which is a pair of contradictions of the droop control.
3. An Energy Management System for DESS
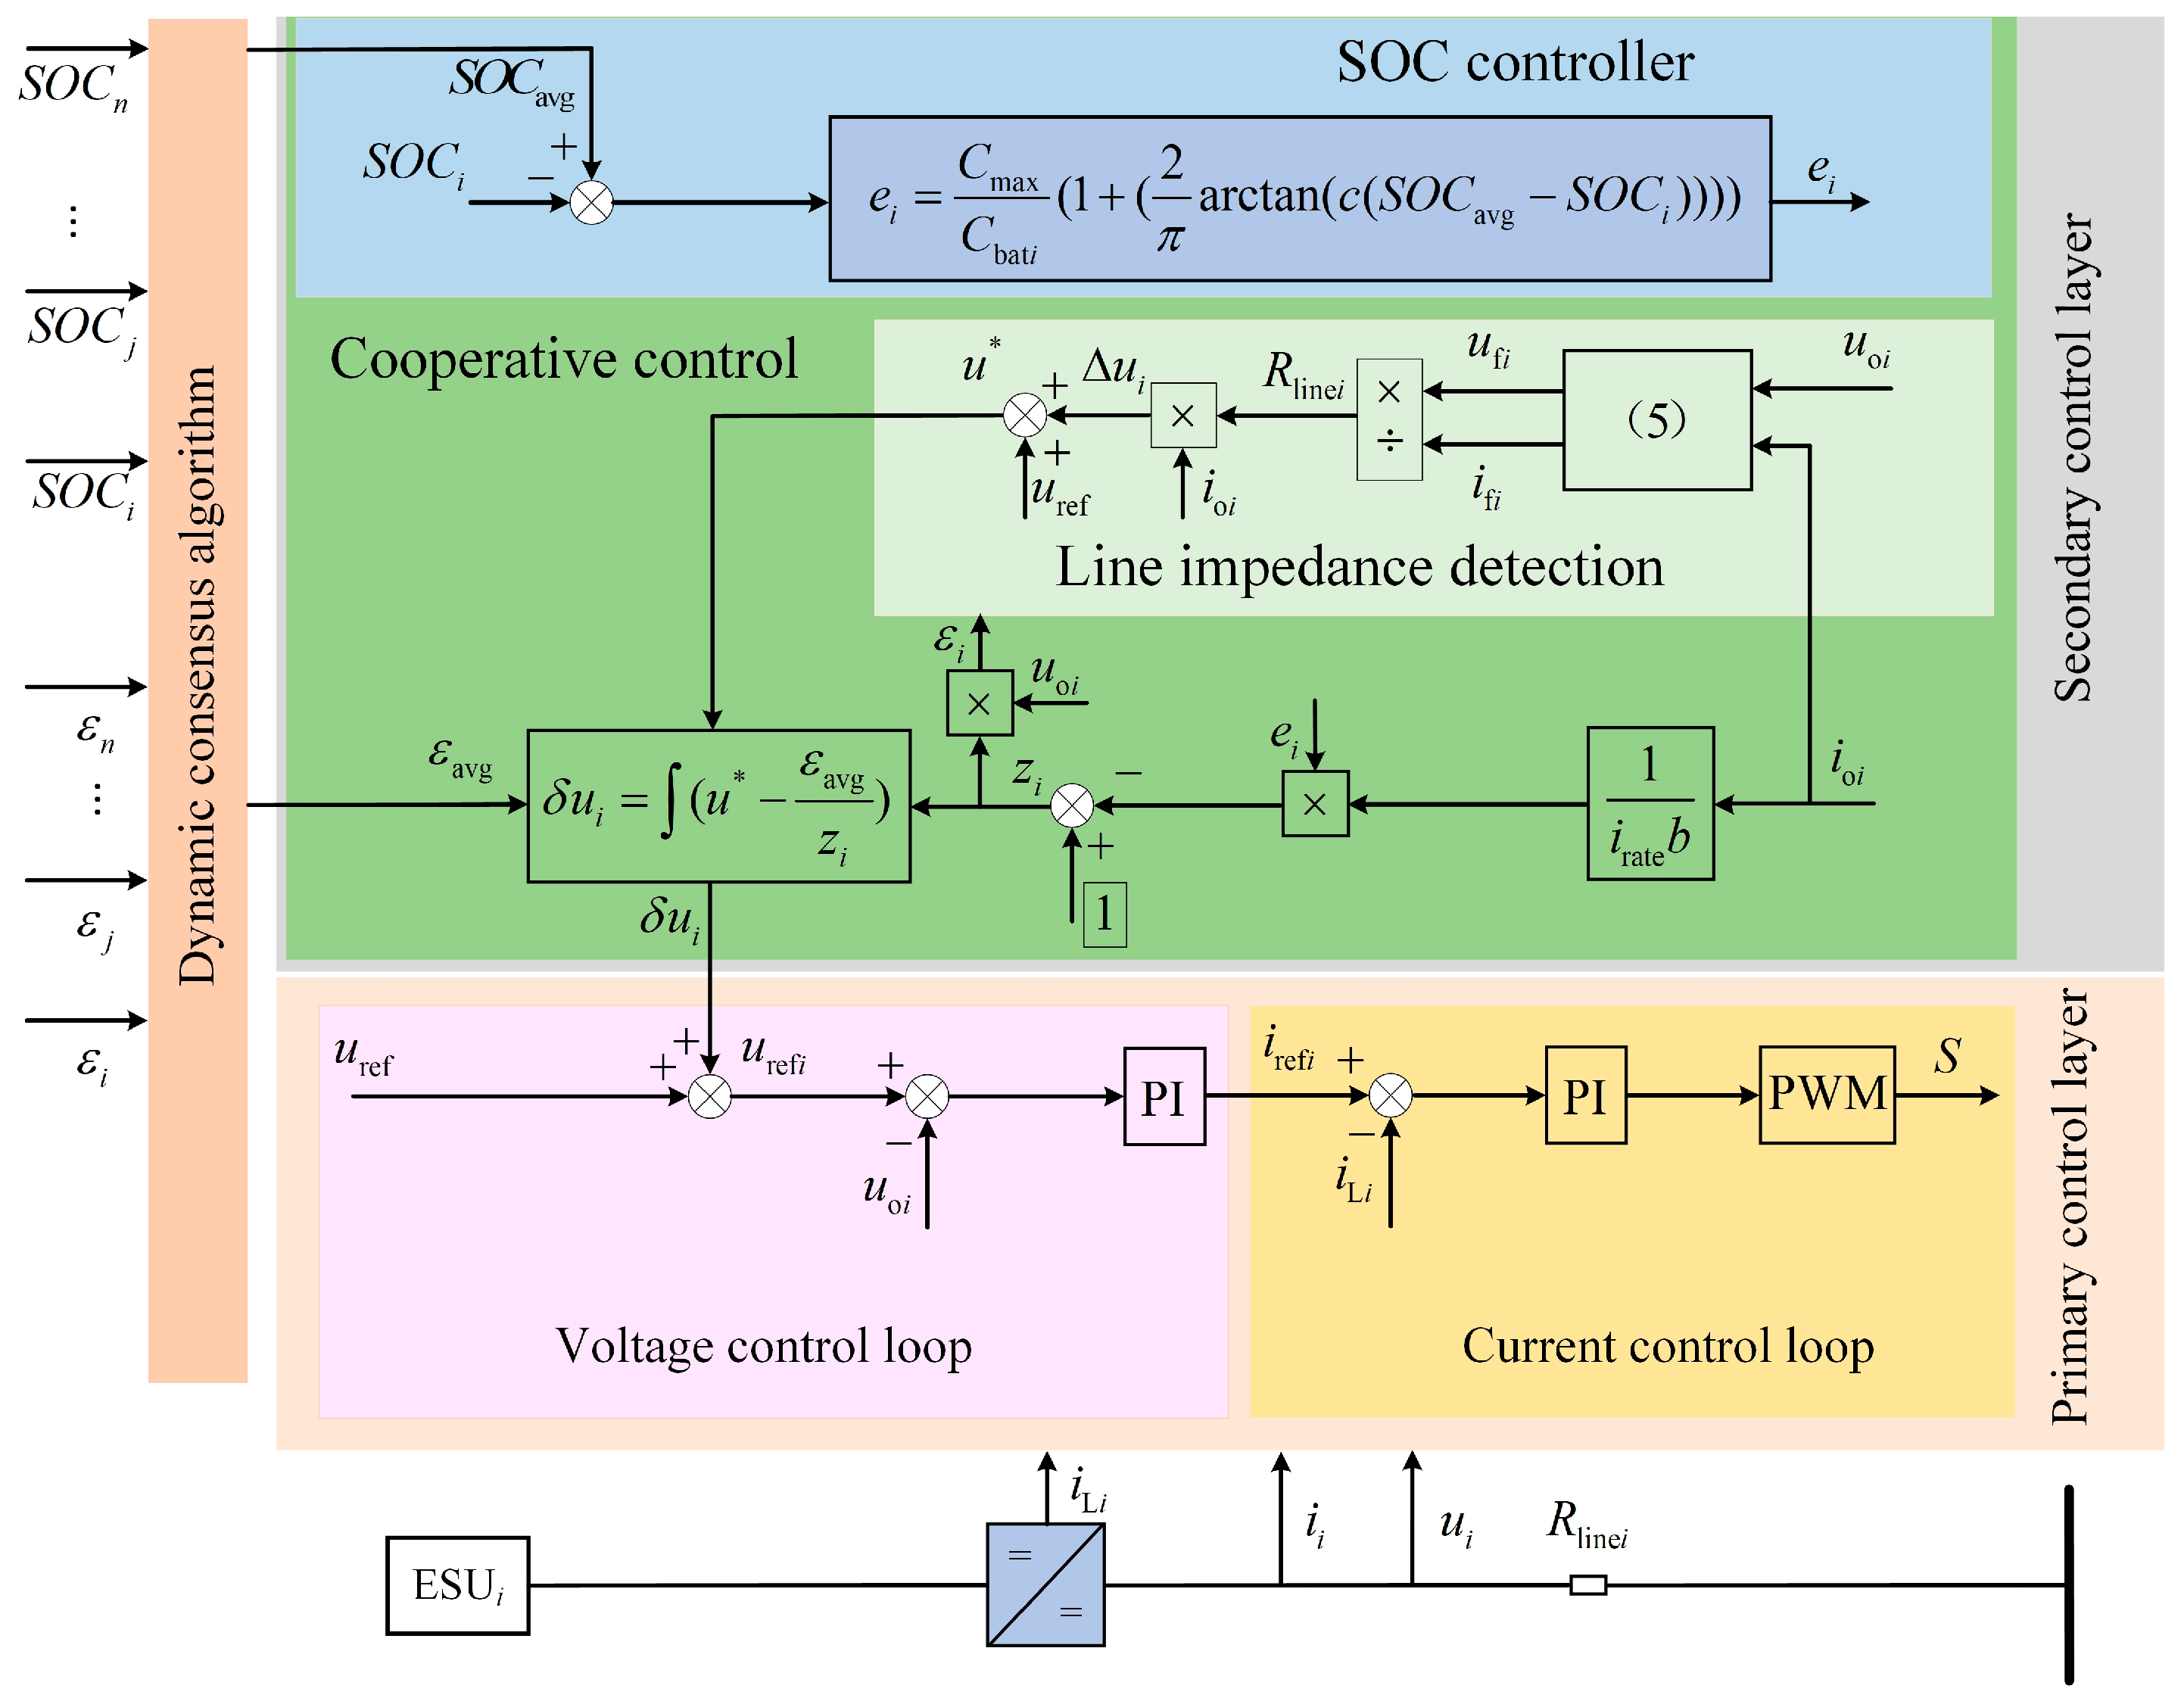
An energy management system for DESS considering time-varying linear resistance is proposed, as shown in Figure 3.
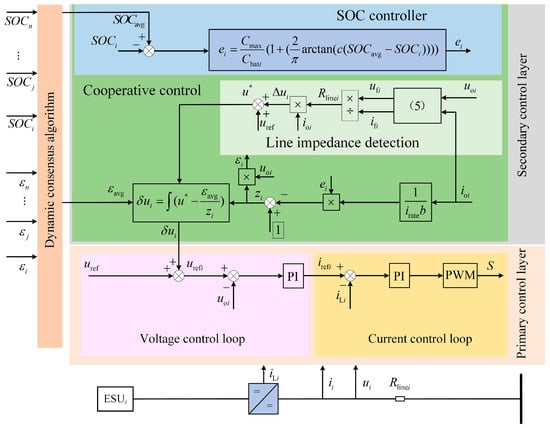
Figure 3.
Control block diagram of DESS.
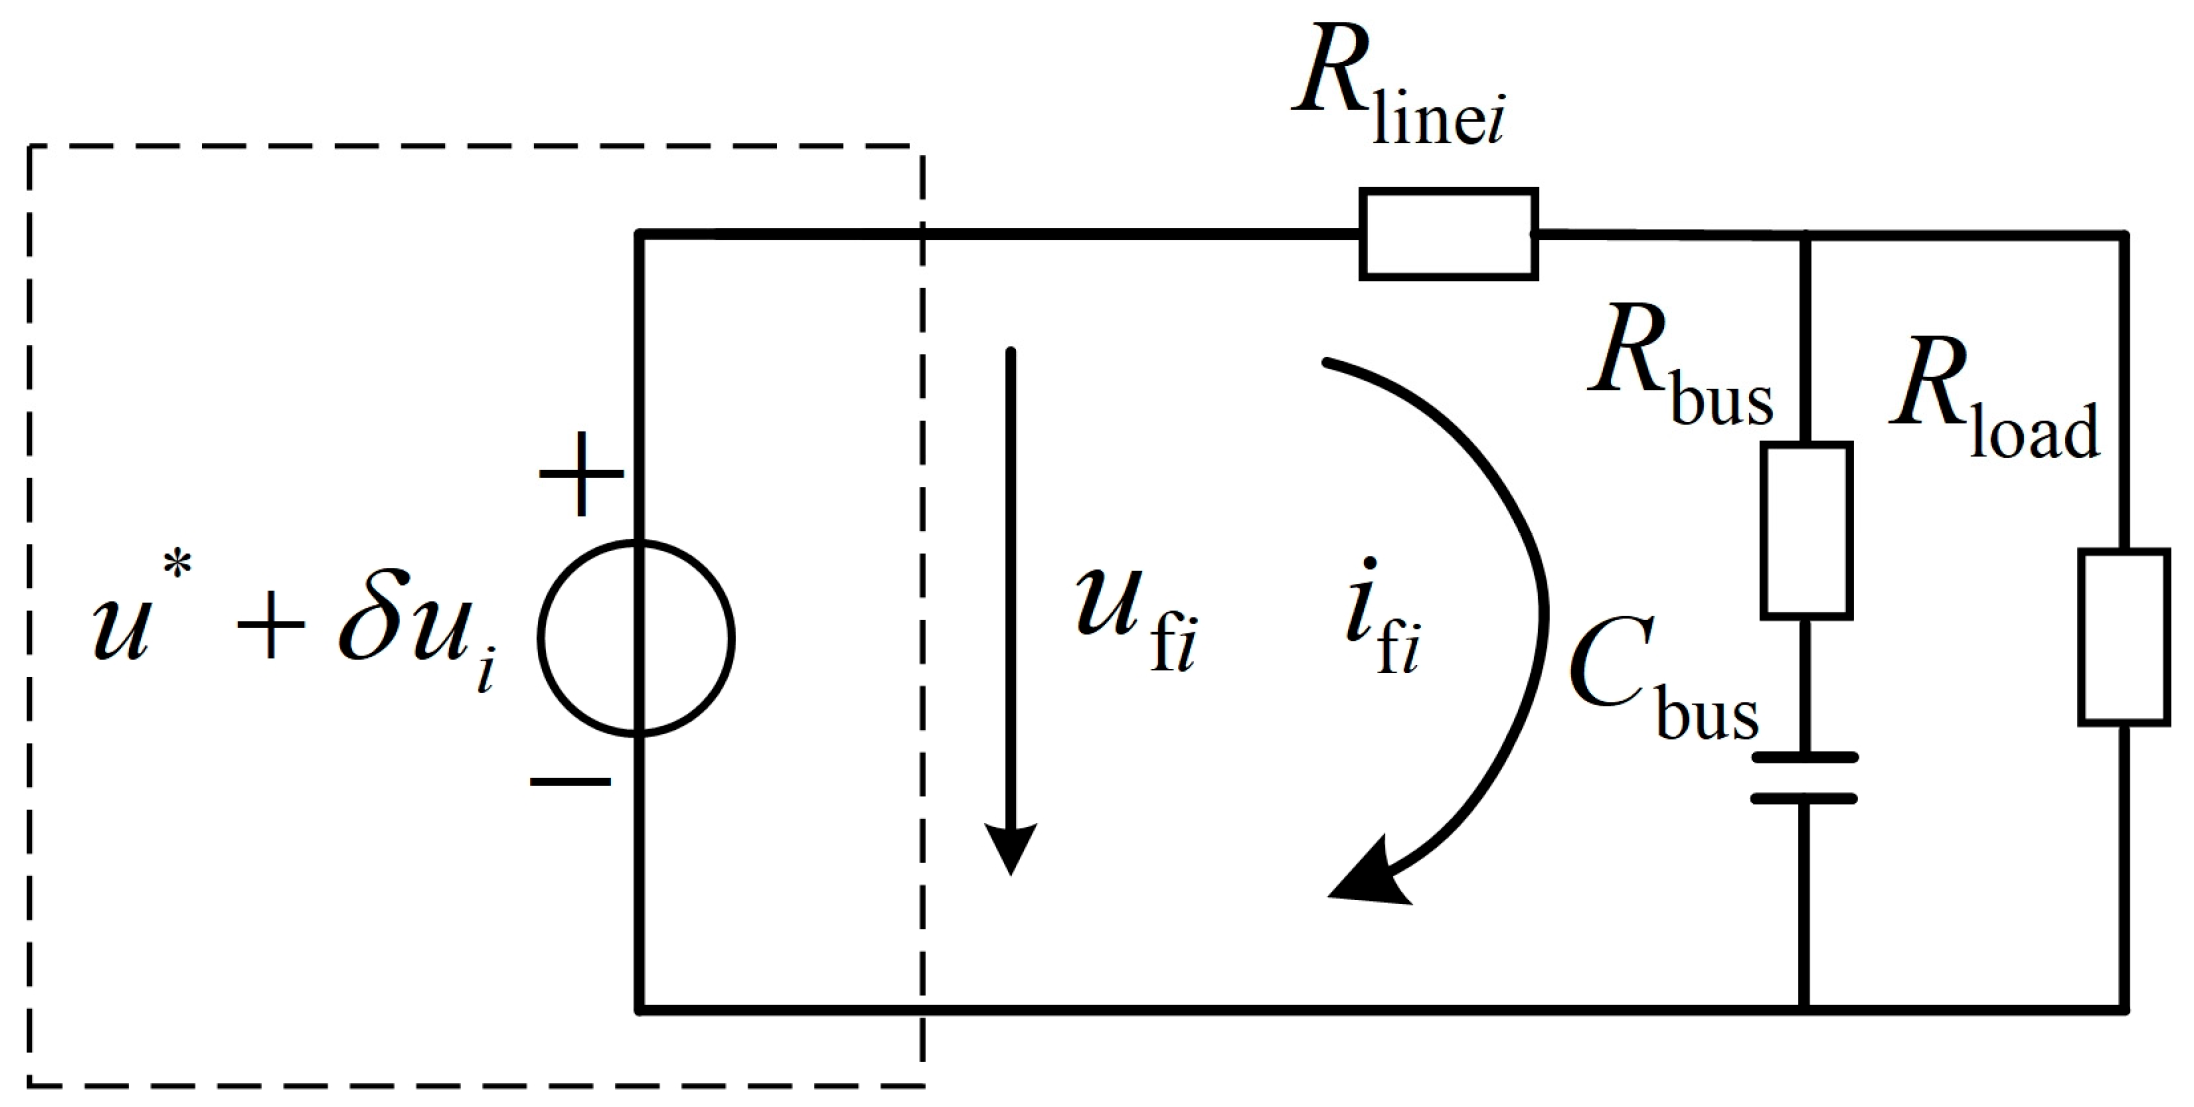
3.1. Line Impedance Detection Method
A method of impedance detection based on the fundamental frequency component of the pulse width modulation (PWM) carrier is used [22]. Since the PWM signal frequency is usually very high, generally above 10 kHz, it has the characteristics of a stable frequency, being free from link interference, and being free from converter device parameter interference. By utilizing this characteristic, the collected voltage and current signals are processed by the controller to obtain the voltage and current components at each frequency. In each frequency, the frequency of the group with the highest energy is equal to the PWM carrier frequency value provided by the controller. The transducer output voltage and current collected by the sensor are carried out, and the voltage and current signal in the time domain is transferred to the frequency domain.
where: T is the period corresponding to this frequency.
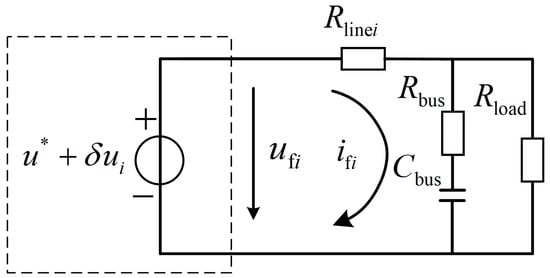
Figure 4.
Equivalent circuit of the converter.
3.2. Cooperative Control
From Figure 3:
where urefi is bus voltage reference; uref is reference voltage; and δui is the voltage compensation.
where u* is the virtual reference voltage with the expression shown in Equation (11); εavg is the average value of the information factor ε; and zi is the transition factor with the expression shown in Equation (14).
where Δui is the line impedance compensation whose expression is shown and b is the gain to avoid zi taking the value of 0 when eiioi = irate, so b = 0.4 is chosen. ei is the expression of the SOC equalization factor:
where Cmax is the maximum rated capacity, SOCavg is the average value of the SOC, c is the amplification factor, and the speed of equalization of the SOC can be controlled by adjusting the amplification factor c. The value of c will be analyzed in the next section.
An SOC equalization factor is designed, and an amplification factor is used to accelerate the equalization speed.
According to the above analysis, we have:
According to Equations (10)–(16), the following can be obtained:
According to Equations (17) and (18), the proposed method can achieve the control objective.
3.3. Parametric Analysis
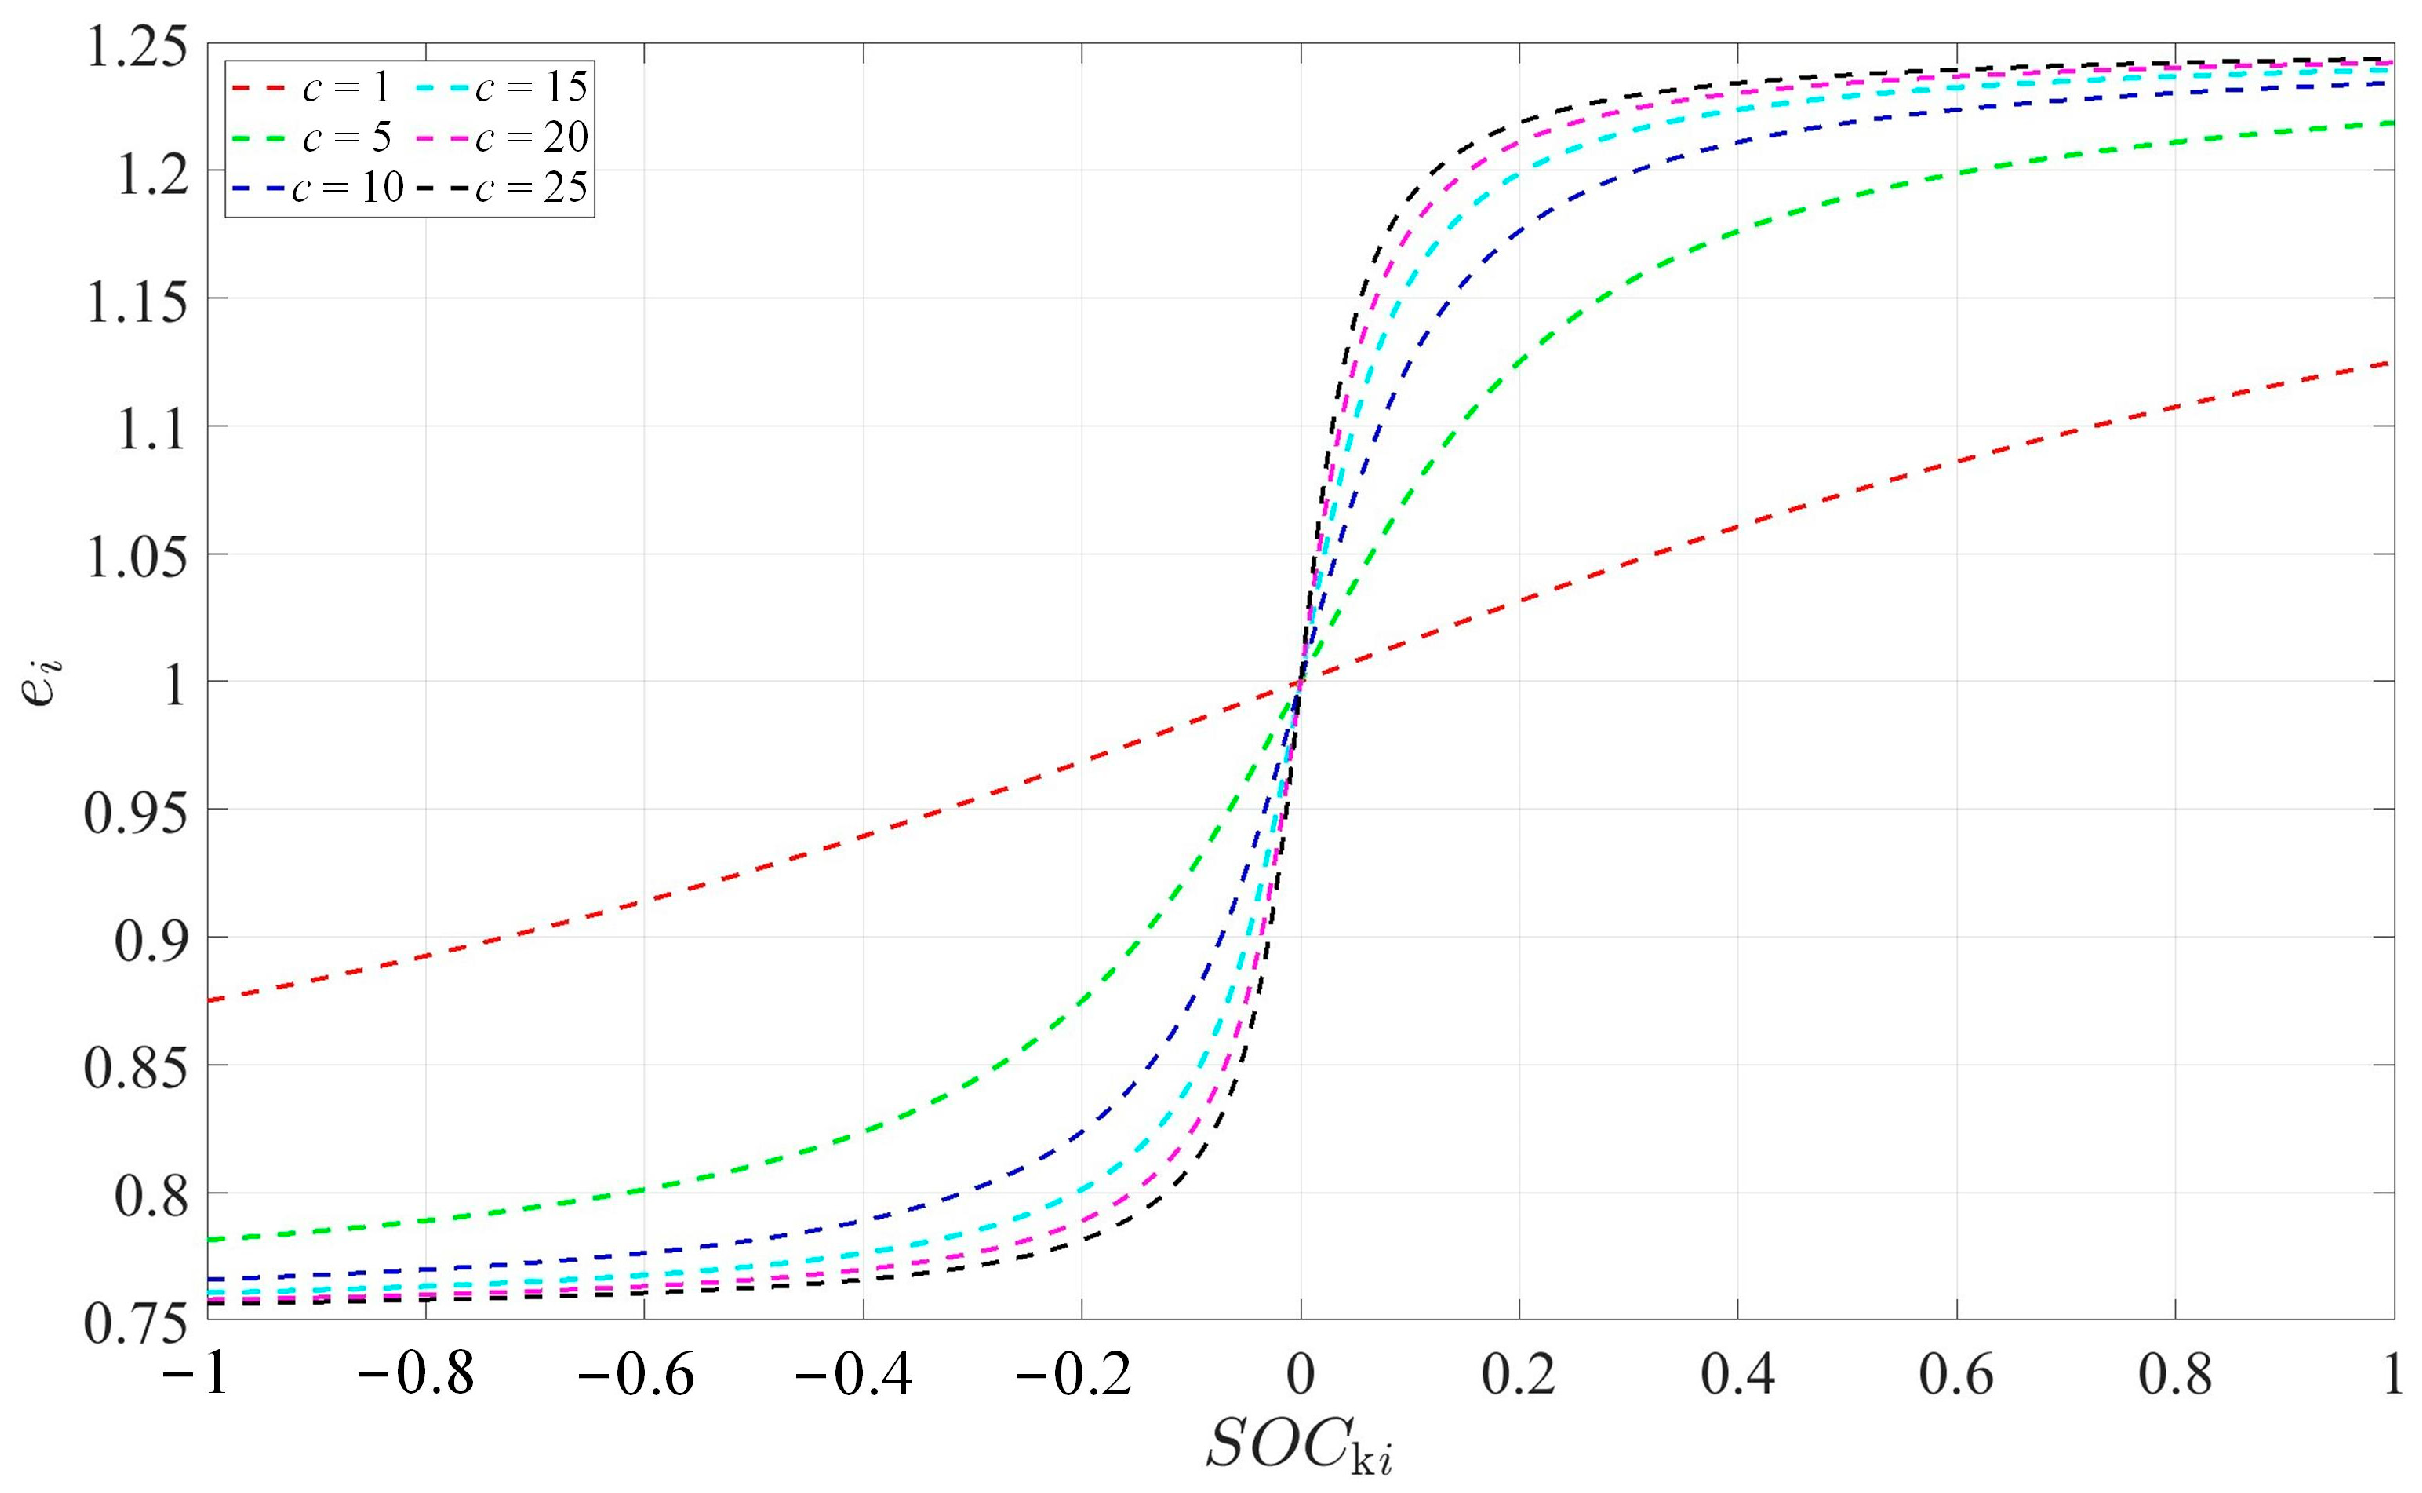
In the analysis below, two ESUs in parallel are used as an example. The converter from Equation (9) and SOCki = SOCavg − SOCi is assumed. The Arctan function and amplification factor are introduced to construct the equalization factor. Because of the large slope of the arctangent function near zero, its value increases faster near zero, and the equalization factor can be limited to a certain range. This characteristic of the arctan function is used to design the amplification factor, as shown in Figure 5. When the amplification factor c is increased, the convergence speed and precision of information state factors are guaranteed, so c = 25 is selected.
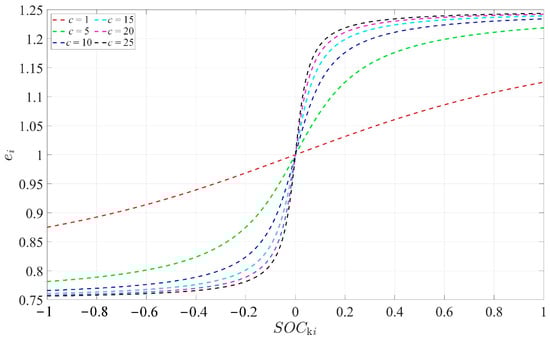
Figure 5.
Variation curve of ei with SOCki while taking different values of c.
4. Stability Analysis
In this paper, the strategy is analyzed in terms of stability in a system consisting of two groups of ESUs of equal capacity, line impedance, and loads, and Figure 6 shows the control block diagram of the ESUs.
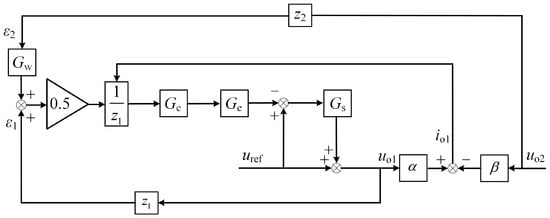
Figure 6.
Control block diagram of the ESUs.
Through Figure 6 and Equations (19)–(20), the voltage can be obtained [23]:
where Gs is the integral link.
According to Equation (21), the expressions of Ge and Gw are:
where τe and τw are the communication delay times.
According to Equations (19)–(22), we can obtain [24]:
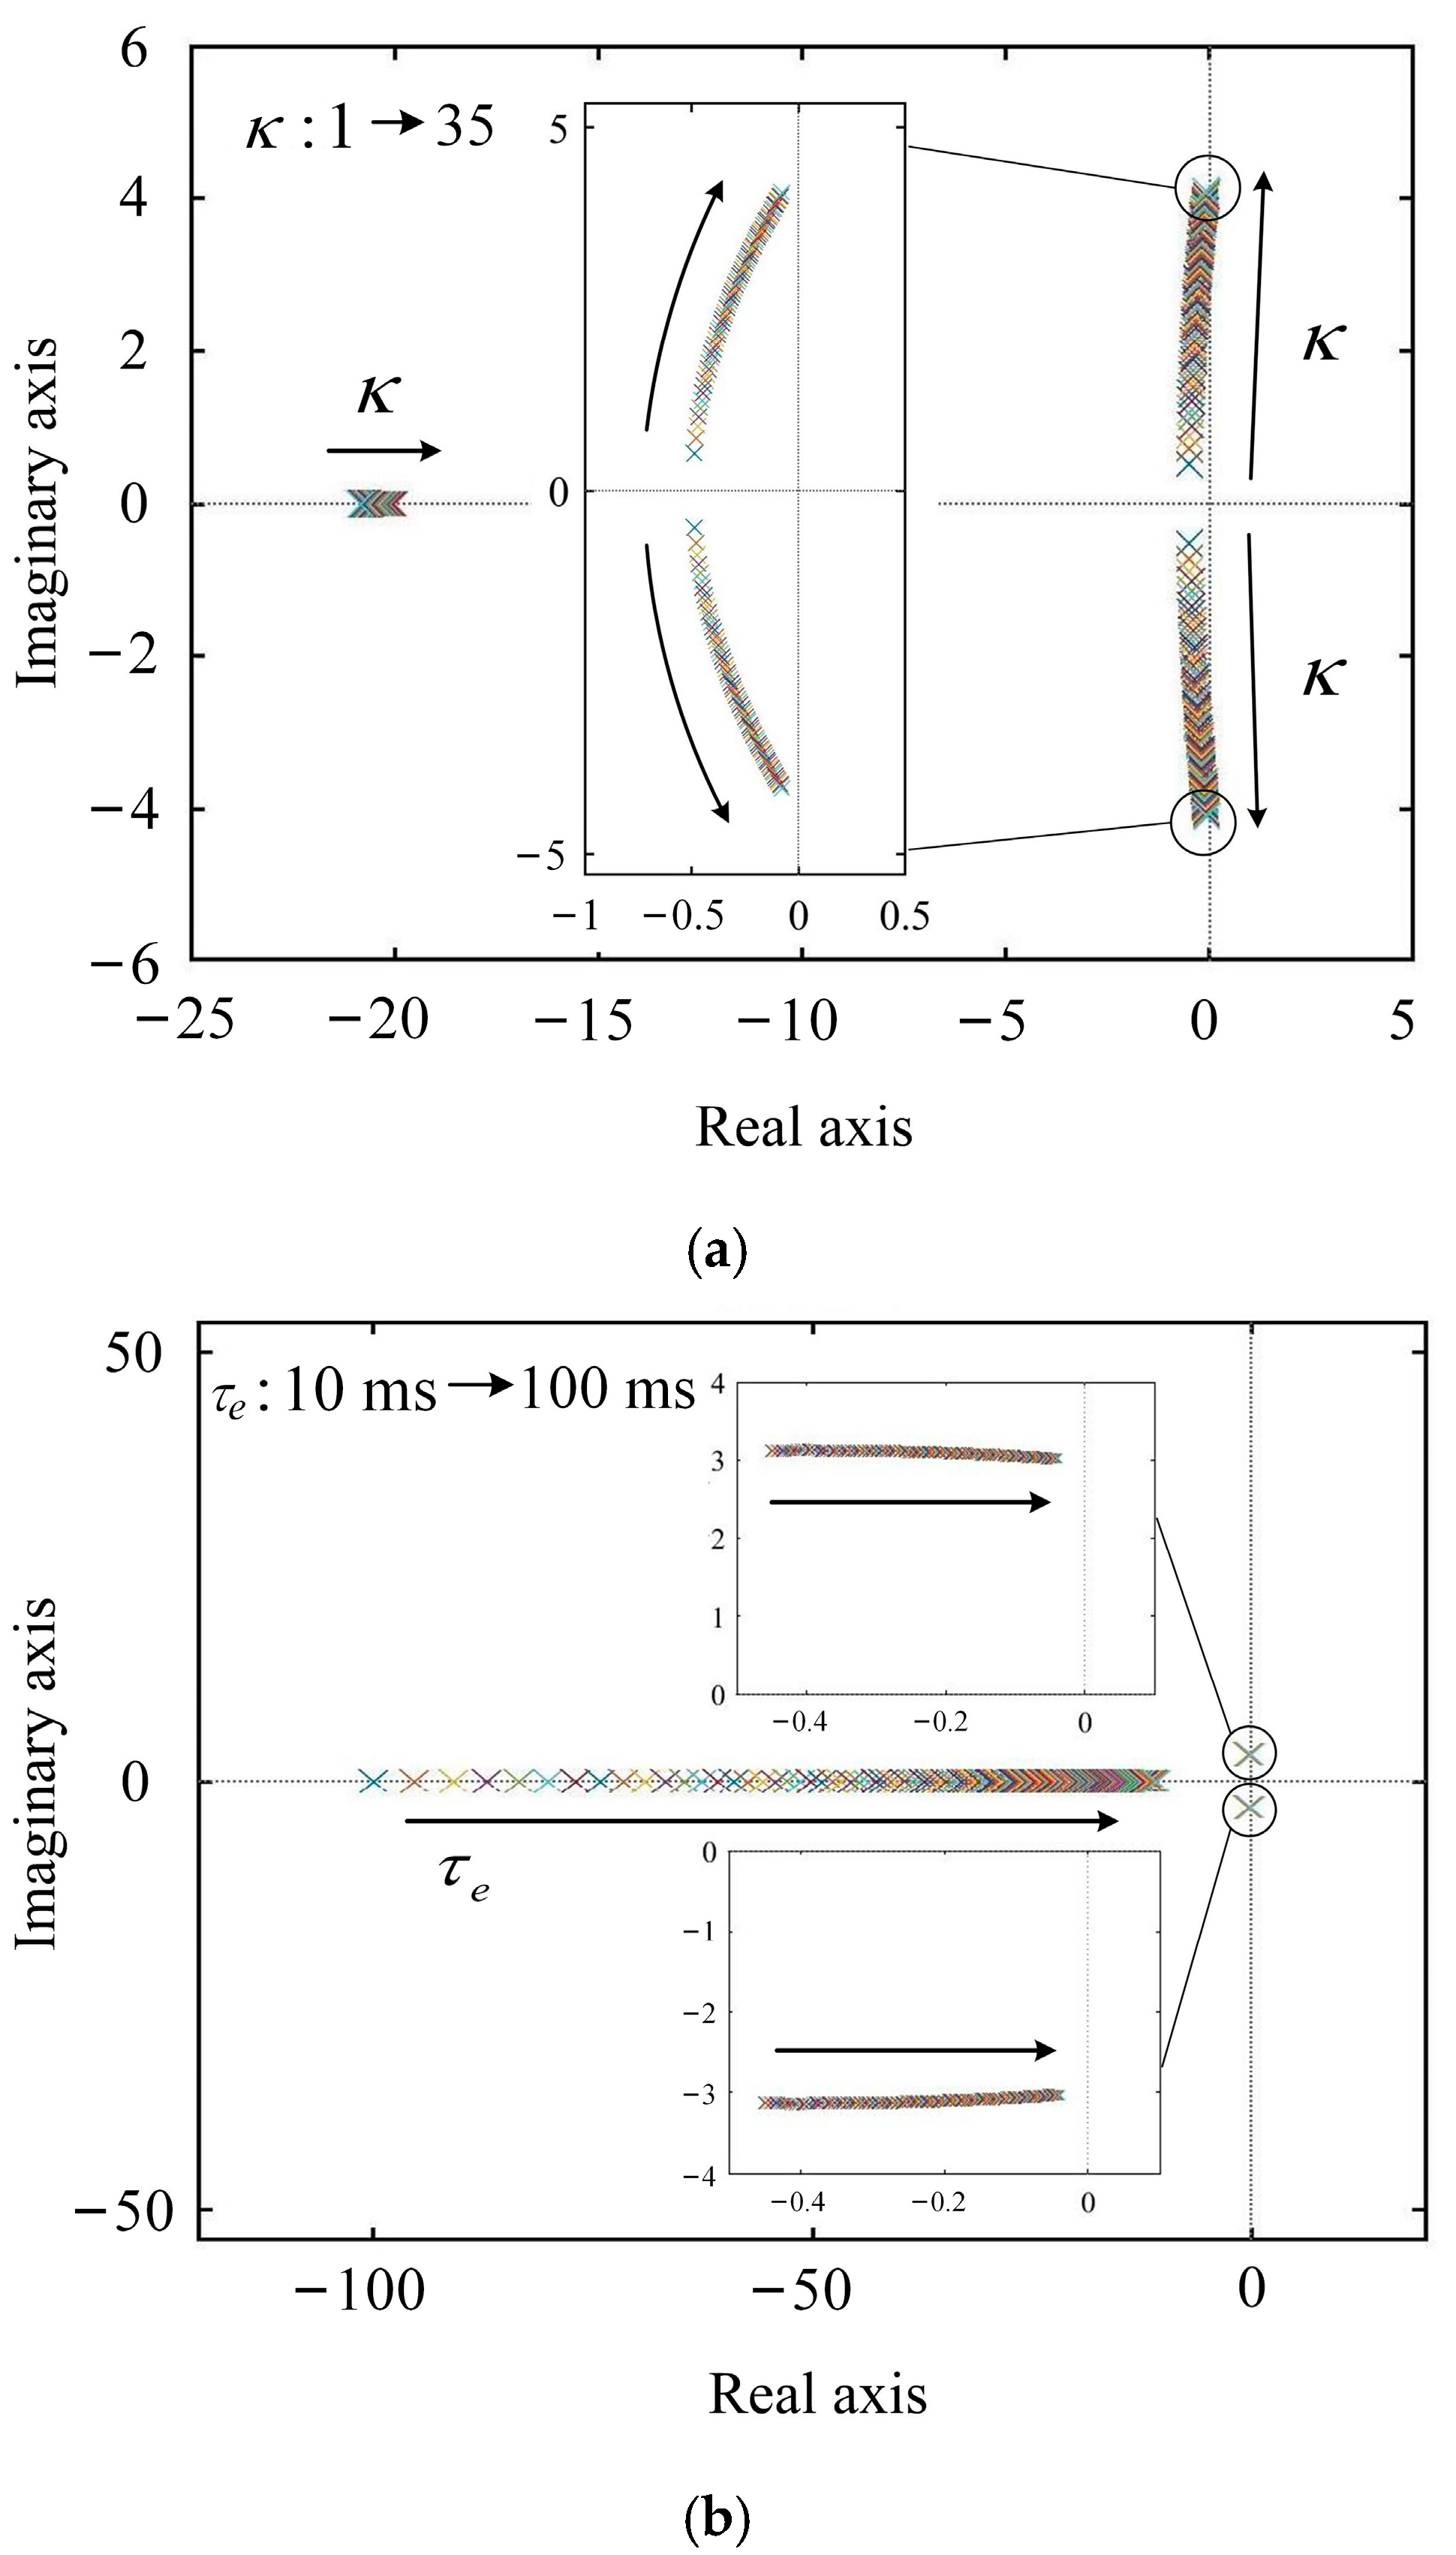
Figure 7a,b display the pole distribution for k from 1 to 35 and τe from 10 ms to 100 ms. From Figure 7a, when the value of k increases, the poles are all on the left side of the imaginary axis and move to the right, but the system can remain stable within the maximum range of k. As can be seen from Figure 7b, the poles are located to the left of the imaginary axis and move to the right as the τe increases. The increase in τe can ensure the system’s stability.

Figure 7.
System stability analysis. (a) τe = 50 ms, κ increases. (b) k = 10, τe increases.
5. Simulation Results
In order to verify the influence on the system’s stability, when the battery capacity, line impedance, and load power of the three converters are changed, a Matlab/Simulink simulation model is built, and it uses control variates to conduct the simulation. The key parameters are shown in Table 1.

Table 1.
The key system parameters.
5.1. Simulation Analysis of Changing the Third Battery Capacity
In terms of battery capacity, the capacity of the first and second group of batteries is kept unchanged, and only the capacity of the third group of batteries is changed in order to analyze the impact to the system when the battery capacity changes.
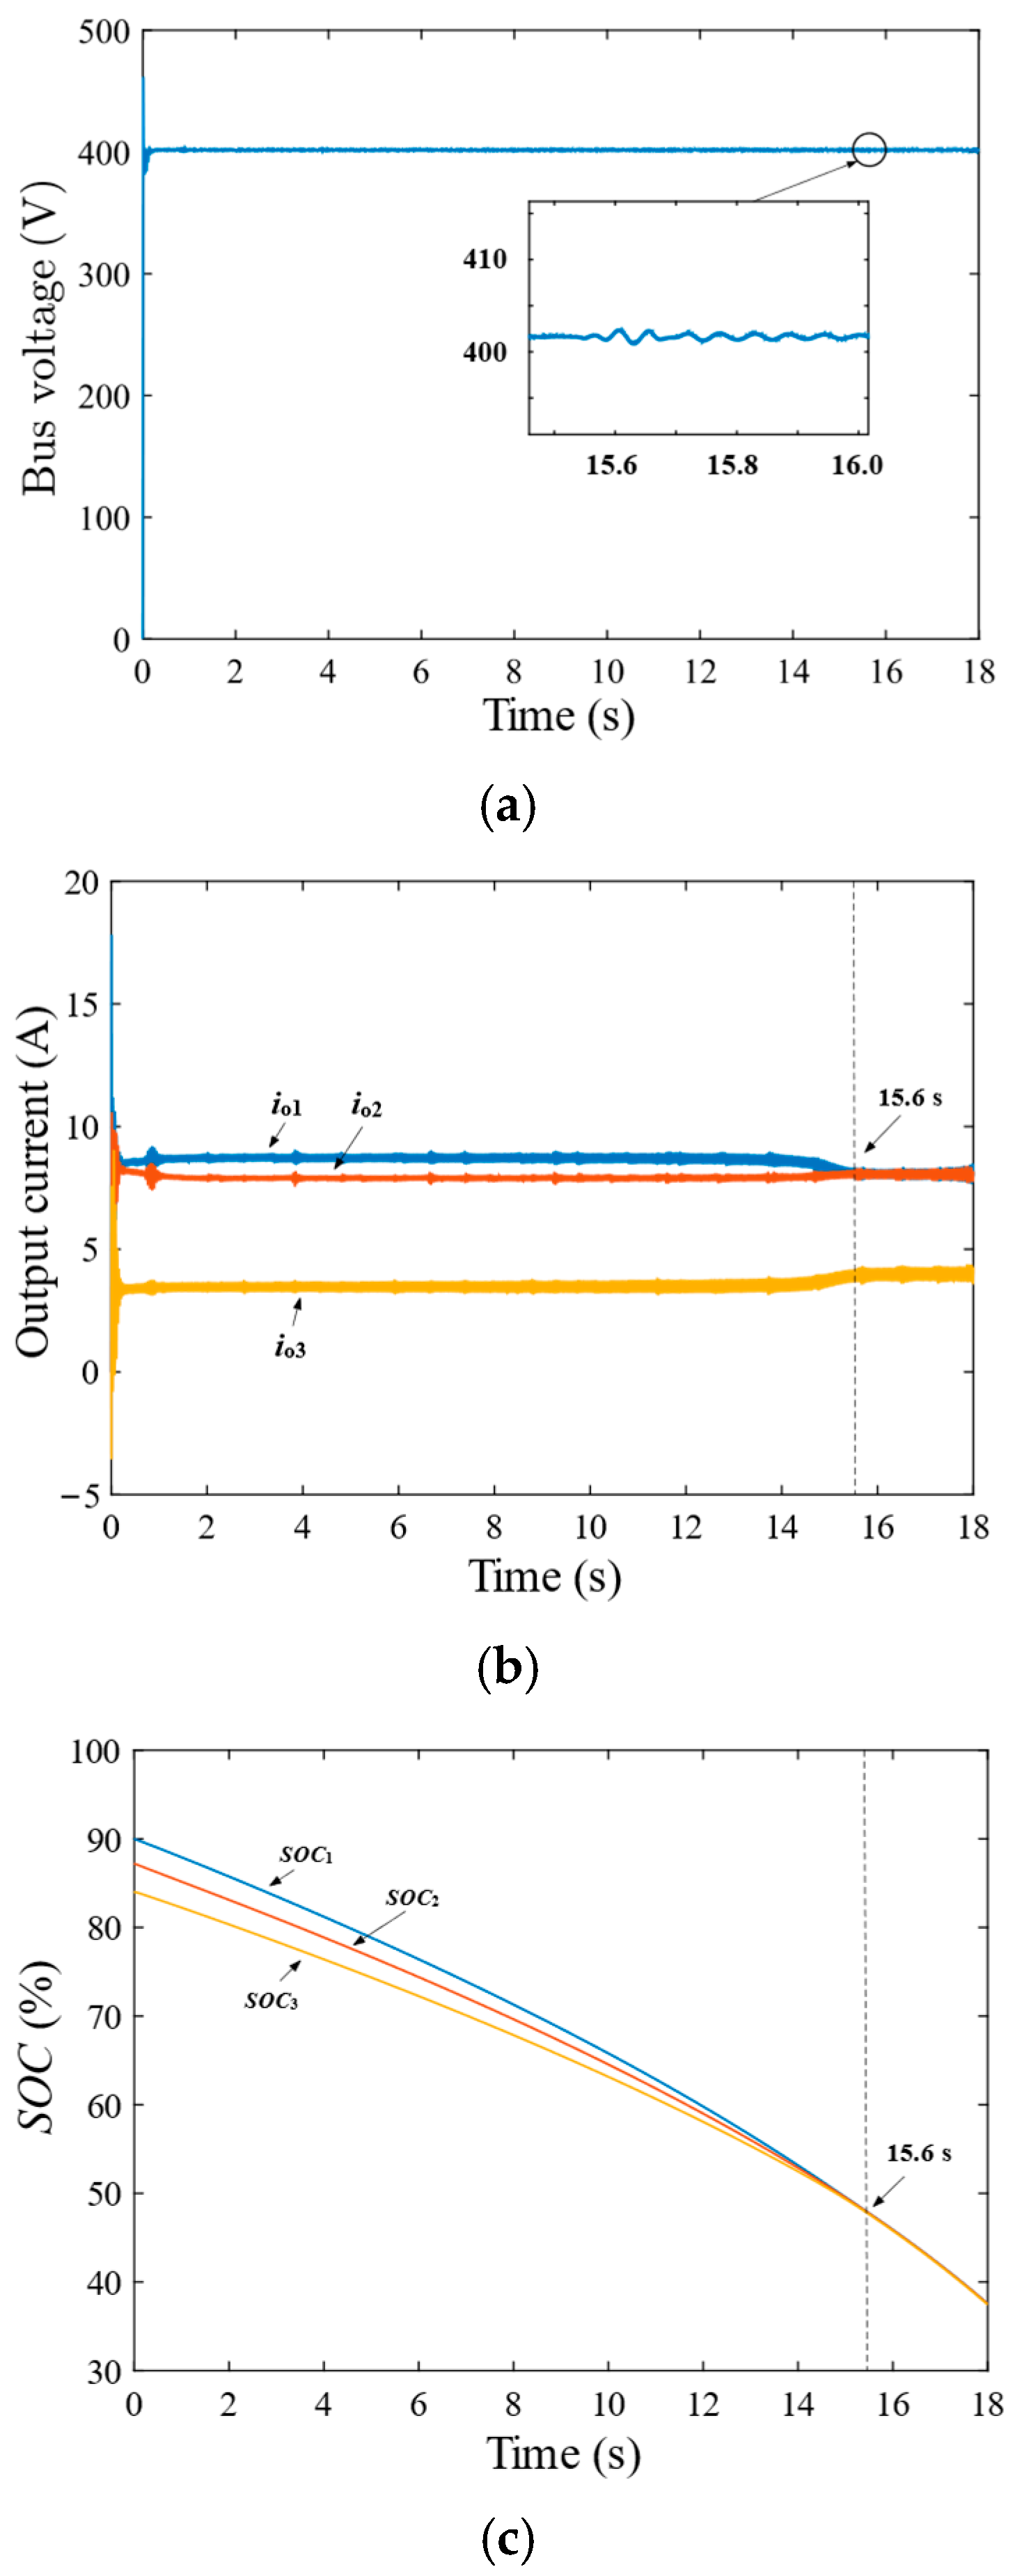
First, the battery capacity of the third group is reduced by 25% of the standard capacity; that is, the battery capacity of the third group is set to 3. The simulation results are shown in Figure 8. The output current is distributed at 6:6:3, which is the same as the standard capacity ratio; the DC bus voltage is maintained at 400 V; the SOC balancing time is 15.6 s; and the system remains stable.
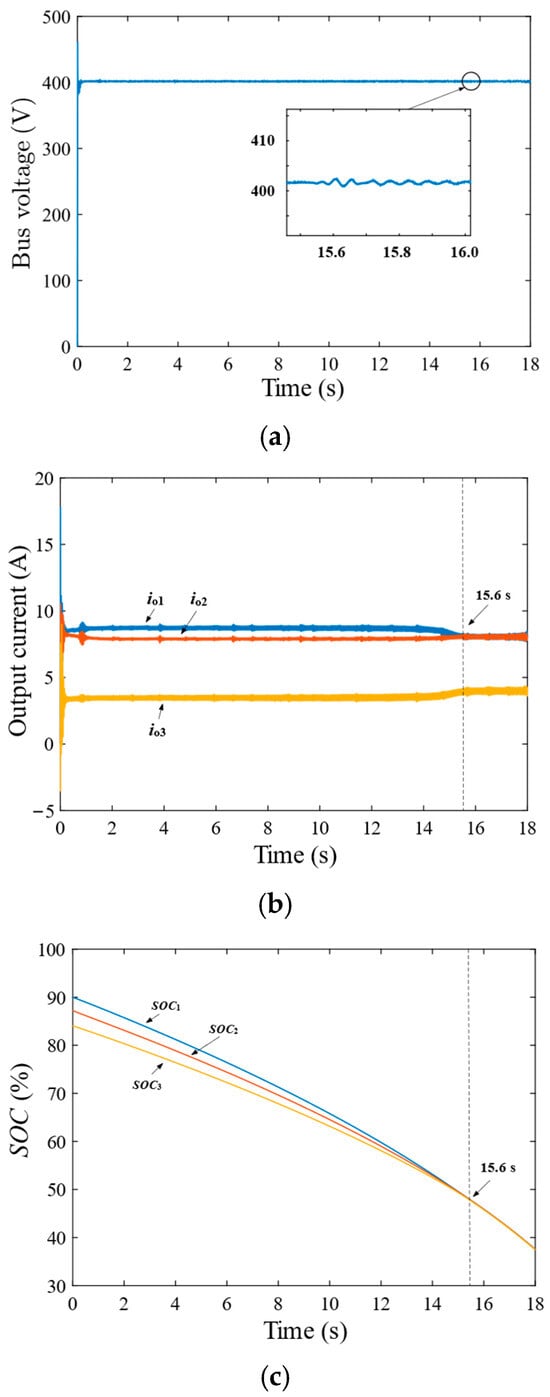
Figure 8.
Simulation of the third battery group decreasing by 25% of its rated capacity. (a) DC bus voltage. (b) Output current. (c) SOC.
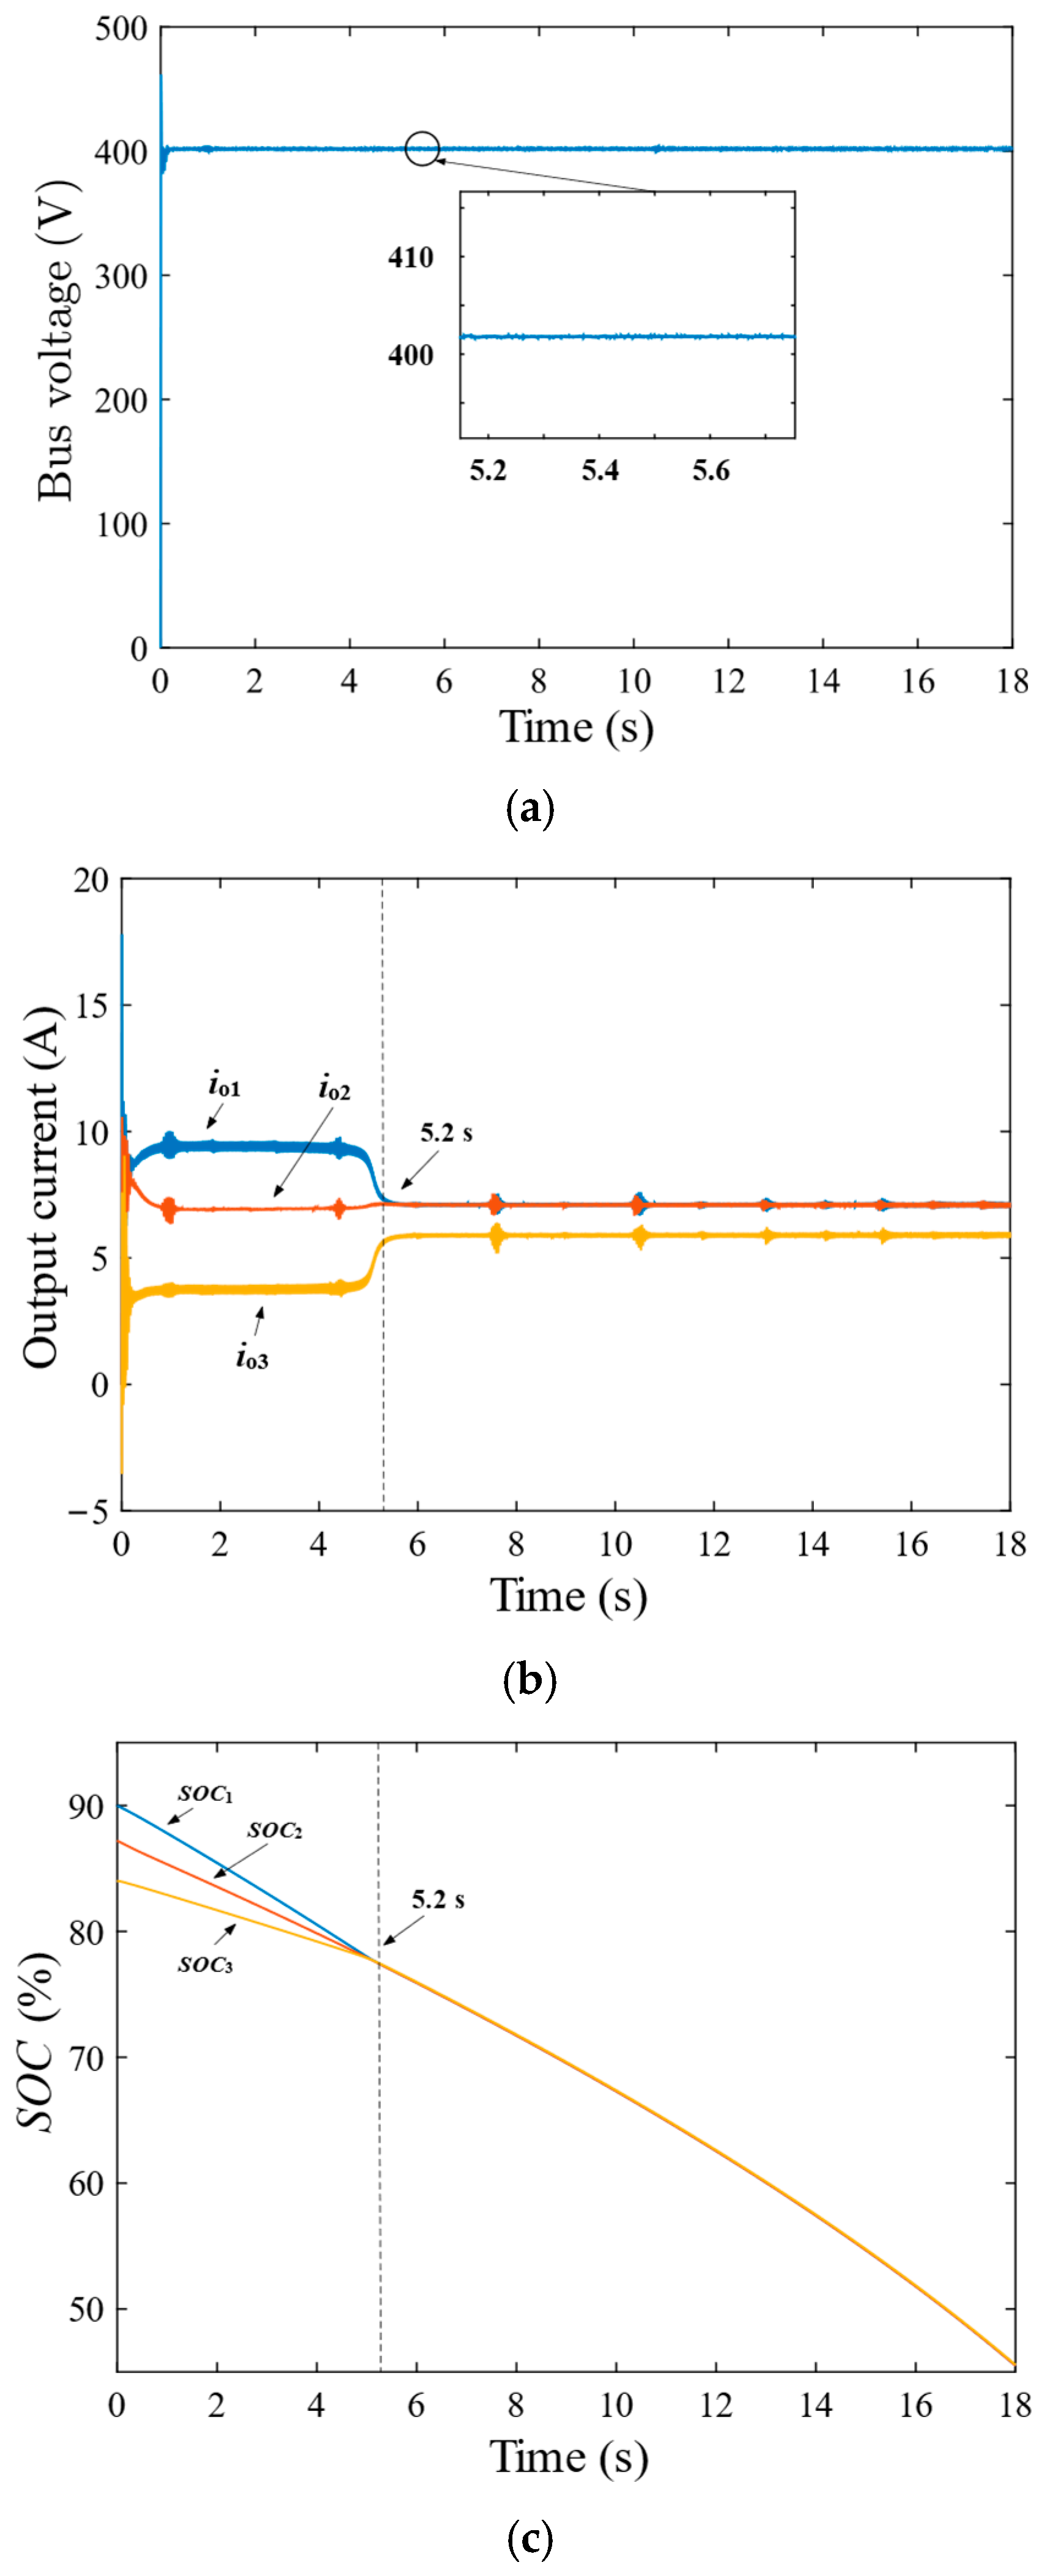
Secondly, the battery capacity of the third group is increased by 25% of the standard capacity; that is, the battery capacity of the third group is set to 5. The simulation results are shown in Figure 9. The DC bus voltage remains stable, the SOC balancing time and the output current equalization time are 5.2 s, and the output current distribution ratio is 6:6:5; the system remains stable.
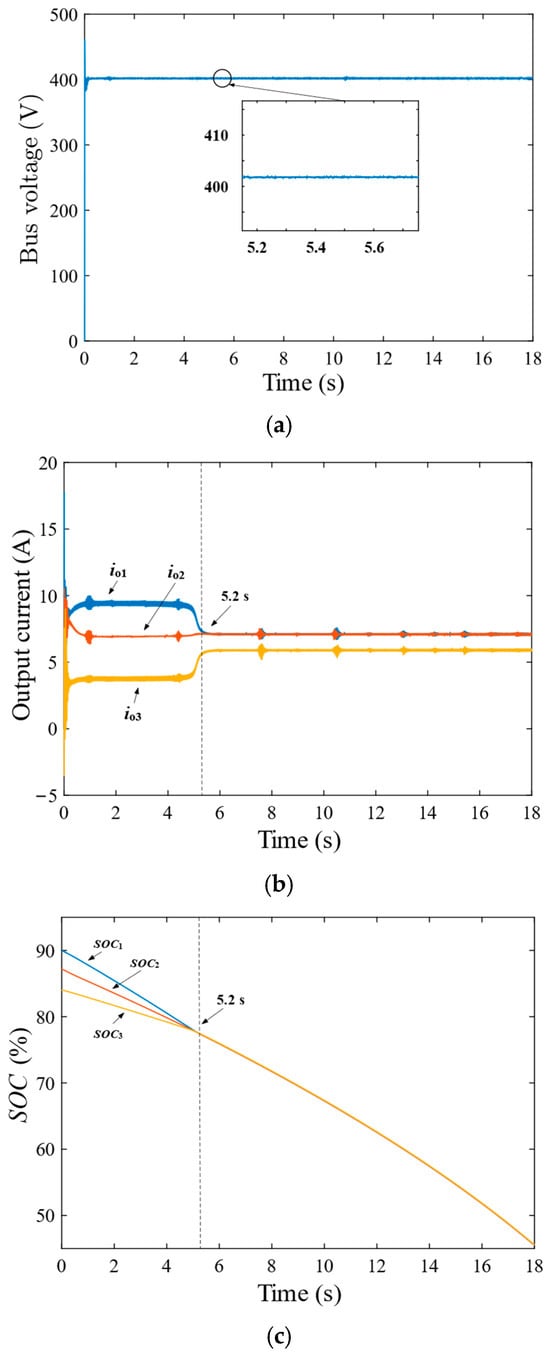
Figure 9.
Simulation of the third battery group increasing by 25% of its rated capacity. (a) DC bus voltage. (b) Output current. (c) SOC.
Therefore, when the battery capacity changes within a reasonable range, the proposed strategy can maintain system stability.
5.2. Simulation Analysis of Changing the Line Impedance of the Third Converter
In terms of line impedance, the line impedance of the first and second converters is kept unchanged, and only the line impedance of the third converter is changed in order to analyze the influence with line impedance variation.
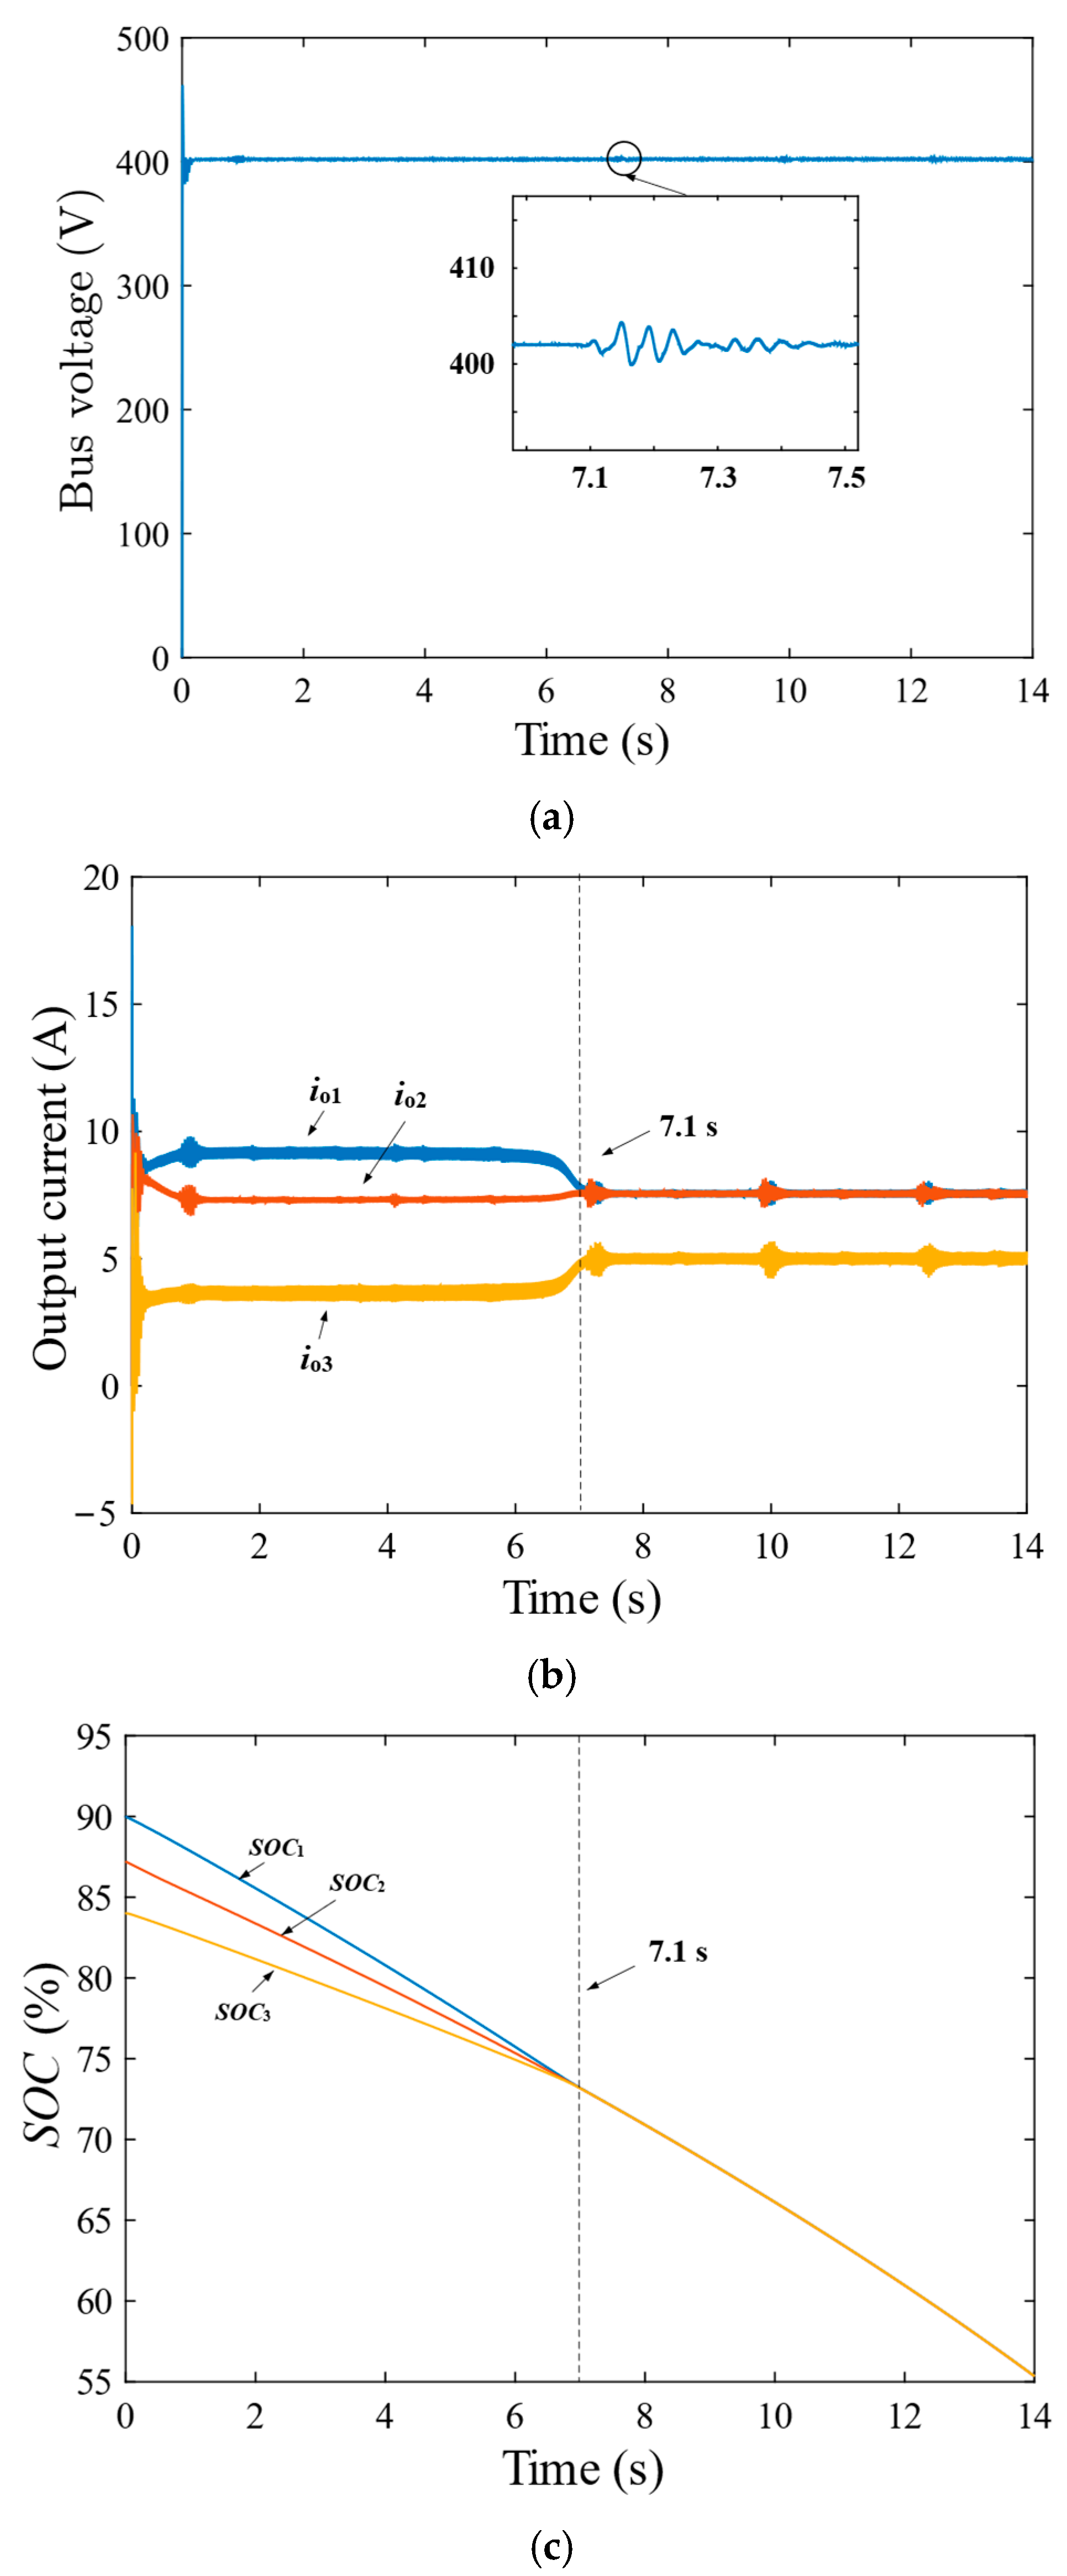
First, the line impedance of the third converter is reduced by 50% of the standard line impedance; that is, the line impedance of the third converter is set to 0.18Ω. The simulation results are shown in Figure 10. The SOC equalization time is 7.1 s, the DC bus voltage is maintained as stable, the output current is distributed proportionally, and the system is maintained as stable.
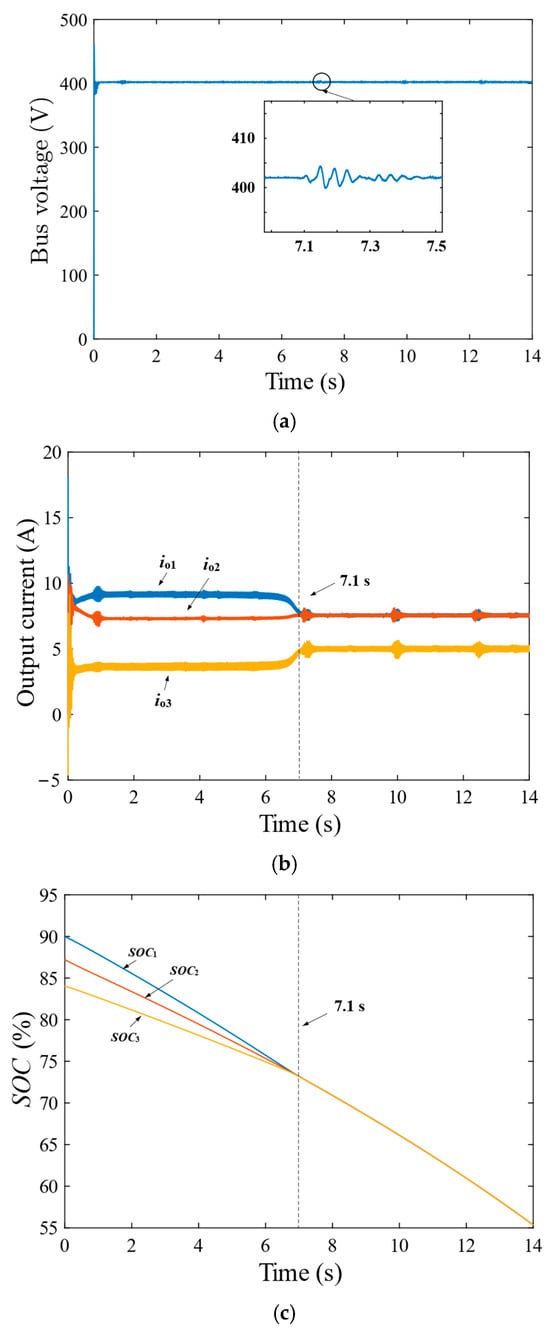
Figure 10.
Simulation of the third transformer’s line impedance decreasing by 50% of its rated line impedance. (a) DC bus voltage. (b) Output current. (c) SOC.
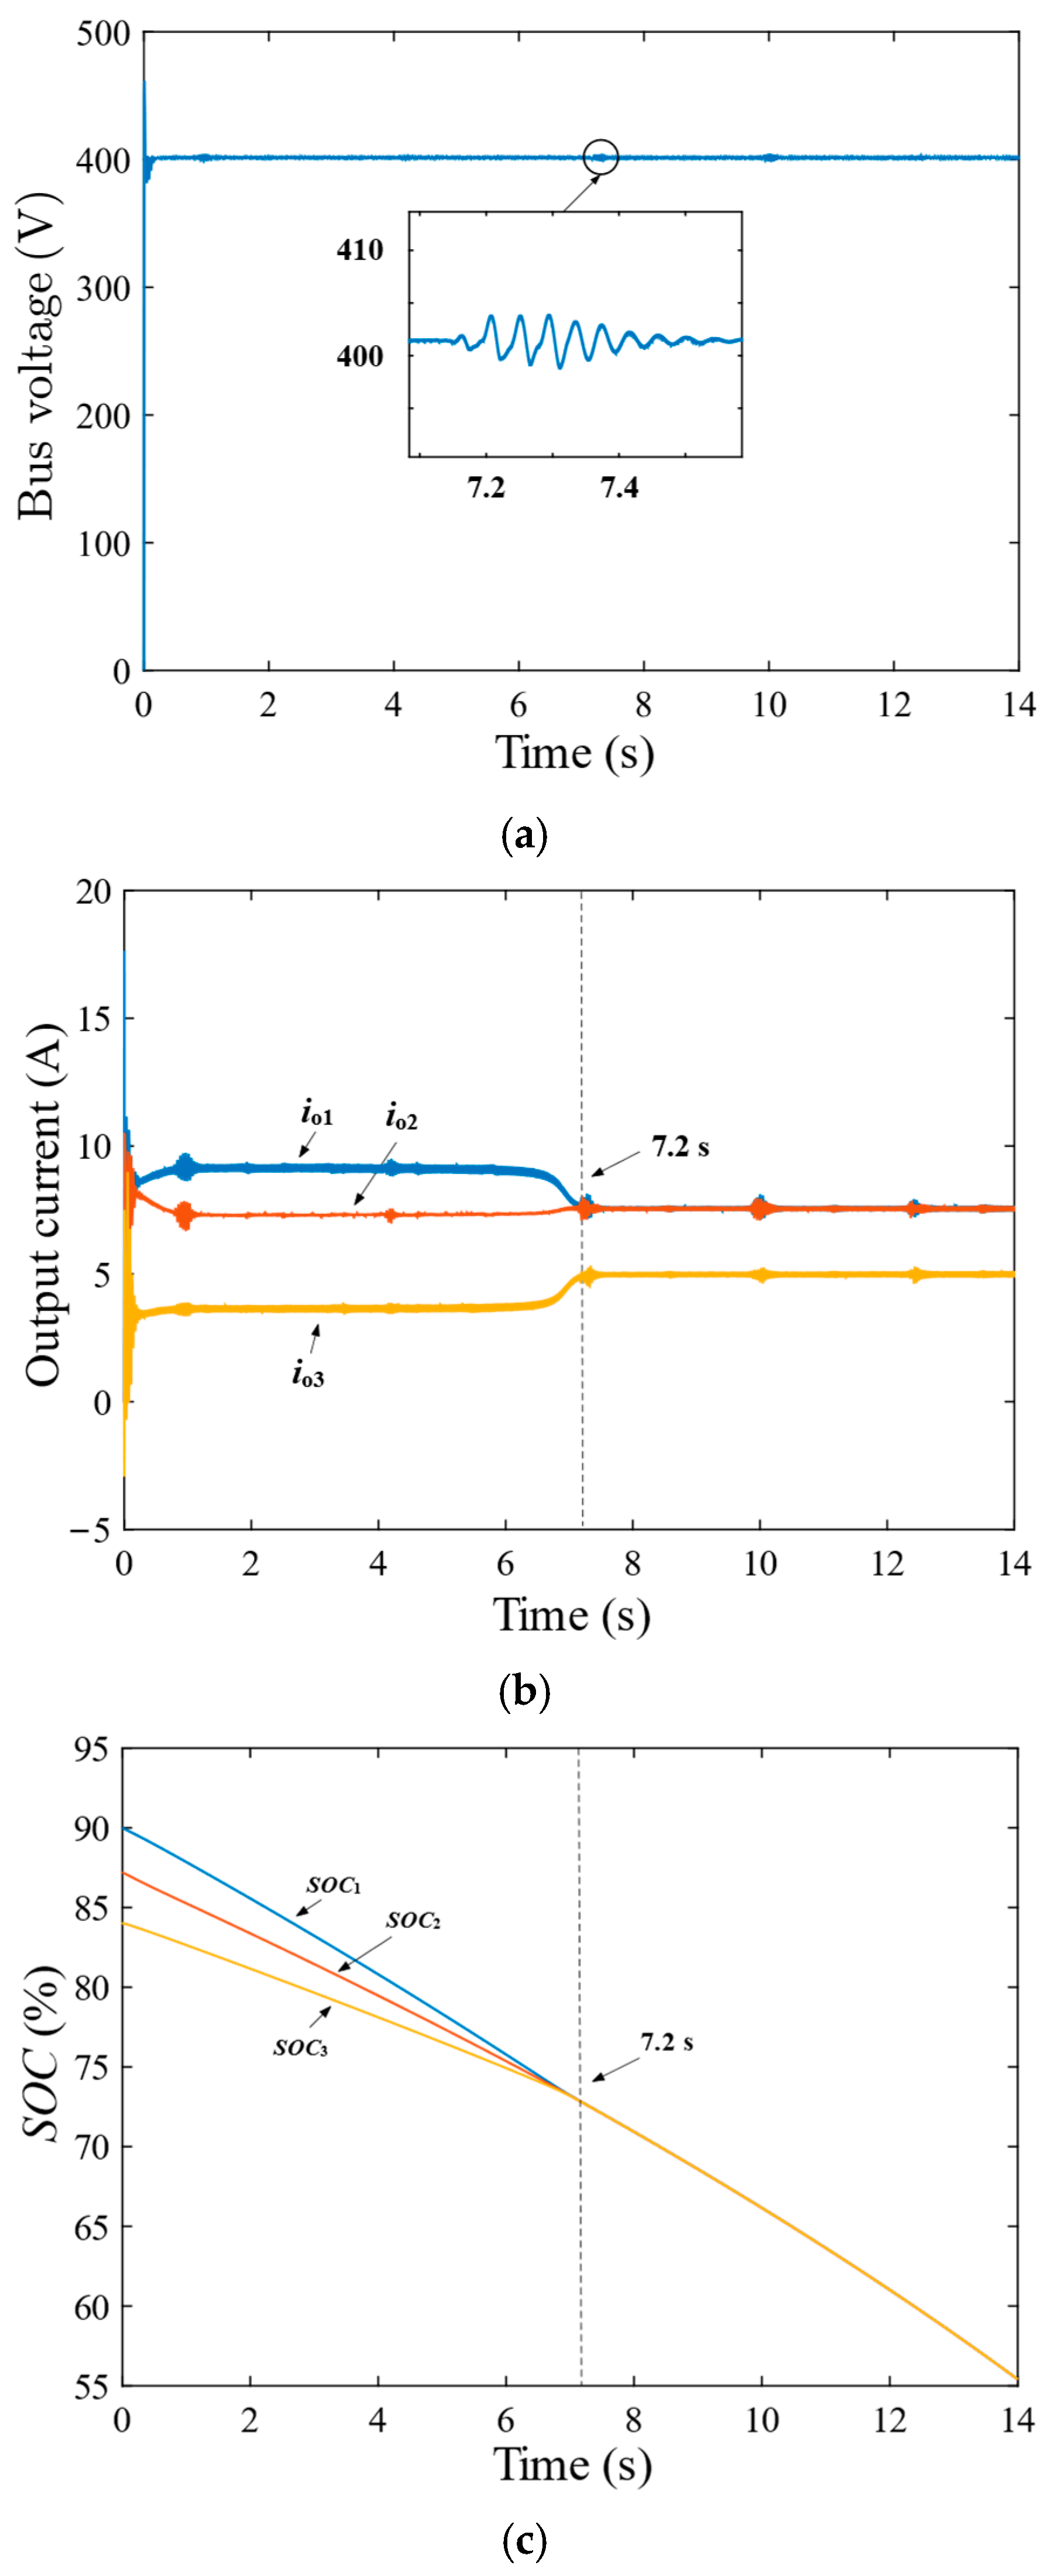
Secondly, the line impedance of the third converter is increased by 50% of the standard line impedance; that is, the line impedance of the third converter is set to 0.54Ω. The simulation results are shown in Figure 11. The DC bus voltage remains stable, the output current is properly distributed, the SOC equalizes after 7.2 s, and the system is stable.
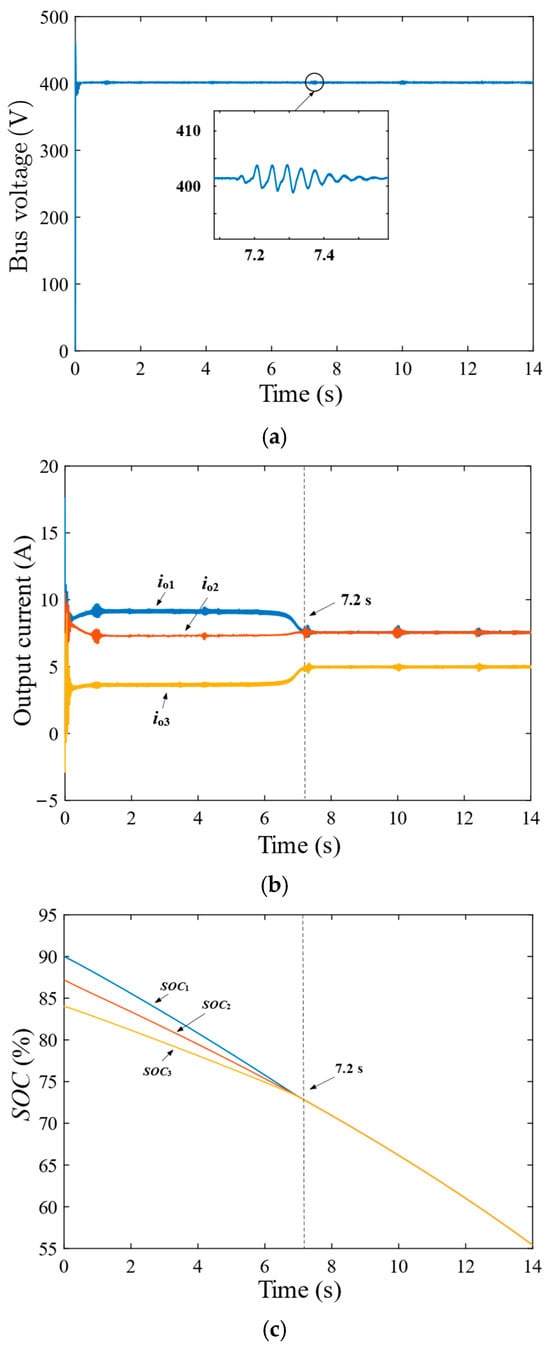
Figure 11.
Simulation of the third transformer’s line impedance increasing by 50% of its rated line impedance. (a) DC bus voltage. (b) Output current. (c) SOC.
Therefore, when line impedance changes reasonably, the proposed strategy can effectively eliminate the effect of line impedance on accurate current distribution and ensure stable system operation.
5.3. Simulation Analysis of Changing the Load Power
In terms of load power, the standard load power is set to 8 kW, and the influence of load power change on the system’s stability is analyzed.
First, the load power is reduced by 25% of the standard load power; that is, the load power is set to 6 kW. The simulation results are shown in Figure 12. After a period of jitter, the DC bus voltage and output current are held steady, the SOC equalizes after 11.6 s, and the system remains stable.
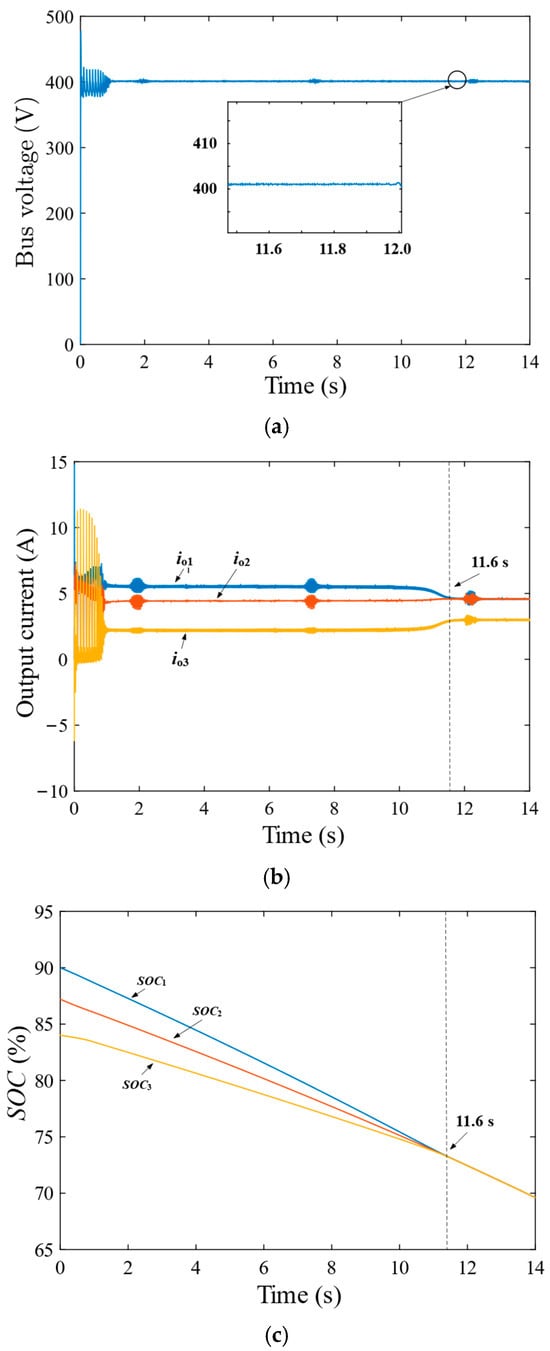
Figure 12.
Simulation of load power decreasing by 25% of its rated load power. (a) DC bus voltage. (b) Output current. (c) SOC.
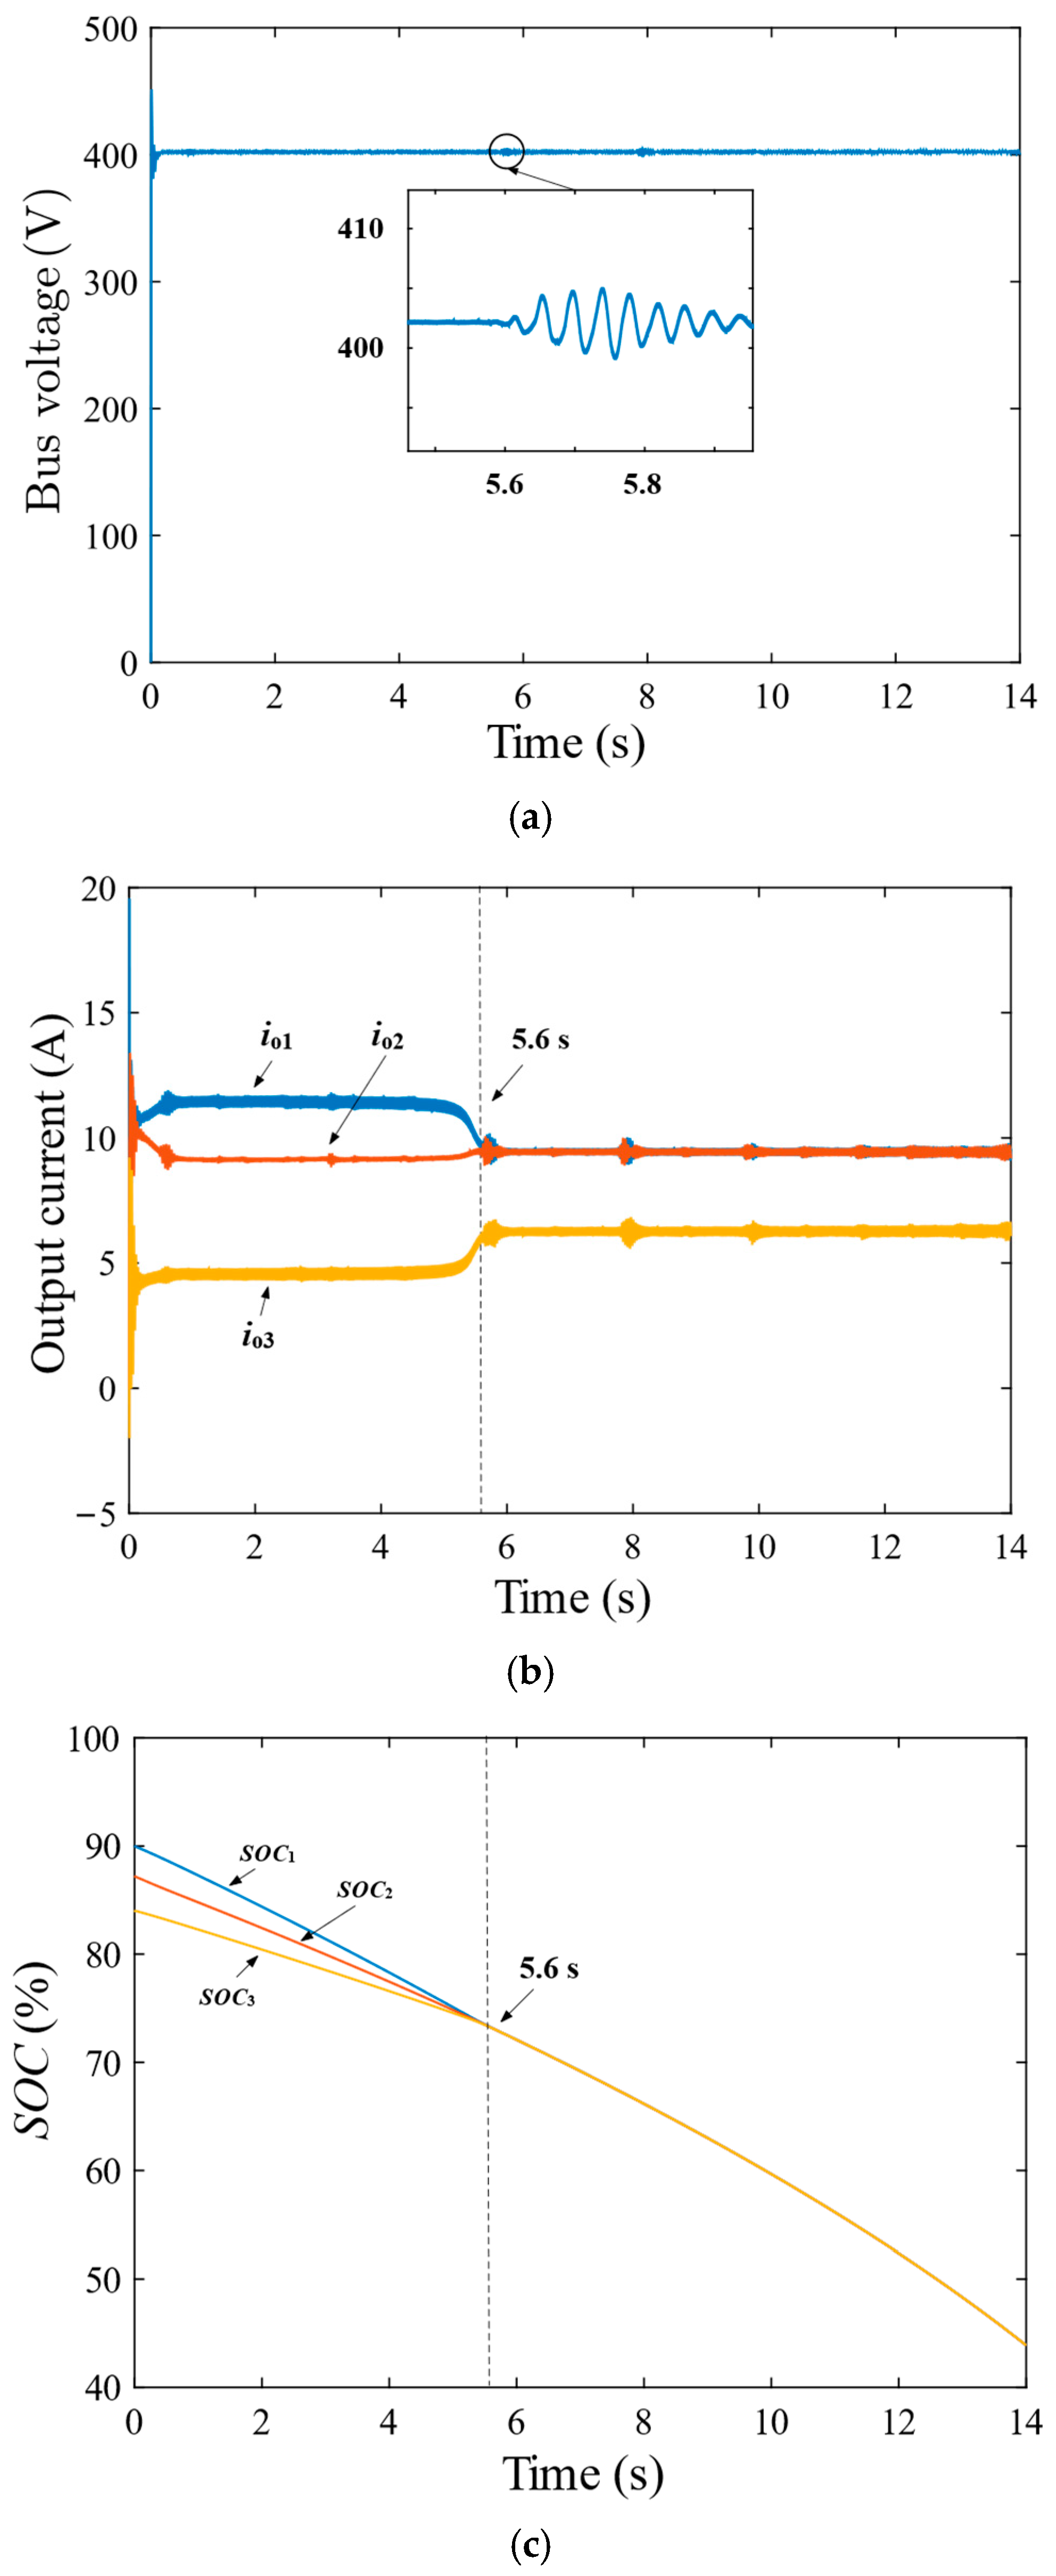
Secondly, the load power is increased by 25% of the standard load power; that is, the load power is set to 10 kW. The simulation results are shown in Figure 13. The SOC balancing time is 5.6 s, the DC bus voltage remains stable, and the system remains stable.
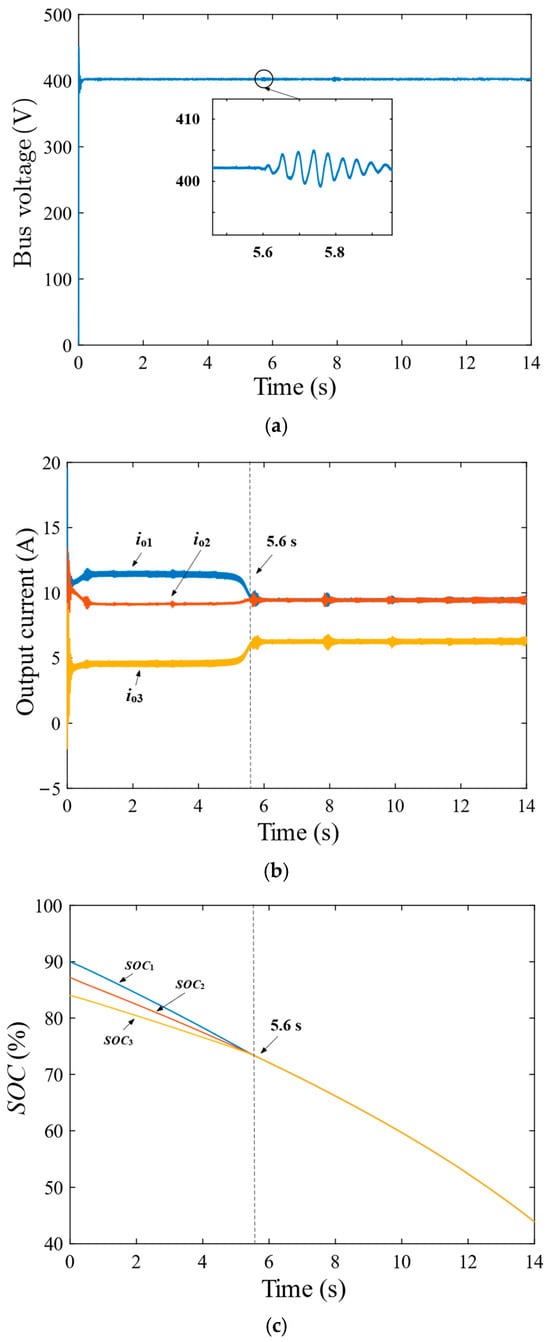
Figure 13.
Simulation of load power increasing by 25% of its rated load power. (a) DC bus voltage. (b) Output current. (c) SOC.
Therefore, when the load power changes reasonably, the proposed strategy can maintain the stable operation of the system.
Through the simulation results, it can be seen that when the battery capacity, line impedance, and load power of the converters are changed, respectively, within the ranges of [3,4,5], [1.8 Ω − 5.4 Ω], and [6 kW − 10 kW], the system can maintain stability.
6. Experiment Results
To verify the effectiveness of the proposed strategy, a hardware-in-the-loop experimental platform is established based on an RT-Lab real-time platform combined with a DSP control board for experimental verification, as shown in Figure 14. The experimental platform is equipped with a master computer, oscilloscope, OP5707, and DSP. In this case, the main circuit model is built in the RT-Lab system. The control strategy is implemented on the DSP board. The key parameters are shown in Table 1.
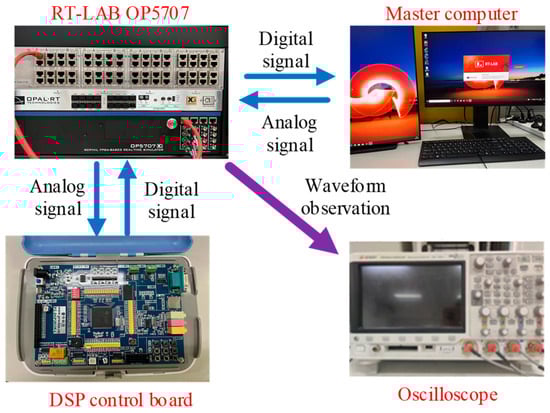
Figure 14.
Hardware-in-the-loop experimental platform display plot.
6.1. Experimental Case I: Normal Discharge Mode and Its Comparison Experiment with Existing Methods
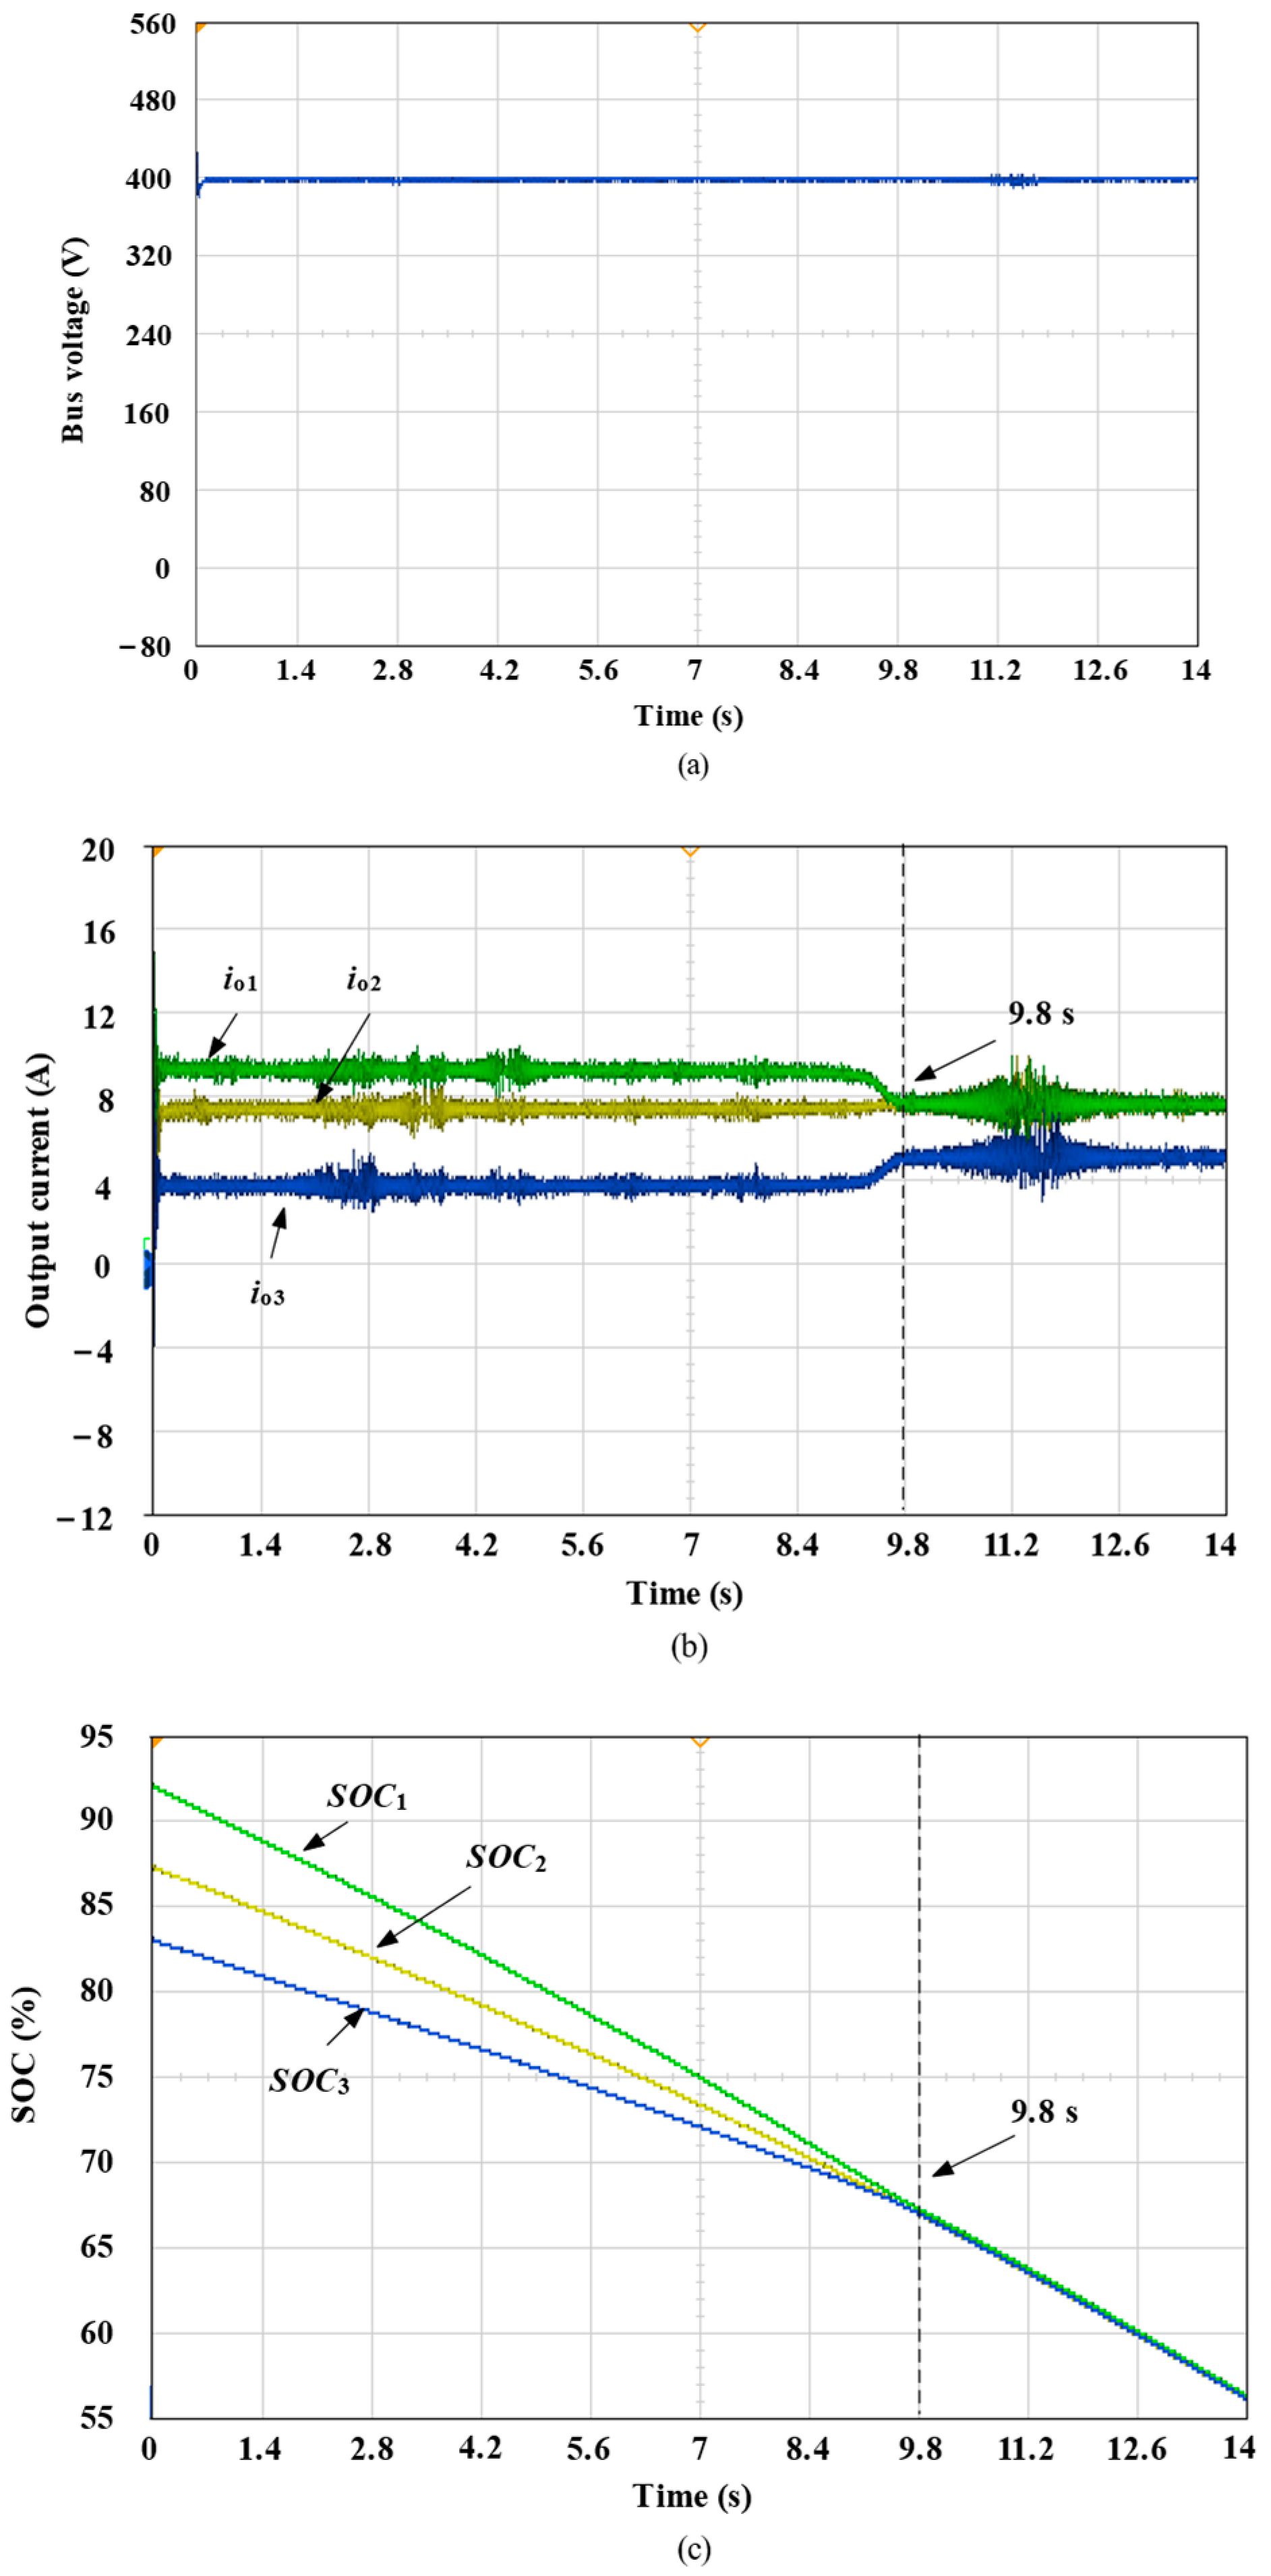
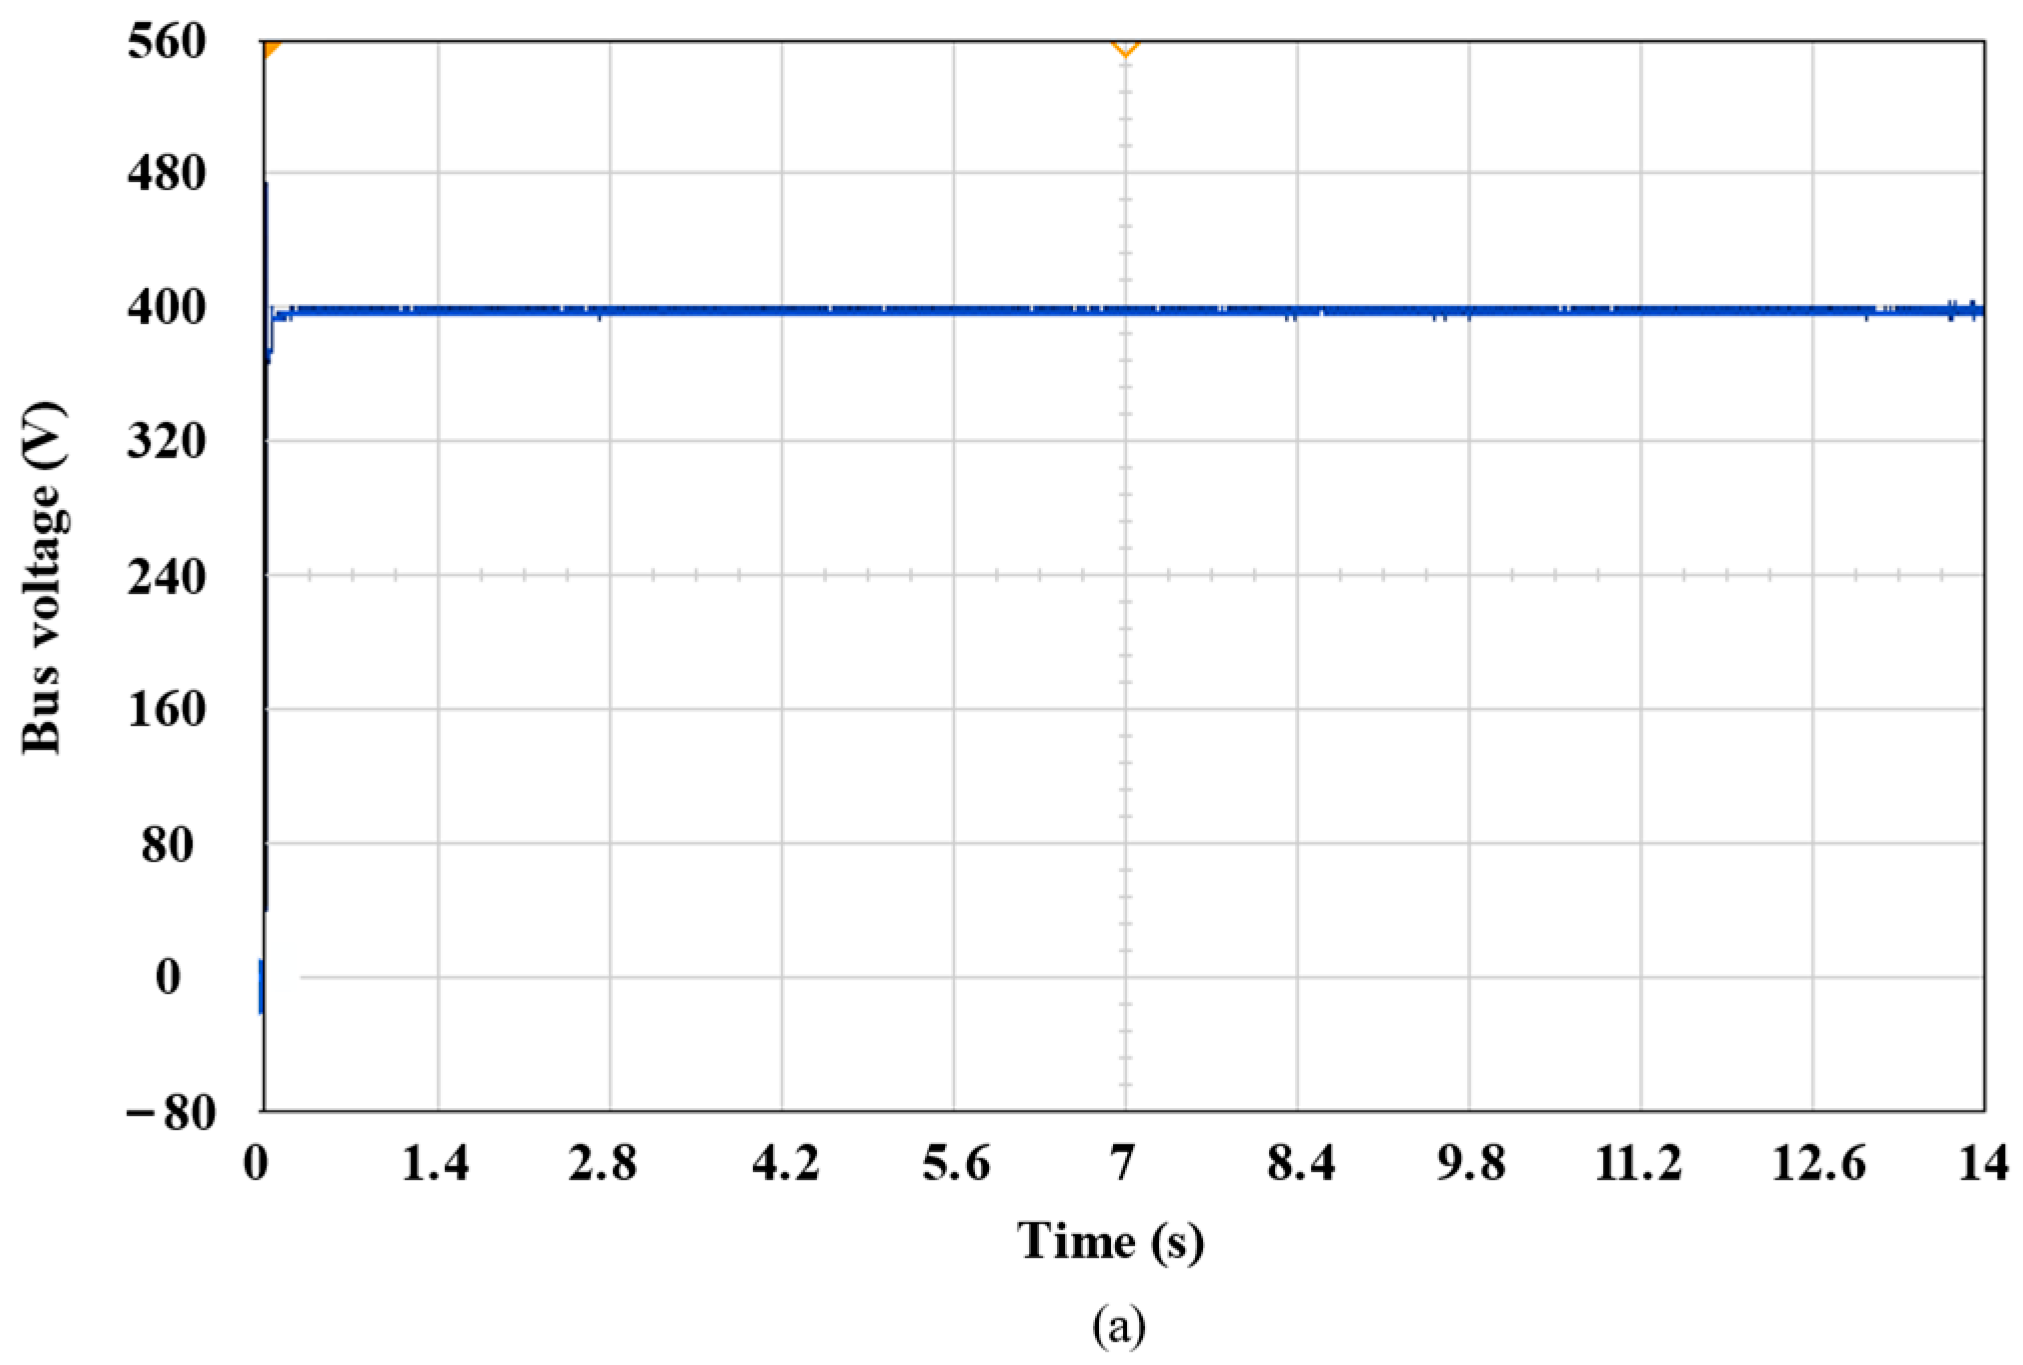
The initial values of SOC for the three ESUs are 93%, 88%, and 83%. The load ratings are all 8 kW. Reference [25] proposes an improved distributed cooperative control strategy to achieve SOC equalization. In this case, Figure 15 shows the experimental results of the control strategy proposed in this paper, and Figure 16 demonstrates the control strategy proposed in [25].
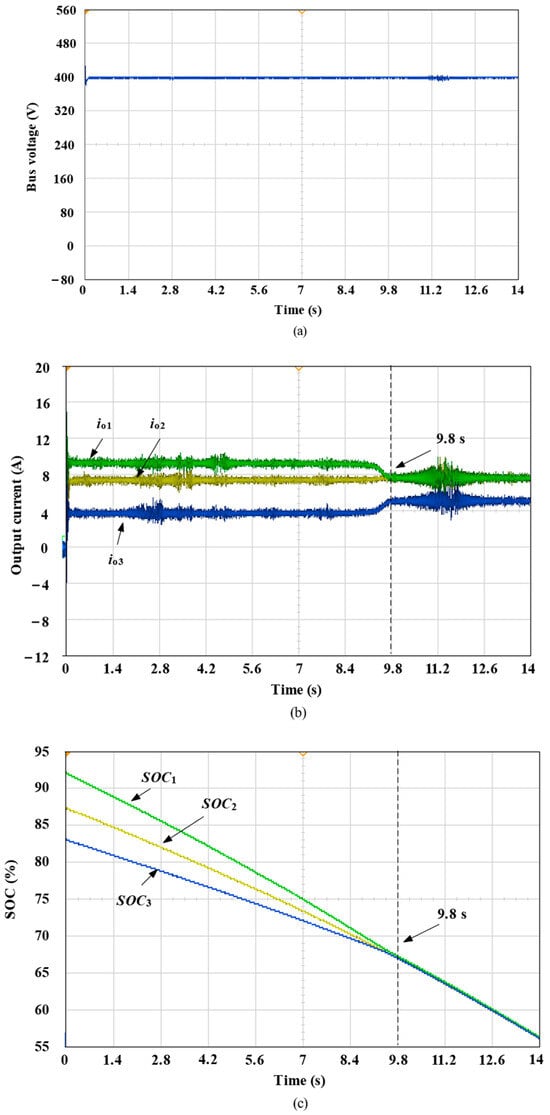
Figure 15.
Experiment of normal discharge mode. (a) DC bus voltage. (b) Output current. (c) SOC.

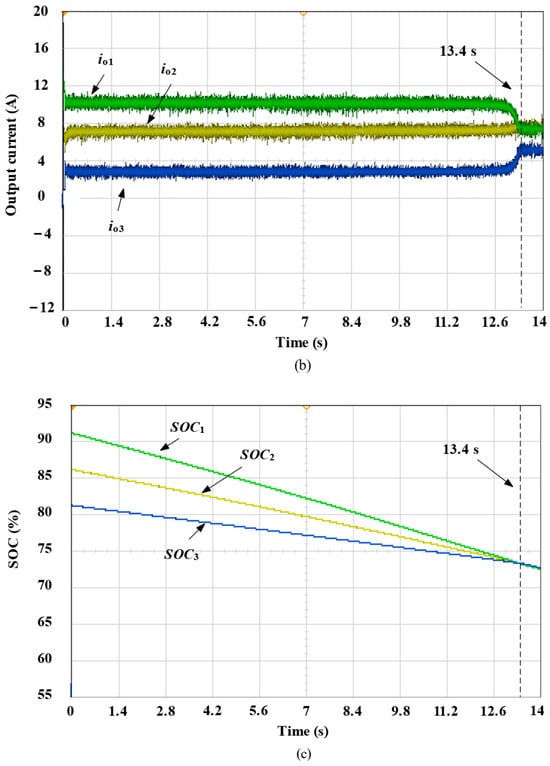
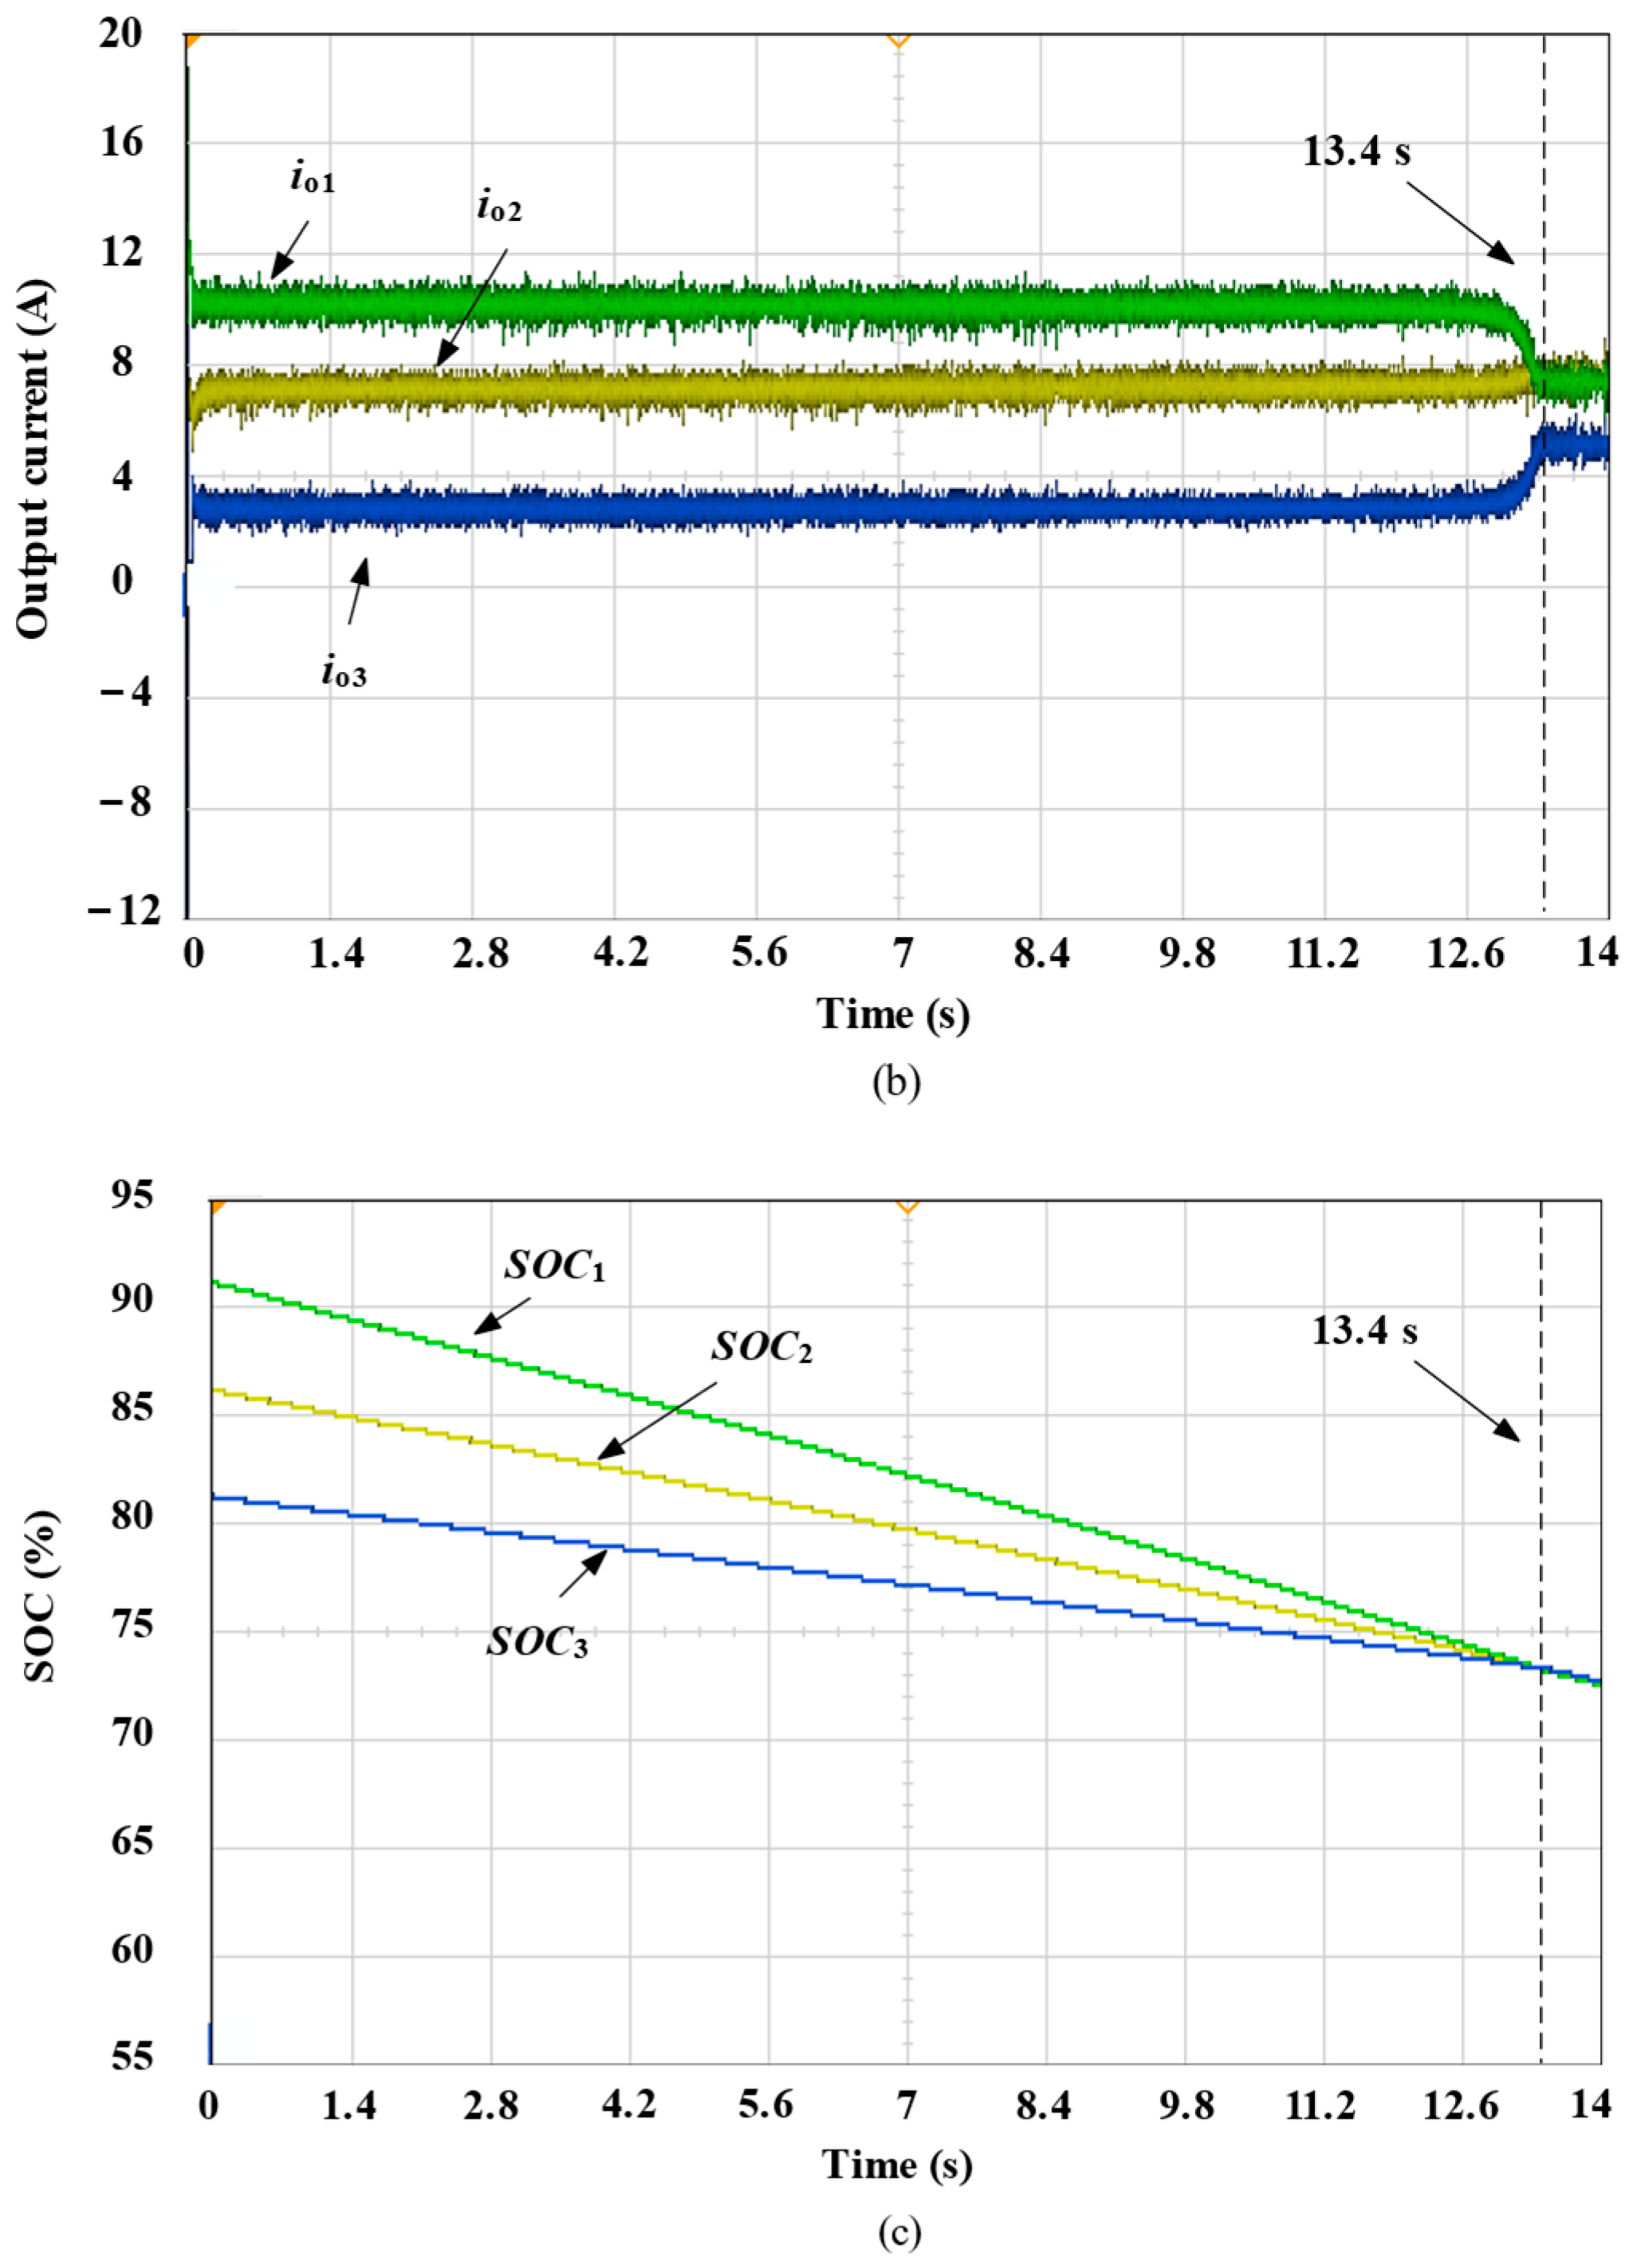
Figure 16.
Experiment of [25]. (a) DC bus voltage. (b) Output current. (c) SOC.
From Figure 15a, it can be seen that there is a certain drop in the bus voltage at the beginning of the discharge phase, but since the proposed control strategy in this paper can compensate for the voltage drop caused by the line losses, the bus voltage can be quickly restored to 400 V and stable operation can be maintained. Although the control strategy of [25] shown in Figure 16a can also restore the bus voltage and keep it stable, its voltage can only be maintained at about 397 V.
Further, from the output current and the SOC waveform under the proposed control method, as shown in Figure 15b,c, respectively, it can be seen that the larger the SOC of the ESUs, the larger their output currents correspondingly; conversely, the smaller the SOC, the smaller their output currents correspondingly. At t = 9.8 s, the SOC of each ESU tends to converge, satisfying the 3:3:2 capacity allocation requirement. In contrast, the proposed control strategy in [25] takes 13.4 s when the output currents are uniformly distributed (as shown in Figure 16b), and the SOC equalization (as shown in Figure 16c) is 3.6 s slower than the proposed method in this paper.
In summary, the proposed control method in this paper achieves SOC equalization and accurate current distribution faster than the comparative methods, and also better maintains the bus voltage at the rated value.
6.2. Experimental Case II: Line Impedance Change
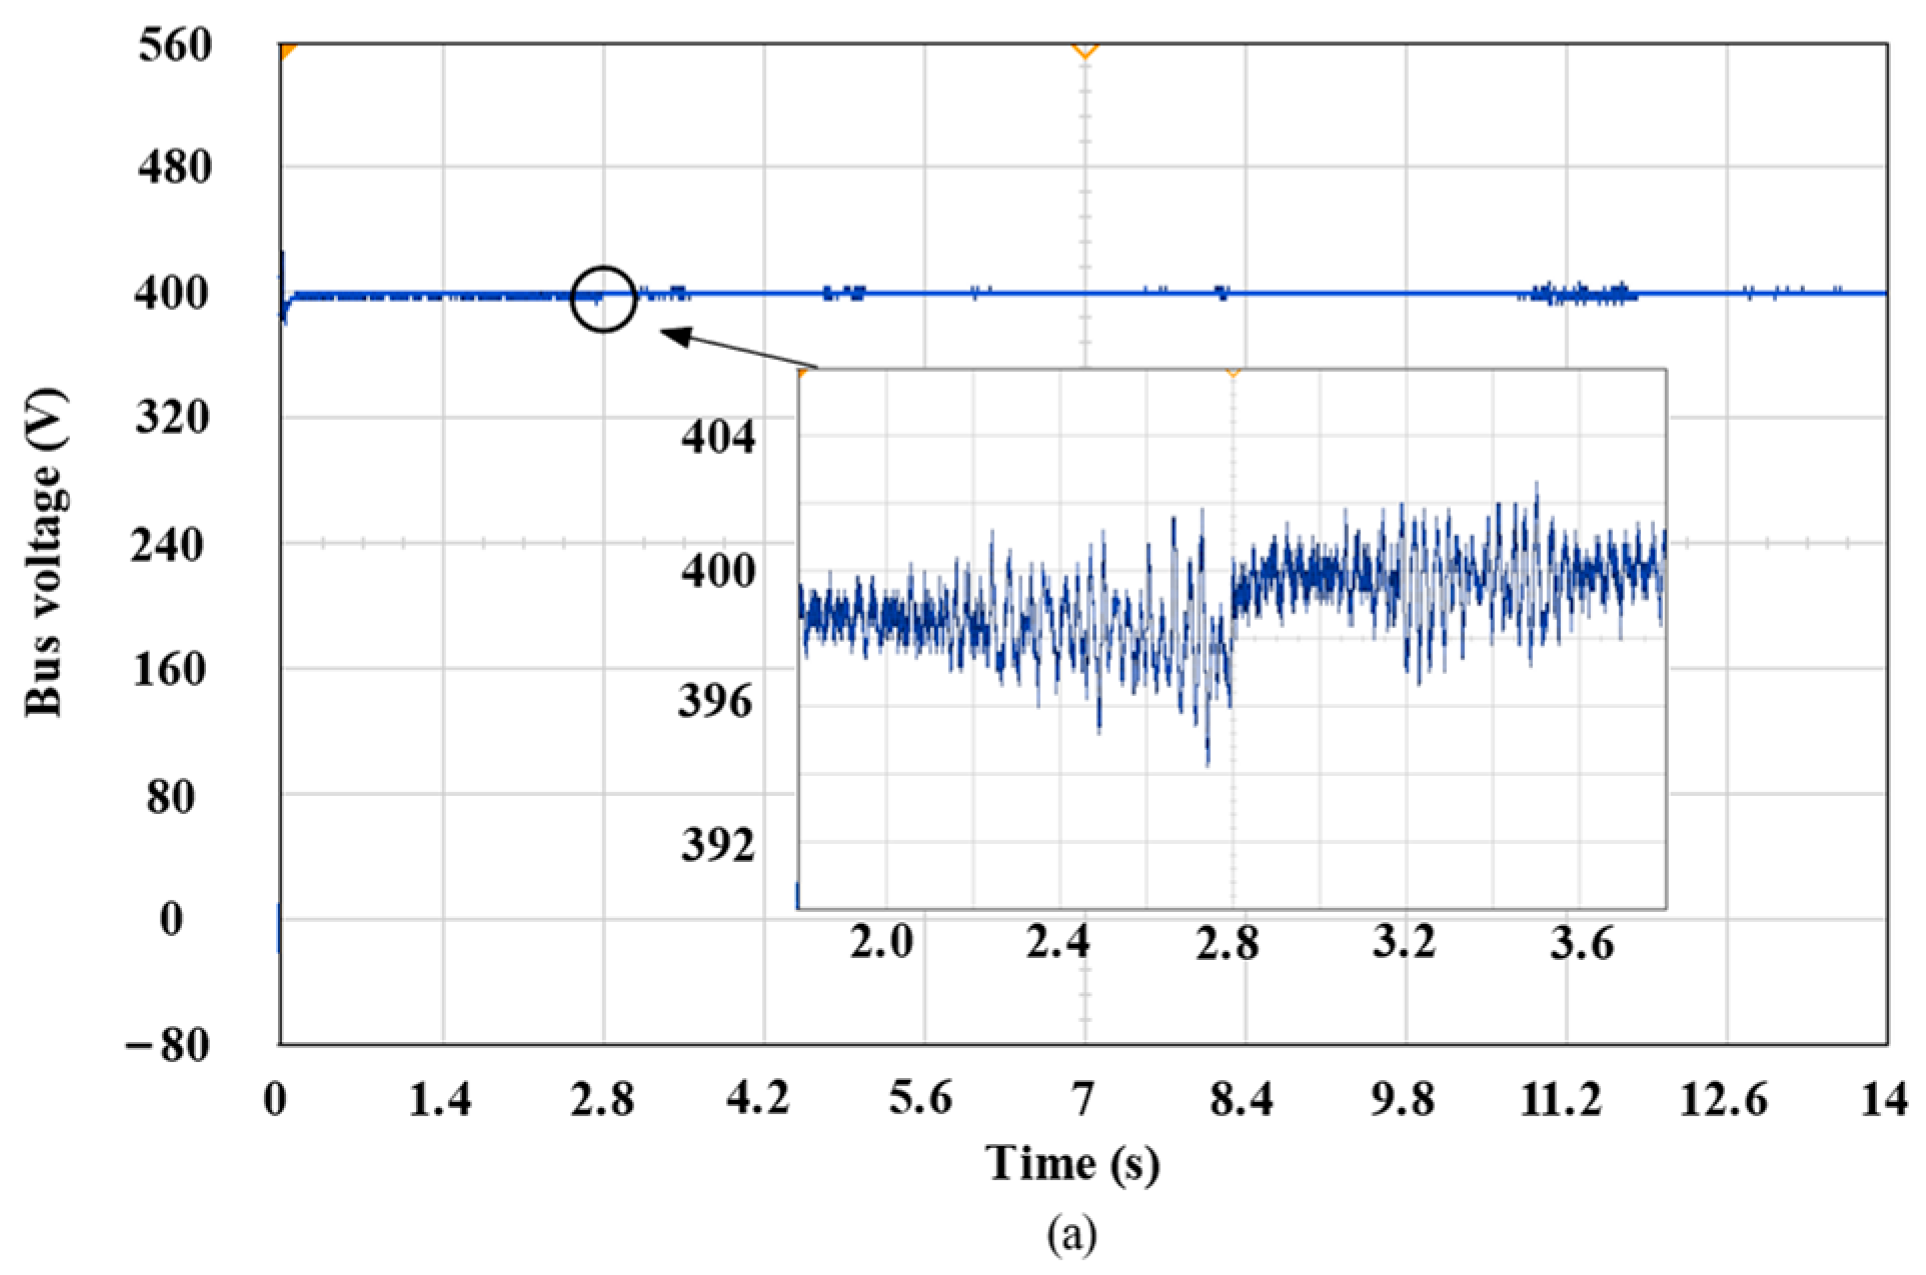
To confirm the control effect of the strategy under the condition of a sudden change in line impedance, the line impedance of the first converter is set to be reduced from 1 Ω to 0.5 Ω at t = 2.8.
At t = 2.8 s, the line impedance of the first ESU becomes 0.5Ω. From Figure 17a, the bus voltage drops briefly when the line impedance is reduced, but it returns to the reference value of 400 V after only 0.01 s and maintains stable operation. From Figure 17b, the control strategy of this paper is adopted. t = 9.8 s satisfies the output current distribution by capacity. From Figure 17c, SOC1, SOC2, and SOC3 reach t = 9.8 s.

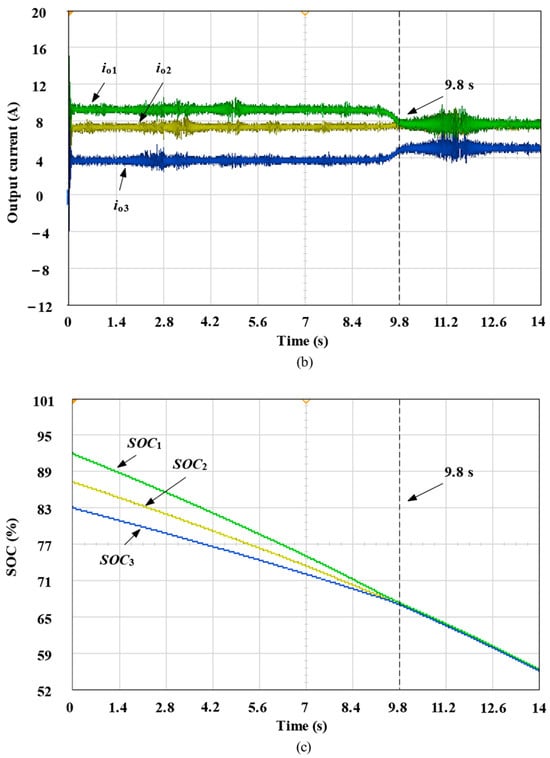
Figure 17.
Experiment of line impedance changes. (a) DC bus voltage. (b) Output current. (c) SOC.
6.3. Experimental Case III: Load Switching in ESSs
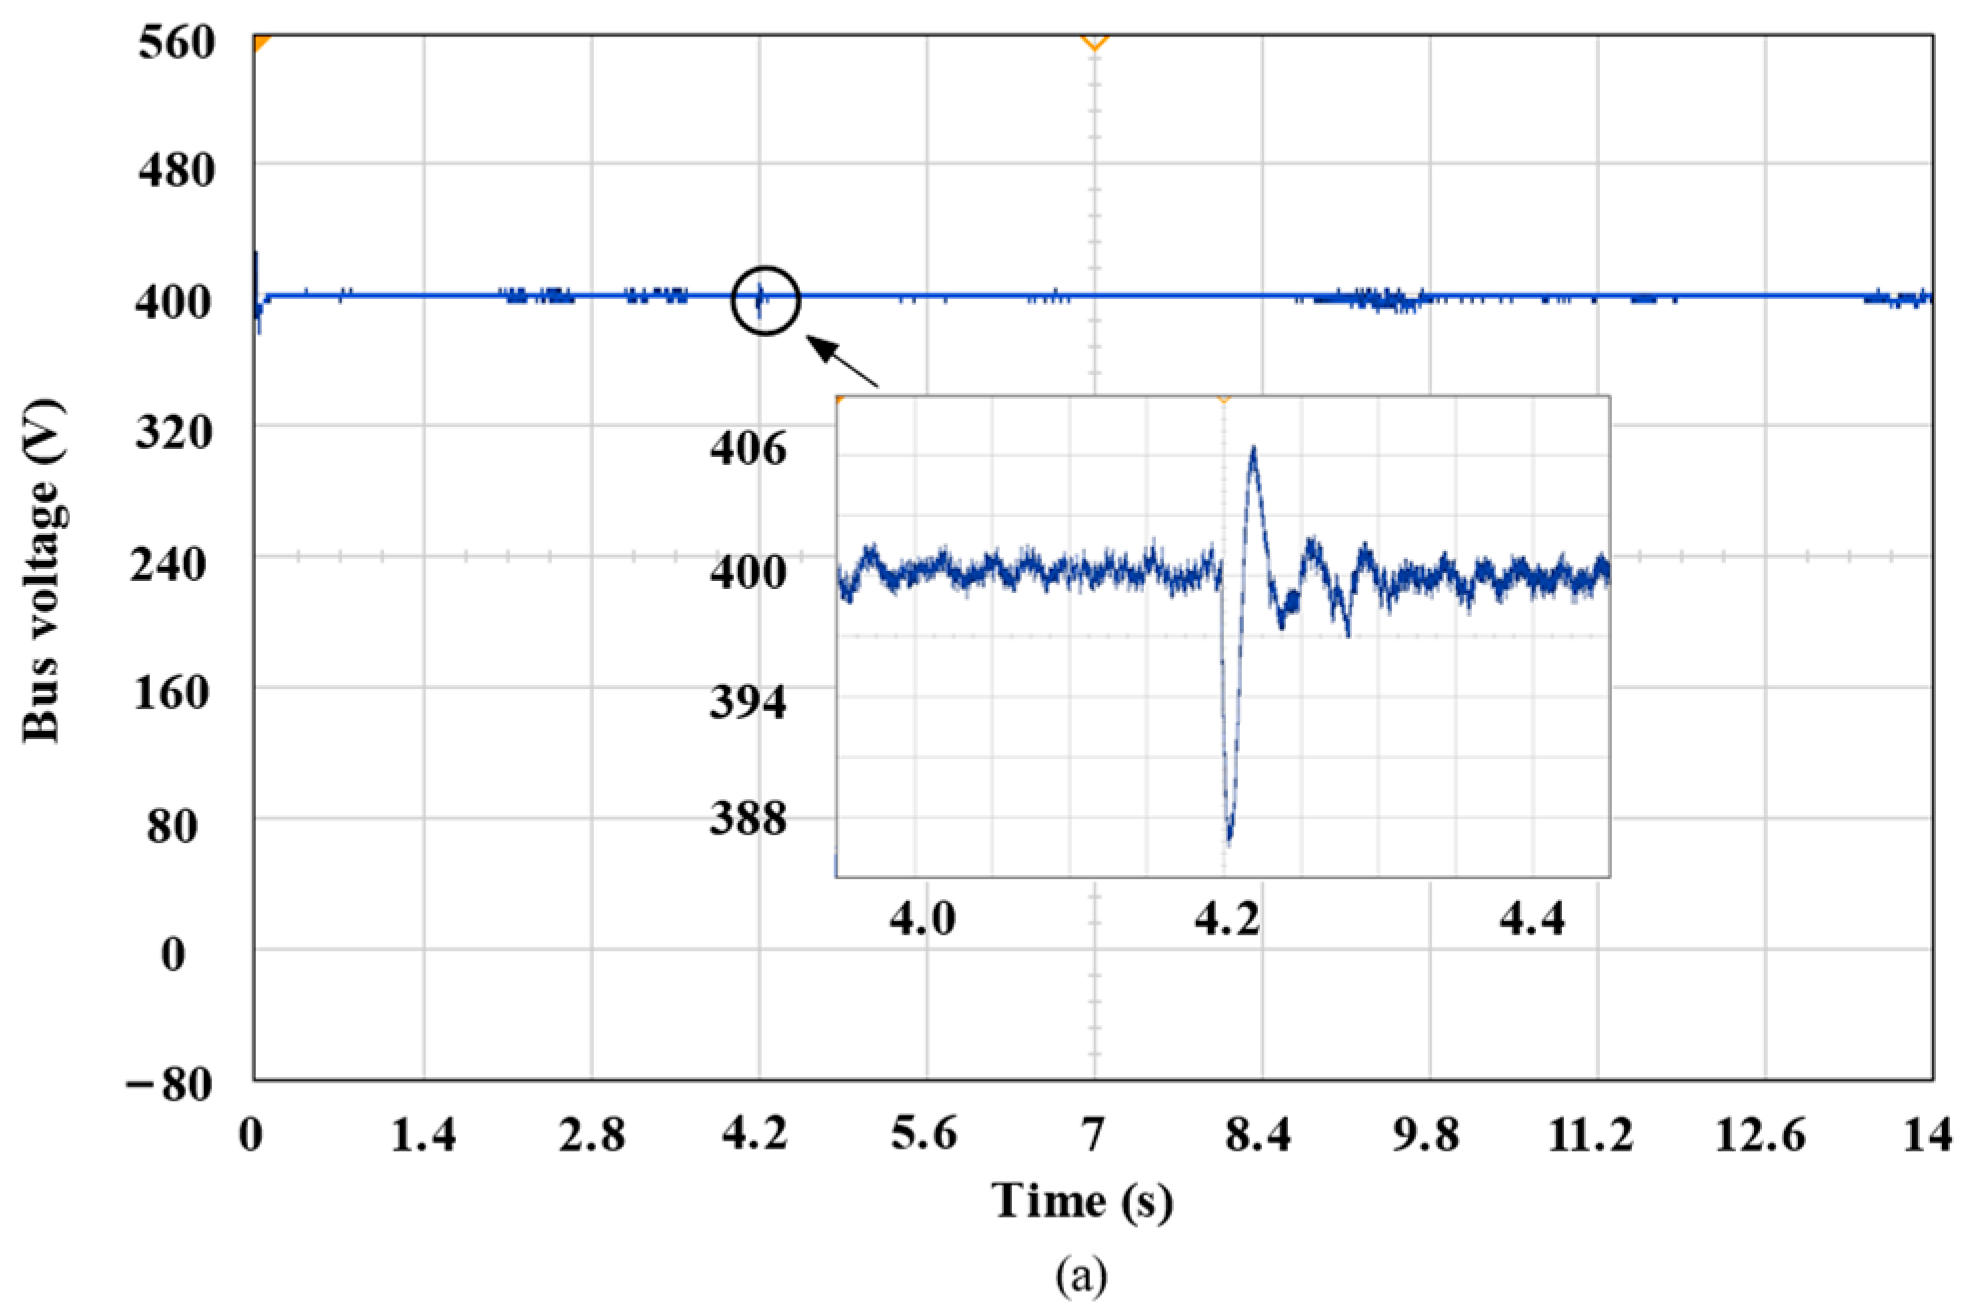
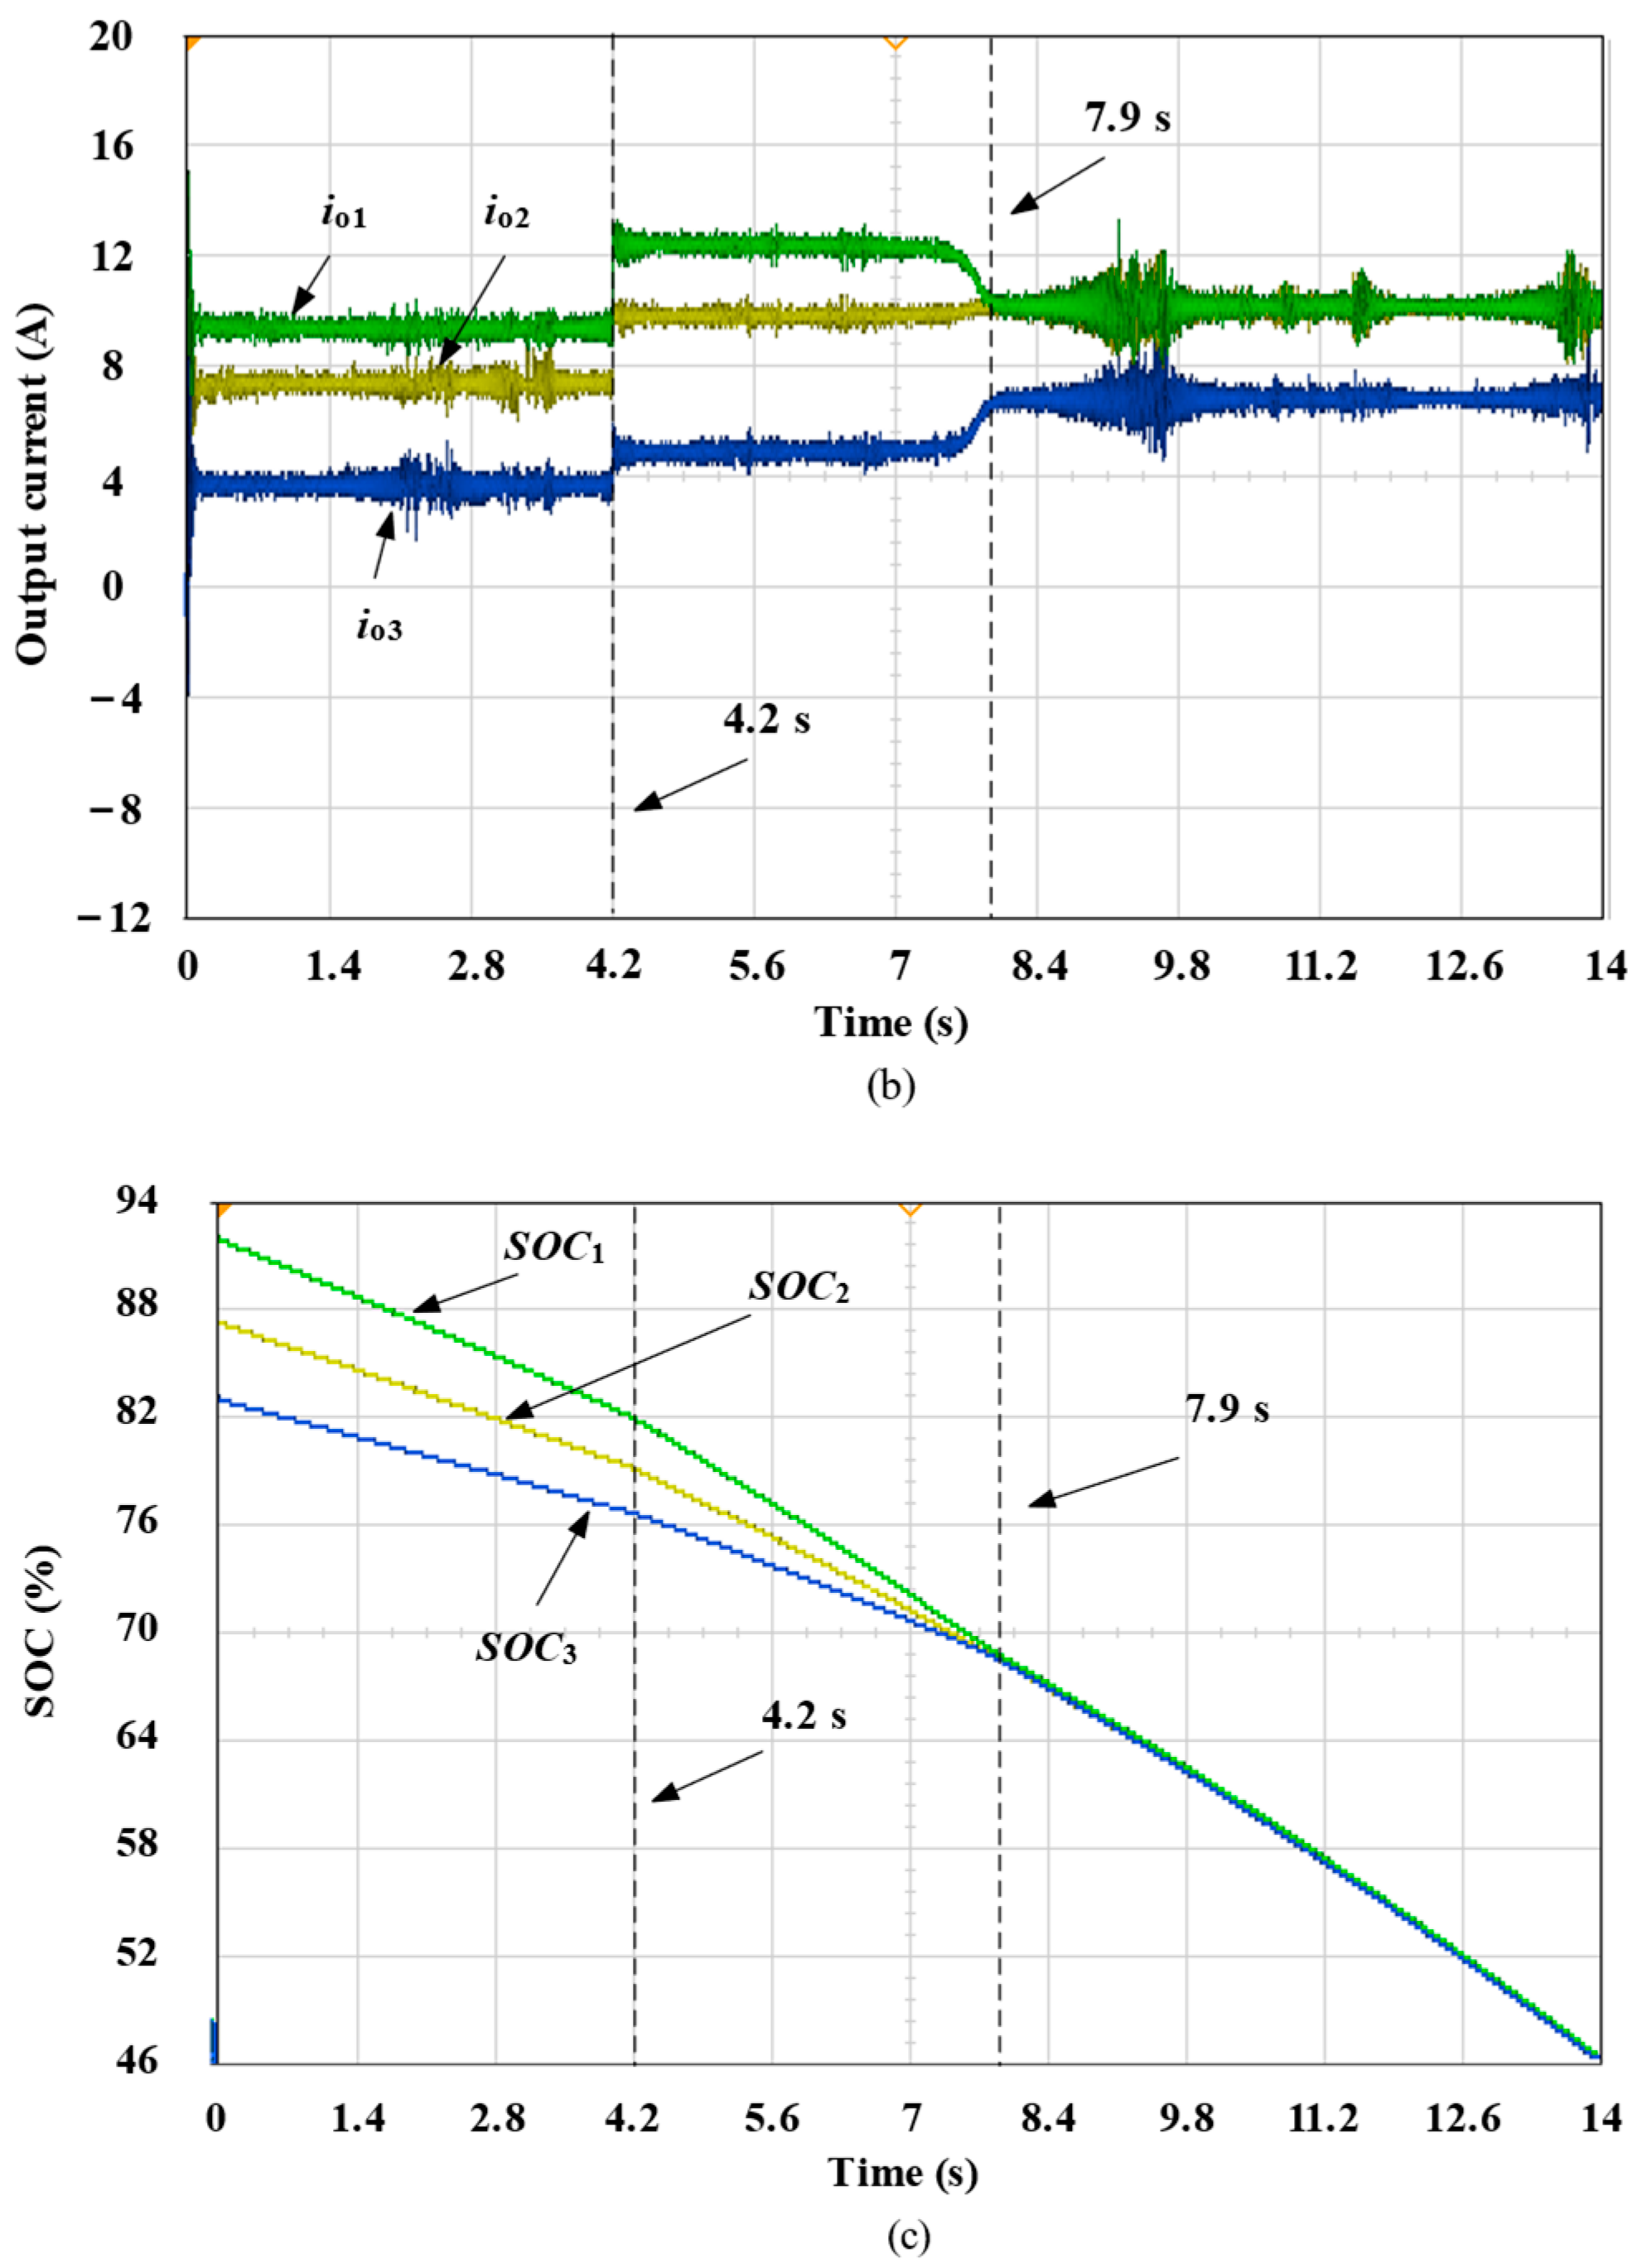
The experiment is set to run until 4.2 s, when the system load changes abruptly. The equivalent load of the system is abruptly changed from the initial 20Ω to 15Ω. Figure 18 shows the experimental results.

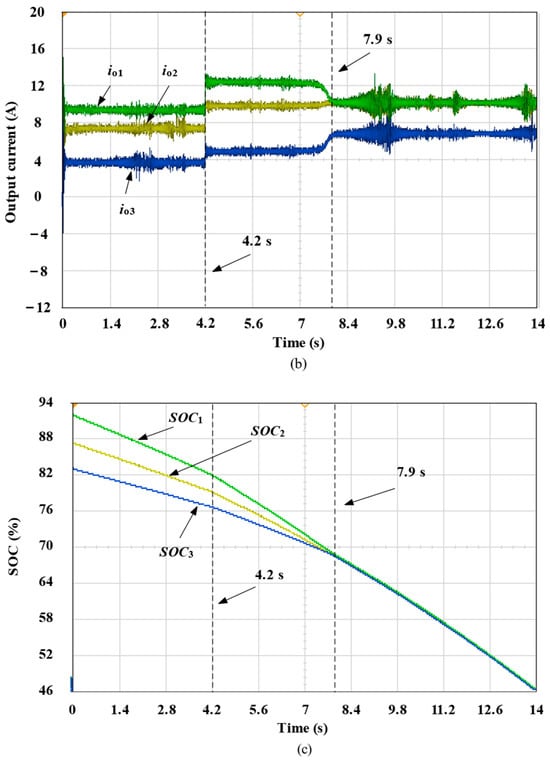
Figure 18.
Experiment of load switching in ESSs. (a) DC bus voltage. (b) Output current. (c) SOC.
The ESU is regular discharge before the load is incorporated, and a 60 Ω resistive load is incorporated into the load when t = 4.2 s. From Figure 18a, the bus voltage can be restored to the reference value of 400 V after a fluctuation of 0.02 s. From Figure 18b, because a 60 Ω resistive load is incorporated after 4.2 s, the output current increases. The increase in power of the load leads to an increase in output current. At t = 7.9 s, the output currents are 10 A, 10 A, and 6.6 A, respectively, which satisfy the output current distribution by capacity. After adopting the proposed strategies, the difference between different SOCs continues to decrease, and in the end, the SOC reaches equilibrium at t = 7.9 s, as shown in Figure 18c.
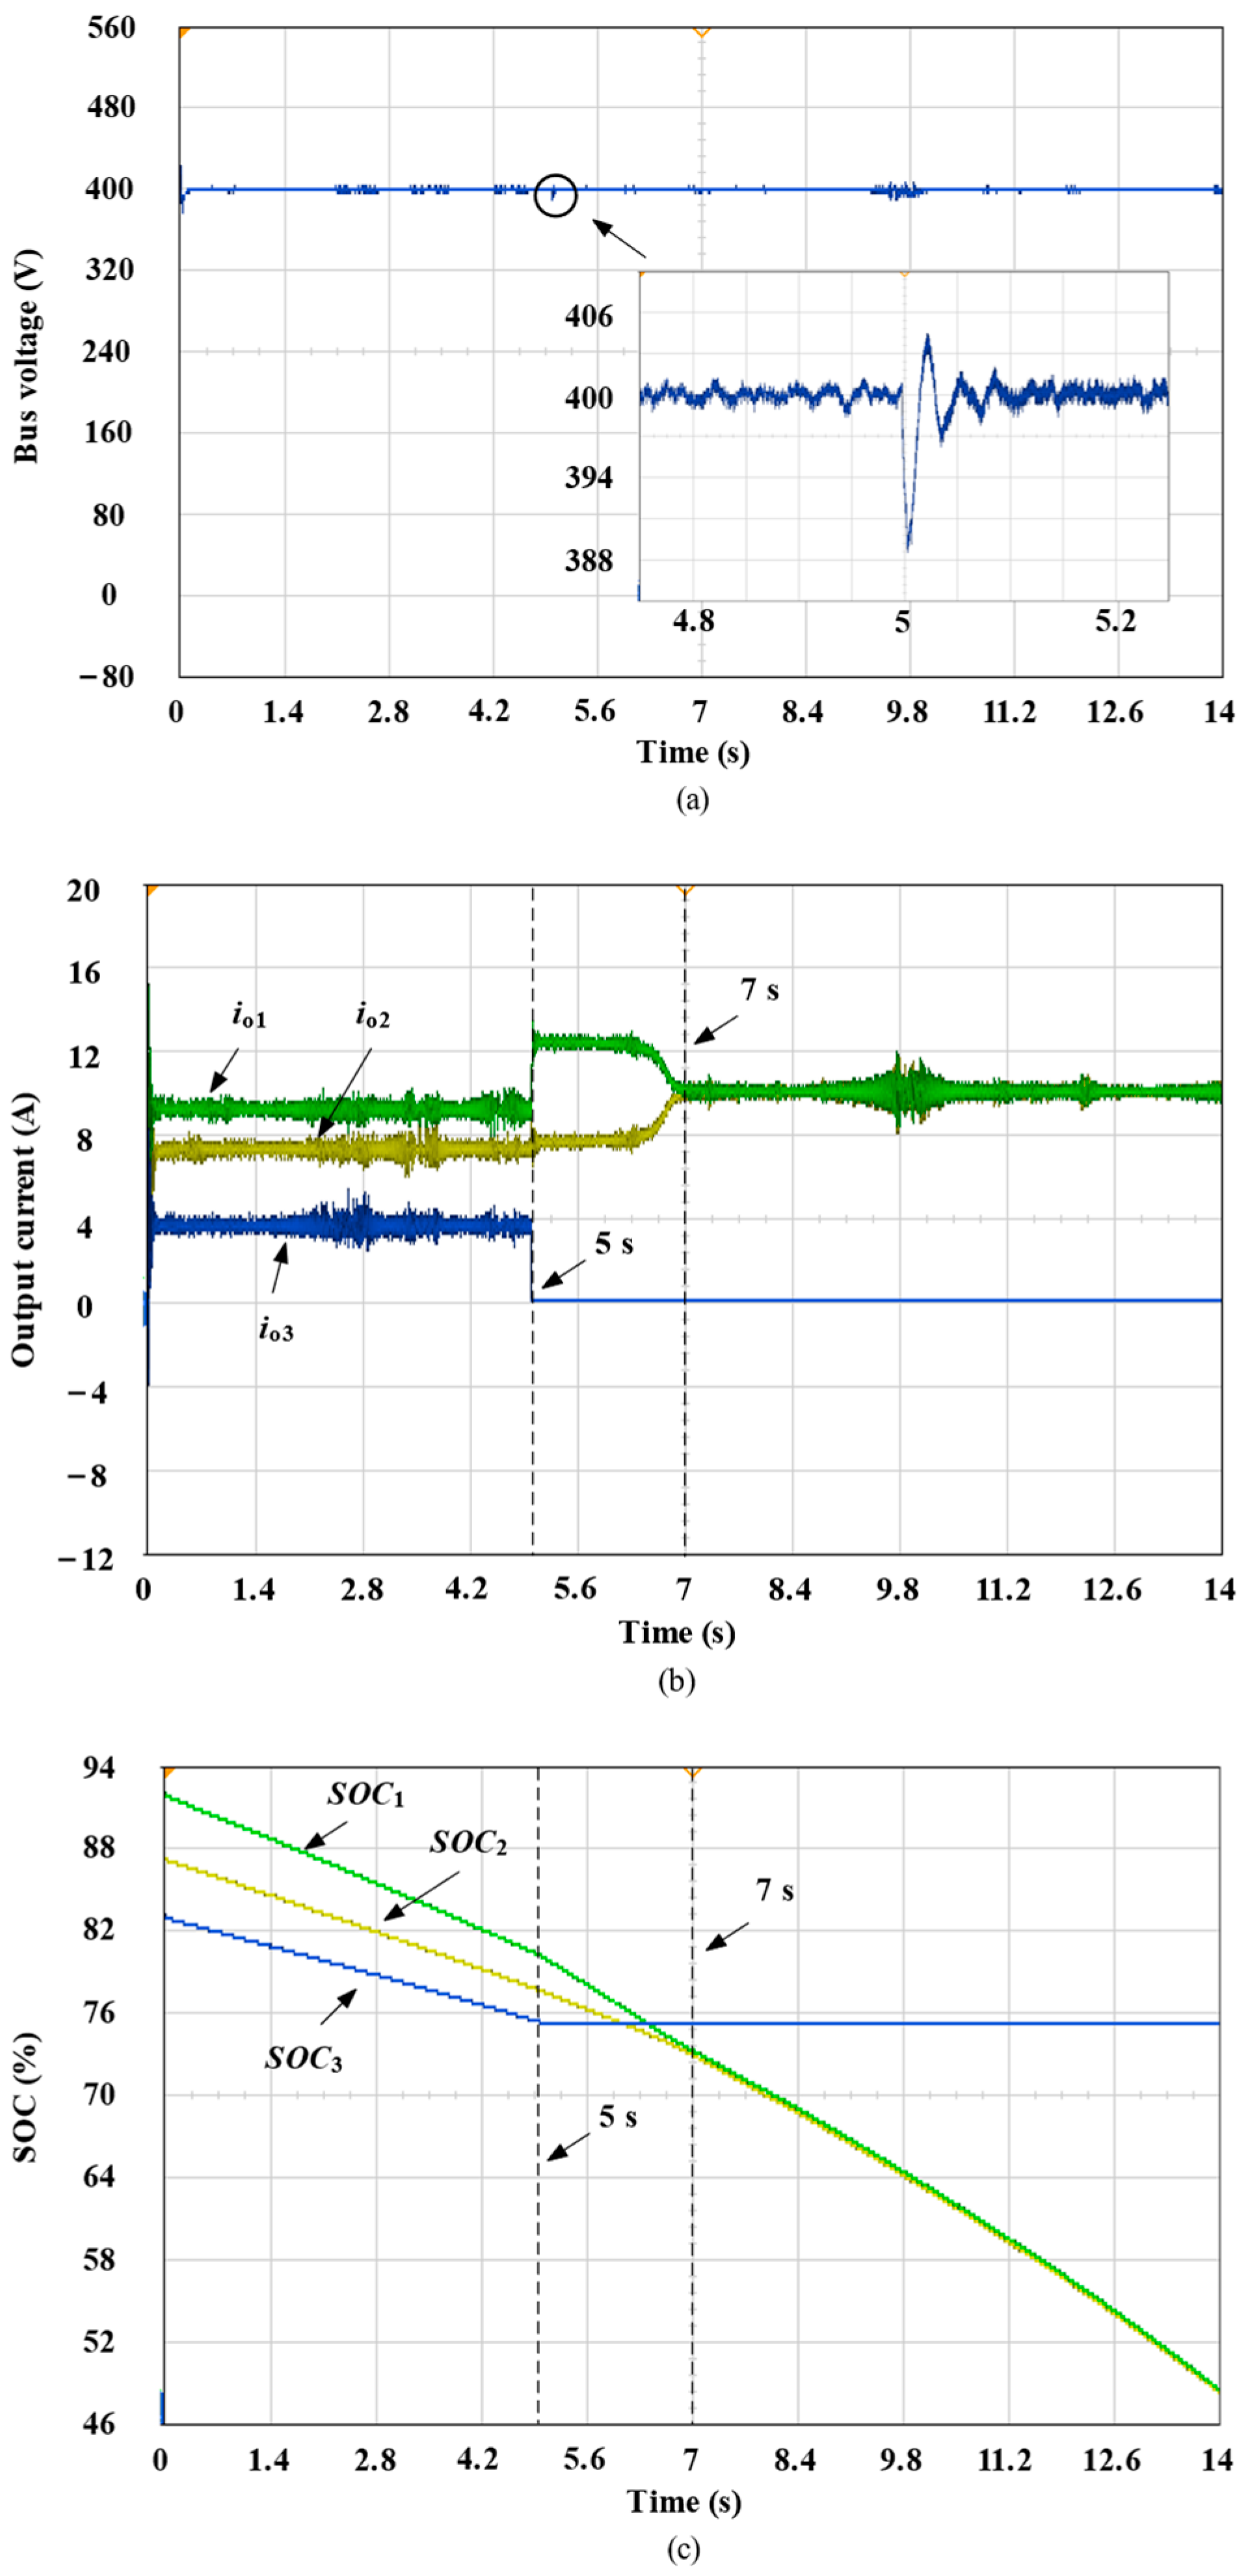
6.4. Experimental Case IV: DESU Exits Randomly
The stability of the control method is verified when ESU fluctuates in Case IV. The system cuts off the third ESU at t = 5 s. In Figure 19, the experiment of random DESU exits is shown.
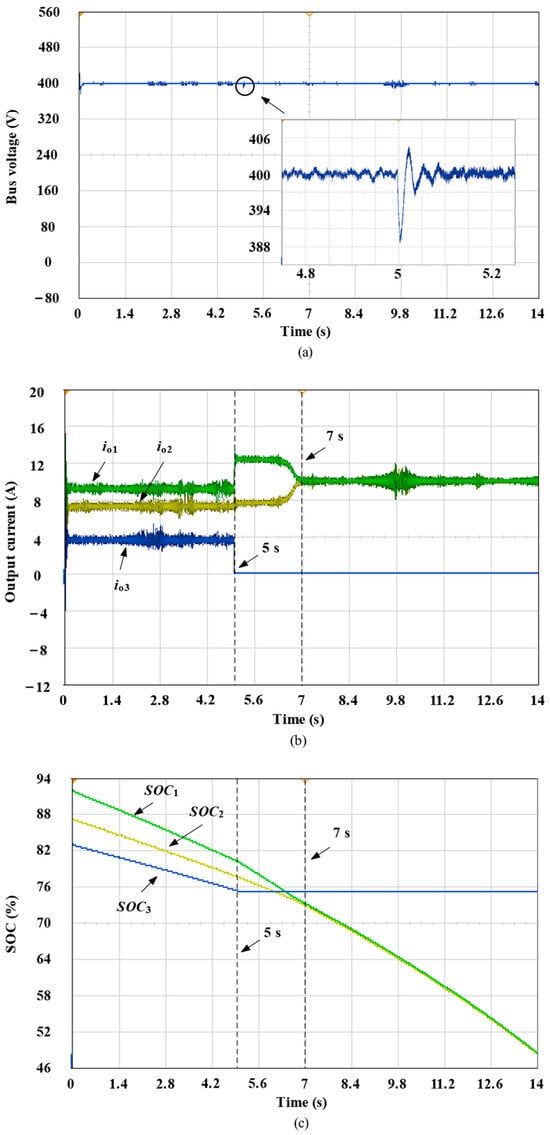
Figure 19.
Experiment of random DESU exits. (a) DC bus voltage. (b) Output current. (c) SOC.
At t = 5 s, the third ESU opens from system interruption, causing a change in communication topology. In Figure 19a, although the DC voltage briefly drops by 8 V when ESU decreases, it is still within acceptable limits, and the voltage returns to the reference value of 400 V in just 0.02 s. From Figure 19b, after adopting the proposed strategy, when the third ESU is disconnected, io3 becomes 0, and the other ESUs increase accordingly. At t = 5 s, the output currents io1 and io2 are both 10 A, which meets the requirements of capacity allocation. Figure 19c shows that due to io3 = 0, the SOC of the third ESU remains unchanged, while the SOC difference between ESU1 and ESU2 gradually decreases until SOC1 and SOC2 reach equilibrium at t = 7 s.
7. Conclusions
To eliminate the effect of line impedance, it is ensured that each ESU can achieve SOC equilibrium while ensuring reasonable current distribution. In this paper, a distributed energy storage system control strategy considering time-varying line impedance is proposed. After theoretical and simulation analyses, it can be concluded that:
- (1)
- The ripple signal on the PWM carrier frequency of the controller can be overlaid onto the output current of the converter. This frequency can be unaffected and can stably transmit information about the line impedance. By analyzing the ripple signal, the impedance value of the circuit can be obtained.
- (2)
- The speed of SOC equalization is improved by using the advantage of the arctan function and a designed acceleration factor.
- (3)
- By analyzing the acceleration factor, the SOC can maintain the equalization quickly when the acceleration factor c is 5 ~ 25.
We will further investigate the effectiveness of the proposed control strategy in large-scale microgrids in the future while considering the impact of the aging of the battery pack on the convergence accuracy and system stability.
Author Contributions
Conceptualization, Z.L. and L.Y.; methodology, Y.F. and L.Y.; data curation, Y.F. and Z.L.; investigation, Z.L. and D.L.; software, Y.F. and X.H.; formal analysis, Z.L., J.L. and L.Y.; validation, X.H.; supervision, L.Y.; project administration, Y.F.; funding acquisition, Y.F. and L.Y.; writing—original draft preparation, Y.F., Z.L., X.H. and D.L.; writing—review and editing, W.C., L.L. and L.Y. All authors have read and agreed to the published version of the manuscript.
Funding
This work is supported by the Science and Technology Project of State Grid Fujian Electric Power Co., Ltd. (Research and Demonstration Application of Autonomous Collaborative Control and Energy Saving and Noise Reduction Methods for Shared Energy Storage System in Distribution Area, No. 521304230007).
Data Availability Statement
Data are contained within the article.
Conflicts of Interest
The authors declare no conflicts of interest.
References
- Ban, C.; Huang, S.; Xiong, L.; Zhou, Y.; Wang, Q.; Song, R.; Wang, L.; Li, F. Distributed model predictive control based on bus voltage derivative and SoC dynamic model for shipboard DC microgrids. Electronics 2024, 13, 2880. [Google Scholar] [CrossRef]
- Yang, Z.; Wang, C.; Han, J.; Yang, F.; Shen, Y.; Min, H.; Hu, W.; Song, H. Analysis of voltage control strategies for DC microgrid with multiple types of energy storage systems. Electronics 2023, 12, 1661. [Google Scholar] [CrossRef]
- Magaldi, G.L.; Serra, F.M.; de Angelo, C.H.; Montoya, O.D.; Giral-Ramírez, D.A. Voltage regulation of an isolated DC microgrid with a constant power load: A passivity-based control design. Electronics 2021, 10, 2085. [Google Scholar] [CrossRef]
- Lv, J.; Wang, X.; Wang, G.; Song, Y. Research on control strategy of isolated DC microgrid based on SOC of energy storage system. Electronics 2021, 10, 834. [Google Scholar] [CrossRef]
- Ma, F.; Kuang, Y.; Wang, Z.; Huang, G.; Kuang, D.; Zhang, C. Multi-port and -functional power conditioner and its control strategy with renewable energy access for a railway traction system. Energies 2021, 14, 6146. [Google Scholar] [CrossRef]
- Chen, J.; Zhao, Y.; Lin, H.; Wei, Y.; Liu, W.; Guo, Q. Analysis and control of cascaded energy storage system for energy efficiency and power quality improvement in electrified railways. IEEE Trans. Transp. Electrif. 2024, 10, 1299–1313. [Google Scholar] [CrossRef]
- El-Shahat, A.; Sumaiya, S. DC-microgrid system design, control, and analysis. Electronics 2019, 8, 124. [Google Scholar] [CrossRef]
- Lu, X.; Sun, K.; Guerrero, J.M.; Vasquez, J.C.; Huang, L. State-of-charge balance using adaptive droop control for distributed energy storage systems in DC microgrid applications. IEEE Trans. Ind. Electron. 2014, 61, 2804–2814. [Google Scholar] [CrossRef]
- Lu, X.; Sun, K.; Guerrero, J.M.; Vasquez, J.C.; Huang, L. Double-quadrant state-of-charge-based droop control method for distributed energy storage systems in autonomous DC microgrids. IEEE Trans. Smart Grid 2015, 6, 147–157. [Google Scholar] [CrossRef]
- Guan, J.; Vasquez, J.C.; Guerrero, J.M. Coordinated secondary control for balanced discharge rate of energy storage system in islanded AC microgrids. IEEE Trans. Ind. Appl. 2016, 52, 5019–5028. [Google Scholar] [CrossRef]
- Hoang, K.D.; Lee, H.H. Accurate power sharing with balanced battery state of charge in distributed DC microgrid. IEEE Trans. Ind. Electron. 2019, 66, 1883–1893. [Google Scholar] [CrossRef]
- Tian, Y.; Peng, F.; Zhu, X.; Wang, Y. Frequency dividing coordinated control strategy for hybrid energy storage system of DC micro-grid. High Volt. Eng. 2020, 46, 2316–2328. [Google Scholar]
- Morstyn, T.; Savkin, A.; Hredzak, B.; Agelidis, V.G. Multi-agent sliding mode control for state of charge balancing between battery energy storage systems distributed in a DC microgrid. IEEE Trans. Smart Grid 2018, 9, 4735–4743. [Google Scholar] [CrossRef]
- Zhang, Q.; Zeng, Y.; Liu, Y. Consensus-based state of charge dynamic equilibrium strategy in isolated DC microgrid with bus voltage regulation. Sustain. Energy Technol. 2022, 54, 102830. [Google Scholar] [CrossRef]
- Khorsandi, A.; Ashourloo, M.; Mokhtari, H. A decentralized control method for a low-voltage DC microgrid. IEEE Trans. Energy Conver. 2014, 29, 793–801. [Google Scholar] [CrossRef]
- Liu, C.; Zhao, J.; Wang, S.; Qu, K.; Li, F. A line impedance identification based on single pulse injection in DC microgrid. Trans. China Electrotech. Soc. 2018, 33, 2584–2591. [Google Scholar]
- Xing, L.; Mishra, Y.; Guo, F.; Lin, P.; Yang, Y.; Ledwich, G.; Tian, Y. Distributed secondary control for current sharing and voltage restoration in DC microgrid. IEEE Trans. Smart Grid 2020, 11, 2487–2497. [Google Scholar] [CrossRef]
- Han, Y.; Ning, X.; Li, L.; Yang, P.; Blaabjerg, F. Droop coefficient correction control for power sharing and voltage restoration in hierarchical controlled DC microgrids. Int. J. Electr. Power Energy Syst. 2021, 133, 107277. [Google Scholar] [CrossRef]
- Mohammed, N.; Callegaro, L.; Ciobotaru, M.; Guerrero, J.M. Accurate power sharing for islanded DC microgrids considering mismatched feeder resistances. Appl. Energy 2023, 340, 121060. [Google Scholar] [CrossRef]
- Bin Shaheed, M.N.; Sozer, Y. Adaptive line impedance estimation algorithm for DC microgrid systems. In Proceedings of the IEEE Applied Power Electronics Conference and Exposition (APEC), Phoenix, AZ, USA, 14–17 June 2021; pp. 62–67. [Google Scholar]
- Liu, C.; Zhao, J.; Wang, S.; Lu, W.; Qu, K. Active identification method for line resistance in DC microgrid based on single pulse injection. IEEE Trans. Power Electron. 2018, 33, 5561–5564. [Google Scholar] [CrossRef]
- Chowdhury, S.; Shaheed, M.N.B.; Sozer, Y. State-of-charge balancing control for modular battery system with output DC bus regulation. IEEE Trans. Transp. Electrif. 2021, 7, 2181–2193. [Google Scholar] [CrossRef]
- Gu, Y.; Xiang, X.; Li, W.; He, X. Mode-adaptive decentralized control for renewable DC microgrid with enhanced reliability and flexibility. IEEE Trans. Power Electron. 2014, 29, 5072–5080. [Google Scholar] [CrossRef]
- Yang, L.; Luo, D.; Liu, Y.; Chen, S.; Wen, X.; Lai, L. A novel energy control strategy for distributed energy storage system based on virtual current. Int. J. Electr. Power Energy Syst. 2024, 158, 109979. [Google Scholar] [CrossRef]
- Zhang, Q.; Zeng, Y.; Liu, Y.; Zhuang, X.; Zhang, H.; Hu, W. An improved distributed cooperative control strategy for multiple energy storages parallel in islanded DC microgrid. IEEE J. Emerg. Sel. Topics Power Electron. 2022, 10, 455–468. [Google Scholar] [CrossRef]


Disclaimer/Publisher’s Note: The statements, opinions and data contained in all publications are solely those of the individual author(s) and contributor(s) and not of MDPI and/or the editor(s). MDPI and/or the editor(s) disclaim responsibility for any injury to people or property resulting from any ideas, methods, instructions or products referred to in the content. |
© 2024 by the authors. Licensee MDPI, Basel, Switzerland. This article is an open access article distributed under the terms and conditions of the Creative Commons Attribution (CC BY) license (https://creativecommons.org/licenses/by/4.0/).