Article

Research on a Passenger Flow Prediction Model Based on BWO-TCLS-Self-Attention

1
School of Computer Science and Engineering, Xi’an University of Technology, Xi’an 710048, China
2
Shaanxi Provincial Key Laboratory of Network Computing and Security Technology, Xi’an 710048, China
*
Author to whom correspondence should be addressed.
These authors contributed equally to this work.
Electronics 2024, 13(23), 4849; https://doi.org/10.3390/electronics13234849
Submission received: 20 September 2024 / Revised: 26 November 2024 / Accepted: 4 December 2024 / Published: 9 December 2024

Abstract

:
In recent years, with the rapid development of the global demand and scale for deep underground space utilization, deep space has gradually transitioned from single-purpose uses such as underground transportation, civil defense, and commerce to a comprehensive, livable, and disaster-resistant underground ecosystem. This shift has brought increasing attention to the safety of personnel flow in deep spaces. In addressing challenges in deep space passenger flow prediction, such as irregular flow patterns, surges in extreme conditions, large data dimensions, and redundant features complicating the model, this paper proposes a deep space passenger flow prediction model that integrates a Temporal Convolutional Network (TCN) and Long Short-Term Memory (LSTM) network. The model first employs a dual-layer LSTM network structure with a Dropout layer to capture complex temporal dynamics while preventing overfitting. Then, a Self-Attention mechanism and TCN network are introduced to reduce redundant feature data and enhance the model’s performance and speed. Finally, the Beluga Whale Optimization (BWO) algorithm is used to optimize hyperparameters, further improving the prediction accuracy of the network. Experimental results demonstrate that the BWO-TCLS-Self-Attention model proposed in this paper achieves an R2 value of 96.94%, with MAE and RMSE values of 118.464 and 218.118, respectively. Compared with some mainstream prediction models, the R2 value has increased, while both MAE and RMSE values have decreased, indicating its ability to accurately predict passenger flow in deep underground spaces.

1. Introduction

With the advancement of urbanization, surface space resources in cities are becoming increasingly scarce, and the development of underground spaces has become a trend to alleviate urban congestion and expand space utilization. The development of deep underground spaces can effectively transfer some urban functions underground, such as transportation, storage, commerce, and research. Accurately predicting passenger flow in deep underground spaces can help in the rational planning of facilities such as elevators, entrances, and passageways, ensuring that they can handle sufficient traffic during peak periods. Moreover, accurate predictions can guide operators in dynamically adjusting service facilities based on passenger flow, optimizing workforce allocation, and improving operational efficiency while reducing costs. Additionally, reasonable passenger flow predictions can minimize overcrowding, effectively reduce safety risks, and enhance the smooth flow of people within deep spaces, providing users with a more comfortable and efficient experience.
Due to the rapid advancements in big data technology and machine learning methods, passenger flow prediction techniques have undergone significant transformation. Initially, we relied primarily on graphical observations and intuitive descriptions to grasp basic passenger flow patterns using non-parametric methods for preliminary analysis of flow sequences and characteristics. Today, big data and machine learning offer more powerful and flexible tools for passenger flow prediction. Models based on artificial intelligence technologies such as neural networks and deep learning can automatically learn and identify complex patterns in the data, enabling precise passenger flow predictions.
Passenger flow in deep underground spaces is characterized by frequent large-scale gatherings and dispersals, presenting two key challenges when studying its prediction. The first challenge is the volatility and unpredictability of the flow. Passenger flow in deep underground spaces fluctuates constantly, making it difficult to accurately capture the flow patterns. To better depict overall trends, the prediction model must have strong real-time responsiveness and high adaptability. It is crucial to incorporate real-world application scenarios, precisely quantify passenger flow characteristics, and ensure the model’s real-time performance and operational practicality to guarantee the accuracy and usefulness of the predictions. To address this, we have improved the LSTM network by designing a dual-layer LSTM structure and incorporating a Dropout layer to fully capture the complex periodicity and temporal continuity of passenger flow distribution along the time axis.
The second challenge is the multidimensionality of data and feature redundancy. There is a significant correlation between changes in passenger flow and external factors such as weather variations and major events. When the model integrates these external feature data, it faces the problem of large data dimensions and redundant features, which not only increases the complexity of the model but also impacts its training performance and prediction accuracy. Therefore, the model selection must consider how to effectively extract and learn from these multi-dimensional inputs to capture the key features accurately, thereby improving prediction precision. To address this issue, we introduce the Temporal Convolutional Network (TCN) and a Self-Attention mechanism to the LSTM model, employing a model fusion strategy to construct an LSTM-TCN hybrid model. This allows for the comprehensive extraction and deep learning of critical feature dimensions in passenger flow data. Finally, we use the Beluga Whale Optimization (BWO) algorithm to optimize hyperparameters, further enhancing the prediction accuracy.
In summary, we have made the following contributions:
  • Propose a two-layer LSTM network structure and add a Dropout layer to fully extract complex time series features and enhance the generalization ability.
  • Introduce a Self-Attention mechanism module (Self-Attention) and TCN network to construct a LSTM-TCN fusion model to reduce redundant feature data and increase the performance and speed of the model.
  • Introduce the BWO algorithm for model hyper-parameter optimization and propose a BWO-TCLS-Self-Attention prediction network structure.

2. Related Works

As a valuable public resource, deep underground space has been widely developed and utilized by many countries. Through complex in-depth analysis and modeling, the effective migration of certain urban functions underground can not only significantly enhance urban sustainability and safety but also play a critical role in addressing challenges of limited spatial resources [1,2,3].
The Long Short-Term Memory (LSTM) network model excels at handling long-term dependencies in time series data, making it particularly suitable for processing dense, highly correlated short-term passenger flow data. Liu et al. [4] utilized a deep LSTM network to develop an hourly subway passenger flow prediction model, which effectively learns and represents the inherent patterns of time series data. This model is especially adept at dealing with long-term dependencies, providing more accurate predictions during critical periods such as peak hours.
TCN is a neural network model that utilizes causal convolution and dilated convolution. It not only retains the advantages of CNN in feature extraction but also overcomes the shortcomings of traditional CNN in dealing with long-term dependencies [5,6,7]. Therefore, it can provide an efficient and accurate solution for time series prediction tasks. Yao et al. [8] used convolutional neural networks (CNNs) to predict short-term passenger flows during special events, demonstrating the powerful capability of CNNs in capturing local features; Liu et al. [9] improved the accuracy and efficiency of bus passenger flow forecasting by using modular CNNs to automatically identify and extract key features, highlighting the potential of deep learning in transportation system analysis.
The Self-Attention mechanism significantly improves the accuracy of future event prediction due to its ability to accurately capture key moments in a time series [10,11,12]. Wang [13] developed a Self-Attention-based temporal graph network model, which is able to adaptively capture key moments in a time series to accurately predict the future passenger flow, which shows that the Self-Attention mechanism can effectively improve the model’s ability to understand the time series data. This shows that the Self-Attention mechanism can effectively improve the model’s ability to understand time series data.
Model fusion, by combining the advantages of multiple algorithms, can improve prediction accuracy and solve problems that are difficult to overcome with a single model. For example, Du et al. [14] proposed a hybrid model based on a convolutional neural network and a long- and short-term memory network, which significantly improved the accuracy of bus passenger flow prediction; Nagaraj et al. [15] combined the Greedy Layer-wise Algorithm (GLA) with long- and short-term memory network to predict the passenger flow of a bus system, which improved the prediction accuracy; Jiao et al. [16] used an improved STL LSTM model to predict bus passenger flow during an epidemic and demonstrated the adaptability of the model in handling unconventional data changes.
In conclusion, research in passenger flow prediction is rapidly evolving, focusing primarily on the adoption of more advanced technologies and algorithms, handling more complex data, and improving the accuracy and real-time performance of predictions. These developments not only improve the overall performance of passenger flow forecasting but also provide essential experience and technical support for the research and application of smart cities.

3. Methods

Here, we propose a new passenger flow prediction model based on BWO-TCLS-Self-Attention, which consists of multiple modules to achieve a more accurate prediction of passenger flow in deep space by using the fusion results of multimodal passenger flow data mapped to the corresponding category mean transformed passenger flow as the preordered passenger flow input in the passenger flow prediction.

3.1. Optimization Algorithm Selection

Because the model is affected by multiple hyper-parameters, resulting in large differences in prediction results, this paper requires the optimization of the number of iterations (epoch), learning rate, and batch size in order to balance computational efficiency and prediction accuracy.
When selecting optimization algorithms, we considered various optimization strategies based on insect and animal behaviors, such as Particle Swarm Optimization (PSO), Genetic Algorithm (GA), Grey Wolf Optimizer (GWO), and others. These algorithms each have their own advantages when solving optimization problems, but they also have limitations. For instance, PSO tends to get stuck in local optimal solutions when dealing with multimodal problems, while GA may not be suitable for applications requiring high real-time performance due to its slower convergence speed.
Compared to these algorithms, SSA (assuming it refers to a specific and widely used optimization algorithm, though not explicitly defined as such in the context, for illustration purposes, we will maintain the abbreviation) and BWO (Black Widow Optimization) exhibit faster convergence speeds and higher stability in parameter optimization. For example, compared to PSO and GWO, BWO demonstrates quicker convergence in the initial few iterations and maintains a lower fitness value throughout the entire iterative process, indicating its potential effectiveness in finding high-quality hyperparameter combinations for LSTM. Additionally, BWO maintains a low fitness level even after convergence, showcasing stability during the optimization process, which may make it more reliable in finding approximate global optimal solutions.
Therefore, based on these considerations, we chose SSA and BWO algorithms for comparative experiments to optimize the hyperparameters of our LSTM network. The Sparrow Search Algorithm (SSA), proposed in 2020, is a population-based optimization algorithm that mimics the behavior of sparrows in searching for food and evading predators. It employs collaborative and intelligent search strategies for optimization. SSA optimizes the balance between the exploration and exploitation phases, demonstrating strong capabilities for comprehensive searching within the parameter space. In early iterations, SSA tends to explore the solution space more broadly, which is beneficial for avoiding local optima but may result in slower convergence speeds.
Beluga Whale Optimization (BWO) [17] is a novel algorithm proposed in 2022, which searches for the optimal solution by simulating the unique movement pattern of diving and rebounding of beluga whales in their social hunting behavior. The algorithm focuses on the balance between the exploration and exploitation phases, as well as the gradual narrowing of the search range over time to improve the search accuracy, and shows a fast convergence rate.
SSA and BWO are both relatively new algorithms, and their introduction helps to explore and leverage the latest optimization methods to enhance the optimization process of LSTM parameters. Firstly, the BWO optimization algorithm is used to optimize the LSTM parameters. The BWO algorithm is divided into three core phases: exploration, exploitation, and whale fall, which correspond to the swimming, preying, and whale fall behaviors of beluga whales, respectively. In the BWO algorithm, the balance factor and the probability of whale fall are adaptive, playing a crucial role in regulating the exploration and exploitation capabilities of the algorithm. To improve the global convergence efficiency during the exploitation phase, the algorithm cleverly integrates the Levy flight mechanism.
Similar to many meta-heuristic algorithms, the BWO algorithm also includes exploration and exploitation phases. During the exploration phase, the algorithm ensures a comprehensive global search within the design space by randomly selecting beluga whales. In the exploitation phase, it focuses on controlling the local fine search within the design space. Based on behavioral records of beluga whales under human care, beluga whales can engage in social behaviors in different postures. To simulate these behaviors, beluga whales are treated as search agents that can move in the search space by changing their position vectors. Additionally, the probability of whale fall needs to be considered in the BWO algorithm, as it changes the position of the beluga whales. Figure 1 demonstrates the optimization process of LSTM hyperparameters using the BWO algorithm.
In addition, to further compare the convergence and stability of the BWO optimization algorithm, both the SSA and the BWO optimization algorithms were used to optimize LSTM parameters. The changes in the best fitness value of the algorithms with the number of iterations are shown in Figure 2.
As can be seen in Figure 2, BWO demonstrates a faster convergence speed compared to SSA in the initial approximately three iterations and maintains a lower fitness value during the iteration process, indicating that BWO may more effectively search for high-quality LSTM hyperparameter combinations. Furthermore, BWO continues to maintain a low fitness level after convergence, demonstrating stability during the optimization process and potentially enabling it to find approximate global optimal solutions more reliably. In contrast to BWO, although the best fitness value of SSA drops rapidly within about four iterations, its stability is poorer after approaching the optimal solution, with fluctuations in the fitness value occurring between 15 and 20 iterations. Due to the complexity of optimizing deep learning model parameters, considering both algorithm efficiency and parameter optimization accuracy, BWO’s rapid convergence and stability make it a superior choice. Therefore, this section selects the BWO algorithm for hyperparameter optimization of the LSTM network.

3.2. Improved LSTM Network

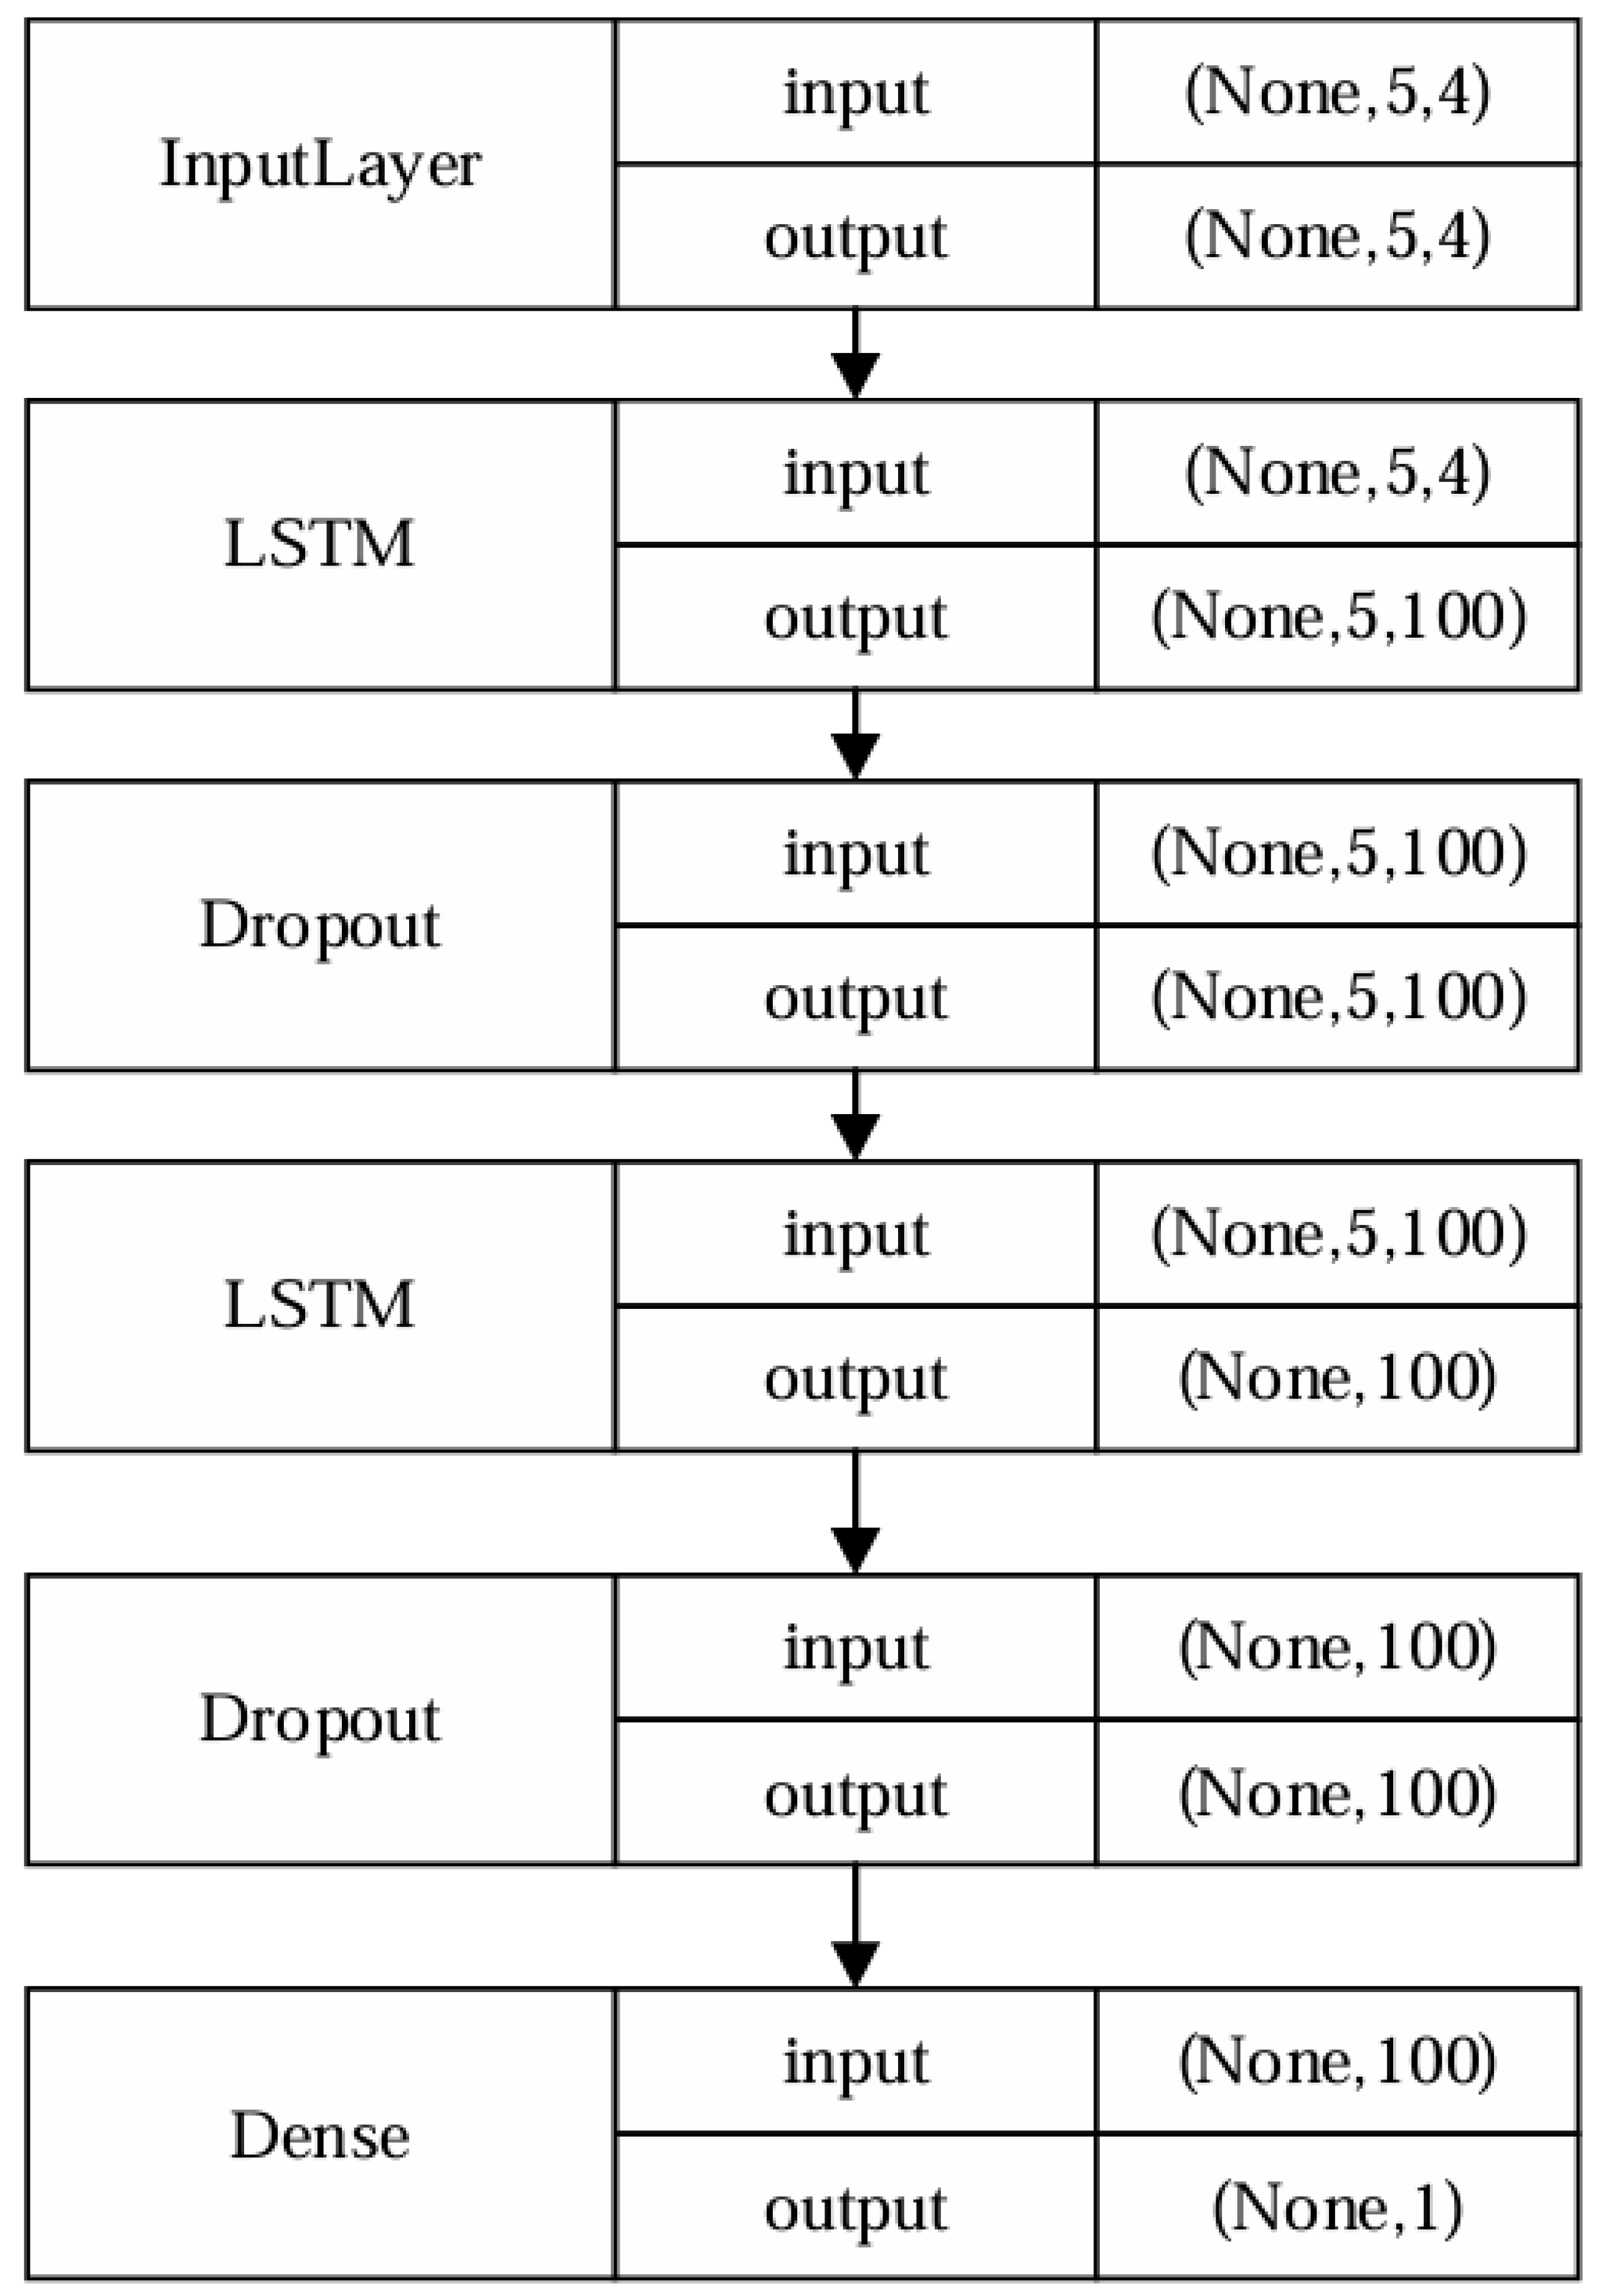
LSTM can predict passenger flow in a single network, but ordinary LSTM network models face the core challenge of how to capture long-term dependence and reduce the risk of overfitting at the same time; the design of this paper adopts a two-layer LSTM structure and at the same time introduces a Dropout layer to effectively mitigate the problem of overfitting of the model and enhances the model’s ability to generalize.
In Figure 3, the channels labeled InputLayer represent the input layer, corresponding to the input of the features. The input layer is designed with a three-dimensional tensor of shape (None, 5, 4) to reflect the model’s adaptability to batch data processing. The length of the time series window chosen for prediction is 5, which enables the model to effectively capture key features of the time series data while maintaining the computational efficiency, avoiding redundancy and noise perturbation of the data due to the introduction of too much historical information. The number of feature dimensions considered at each time step is 4, indicating the different data dimensions considered, such as day type (weekday or non-workday), major events, and weather factors, which ensures the diversity and contextual relevance of the model predictions.
The model includes two LSTM layers designed to capture complex temporal dependencies in the data more efficiently, and this two-layer LSTM structure enhances the model’s ability to capture long-time dependencies. In addition, the LSTM layer is followed by a Dropout layer, which not only prevents the model from relying too much on specific sample features in the training data and reduces the risk of overfitting by randomly discarding some neurons’ activation outputs during the training process but also helps to improve the model’s generalization ability by this regularization technique.
The last layer is the fully connected layer (Dense), which transforms the time series features of the LSTM layer into the final prediction output, forming a direct mapping from time series features to prediction results. Through the linear transformation of this layer, the model is able to synthesize the learned complex time dynamics into a specific prediction value, thus completing the whole conversion process from input data to predicted passenger flow.
The structure of the improved two-layer LSTM captures the complex time series dynamics while retaining the sensitivity to different contextual information, enhances the accuracy of the prediction, and shows good generalization ability by avoiding the overfitting phenomenon through an effective regularization technique.

3.3. BWO-TCLS-Self-Attention Network

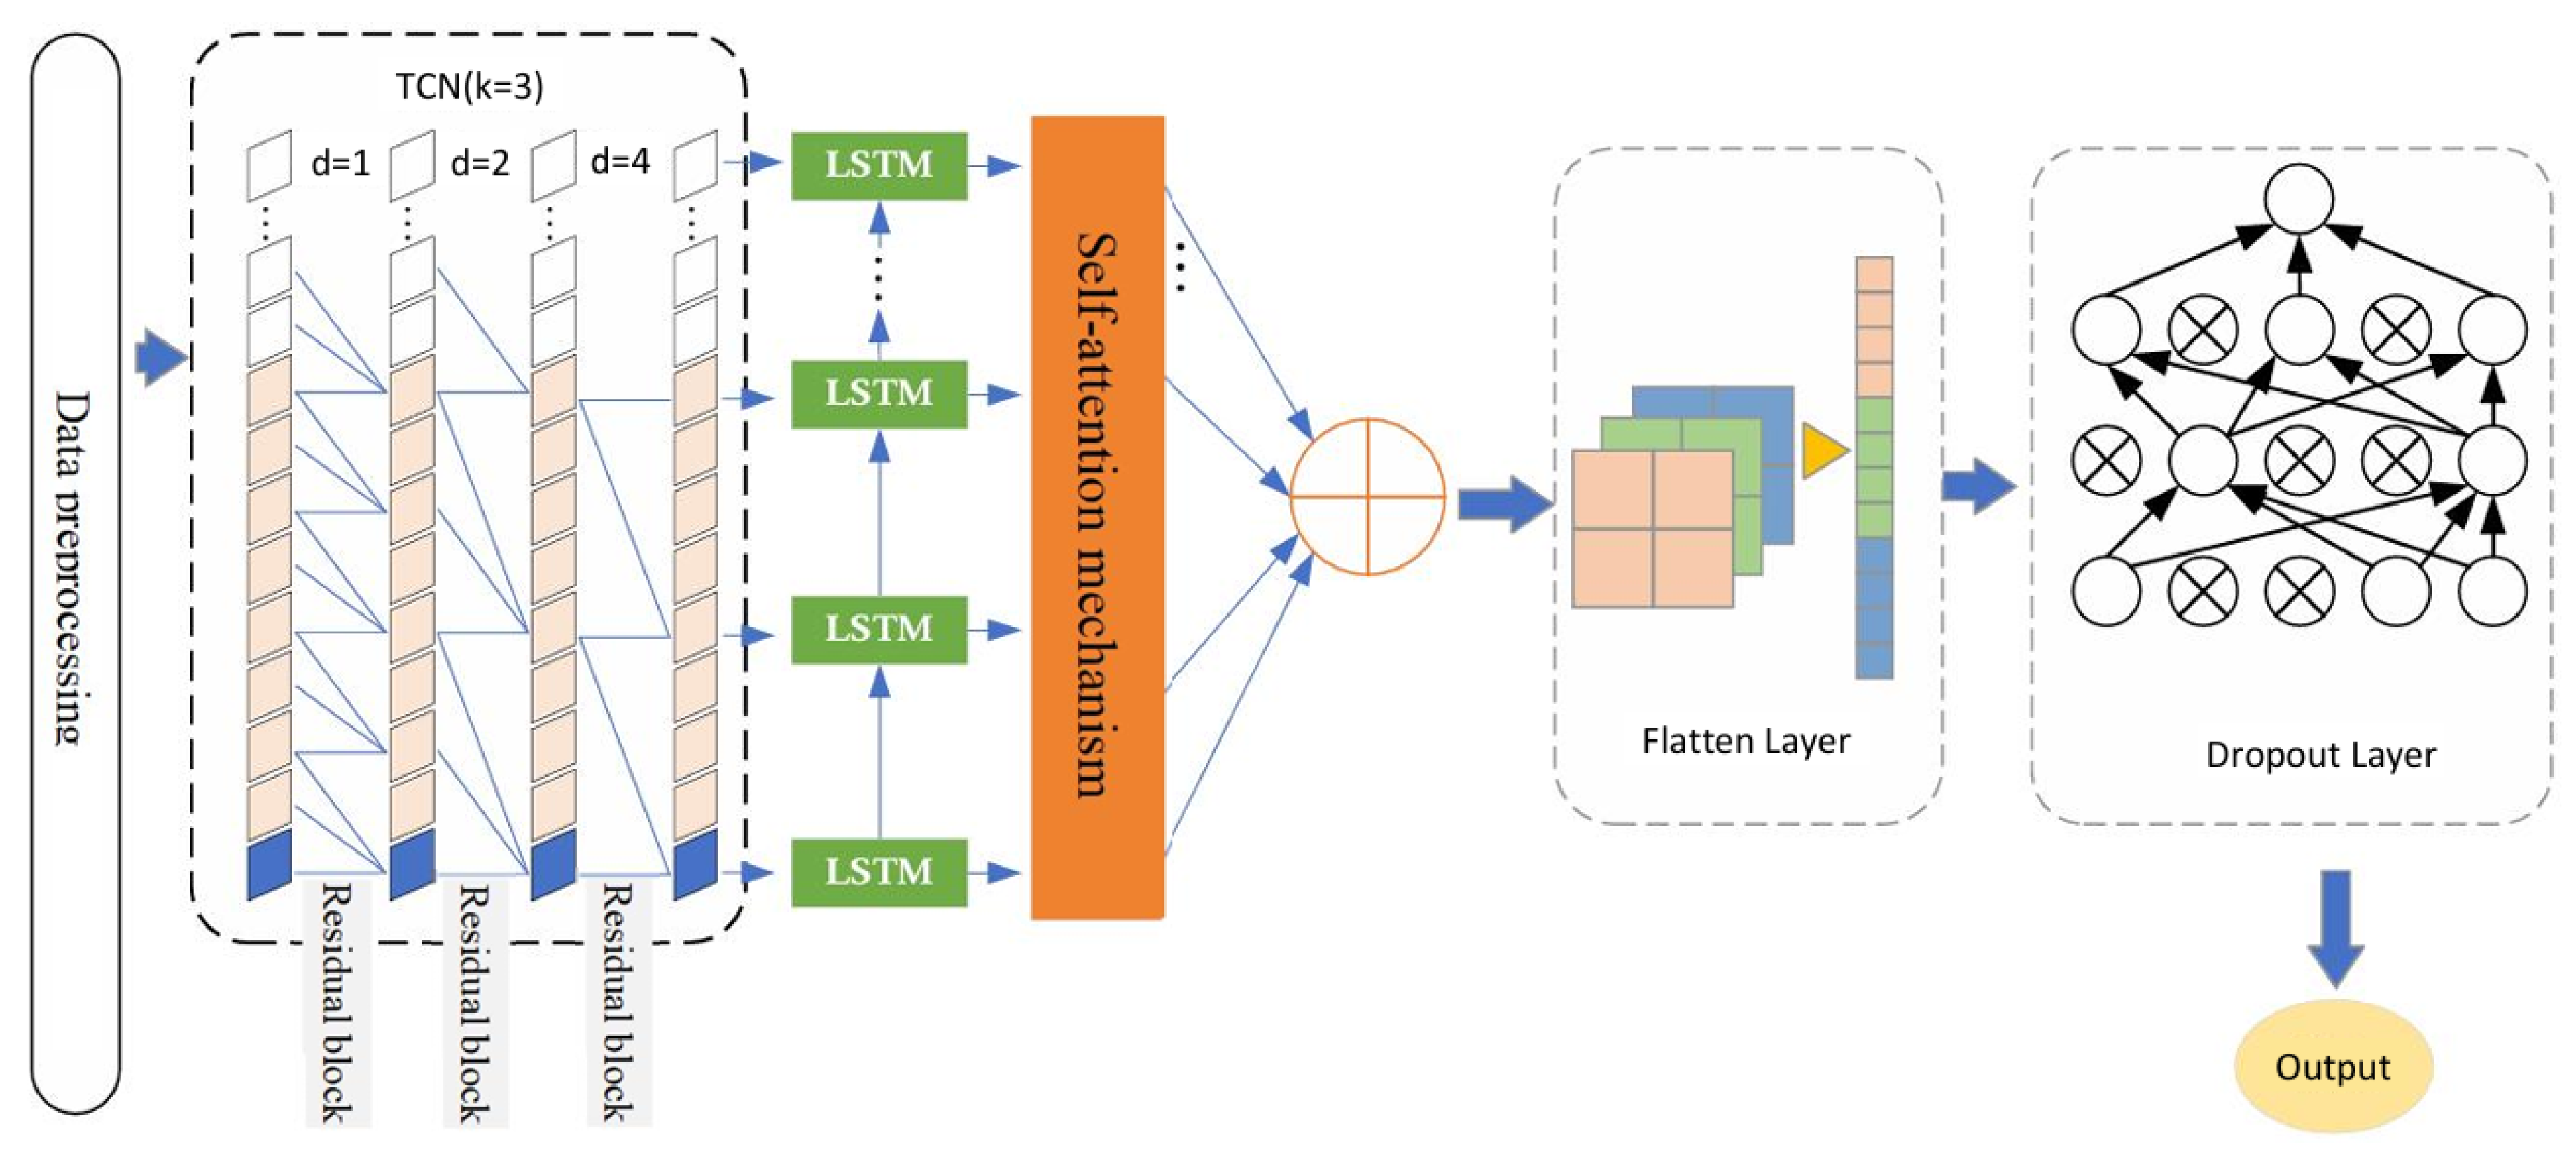
In order to accurately predict the passenger flow in deep space, two improved strategies, the TCN network and the Self Attention, are fused in the improved LSTM network so as to improve the model accuracy, and in order to further optimize the fusion network model, the BWO optimization algorithm is added for passenger flow prediction task in deep space. The TCN-LSTM-Self-Attention hierarchical structure of the fusion network proposed in this paper is shown in Figure 4.
First, the data undergo a series of preprocessing steps, including normalization, to ensure the consistency of the scales of the input features. The processed data are then passed through the TCN (Temporal Convolutional Network) part. The TCN network is constructed by stacking three residual blocks with different dilation rates, each containing two convolutional layers with the same dilation rate. The dilation rates of the residual blocks are 1, 2, and 4, respectively. The increasing setting of the dilation rate in the TCN network allows the network to increase the receptive field while keeping the computational complexity relatively constant. This ensures that each layer can capture information at different scales without missing some information due to too large jumps. Moreover, the exponential growth of the dilation rate, compared to linear growth, achieves more efficient information coverage, rapidly expanding the network’s temporal range coverage without excessively increasing the number of network layers.
Subsequently, the features processed by TCN are further passed to the LSTM layer. The LSTM layer leverages its unique gating mechanism to effectively optimize the memory and transmission of long-term dependency information. This mechanism ensures that the model can effectively retain long-term dependencies and significantly reduces the risk of information loss that may occur in the learning of long sequences. Furthermore, the introduction of the Self-Attention mechanism allows the model to establish direct connections between different points in the sequence. This mechanism not only enhances the model’s ability to perceive key time points but also strengthens the accuracy of predictions.
After being processed by the Self-Attention mechanism, the data are passed to the flattening layer for flattening operations. This step aims to convert multi-dimensional time series data into a one-dimensional vector to meet the processing requirements of subsequent fully connected layers. At the same time, to prevent overfitting and enhance the model’s generalization ability, a Dropout layer is introduced. Finally, the fully connected layer integrates all high-level features and outputs the final prediction value.
The entire algorithm model, by combining TCN, LSTM, and Self-Attention mechanisms, not only captures the complex characteristics of time series but also flexibly adjusts according to the importance of different time points in the sequence. While ensuring the model has sufficient complexity, it can also effectively handle long time series and produce accurate prediction results. Additionally, the model also balances computational efficiency with model complexity.

3.4. Evaluation Metrics

In the experimental aspect of this paper, seven models were used for the prediction of passenger flow in deep space, with six models serving as comparative experiments and the other being the BWO-TCLS-Self-Attention model proposed in this paper. There will inevitably be some degree of error in the prediction results, and this error can also be regarded as an evaluation index for measuring the performance of the algorithm. Based on this, a comprehensive performance assessment of the prediction method is carried out to obtain feedback on the accuracy of the prediction effect. The following indicators were selected as the evaluation criteria for this experiment, and the specific formulas for each indicator are as follows.
Mean Absolute Error (MAE): MAE is calculated by averaging the absolute differences between the actual and predicted values. It effectively measures the degree of discrepancy between the model’s predictions and the actual data. As an important evaluation metric, MAE provides a comprehensive reflection of a model’s performance. Its value ranges from [ 0 , + ) , and the smaller the value, the better the model fits the data, indicating higher prediction accuracy. Given that n is the number of samples, y i is the actual value, and y ^ i is the predicted value, the formula for calculating MAE is as follows:
MAE = 1 n i = 1 n | y i y ^ i |
Root Mean Square Error (RMSE): RMSE is an important metric for measuring the deviation between predicted values and actual values.
The RMSE value provides a clear observation of the dispersion between predicted and actual values. When the difference between the predicted and actual values decreases, it indicates an improvement in the model’s prediction accuracy; conversely, if the difference increases, the accuracy decreases. Given that n is the number of samples, y i is the actual value, and y ^ i is as the predicted value, the RMSE calculation formula is as follows:
RMSE = 1 n i = 1 n ( y i y ^ i ) 2
Coefficient of Determination R 2 :  R 2 measures the proportion of the variance in the observed data that is explained by the model, and it is commonly used to assess how well the model fits the target variable. The value of R 2 typically ranges from 0 to 1. The closer the value is to 1, the better the model’s fit to the data; conversely, a value closer to 0 indicates a relatively poor fit. Given y i as the actual values, f ^ i as the predicted values, and y ^ i as the mean of the actual values, the formula for R 2 is as follows:
R 2 = 1 i = 1 n ( y i y ^ i ) 2 i = 1 n ( y i y ¯ ) 2

4. Results

In this section, we will expound the real prediction effect of the BWO-TCLS-Self-Attention prediction model on the dataset, including the introduction of the original data, the selection of experimental evaluation indicators, the analysis of experimental results, and the comparison of different models in deep passenger flow prediction to highlight the superiority of the model proposed in this paper in deep space passenger flow prediction.

4.1. Data Set Establishment and Preprocessing

4.1.1. Data Set Establishment

In the prediction phase of this paper, the experimental data used include the original passenger flow data and historical weather data from a certain deep underground space area. The original data volume contains approximately 360 million records, covering detailed travel data such as user information, entry and exit locations, and entry and exit times. Major events such as natural disasters are also marked in the dataset. During the preprocessing stage, various abnormal travel data were excluded, including data with duplicate entry and exit locations, empty code fields, or special tickets belonging to construction and maintenance. After a rigorous selection process, a total of 4.529 million valid data records were obtained for subsequent experiments, covering a date range of 31 days, with a time range from 2:00 to 2:00 the next day and passenger flow ranging from 0 to 6000 people. These data were used to verify the passenger flow prediction model. As shown in Figure 5, it can be seen that the passenger flow in this area is relatively large and also shows a strong nonlinear fluctuation at different times of the day. There have been sudden passenger flows under the influence of major events; thus, predicting the passenger flow in such areas has significant practical importance.
In this paper, the non-numerical data of weather conditions, operating hours, and events are selected, and their characteristics are converted into numerical values by using the assignment method so that they can be better applied to the training and analysis of the model. The numerical correspondence is shown in Table 1.

4.1.2. Data Normalization

The primary purpose of data normalization is to ensure that the feature dimensions of the sample data have the same measurement scale. For passenger flow data, in order to eliminate the interference caused by different dimensions in the data, we performed normalization on the preprocessed passenger flow data. Let x ˙ represent the normalized passenger flow value and x the original passenger flow value. Additionally, x max and x min represent the maximum and minimum values in the passenger flow data, respectively. After normalization, all variables have similar weights during model training, which enhances the stability and performance of the learning algorithm and accelerates the speed of gradient descent in finding the optimal solution during model training. The normalization formula can be expressed as follows:
x ˙ = x x max x max x min

4.1.3. Dataset Partitioning

This paper utilizes a passenger flow dataset from a specific region, containing approximately 4,529,000 records with passenger flow ranging from 0 to 6000 people per entry. For the experiment, the first 25 days of passenger flow data are selected as the training set to train the prediction model, while the passenger flow data for the following six days are chosen as the test set to evaluate the model’s prediction performance.
Regarding the passenger flow in underground spaces, this paper primarily elaborates on the passenger flow status and its characteristics from both the temporal and spatial dimensions. At the temporal level, the focus is on the statistical time intervals of passenger flow, which cover various time granularities such as years, months, weeks, days, hours, 30 min, and 15 min. At the spatial level, the primary research is on the targets of passenger flow, such as specific areas. Meanwhile, passenger flow descriptors are specific parameters that reflect passenger flow characteristics from different perspectives, including inbound and outbound passenger flow in a region, and time. In selecting the time granularity, this paper comprehensively considers the practical value of short-term predictions for real-world applications and chooses a 30 min time interval. This time granularity can more accurately capture the dynamic changes in passenger flow while providing a sufficient buffer time for real-time adjustment decisions in practical work. Therefore, considering the above factors comprehensively, this paper decides to adopt a 30 min time granularity to predict passenger flow in underground spaces.

4.2. Ablation Experiment

To verify the effectiveness of the BWO-TCLS-Self-Attention integrated model, this paper conducts module ablation experiments on the deep underground space passenger flow dataset using LSTM, LSTM-Self-Attention, TCN-LSTM-Self-Attention, and the proposed BWO-TCLS-Self-Attention network model. The Self-Attention module and TCN network module are sequentially added. Additionally, to validate the optimization effect of the introduced BWO on TCN-LSTM-Self-Attention, the BWO module is embedded into TCN-LSTM-Self-Attention to obtain the BWO-TCLS-Self-Attention model, and comparative experiments are conducted on the dataset used in this paper. Firstly, the evolution of the loss function during the training process of each model is analyzed to assess their learning efficiency and convergence behavior.
In Figure 6a–d, respectively, represent the loss functions of the LSTM, LSTM-Attention, TCN-LSTM-Self-Attention, and BWO-TCLS-Self-Attention models on both the training and test sets.
In Figure 6, the blue curves represent the training loss, while the orange curves represent the validation loss. All charts show a sharp decline in loss from an initial high value, followed by a gradual stabilization and convergence. This trend reflects the ability of each model to gradually optimize and adapt to the data during the learning process.
Specifically, in (a), the LSTM model reaches a relatively stable loss value after about 20 training epochs, indicating its relatively rapid convergence ability and the effectiveness of the model in learning time series data. In (b), the LSTM model with the attention mechanism exhibits a similar downward trend, rapidly decreasing after about 20 training epochs, but with slightly reduced fluctuations in validation loss after about 40 iterations in the later stages of training, suggesting that the attention mechanism may enhance the model’s generalization ability. (c) and (d) compare the loss curves of the TCN-LSTM-Attention model with and without the optimization algorithm. In (c), the TCN-LSTM-Attention model, which combines the long-term dependency capturing ability of TCN with the short-term dynamic processing advantage of LSTM, reaches a lower stable value within the first 10 iterations during training and exhibits a smoother loss curve after 10 iterations, demonstrating the model’s excellent performance in capturing time series. In (d), the model with the BWO algorithm has a validation loss value approximately 0.001 lower than that in (c), showing a smoother and more stable curve and presenting the best loss-decreasing trend, highlighting the significant advantage of this model in fine-tuning model parameters to adapt to complex time series characteristics.
Among all models, the small gap between the training loss and validation loss curves indicates insignificant overfitting, demonstrating good generalization. As seen in (d), after 100 iterations, the loss value gradually stabilizes, leading to the termination of model training. Finally, the minimum loss value obtained on the training set is 0.001326, and the minimum loss value on the validation set is 0.001483.
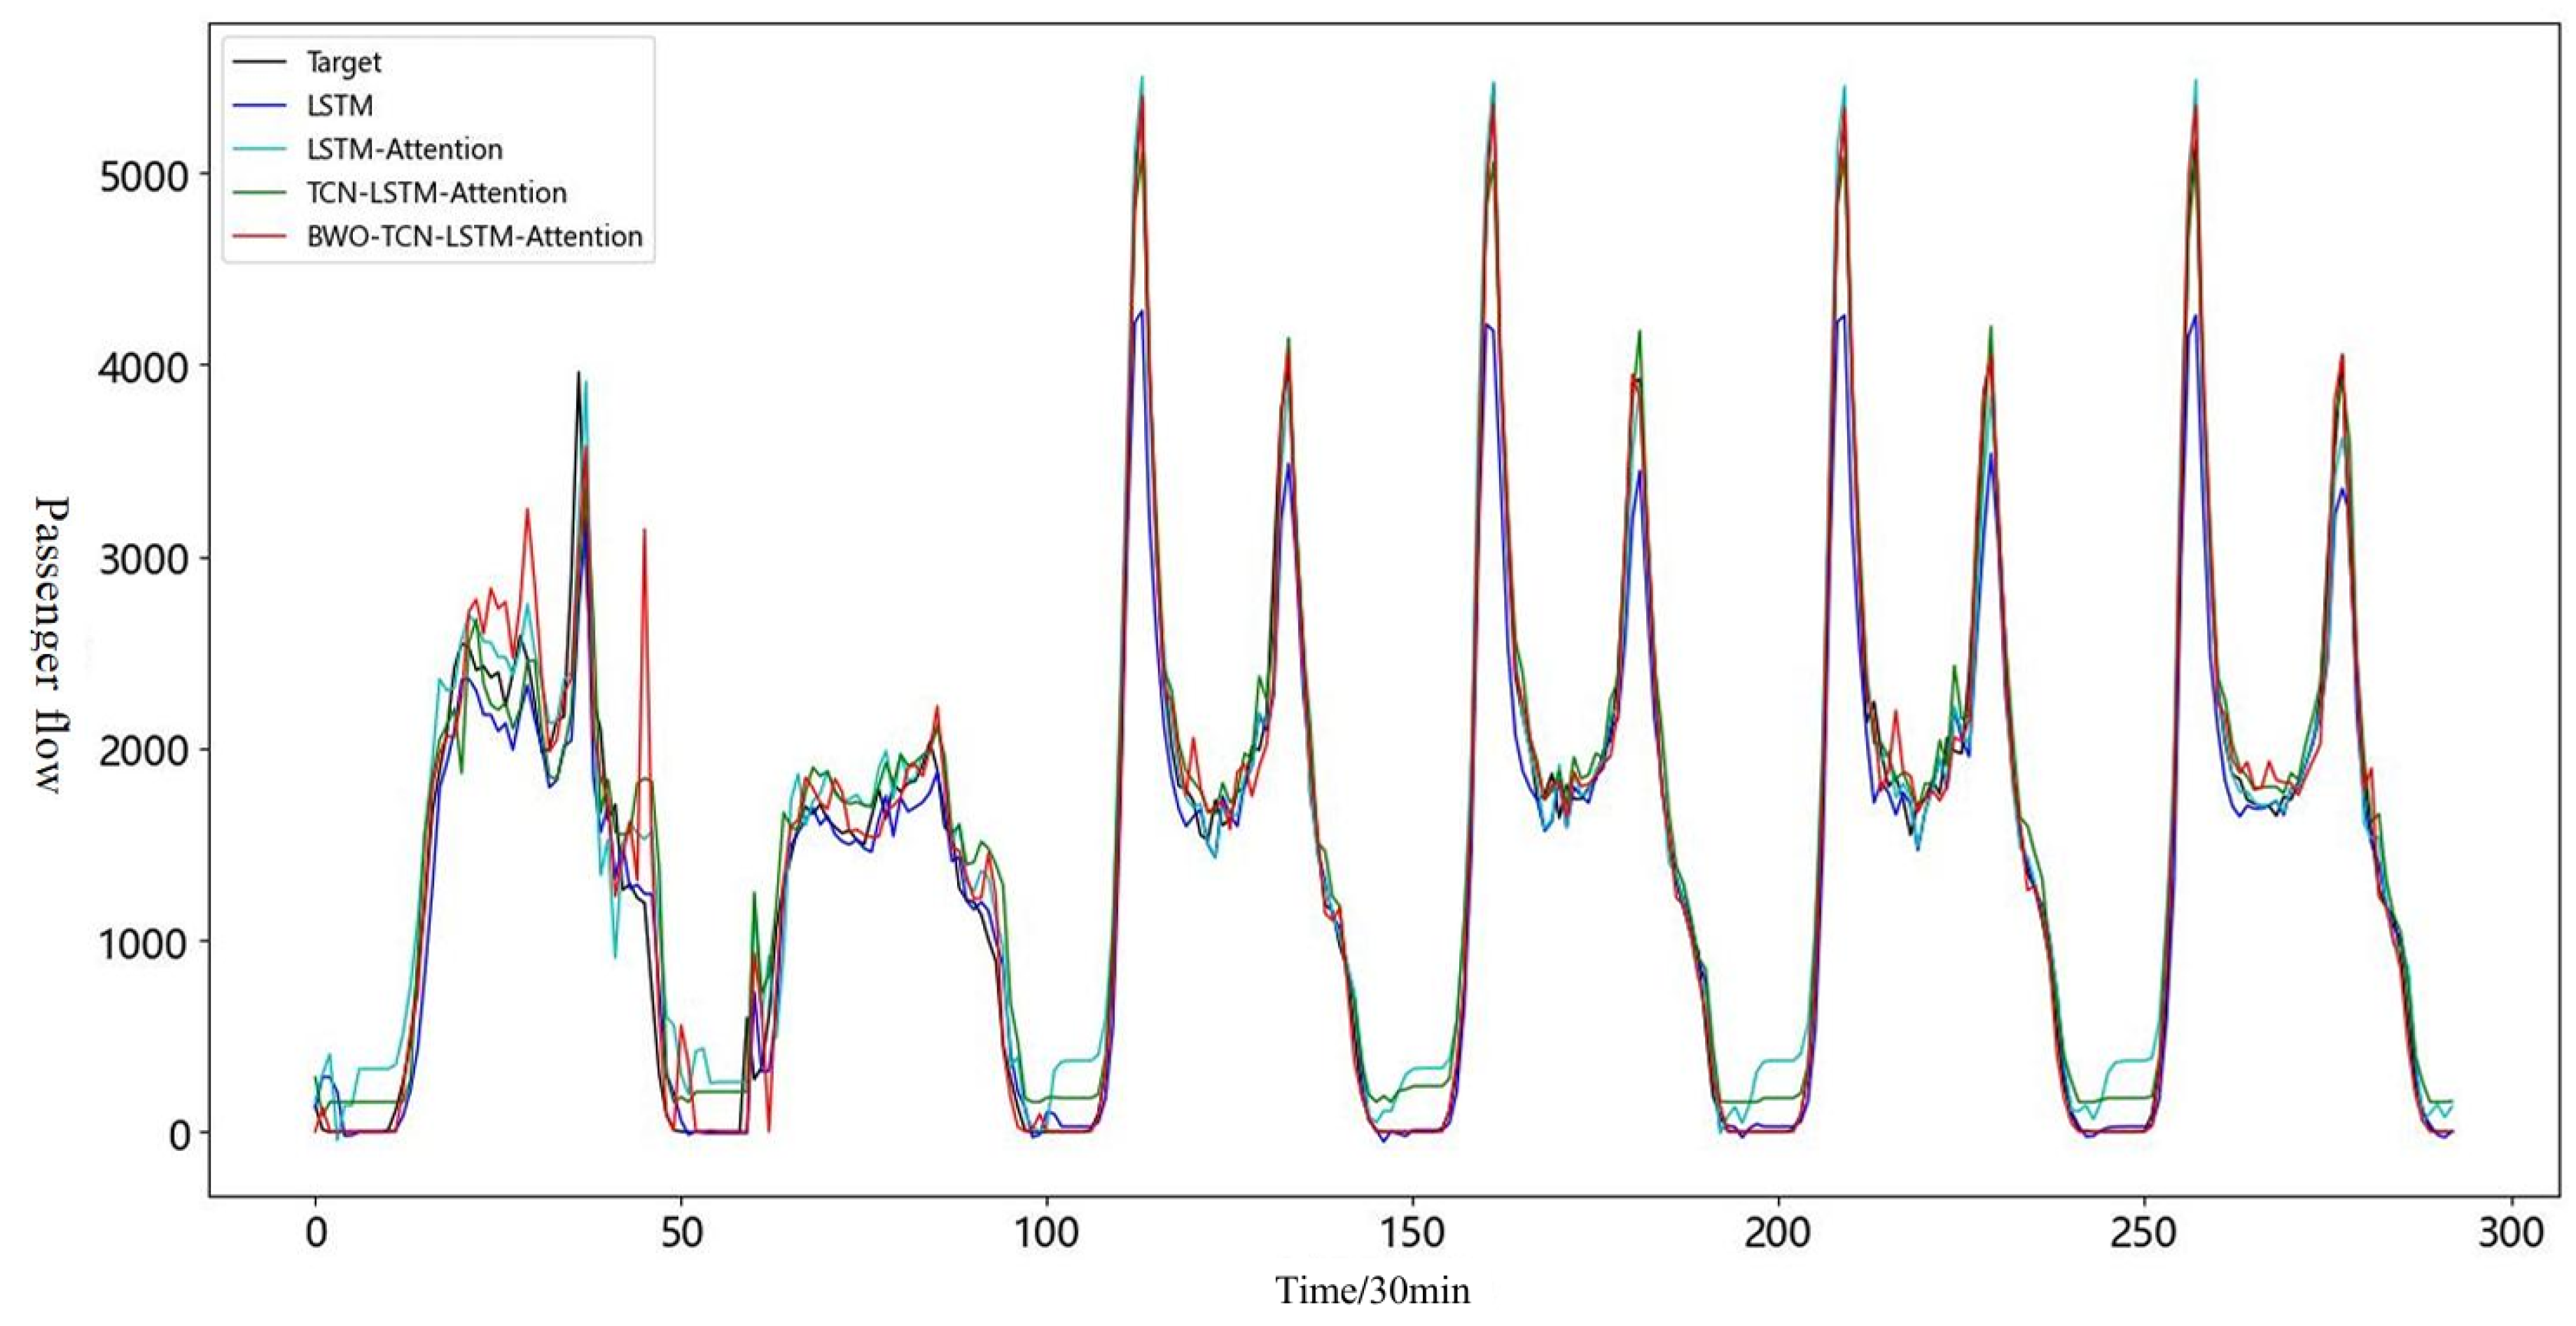
To validate the effectiveness of the model, comparative experiments were conducted on the dataset. The prediction results of the four models are shown in Figure 7.
In Figure 7, it can be clearly seen that the LSTM model struggles significantly when fitting passenger flow peaks during high-demand periods. Specifically, when passenger flow fluctuates dramatically, the marked increase in the prediction error of the LSTM model indicates that relying solely on LSTM for forecasting is suboptimal in scenarios with frequent and large passenger flow variations. This might be due to the inability of the LSTM’s internal memory mechanism to fully capture the characteristic information of peak periods, leading to inaccurate predictions.
In contrast, the TCN-LSTM-Self-Attention hybrid model demonstrates superior performance in predicting peak passenger flow values. However, during relatively stable periods of passenger flow, the LSTM model shows good curve-fitting ability. This is primarily attributed to the LSTM model’s specialized capability in handling sequential data, allowing it to effectively capture the temporal dependencies and long-term trends in passenger flow data.
During the first 50 time intervals, the BWO-TCLS-Self-Attention hybrid model experiences two instances of abrupt changes, likely due to insufficient data in this range to train the model to capture complex dependencies. Overall, the BWO-TCLS-Self-Attention hybrid model outperforms the others in full-period passenger flow predictions. Whether during peak or stable periods, this model provides stable and accurate predictions, making it the most robust across different timeframes.
To further compare the strengths and weaknesses of the four models, it is essential to analyze the model outputs based on the experimental evaluation metrics established in this paper. Table 2 presents the experimental results for the four models.
Based on Table 2, the average absolute error of prediction results of the LSTM model is relatively low, indicating that the predicted value of the LSTM model is close to the actual value in most cases, but the root-mean-square error is high, which is because there are some cases in which the predicted value has a large gap with the actual value. After adding Self-Attention, the mean absolute error (MAE) increased by 20.89, indicating that the model’s prediction error at some points increased, but the root-mean-square error (RMSE) of passenger flow prediction decreased by 20.516 after the introduction of the attention mechanism, indicating that the attention mechanism may effectively reduce the extreme prediction error. After adding the TCN network for mode fusion, the mean error of this model is lower than that of the LSTM-attention model. Compared with LSTM, the mean absolute error (MAE) increases by 5.371, but the root mean square error (RMSE) decreases by 37.591. Compared with LSTM-Self-Attention, it is further reduced by 17.075, which means that the prediction of the model is more accurate on the whole. After adding Self-Attention and TCN, the model determination coefficient ( R 2 ) increased by 0.0072 and 0.0127, respectively.
After incorporating the BWO optimization algorithm module, the TCN-LSTM-Self-Attention model’s Coefficient of Determination ( R 2 ) value showed a noticeable increase, rising by 0.0078. The Mean Absolute Error (MAE) value decreased by 61.744 compared to the LSTM, by 82.634 compared to the LSTM-Self-Attention, and by 67.155 compared to the TCN-LSTM-Self-Attention, significantly lower than other models. This indicates that the BWO optimization algorithm significantly enhanced the model’s accuracy in prediction. The Root Mean Square Error (RMSE) value decreased by 63.915 compared to the LSTM, by 43.399 compared to the LSTM-Self-Attention, and by 26.324 compared to the TCN-LSTM-Self-Attention, making this model’s RMSE the lowest among all the models. This suggests that the influence of outliers and noise in prediction is effectively controlled. The experimental results demonstrate that the introduction of the BWO optimization algorithm is very effective for deep underground passenger flow prediction, proving the effectiveness of adding the BWO optimization algorithm module to the TCN-LSTM-Self-Attention.
In summary, based on the comprehensive evaluation of the Mean Absolute Error (MAE), Root Mean Square Error (RMSE), and Coefficient of Determination ( R 2 ) metrics, the BWO-TCLS-Self-Attention hybrid model performs better in passenger flow prediction. Specifically, the model’s MAE value is reduced by 34% to 41% compared to other methods, and its RMSE value is also reduced by 10% to 22% compared to other methods. The R 2 value is higher than other methods by 0.0205, 0.0133, and 0.0078. The BWO-TCLS-Self-Attention model shows the best performance in all three metrics, which may be due to the BWO algorithm finding parameters that are more suitable for the current dataset during the hyperparameter search process. The high R 2 value indicates that the model has strong explanatory power for changes in passenger flow, while the lower MAE and RMSE indicate that the predicted values are very close to the actual values, even under extreme conditions.

4.3. Comparison of Different Model Algorithms

Linear Regression (LR) [18], as a benchmark model, can be used to measure the relative advantage of other models in capturing linear trends. Random Forest (RF) [18,19] and Gradient Boosting Decision Tree (GBDT) [20], as ensemble learning methods, have been widely recognized for their ability to capture nonlinear complex patterns. Comparing them with deep learning models can reveal the effectiveness of handling the underlying complexity of the data. Ensemble algorithms are strong in identifying complex interactions between features and have inherent resistance to outliers. In order to evaluate the performance of the proposed model and verify the robustness of the experimental results, in addition to the previously mentioned LSTM, LSTM-Attention, and TCN-LSTM-Attention models, the Linear Regression, Random Forest, and Gradient Boosting Decision Tree models are also compared with the BWO-TCLS-Self Attention network model proposed in this chapter using the same training and testing datasets. The same evaluation metrics of MAE, RMSE, and R 2 are used for comparative experiments and result assessment. After complete training and testing, the experimental prediction results are shown in Figure 8.
Figure 8 presents the curves of passenger flow prediction values and actual values for various models. It can be observed that both traditional algorithms and neural-network-based algorithms have a good fitting effect on passenger flow prediction. Among them, the prediction accuracy of the LR algorithm is relatively poor compared to other models, and the GBDT’s prediction effect during peak hours is comparatively worse than that of other models. The BWO-TCLS-Self-Attention hybrid model proposed in this paper shows a higher degree of fit compared to other traditional prediction models. This result indicates that using TCN to extract passenger flow sequence features can more effectively leverage the LSTM model’s ability to learn long- and short-term dependencies in handling passenger flow and external features.
To further compare the prediction effects of each model, calculations are made based on the experimental evaluation indicators established in this paper.
From Table 3, it can be observed that among the three different models compared, the RF algorithm has better predictive capabilities, with an R 2 value higher than the LR algorithm and GBDT algorithm by 0.1171 and 0.0926, respectively. However, when comparing the evaluation metrics of all seven models, the BWO-TCLS-Self-Attention hybrid prediction model proposed in this paper is optimal, with the smallest error values in all aspects. Compared to the LR algorithm, this model has reduced the Mean Absolute Error (MAE) by 299.34 and the Root Mean Square Error (RMSE) by 449.61, and it has increased the R 2 value by 0.2556. Compared to the RF algorithm, the model has reduced the MAE and RMSE by 198.665 and 295.098, respectively, and increased the R 2 value by 0.1385. Compared to the GBDT algorithm, the model has reduced the MAE by 283.442 and the RMSE by 420.449, and it has increased the R 2 value by 0.2321. By using different models to predict passenger flow in the deep underground space scenario, the superiority of the BWO-TCLS-Self-Attention model established in this paper for deep underground passenger flow prediction is further demonstrated.

5. Conclusions

In this paper, we address the problem of passenger flow prediction in deep underground spaces by constructing the BWO-TCLS-Self-Attention hybrid prediction model. First, we analyze the factors influencing underground passenger flow and define the prediction time granularity. Considering the flow patterns and the computational speed of prediction models, we propose a network model that combines TCN with an improved LSTM and introduce a Self-Attention mechanism to enhance prediction accuracy. The BWO algorithm is employed to optimize hyperparameters.
Then, a multi-model evaluation strategy is adopted, along with unified evaluation metrics, to ensure a comprehensive quantitative analysis of the model’s effectiveness in real-world complex environments. Finally, experimental results show that the model achieves a prediction accuracy of 96.94%. Compared with the LR, RF, and GBDT differential learning algorithms, the Coefficient of Determination ( R 2 ) improves by 25.56%, 13.85%, and 23.21%, respectively, indicating that the improved network model enhances the prediction accuracy.

Author Contributions

S.L. and T.C.: Preparation of manuscripts and presentation of methodology. L.D.and T.Z.: Data collection, charting, and coding. All authors have read and agreed to the published version of the manuscript.

Funding

Science and Technology Program in Xi’an city under Grant 21XJZZ0055, Natural Science Foundation of Shaanxi Provincial Department of Education under Grant 22JK0474.

Data Availability Statement

The relevant information about the passenger flow of the deep underground space is provided by the project party, which is confidential information and will not be disclosed for the time being. Thus the dataset used in this paper is not publicly available.

Conflicts of Interest

The authors declare no conflicts of interest.

References

  1. Bobylev, N. Underground space in the Alexanderplatz area, Berlin: Research into the quantification of urban underground space use. Tunn. Undergr. Space Technol. 2010, 25, 495–507. [Google Scholar] [CrossRef]
  2. Cui, J.; Broere, W.; Lin, D. Underground space utilisation for urban renewal. Tunn. Undergr. Space Technol. 2021, 108, 103726. [Google Scholar] [CrossRef]
  3. Bobylev, N. Underground space as an urban indicator: Measuring use of subsurface. Tunn. Undergr. Space Technol. 2016, 55, 40–51. [Google Scholar] [CrossRef]
  4. Liu, L.; Chen, R.-C.; Zhu, S. Impacts of weather on short-term metro passenger flow forecasting using a deep LSTM neural network. Appl. Sci. 2020, 10, 2962. [Google Scholar] [CrossRef]
  5. Hewage, P.; Behera, A.; Trovati, M.; Pereira, E.; Ghahremani, M.; Palmieri, F.; Liu, Y. Temporal convolutional neural (TCN) network for an effective weather forecasting using time-series data from the local weather station. Soft Comput. 2020, 24, 16453–16482. [Google Scholar] [CrossRef]
  6. Fan, J.; Zhang, K.; Huang, Y.; Zhu, Y.; Chen, B. Parallel spatio-temporal attention-based TCN for multivariate time series prediction. Neural Comput. Appl. 2023, 35, 13109–13118. [Google Scholar] [CrossRef]
  7. Lea, C.; Flynn, M.D.; Vidal, R.; Reiter, A.; Hager, G.D. Temporal Convolutional Networks for action segmentation and detection. In Proceedings of the IEEE Conference on Computer Vision and Pattern Recognition 2017, Honolulu, HI, USA, 21–26 July 2017; pp. 156–165. [Google Scholar]
  8. Yao, L.; Zhang, S.; Li, G. Neural network-based passenger flow prediction: Take a campus for example. In Proceedings of the 2020 13th International Symposium on Computational Intelligence and Design (ISCID), Hangzhou, China, 12–13 December 2020; pp. 384–387. [Google Scholar]
  9. Liu, Y.; Lyu, C.; Liu, X.; Liu, Z. Automatic feature engineering for bus passenger flow prediction based on modular convolutional neural network. IEEE Trans. Intell. Transp. Syst. 2021, 22, 2349–2358. [Google Scholar] [CrossRef]
  10. Feng, J.; Feng, X.; Chen, J.; Cao, X.; Zhang, X.; Jiao, L.; Yu, T. Generative adversarial networks based on collaborative learning and attention mechanism for hyperspectral image classification. Remote Sens. 2020, 12, 1149. [Google Scholar] [CrossRef]
  11. Wang, L.; Fang, S.; Meng, X.; Li, R. Building extraction with vision transformer. IEEE Trans. Geosci. Remote Sens. 2022, 60, 5625711. [Google Scholar] [CrossRef]
  12. Li, Y.; Mavromatis, S.; Zhang, F.; Du, Z.; Sequeira, J.; Wang, Z.; Zhao, X.; Liu, R. Single-image super-resolution for remote sensing images using a deep generative adversarial network with local and global attention mechanisms. IEEE Trans. Geosci. Remote Sens. 2021, 60, 3000224. [Google Scholar] [CrossRef]
  13. Wang, C.; Zhang, H.; Yao, S.; Liu, M. DCGCN: Double-Channel Graph Convolutional Network for passenger flow prediction in urban rail transit. In Proceedings of the 2022 8th International Conference on Big Data Computing and Communications (BigCom), Xiamen, China, 6–7 August 2022; pp. 304–313. [Google Scholar]
  14. Du, B.; Peng, H.; Wang, S.; Bhuiyan, M.Z.A.; Wang, L.; Gong, Q.; Liu, L.; Li, J. Deep irregular convolutional residual LSTM for urban traffic passenger flows prediction. IEEE Trans. Intell. Transp. Syst. 2020, 21, 972–985. [Google Scholar] [CrossRef]
  15. Nagaraj, N.; Gururaj, H.L.; Swathi, B.H.; Hu, Y.C. Passenger flow prediction in bus transportation system using deep learning. Multimed. Tools Appl. 2022, 81, 12519–12542. [Google Scholar] [CrossRef] [PubMed]
  16. Jiao, F.; Huang, L.; Song, R.; Huang, H. An improved STL-LSTM model for daily bus passenger flow prediction during the COVID-19 pandemic. Sensors 2021, 21, 5950. [Google Scholar] [CrossRef] [PubMed]
  17. Zhong, C.; Li, G.; Meng, Z. Beluga whale optimization: A novel nature-inspired metaheuristic algorithm. Knowl.-Based Syst. 2022, 251, 109215. [Google Scholar] [CrossRef]
  18. Jing, Y.; Hu, H.; Guo, S.; Wang, X.; Chen, F. Short-term prediction of urban rail transit passenger flow in external passenger transport hub based on LSTM-LGB-DRS. IEEE Trans. Intell. Transp. Syst. 2021, 22, 4611–4621. [Google Scholar] [CrossRef]
  19. Rigatti, S.J. Random Forest. J. Insur. Med. 2017, 47, 31–39. [Google Scholar] [CrossRef] [PubMed]
  20. Ke, G.; Meng, Q.; Finley, T.; Wang, T.; Chen, W.; Ma, W.; Ye, Q.; Liu, T.Y. Lightgbm: A highly efficient Gradient Boosting Decision Tree. In Proceedings of the Annual Conference on Neural Information Processing Systems 2017, Long Beach, CA, USA, 4–9 December 2017; Volume 30. [Google Scholar]
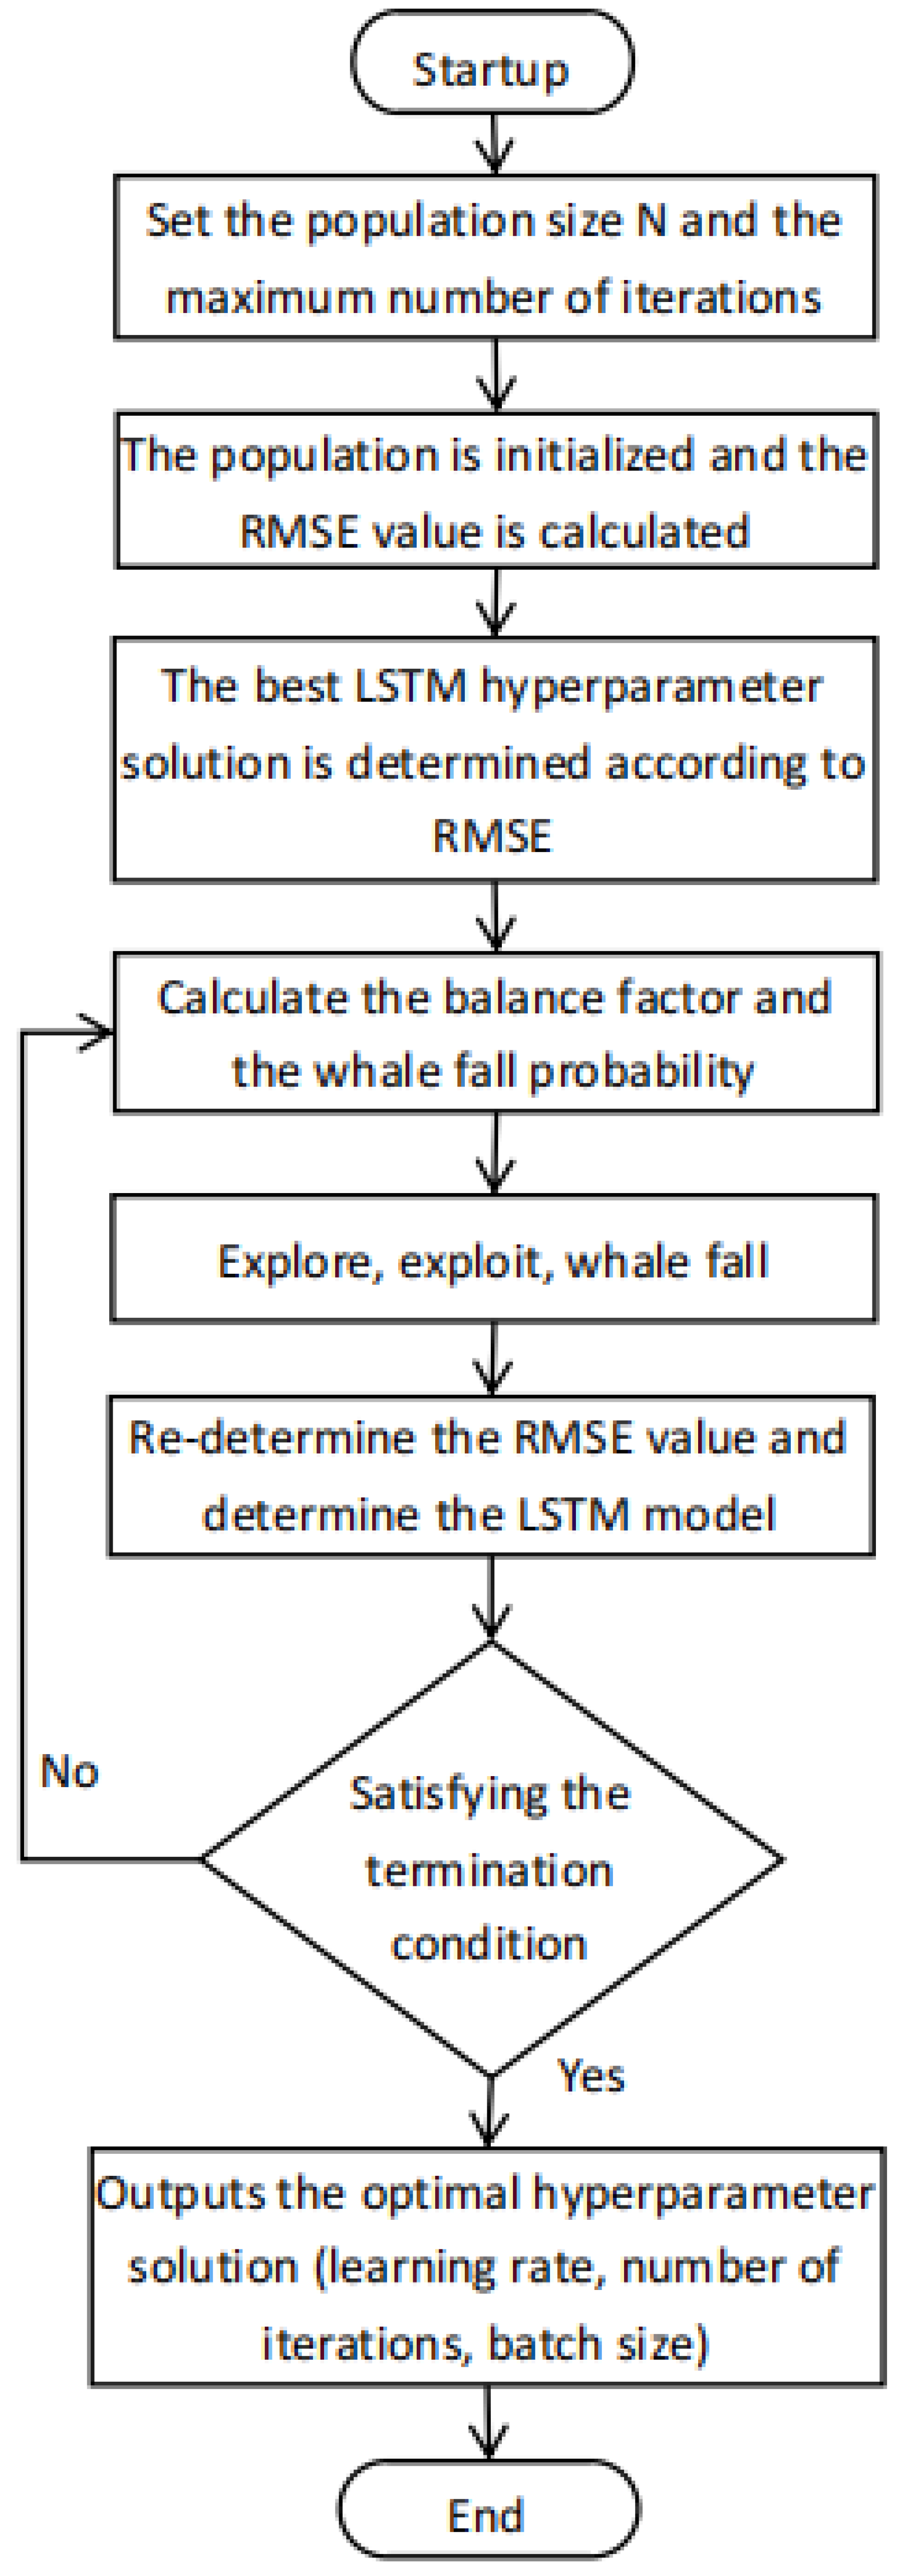
Figure 1. Hyperparametric optimization process.
Electronics 13 04849 g001
Figure 2. SSA vs. BWO optimization process.
Electronics 13 04849 g002
Figure 3. Improved two-layer LSTM structure.
Electronics 13 04849 g003
Figure 4. TCN-LSTM-Self-Attention network structure.
Electronics 13 04849 g004
Figure 5. Passenger traffic for 31 days at one location.
Electronics 13 04849 g005
Figure 6. Loss values for different models.
Electronics 13 04849 g006
Figure 7. Line graphs of the results of multiple model passenger flow forecasts.
Electronics 13 04849 g007
Figure 8. Line graphs of the results of multiple models’ passenger flow forecasts.
Electronics 13 04849 g008
Table 1. Characteristic numerical correspondence table.
FeaturesDataNumerical Value
WeatherCloudy/cloudy1
Cloudy/sunny2
Cloudy/Light rain3
Thundery/cloudy4
Thundery/thundery5
Sunny/cloudy6
Sunny/sunny7
Light rain/cloudy8
Light rain/thunder9
Overcast/cloudy10
Hours of operationWorking day1
Non-working day2
Major eventsMajor events1
Non major event0
Table 2. Module ablation experiment.
Prediction ModelMAERMSE R 2
LSTM180.208282.0330.9489
LSTM-Self-Attention201.098261.5170.9561
TCN-LSTM-Self-Attention185.579244.4420.9616
BWO-TCLS-Self-Attention118.464218.1180.9694
Table 3. Comparison of different model algorithms.
Prediction ModelMAERMSE R 2
Linear Regression LR417.804667.7280.7138
Random Forest RF317.129513.2160.8309
Gradient lifting decision tree GBDT401.906638.5670.7383
LSTM180.208282.0330.9489
LSTM-Self-Attention201.098261.5170.9561
TCN-LSTM-Self-Attention185.579244.4420.9616
BWO-TCLS-Self-Attention118.464218.1180.9694
Disclaimer/Publisher’s Note: The statements, opinions and data contained in all publications are solely those of the individual author(s) and contributor(s) and not of MDPI and/or the editor(s). MDPI and/or the editor(s) disclaim responsibility for any injury to people or property resulting from any ideas, methods, instructions or products referred to in the content.