Article

An Adaptive Control Method and Learning Strategy for Ultrasound-Guided Puncture Robot

1
Shenzhen Institutes of Advanced Technology, Chinese Academy of Sciences, Shenzhen 518055, China
2
Center of Interventional Radiology & Vascular Surgery, Department of Radiology, Zhongda Hospital, Southeast University, 87 Dingjiaqiao Road, Nanjing 210009, China
*
Authors to whom correspondence should be addressed.
Electronics 2024, 13(3), 580; https://doi.org/10.3390/electronics13030580
Submission received: 11 December 2023 / Revised: 24 January 2024 / Accepted: 26 January 2024 / Published: 31 January 2024
(This article belongs to the Section Computer Science & Engineering)

Abstract

:
The development of a new generation of minimally invasive surgery is mainly reflected in robot-assisted diagnosis and treatment methods and their clinical applications. It is a clinical concern for robot-assisted surgery to use a multi-joint robotic arm performing human ultrasound scanning or ultrasound-guided percutaneous puncture. Among them, the motion control of the robotic arm, and the guiding and contact scanning processes of the ultrasonic (US-) probe determine the diagnosis effect, as well as the accuracy and safety of puncture surgery. To address these challenges, this study developed an intelligent robot-assisted system integrating autonomous US inspection and needle positioning, which has relation to several intelligent algorithms such as adaptive flexible control of the robot arm, autonomous US-scanning, and real-time attitude adjustment of the puncture needle. To improve the cooperativity of the spatial operation of the robot end-effector, we propose an adaptive flexible control algorithm that allows the operator to control the robot arm flexibly with low damping. To achieve the stability and uniformity of contact detection and imaging, we introduced a self-scanning method of US-probe based on reinforcement learning and built a software model of variable stiffness based on MuJoco to verify the constant force and velocity required by the end mechanism. We conducted a fixed trajectory scanning experiment at a scanning speed of 0.06 m/s. The force curve generally converges towards the desired contact force of 10 N, with minor oscillations around this value. For surgical process monitoring, we adopted the puncture needle detection algorithm based on Unet++ to acquire the position and attitude information of the puncture needle in real time. In short, we proposed and verified an adaptive control method and learning strategy by using an UR robotic arm equipped with a US-probe and puncture needle, and we improved the intelligence of the US-guided puncture robot.

1. Introduction

In comparison with CT or MRI examinations, US-scanning is more commonly used in modern medical applications due to its safety, real-time capacity, low cost, and broad applicability [1]. Real-time US-guidance is crucial for minimally invasive interventions during percutaneous interventional diagnosis and treatment (PIDT), such as regional anesthesia [2], needle biopsies [3], and vascular imaging [4]. However, traditional freehand US-scanning not only relies heavily on the operator’s experience but also leads to musculoskeletal strain and an increased risk of infectious diseases [5,6,7]. Robot-assisted US-scanning has emerged as a solution to address these concerns by providing stability, accuracy, and reduced doctor–patient contact [8].
An autonomous US-scanning task requires proper contact of the US-probe with the human body as well as adaptation to the uncertainty of human abdominal undulations. One challenge is ensuring the US images meet universal quality assessment standards. Researchers have explored various methods, such as ultrasound image quality assessment [7,9], visual feedback [8,10], and force feedback [11,12]. For instance, Akbari et al. [7] proposed an automated US-scanning robot that uses deep learning with Support Vector Machine (SVM). This system regulates the scanning force of the US-probe by recording the correlation, compressibility, and noise properties of US images. Salvatore Virga et al. [9] used a US confidence map to assess image quality and made real-time adjustments to the probe’s contact force and rotation angles to enhance aorta visibility. However, these control models show limited applicability to different scanning subjects. On the other hand, managing scanning behavior using visual information provides a more direct approach [13]. Qinghua Huan et al. [8] presented an in-depth camera-based 3D contour acquisition system for acquiring the 3D contour, scan path planning, and autonomous US-scanning. Nadeau et al. [14] developed an image-based visual servo system capable of autonomously controlling the position of the US-scanning robot and extracting target contours from images obtained by a 3D US-probe. However, visual-based control methods still face challenges in clinical application, such as equipment occlusion, image stability, uniformity, and so on, which may impact the final diagnosis and treatment results.
Furthermore, many studies have attempted to control robot-assisted US-scanning using force feedback. The most common control methods for this task include hybrid force-position control [15], impedance control [16], and admittance control [17,18]. Kurnicki et al. [11] developed the ReMeDi US-scanning system, which consists of a 7-degree-of-freedom robotic arm and a torque sensor controlled by an STM32 microcontroller to replicate complex procedures performed by surgeons in real time. Risto Kojcev et al. [12] developed a dual-independent robotic US-guided needle assistance localization system with separate imaging and needle insertion modules. The seamless integration of planning, imaging, and needle puncture was achieved through a unified system that combines force-controlled US image acquisition, preoperative and intraoperative image registration, vision-based robot control, and needle tracking algorithms for precise target localization. Additionally, the MELODY system [19] developed by AdEcho Tech, employs master-slave control machinery and allows operators to begin with coarse placement and then fine-tune the probe direction. The abovementioned technologies have been used effectively in remote examinations for over 300 patients in fields such as cardiology, abdominal imaging, and obstetrics [20,21,22]. Although significant improvements have been made in the control methods, it remains challenging, especially in addressing the large variability in the US image caused by factors such as intestinal gas and a lack of gel coupling. All these methods rely on both force and position information, and their effectiveness depends entirely on the established parameters. Additionally, several studies have focused on optimizing US-probe control by incorporating multi-modal information. Reinforcement learning has shown promise for handling changing multi-modal information in tasks involving contact-rich interactions. For example, Asad Ali Shahid et al. [23] used reinforcement learning to enable continuous control action learning and adaptive control of robot manipulation, successfully verifying the feasibility of the algorithm in a grasping challenge with the Franka Emika Panda robot. Another autonomous US-scanning system was developed by Guochen Ning et al. [24]. The system combined the information on humans from a force sensor and a US image, whose control model was trained using a reinforcement learning network.
In clinical practice, surgeons use ultrasound-scanning robots to autonomously perform tasks while ensuring safety and flexibility. Additionally, these robots can serve as platforms to facilitate human–machine interaction, allowing manual adjustments and modifications to meet specific needs [25]. However, most of the aforementioned research focuses only on the ultrasound scanning process and overlooks the flexibility and comfort required in the pre-operative rough positioning process, where clinical surgeons manually position the robotic arm to the desired location. Furthermore, the challenges presented by soft contact between deformable objects have only been explored by a limited number of research teams [26]. In fact, deformable objects have a wide range of practical applications, particularly in scenarios involving surgical robots that necessitate human–machine interaction [27]. Similarly, the robot-assisted US-scanning procedure faces difficulties arising from soft interactions, such as tissue deformation and surface movements of the human skin during respiratory motions. To address these challenges and adapt the robot system to soft contacts and variable scanning environments during the scanning process, we employ a reinforcement learning approach combined with an adaptive flexible control algorithm to achieve autonomous ultrasound scanning tasks. The adaptive flexible control algorithm provides both the flexibility and comfort needed for clinicians to manually position the robotic arm to the target location during the preoperative rough positioning process and significantly improves the learning speed of the adaptive ultrasound scanning task through Cartesian space impedance matching learning techniques [28].
To meet the clinical requirements of US-scanning and percutaneous puncture procedures, we designed an integrated autonomous US-scanning and needle localization system that combines flexible traction positioning, autonomous scanning, and real-time localization of the puncture needle. In summary, our contributions are as follows:
  • We proposed an adaptive, flexible control algorithm for robotic arms. This algorithm enables surgeons to easily manipulate and position the robotic arm before US-scanning, thus enhancing the smoothness and safety of the preoperative process. As a result, we can drag the arm with ease, ensuring flexibility in its movements and placement.
  • Based on reinforcement learning, an autonomous scanning mode with constant contact force and velocity was developed. By using information from the end-effector force sensor and the state of the robotic arm, the autonomous scanning mode generates commands for the robot controller. The flexible control algorithm is incorporated to directly control the motion of the US-probe.
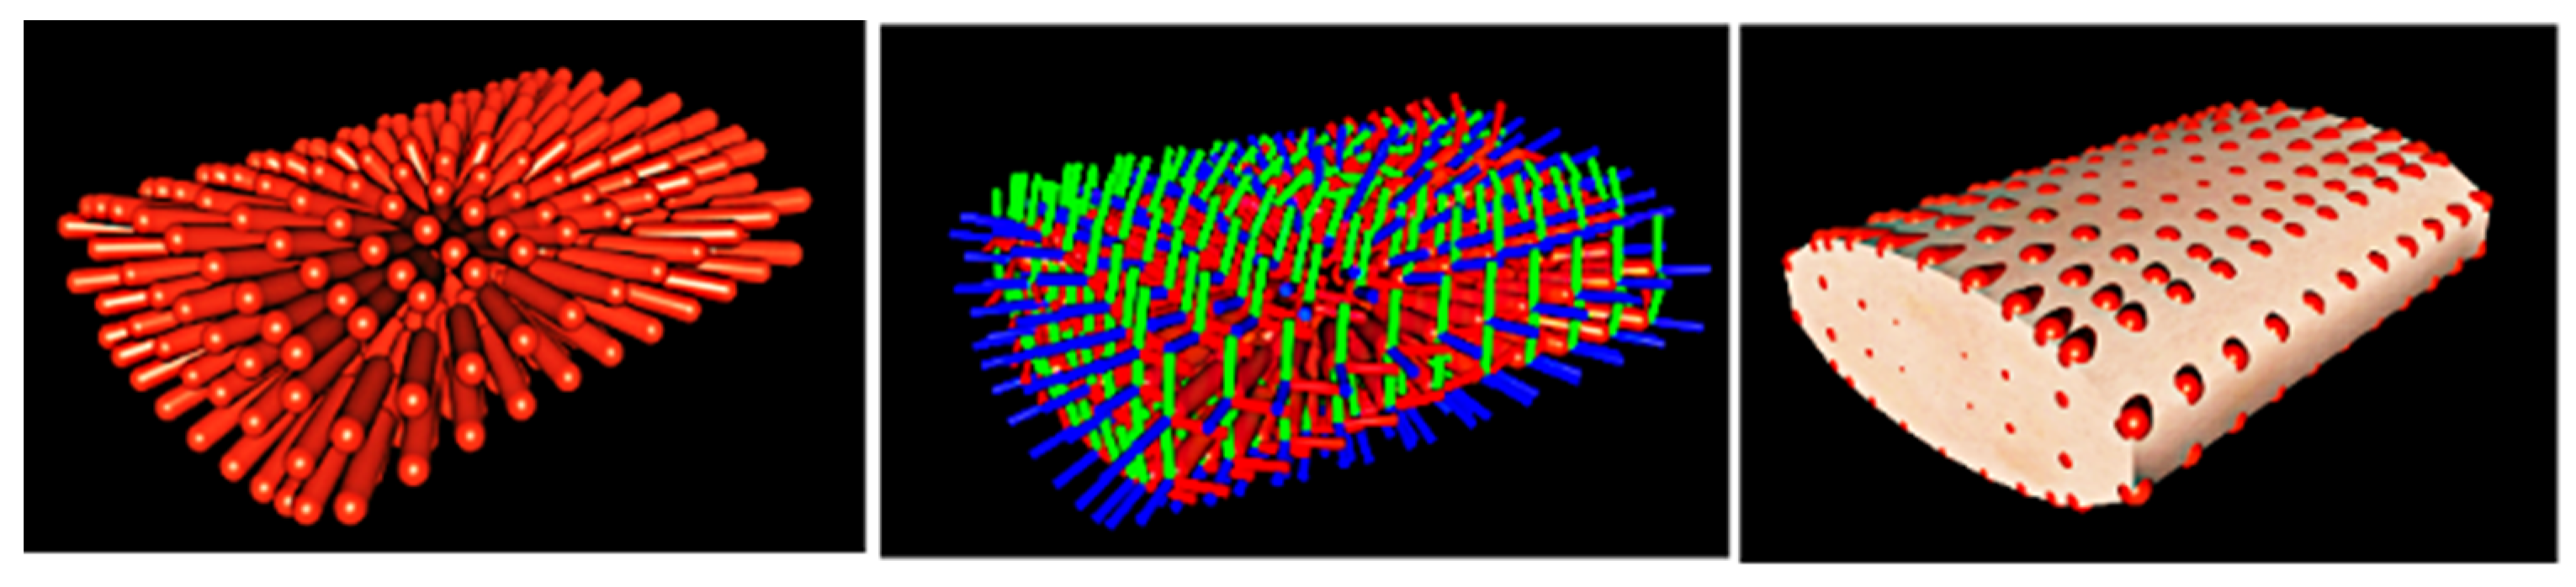
  • In terms of reinforcement learning in soft contact simulation, we use Multi-Joint Dynamics with Contact (MuJoCo) to create a deformable physics model of soft contact objects that can modify stiffness and damping, allowing the simulation process to exhibit noticeable and more realistic stress reactions.
  • After the US-scanning operation was completed, we performed tumor-related object localization and proposed a real-time needle posture adjustment approach based on the UNet++ algorithm to solve the difficulty of properly establishing the position and orientation of the needle.
For the remainder of this paper, Section 2 provides a detailed description of the system architecture, the adaptive flexible control algorithm, the reinforcement learning method, and the real-time needle posture adjustment method. Section 3 presents the results of a series of experiments conducted to evaluate the system. Section 4 contains a discussion of the findings, and Section 5 offers the conclusions. In order to make reading the article easier, we prepared a list of the most important symbols for patterns appearing in Appendix A.

2. Materials and Methods

2.1. System Description

We displayed the overall structure of the robot-assisted system for autonomous ultrasound scanning and percutaneous puncture localization in Figure 1. This system consists of three main components: ultrasonic imaging equipment, an executive robot, and a biopsy model. Specifically, we used the Mindray DC-8 Pro as the US-imaging equipment. The executive robot is composed of a UR5e robotic arm equipped with a teaching pendant and control cabinet. The end-effector of the robotic arm is outfitted with an US-probe and an assisted puncture positioning device. Additionally, we used the 071B-image-guided abdominal biopsy phantom as the biopsy model.

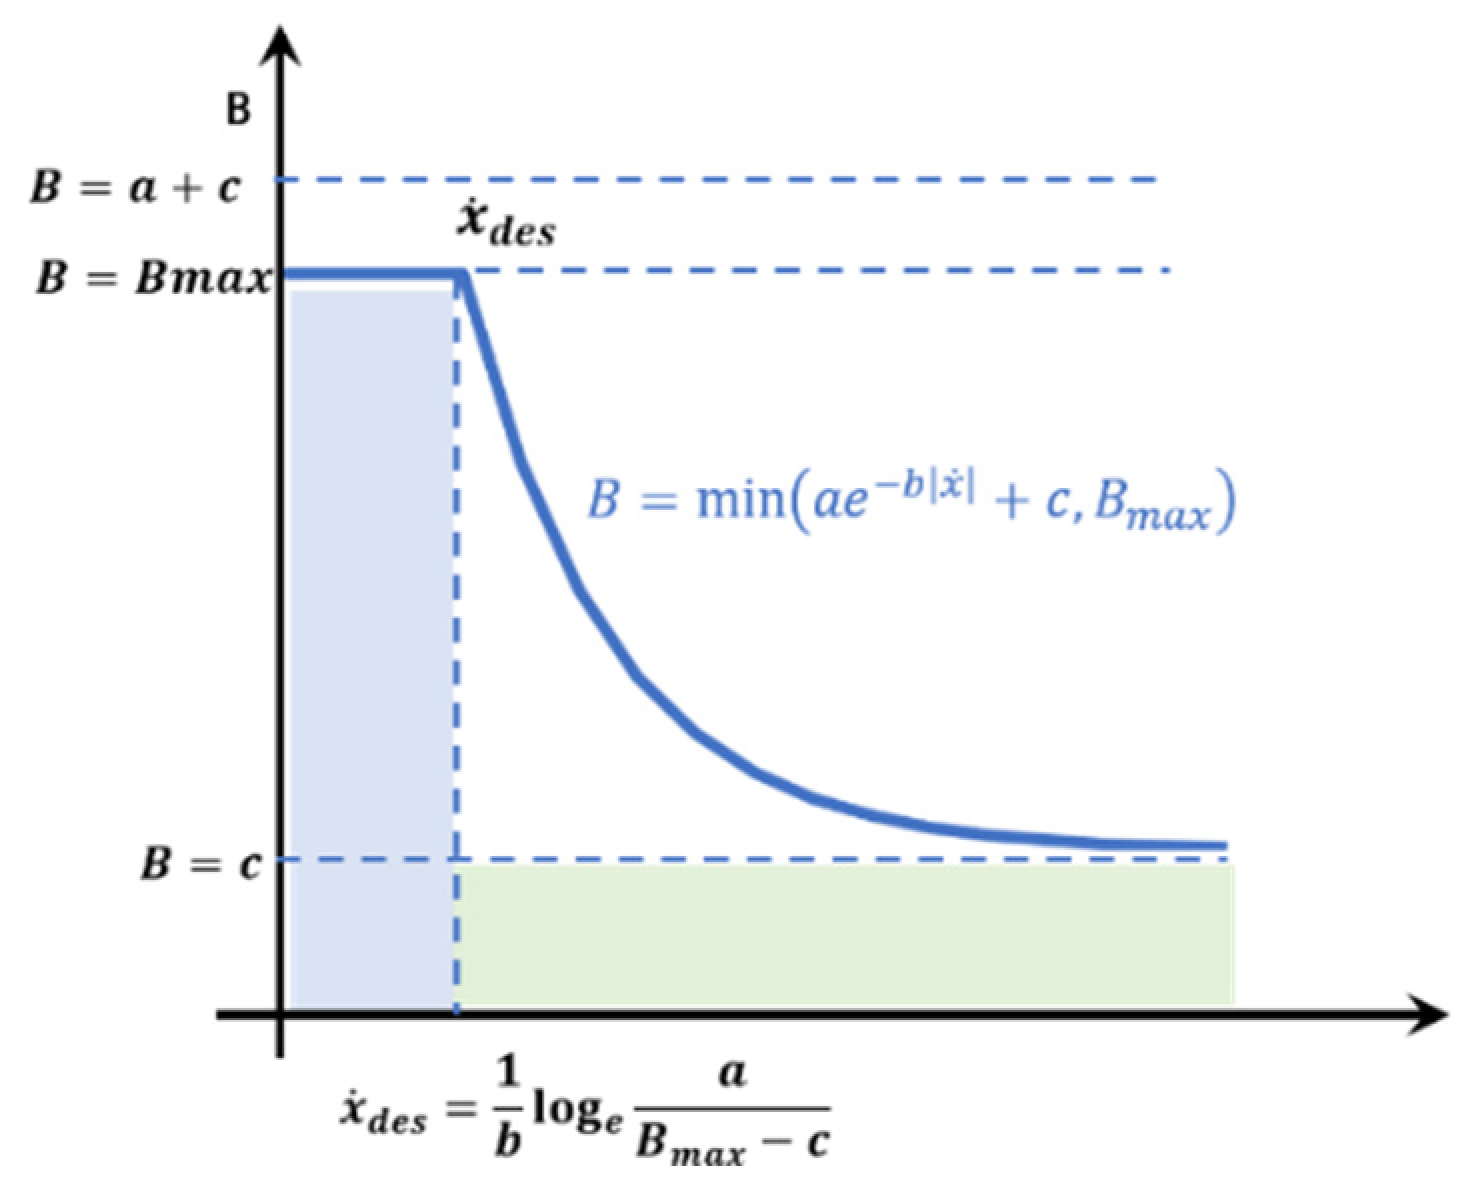
2.2. Adaptive Flexible Control Algorithm

Variable impedance control is a widely recognized method to achieve indirect force control by managing robot motion [28]. This approach enables manual rough positioning and accelerated reinforcement learning training by adjusting the dynamic interactions between the robot and its environment. In order to achieve impedance characteristics in the end-effector of the robotic arm when subjected to external forces, we have implemented impedance control in Cartesian space. The relationship between the position and force of the end-effector of the robotic arm can be expressed as:
M x ¨ e + B x ˙ e + K x e = F e x t   ,
where F e x t represents the ambient stress exerted on the six-dimensional force transducer in the end-effector, x e denotes the difference between the actual position x and the desired position x d , x e ¨ represents the second-order derivative of x e , and x e ˙ represents the first-order derivative of x e . The diagonal matrices K   B , and M correspond to the stiffness coefficients, damping coefficients, and inertia coefficients, respectively. It is important to note that M , B , and K must all be positive definite matrices. The robot’s dynamics, based on Lagrange’s equations, can be expressed as:
M q q ¨ + C q ˙ , q q ˙ + g q = τ τ e x t   ,
where M q is the robot mass matrix, C q ˙ , q is the centrifugal and coriolis forces, and g q is the gravitational moment. If an advance-planned trajectory is specified as ( x ¨ d , x ˙ d , x d ), the input to the joint torque τ control can be derived from the above equation as:
τ = & M q J 1 M 1 M x ¨ d + K x e ˙ + B x e M J q ˙ , q q ˙ + J T q M q J 1 q M 1 F e x t + g q + C q , q ˙ q ˙ ,
Achieving fully decoupled impedance properties in Cartesian space for the end-effector is not feasible in practice without an accurate model of the robot’s dynamics. To enhance the learning speed of reinforcement learning tasks, the admittance control approach can be employed. The robot’s admittance control consists of an inner-loop strategy based on position control and an outer-loop technique based on force control. An observer uses a six-dimensional moment sensor to monitor the contact force exerted on the system by the external world and generates an additional position using a second-order guidance model. This control method allows the system to demonstrate second-order impedance characteristics without requiring an accurate model of the robot’s dynamics. This method is particularly suitable for servo control systems where positional control is efficient. The desired joint position is determined through the admittance control calculation, which is straightforward for standard industrial robots. Consequently, admittance control dominates in current applications of force control. Given that admittance control adjusts the robot’s movement based on contact forces, the output speed and acceleration of the robot are modified according to the force conditions identified at the end-effector.
The impedance model must be rewritten in the following manner:
      x e ¨ = M 1 F e x t B x ˙ e t K x e t x ˙ e t + 1 = x e t ˙ + x ¨ e Δ t   x e t + 1 = x e t + x ˙ e t + 1 Δ t ,
While a single impedance characteristic is challenging to match the complexity of numerous scenarios in the autonomous sweeping behavior of US-scanning robots, the robot must be able to alter its impedance online and autonomously to produce steady US images. The damping transformations listed below are required to adaptively tune the damping size.
B x ˙ = m i n a e x p b x ˙ + c , B m a x ,
where a is the initial impedance coefficient, b is the impedance coefficient drop, c is the minimum value at which the impedance coefficient is scaled (to prevent the impedance coefficient from being too low and causing the robotic arm to jitter irregularly), and B m a x is the maximum value of the impedance coefficient. As seen in the equation above and from Figure 2, damping B is equivalent to a negative power function connected to the velocity of the robot’s arm tip. If the tip detector is found to be powerful enough while the probe has an initial velocity value, the damping is rapidly lowered, leading the tip of the robot arm to present a soft feature, depending on the rate of decline of the power function.

2.3. Simulation Environment and Reinforcement Learning

Reinforcement learning algorithms have gained increasing prominence in complex decision-making tasks, allowing for the direct learning of optimal control approaches from observations. Wu et al. [29] have developed an adaptive impedance control approach based on Q-Learning that incorporates human and robot impedance models to estimate human trajectories in real time. Jonas Buchl et al. [30] have proposed the policy function-based reinforcement learning algorithm PI2 for adaptive impedance control of robots and platform migration. Likewise, we employed reinforcement learning for training the UR5e robotic arm in ultrasound scanning. Additionally, due to the challenges associated with real-world reinforcement learning, such as limited efficiency in collecting real-world data samples and potential safety risks during robotic arm operation, it is customary to train agents in simulation environments instead. Figure 3 depicts a constructed simulation system for training the UR5e robotic arm to maintain constant contact force and velocity during US-scanning. This chapter presents a thorough description of the complete system, placing emphasis on the architecture of the simulation environment and the employed reinforcement learning methodology.

2.3.1. Simulation Environment Construction

  • Construction of the soft contact model
Given the soft nature of the patient’s body, we create a more realistic simulation of the dynamics between the US-probe and the human body to ensure a translation to reality. To bridge the gap between simulation and reality, we placed deformable objects in the simulation environment that closely mimic the softness of the human body, enabling a more authentic representation of the movements of the US-probe during contact with the patient. Modeling deformable objects in a configuration space is a highly complex task, often demanding significant effort and resulting in poor model migration. Martín-Martín et al. [28] employed MuJoco to model soft contact objects and implement a robotic surface wiping task using reinforcement learning methods. MuJoco provides the necessary mathematical foundations and modeling approaches to accurately represent soft-contact human models. To construct a soft contact object for US-scanning activities in Mujoco, a composite element is defined based on the MJCF model language [31]. This composite element serves as a macro that encompasses multiple model elements, representing a composite object of the same structure, effectively simulating the movement of the object’s surface as a particle system. Figure 4 illustrates a soft-contact item composed of multiple stiff bodies, each having a retractable joint positioned at the center. The built-in parameters, e.g., solref and solimp in MuJoco2.1 software settings are critical in determining the surface stiffness and damping of this soft-contact device. The limited-space dynamics of this model are approximated to fulfill the following equation:
      a 1 + d b v + k x = 1 d a 0 ,
where a 1 , v , and x represent the acceleration, velocity, and position difference, respectively; k , b , and d represent the stiffness, damping, and impedance constraints of the equivalent mass-spring-damping model, respectively; and a 0 represents the unforced acceleration where the reference acceleration is a r e f = b v k x . Functions on d parameterized by solimp elements are dmin, dmax, width, midpoint, and power.
In Figure 4, the soft contact model depicted employs texture to generate intricate and realistic surface texture meshes. The red region precisely indicates the spatial position of the sliding joint. To enhance visual fidelity, the skin element was introduced, using advanced bicubic interpolation techniques to achieve precise texture mapping and subdivision of the skin image. Consequently, the skin smoothly adheres to the model’s surroundings, skillfully concealing the underlying rigid structure. This meticulous integration faithfully replicates the model’s physical state within a highly realistic and immersive real-world environment.
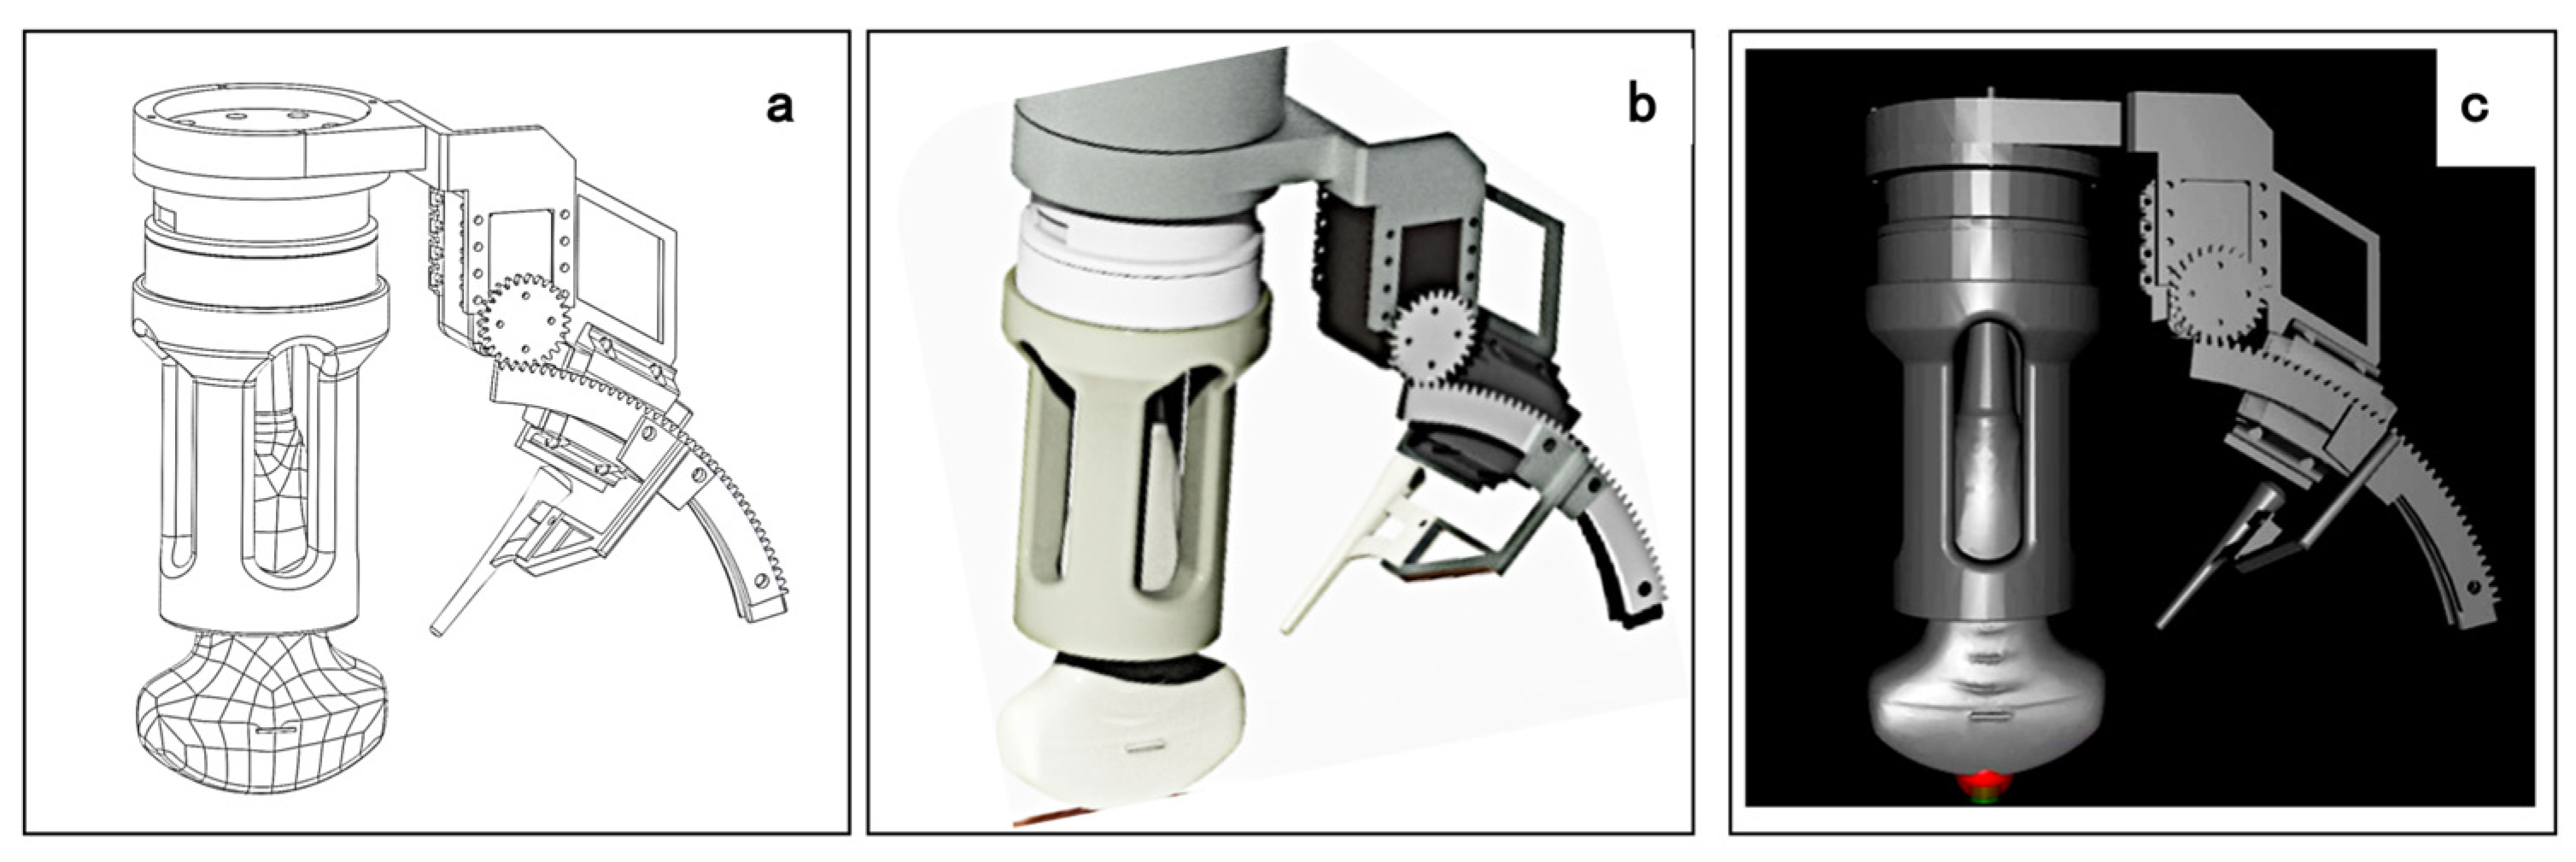
  • Design of the robotic arm’s end-effector mechanism
As widely acknowledged, the successful implementation of clinical percutaneous procedures requires physicians to possess exceptional coordination skills. These skills enable them to ensure precise puncture operations by keeping the puncture needle within the plane of the US image. Meeting these criteria places significant demands on physicians’ experience and technical proficiency. Properly identifying the insertion angle as well as continually monitoring the spatial attitude of the puncture needle are important aspects of the puncture technique. To address these challenges, this study presents an auxiliary puncture mechanism that provides real-time visualization of the puncture needle within the US image, allowing physicians to monitor its status and spatial position during the surgery.
Obtaining force and torque data from the end-effector in the simulated environment is crucial. However, direct physical sensors that meet this criterion are unavailable. In contrast, the UR5e robotic arm, distinct from the UR5 series, is equipped with a force and torque sensor. To capture the end-effector’s force and torque during simulation, a virtual force and torque sensor are incorporated into the end-effector and placed at the end of the US-probe model. This compensates for the simulated environment’s inability to acquire end-effector force. The specific installation of this mechanism is illustrated in Figure 5, with the red portion indicating the location of the force and torque sensors.

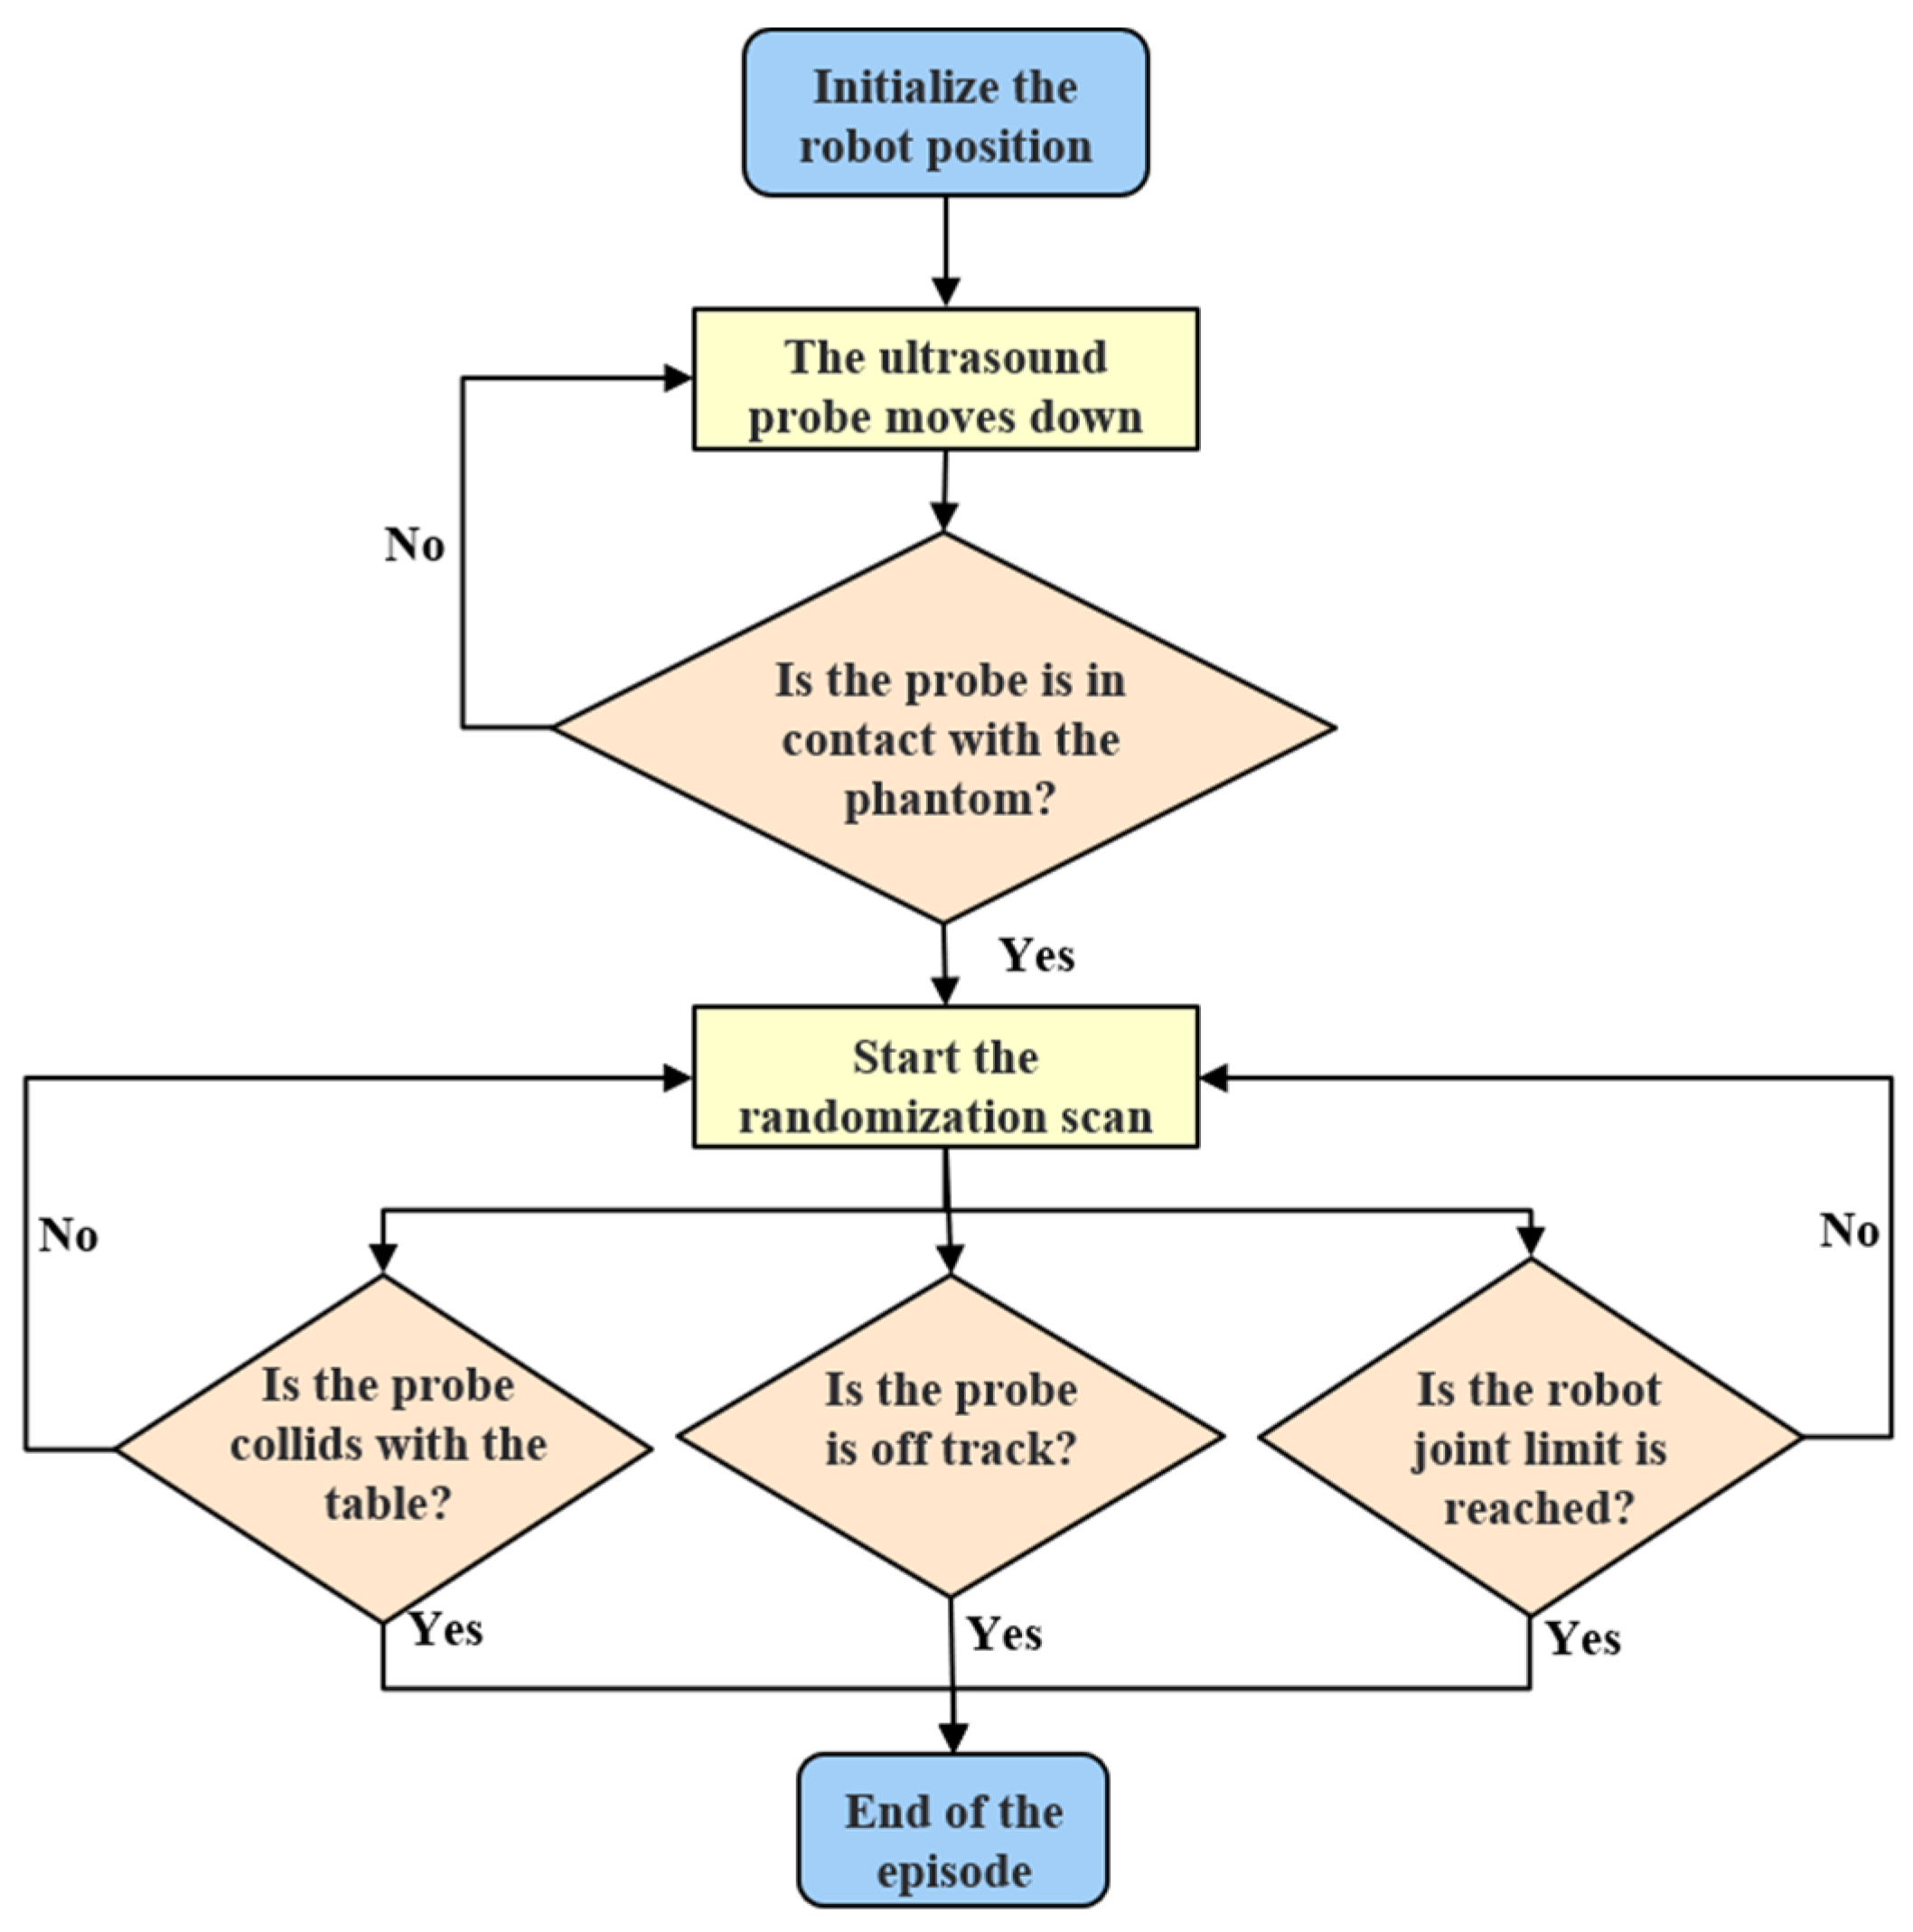
2.3.2. Reinforcement Learning

Reinforcement learning studies sequential decision problems, where the state of an agent shifts over time, and focuses on Markovian problems, where the future state is conditionally independent of the past state, given the present state: P s t + 1 s 1 , s t = P s t + 1 s t . This topic focuses on the interaction between US-probes and soft-touch objects. The scanning process satisfies a Markov Decision Process and can be represented by a tuple: S , A , P , R , γ , where S is a finite set of states, A is a finite set of actions, P is a state transfer probability matrix representing: P s s α = p s t + 1 = s s t = s , a t = a , R is the reward function: R s α = E r t + 1 s t = s , a t = a , and γ 0,1 is a discount factor. The rewards expected by the agent depend on the actions they choose to take. Therefore, the value function is associated with a specific mode of action, also referred to as the strategy: π a | s = P a t = a s t = s , which represents the probability of choosing action a in state s , and the expected reward for choosing strategy π in state s is the value of that state V π s . The purpose of reinforcement learning is to train a policy P that maximizes the expected reward by learning to select an action. In the case of ultrasonic scanning tasks, the US-probe continuously scans the body at a constant speed and pressure to acquire stable US images.
Proximal Policy Optimization (PPO) [32] is an on-policy deep reinforcement learning algorithm designed for continuous or discrete action spaces that emerges with better performance in complex environments. The PPO algorithm proposed a new target function to update in small batches in multiple training steps, thus solving the issue of step length determination in the Policy Gradient algorithm. Building upon the Actor-Critic algorithm, the goal of PPO is to maximize the following target functions:
L C L I P θ = E ^ t m i n π θ a t s t π o l d a t s t A ^ t s , a , c l i p π θ a t s t π o l d a t s t , 1 ϵ , 1 + ϵ A ^ t s , a
where π θ a t s t / π o l d a t s t represents the ratio of the new policy to the old policy and is mainly used to limit the extent to which New Policy can be updated, ensuring that the algorithm converges more easily. A ^ t s , a represents the estimated amount of dominance function.
This study aims to train US-scanning robots for the automatic probing and acquisition of stable US images. To accomplish this task, the US-probe is required to execute random scans of the human body at a consistent speed and contact force. Therefore, the design of the reward function necessitates consideration of pertinent factors such as position, direction, and contact force. As a result, the reward function is formulated as the sum of the weight matrix and individual component rewards, expressed as:
  R t o t a l = i = 1 N W i T R i ,
Here, the weight matrix W i = w 1 , w 2 w 6 T represents the weights assigned to each reward item, and N is the number of reward items set to N = 6. The rewards matrix R i = r 1 , r 2 r 6 T represents the rewards of each individual component, including position reward, orientation reward, contact force reward, derivative contact force reward, velocity reward, and acceleration reward. The position error of the US-probe in the x-y plane is expressed as a Euclidean distance and normalized to serve as the position reward:
r 1 = r p o s = 1 e x p w p o s P p r o b e P g o a l , t ,
where P g o a l , t is the aim position of the US-probe at moment t . The same approach is applied to the directional reward r 2 :
r 2 = r o r i = 1 e x p w o r i d q t , q g o a l , t ,
where d q t , q g o a l , t is a distance metric representing two quaternions, calculated as:
d q 1 , q 2 =     2 π ,     q ¯ 1 q ¯ 2 = 1 + 0,0 , 0 T 2 l o g q ¯ 1 q ¯ 2 ,     o t h e r w i s e ,
where l o g q ¯ 1 q ¯ 2 represents the logarithm of the quaternion, calculated as:
l o g q = l o g v + u = arccos ( v ) u u ,     u 0     0 , 0 , 0 T ,     o t h e r w i s e ,
The reward for the contact force at the end of the US-probe is represented as r 3 :
r 3 = r f o r c e = 1 e x p w f r o c e f t ¯ f g o a l , t 2 ,
where the operating average f ¯ t is used as a filter to smooth out the measured contact force values. f ¯ t can be found by using the following formula:
f ¯ t = 1 β f ¯ t 1 + β f t ,   0 < β < 1 ,
Similarly, r 4 is obtained as a reward for the derivative of the contact force:
r 4 = r d e r f = 1 e x p w d e r f f t f g o a l , t 2 ,
r 5 and r 6 are the velocity reward and acceleration reward at the end of the US-probe respectively, where ν ¯ t is the average speed value.
r 5 = r v e l = 1 e x p w v e l ν ¯ t ν ¯ g o a l , t 2 ,
      ν ¯ t = ν ¯ t 1 + ν t 1 ν ¯ t 1 n ,
r 6 = r a c c = 1 e x p w a c c a ¯ t a ¯ g o a l , t 2 .
In configuring the reward function within the reinforcement learning algorithm, the weight for contact force is set to the maximum, giving priority to maintaining a constant contact force. As described in the reward function, several target values need to be selected, and at each time step, the trajectory generator extracts the target position from the trajectory, while the target orientation quaternion is set as q g o a l = 0.692 , 0.722 , 0.005 , 0.11 . Adhering to the clinical standard that mandates US-scanning behavior to have a contact force of less than 15 N, the target contact force is set as f g o a l = 10   N , and the contact force derivative is set as f g o a l = 0   N / s . Similarly, the target velocity is set to V g o a l = 0.06   m / s , and the acceleration is set to 0   m / s 2 . To ensure sufficient contact between the US-probe and the soft body model, the z-axis scanning height is set to Z g o a l = 0.895   m . This value is slightly lower than the overall height of the body model plus the table, which is 0.9 m. We chose appropriate parameter settings to guarantee the US-probe consistently making full contact with the soft body model in the z-direction each time it moves towards the target position, thereby achieving the scanning objective. For the soft body model, stiffness and damping are set as variables with values of (1300, 60), and multiple data sets are used for training and testing.
Building upon the aforementioned design of the reward function, further configuration of the training process is required. To accelerate the training process, three termination conditions depicted in Figure 6 are proposed, allowing the training process to concentrate on the target task and avoid expending time on other complex states in the simulation environment. In this simulation environment, real-time access to various state parameters of the robot is feasible, including joint positions and orientations, joint linear velocity and acceleration, end-effector forces and torques, US-probe contact forces and torques, as well as parameters related to tangential and normal contact forces. Treating each scanning process as an episode, we used these parameters to determine whether the US-probe was in contact with the soft body model. Once proper contact is established, random scanning can be initiated with a constant contact force, constant velocity, and a direction perpendicular to the contact surface of the soft body model. The scanning episode concludes when the US-probe deviates from the trajectory, loses contact with the soft body model, or reaches joint limits.

2.4. Piercing Needle Identification

After determining the puncture angle, the physician must manually perform a puncture procedure based on the specified angle of the end-effector. To visualize the real-time status and spatial position of the puncture needle in the human body, the scanning surface of the US-probe and the puncture needle should be in the same plane. We designed the end-effector to always keep the needle within range of the ultrasonic scan. Based on this, a real-time detection and localization strategy for intraoperative puncture needles is presented using US-imaging. This strategy assists surgeons in performing operations and increases puncture accuracy by providing visual information on the position and orientation of the needle. Medical image segmentation with deep learning, particularly the U-Net architecture, has gained significant attention in academic research [33]. However, the segmentation target, that is, the puncture needle, is a small and thin object compared to the entire image, making it prone to loss during the down- and up-sampling procedures of deep networks, resulting in lower segmentation accuracy.
In 2018, Ozan Oktay et al. [34] introduced Attention U-Net, which selectively processes the output features of the encoder before concatenating them with the corresponding features in the decoder. In 2019, Zhou et al. [35] improved upon the UNet++ model by incorporating multiple levels of image characteristics through layered sub-networks and long-short connections for multi-feature fusion.
Furthermore, the combination of a flexible network topology and a deep supervision mechanism allows deep networks with numerous parameters to significantly reduce the number of parameters while still achieving acceptable accuracy. We employ 5 metrics to evaluate the accuracy of the predicted needle trajectories: dice score, precision, sensitivity, angular root-mean-square error (AE, in degrees), and distance root-mean-square error (DE, in centimeters). AE is calculated based on the deviation angle between the segmentation result and the true value, while DE is calculated using the difference in distance between the centroid of the segmentation result and the true value, relative to the image center. As shown in Table 1, UNet++ outperforms other models in these 5 metrics and is more suitable for this detection task.
Figure 7 illustrates the complete experimental process of real-time detection and positioning of the puncture needle. A total of 1230 US images were collected to evaluate the efficiency of the network, with 984 images used for training and 246 images used for testing. Initially, a US-probe was employed to capture the video stream, resulting in a frame with dimensions of 1280 × 1024 pixels (see Figure 7a,b). Subsequently, the original image’s shortened region of interest (ROI) (512 × 512 pixels), which contains the segmented target, was sent to the UNet++ network (Figure 7c). The segmentation outcome is shown in Figure 7d. Due to variations in experimental settings and potential interference in real tests, we need post-processing of the deep learning results to identify the potential location of the puncture needle. In the experimental results, the puncture needle often occupies a relatively large, connected area. Therefore, we traversed each connected area and eliminated smaller areas based on a threshold to obtain accurate segmentation results for the puncture needle (Figure 7e).
To calculate the puncture trajectory in real time, the detection findings are fitted into a straight line, and it is determined whether it reaches the target. Pixel points with values greater than 0 in the accurately segmented image are removed, and their coordinates are used for linear fitting based on the area of the penetrated needle obtained in the previous phase. The linear fitting coefficient is expressed as follows:
    a = x i , j x ¯ y i , j y ¯ x i , j x ¯ 2 ,
  b = y ¯ a x ¯ ,
where x i , j denotes the horizontal coordinate of the pixel point of the segmented image at ( i , j ) , y i , j denotes the vertical coordinate of the pixel point of the segmented image at ( i , j ) , x ¯ is the mean of all horizontal coordinates, and y ¯ is the mean value of all vertical coordinates. Figure 7f shows the image after the linear fit process, where the green line in Figure 7d represents the position of the puncture needle in real time.

3. Experiments and Results

3.1. Flexible Traction Experiment

We conducted a traction experiment to evaluate the performance of the adaptive admittance control algorithm employed on the US-scanning robot. The experiment involved following a predetermined trajectory, named the three-leaf rose trajectory, as described by the following equation:
x = 0.13 sin 3 θ cos θ y = 0.13 sin 3 θ sin θ
As shown in Figure 8a, the three-leaf rose trajectory introduces continuous changes in the direction of the applied force, which places additional demands on the flexibility of the robotic arm when compared to a standard circular trajectory. The operator starts from the center of the three-leaf rose and drags the end-effector along the indicated route, marked by red arrows. The movement begins from left to right and then proceeds downward before returning to the endpoint. This complex trajectory requires a continuous change in direction, and only the robotic arm is flexible and stable enough to follow the trajectory smoothly, while the method is more intuitive to show the excellent performance of the system.
Figure 8b depicts the experimental setup for flexible traction. The US-probe (DC-8 Pro, Mindary Co., Ltd., Shenzhen, China) is affixed to the end of the UR5e robotic arm, and the trajectory diagram is placed beneath it on an A4 paper. Three comparison experiments were conducted to assess the system’s adaptability, using traditional impedance control, admittance control, and adaptive admittance control algorithms, respectively.
The adaptive admittance control algorithm was configured with the following settings, based on Equation (5) and the findings from actual testing:
a = 4 b = 2 c = 1 B m a x = 5 ,
We adjusted the damping variation range from 25 Nm/s to 100 Nm/s, while the coefficient M was defined as 0.6 kg. The parameter settings for the standard impedance control algorithm closely resemble those for the adaptive control technique, except for the fixed damping. In this experiment, we adjusted the damping B coefficient to 35 Nm/s. The typical impedance control algorithm, described by Equation (2), employed the following parameter settings:
M 1 = 5 0 0 0 0 0 5 0 0 0 0 0 5 0 0 0 0 0 5 0 0 0 0 0 5 × 0.1 ,
D 1 = 5 0 0 0 0 0 5 0 0 0 0 0 5 0 0 0 0 0 5 0 0 0 0 0 5 × 5 ,
K 1 = 1 0 0 0 0 0 1 0 0 0 0 0 1 0 0 0 0 0 1 0 0 0 0 0 1 × 10 .
Five repeated tests are carried out for each control method based on the previous parameter choices. We use the trapezoidal area algorithm to determine the overlap area between the experimental pathways and the reference path specifically, yielding the path tracking error. The algorithm’s overall performance is assessed by comparing the scanning execution time, scanning trajectories, and computed route tracking errors.
We can observe the performance of each control method in dragging the robotic arm along a predetermined path in Figure 9. Figure 9a–c illustrate the actual motion trajectories obtained with standard impedance control, standard admittance control, and adaptive admittance control, respectively. The green line represents the actual motion trajectories of the US-probe, while the red section indicates the predetermined target trajectory. It is worth noting that the scanning trajectory produced by the proposed adaptive admittance algorithm demonstrates smoother motion and better alignment with the reference value, in contrast to the significant jitter observed in the trajectories generated by standard admittance control and impedance control. Additionally, the adaptive impedance control algorithm exhibits the lowest trajectory tracking errors (Figure 9d) and the fastest average execution time (Figure 9e).
In Figure 9f, the dynamic modification of the damping coefficient is shown. This modification is based on the velocity of the end-effector, which is measured by a sensor. When the velocity crosses a critical threshold, the damping coefficient decreases rapidly, following a negative exponential gradient. This reduction in damping enhances the flexibility of the robotic arm and reduces the execution time. As a result, the operator can easily drag the arm with minimal force. Maintaining a consistent damping coefficient throughout the dragging process would not provide enough flexibility for the complex three-leafed rose route with an envelope radius of 13 cm. However, the adaptive admittance control algorithm proposed in this work offers not only high flexibility but also minimizes the dragging force according to the operator’s desire. This algorithm improves the smoothness and safety of the positioning process by allowing the operator to have better control over the arm’s movements.

3.2. Reinforcement Learning-Based US-Scanning Experiment

This experiment is conducted using the MuJoCo simulator on an Ubuntu 18.04 operating system. The hardware setup comprises an Intel (R) Xeon (R) Silver 4216 CPU running at 2.10 GHz and a GeForce RTX 2080 Ti GPU. The training process consists of 40,000 episodes, with each episode lasting 1000 timesteps, resulting in a total of 40 million timesteps.
Figure 10 illustrates the training curve, with the average episode reward represented by the blue line and the average number of survived steps per episode depicted by the red line.
Figure 11 presents the observation curve for the training parameters of the PPO algorithm. Specifically, Figure 11a displays the clip fraction, which is closely related to the policy loss. Meanwhile, Figure 11b illustrates the entropy loss, representing the loss of information entropy. The explained variance is depicted in Figure 11c, while Figure 11d shows the train loss, which combines the policy, value, and entropy losses with specific weight values. Additionally, Figure 11e showcases the policy gradient loss, and Figure 11f displays the value loss. The training curves in this section were generated using the stable-baselines3’s PPO algorithm with predetermined parameter settings. We used the TensorBoard tool to capture and visualize these curves. The train loss, as defined by Equation (26), incorporates the aforementioned weight values denoted by v f and e n t _ c o e f .
T r a i n l o s s = v f × V a l u e l o s s + P o l i c y l o s s + e n t c o e f × E n t r o p y l o s s .
To validate the model’s speed tracking ability, force control effectiveness, and overall stability, a fixed trajectory scanning experiment was conducted. The trained model autonomously controls the robotic arm to scan along a specified trajectory, with the start and end points determining the path, while the height along the z-axis remains constant. In the same environment, the scanning procedure begins by following the initial trajectory, which covers a round trip from the starting point to the ending point. Figure 12a exhibits the actual force tracking performance at the end-effector during a complete round-trip trial. The scanning speed was set to 0.06 m/s. The x-axis represents 1000 timesteps within a single episode, and the y-axis represents the scanning speed at the end-effector of the robotic arm. This scanning speed is calculated by multiplying the end-effector velocity values in the x, y, and z directions. Furthermore, Figure 12b presents the absolute value of the contact force in the z-axis direction between the end-effector and the soft body model during an episode, with a target contact force of 10 N. The x-axis denotes 1000 timesteps within a single episode, and the y-axis represents the amplitude of the contact force between the robotic arm’s US-scanning mechanism and the soft body model in the z-axis direction. The curve generally converges towards the desired contact force of 10 N, with minor oscillations around this value. Lastly, Figure 12c displays the three-dimensional spatial position of the end of the US-probe during the episode.
Figure 13 shows an extensive analysis of the spatial position changes in the x, y, and z dimensions during the scanning process. It displays the robotic arm’s sequential action as it descends from the air, contacts the soft body model, and performs the scanning procedure. Figure 13 methodically details the robotic arm’s precise spatial location alterations at each stage of the procedure.
The positional deviation in the x-direction shown in Figure 13 ranges from −0.30 m to −0.029 m, with a deviation of 0.001 m. In the y direction, the positional deviation ranges from −0.076 m to −0.074 m, with a deviation of 0.002 m. The US-probe exhibits fluctuation in the z direction, with a range of 0.898 m to −0.900 m and a deviation of 0.002 m. The soft body model, in conjunction with a tabletop height of 0.9 m, ensures sufficient contact between the US-probe and the soft body model, enabling stable scanning in the x, y, and z dimensions.
This study conducted three comparison experiments involving a control group and two experimental groups to further assess the impact of varying stiffness and damping parameters of the soft body model on the stability of the US-scanning robot. In the control group, the soft body model used a damping configuration of (1300, 20). Experimental Group 1 employed a higher damping coefficient while maintaining the stiffness constant at (1300, 60), while Experimental Group 2 used a lower stiffness while keeping the damping constant at (600, 20). Figure 14a illustrates the velocity tracking stability under the three experimental conditions, aiming to validate the US-scanning performance of the robot across multiple stiffness and damping configurations. The red curve represents the control experiment, showing low variations in scanning velocity under the specified stiffness and damping parameters. The green curve corresponds to the comparative experiment with increased damping, while the blue curve corresponds to the comparative experiment with decreased rigidity.
Figure 14b demonstrates the contact force between the robotic arm’s end-effector and the soft body model under the three experimental conditions. The horizontal axis represents the duration of the episode, while the vertical axis reflects the magnitude of the contact force in Newtons (N). The red curve depicts the control experiment, which exhibited improved scanning performance after multiple tests under the specified stiffness and damping conditions. The blue curve corresponds to the comparative experiment with increased damping, while the green curve corresponds to the comparative experiment with decreased stiffness.

4. Discussion

We developed a novel robot-assisted system that incorporates autonomous US-scanning and puncture needle localization. The US-guided surgical technique is divided into two stages: preoperative flexible traction positioning and autonomous scanning driven by reinforcement learning. After determining the location of the lesion and the angle for needle insertion through autonomous US-scanning, a real-time needle localization system is implemented to assist physicians during percutaneous needle insertion. To enhance the smoothness and safety of the preoperative traction and positioning process, we introduced an adaptive admittance control algorithm for end-effector space manipulation, allowing medical physicians to manipulate the robotic arm with lower damping and higher speed. The use of the Proximal Policy Optimization (PPO) reinforcement learning method ensures consistent contact force and constant speed during autonomous scanning. Additionally, we addressed the challenge of inaccurate percutaneous needle insertion by introducing a real-time needle localization method based on the UNet++ algorithm, which effectively resolved difficulties associated with obtaining precise needle position and orientation during the percutaneous procedure.
In the experimental part, we conducted the flexible traction experiment to demonstrate the flexibility and stability of our proposed flexible traction positioning algorithm in comparison with other algorithms. The reinforcement learning-based sweeping experiment showcased the stability and robustness of the sweeping system, which can sweep at a constant speed and pressure while adapting autonomously. We also experimented with selecting the UNet++ algorithm appropriate for the real-time puncture needle localization system during the puncture process, successfully achieving real-time puncture needle localization. To decrease the gap between simulation and reality and improve the strategy’s performance, we created a deformable physics model that simulates human tissue deformation on the surface of the skin and respiratory motion during the reinforcement learning training. This has numerous potential medical research applications that are continuously being studied.

5. Conclusions

This research aimed to develop an integrated, autonomous US-probe scanning and needle localization system to meet the clinical requirements of US examinations and percutaneous puncture operations. Reinforcement learning and the UNet++ algorithm were used for autonomous scanning and real-time puncture needle localization, respectively.
Figure 9 shows experimental results based on three-leafed rose traction trajectories that verify the flexibility and stability of our proposed flexible traction localization algorithm. According to the experimental results based on reinforcement learning sweeping in Figure 12 and Figure 13, it is proven that not only can sweeping be carried out at constant speed and pressure but also has the ability of self-adaptation. This is a strong indication of the feasibility of reinforcement learning for the sweeping task. This research primarily focuses on flexible traction positioning algorithms and autonomous scanning based on reinforcement learning, and the real-time positioning function of the puncture needle is also a specific application based on the above algorithms.
Nevertheless, this autonomous ultrasound scanning system can have more possibilities in the clinic. For instance, the autonomous scanning can be activated according to the pathological information to find the lesions accurately; adaptive adjustments of the contact force can be made to perform ultrasound examinations on different parts of the human body; and ultrasound examination and assisted remote surgery can be provided in the field of telemedicine.
In conclusion, a low-cost, efficient, and effective system with three parts—a flexible traction positioning algorithm, autonomous scanning, and real-time puncture needle localization—was developed to intelligently assist the US-scanning and puncture localization. Our forthcoming study will focus on sim2real studies to translate the reinforcement learning models from the simulation environment to the real clinical setting.

Author Contributions

Conceptualization, T.L. and Q.Z.; methodology, T.L., J.L. (Jinbiao Li) and Q.Z.; validation, J.L. (Jian Lu), C.Q. and H.Y.; investigation, J.L. (Jinbiao Li), Y.Z. and H.Y.; resources, J.L. (Jian Lu) and Y.Z.; writing—original draft preparation, T.L.; writing—review and editing, S.Z., Y.Z. and J.L. (Jian Lu); supervision, S.Z. All authors have read and agreed to the published version of the manuscript.

Funding

This research was supported in part by the National Key R&D Project of China (Nos. 2018YFA0704102 and 2018YFA0704104), in part by the National Natural Science Foundation of China (No. 81827805), in part by the Natural Science Foundation of Guangdong Province (No. 2023A1515010673), in part by the Shenzhen Technology Innovation Commission (Nos. JCYJ20200109114610201, JCYJ20200109114812361, and JSGG20220831110400001), and in part by the Shenzhen Engineering Laboratory for Diagnosis & Treatment Key Technologies of Interventional Surgical Robots (XMHT20220104009).

Data Availability Statement

The data are unavailable due to privacy or ethical restrictions.

Conflicts of Interest

The authors declare no conflicts of interest.

Appendix A

SymbolsMeaning
F e x t ambient stress exerted on the six-dimensional force transducer
x e the difference between the actual position and the desired position
x e ¨ the second-order derivative of x e
x e ˙ the first-order derivative of x e
K, B, and Mthe stiffness coefficients, damping coefficients, and inertia coefficients
M q robot mass matrix
C q ˙ , q centrifugal and coriolis forces
g q the gravitational moment
τ the joint torque
a the initial impedance coefficient
b the impedance coefficient drop
c the minimum value
B m a x the maximum value of the impedance coefficient
a 1 ,   v ,   x the acceleration, velocity, and position difference
k ,   b ,   d the stiffness, damping, and impedance
a 0 the unforced acceleration
π θ a t s t / π o l d a t s t the ratio of the new policy to the old policy
A ^ t s , a the estimated amount of dominance function
W i the weights assigned to each reward item
R i the rewards of each individual component
d q t , q g o a l , t distance metric representing two quaternions
x i , j the horizontal coordinate of the pixel point of the segmented image at ( i , j )
y i , j the vertical coordinate of the pixel point of the segmented image at ( i , j )

References

  1. Chen, F.; Liu, J.; Liao, H. 3D catheter shape determination for endovascular navigation using a two-step particle filter and ultrasound scanning. IEEE Trans. Med. Imaging 2016, 36, 685–695. [Google Scholar] [CrossRef]
  2. Bowness, J.; Varsou, O.; Turbitt, L.; Burkett-St Laurent, D. Identifying anatomical structures on ultrasound: Assistive artificial intelligence in ultrasound-guided regional anesthesia. Clin. Anat. 2021, 34, 802–809. [Google Scholar] [CrossRef]
  3. Stukan, M.; Rutkowski, P.; Smadja, J.; Bonvalot, S. Ultrasound-Guided Trans-Uterine Cavity Core Needle Biopsy of Uterine Myometrial Tumors to Differentiate Sarcoma from a Benign Lesion—Description of the Method and Review of the Literature. Diagnostics 2022, 12, 1348. [Google Scholar] [CrossRef]
  4. Mori, S.; Hirano, K.; Yamawaki, M.; Kobayashi, N.; Sakamoto, Y.; Tsutsumi, M.; Honda, Y.; Makino, K.; Shirai, S.; Ito, Y. A comparative analysis between ultrasound-guided and conventional distal transradial access for coronary angiography and intervention. J. Interv. Cardiol. 2020, 2020, 7342732. [Google Scholar] [CrossRef]
  5. Cardinal, H.N.; Gill, J.D.; Fenster, A. Analysis of geometrical distortion and statistical variance in length, area, and volume in a linearly scanned 3-D ultrasound image. IEEE Trans. Med. Imaging 2000, 19, 632–651. [Google Scholar] [CrossRef]
  6. Evans, K.; Roll, S.; Baker, J. Work-related musculoskeletal disorders (WRMSD) among registered diagnostic medical sonographers and vascular technologists: A representative sample. J. Diagn. Med. Sonogr. 2009, 25, 287–299. [Google Scholar] [CrossRef]
  7. Akbari, M.; Carriere, J.; Meyer, T.; Sloboda, R.; Husain, S.; Usmani, N.; Tavakoli, M. Robotic ultrasound scanning with real-time image-based force adjustment: Quick response for enabling physical distancing during the COVID-19 pandemic. Front. Robot. AI 2021, 8, 645424. [Google Scholar] [CrossRef] [PubMed]
  8. Huang, Q.; Lan, J.; Li, X. Robotic arm based automatic ultrasound scanning for three-dimensional imaging. IEEE Trans. Ind. Inform. 2018, 15, 1173–1182. [Google Scholar] [CrossRef]
  9. Virga, S.; Zettinig, O.; Esposito, M.; Pfister, K.; Frisch, B.; Neff, T.; Navab, N.; Hennersperger, C. Automatic force-compliant robotic ultrasound screening of abdominal aortic aneurysms. In Proceedings of the 2016 IEEE/RSJ International Conference on Intelligent Robots and Systems (IROS), Daejeon, Republic of Korea, 9–14 October 2016; pp. 508–513. [Google Scholar]
  10. Pan, Z.; Tian, S.; Guo, M.; Zhang, J.; Yu, N.; Xin, Y. Comparison of medical image 3D reconstruction rendering methods for robot-assisted surgery. In Proceedings of the 2017 2nd International Conference on Advanced Robotics and Mechatronics (ICARM), Hefei and Tai’an, China, 27–31 August 2017; pp. 94–99. [Google Scholar]
  11. Giuliani, M.; Szczęśniak-Stańczyk, D.; Mirnig, N.; Stollnberger, G.; Szyszko, M.; Stańczyk, B.; Tscheligi, M. User-centred design and evaluation of a tele-operated echocardiography robot. Health Technol. 2020, 10, 649–665. [Google Scholar] [CrossRef]
  12. Kojcev, R.; Fuerst, B.; Zettinig, O.; Fotouhi, J.; Lee, S.C.; Frisch, B.; Taylor, R.; Sinibaldi, E.; Navab, N. Dual-robot ultrasound-guided needle placement: Closing the planning-imaging-action loop. Int. J. Comput. Assist. Radiol. Surg. 2016, 11, 1173–1181. [Google Scholar] [CrossRef] [PubMed]
  13. Culjat, M.; Singh, R.; Lee, H. Medical Devices: Surgical and Image-Guided Technologies; John Wiley & Sons: Hoboken, NJ, USA, 2012. [Google Scholar]
  14. Nadeau, C.; Krupa, A.; Petr, J.; Barillot, C. Moments-based ultrasound visual servoing: From a mono-to multiplane approach. IEEE Trans. Robot. 2016, 32, 1558–1564. [Google Scholar] [CrossRef]
  15. Mohamed, A.; Sami, A.; Santosha, D. Event-Triggered Adaptive Hybrid Position-Force Control for Robot-Assisted Ultrasonic Examination System. J. Intell. Robot. Syst. 2021, 102, 84. [Google Scholar]
  16. Fabian, J.; Garcia-Cardenas, F.; Canahuire, R.; Ramos, O.E. Sensorless Impedance Control for the UR5 Robot. In Proceedings of the 2020 International Conference on Control, Automation and Diagnosis (ICCAD), Paris, France, 7–9 October 2020; pp. 1–6. [Google Scholar]
  17. Piwowarczyk, J.; Carriere, J.; Adams, K.; Tavakoli, M. An admittance-controlled force-scaling dexterous assistive robotic system. J. Med. Robot. Res. 2020, 5, 2041002. [Google Scholar] [CrossRef]
  18. Carriere, J.; Fong, J.; Meyer, T.; Sloboda, R.; Husain, S.; Usmani, N.; Tavakoli, M. An admittance-controlled robotic assistant for semi-autonomous breast ultrasound scanning. In Proceedings of the 2019 International Symposium on Medical Robotics (ISMR), Atlanta, GA, USA, 3–5 April 2019; pp. 1–7. [Google Scholar]
  19. von Haxthausen, F.; Böttger, S.; Wulff, D.; Hagenah, J.; García-Vázquez, V.; Ipsen, S. Medical robotics for ultrasound imaging: Current systems and future trends. Curr. Robot. Rep. 2021, 2, 55–71. [Google Scholar] [CrossRef] [PubMed]
  20. Avgousti, S.; Panayides, A.S.; Jossif, A.P.; Christoforou, E.G.; Vieyres, P.; Novales, C.; Voskarides, S.; Pattichis, C.S. Cardiac ultrasonography over 4G wireless networks using a tele-operated robot. Health Technol. Lett. 2016, 3, 212–217. [Google Scholar] [CrossRef] [PubMed]
  21. Georgescu, M.; Sacccomandi, A.; Baudron, B.; Arbeille, P.L. Remote sonography in routine clinical practice between two isolated medical centers and the university hospital using a robotic arm: A 1-year study. Telemed. e-Health 2016, 22, 276–281. [Google Scholar] [CrossRef] [PubMed]
  22. Adams, S.J.; Burbridge, B.E.; Badea, A.; Langford, L.; Vergara, V.; Bryce, R.; Bustamante, L.; Mendez, I.M.; Babyn, P.S. Initial experience using a telerobotic ultrasound system for adult abdominal sonography. Can. Assoc. Radiol. J. 2017, 68, 308–314. [Google Scholar] [CrossRef] [PubMed]
  23. Shahid, A.A.; Piga, D.; Braghin, F.; Roveda, L. Continuous control actions learning and adaptation for robotic manipulation through reinforcement learning. Auton. Robot. 2022, 46, 483–498. [Google Scholar] [CrossRef]
  24. Ning, G.; Zhang, X.; Liao, H. Autonomic robotic ultrasound imaging system based on reinforcement learning. IEEE Trans. Biomed. Eng. 2021, 68, 2787–2797. [Google Scholar] [CrossRef]
  25. Priester, A.M.; Natarajan, S.; Culjat, M.O. Robotic ultrasound systems in medicine. IEEE Trans. Ultrason. Ferroelectr. Freq. Control 2013, 60, 507–523. [Google Scholar] [CrossRef]
  26. Zhao, W.; Queralta, J.P.; Westerlund, T. Sim-to-real transfer in deep reinforcement learning for robotics: A survey. In Proceedings of the 2020 IEEE Symposium Series on Computational Intelligence (SSCI), Canberra, ACT, Australia, 1–4 December 2020; pp. 737–744. [Google Scholar]
  27. Schulman, J.; Ho, J.; Lee, C.; Abbeel, P. Generalization in robotic manipulation through the use of non-rigid registration. In Proceedings of the 16th International Symposium on Robotics Research (ISRR), Singapore, 16–19 December 2013. [Google Scholar]
  28. Martín-Martín, R.; Lee, M.A.; Gardner, R.; Savarese, S.; Bohg, J.; Garg, A. Variable impedance control in end-effector space: An action space for reinforcement learning in contact-rich tasks. In Proceedings of the 2019 IEEE/RSJ International Conference on Intelligent Robots and Systems (IROS), Macau, China, 3–8 November 2019; pp. 1010–1017. [Google Scholar]
  29. Wu, M.; He, Y.; Liu, S. Adaptive impedance control based on reinforcement learning in a human-robot collaboration task with human reference estimation. Int. J. Mech. Control 2020, 21, 21–31. [Google Scholar]
  30. Buchli, J.; Stulp, F.; Theodorou, E.; Schaal, S. Learning variable impedance control. Int. J. Robot. Res. 2011, 30, 820–833. [Google Scholar] [CrossRef]
  31. Todorov, E.; Erez, T.; MuJoCo, Y. A physics engine for model-based control. In Proceedings of the 2012 IEEE/RSJ International Conference on Intelligent Robots and Systems, Vilamoura-Algarve, Portugal, 7–12 October 2012; pp. 5026–5033. [Google Scholar]
  32. Schulman, J.; Wolski, F.; Dhariwal, P.; Radford, A.; Klimov, O. Proximal policy optimization algorithms. arXiv 2017, arXiv:1707.06347. [Google Scholar]
  33. Ronneberger, O.; Fischer, P.; Brox, T. U-net: Convolutional networks for biomedical image segmentation. In Medical Image Computing and Computer-Assisted Intervention–MICCAI 2015: 18th International Conference, Munich, Germany, 5–9 October 2015, Proceedings, Part III 18; Springer: Cham, Switzerland, 2015; pp. 234–241. [Google Scholar]
  34. Oktay, O.; Schlemper, J.; Folgoc, L.L.; Lee, M.; Heinrich, M.; Misawa, K.; Mori, K.; McDonagh, S.; Hammerla, N.Y.; Kainz, B.; et al. Attention u-net: Learning where to look for the pancreas. arXiv 2018, arXiv:1804.03999. [Google Scholar]
  35. Zhou, Z.; Siddiquee, M.M.R.; Tajbakhsh, N.; Liang, J. Unet++: Redesigning skip connections to exploit multiscale features in image segmentation. IEEE Trans. Med. Imaging 2019, 39, 1856–1867. [Google Scholar] [CrossRef] [PubMed]
Figure 1. The overall structure of the autonomous ultrasound imaging and percutaneous puncture-assisted localization system.
Electronics 13 00580 g001
Figure 2. Damping curve of the adaptive admittance control algorithm where the blue area indicates that the maximum impedance value has been reached and the green area indicates that the impedance value changes with velocity.
Electronics 13 00580 g002
Figure 3. Simulation system of autonomous US-scanning control based on reinforcement learning. The flow diagram framework includes the simulation environment (blue), the reinforcement learning algorithm (yellow), and the robot controller (red). The environment includes the UR5e robotic arm, soft contact model, end-effector, and environment scene. The simulation environment’s state information is fed into the reinforcement learning system, and the manipulator’s action is output. The operational space controller (OSC) is used to input to the manipulator by mapping the actions to the manipulator controller via standardization in conjunction with the flexible control method.
Electronics 13 00580 g003
Figure 4. Soft contacts model based on MuJoCo design, where the left image represents the soft contacts body model composed of a particle system with flexible rods internally, the middle image represents spatial coordinate systems for each rod structure, and the right image showcases a soft body model with added skin elements.
Electronics 13 00580 g004
Figure 5. The end-effector mechanism, which has US-probe gripping capability and percutaneous puncture-assisted localization function, is connected to the end of the UR5e robotic arm. (a) The mechanical structure of the end-effector mechanism; (b) the rendered actual effect, and (c) the end-effector mechanism with added force and torque sensors in the MuJoCo simulation environment.
Electronics 13 00580 g005
Figure 6. Early termination conditions set for the training process.
Electronics 13 00580 g006
Figure 7. The real-time detection and positioning system for the puncture needle.
Electronics 13 00580 g007
Figure 8. Traction experiment for the adaptive admittance control algorithm. (a) Three-leafed rose traction trajectories where the arrows represent the direction of the trajectory and (b) a diagram of the experimental setup for flexible traction.
Electronics 13 00580 g008
Figure 9. (a) Trajectory diagram of standard impedance control, (b) trajectory diagram of standard admittance control, (c) trajectory diagram of adaptive admittance control, (d) trajectory errors of different control methods, (e) execution time of different control modes, and (f) adaptive damping adjustment process.
Electronics 13 00580 g009
Figure 10. Reinforcement learning training curves.
Electronics 13 00580 g010
Figure 11. Observation curve for the training parameters of reinforcement learning procedure. (a) The policy function loss, (b) the information entropy loss, (c) the explained variance, (d) the train loss; (e) the policy gradient loss, and (f) the value loss.
Electronics 13 00580 g011
Figure 12. (a) The velocity following diagram at the end of the manipulator where the horizontal dotted line indicates the target End_vel, (b) the contact force following diagram in the z-direction at the end of the manipulator where the horizontal dotted line indicates the target contact force, and (c) the end of the US-probe that follows and records the three-dimensional spatial location along the trajectory connecting the start and end points where the green line represents the projection of the trajectory in the xz plane; the red line represents the projection of the trajectory in the xy plane.
Electronics 13 00580 g012
Figure 13. The spatial position variations of the US-probe’s end in the (ac) x, y, and z directions.
Electronics 13 00580 g013
Figure 14. (a) The end-effector’s velocity variation during scanning under various stiffness and dampening settings where the horizontal dotted line indicates the target velocity and (b) the changes in contact force along the z-axis between the US-probe’s end-effector and the soft body model for various stiffness and damping settings where the horizontal dotted line indicates the target contact force.
Electronics 13 00580 g014
Table 1. Performance comparison of each network.
ModelBest DicePrecisionSensitivityAEDE
Unet [33]0.8060.9030.7320.9200.208
AttentionUNet [34]0.7900.8920.7130.3610.259
UNet++ [35]0.8280.9190.7590.2700.068
Disclaimer/Publisher’s Note: The statements, opinions and data contained in all publications are solely those of the individual author(s) and contributor(s) and not of MDPI and/or the editor(s). MDPI and/or the editor(s) disclaim responsibility for any injury to people or property resulting from any ideas, methods, instructions or products referred to in the content.

