Article

Specific Emitter Identification Based on Attractor Feature Space of System under Blind Equalization

1
College of Electronic Countermeasures, National University of Defense Technology, Hefei 230037, China
2
36th Research Institute of China Electronics Technology Group Corporation, Jiaxing 314033, China
*
Author to whom correspondence should be addressed.
Electronics 2024, 13(3), 611; https://doi.org/10.3390/electronics13030611
Submission received: 25 December 2023 / Revised: 27 January 2024 / Accepted: 29 January 2024 / Published: 1 February 2024

Abstract

:
In the process of the individual identification of radiation sources, the effective extraction of fine features of target radiation sources can be regarded as being crucial for the subsequent individual identification. However, in the complex electromagnetic environment, the effective extraction of the radiation source features is still facing great challenges. To solve this problem, we propose an algorithm for constructing the attractor feature space of the radiation source system based on blind equalization to solve this problem. Firstly, we use blind equalization to process the target signal. Secondly, we use the phase-space reconstruction technique to construct the system attractor feature space of the target signal processed, and explore the adaptive relationship between feature-space-embedding dimensions, the delay time and the neural network, finding the optimal values. Finally, the feature space is used as the input of the neural network for the subsequent individual discrimination decision. Experimentally, it is proved that our proposed algorithm improves the individual recognition rate of the target radiation source under the complex electromagnetic environment to a certain extent, which is of practical application value.

1. Introduction

The specific emitter identification (SEI) technique is of great practical value, as it can discover and identify the target signal of interest and associate it with the source target, its carrier platform and the user’s identity without relying on the connotation information, in the presence of information encryption, connotation deficiencies and the dynamic allocation of channel resources [1]. As they do not rely on the decoding of embedded intelligence, SEI techniques play an important role in addressing the challenges posed by the application of technical means such as the information encryption, dynamic allocation of channel resources and shortcutting of signal parameters for a radiation source target identification. Among these, SEI techniques often utilize the extracted fingerprint characteristics of the individual radiation source for identification, which refers to the unique electromagnetic characteristics of the radiation source when emitting radio waves, and these characteristics can be obtained by analyzing the radio waves emitted by the radiation source. Specifically, the fingerprint features can include the spectrum features, time domain features, spatial features and modulation features of the radiation source, etc. Through the analysis and comparison of these fingerprint features, the monitoring and control of radio waves can be achieved.
Communication Emitter Identification refers to the identification of individual attributes of different communication radiation sources based on the communication signals emitted by wireless communication devices. The communication radiation source individual identification technology is based on the radio frequency fingerprint feature. Since the feature is inevitable, difficult to forge and does not depend on the content information of the communication signal itself, the communication radiation source individual identification, as a key technology, has an important position in both civil and military fields.
In the individual identification of communication radiation sources, the research at home and abroad mainly includes two categories. The first category is where the signal samples are recognized after some preprocessing. In the literature of [2], the authors extracted the “turn-on” transient signal features of the radio station by the wavelet transform and used a neural network classifier for the subsequent classification, but the performance of this method declines seriously under the condition of the low signal-to-noise ratio (SNR). The literature of [3] proposes a deep convolutional neural network model based on a multi-signal feature fusion to identify the emission source. In terms of signal preprocessing, the singular spectrum analysis (SSA), variational mode decomposition (VMD) and inherent time scale decomposition (ITD) are used to extract signal variables, and different signal features are fused. The experimental results show that the algorithm can improve the accuracy of the radiation source identification to some extent. In the literature [4], the authors applied deep learning to electromagnetic fingerprint extraction, and constructed a pre-transformation network suitable for electromagnetic signals for the collected addressing signals between civil aircraft and airport towers, converting one-dimensional signals into two-dimensional feature maps, and then inputting the feature maps into the neural network for classification, but this method is also accomplished in a relatively ideal situation. In the literature of [5], the authors proposed a feature extraction method for HPLC communication signals based on a genetic algorithm, the feature quantity containing the topological line state is optimized, and the feature quantity which is closer to the real state of the topological line is obtained, which improves the effect of the final recognition and localization; however, this method is only suitable for the HPLC signal. The literature of [6] proposes an SEI algorithm based on signal track images. It first analyzes the visual features of multi-emitter defects in signal track images, and then uses the gray level image of the signal track as a signal representation to represent the fingerprint features of signals for subsequent recognition. The proposed method overcomes the limitations of existing knowledge and combines the high information integrity with low computational complexity.
The second category is the method of directly constructing a deep learning model for recognition. In the literature [7], the authors constructed a one-dimensional deep convolutional model integrating multiple sub-networks, using the ability of deep neural networks to automatically characterize and dispense with the expert knowledge-based feature extraction, and to automatically obtain individual features from radio timing signals, thereby identifying radio individuals in an end-to-end format. The literature of [8] proposed a new complex Fourier neural operator (CFNO), which introduced the time domain and frequency domain attention mechanism, and used CFNO blocks to fully learn features from different domains. The CFNO operator was integrated into the convolutional neural network in experiments, and the superiority of the algorithm is proved by comparing with other models. The literature of [9] proposes a deep scattering network (DSN) based on a fractional wavelet transform (FWT), which regards FWT as a set of linear translation invariant filters, effectively solving the problem that DSN is suitable for stationary signal processing but not for non-stationary signal processing. In the experiment, the recognition effect of the stationary signal and non-stationary signal is compared to verify the effectiveness of the proposed method. In the literature of [10], the unsupervised neural network NEGAN was proposed to reduce the dependence on the data set quality, obtain accurate and clean RF fingerprint features from signals with noise, optimize the waveform and classifier structure, and obtain better performance with lower complexity and lower cost.
The above SEI techniques have the ability to effectively represent the relevant features of the communication radiation source to a certain extent, and to construct a classification and identification model with strong adaptive ability, but it is limited to the electromagnetic environment in which the signal located is too ideal, and does not conform to the signal transmission situation in reality. From the perspective of the current research on the individual identification of radio radiation sources, there are two main problems: First, due to the adverse factors such as multi-path effect and noise in the complex electromagnetic environment, most SEI methods cannot effectively extract the fingerprint characteristics of individual radiation sources. Second, the radiation source classifier model does not treat the fingerprint features as inputs with divisibility, which further affects the results of the subsequent classification decisions. Inspired by a blind equalization technique [11] and phase-space reconstruction technique [12], we construct a systematic attractor feature space algorithm under a blind equilibrium to better extract the subtle features of communication radiation source individuals in complex electromagnetic environments, and carry out the subsequent individual identification by the improved neural network based on R e s N e t 50 . The main contributions of this paper are summarized as follows:
  • In order to solve the problem of communication signals being seriously affected by multi-path channels and noise in a complex electromagnetic environment during transmission, this paper proposes to construct a system attractor feature space based on blind equalization, and effectively extracts fingerprint characteristics of different individuals of the target. An experimental verification shows that this method can effectively improve the individual recognition rate of radiation sources.
  • This paper explores the adaptability of the neural network with respect to the embedding dimension and delay time of the attractor feature space of the target radiation source. Experiments show that when the embedding dimension and delay time of the feature space of each radio station are consistent, the adaptability of the network is the best, and the optimal embedding dimension and delay time are found out.
  • Based on the R e s N e t 50 model, the recognition model adapted to the complex electromagnetic environment is designed, and when recently compared with the more popular neural network, the superiority of our model is proved by experiments.
The rest of this paper is arranged as follows: In the second part, the method proposed by us is explained in detail from its principle to the reasons for putting forward the method; in the third part, the data set and related experiments are introduced, and the experimental results are analyzed and demonstrated. In conclusion, this paper summarizes the main work and innovation points.

2. Methods

This section will elaborate on our proposed method in terms of algorithmic principles and system mechanics, focusing on four aspects: blind channel equalization, signal phase space construction, neural networks and algorithm implementation. Firstly, we carry out blind equalization for the signal seriously affected by the multi-path effect, and then we reconstruct the phase space to generate the system feature attractor, which is used as the feature input for recognition by the neural network. The specific algorithm process is shown in Figure 1.

2.1. Blind Equalization

With the explosive growth of wireless data traffic and interference, the electromagnetic environment has become increasingly complex [13], in which the quality of the received signal can easily deteriorate due to multi-path propagation and non-ideal channel characteristics. In this case, blind equalization is widely used to eliminate the signal multi-path fading and improve communication quality [14]. Blind adaptive equalizers, which do not require a training sequence to compensate for the effects caused by channel distortion, are one such class of adaptive algorithms that do not require an externally provided desired response to produce a filter output that is the closest approximation to the input signal expected to be recovered under some criterion [15]. The aim is to adjust the equalizer weight vector using a blind equalization algorithm in the case of a known channel output signal y ( k ) , so that the equalizer output signal z ( k ) is in some sense an optimal estimate of the original signal a ( k ) , i.e., the deviation between z ( k ) and a ( k ) is so small that z ( k ) recovers the source signal a ( k ) essentially without distortion after the output of the adjudicator. In this section, the constant modulus algorithm (CMA) and multi-modulus algorithm (MMA) of blind equalization algorithms are analyzed, and the elimination of signal multi-path effects is also modeled based on these two algorithms. The details are summarized as follows:

2.1.1. CMA

The constant modulus algorithm is a special case of the Godard algorithm. It constructs the cost function by using (implied) higher-order statistical characteristics, and finds the extreme point of the cost function by adjusting the weight vector of the equalizer, as shown in Figure 2.
a ( k ) in the figure can be regarded as the signal vector transmitted by the communication radiation source. h ( k ) is the channel impulse response vector and its length is M, namely h ( k ) = [ h 0 ( k ) , , h M 1 ( k ) ] T (superscript represents transpose), which is regarded as the channel influence in the transmission of the transmitted signal. w ( k ) is the additive Gaussian white noise. ψ is the error generating function. e ( k ) is the error function. f ( k ) = [ f L ( k ) , , f 0 ( k ) , , f L ( k ) ] T is the weight vector of the equalizer and the length is 2 L + 1 . y ( k ) is the equalizer received signal vector, i.e., the receiver received signal vector. z ( k ) is the equalizer output signal. a ( k ) is the decision output signal of the decision device to z ( k ) .
Set a ( k ) = [ a ( k ) , , a ( k M + 1 ) ] T (which is more intuitive) and y ( k ) = [ y ( k L ) , , y ( k ) , y ( k + L ) ] T , and y ( k ) can be obtained from Figure 2.
y ( k ) = i = 0 M 1 h i ( k ) a ( k i ) + w ( k ) = h T a ( k ) + w ( k )
z ( k ) = i = L L f i ( k ) y ( k i ) = f T ( k ) y ( k ) = y T ( k ) f ( k )
The error function of CMA is
e ( k ) = z ( k ) 2 R 2
where R 2 is the modular value of CMA, defined as
R 2 = E { a ( k ) 4 } E { a ( k ) 2 }
The cost function of CMA is
J = 1 2 E [ e 2 ( k ) ]
In order to minimize the CMA cost function, the random gradient method is adopted to adjust  f ( k )
f ( k + 1 ) = f ( k ) μ f J
where μ represents the step size and is a small positive number, f J is the instantaneous value of the partial derivative of J with respect to f ( k ) .
Take the partial derivative of J with respect to f ( k )
f = J f ( k ) = E [ 2 ( z ( k ) 2 R 2 ) ] [ z ( k ) z * ( k ) ] f ( k ) = E [ 2 ( z ( k ) 2 R 2 ) ] [ f T ( k ) y ( k ) ( f T ( k ) y ( k ) ) * ] f ( k ) = E [ 4 ( z ( k ) 2 R 2 ) y * ( k ) y T ( k ) f ( k ) ] = E [ 4 ( z ( k ) 2 R 2 ) y * ( k ) z ( k ) ]
f J = 2 ( z ( k ) 2 R 2 ) y * ( k ) z ( k )
By substituting (8) into (6), the iterative formula of the CMA weight vector is
f ( k + 1 ) = f ( k ) 2 μ ( z ( k ) 2 R 2 ) y * ( k ) z ( k ) = f ( k ) 2 μ e ( k ) z ( k ) y * ( k )
After initializing the weight coefficient f ( k ) of the equalizer and designing the order L and step factor μ of the equalizer, the error factor is minimized by iterating according to the above formula, and the signal data after passing the equalizer is finally obtained.

2.1.2. MMA

In theory, the multi-mode algorithm (MMA) [16,17] overcomes the shortcomings of the constant modulus algorithm (CMA), divides the signal into a real part and imaginary part, which is closer to the IQ data in form, and makes the modulus of the real part and imaginary part respectively approximate the expected size. MMA can eliminate the inter symbol interference and correct the phase rotation of the signal at the same time. Compared with the CMA algorithm, the cost function of MMA is
J = 1 2 { E [ z R ( k ) 2 R R 2 ] + E [ z I ( k ) 2 R I 2 ] }
where z R ( k ) and z I ( k ) are the real and imaginary parts of the output signal z ( k ) of the equalizer, and R R and R I are calculated from the real and imaginary parts of the transmitted signal a ( k ) , respectively. The specific formula is as follows
R R 2 = E { a R ( k ) 4 } E { a R ( k ) 2 } , R I 2 = E { a I ( k ) 4 } E { a I ( k ) 2 }
Accordingly, the weight vector iteration formula of MMA is
f ( k + 1 ) = f ( k ) 2 μ ( [ z R ( k ) 2 R R 2 ] z R ( k ) + j [ z I ( k ) 2 R I 2 ] z I ( k ) ) y * ( k )
Consistent with CMA, after parameters are set, the iterative solution is carried out according to the above formula, and the signal after equilibrium is obtained.

2.2. Phase Space Reconstruction

Phase space reconstruction technology is a signal-processing method based on the nonlinear dynamics theory, which can map high-dimensional sequential signals to low-dimensional phase spaces, so as to achieve the signal feature extraction. When the signal is blindly equalized, the influence of the signal due to channel distortion is solved, which makes the reconstructed phase-space trajectory more accurate and stable, and thus improves the accuracy and reliability of the reconstruction; thus, the blind equalization process is necessary. In this section, based on the premise that the signal is blindly equalized, we discuss how to determine the delay time and embedding dimension of the signal feature space.
In a dynamic system, each state component of the system interacts with other components and is related to each other. The state space of the system can be reconstructed by observing the scalar time series of the system, which contains the system attractor. According to [18], in the differential homeomorphism between the reconstructed phase space and the system attractor, the reconstructed phase space contains the system attractor; that is, it contains the fingerprint characteristics of the individual radiation source, and can be used as the basis for the individual identity identification. In this paper, we chose Takens’ coordinate delay method [19] to construct the phase space, which requires less computation and has a higher numerical accuracy than Packard’s derivative method [20]. Using the coordinate delay method to construct the image space focuses on determining two reconstruction parameters: embedding dimension m and delay time τ . Suppose that the observation time series of signals received by a receiver is
s ( n ) = s ( 1 ) , s ( 2 ) , s ( 3 ) , , s ( N )
where N is an integer, representing the signal length and sequence index value. In this paper, s ( n ) represent the signal IQ sequence intercepted by the receiver after blind equalization processing. After the embedding dimension m and the delay time τ are determined, the signal phase space can be expressed as
S = [ S 1 , S 2 , S 3 , , S i , S i + 1 , , S N ( m 1 ) τ ] T
where
S i ( m ) = [ s ( i ) , s ( i + τ ) , s ( i + 2 τ ) , , s ( i + ( m 1 ) τ ) ]
It can be observed that the appropriate m and τ greatly affect the quality and effect of the phase space; thus, calculating m and τ reasonably is crucial.

2.2.1. Delay Time τ

Common calculation methods include the auto-correlation coefficient method and mutual information method. Because the value of τ determines the size of the signal delay, when τ is too small, the two adjacent components are too close to each other, and their redundancy is large, thus losing the significance of independent representation. When τ is too large, the distance between the two adjacent components is too large and the correlation between them is not strong, which can be regarded as independent. Although the auto-correlation coefficient method is simple and effective, and the calculation amount of the algorithm is small, it can only extract the linear correlation of the time series, which means that the method cannot be effectively extended to the study of high dimensions. Based on the above considerations, we choose the mutual information method to calculate the delay time, τ .
Suppose there are two distinct discrete systems A and B; the mutual information of A and B can be expressed as
I ( A , B ) = H ( A ) + H ( B ) H ( A , B )
where H ( A , B ) is the joint entropy of system A and B, which can be expressed as
H ( A , B ) = i j P a b ( a i , b j ) log 2 P a b ( a i , b j )
P a b ( a i , b j ) is the joint distribution probability of event a i and event b j . By substituting the above formula, the mutual information I ( A , B ) of system A and B can be written as
I ( A , B ) = i j P a b ( a i , b j ) log 2 P a b ( a i , b j ) P ( a i ) P ( b j )
Suppose that the delay time of the signal observation sequence s ( n ) after blind equalization is τ ; then, the corresponding system A and B can be expressed as
{ A , B } = { s ( n ) , s ( n + τ ) }
The mutual information I ( A , B ) of the two systems is converted into a polynomial containing τ , which is expressed as I ( τ )
I ( τ ) = I [ s ( n ) , s ( n + τ ) ] = i j P s ( n ) s ( n + τ ) [ s i ( n ) , s j ( n + τ ) ] log 2 P s ( n ) s ( n + τ ) [ s i ( n ) , s j ( n + τ ) ] P [ s i ( n ) ] P [ s j ( n + τ ) ]
where s i ( n ) , s j ( n + τ ) , respectively, represent the value of each signal in system s ( n ) , s ( n + τ ) . When I ( τ ) = 0 , it means that the two systems { s ( n ) , s ( n + τ ) } are not correlated, which represents that s ( n + τ ) cannot be predicted when s ( n ) is known. When the delay time τ between two systems is properly selected, the mutual information will reach a peak, because at this delay time, the relationship between the two systems is most similar, which can better reveal the nature of the dynamic system. Generally, the minimum value is selected as the optimal delay time, because the delay time corresponding to the minimum value is at the end of the mutual information rising stage, which can ensure that the data have a high correlation, and at the same time, the delay time is too large to cause the data to lose correlation. To sum up, we choose the first minimum value of I ( τ ) as the optimal delay time τ . It should be noted that the delay time selected by the mutual information method is only an approximation, and further verification and optimization are needed in the practical application.

2.2.2. Embedding Dimension m

In the phase-space reconstruction, the embedded dimension is a very key parameter, which determines the dimension of the low-dimensional space to which data are mapped, so as to ensure that the reconstructed phase space is equivalent to the attractor topology of the system as much as possible. If the embedding dimension is too large, the distance between data points will be relatively large, which may mask some local structures in the data. In addition, the large embedding dimension increases the computational complexity, which leads to the slow running of the algorithm. If the embedding dimension is too small, there may be a large reconstruction error, so that the dynamic characteristics of the data cannot be accurately reflected, and important information about the data structure may be lost. Therefore, appropriate dimensions should be determined according to specific data sets and requirements. Currently, the commonly used methods include the [21,22,23] geometric invariant method, false nearest point method and Cao’s method. Since Cao’s method can calculate the embedded dimension just when the delay time τ is known, and the calculation amount is relatively small, Cao’s method is used in this paper to calculate the embedded dimension of the phase space.
In the case that the delay time τ is known, the vector space of the observation sequence based on this construction can be expressed as (15). In the vector space, every S i ( m ) has a nearest neighbor of a Euclidean distance S N ( i , m ) , and 1 N ( i , m ) N ( m 1 ) τ , so the nearest distance R i ( m ) can be expressed as
R i ( m ) = S i ( m ) S N ( i , m ) ( m ) 2
When the embedding dimension of the phase space changes from dimension m to dimension ( m + 1 ) , its closest distance becomes
R i ( m + 1 ) = S i ( m + 1 ) S N ( i , m + 1 ) ( m + 1 ) 2
If there is too much difference between R i ( m + 1 ) and R i ( m ) , it can be considered that it is caused by the projection of two non-adjacent points in the higher dimensional chaotic attractor into the lower dimensional coordinates to become the adjacent two points; such adjacent points are false and now we set
a ( i , m ) = S i ( m + 1 ) S N ( i , m + 1 ) ( m + 1 ) S i ( m ) S N ( i , m ) ( m )
here is the maximum model number, and then we define it
E ( m ) = ( N m τ ) 1 · i = 1 N m τ a ( i , m )
It can be observed that E ( m ) is a function determined by embedding dimension m. In order to more effectively represent how much the function changes from m to m + 1 , consider the following formula
E ( m ) = E ( m + 1 ) E ( m )
When m is greater than some value m 0 , and E ( m ) no longer changes or fluctuates within a small margin of error ( 1 × 10 3 ), then m + 1 is the embedding dimension we are looking for.
After determining the delay time τ and embedding dimension m, we can construct the attractor feature space of its system on the basis of the signal after blind equalization, then we use the feature space as the input to realize the recognition of different radiation sources by the neural network. The specific algorithm process is shown in Figure 3.

2.3. Neural Network

The traditional SEI technology is based on the signal detection and analysis technology, statistical knowledge and expert experience [24,25], in order to carry out the feature engineering and realize the expert feature extraction. Expert features have an obvious physical significance, but the extraction process is complex and professional, and the applicable radiation source types are limited, which cannot meet the needs of complex and rich scenarios [26].
With the breakthrough of computing power and the maturity of the neuron-related mathematical model, the deep neural network (DNN), with powerful feature learning and feature extraction ability, has become a research hot spot in various fields. DNN has achieved great success in various computer vision tasks, such as image classification, object detection and scene annotations [27,28,29]. By integrating feature learning into the process of model building, it can reduce the imperfection created by artificial design features and skip the stage of the manual design of fingerprint features. In addition, DNN can make the finally extracted fingerprint features have a lower dimension, which can not only effectively represent the individual communication source, but also solve the problem that traditional classifiers cannot fully utilize the fingerprint feature information [30]. Compared with the traditional radiation source individual identification method, the neural network has better robustness and nonlinear modeling ability, and the traditional identification method requires manual feature extraction, while the neural network can automatically learn the features of the data, so as to avoid the complexity and subjectivity of artificial feature extraction; it is also more real-time and scalable. In this section, we present our improvements based on the R e s N e t 50 model and explain the reason for doing so.
When it comes to neural networks, as convolutional neural networks have made increasingly high achievements in the field of image recognition, convolutional neural networks have also been gradually applied to the field of signal processing for the individual recognition of radiation sources. The deeper the convolutional neural network is, the stronger the feature extraction capability is, and the better the performance will be. However, as the depth of layers increases, the traditional convolutional neural network will face network degradation, gradient disappearance, gradient explosion and other problems, making the performance of the high-level network inferior to that of the shallow network. The emergence of the R e s N e t 50 network effectively solves this problem. In terms of the network degradation, the residuals module is introduced into the R e s N e t 50 network, as shown in Figure 4.
The basic idea is that the true measurement is equal to the sum of the predicted value and the residuals, i.e., x ¯ = F ( x ) + X , where X is the identity mapping and F ( x ) is the residuals, which are processed by the activation function ReLU after summing. The main function of the residual F ( x ) is to correct the error of the identity mapping X to make the network fit better. If X is good enough, the parameter of the residual is 0, so that the output F ( x ) is 0. If X is not good enough, then F ( x ) is optimized based on X. There are three convolution kernels in each residual block of the R e s N e t 50 network, with sizes of 1 × 1 , 3 × 3 and 1 × 1 , respectively, and the number of channels in each residual module is gradually increased to retain more features. On gradient elimination or explosion problems, the R e s N e t 50 network introduces the Batch Normalization(BN) layer and abandons Dropout. The purpose of the BN layer is to make the characteristic values of each input data meet the distribution law of mean 0 and variance 1, which can accelerate the network convergence and effectively solve the gradient anomaly problem. Generally, the BN layer is placed between the convolution layer and the activation layer.
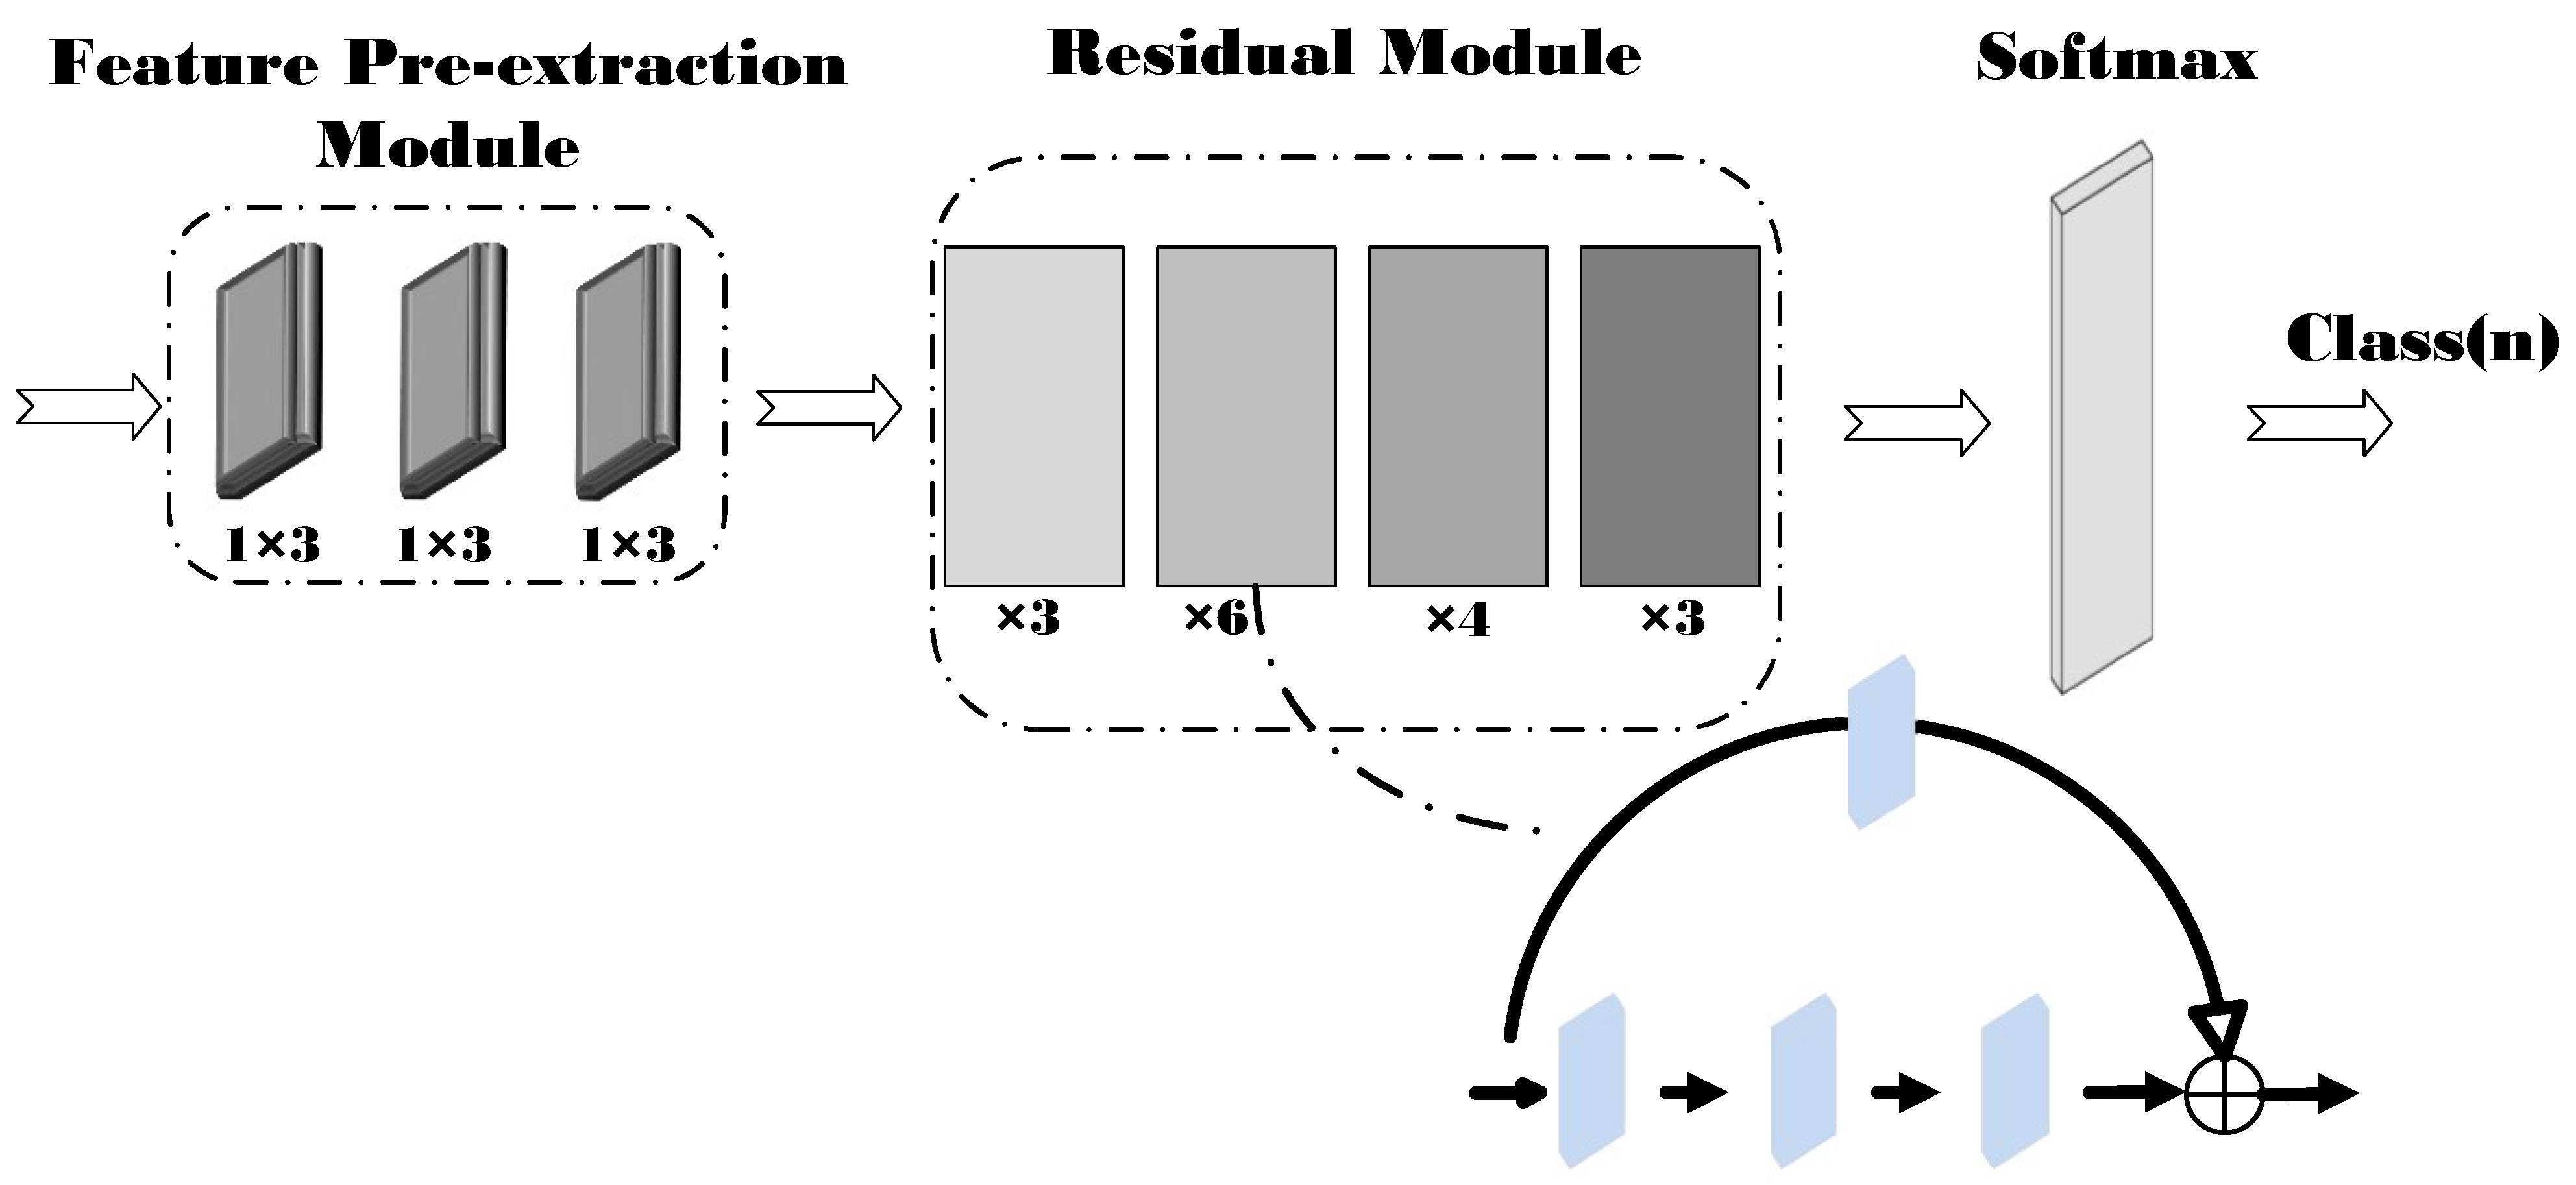
The R e s N e t 50 model has excellent performance in image classification, but due to the difference in the distribution of signal data and image data, the original model may not be able to properly handle the task of the radiation source identification. Based on this, we make the following improvements, and the structure of the improved model is shown in the Figure 5.
First, we only use one-dimensional convolution kernels with a kernel size of 1 × N , and in the three convolution of pre-extracted features, the convolution kernels are 1 × 3 ; in the residual module, the convolution kernels are 1 × 1 and 1 × 3 , whose details are shown in Figure 4. We believe that the communication signal data does not change the size before input into the network, and maintains the original form, i.e., 2 × N , which can better characterize the original characteristics of the signal without disturbing the original data distribution. However, when the convolution kernel size is larger than the data size, while increasing the calculation amount of the model, the number of output feature channels will be reduced, resulting in information loss, and important features cannot be effectively extracted. Second, decomposing the large convolution kernel, i.e., splitting the 7 × 7 convolution kernel in front of the first residual module into three 1 × 3 convolution kernels, is an idea similar to that of V G G 16 , where fine features can be extracted more efficiently with smaller convolution kernels and without increasing the number of parameters too much. Finally, the 1 × 1 convolution is used to replace the constant mapping in the residual block, because the vast majority of parameters and operations in the depth-separable convolution are concentrated in the 1 × 1 convolution operation, which saves the time and space for data rearranging and is more efficient than the constant mapping in the residual block.
Besides, through our validation, keeping the number of residual blocks (3, 6, 4, 3, respectively) and neuron nodes the same as the baseline R e s N e t 50 model, the improved model has the best recognition performance. We analyze that this is because the same number of residual blocks and neuron nodes preserves the internal structural features of the baseline model, which can better prevent the model gradient from vanishing and represent bottlenecks, and improve the performance and learning ability of the network.

2.4. Attractor Feature Space Based on Blind Equalization Algorithm

First of all, we obtain the time observation sequence s ( n ) of the signal of the target communication radiation source through the receiver; the signal is then equalized blindly using CMA to obtain s ( n ) (we will explain the reasons for this in the experimental section). Furthermore, the delay time τ and the embedding dimension m of the attractor of the target communication radiation source system are calculated based on the phase-space reconstruction technology, so as to construct the feature space S ( n ) of the system. Finally, the system attractor feature space of the target communication radiation source is input into the neural network as a fingerprint feature, and the individual recognition result c l a s s ( n ) of the target communication radiation source is obtained through training. The main steps of the system attractor feature space recognition algorithm based on blind equalization are shown in Algorithm 1.
Algorithm 1 Attractor feature space based on blind equalization.
 PREPROCESSING
      Input s ( n )
      Initialize f ( k ) , L , μ
      Calculate s ( n ) by (2) ∼ (9)
      While i < n , j < n
                Calculate τ by (14) ∼ (20)
                Calculate  m by (21) ∼ (25)
      End
     return  S ( n )

 TRAIN
      Input S ( n )
      Initialize EPOCH, learning rate
      While i < EPOCH
            Updated model weight
     return TRAINED model

 TEST
      Input S ( n )
     return  c l a s s ( n )

3. Datasets and Experiments

In this section, we will describe our data acquisition and experimental scheme and the reasons behind them.

3.1. Datasets

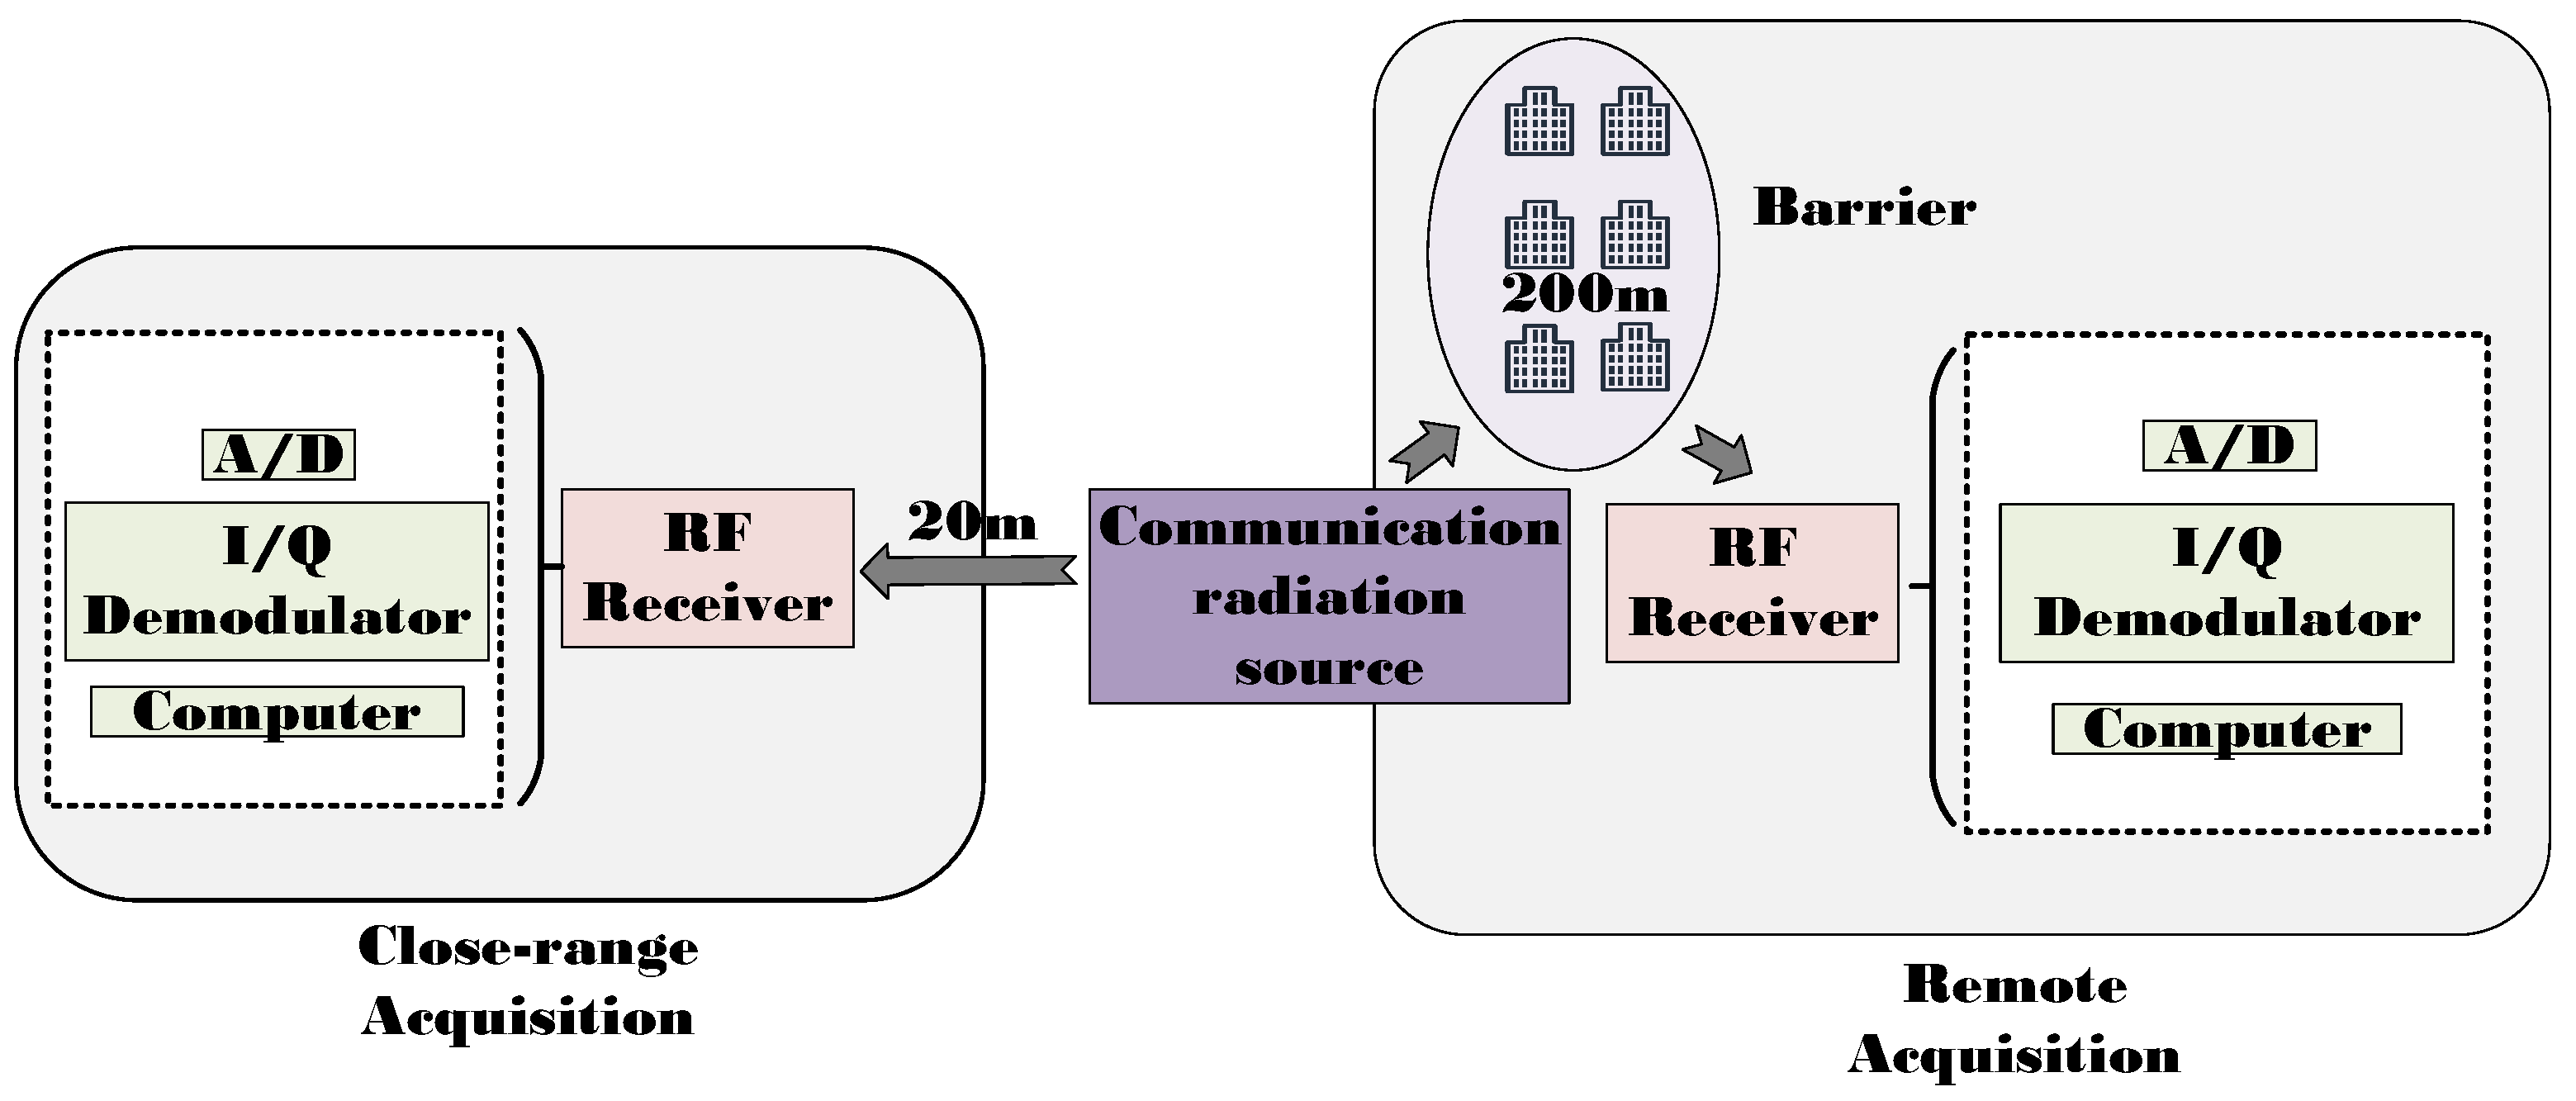
The data set used in this paper is ten “Kenwood” handheld radio communication data sets, which are data sets from a research institute of China Power Group. The data set was sampled from 10 “Kenwood” handheld radio stations of the same manufacturer and model, and the signals transmitted by the radio stations in the same working mode were collected. The experimental acquisition block diagram of the whole data set is shown in Figure 6.
Acquisition can be divided into two forms: close-range acquisition and remote acquisition. In close-range acquisition, the receiver and transmitter are 20 m apart, and there is no interference between them. In the remote acquisition, the receiver and transmitter are 200 m apart, and several obstacles are placed in the propagation path during acquisition to simulate the multi-path effect; thus, the data set is also divided into close-range data with a direct wave and remote data without a direct wave. In addition, the working mode of the former radio station is noise quieting, while the working mode of the latter radio station is monophonic quieting. Among them, the center frequency of the radio signal is 160 MHz, the signal bandwidth is 25 kHz, the channel bandwidth of the receiver is 100 kHz, the output signal frequency of the RF receiver is 12.8 MHz, the sampling frequency is 204.8 kHz, and the signal sampling time is 15 s. Each sample contains three different information individuals, and the modulation style of the station is the FM modulation. Finally, in order to simulate the noise environment, we simulate nine different Gaussian noises with SNR from −8 dB to 8 dB, and add them to the original data set to generate a new data set.
The reason for setting up the data set in this way is to better simulate the complex and changing electromagnetic environment in the real environment, and also to verify the adaptability of the proposed model to the signal data under different conditions. The data in this paper are collected by non-cooperative communications. Three samples are collected from each radio station, and 1,000,000 sampling points are selected for each sample, which is saved in the bin file format.

3.2. Experiments

In the experimental section, we will arrange four different small experiments to explain our algorithm and network model. In the first experiment, we will verify the negative effect of the multi-path effect on the individual identification of radiation source, and prove the importance of eliminating the multi-path effect. In the second experiment, we will verify which method of the blind equalization algorithm CMA and MMA is more suitable for the task of the individual identification of radiation source, and select the appropriate one for subsequent experiments. In the third experiment, we build a system attractor feature space based on blind equalization, explore the adaptive relationship between the embedding dimension, delay time and neural network, and, finally, compare our algorithm with the recently popular recognition network to prove the superiority of our algorithm. Finally, an ablation experiment is carried out to verify the rationality of the algorithm and analyze the separability of fingerprint features of different radiation sources.

3.2.1. The Influence of Multi-Path Effect

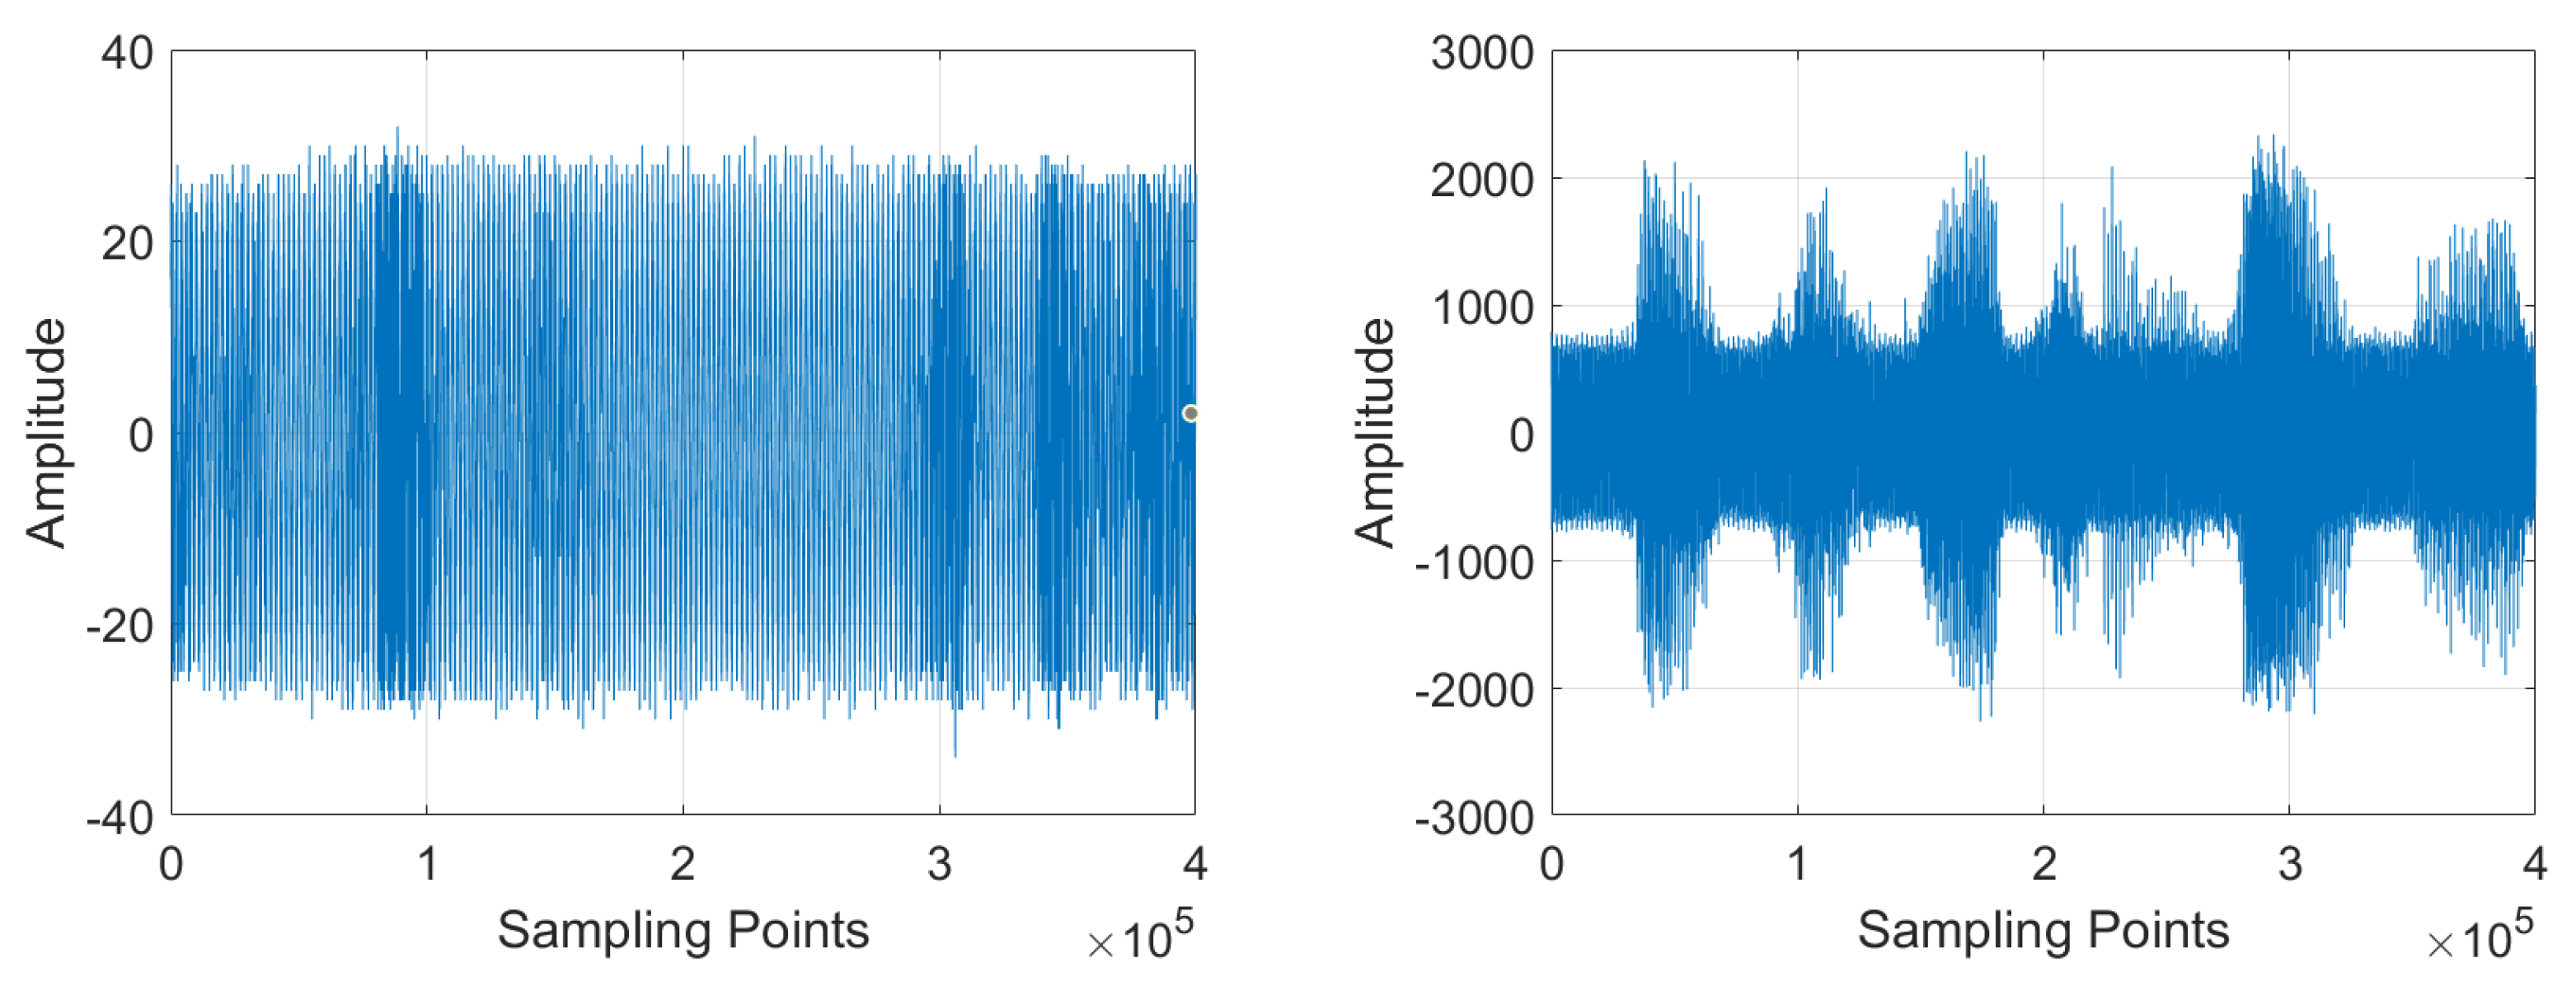
Close-range acquisition data are collected at close range, and the signal propagation distance is short, the transmission signal quality is good, and it usually has a high signal-to-noise ratio and low transmission delay. However, in the process of remote data acquisition, there are many obstacles in the signal transmission path, the signal transmission quality is poor, and it usually has a low signal-to-noise ratio and large transmission delay. The time-domain diagram of remote and close-range acquisition data is shown in Figure 7.
Among them, the left figure is close-range acquisition data, and the right figure is remote acquisition data, with 100,000 sampling points. It can be clearly observed from the Figure 7 that remote acquisition data are seriously affected by the multi-path effect.
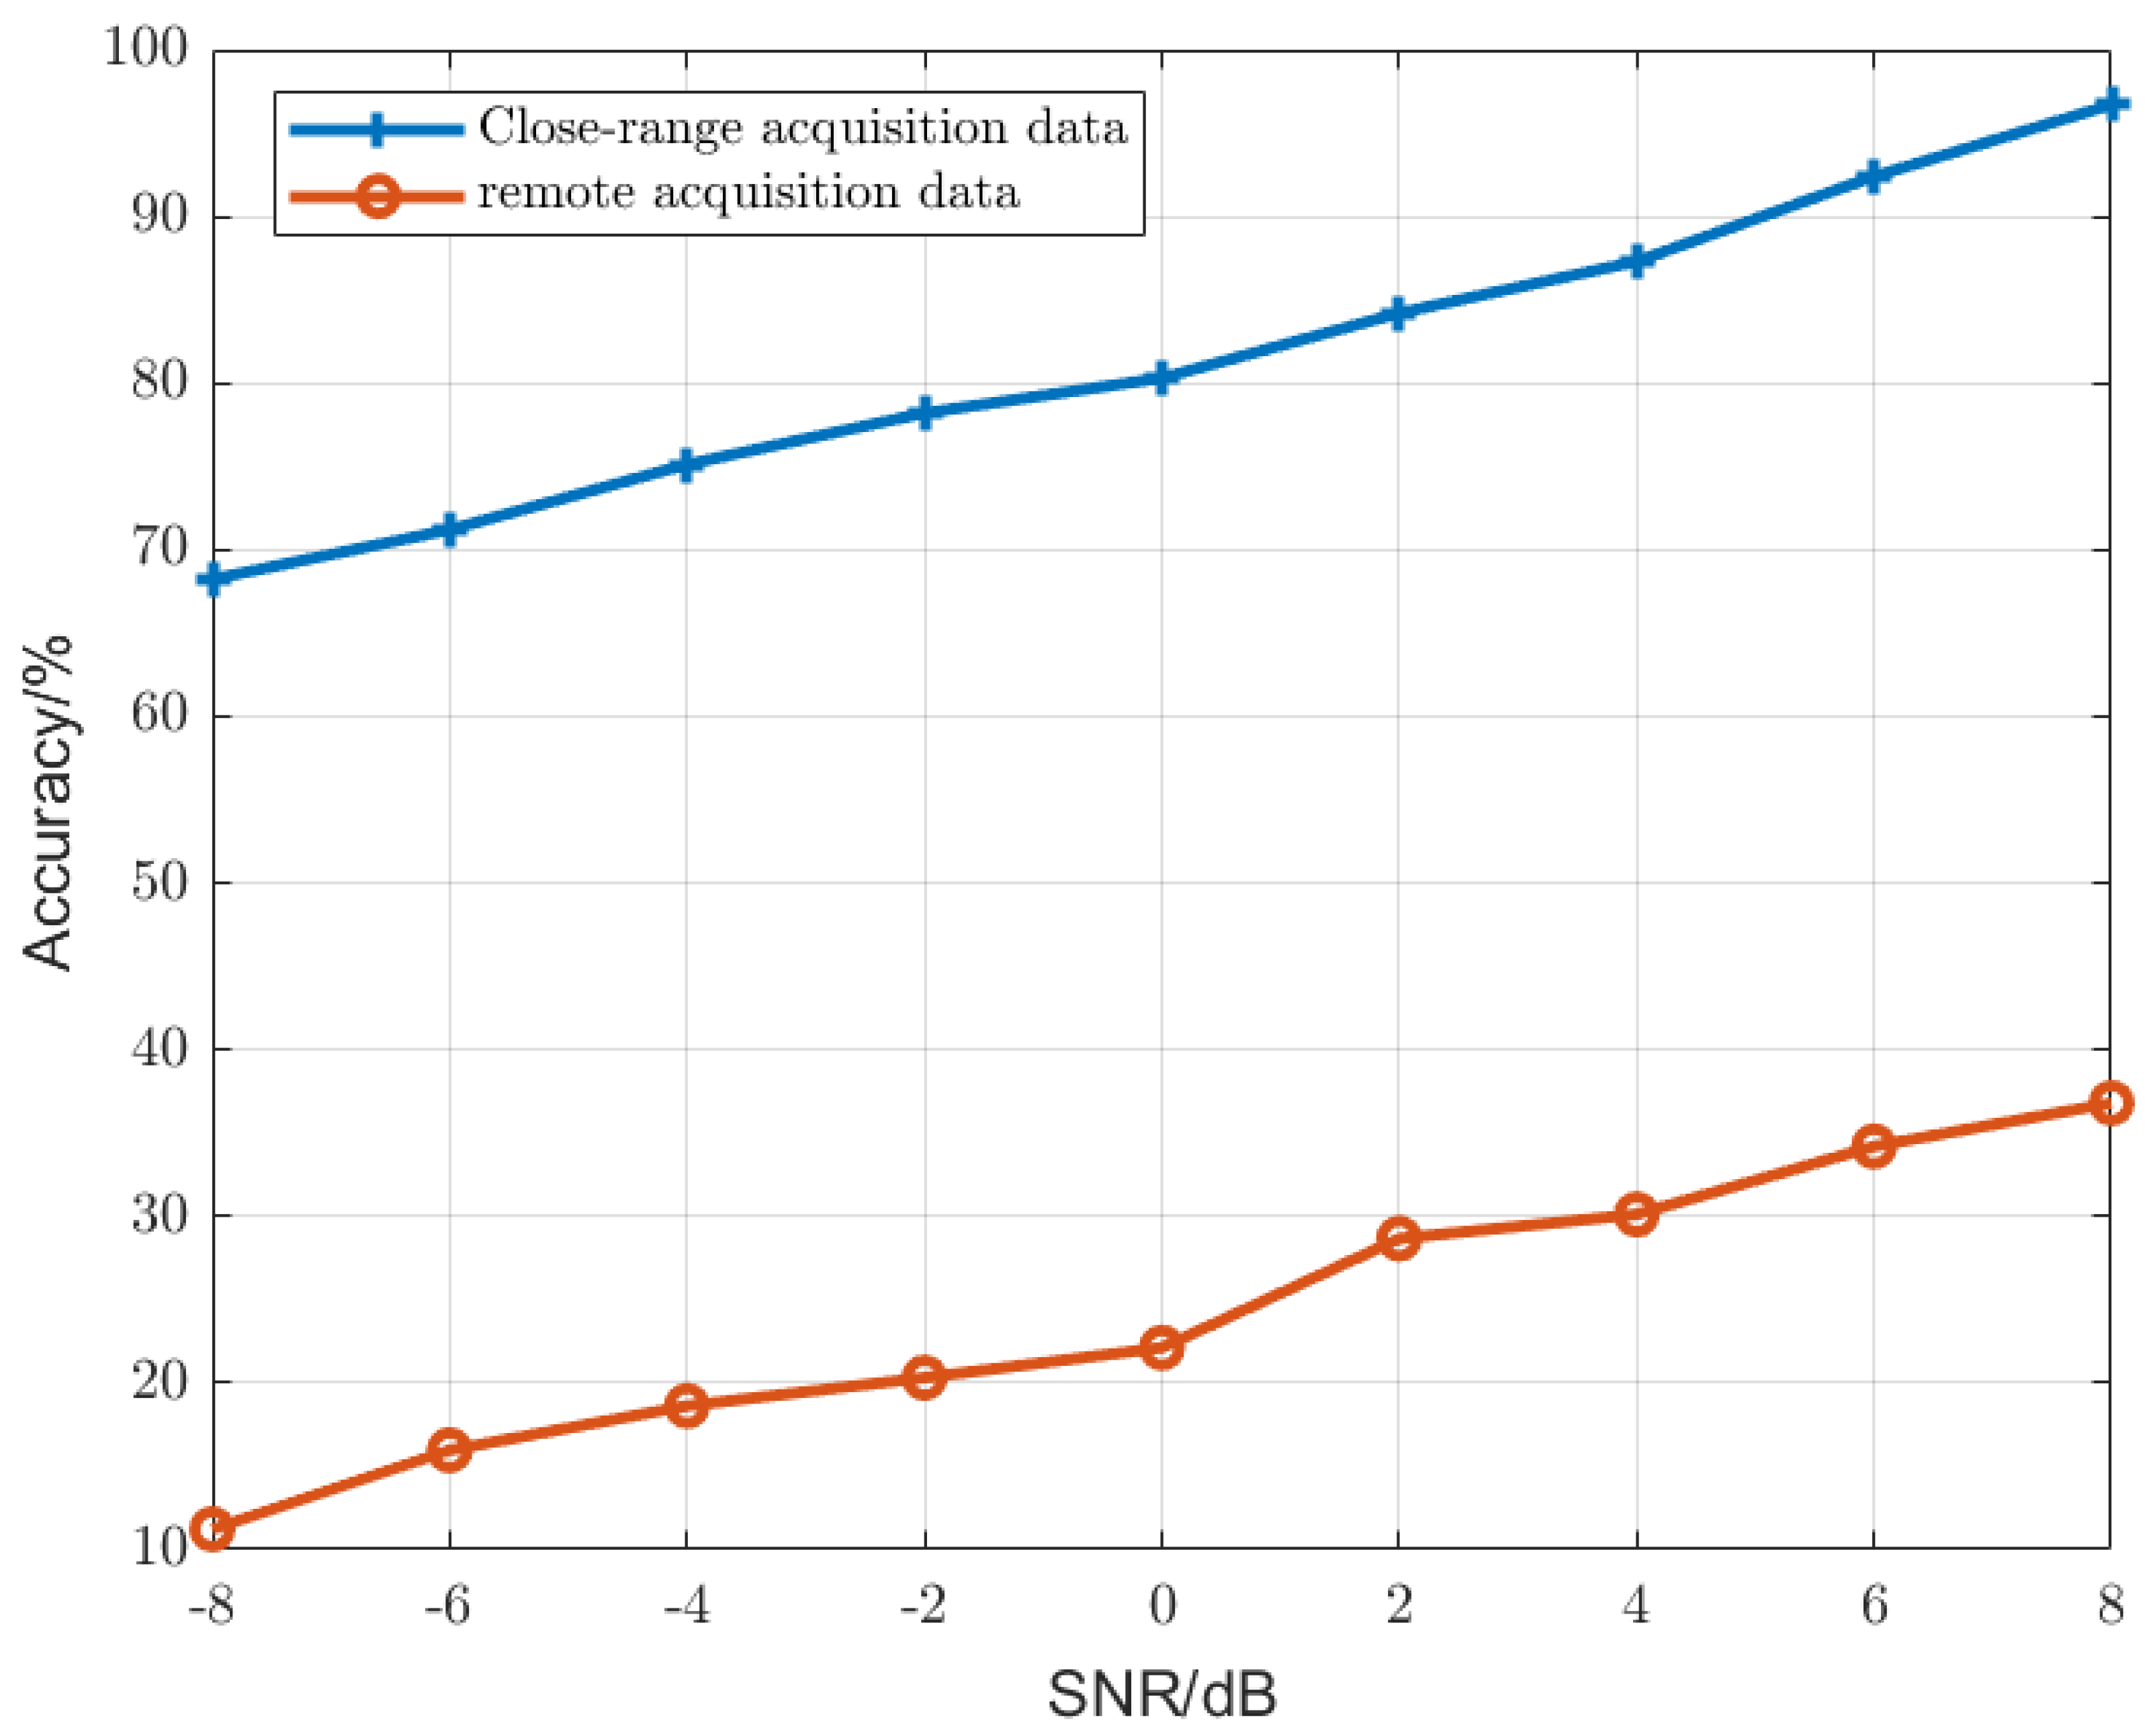
In order to illustrate our point of view more objectively, we input the remote acquisition data and the close-range acquisition data, without any processing, into the same model for recognition, and observe and compare the recognition rates under different SNR conditions. The recognition results are shown in Figure 8. In this model, the R e s N e t 50 model was adopted, the loss function was the Cross-Entropy loss function, the model optimizer was Adam, the initial learning rate was set to 1 × 10 4 , the number of model training rounds was 100, and the value after 10 Monte Carlo tests was taken as the final result.
It is not difficult to observe from Figure 8 that the recognition rate of close-range acquisition data is 96.7% when the SNR is 8 dB, while the recognition rate of remote acquisition data is only 36.8% under the same circumstances, which shows the great influence of the multi-path effect on the signal transmission.

3.2.2. The Choice of Blind Equalization Method

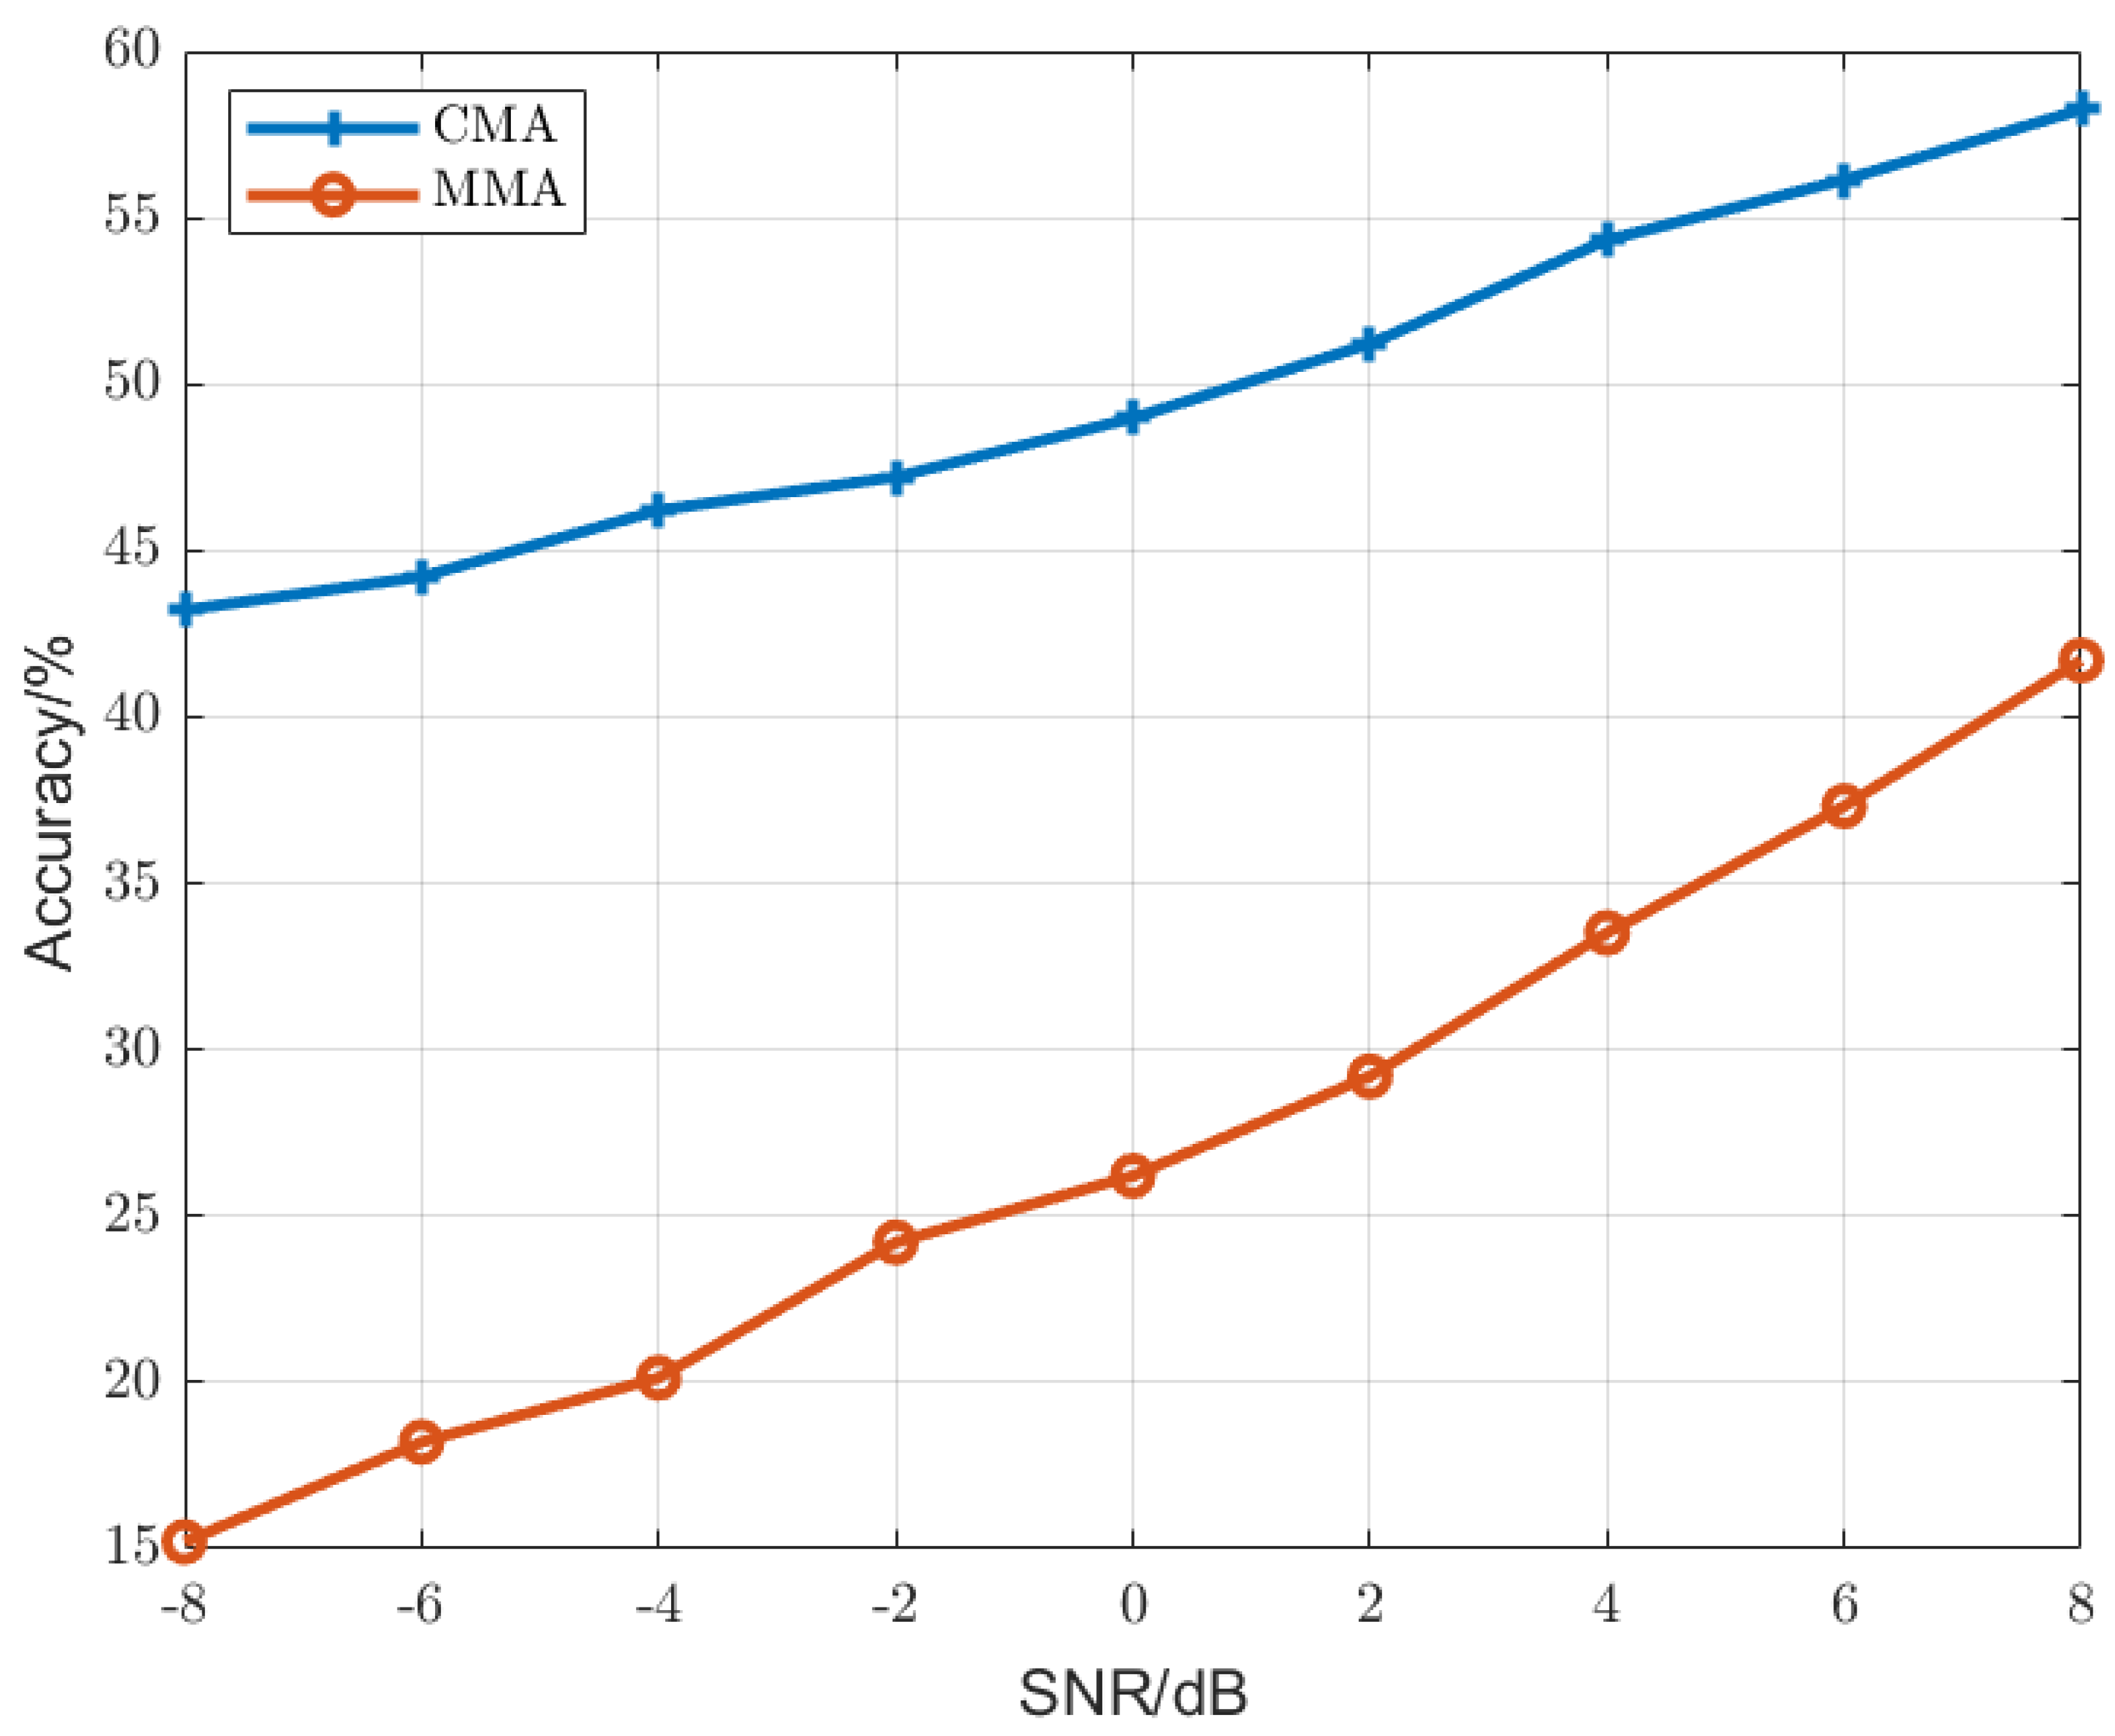
From the results of the first experiment, it can be observed that the remote data acquisition is seriously affected by the multi-path effect, and the recognition result will be very unsatisfactory if it is not processed. The first step is to try to reduce the negative impact of the multi-path effect by the blind equalization method. Here, we use CMA and MMA, respectively, for remote data acquisition, and judge which blind equalization method is more suitable for individual radiation source identification under the multi-path effect by identifying results. The setting conditions of the model are the same as those of the first experiment, and the specific results are shown in Figure 9.
We found that the final recognition rate of data after CMA processing reached 58.25%, and the final recognition rate of the data processed by MMA is only 41.7%, which is not significantly higher than the final recognition rate of the unprocessed data of 36.8%. We analyzed that the reason why the CMA equalization algorithm is better than the MMA equalization algorithm is that the MMA algorithm is sensitive to signal noise, and it is easy to mistake noise for a signal, which leads to the wrong judgment and slow convergence speed, and it takes more time to adapt to channel changes. By contrast, the CMA algorithm has strong noise suppression ability. It can effectively eliminate the noise and interference in the signal transmission process, and the convergence speed is fast. It can quickly adapt to the changes of the channel, and the computing resource and time cost is small, which is suitable for real-time processing.
However, this is still far from our goal. Our second step is to introduce a phase-space reconstruction to construct the feature space of the attractor of the signal system, so as to characterize the signal characteristics at a deeper level.

3.2.3. Determination of Delay Time and Embedding Dimension

Through the above experiments, we choose a CMA algorithm to process the signal, and then we construct the feature space of an attractor of the target communication radiation source system with the help of phase-space reconstruction technology. Here, we select the mutual information method and Cao’s method to determine the delay time and embedding dimension of the feature space, respectively. To ensure the rigor of the experiment, the delay time and embedding dimension were solved independently for each individual radio station, and the relevant results were shown in Table 1.
It can be observed from the table that the individual delay time of ten radio stations is two, except for the first and seventh radio stations, which are three. The embedding dimensions of the ten stations differ from each other, and are mainly concentrated in 16, 21, 23, 30 and 40. We believe that when the embedding dimension and delay time are different, the attractors of the individual system of different radiation sources constructed by this method are not strongly related to each other, and the internal distribution of the feature space is different; then, the recognition effects should not be ideal. To test our hypothesis, we designed the following two comparative experiments:
  • According to the obtained delay time and embedding dimension of each radio station, the system attractor feature space of each radio station is constructed, respectively, and the recognition result is obtained using this as the input of the recognition model. The model adopts our improved model, and the other settings are the same as the first experiment.
  • Controlling the delay time and embedding dimension of the attractor feature space of the system of each radio station is the same, and there are 10 different combinations according to the calculation. In the meantime, these 10 different combinations were input into the recognition model for training and testing. The model adopts our improved model, and the other settings are the same as in the first experiment.
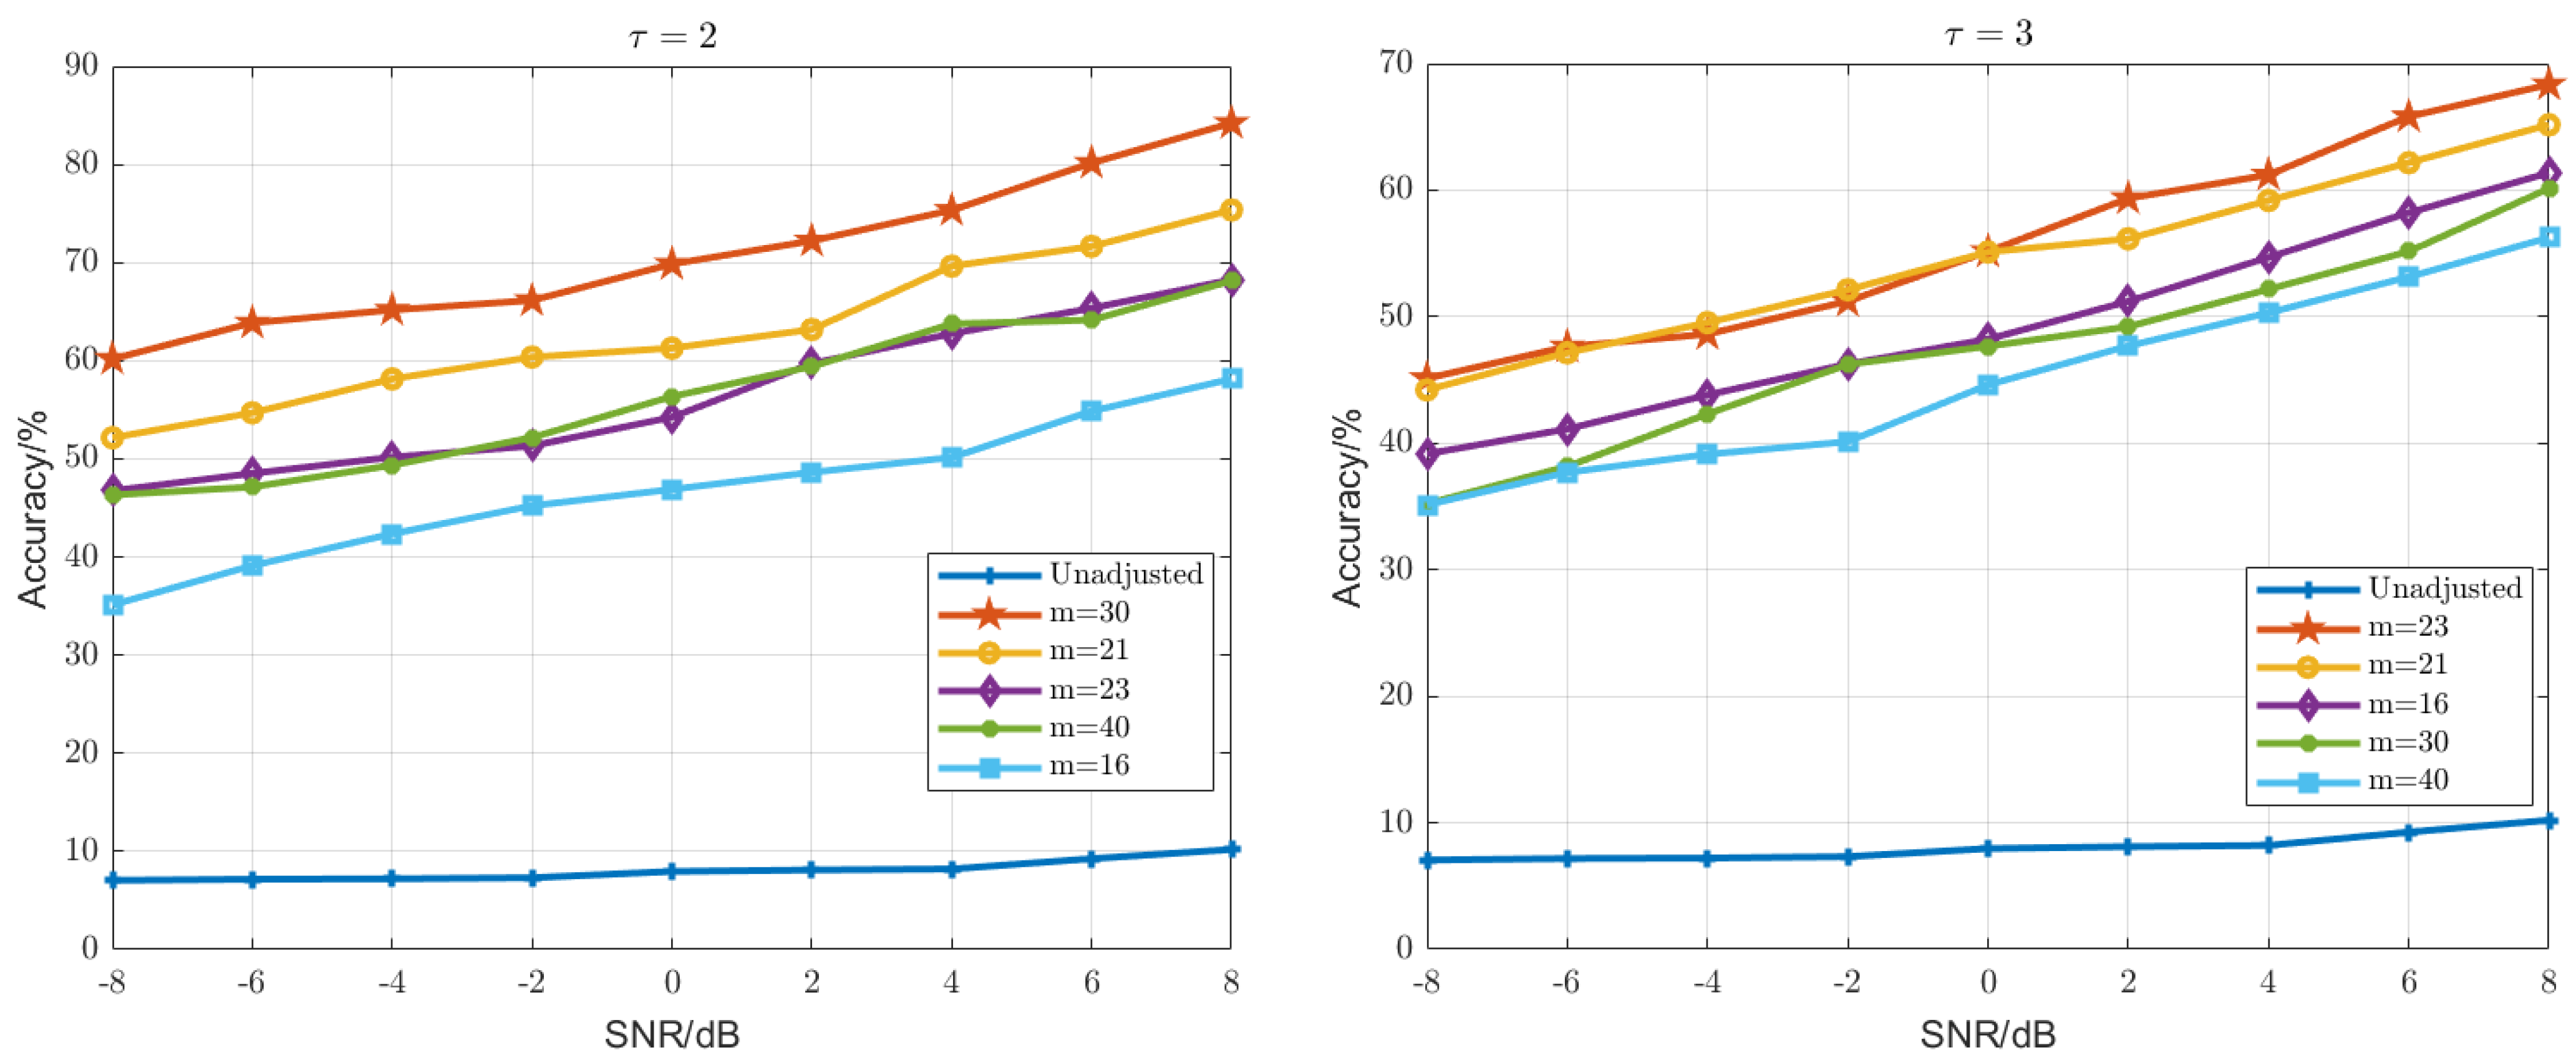
In order to make the comparison effect more obvious, we divided the combinations in the second experiment into τ = 2 group and τ = 3 group, and the identification results are shown in Figure 10.
According to the results, when the system attractor feature space is constructed according to the delay time and embedding dimension calculated by each radio station, the highest total recognition rate is only 10.2%. When the delay time is 2 and the embedding dimension is 30, the final total recognition rate of ten stations is the best, which can reach 84.21%. When the delay time is 3 and the embedding dimension is 40, the final total recognition rate of ten stations is the lowest, which is 56.25%. The reason why the optimal result is only 84.21% is that when we collect data, we also consider the influence of multiple factors such as multi-path propagation, different speakers and environmental noise, which increases a certain difficulty for our identification process. Combined with the two experiments, it can be observed that if the embedding dimension and delay time are improperly selected, it will not only be difficult to construct a high-quality system attractor feature space, but also destroy the original features of the data and affect the recognition effect. In general, we take a small delay time, like τ = 2 in our experiment, to avoid introducing significant system detection time delays, and the embedding dimension needs to be selected according to the specific identification task and data set size.
In order to verify the superiority of our algorithm, we choose to compare this recognition algorithm with the following recognition algorithms, which are all representative algorithms in recent years for dealing with the task of recognizing radiation sources in complex electromagnetic environments, at τ = 2 and m = 30 , and the specific results are shown in Table 2. As stated in the introduction, most of the current radiation source recognition algorithms have more ideal experimental conditions and are not applicable in real signal samples. As can be observed from Table 2, when the signal acquisition environment is poor, the remaining three algorithms do not extract the effective fingerprint features of the signal, and the recognition performance is poor. And, our algorithm can effectively eliminate the multi-path effect of the signal to a certain extent, and alleviate the impact of a bad environment on the radiation source identification.
  • CFNO [8].
  • DSN [9].
  • NEGAN [10].

3.2.4. Ablation Experiment

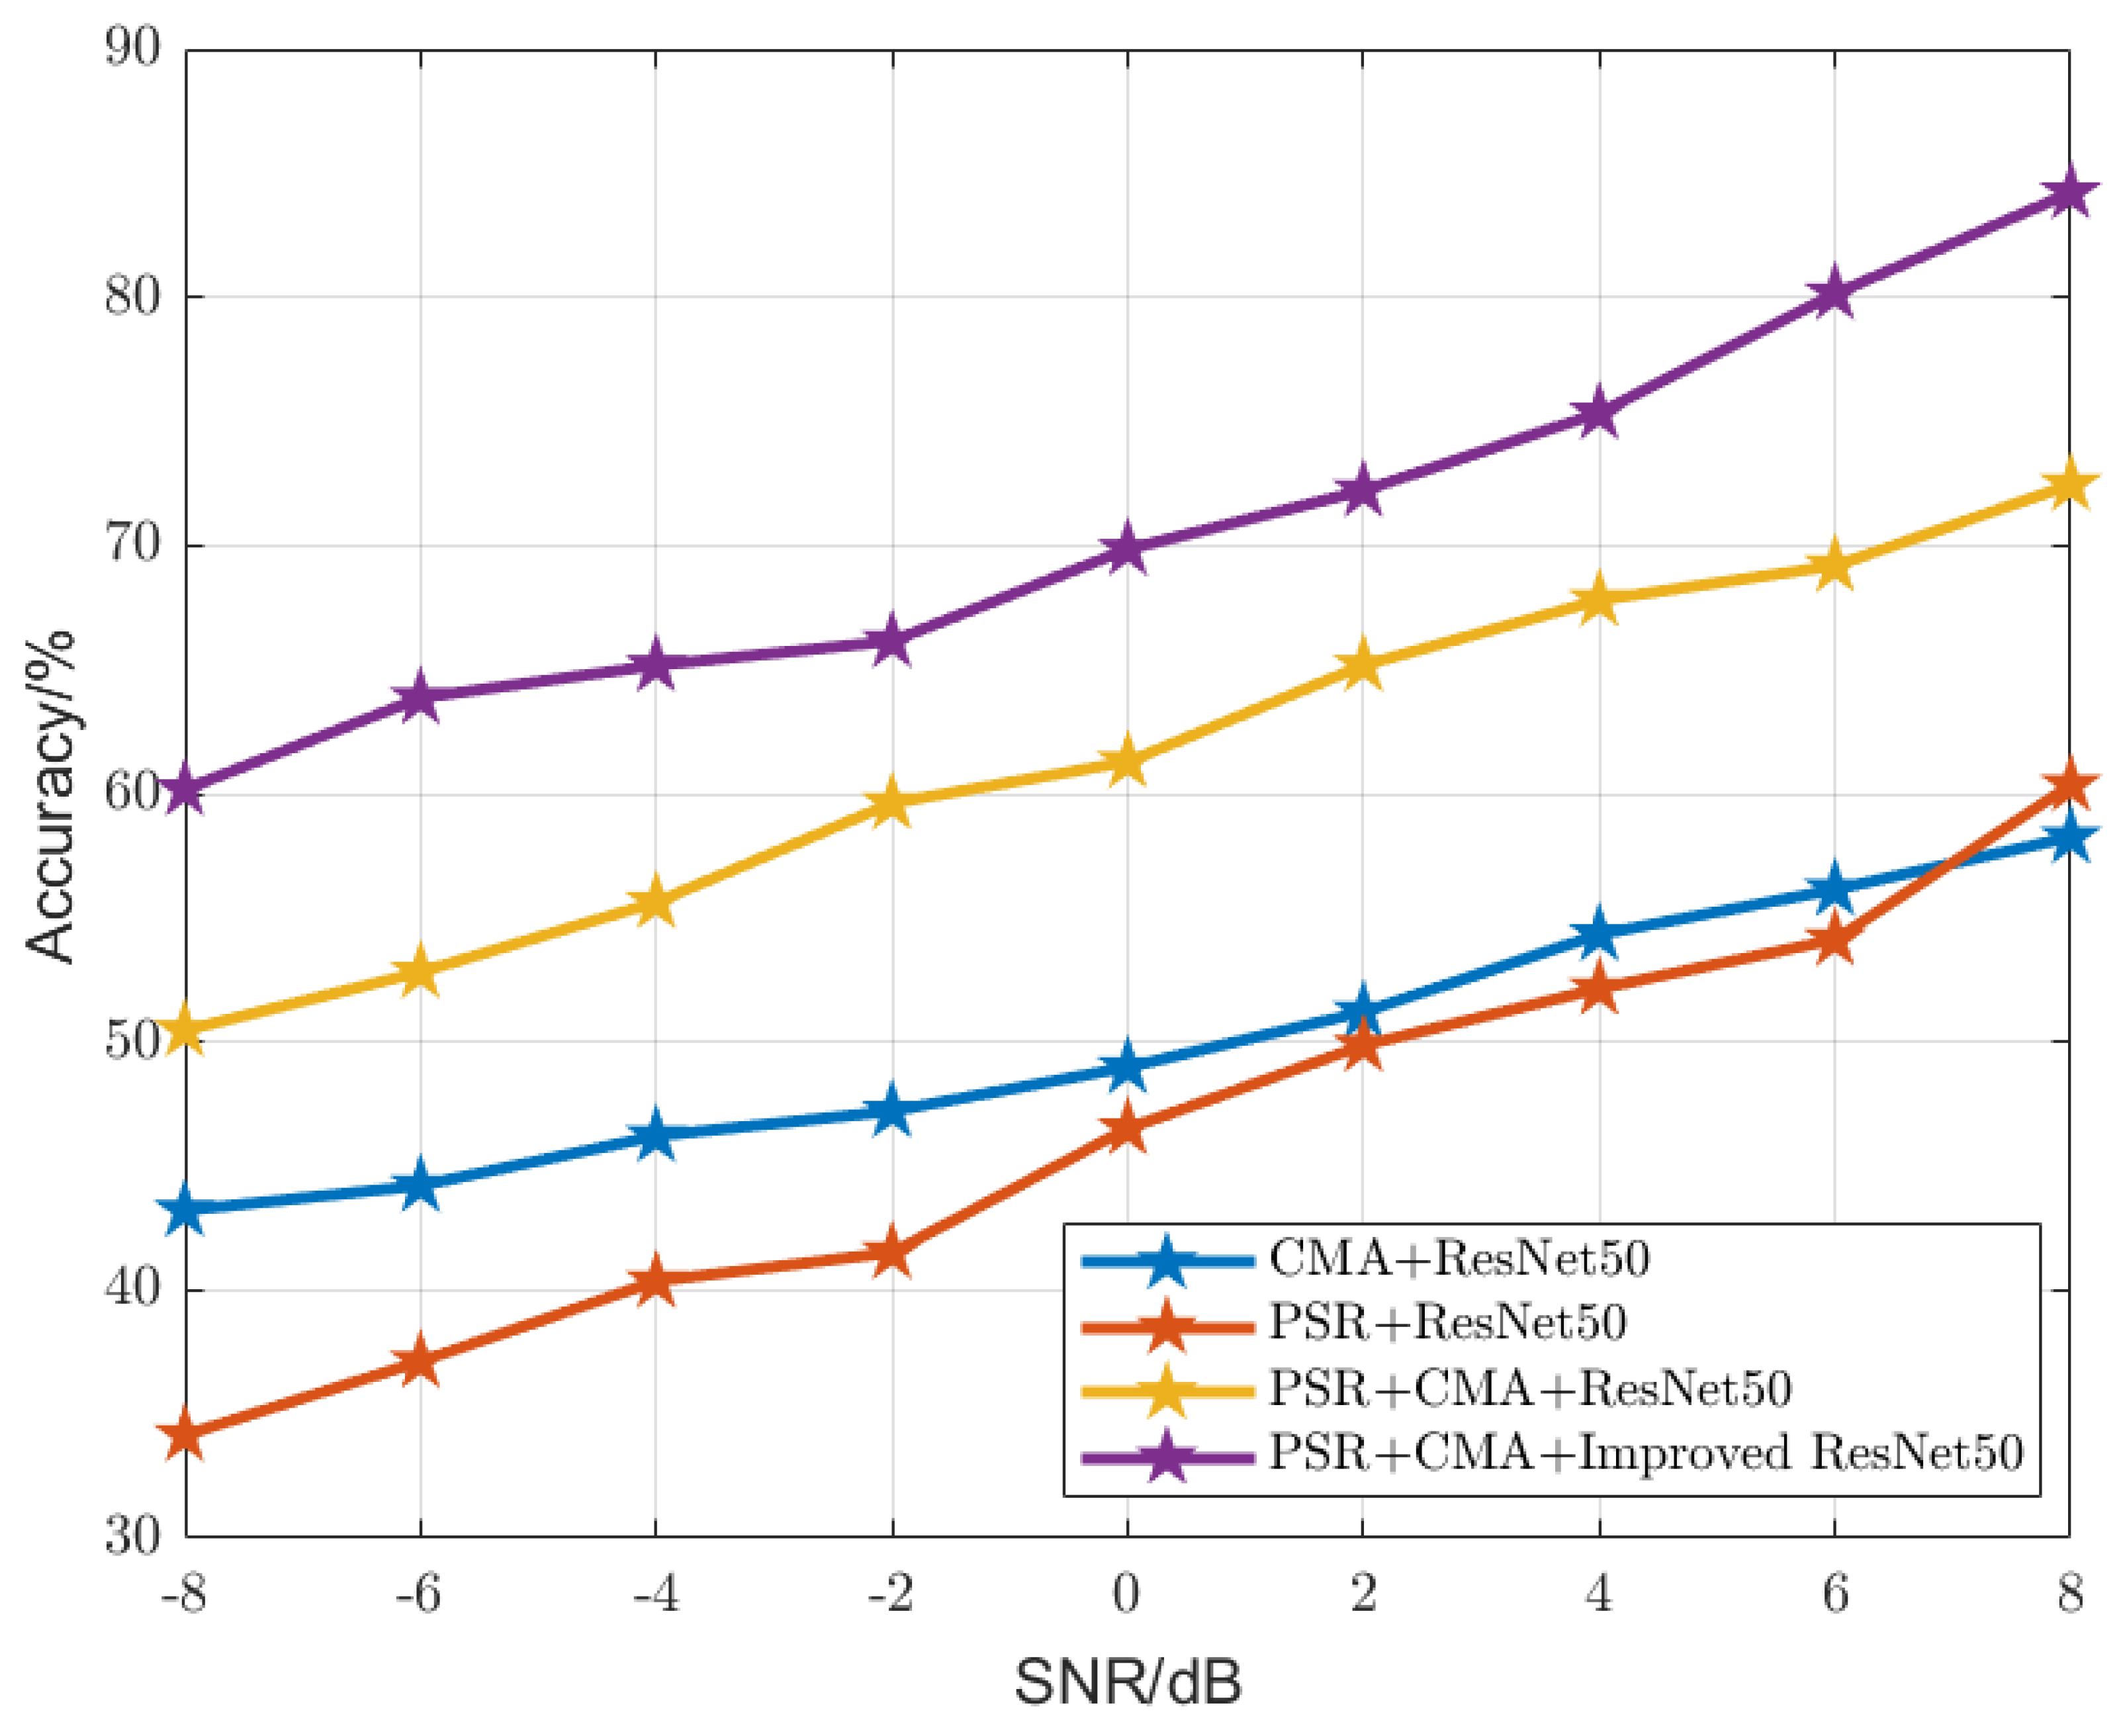
To further verify the rationality of our algorithm, we performed the following ablation experiment. For remote acquisition data, we set up four different sets of variables. We set the first group of variables as data processed only by CMA algorithm, the second group of variables as data processed only by the phase-space reconstruction algorithm; the third group of variables and the fourth group of variables are set to be processed by the CMA and phase-space reconstruction algorithm; however, the third group of data is identified by R e s N e t 50 model, and the first, second and fourth groups of data are identified by the improved model. The recognition results of the four groups of data are shown in Figure 11.
It can be observed that each step of our algorithm has its own significance, and the loss any link can not provide a full example of its maximum efficiency.
Our proposed algorithm is a systematic algorithm, and it is clear from the results that neither the blind equalization of the signal alone nor a phase-space reconstruction method yields satisfactory recognition results; the former is because the signal samples after the blind equalization are not a paradigm that allows the neural network to extract effective fingerprint features, and the latter is because it makes no sense to use the phase-space reconstruction directly on the signal without eliminating the signal multi-path effect. In addition, we can also find that the improved R e s N e t 50 model has a better recognition performance than the baseline R e s N e t 50 model, which, at the same time, illustrates that the data preprocessing method and the neural network model are indispensable in the deep learning-based radiation source identification.

4. Conclusions

Aiming at the problem that in a complex electromagnetic environment, the target radiation source is seriously affected by adverse factors such as multi-path effect and noise, and it being difficult to extract the separable fingerprint features, a blind equalization-based attractor feature space construction method is proposed. In the experiment, we firstly use the blind equalization algorithm which is suitable for the radiation source individual recognition task to preprocess the signal. Then, we construct the attractor feature space of the radiant source system based on this, and we discuss the adaptability of the feature space delay time and embedding dimension to neural networks. Experiments show that when the embedding dimension and delay time of all radiation source individual feature spaces are the same, the neural network is most suitable for the recognition task. Finally, we input the feature space into our deep learning model for individual recognition. Under this method, the final recognition rate of 10 radio stations is greatly improved compared with the original method, which verifies the effectiveness and feasibility of the proposed method, and has a certain practical significance for the individual recognition of communication radiation sources in the complex electromagnetic environment of the battlefield. In the future, we will continue to study and solve other factors that affect the identification effect of specific communication radiation sources in order to improve the robustness of specific radiation source identification.
In the next step, we will address the problem of the open-set identification of radiation sources in multi-path environments, and solve the open-set identification task by building mathematical models of transmitters, channels and receivers, and mining fingerprint features that better characterize individual radiation sources.

Author Contributions

Writing—original draft, W.S.; Supervision, Y.L., H.J. and F.T.; Funding acquisition, C.L. All authors have read and agreed to the published version of the manuscript.

Funding

This paper and research were supported by National Natural Science Foundation Project of College of Electronic Countermeasures, National University of Defense Technology No. (62071479).

Data Availability Statement

Data are contained within the article.

Conflicts of Interest

Author Caiyi Lou was employed by the company 36th Research Institute of China Electronics Technology Group Corporation. The remaining authors declare that the research was conducted in the absence of any commercial or financial relationships that could be construed as a potential conflict of interest.

References

  1. Huang, L.-Y. Influence of receiver distortion on fingerprint characteristics of modulator in individual recognition of radiation source. Telecommun. Eng. 2021, 61, 979–985. [Google Scholar]
  2. Toonstra, J.; Kinsner, W. Transient analysis and genetic algorithms for classification. In Proceedings of the IEEE WESCANEX 95, Communications, Power, and Computing, Conference Proceedings, Winnipeg, MB, Canada, 15–16 May 1995; pp. 432–437. [Google Scholar]
  3. Bengio, Y.; Simard, P.; Frasconi, P. Learning long-term dependencies with gradient descent is difficult. IEEE Trans. Neural Netw. 1994, 5, 157–166. [Google Scholar] [CrossRef] [PubMed]
  4. Wang, G.; Zou, C.; Zhang, C. Aircarft signal feature extraction and recogniton based on deep learning. IEEE Trans. Veh. Technol. 2022, 71, 9625–9634. [Google Scholar] [CrossRef]
  5. Tang, C.; Chang, Z.-W.; Liang, H.-H.; Zhang, L.-H.; Pang, B. Feature extraction method of HPLC communication signal based on genetic algorithm. IET Commun. 2022, 17, 1553–1561. [Google Scholar] [CrossRef]
  6. Xin, Q.; Hu, S.-H.; Liu, S.-Q.; Zhao, L.; Zhang, Y.-D. An Attention-Based Wavelet Convolution Neural Network for Epilepsy EEG Classification. IEEE Trans. Neural Syst. Rehabil. Eng. 2022, 30, 957–966. [Google Scholar] [CrossRef]
  7. Xing, C.-J.; Wang, L.-G. Radio individual recognition using deep neural networks and ensemble learning. Telecommun. Eng. 2021, 61, 1059–1065. [Google Scholar]
  8. He, K.-M.; Zhang, X.-Y.; Ren, S.-Q.; Sun, J. Identity mappings in deep residual networks. In Computer Vision—ECCV 2016: 14th European Conference, Amsterdam, The Netherlands, 11–14 October 2016, European Conference on Computer Vision; Springer: Berlin/Heidelberg, Germany, 2016. [Google Scholar]
  9. Tang, J.; Deng, C.; Huang, G.-B.; Zhao, B. Compressed-Domain ship detection on spaceborne optical image using deep neural network and extreme learning machine. IEEE Trans. Geosci. Remote Sens. 2015, 53, 1174–1185. [Google Scholar] [CrossRef]
  10. Doukim, C.; Dargham, J.; Chekima, A.; Omatu, S. Combining neural networks for skin detection. Signal Image Process. Int. J. 2018, 1, 1–11. [Google Scholar]
  11. He, B.; Wang, F. Specific Emitter Identification via Sparse Bayesian Learning Versus Model-Agnostic Meta-Learning. IEEE Trans. Inf. Forensics Secur. 2023, 18, 3677–3691. [Google Scholar] [CrossRef]
  12. Zhao, Y.; Wang, X.; Huang, Z. Concentrate on Hardware Imperfection via Aligning Reconstructed States. IEEE Commun. Lett. 2022, 26, 2934–2938. [Google Scholar] [CrossRef]
  13. Lin, S.-C.; Wang, P.; Akyildiz, I.F.; Luo, M. Towards optimal network planning for software-defined networks. IEEE Trans. Mobile Comput. 2018, 17, 2953–2967. [Google Scholar] [CrossRef]
  14. Ma, J.-T.; Qiu, T.-S.; Quan, T. Fast blind equalization using Bounded Non-Linear Function with Non-Gaussian noise. IEEE Commun. Lett. 2020, 24, 1812–1815. [Google Scholar] [CrossRef]
  15. Guo, Y.-C. Swarm Intelligence and Computational Intelligence Optimization Based Blind Equalization Algorithm; Tsinghua University Press: Beijing, China, 2018; pp. 4–5. [Google Scholar]
  16. Yang, D.-L.; Zhang, J.; Chen, Q.-Z. Multi-mode blind equalization carrier synchronization joint architecture and analysis. Signal Process. 2014, 30, 665–673. [Google Scholar]
  17. Yuan, J.; Lin, T. Equalization and carrier phase recovery of CMA and MMA in blind adaptive receivers. IEEE Trans. Signal Process. 2010, 58, 3206–3217. [Google Scholar] [CrossRef]
  18. Zhao, Y.-R.; Huang, Z.-T.; Wang, X. A Review of Individual Radiation Source Recognition Systems Based on Phase Space Reconstruction; School of Electronic Science, National University of Defense Technology: Changsha, China, 2022. [Google Scholar]
  19. Noakes, L. The Takens Embedding Theorem. Int. J. Bifurc. Chaos 1991, 1, 867–872. [Google Scholar] [CrossRef]
  20. Packard, N.-H.; Crutchfield, J.-P.; Farmer, J.-D. Geometry from a Time Series. Phys. Rev. Lett. 1980, 45, 712. [Google Scholar] [CrossRef]
  21. Zhang, Y.; Ren, C.-L. Determine the method of reconstruction phase space dimension. J. Natl. Univ. Def. Technol. 2005, 101–106. [Google Scholar]
  22. Kennel, M.-B.; Brown, R. Determining embedding dimension for phase-space reconstruction using a geometrical construction. Phys. Rev. 1992, 45, 3403. [Google Scholar] [CrossRef] [PubMed]
  23. Cao, L. Practical method for determining the minimum embedding dimension of a scalar time series. Phys. Nonlinear Phenom. 1997, 110, 43–50. [Google Scholar] [CrossRef]
  24. Qian, Y.; Qi, J.; Kuai, X.; Han, G.; Sun, H.; Hong, S. Specific emitter identification based on Multi-Level sparse representation in Automatic Identification System. IEEE Trans. Inf. Forensics Secur. 2021, 16, 2872–2884. [Google Scholar] [CrossRef]
  25. Zhang, J.; Wang, F.; Dobre, O.A.; Zhong, Z. Specific emitter identification via Hilbert-Huang transform in Single-Hop and relaying scenarios. IEEE Trans. Inf. Forensics Secur. 2016, 11, 1192–1205. [Google Scholar] [CrossRef]
  26. Riyaz, S.; Sankhe, K.; Ioannidis, S.; Chowdhury, K. Deep learning convolutional neural networks for radio identification. IEEE Commun. Mag. 2018, 56, 146–152. [Google Scholar] [CrossRef]
  27. Hinton, G.E.; Salakhutdinov, R.R. Reducing the dimensionality of data with neural networks. Science 2006, 313, 504–507. [Google Scholar] [CrossRef] [PubMed]
  28. Krizhevsky, A.; Sutskever, I.; Hinton, G.E. Imagenet classification with deep convolutional neural networks. Adv. Neural Inf. Process. Syst. 2012, 25, 1097–1105. [Google Scholar] [CrossRef]
  29. He, K.; Zhang, X.; Ren, S.; Sun, J. Deep residual learning for image recognition. Comput. Vis. Pattern Recognit. 2015, 770–778. [Google Scholar]
  30. Liu, J.-L.; Jiang, Q.; Wang, J.; Huang, H. Specific emitter identification at different time based on multi-domain migration. In Proceedings of the 2022 APSIPA Annual Summit and Conference, Chiang Mai, Thailand, 7–10 November 2022. [Google Scholar]
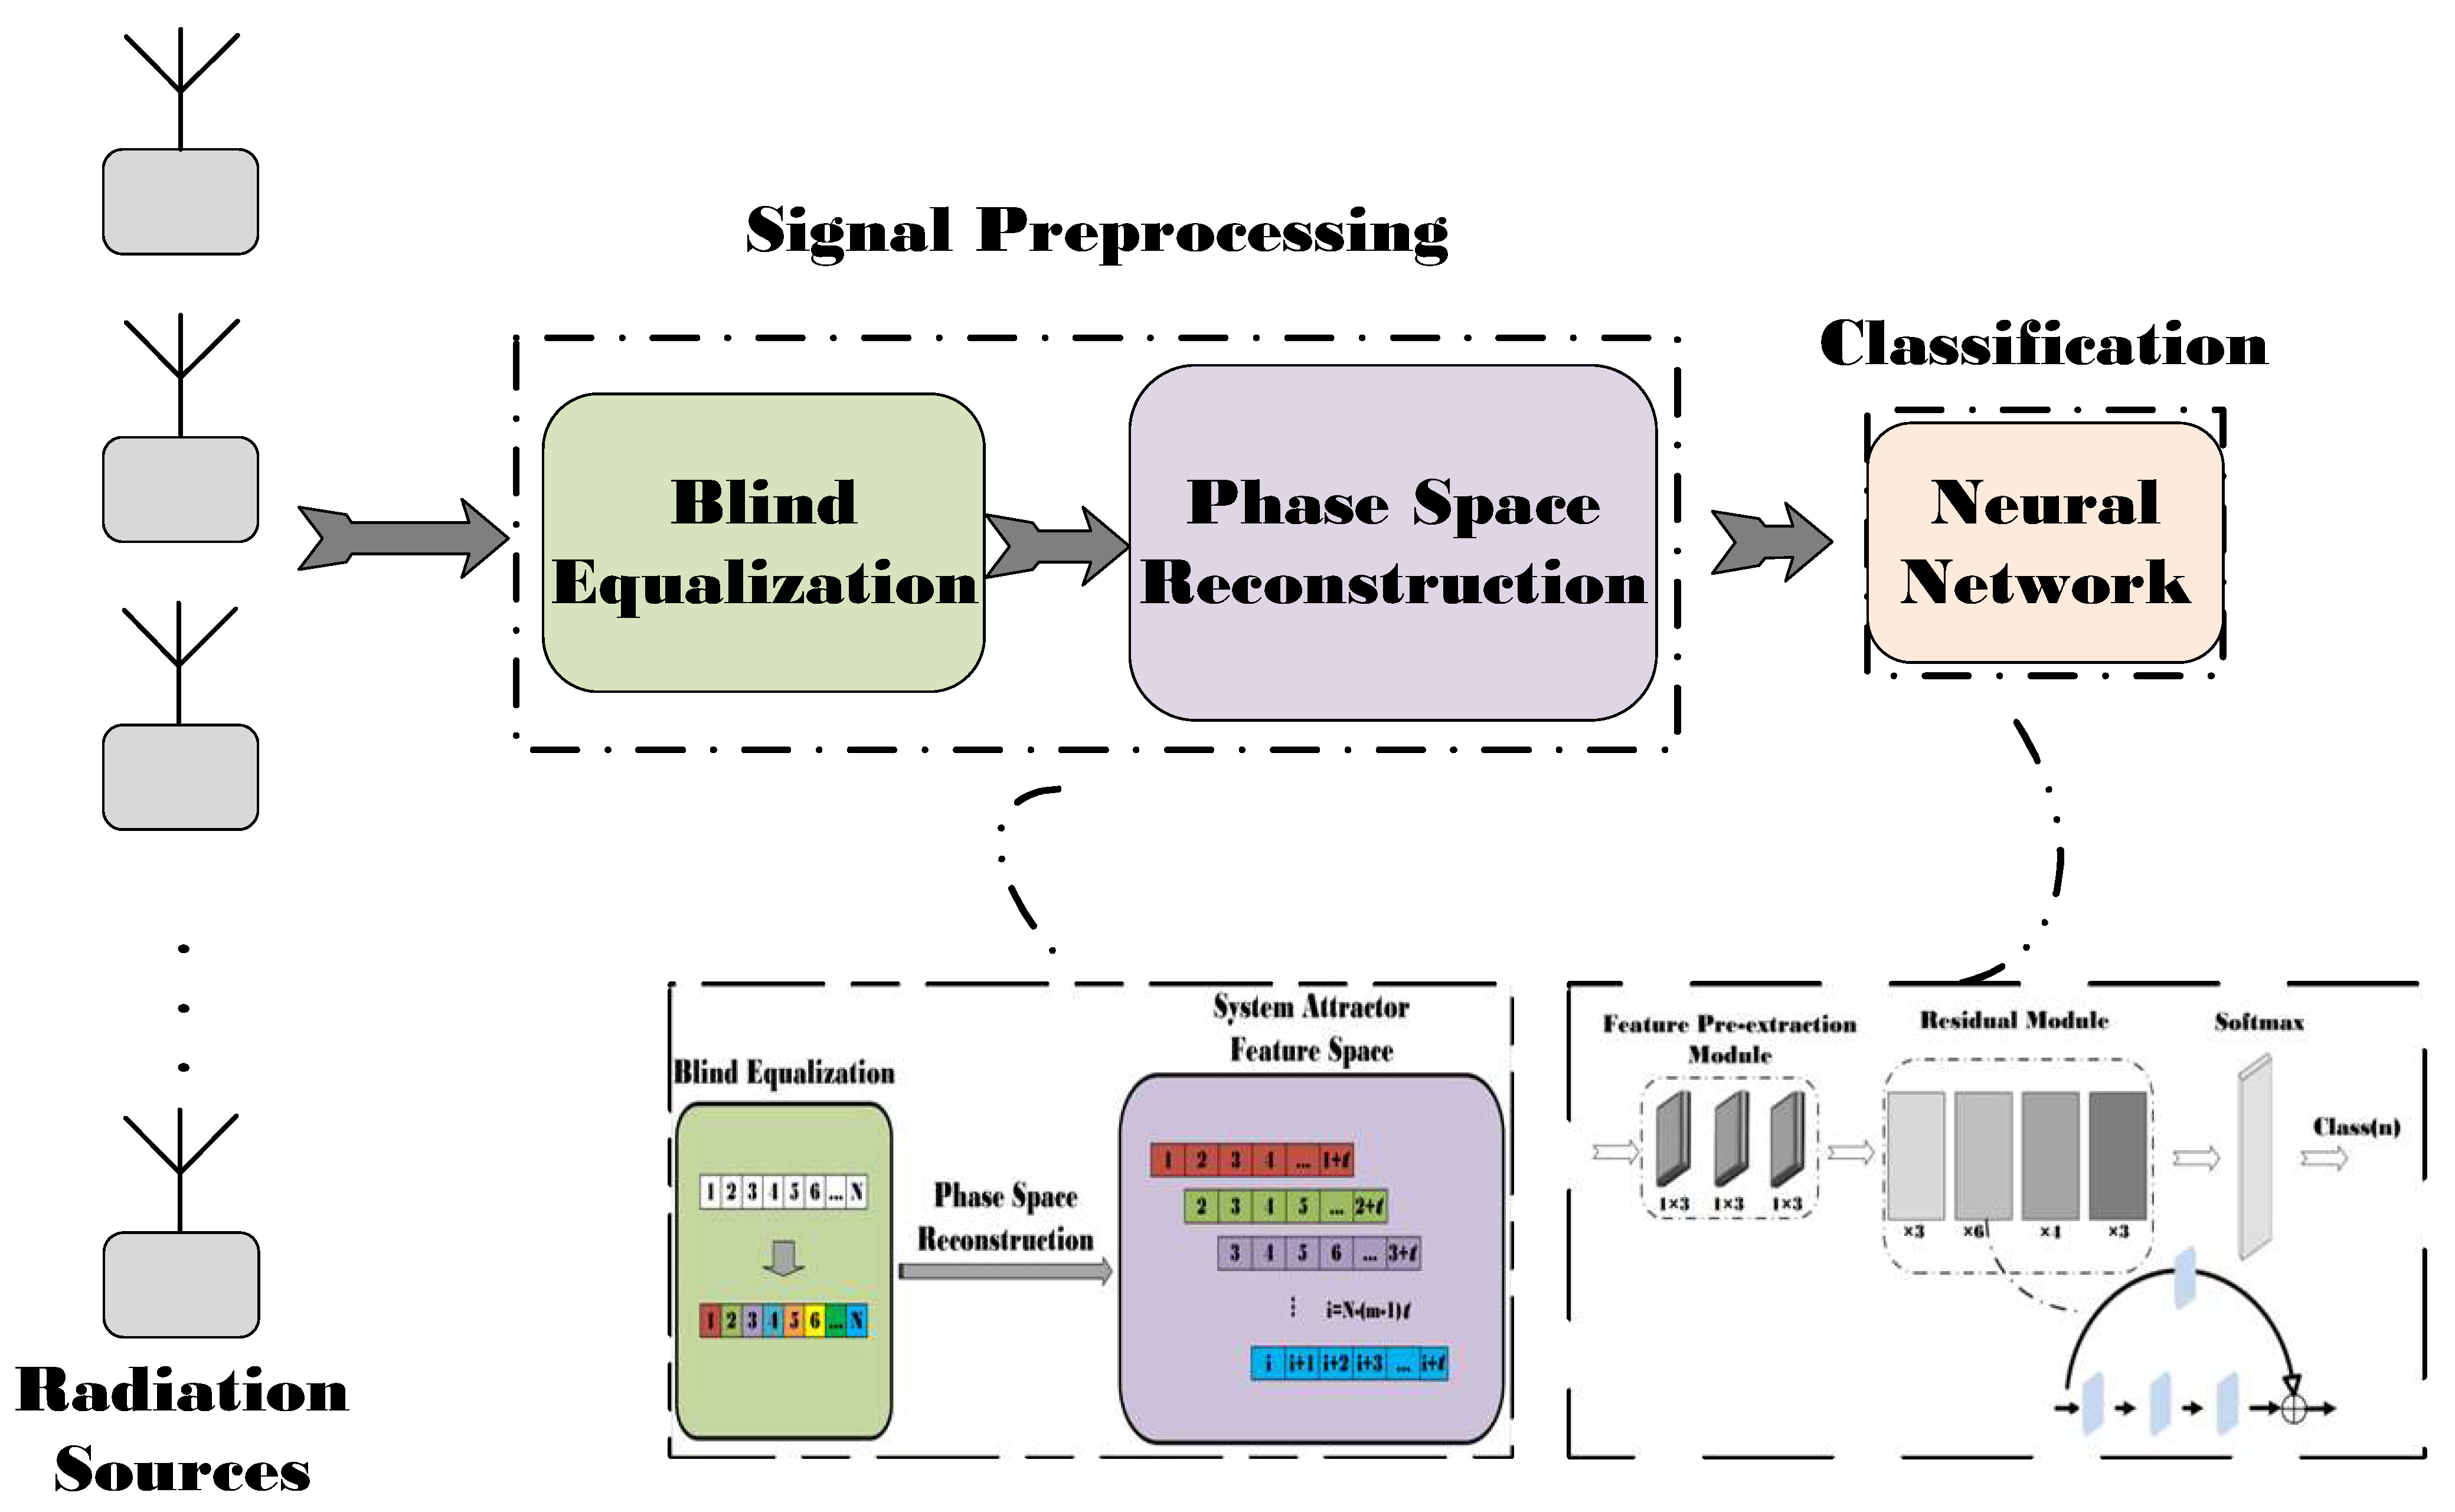
Figure 1. The specific flow chart of the proposed algorithm.
Electronics 13 00611 g001
Figure 2. CMA algorithm structure diagram.
Electronics 13 00611 g002
Figure 3. System attractor feature space construction process.
Electronics 13 00611 g003
Figure 4. (a) ResNet50 residual block; (b) Improved residual block.
Electronics 13 00611 g004
Figure 5. The structure of improved module.
Electronics 13 00611 g005
Figure 6. Data set acquisition diagram.
Electronics 13 00611 g006
Figure 7. Signal time-domain diagram.
Electronics 13 00611 g007
Figure 8. The performance of the same network model on different data.
Electronics 13 00611 g008
Figure 9. The comparison of CMA and MMA.
Electronics 13 00611 g009
Figure 10. Experimental comparison result.
Electronics 13 00611 g010
Figure 11. Ablation experiments results.
Electronics 13 00611 g011
Table 1. The delay time and embedding dimension of ten stations.
Radio12345678910
m21231630212340303016
τ 3222223222
Table 2. Performance comparison results.
SNR−8−6−4−202468
Algorithms
C F N O 43.12%45.68%46.39%48.31%51.88%53.19%54.36%55.28%57.58%
D S N 46.91%48.67%51.28%52.91%54.04%55.24%57.31%59.82%61.93%
N E G A N 60.88%62.27%64.11%65.97%67.82%69.08%72.34%74.86%76.11%
O u r s 60.28%63.89%65.28%66.48%70.31%73.67%76.68%81.39%84.21%
Disclaimer/Publisher’s Note: The statements, opinions and data contained in all publications are solely those of the individual author(s) and contributor(s) and not of MDPI and/or the editor(s). MDPI and/or the editor(s) disclaim responsibility for any injury to people or property resulting from any ideas, methods, instructions or products referred to in the content.