Abstract
Eye stimulation research plays a critical role in advancing our understanding of visual processing and developing new therapies for visual impairments. Despite its importance, researchers and clinicians still face challenges with the availability of cost-effective, precise, and versatile tools for conducting these studies. Therefore, this study introduces a high-resolution, compact, and budget-friendly multi-wavelength LED light source tailored for precise and versatile eye stimulation, addressing the aforementioned needs in medical research and visual science. Accommodating standard 3 mm or 5 mm package LEDs, the system boasts broad compatibility, while its integration with any microcontroller capable of PWM generation and supporting SPI and UART communication ensures adaptability across diverse applications. Operating at high resolution (18 bits or more) with great linearity, the LED light source offers nuanced control for sophisticated eye stimulation protocols. The simple 3D printable optical design allows the coupling of up to seven different wavelengths while ensuring the cost-effectiveness of the device. The system’s output has been designed to be fiber-coupled with standard SMA connectors to be compatible with most solutions. The proposed implementation significantly undercuts the cost of commercially available solutions, providing a viable, budget-friendly option for advancing eye stimulation research.
1. Introduction
The human visual system is a complex and sophisticated mechanism, pivotal in our perception of the surrounding world. Various applications, ranging from medical research [1,2] to visual science [3,4], depend on the precise and controlled stimulation of the eyes. Therefore, the development of specialized tools for eye stimulation [5,6] has become increasingly crucial for advancing these diverse fields. However, a significant issue in the widespread adoption of eye stimulation technologies lies in the limitations posed by current commercially available multi-wavelength tunable LED light sources, such as Thorlabs’ Chrolis [7], Roithner LED multi-F [8] or the more compact Mightex, which goes up to 8 wavelengths [9].
Indeed, currently available eye stimulation systems are generally expensive (often reaching into the thousands of euros) [9,10], and often do not meet the special needs requested for modern vision research purposes [11,12,13]. Among all, light intensity resolution is one of the most significative limitations, typically being in the range of 10 bits (%), while the vision science field requires much more precision as the diverse range of the human visual system extends from to cd/m2 [14]. These aspects usually render commercially available options inaccessible to a broader spectrum of small research and medical laboratories, forcing scientists to build their own stimulators [2,15,16,17]. Furthermore, many of these systems are characterized by a lack of possibility of customization, operating as a sort of black boxes that hinder users from tailoring the configuration and stimulation parameters to specific requirements. Finally, the above-mentioned constraints impede the widespread dissemination and practical application of eye stimulation technologies, particularly in portable settings where flexibility and affordability are paramount [18,19,20].
Therefore, in response to these challenges, in this paper, we introduce and describe a flexible solution for eye stimulation, specifically a compact and cost-efficient multi-wavelength LED light source designed explicitly to be easily customizable, compact, and affordable. In particular, our system aims to address the existing limitations by prioritizing extensibility, empowering users to finely tune the parameters of eye stimulation, such as wavelength selection and optical coupling, to meet the unique demands of diverse applications.
The proposed LED light source accommodates standard 3 mm or 5 mm package LEDs, ensuring broad compatibility while facilitating integration with any microcontroller capable of pulse-width modulation (PWM) generation and supporting serial peripheral interface (SPI) communication. This adaptability across diverse applications is a pivotal feature, enabling seamless incorporation into several research and real-world settings. Moreover, operating at a high intensity and high spatial resolution, within a range of up to 18 bits or more, and microseconds time resolution, the configurable LED light source offers nuanced control essential for implementing sophisticated eye stimulation protocols.
In addition to these technical configurations, the cost-effectiveness of our LED light source is improved by the possibility of 3D printing the mounting components and supports using standard Fused Deposition Modeling (FDM) commercial printers [21,22,23]. This feature not only contributes to its affordability but also enhances its versatility by providing users with the means to customize and adapt the system to specific experimental setups. Furthermore, the system’s output can be efficiently fiber-coupled with inexpensive plastic fibers [24], offering a cost-effective alternative to traditional coupling methods. By significantly undercutting the cost of commercially available fiber-coupled LED light sources [7,8,9], our solution establishes itself as a specific, accessible, and budget-friendly choice for researchers and practitioners engaged in eye stimulation research applications.
In summary, the main novel contributions introduced by the proposed LED light source system are the following:
- Resolution: our LED light source presents high-intensity resolution, up to 18 bits (or more), and high time resolution in the order of microseconds by the combination of PWM and LED peak current while keeping a high linearity.
- Flexibility: the proposed LED light source can be used with any standard 3 mm or 5 mm package LEDs and up to 7 different wavelengths. In addition, it is possible to control the system with any microcontroller capable of generating PWM and with SPI communication.
- Portability: the whole LED light source can be embedded in any compact device as the realized prototype optic is about 100 mm long, 46 mm wide, and 20 mm thick, while the electronic board for up to five LEDs is less than mm.
- Affordability: our LED light source is conceived to limit the cost of the solution. For instance, inexpensive mounting and supports can be produced with simple commercially available filament FDM printers. The output can be fiber coupled with cheap plastic fibers.
2. Materials and Methods
Figure 1 illustrates an overview of the proposed LED light source.
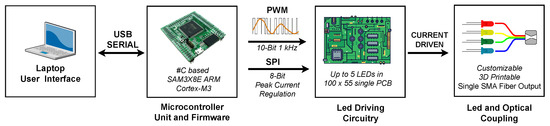
Figure 1.
Schematic overview of the proposed LED light source. In particular, four different modules are highlighted and further described in Section 2.
The system can be divided into a few blocks:
- A generic PC-based user interface that communicates with the device through simple serial commands to configure and customize the output light configuration;
- A general purpose 32-bit microcontroller board with PWM, SPI, and UART (Universal Asynchronous Receiver–Transmitter) communication availability, which handles data communications and controls the driving circuitry as detailed in Section 2.1);
- Driving electronics, thus including the drivers and circuitry necessary for the correct setting of the average and peak LED current, which enables setting the intensity with up to 18-bit resolution for each wavelength. These aspect are further described in Section 2.2;
- Standard 3 mm or 5 mm LEDs with custom 3D printable and low-cost optics to achieve single SMA optical coupling, fully described in Section 2.3).
In the following subsections, each block description is provided.
2.1. Microcontroller Unit and Firmware
The main control unit used for the LED light source is an Atmel-based SAM3X8E ARM Cortex-M3 micro-controller (32-bit architecture) produced by Microchip Technology (Microchip Technology Inc, Chandler, AZ, USA) embedded in a compact form factor ( mm) board [25] and with up to 116 I/O pins. The microcontroller is the same one used in the popular Arduino Due board [26] and can be programmed with the user-friendly Arduino IDE [27] as well as any other C-based Integrated Development Environment (IDE). Additional information can be found in the relative datasheet [28].
In our LED light source, the micro-controller is responsible for the following tasks:
- Handling the low-level serial communication that allows the configuration of the light output from any type of device equipped with UART communication, e.g., the personal computer.
- Generation of PWM signals to control the LEDs dimming (i.e., ON and OFF state) and intensity modulation;
- Handling SPI communication with the digital potentiometer on the electronics board to set the peak current of each LED (see Section 2.2).
More specifically, using the 32-bit based board, which besides the more advanced and performing microcontroller is equipped with an 84 MHz clock frequency, allows the generation of proper digital signals (PWM) with variable duty cycle (DC) to control each LED’s average light intensity and eventually synthesize analog modulation of the output light intensity, i.e., sinusoidal modulations or square wave modulation. This has been made possible by using the microcontroller’s internal timer which has been manually set to run at = 100 kHz frequency, i.e., 10 s time resolution. Generally speaking, depending on the PWM frequency () used to dim the LED average output light, the DC resolution limit () can be derived as follows:
We decided to use a duty cycle resolution of (10-bit) by employing a variable modulation frequency, Hz. This approach optimizes modulation frequency according to the duty cycle, aiming to minimize color flickering perceived by the subject while ensuring a software-limited minimum time resolution of 10 s. These settings are based on the consideration that human eyes are sensitive to light flicker [29]. The flicker fusion threshold, also known as the Critical Flicker Frequency (CFF) [30], represents the frequency above which flicker is no longer perceived, and the light appears continuous. As long as the modulation frequency remains above this threshold, the perceived intensity can be changed by altering the relative periods of light and darkness, also known as the Talbot–Plateau law. The CFF determines the frequency at which a flickering light appears steady to the average human observer and can be affected by numerous factors, such as the wavelength of illumination, light or dark adaptation, illumination intensity, and many others [31,32]. Research [33,34] suggests that most people’s maximum ability to detect flicker typically ranges between 50 and 90 Hz. However, recent studies indicate that the human eye may be capable of detecting higher flicker rates than previously thought [33].
Besides the generation of PWM that is necessary to control each LED intensity, the microcontroller communicates through SPI with the digital potentiometers (see Section 2.2 for details), where the peak current of each LED can be further adjusted with 8-bit resolution.
Lastly, firmware handles an additional serial (UART) communication with an external device that can be used to configure and control light stimulation protocols and basic light tests. The developed firmware handles an additional second-level modulation (over PWM) that can be used to synthesize the most common analog or digital waveforms, especially simple low-frequency square waves, flashes, sine waves, or linear ramps. Since, in our case, the first-level modulation (PWM) has a minimum frequency of 100 Hz, to keep the full 18-bit resolution, the second-level modulation must have the same or slower frequency, i.e., a minimum time resolution of = 10 ms.
2.2. LED Driving Circuitry
A straightforward and efficacious method for regulating a generic LED-based apparatus involves controlling the forward current, given the nearly linear correlation between forward current and output optical power in solid-state sources [35]. It has been noted previously that the primary approach to adjusting the luminosity of LED sources is by modulating the average forward current using digital modulation techniques, such as pulse-width modulation (PWM), wherein the duty cycle of the signal is variable. This manipulation entails altering the ratio of ON time to OFF time without affecting the peak forward current. However, merely manipulating the duty cycle, even with advanced microcontroller units or purpose-built chips capable of 16-bit precision, often proves not enough to adequately stimulate the diverse range of the human visual system, which spans from to cd/m2 [14]. Consequently, there arises a crucial need to explore and develop more sophisticated driving techniques to effectively meet these demands.
As presented in this section and as detailed in Section 2.2, the driving scheme presented in Figure 2 combines a boost-led driver CAT4238 [36] and a digital potentiometer AD4803 [37] which allows controlling both average and peak current of each LED independently. This allowed us to extend further the control of the emitted light intensity to a total of 18-bits given by: 8-bit resolution on the LED peak current regulation and 10-bit resolution provided by our PWM modulation, implemented through a CAT4238 SHDN pin.
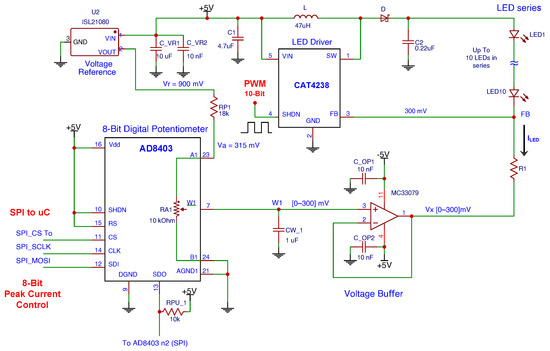
Figure 2.
Schematic of the LED driving circuitry realized. The schematic can be used to drive up to 10 LEDs in series. In our case, the above circuit is used for each primary, which is constituted by a single LED. A single PWM signal can be used to turn ON or OFF the less or to modulate the intensity with a 10-bit resolution. An SPI interface is also used to set the 8-bit digital potentiometer, thus giving an additional 8-bit resolution on the current peak intensity.
Circuit Detailed Description
First of all, the choice of the led driver fell on the CAT4238 driver from On Semiconductor [36]. CAT4238 is a high-efficiency, boost-led driver, with the capability to power up to 10 LEDs in series with a maximum current of 100 mA. In our case, the described circuit is used for each primary wavelength, which is constituted by a single LED. Moreover, the driver allows adjustable output LED current and PWM modulation up to 1 kHz. The chip is available in a tiny SOT23 package ( mm for width, length, and height, respectively) suitable for space-critical applications.
As can be noted in Figure 2, the reference LED’s current () is simply given by the formula:
where is the fixed feedback voltage at the FB node (nominally equal to 300 mV), i.e., pin 3 of the LED driver CAT4238, is the voltage at the output of the operational amplifier MC33079, and R1 is the fixed resistance connected between the two nodes.
It can be inferred that by changing the voltage value it is possible to tune the LED output current, i.e., output light intensity during the ON state. As a consequence, the max is obtained when the R1 is tied between and virtual ground ( V). In the realized circuit, can be set for each color as it regulates the maximum current that can flow through each LED. The variable voltage was then obtained by the conditioning circuit shown in Figure 2.
The variable voltage is generated starting from a 900 mV voltage reference ISL2108 from Renesas Electronics [38] and a digitally programmable resistive divider, realized with a digital potentiometer, the AD8403 [37]. The AD8403 provides a quad-channel, 8-bit (256-positions), digitally controlled variable resistor device. The device is digitally programmable through the SPI interface. The resistance between pin A1 and pin B1 is fixed to 10 k, while the wiper position (referred to as W1) can be programmed with a standard microcontroller provided with SPI interface protocol. Each chip can be connected in a cascade to be serially programmed. For the system described here, a total of 4 digital potentiometers are required; thus, it can be achieved with only a single chip.
It is worth noting that the ISL2108 provides a precise and stable voltage reference that is of fundamental importance for the constant current generation. Any variation in this voltage is directly reflected in LED current variation, and thus in unwanted variations in output light intensity. By adding resistance , the voltage at pin A1 is then fixed to be slightly above 300 mV. By programming the AD8403 with a digital value in a range from 0 to 255, the voltage at the W1 wiper pin can go from 0 to 315 mV, respectively. A voltage W1 equal to 0 V gives the maximum LED current, that is . Setting W1 voltage higher than 300 mV gives no current on LEDs, since V. The output buffer (Av = 1) stage is added to avoid the breakdown of the digital potentiometer since it can only support an absolute maximum current of ±5 mA between W1 and B1. For the buffer stage, the selection of the amplifier is also critical. A low noise, low offset, low output impedance amplifier capable of sinking the entire is required. Unfortunately, with a single supply, the output stage of any operational amplifier, even rail-to-rail ones, is limited to a few dozen mV when sinking high currents. For that reason, the choice of dual supply was the only alternative to obtain output signal swiping between 0 and 300 mV. Considering all these requirements, the choice for the operational amplifier fell on the Low Noise Quad Operational Amplifier MC33079 provided by On Semiconductor [39].
As can be seen by observing Figure 2, the current can be further modulated by connecting a PWM digital signal to the SHDN pin of the CAT4328 LED driver.
2.3. LEDs and Optical Coupling
The last element of the system is the mechanical design and optical coupling of the light generated by the sources. To generate visible light four 5 mm LEDs types with different peak emission wavelengths (RGBY illumination, namely red, green, blue, and yellow) have been used. In Table 1, the main specifications of the selected LEDs are reported.

Table 1.
Specifications of selected Roithner LEDs used for eye stimulation.
As can be seen in the table, we opted for high-brightness standard LEDs in a 5 mm package from Roithner (Roithner Lasertechnik GmbH, Vienna, Austria). As shown in Figure 3, the four RGBY 5 mm LED housings are constituted by part A which can be easily swapped to accommodate 3 mm LEDs as well.
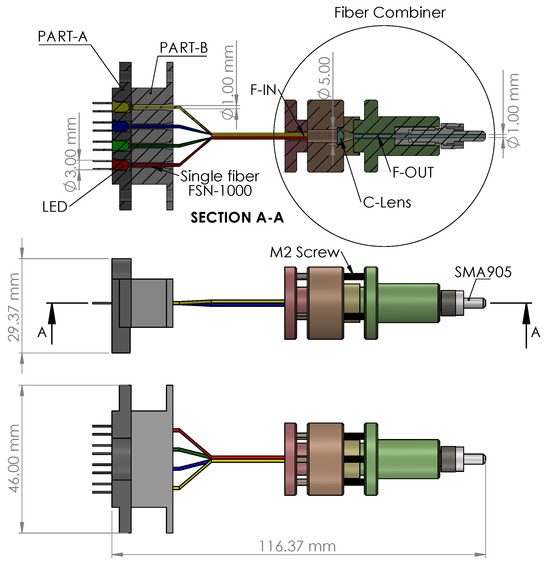
Figure 3.
LED light source prototype assembly drawing on SolidWorks (Dassault Systèmes, Vélizy-Villacoublay, France). On the top left (section A-A), parts A and B allow the coupling between the four LEDs and single FSN-1000 1 mm core fibers, while on the right, the collimator lens (C-Lens) allows the imaging of the light coming from the four-fiber bundle (F-IN) into a single 1 mm core fiber (F-OUT). As shown in the middle view, the custom light combiner ends with the single SMA905 fiber connector, while standard M2 screws keep the parts tight together. The top view of the LED light source is depicted at the bottom of the figure and shows the overall width and length of the assembly.
We have selected cheap polymethyl methacrylate 1 mm core FSN-1000 optical fibers with 0.51 Numerical aperture ( acceptance angle). The four fiber ends are aligned and placed in close contact with the four LEDs through part B (Figure 3) inside which they have been glued with clear epoxy.
The low full-width emission angle, also known as the viewing angle, of an LED is a measure of how wide the angle of light emission is from the LED. It is typically measured in degrees and it describes the angle at which the intensity of the light emitted by the LED is half of its maximum intensity. In our case, 15° full-width emission angle has been chosen to maximize the light entering into the optical fiber as it is lower than the selected fiber acceptance angle (). The light coming from the four-fiber bundle is mixed with the last stage of the LED light source shown in Figure 4.
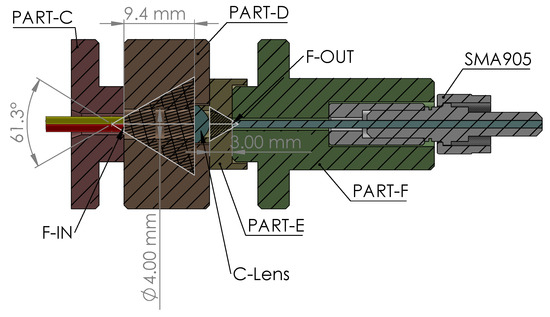
Figure 4.
Details of the fiber combiner. As input (F-IN), the four 1 mm core fibers (FSN-1000) have been glued together inside a cavity (part A) with clear epoxy. Part C, part D, and part E provide housing and correct spacing for the aspheric collimator lens (C-Lens) [40] used to image the fiber bundle into one single FNS-1000 fiber (F-OUT). In this case, the longer the output fiber, the more uniform the mixing will be. Part F provides housing for the single SMA905 [41] output connector. The fiber combiner is kept together with three standard M3 screws placed at 120°.
While the described coupling method is cost-effective, compact, and customizable, it suffers from efficiency loss and uneven light mixing. These issues can be mitigated by implementing a two-lens focusing system to increase overall optical power and minimize light loss introduced from thick fibers with large numerical aperture (NA). Additionally, by extending the output fiber, it would be possible to enhance beam uniformity as the refractive index of the fiber core may slightly vary with wavelength, which can affect the propagation characteristics of light in the fiber.
In the development of our multi-wavelength LED light source, a key focus was on achieving a compact, modular design that leverages the accessibility of 3D printing technology. Figure 5 presents the fully assembled prototype, illustrating its modularity and compactness, with the possibility to self-3D-print the various mounting components.
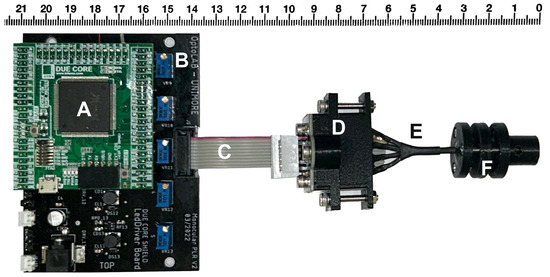
Figure 5.
The figure shows an assembled multi-wavelength LED light source, showcasing its compact design and the possibility to be modular and easily 3D printable. In the figure, A is the microcontroller board (DUE CORE), B is the PCB board with driving circuitry, C is the flexible connection cable for LEDs current, D indicates the 3D printable holders to connect 5 mm standard LEDs and FSN-1000 fibers, E is the four-fiber bundle and F is the fiber combiner depicted in Figure 4.
This prototype demonstrates the practical realization of our previously described design concepts, highlighting the system’s user-friendly assembly and flexible configuration which allows us to mount and adapt the device to many portables and compact diagnostic tools.
3. Characterization Results and Discussion
The characterization of the LED light source is performed with the help of two lab instruments:
- Spectrometer: Hamamatsu PMA-11 [42]. The C5966-31 integrated into the Hamamatsu PMA-11 is a CCD linear image sensor with 1024 sensitive channels ranging from 300 nm to 800 nm and a wavelength resolution lower than 3 nm. The fiber-coupled optical head is wavelength and sensitivity calibrated, while the exposure time has been set to 19 ms for all the measurements.
- Power meter: the Newport (Irvine, CA, USA) 1918R model coupled with a 918d-UV-od3 optical head designed for radiant flux between 20 pW to 200 mW in the 200–1100 nm wavelength range; it has a sensitive area of mm and a typical uncertainty of in the visible range. Additionally, we ensured proper optical head alignment to guarantee that the entire output radiant flux effectively reached the sensor’s sensitive area.
The measurements were carried out on LEDs under controlled environmental conditions and with each color being lit independently.
3.1. Sources Output Spectra Measurement
The spectral characterization of a multi-wavelength LED light source for human eye stimulation is a crucial aspect of understanding the emitted light color coverage over a standard human visual range. In our study, we conducted spectral emission analysis using a Photonic Multichannel Spectral Analyzer, specifically the PMA-11 produced by Hamamatsu [42]. This tool allowed us to comprehensively evaluate the spectral distribution of the light emitted by our sources. Figure 6a below shows the normalized spectral distribution of the three LED sources used and Figure 6b shows the CIE 1931 color space diagram [43] with our configuration coverage.
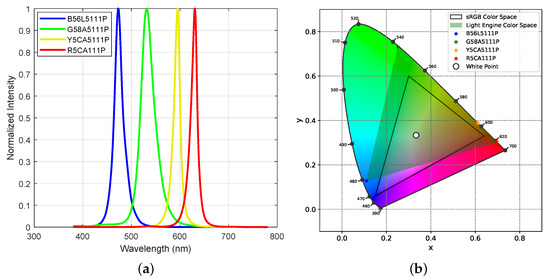
Figure 6.
(a) shows the normalized output spectra acquired with the Hamamatsu PMA-11 multichannel spectrometer, while (b) shows our device coverage of the standard CIE 1931 chromaticity diagram and the comparison with the standard sRGB color space.
Furthermore, in Figure 6b, we juxtaposed our configuration’s color coverage with the sRGB standard color space [44], renowned for its use of the primary colors red, green, and blue. sRGB is widely recognized for providing a uniform color representation across screens, displays, and printers.
A visual inspection reveals that our selected LEDs outperform sRGB in terms of green and red wavelengths while exhibiting a gap in coverage around the blue color spectrum. This deliberate choice stemmed from our selection of the blue LED (B56L5111P), tailored to align more closely with the peak sensitivity of intrinsically photosensitive Retinal Ganglion Cells (ipRGCs) [45]. Our research, including investigations into pupillary light reflex involving this device [3,46,47], underscores the significance of this tailored selection. Finally, in Table 2, the measured peak value and the FWHM (full wavelength half maximum) values of the four sources’ normalized spectral distributions are reported.
Table 2.
Source peak level and FWHM measured with Hamamatsu PMA11 Spectrometer.
Given the single spectral flux distributions depicted in Figure 6a, the combined output from a multi-wavelength source system is generally represented by the sum of the spectral fluxes emitted by each individual source. This additive principle of spectral flux, supported by findings in related studies [48], facilitates the precise generation of desired spectral power distributions (SPDs) through the proportional sum of each component’s intensity. It is crucial to note that optical components in our design, such as fibers and lenses, may slightly alter the source output’s spectral composition due to their material properties. We have rigorously accounted for these effects as our analysis includes measurements of both spectral and intensity profiles at the output of the light combiner shown in Figure 4.
3.2. Linearity
As explained in Section 2.2, the proposed driving circuitry allows the regulation of each LED by two acting on two different parameters:
- Digital modulation: by changing the duty cycle of the PWM signals which enables or not each one of the LED drivers (10-bit resolution);
- Peak current modulation: the digital potentiometer AD8403 allows the regulation of the peak forward current of each LED when the diver is enabled (8-bit resolution).
Accessing the linearity of the emitted light intensity by quantifying duty cycle (DC) is crucial to facilitate the generation of precise spectral distribution for general eye stimulation [49]. To assess overall linearity, we performed two tests measuring the radiant flux for each LED by randomly setting the DC between 0 and 100% and between 0 and 5%. The process for each test involved 50 measurements. During each measurement, the selected LED was turned ON for 5 s and then turned OFF for an additional 5 s to allow it to cool down and prevent overheating. Throughout the 5 s ON period, we captured data using an 80% window (4 s, starting 500 ms after turning ON) to measure the average radiant flux emitted from the device’s output SMA fiber. During the OFF period, lasting 500 ms, we measured the dark current to account for any changes in ambient illumination. Figure 7 shows the normalized radiant flux of each LED compared with an ideally linear behavior, i.e., a 1 to 1 match between the DC value and the normalized radiant flux.
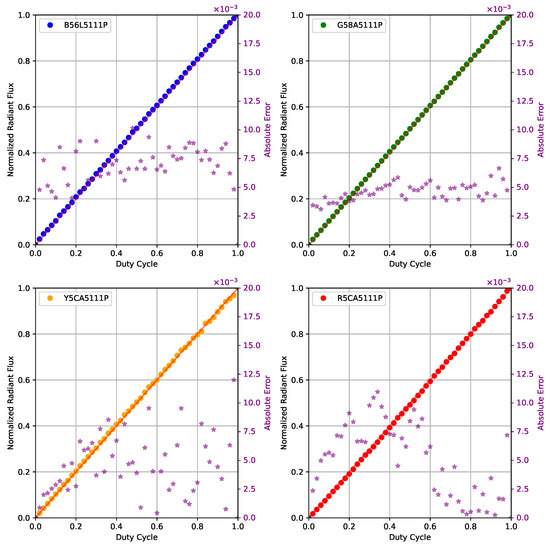
Figure 7.
The linearity test was performed on each LED by changing the duty cycle randomly from 0 to 1.0 with a 0.02-step resolution (50 points). Solid circles • show the radiant flux (normalized to maximum) acquired with the Newport Spectrometer, while the ★ marks refer to the right Y-axis, show the absolute error of each point with the best linear fit with an intercept equal to zero, represented by the solid red line.
As can be seen in Figure 7 the overall linearity is exceptionally good. For all LEDs, the coefficient of determination , which represents the proportion of the variance in the dependent variable that is predictable from the independent variable, is above 0.999 in all LEDs while the average absolute error is in the range of to .
Since the linearity assessment conducted in this manner is dependent on the selected drivers rather than the type of LED, the second test was exclusively conducted on the G58A5111P LED. In this test, we examined linearity at low duty cycle values, as drivers may exhibit non-linear behavior when activated with very short pulses. The measurements were conducted following the same procedure described earlier. The results, obtained by randomly varying the duty cycle from 0 to 0.05 with a total of 50 steps, are illustrated in Figure 8.
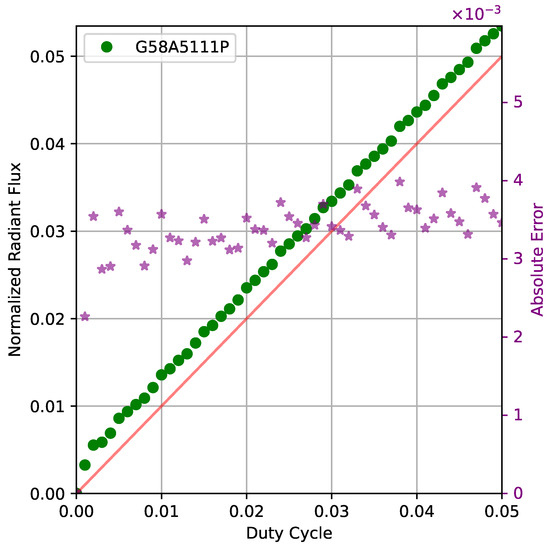
Figure 8.
The linearity at low intensities has been tested by randomly setting the DC from 0 to 0.05 with 0.001 step resolution (50 points). Green circles • show the acquired radiant flux (normalized to the value measured with DC = 1) acquired with the Newport Spectrometer. In contrast, the ★ referring to the right Y-axis shows the absolute error of each point with a perfectly linear behavior, represented by a solid red line in the figure.
Even in this case, the control circuitry proved to be mostly linear, where the coefficient of determination in this case is while the average absolute error is around .
A third test was conducted to assess the linearity of the digital potentiometer (AD8403; see Figure 2), which can be adjusted with an 8-bit resolution. Similar to the initial test, measurements were conducted on a single LED, as the circuitry remained consistent across all utilized wavelengths. The procedure employed is the same as the first test. Figure 9 shows the results where the normalized radiant flux measured with the Newport power meter by varying the AS8403 digital value while keeping DC at 100% has been compared to the best linear interpolation.
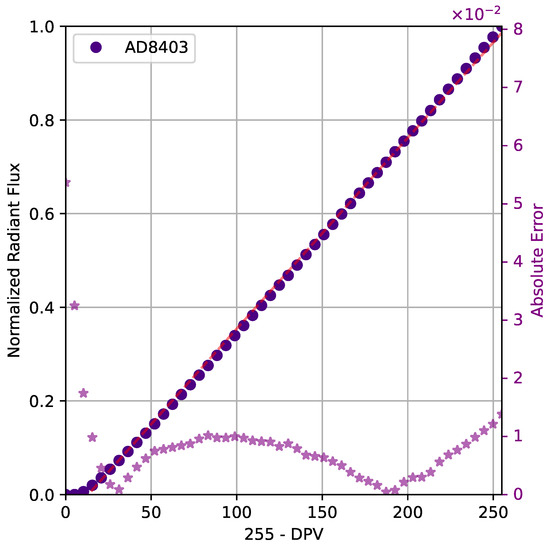
Figure 9.
Linearity test performed by fixing the DC to 1 and by changing the LED current by setting the 8-bit resistance value of the digital potentiometer with 50 different settings. Purple circles • show the radiant flux (normalized to maximum) acquired with the Newport Spectrometer, while the ★ referring to the right Y-axis shows the absolute error of each point with the best linear fit, represented by a solid red line in the figure.
The radiant flux proved to vary linearly with the variation in the peak current regulated by the internal potentiometer resistance value. The R-squared coefficient of determination is in this case equal to 0.998 while the average absolute error was . A small offset is present at the very beginning of the curve which indicates that the radiant flux starts its linear increase at around value 13 (around 5%) of the digital potentiometer. This is as expected as we explicitly designed the circuit (see Figure 2) to have some margin reaching zero current, as the voltage has been set to 315 mV which is indeed slightly higher than the voltage required to set zero current ( mV).
3.3. Stability
The stability of the total radiant flux for each LED was assessed by activating each of the six LEDs with a duty cycle (DC) of 1 (100%) and maximum current for 5 min. Throughout this period, as shown in Figure 10, we measured the fluctuation in total radiant intensity with the Newport 1918R power meter.
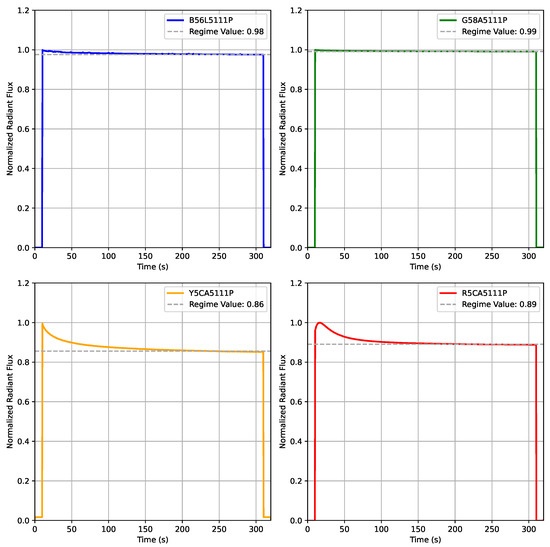
Figure 10.
Stability test performed on each one of the LEDs with maximum output current (DC = 1 and max current). Each curve has been normalized to the peak. An exponential decay function has been used to estimate the regime value for each LED.
Each test has been performed with an automated procedure in a light-controlled environment (dark room) where the device has been turned on from cold-start, i.e., LEDs at an ambient temperature around 22 °C.
When evaluating LED performance at full power for five minutes (Figure 10), the blue-light LED retained over 98% of the initial emitted radiant power, while the green LED remained in the 99% range. However, the radiant flux of the yellow and red LED exhibited the highest decline, stabilizing at 86% and 89%, respectively. Likely, this behavior is attributed to the lower quantum efficiency in this wavelength range [50] and the dependency of such LEDs’ light efficiency on temperature. This is to be taken into account when using very high currents for long periods and LED junction temperatures are not directly monitored.
3.4. Timing
The investigation on the timing component of light pulses emitted by a system for visual stimulation could be of crucial importance in studies involving very short flashes, like the observation of electroretinogram (ERG) responses to light [46] which requires millisecond-length flashes [51] or where sinusoidal pulse-width modulation [52] (SPWM) waves are involved [53]. Therefore, we tested our device output flash response in terms of rising time, falling time, duration, and delay with respect to the trigger signal while the maximum current was set on the digital potentiometer. At this scope, we acquired with the Newport power meter introduced before (see Section 3), the light flash produced with a 500 s digital trigger. The wave has been acquired by sampling with a digital oscilloscope the analog signal produced by the power meter, without any active filter. According to the Newport datasheet [54], the detector used should have a rise time lower than 6 μs. The acquired optical flash with the respective digital trigger is reported in Figure 11.
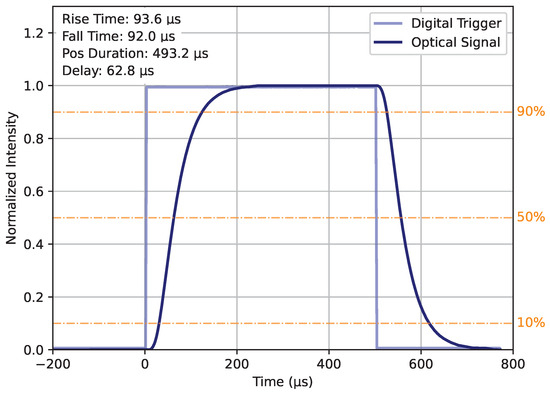
Figure 11.
The 500 s flash test has been executed to measure the LED driver’s time response. The graph shows in light blue the digital trigger signal applied to the SHDW pin of the CAT4238 (see Figure 2) while the dark blue solid line shows the normalized optical radiant flux acquired with the Newport power meter. Rise and fall time have been measured with the standard 10–90% rule, while positive duration has been measured by taking the signal width at 50%.
We measured comparable rising and falling time in the order of 90 s while the duration of the flash was 493 s compared to the 500 s trigger pulse. The rise time of the detector is neglected as much slower than the total rising time. This test proved that our system is capable of delivering short and precise stimulations in the order of ms to cover even the most demanding eye stimulation protocols.
4. Conclusions and Future Work
In this paper, we have introduced a cost-effective and compact multi-wavelength LED light source designed specifically for precise eye stimulation. Unlike expensive commercial devices lacking modulation and resolution, our system offers versatility and affordability. Indeed, by accommodating standard 3 mm and 5 mm LEDs, as well as a standard SMA fiber output, it ensures compatibility and high-resolution control, allowing it to cover a wide range of the human visual spectrum [14].
The cost-effectiveness is further enhanced by its compatibility with 3D printing, providing researchers with an accessible solution that can be integrated into any compact-sized prototype. With our design, we achieved a resolution of 18 bits, and the potential integration of a specific modern IC for PWM generation [55], capable of reaching up to 16 bits alone, could push the total resolution to 26 bits. Additionally, implementing a two-lens light combiner and slightly longer fiber could enhance light transmission efficiency and improve color homogenization at the output. Lastly, simple heat dissipation techniques could be employed to enhance the stability of LED emission at very high intensities.
Our LED light source has been validated in pupillary light reflex studies [13,46,47], underscoring its utility across both research and clinical domains. Its precise stimulus control is vital for exploring complex visual functions, benefiting areas like vision therapy, adaptive optics, and photoreceptor dynamics [56,57,58].
Additionally, its suitability for color vision, depth perception, and visual acuity experiments under varied lighting [59,60,61], alongside its potential in circadian rhythm and sleep disorder research [62,63], showcases its broad applicability. The system’s portability and affordability facilitate wider access to sophisticated eye stimulation technology.
Notably, its efficacy in ERG response studies marks it as a pivotal tool for retinal disease diagnosis and research [64,65], enhancing study quality and insights into retinal health.
In future work, we plan to explore these applications further, aiming to demonstrate the broad utility of our LED light source in addressing the current limitations of eye stimulation research and clinical interventions.
Author Contributions
Writing—original draft preparation, G.G. and G.B.; writing—review and editing, G.G., G.B. and L.R.; project administration, L.R.; Methodology, G.G. and G.B.; hardware: G.G.; software, G.G. and G.B.; formal analysis, G.G. and G.B.; Validation, G.G., G.B. and L.R.; supervision L.R. All authors have read and agreed to the published version of the manuscript.
Funding
This research received no external funding.
Institutional Review Board Statement
Not applicable.
Informed Consent Statement
Not applicable.
Data Availability Statement
The firmware developed in C described in Section 2.1 as well as the 3D CAD files described in Section 2.3 are available from the corresponding author upon reasonable request by email: giovanni.gibertoni@unimore.it.
Conflicts of Interest
The authors declare no conflicts of interest.
Abbreviations
The following abbreviations are used in this manuscript:
| PWM | Pulse-Width Modulation |
| SPI | Serial Peripheral Interface |
| FDM | Fused Deposition Modeling |
| IDE | Integrated Development Environment |
| DC | Duty Cycle |
| CFF | Critical Flicker Frequency |
| AU | Arbitrary Unit |
| NA | Numerical Aperture |
| FWHM | Full Wavelength Half Maximum |
| ipRGCs | intrinsically photosensitive Retinal Ganglion Cells |
| NA | Numerical Aperture |
References
- Cao, D.; Nicandro, N.; Barrionuevo, P.A. A five-primary photostimulator suitable for studying intrinsically photosensitive retinal ganglion cell functions in humans. J. Vis. 2015, 15, 27. [Google Scholar] [CrossRef]
- Kuze, M.; Morita, T.; Fukuda, Y.; Kondo, M.; Tsubota, K.; Ayaki, M. Electrophysiological responses from intrinsically photosensitive retinal ganglion cells are diminished in glaucoma patients. J. Optom. 2017, 10, 226–232. [Google Scholar] [CrossRef] [PubMed]
- Gibertoni, G.; Borghi, G.; Rovati, L. Vision-Based Eye Image Classification for Ophthalmic Measurement Systems. Sensors 2023, 23, 386. [Google Scholar] [CrossRef] [PubMed]
- Viénot, F.; Bailacq, S.; Rohellec, J.L. The effect of controlled photopigment excitations on pupil aperture. Ophthalmic Physiol. Opt. 2010, 30, 484–491. [Google Scholar] [CrossRef] [PubMed]
- Conus, V.; Geiser, M. A Review of Silent Substitution Devices for Melanopsin Stimulation in Humans. Photonics 2020, 7, 121. [Google Scholar] [CrossRef]
- Larson, M.D.; Behrends, M. Portable infrared pupillometry: A review. Anesth. Analg. 2015, 120, 1242–1253. [Google Scholar] [CrossRef] [PubMed]
- 6-Wavelength High-Power LED Sources. 2024. Available online: https://www.thorlabs.com/newgrouppage9.cfm?objectgroup_id=13597 (accessed on 29 February 2024).
- Laser, R. Fiber Pigtailed Multi LED Light Engine. 2023. Available online: https://www.roithner-laser.com/datasheets/led_fiber/led-multi-f.pdf (accessed on 29 February 2024).
- Multi-Wavelength Fiber-Coupled LED Sources (Up to 8 Wavelengths)—Mightex. 2024. Available online: https://www.mightexsystems.com/product/multi-wavelength-fiber-coupled-led-sources-up-to-8-wavelengths (accessed on 29 February 2024).
- High Power Fiber Coupled LEDs | Goldstone Scientific. 2024. Available online: https://www.goldstonescientific.com/fiber-coupled-leds (accessed on 29 February 2024).
- Spitschan, M.; Jain, S.; Brainard, D.H.; Aguirre, G.K. Opponent melanopsin and S-cone signals in the human pupillary light response. Proc. Natl. Acad. Sci. USA 2014, 111, 15568–15572. [Google Scholar] [CrossRef] [PubMed]
- Parry, N.R.A.; McKeefry, D.J.; Kremers, J.; Murray, I.J. A dim view of M-cone onsets. J. Opt. Soc. Am. A 2016, 33, A207–A213. [Google Scholar] [CrossRef]
- Gibertoni, G.; Cattini, S.; Rovati, L. Towards the development of a new model for the oculomotor system. In Proceedings of the Ophthalmic Technologies XXXI, SPIE, Online, 6–12 March 2021; Volume 11623, pp. 93–100. [Google Scholar] [CrossRef]
- Shevell, S.K. The Science of Color; Elsevier: Amsterdam, The Netherlands, 2003. [Google Scholar]
- Horiguchi, H.; Winawer, J.; Dougherty, R.F.; Wandell, B.A. Human trichromacy revisited. Proc. Natl. Acad. Sci. USA 2013, 110, E260–E269. [Google Scholar] [CrossRef]
- Patrick, F.; Jessica, S.; Gilles, E.; Pierre, B.; Martial, G. Homogeneous light stimulation of melanopsin and cones with a Maxwellian view device for the human eye. In Proceedings of the 2021 IEEE International Instrumentation and Measurement Technology Conference (I2MTC), Glasgow, UK, 17–20 May 2021; pp. 1–5, ISSN: 2642-2077. [Google Scholar] [CrossRef]
- Hexley, A.C.; Yöntem, A.O.; Spitschan, M.; Smithson, H.E.; Mantiuk, R. Demonstrating a multi-primary high dynamic range display system for vision experiments. J. Opt. Soc. Am. A 2020, 37, A271–A284. [Google Scholar] [CrossRef]
- da Silva Pinto, M.A.; de Souza, J.K.S.; Baron, J.; Tierra-Criollo, C.J. A low-cost, portable, micro-controlled device for multi-channel LED visual stimulation. J. Neurosci. Methods 2011, 197, 82–91. [Google Scholar] [CrossRef]
- Mouli, S.; Palaniappan, R.; Sillitoe, I.P. A Configurable, Inexpensive, Portable, Multi-channel, Multi-frequency, Multi-chromatic RGB LED System for SSVEP Stimulation. In Brain-Computer Interfaces: Current Trends and Applications; Hassanien, A.E., Azar, A.T., Eds.; Intelligent Systems Reference Library; Springer International Publishing: Cham, Switzerland, 2015; pp. 241–269. [Google Scholar] [CrossRef]
- Rogers, B.; Shih, Y.Y.I.; Garza, B.D.L.; Harrison, J.M.; Roby, J.; Duong, T.Q. A low cost color visual stimulator for fMRI. J. Neurosci. Methods 2012, 204, 379–382. [Google Scholar] [CrossRef][Green Version]
- Zhang, C.; Anzalone, N.C.; Faria, R.P.; Pearce, J.M. Open-Source 3D-Printable Optics Equipment. PLoS ONE 2013, 8, e59840. [Google Scholar] [CrossRef] [PubMed]
- Schubert, C.; van Langeveld, M.C.; Donoso, L.A. Innovations in 3D printing: A 3D overview from optics to organs. Br. J. Ophthalmol. 2014, 98, 159–161. [Google Scholar] [CrossRef] [PubMed]
- Willis, K.; Brockmeyer, E.; Hudson, S.; Poupyrev, I. Printed optics: 3D printing of embedded optical elements for interactive devices. In UIST ’12: Proceedings of the 25th Annual ACM Symposium on User Interface Software and Technology, Cambridge, MA, USA, 7–10 October 2012; Association for Computing Machinery: New York, NY, USA, 2012; pp. 589–598. [Google Scholar] [CrossRef]
- Fibre Ottiche. 2001. Available online: http://www.sunfiberoptic.com/prod01_FO.htm (accessed on 1 March 2024).
- DUE CORE SAM3X8E 32-Bit ARM Cortex-M3 Module. 2024. Available online: http://www.inhaos.com/product_info.php?products_id=164 (accessed on 29 February 2024).
- Arduino Team. Arduino Due; Arduino: Turin, Italy, 2017. [Google Scholar]
- Arduino Integrated Development Environment (IDE). Available online: https://www.arduino.cc/en/software (accessed on 20 February 2024).
- SAM3X8E ARM Cortex-M3 Datasheet. 2015. Available online: https://ww1.microchip.com/downloads/en/devicedoc/atmel-11057-32-bit-cortex-m3-microcontroller-sam3x-sam3a%5Fdatasheet.pdf (accessed on 4 March 2024).
- Brundrett, G. Human sensitivity to flicker. Light. Res. Technol. 1974, 6, 127–143. [Google Scholar] [CrossRef]
- Smith, J.M.; Misiak, H. Critical flicker frequency (CFF) and psychotropic drugs in normal human subjects—A review. Psychopharmacology 1976, 47, 175–182. [Google Scholar] [CrossRef] [PubMed]
- Landis, C. Determinants of the Critical Flicker-Fusion Threshold. Physiol. Rev. 1954, 34, 259–286. [Google Scholar] [CrossRef] [PubMed]
- Mankowska, N.D.; Marcinkowska, A.B.; Waskow, M.; Sharma, R.I.; Kot, J.; Winklewski, P.J. Critical Flicker Fusion Frequency: A Narrative Review. Medicina 2021, 57, 1096. [Google Scholar] [CrossRef] [PubMed]
- Davis, J.; Hsieh, Y.H.; Lee, H.C. Humans perceive flicker artifacts at 500 Hz. Sci. Rep. 2015, 5, 7861. [Google Scholar] [CrossRef]
- Yerazunis, W.S.; Carbone, M. Privacy-enhanced displays by time-masking images. In Proceedings of the Australian Conference on Computer-Human Interaction, Gold Coast, QLD, Australia, 29 January–1 February 2001. [Google Scholar]
- Narra, P.; Zinger, D. An effective LED dimming approach. In Proceedings of the Conference Record of the 2004 IEEE Industry Applications Conference, 2004. 39th IAS Annual Meeting, Seattle, WA, USA, 3–7 October 2004; Volume 3, pp. 1671–1676, ISSN: 0197-2618. [Google Scholar] [CrossRef]
- ON-Semiconductor. CAT4238: LED Driver, Boost Converter, High Efficiency. Available online: https://www.onsemi.com/PowerSolutions/product.do?id=CAT4238 (accessed on 4 March 2024).
- Devices, A. 1-/2-/4-Channel Digital Potentiometers, AD8400/AD8402/AD8403. Available online: https://www.analog.com/en/products/ad8403.html#product-overview (accessed on 4 March 2024).
- Renesas Electronics. ISL21080 NanoPower Voltage Reference. Available online: https://www.renesas.com/eu/en/www/doc/datasheet/isl21080.pdf (accessed on 4 March 2024).
- ON-Semiconductor. mc33078, MC33079, NCV33078, NCV33079—Low Noise Dual/Quad Operational Amplifiers. Available online: https://www.onsemi.com/pdf/datasheet/mc33078-d.pdf (accessed on 4 March 2024).
- 5mm Dia. x 3.1mm FL, Uncoated Molded Aspheric Condenser Lens. 2024. Available online: https://www.edmundoptics.com/p/5mm-dia-x-31mm-fl-uncoated-molded-aspheric-condenser-lens/43050 (accessed on 25 February 2024).
- Thorlabs-b11040A SMA905 Multimode Connector, Ø1040 μm Bore, SS Ferrule, for BFT1. 2020. Available online: https://www.thorlabs.com/thorproduct.cfm?partnumber=B11040A (accessed on 28 February 2024).
- HAMAMATSU. Photonic Multichannel Spectral Analyzer Model: PMA-11. Available online: http://pdf.datasheetcatalog.com/datasheet/hamamatsu/C8147-38.pdf (accessed on 4 March 2024).
- CIE. Commission Internationale de l’Eclairage Proceedings, 1931; Cambridge University: Cambridge, UK, 1932. [Google Scholar]
- Süsstrunk, S.; Buckley, R.; Swen, S. Standard RGB Color Spaces. In Proceedings of the IS&T/SID 7th Color Imaging, Scottsdale, AZ, USA, 16–19 November 1999. [Google Scholar]
- CIE. CIE S 026/E:2018 CIE System for Metrology of Optical Radiation for ipRGC-Influenced Responses to Light; Technical Report; International Commission on Illumination (CIE): Vienna, Austria, 2018. [Google Scholar] [CrossRef]
- Gibertoni, G.; Irungovel, A.B.P.; Viswanathan, S.; Rovati, L. Silent stimulation of cones: A comparison between the ERG and PLR responses. In Proceedings of the Ophthalmic Technologies XXXIII, SPIE, San Francisco, CA, USA, 28 January–3 February 2023; Volume 12360, pp. 156–166. [Google Scholar] [CrossRef]
- Gibertoni, G.; Pinto, V.D.; Cattini, S.; Tramarin, F.; Geiser, M.; Rovati, L. A simple Maxwellian optical system to investigate the photoreceptors contribution to pupillary light reflex. In Proceedings of the Ophthalmic Technologies XXXII, SPIE, San Francisco, CA, USA, 22 January–28 February 2022; Volume 11941, pp. 52–60. [Google Scholar] [CrossRef]
- Llenas, A.; Carreras, J. Arbitrary spectral matching using multi-LED lighting systems. Opt. Eng. 2019, 58, 035105. [Google Scholar] [CrossRef]
- Spitschan, M.; Woelders, T. The Method of Silent Substitution for Examining Melanopsin Contributions to Pupil Control. Front. Neurol. 2018, 9, 941. [Google Scholar] [CrossRef]
- Jiang, F.; Zhang, J.; Xu, L.; Ding, J.; Wang, G.; Wu, X.; Wang, X.; Mo, C.; Quan, Z.; Guo, X.; et al. Efficient InGaN-based yellow-light-emitting diodes. Photonics Res. 2019, 7, 144–148. [Google Scholar] [CrossRef]
- Creel, D.J. Electroretinograms. In Handbook of Clinical Neurology; Elsevier: Walthm, MA, USA, 2019; Volume 160, pp. 481–493. [Google Scholar] [CrossRef]
- Zhong, C.; Lu, Y.; Chen, G.; Zhu, L.; Guo, Z.; Zhang, X.; Chen, Z.; Guo, W. Sinusoidal Pulsewidth Modulation Scheme for LED Lighting to Reduce LED Flicker. IEEE Trans. Electron Devices 2023, 70, 5720–5726. [Google Scholar] [CrossRef]
- Twyford, P.; Fried, S. The Retinal Response to Sinusoidal Electrical Stimulation. IEEE Trans. Neural Syst. Rehabil. Eng. 2015, 24, 413–423. [Google Scholar] [CrossRef]
- 918D-UV-OD3R UV Silicon Detector. 2024. Available online: https://www.newport.com/p/918D-UV-OD3R (accessed on 29 February 2024).
- TLC59711 Data Sheet, Product Information and Support. 2024. Available online: https://www.ti.com/product/TLC59711 (accessed on 1 March 2024).
- Polat, U. Improving vision in adult amblyopia by perceptual learning. Proc. Natl. Acad. Sci. USA 2004, 101, 6692–6697. [Google Scholar] [CrossRef]
- Liang, J.; Williams, D.R.; Miller, D.T. Supernormal vision and high-resolution retinal imaging through adaptive optics. J. Opt. Soc. Am. A 1997, 14, 2884–2892. [Google Scholar] [CrossRef] [PubMed]
- Williams, D.R. Rapid photoreceptor mosaic assessment with adaptive optics optical coherence tomography. J. Optom. 2014, 7, 217–227. [Google Scholar] [CrossRef]
- Neitz, J.; Neitz, M. The neuroscience of color vision and its implication. Opt. Photonics News 2011, 22, 18–23. [Google Scholar] [CrossRef]
- Howard, I.P.; Rogers, B.J. Perceiving in Depth: Volume 2 Stereoscopic Vision; Oxford University Press: Oxford, UK, 2012. [Google Scholar] [CrossRef]
- Marcos, S.; Werner, J.S.; Burns, S.A.; Merigan, W.H.; Artal, P.; Atchison, D.A.; Hampson, K.M.; Legras, R.; Lundstrom, L.; Yoon, G.; et al. Influence of adaptive-optics optical coherence tomography (AO-OCT) on clinical-decision making in age-related macular degeneration. Am. J. Ophthalmol. 2017, 179, 126–137. [Google Scholar] [CrossRef]
- Czeisler, C.A.; Allan, J.S.; Strogatz, S.H.; Ronda, J.M.; Sánchez, R.; Ríos, C.D.; Freitag, W.O.; Richardson, G.S.; Kronauer, R.E. Role of human circadian rhythms in the pathophysiology of sleep disorders. Sleep Med. 2000, 1, 19–23. [Google Scholar] [CrossRef]
- Norman, E.; Rosenthal, M.D. Seasonal Affective Disorder: A Description of the Syndrome and Preliminary Findings With Light Therapy. Arch. Gen. Psychiatry 1984, 41, 72–80. [Google Scholar] [CrossRef]
- Berson, E.L. Retinitis pigmentosa and allied diseases: Applications of electroretinographic testing. Int. Ophthalmol. 1981, 4, 7–22. [Google Scholar] [CrossRef] [PubMed]
- Marmor, M.F.; Fulton, A.B.; Holder, G.E.; Miyake, Y.; Brigell, M.; Bach, M. ISCEV Standard for full-field clinical electroretinography (2008 update). Doc. Ophthalmol. 2009, 118, 69–77. [Google Scholar] [CrossRef] [PubMed]


Disclaimer/Publisher’s Note: The statements, opinions and data contained in all publications are solely those of the individual author(s) and contributor(s) and not of MDPI and/or the editor(s). MDPI and/or the editor(s) disclaim responsibility for any injury to people or property resulting from any ideas, methods, instructions or products referred to in the content. |
© 2024 by the authors. Licensee MDPI, Basel, Switzerland. This article is an open access article distributed under the terms and conditions of the Creative Commons Attribution (CC BY) license (https://creativecommons.org/licenses/by/4.0/).