Article

Pedestrian Trajectory Prediction Based on Motion Pattern De-Perturbation Strategy

1
The Information Materials and Intelligent Sensing Laboratory of Anhui Province, Anhui University, Hefei 230601, China
2
School of Integrated Circuits, Anhui University, Hefei 230601, China
3
The 38th Research Institute of China Electronics Technology Group Corporation, Hefei 230601, China
4
The Hefei Institute of Physical Science, Chinese Academy of Sciences, Hefei 231283, China
*
Author to whom correspondence should be addressed.
Electronics 2024, 13(6), 1135; https://doi.org/10.3390/electronics13061135
Submission received: 15 February 2024 / Revised: 11 March 2024 / Accepted: 14 March 2024 / Published: 20 March 2024
(This article belongs to the Special Issue Intelligent Mobile Robotic Systems: Decision, Planning and Control)

Abstract

:
Pedestrian trajectory prediction is extremely challenging due to the complex social attributes of pedestrians. Introducing latent vectors to model trajectory multimodality has become the latest mainstream solution idea. However, previous approaches have overlooked the effects of redundancy that arise from the introduction of latent vectors. Additionally, they often fail to consider the inherent interference of pedestrians with no trajectory history during model training. This results in the model’s inability to fully utilize the training data. Therefore, we propose a two-stage motion pattern de-perturbation strategy, which is a plug-and-play approach that introduces optimization features to model the redundancy effect caused by latent vectors, which helps to eliminate the redundancy effects in the trajectory prediction phase. We also propose loss masks to reduce the interference of invalid data during training to accurately model pedestrian motion patterns with strong physical interpretability. Our comparative experiments on the publicly available ETH and UCY pedestrian trajectory datasets, as well as the Stanford UAV dataset, show that our optimization strategy achieves better pedestrian trajectory prediction accuracies than a range of state-of-the-art baseline models; in particular, our optimization strategy effectively absorbs the training data to assist the baseline models in achieving optimal modeling accuracy.

1. Introduction

The task of pedestrian trajectory prediction is to predict the future trajectories of pedestrians by modeling their movement patterns on the basis of historical trajectories in real-world scenarios. This task is used in various automated scenarios, such as traffic, service, and video surveillance. Accurately predicting the future trajectories of pedestrians can help avoid collisions between driverless devices and pedestrians. Additionally, it can identify abnormal behaviours and assess crowd density in public places, particularly in dense urban scenarios.
For trajectory prediction tasks, it is still challenging to accurately model the movement patterns of pedestrians. This is due to the complex social interactions involved and the fact that pedestrian movements are easily influenced by surrounding pedestrians and the environment.
In previous methods [1,2,3,4,5,6], historical pedestrian behavioral characteristics, such as trajectory characteristics and interaction characteristics, were mainly derived from historical trajectory information and subsequently combined with the introduction of latent vectors (tensors of random numbers obeying a standard normal distribution) to predict the multimodal future trajectories of the pedestrians. These approaches focus on improving pedestrian interactions and modeling pedestrian multimodality. However, they consistently ignore the fact that the latent vectors are composed of random numbers unrelated to the historical behavioral characteristics of pedestrians. We believe that using latent vectors to model the randomness of pedestrian motion has a redundancy effect on the accurate modeling of pedestrian motion patterns. This redundancy effect will be explored through the experiments in Table A1 of Appendix A.1. Furthermore, these methods do not take into account the inherent interference that exists during model training, which we define as the perturbations of pedestrians without historical trajectories for model training. As a result, these methods are ineffective in optimizing the performance of the constructed models.
In Figure 1, panel (a) shows a schematic diagram for constructing pedestrian motion patterns, modeling the time domain of historical trajectories to obtain trajectory features, modeling the spatial domain of historical trajectories to obtain interaction features, and sampling latent vectors from a normal distribution to characterize the multimodality of pedestrian motion. Most of the methods are based on this idea to establish the motion patterns of pedestrians. Latent vectors are introduced to predict multimodal trajectories (i.e., multiple possibilities of trajectories), but the latent vectors themselves are random numbers that are completely unrelated to the trajectory features and interaction features; thus, the introduction of latent vectors will inevitably interfere with the expression of the trajectory features and interaction features, thus introducing unnecessary redundancy effects in the subsequent trajectory prediction. Moreover, there are still inherent interference factors in network training for learning pedestrian motion patterns, i.e., the presence of pedestrians with no history of trajectories. In panel (b) of Figure 1, the model training phase calculates the predicted loss for pedestrians with and without historical track information. In panel (c), the predicted loss is calculated only for pedestrians with historical track information. It should be noted that in panel (c), the predicted trajectory error for pedestrians with no historical trajectories is simply disregarded in the loss calculation. This does not affect the interaction between pedestrians in the model of panel (a). The right half of panel (b) demonstrates that pedestrians without historical trajectory information have multiple possible future trajectories that are entirely random. As a result, there is no correlation between their future and historical trajectories.
To solve these problems and model more accurate and reliable pedestrian motion patterns, we propose a two-stage motion pattern de-perturbation strategy. Stage 1—Constructing the pedestrian motion pattern, the baseline model utilizes latent vectors to introduce randomness. Inspired by the counterfactual analysis paper [7], they use counterfactual features to replace trajectory features to eliminate training and deployment environment biases. We replace trajectory and interaction features with optimization features to eliminate redundant effects of introducing latent vectors. Stage 2—The training model iteration phase is a new loss mask design for shielding pedestrians with no history of trajectories to more accurately model pedestrian motion patterns and accurately capture the correspondence between learned historical trajectories and future trajectories. Notably, we do not interfere with the interaction between pedestrians with no history track and other pedestrians. Our proposed two-stage motion pattern de-perturbation strategy is a plug-and-play module. It can be applied to any benchmark method for pedestrian trajectory prediction that introduces latent vectors. We conducted experiments on three baseline approaches, namely, STGAT [3], which is based on an RNN (Recurrent Neural Network) and a GAT (Graph Attention Network); SGAN [2], which is based on an RNN and a GAN (Generative Adversarial Network); and SocialVAE [6], which is based on an RNN and a VAE (Variational Auto-Encoder).
In summary, this paper contributes the following:
  • The introduction of latent vectors inevitably introduces redundancy effects; therefore, we propose the use of optimization features to replace trajectory features and interaction features to eliminate these redundant effects.
  • Pedestrians without historical trajectories during model training can interfere with the accurate iteration of pedestrian motion patterns; thus, we propose loss masks to eliminate this interference to reduce the uncertainty of the training process.
  • Our method, as a migratable module, can effectively eliminate the interference factor of pedestrian motion pattern modeling in two stages, maximizing the performance of the baseline models.

2. Related Work

Expert-based models generally set the relevant rules manually, and some approaches base their motion planning on dynamics equations and obstacles in the scene [8,9], while others are based on heuristic methods that use human-formulated motion functions to avoid collisions [10,11]. There are also methods [12,13] that use pedestrian interaction simulation software, such as Legion, to simulate complex interactions between pedestrians and analyze group motion behaviors more effectively.
In recent years, many methods have been applied to learning pedestrian movement patterns from data. The data-driven models mainly include Bayesian network-based, reinforcement learning-based, and deep learning-based models. Among them, deep learning-based models are the focus of this paper.
Bayesian networks were used in [14] to model an agent’s state and predict the agent’s intention and trajectory. Several approaches [15,16] also use deep reinforcement learning models to predict pedestrian trajectories in human–vehicle conflict scenarios.
Deep models have recently achieved good results in pedestrian trajectory prediction tasks due to the powerful characterization capabilities of deep learning.
Regarding recurrent neural networks, speech sequence recognition and machine translation [17,18] have demonstrated that RNNs and their variants, such as long short-term memory networks (LSTMs), are well suited for processing sequence information and predicting sequence data problems. Social-LSTM [1] uses the hidden states extracted by an RNN as the trajectory features of pedestrians and introduces a local “social” pooling module by considering the social attributes of pedestrians to weight the hidden states of pedestrians within a certain spatial distance to simulate pedestrian interactions in real scenes. Social-GAN [2] uses a GAN as the overall model architecture and uses an RNN to model pedestrian trajectory features in the generator but uses a global pooling module to improve the pooling mechanism based on the relative distance between pedestrians, making the generated trajectories more in line with social norms. TPHT [19] introduces a soft attention mechanism to model the interaction between pedestrians based on RNN-extracted trajectory features. Several works [6,20,21,22,23,24] further refine the extraction of pedestrian interaction features using scene information and the physical parameters of pedestrian motion (motion direction angle, shortest distance, etc.).
Graph neural networks have been widely used in the field of deep learning in recent years. Previous methods have been based on designing pooling modules to aggregate interactions between pedestrians; this pooling method aggregates only different pedestrian states based on simple features such as the spatial distance between pedestrians, which has certain limitations, while graph neural networks essentially combine graph data with neural networks to effectively aggregate information between nodes, which is highly relevant to pedestrian trajectory prediction tasks. STGAT [3] introduces GAT to design spatio-temporal graphical attention networks. RNN is used to encode pedestrian trajectories, while GAT is used to capture the spatial correlation between different pedestrian trajectories to extract social interactions between pedestrians. Social-BiGAT [25] applied a GAT-based generative adversarial network to better model pedestrian social interactions in scenarios, while adversarial training based on the GAN framework was used to model the multimodality of pedestrian trajectories. STGCNN [26] and SGCN [27] model the movement patterns of pedestrians directly and explicitly on a spatiotemporal graph, modeling interactions as graphs to replace traditional aggregation methods. Some work [28,29] combines rule-based or optimized physical models with deep learning models to improve model accuracy.
Numerous methods [1,2,3,4,5,6,20,22,25] rely on the randomness of latent vectors to create the multimodality of pedestrian trajectories. However, they often overlook the redundancy effects caused by the latent vectors being unrelated to pedestrian movement patterns. Moreover, these methods often overlook the impact of pedestrians without historical trajectories on the accurate iterative motion patterns during the training model stage. Given this, our two-stage de-disturbance strategy incorporates optimized features and loss masks to eliminate redundant disturbances. This enables the baseline models to demonstrate even better performance.

3. Methods

This section outlines the construction of a two-stage motion pattern de-perturbation strategy and its implementation in the baseline models. Table 1 provides a summary of the main notations used in this paper.

3.1. Problem Definition

The goal of pedestrian trajectory prediction is to take all pedestrian historical coordinate points at a specified time t 1 = 1 , 2 , , t o b s as input X = X 1 ,   X 2 ,     ,   X n and to predict the future coordinate points Y ^ = Y ^ 1 ,   Y ^ 2 ,     ,   Y ^ n of all pedestrians at a subsequent time t 2 = t o b s + 1 ,   t o b s + 2 ,   ,   t p r e d by constructing a model. For pedestrian i , its input historical coordinates and true future coordinates can be defined as follows:
X i = x i t 1 , y i t 1 R 2 t 1 = 1 , 2 , , t o b s
Y i = x i t 2 , y i t 2 R 2 t 2 = t o b s + 1 ,   t o b s + 2 ,   ,   t p r e d
Notably, previous methods mainly used the relative position of pedestrians, i.e., the historical displacement, instead of absolute position coordinates as input information.

3.2. Method Overview

Encoder–Decoder framework: Pedestrian trajectory prediction is a sequence prediction task. Many methods use coding and decoding frameworks, with encoding and decoding modules typically designed as RNN or LSTM structures. The process can be summarized as follows:
  • The encoding module encodes the input historical pedestrian trajectory to obtain the trajectory features of the pedestrians.
  • The portrayal of interactions between pedestrians is generally based on factors such as their distance from each other or the risk of collision. This is performed to obtain the encoding of the interaction feature.
  • The complete motion pattern encoding of the pedestrians is obtained by splicing together the trajectory features, interaction features, and introduced latent vectors.
  • To decode the high-dimensional features of the predicted trajectory, input the complete motion pattern encoding of pedestrians into the decoding module.
  • The predicted trajectory’s high-dimensional features are passed through the output module, typically a linear layer, to obtain the mapped future trajectory.
Overview: As shown in Figure 2, where the encoder and decoder represent the encoding and decoding modules of a baseline model, respectively, the de-perturbation strategy consists of two main stages. In the first stage, optimization features are used to replace pedestrian trajectory and interaction features in the baseline model, eliminating the redundancy effects of introducing latent vectors; in the second stage, the designed loss mask is used to optimize the model training process, eliminating the interference of irrelevant training data for loss computation.

3.3. Stage 1: Pedestrian Motion Pattern Construction Optimization

As shown in panel (a) of Figure 1, the baseline model introduces randomness of latent vectors to model the multimodality of trajectories. However, according to our experimental results in Table A1 in Appendix A.1, latent vectors cause redundant effects on the motion patterns constructed by the baseline model. Therefore, as shown in Figure 2, we propose to use optimization features to replace the pedestrian trajectory features and interaction features connected to the latent vectors, and the same are input to the decoding module of the baseline model to replicate the redundancy effect caused by the introduction of latent vectors.
For pedestrian i , we assume that the trajectory features and interaction features modeled by the baseline model are m i and g i , respectively, so that the pedestrian motion pattern h i modeled by the baseline model can be given by the following equation:
h i = D e c o d e r m i g i z ; W d
where | | denotes the concatenation operation and z is the latent vector introduced by the baseline model to construct the multimodality of the pedestrian trajectory, i.e., to introduce randomness into the deterministic trajectory. W d is the weight parameter in the decoder module.
The additional optimization features we introduce are defined as O F = m i g i ξ i , where ξ i is the optimization factor (set to zero in our approach); moreover, we present our exploratory experiments using different forms of ξ i in Section 4. O F is used to replace the trajectory features ( m i ) and interaction features ( g i ) in the pedestrian movement pattern constructed by the baseline model to replicate the redundancy effects ( h i ) from the introduction of latent vectors:
h i = D e c o d e r O F z ; W d
h i and h i are finally input to the output module of the baseline model to eliminate redundancy effects to obtain the final predicted trajectory:
Y i ^ = O u t p u t h i h i ; W o
where W o is the weight parameter in the output module of the baseline model and Y i ^ is the predicted trajectory of the final model output.

3.4. Stage 2: Loss Mask Optimization

We first use the historical coordinates X i of pedestrian i to calculate the displacement of the current time frame relative to the previous time frame:
x i t 1 = x i t 1 x i t 1 1 , y i t 1 = y i t 1 y i t 1 1
We calculate the average velocity ( V A i ) of pedestrian i based on its displacement in the historical observation frames. The V A i in the historical observation frame is described as follows:
V A i = 1 t o b s t 1 = 1 t o b s x i t 1 2 + y i t 1 2
For pedestrian i with zero average velocity V A i , the displacement in historical time is also zero, and it is impossible to model its motion pattern to catch the relationship between historical and future trajectories. For this reason, we propose the loss mask ( L M a s k i ) for training to ensure that the gradient backpropagation of loss is not used for pedestrian i , so that the network no longer focuses on pedestrian i during training and more accurately models pedestrians with definite motion patterns. We define L M a s k i below:
L M a s k i = o n e s ,   V A i 0 z e r o s ,   V A i = 0
The final loss function is defined as follows:
L = L ( Y i ,   Y i ^ ) L M a s k i
where L B is the loss function defined by the baseline model and the training loss mask L M a s k i enables the network to target weight updates to exclude the interference of irrelevant data to more accurately map the relationship between historical and future trajectories, ensuring the accuracy of modeled pedestrian movement patterns and making the network model more effectively absorb training data and improving learning efficiency. In Section 4, we conducted experiments to investigate the model’s learning efficiency with varying dataset sizes.

4. Experimental Section

4.1. Experimental Settings

Dataset: We evaluated our method on two publicly available trajectory prediction datasets, ETH [30] and UCY [31], which contain five different real scenarios, namely, ETH, Hotel, Zara1, Zara2, and Univ. These scenarios involve different social environments and different crowd densities. The dataset was obtained by sampling data from a real scene at 0.4 s intervals, and the training idea was the same as that used by the current mainstream methods; that is, 3.2 s ( t o b s = 8 ) trajectory data were used as the historical trajectory data, and 4.8 s ( t p r e d = 12 ) trajectory data were used as the real values of the predicted trajectories while maintaining a cross-validation evaluation strategy that is consistent with the baseline models [2,3,6].
Evaluation metrics: To specifically evaluate the accuracy of the predicted trajectory, we used the same evaluation metrics as those used by the baseline methods, the average displacement error (ADE) [32] and the final displacement error (FDE) [1], which are calculated as follows:
A D E = i N t = t o b s t p r e d Y ^ n t Y n t 2 N ( t p r e d t o b s )
F D E = i N Y ^ i t = t p r e d Y i t = t p r e d 2 N
Baseline models: We used three representative baseline models for trajectory prediction to evaluate our approach: (1) an SGAN based on an RNN and a GAN, (2) an STGAT based on an RNN and a GNN, and (3) a SocialVAE based on an RNN and VAE.

4.2. Experimental Evaluation

In this section, we show how the experiments demonstrated the effectiveness of the proposed two-stage motion pattern de-perturbation strategy.
Experimental evaluation of the pedestrian motion pattern de-perturbation strategy: To evaluate the effectiveness of our designed method in improving prediction accuracy, we conducted comparison experiments on the official source codes provided by STGAT [3], Social-GAN [2], and SocialVAE [6], as shown in Table 2, where * in Table 2 indicates the results we directly replicated with the official source codes; for fairness of comparison, we kept the same hyperparameters as the replicated baseline model source codes. When evaluating Ours–STGAT, Ours–SGAN, and Ours–SocialVAE, we kept the same hyperparameters as the reproduced baseline model source codes, and we set the same random number seed for all subsequent experimental evaluations to make the experimental results reproducible. The results in Table 2 show that our proposed two-stage motion pattern de-perturbation strategy can improve the prediction accuracy of the different baseline models, where Ours–STGAT achieves an improvement of 0.06/0.09 on the average ADE/FDE on five different scenario datasets compared to the baseline STGAT* model, Ours–SGAN achieves an improvement of 0.02/0.06 compared to the baseline SGAN* model, and Ours–SocialVAE achieves an improvement of 0.02 on the average FDE compared to the baseline model. Notably, our strategy results in all baseline models achieving significant increases in both the ETH and HOTEL dataset scenarios, with the increases being more pronounced in the ETH scenario. We attribute this to the fact that pedestrians in motion in the ETH and HOTEL scenarios are more sparsely located; thus, pedestrian motion is more influenced by their own motion patterns. In the ETH and HOTEL datasets, our strategy removes the redundancy effects of the randomness of latent vectors on the construction of pedestrian motion patterns, while the use of loss masks shields the inherent interference of pedestrians with no history of trajectories, allowing for the maximization of baseline model performance.
Evaluating the use of different forms of ξ i to construct the optimization features: To determine the final form of the optimization features introduced in Section 3.2, as shown in Table 3, we designed experiments to evaluate the effect of using different forms of ξ i to construct the optimization features to obtain the final experimental results. The experiments involved using ξ i with all-zero values, ξ i with all-0.5 values, ξ i with values sampled from a uniform distribution, and ξ i with values sampled from a standard normal distribution. The experimental results in Table 3 show that the baseline model is improved under every form of ξ i , which indicates that our method has some universality. Using ξ i with all-zero vectors achieves the best results, which is consistent with our design philosophy that the optimization features are introduced to eliminate the redundancy of latent vectors, and the use of all-zero vectors can directly reflect the influence of latent vectors on trajectory features and interaction features.
Contributions of different optimization designs: In this subsection, we discuss the design of experiments to evaluate the separate contributions of the optimization features and the loss mask, as shown in Table 4, where (1) STGAT w/o OF indicates no optimization features and that only the loss mask was used and (2) STGAT w/o LM indicates no loss mask and that only the optimization features were used. The results show that the use of the loss mask and the optimization features alone can both improve the prediction effectiveness of the baseline models, with the effect of using the optimization features being more obvious. Moreover, Ours–STGAT using a loss mask and optimized feature at the same time has advantages on individual datasets but does not improve on the average performance compared to STGAT w/o LM. This is because we introduce the loss mask aims to eliminate the influence of pedestrians without historical trajectories on the construction of deterministic motion patterns during network training. This improves the network’s ability to absorb and discriminate the training data, enhances its stability, and steadily improves the model prediction performance. The effect of the loss mask will be illustrated through the experiment shown in Figure 3.
Data efficiency: The size of the dataset has an impact on the effectiveness of the model. An increase in the training data tends to improve the effectiveness of the model, but a large amount of training data implies a large computational cost; therefore, in this subsection, we explore the relationship between the size of the training dataset and the learning efficiency. We conducted a series of experiments in which different percentages of training data were randomly sampled from the original training data. The training data were randomly selected and divided into 5%, 25%, and 50% samples, and the same data were input to train different models. The experiments used STGAT as a baseline model to compare two of our methods, Ours–STGAT and STGAT w/o LM, and the experimental results of the data learning efficiency with average ADE and FDE values are shown in Figure 3a and 3b, respectively. (1) It is clear that the predictive efficacy of Ours–STGAT exceeds that of the baseline model, STGAT, when using different proportions of training data; (2) STGAT w/o LM clearly exhibits the same instability as the baseline, while Ours–STGAT, with both a loss mask and an optimization feature (OF), exhibits the ideal of stable absorption of training data. It should be noted that as the amount of training data increases, both the baseline model and STGAT w/o LM exhibit unstable learning efficiency compared to Ours–STGAT. This suggests that they are not able to absorb the additional training data efficiently. We consider that this instability is precisely due to inherent interference, where the training data cannot properly and effectively guide model learning. Our proposed two-stage motion pattern de-perturbation strategy eliminates the redundant effects of introducing latent vectors and the inherent disturbances that exist when training the model. This ensures that the baseline model can effectively utilize the training data to establish accurate pedestrian motion patterns, allowing it to perform as intended and demonstrate improved results.

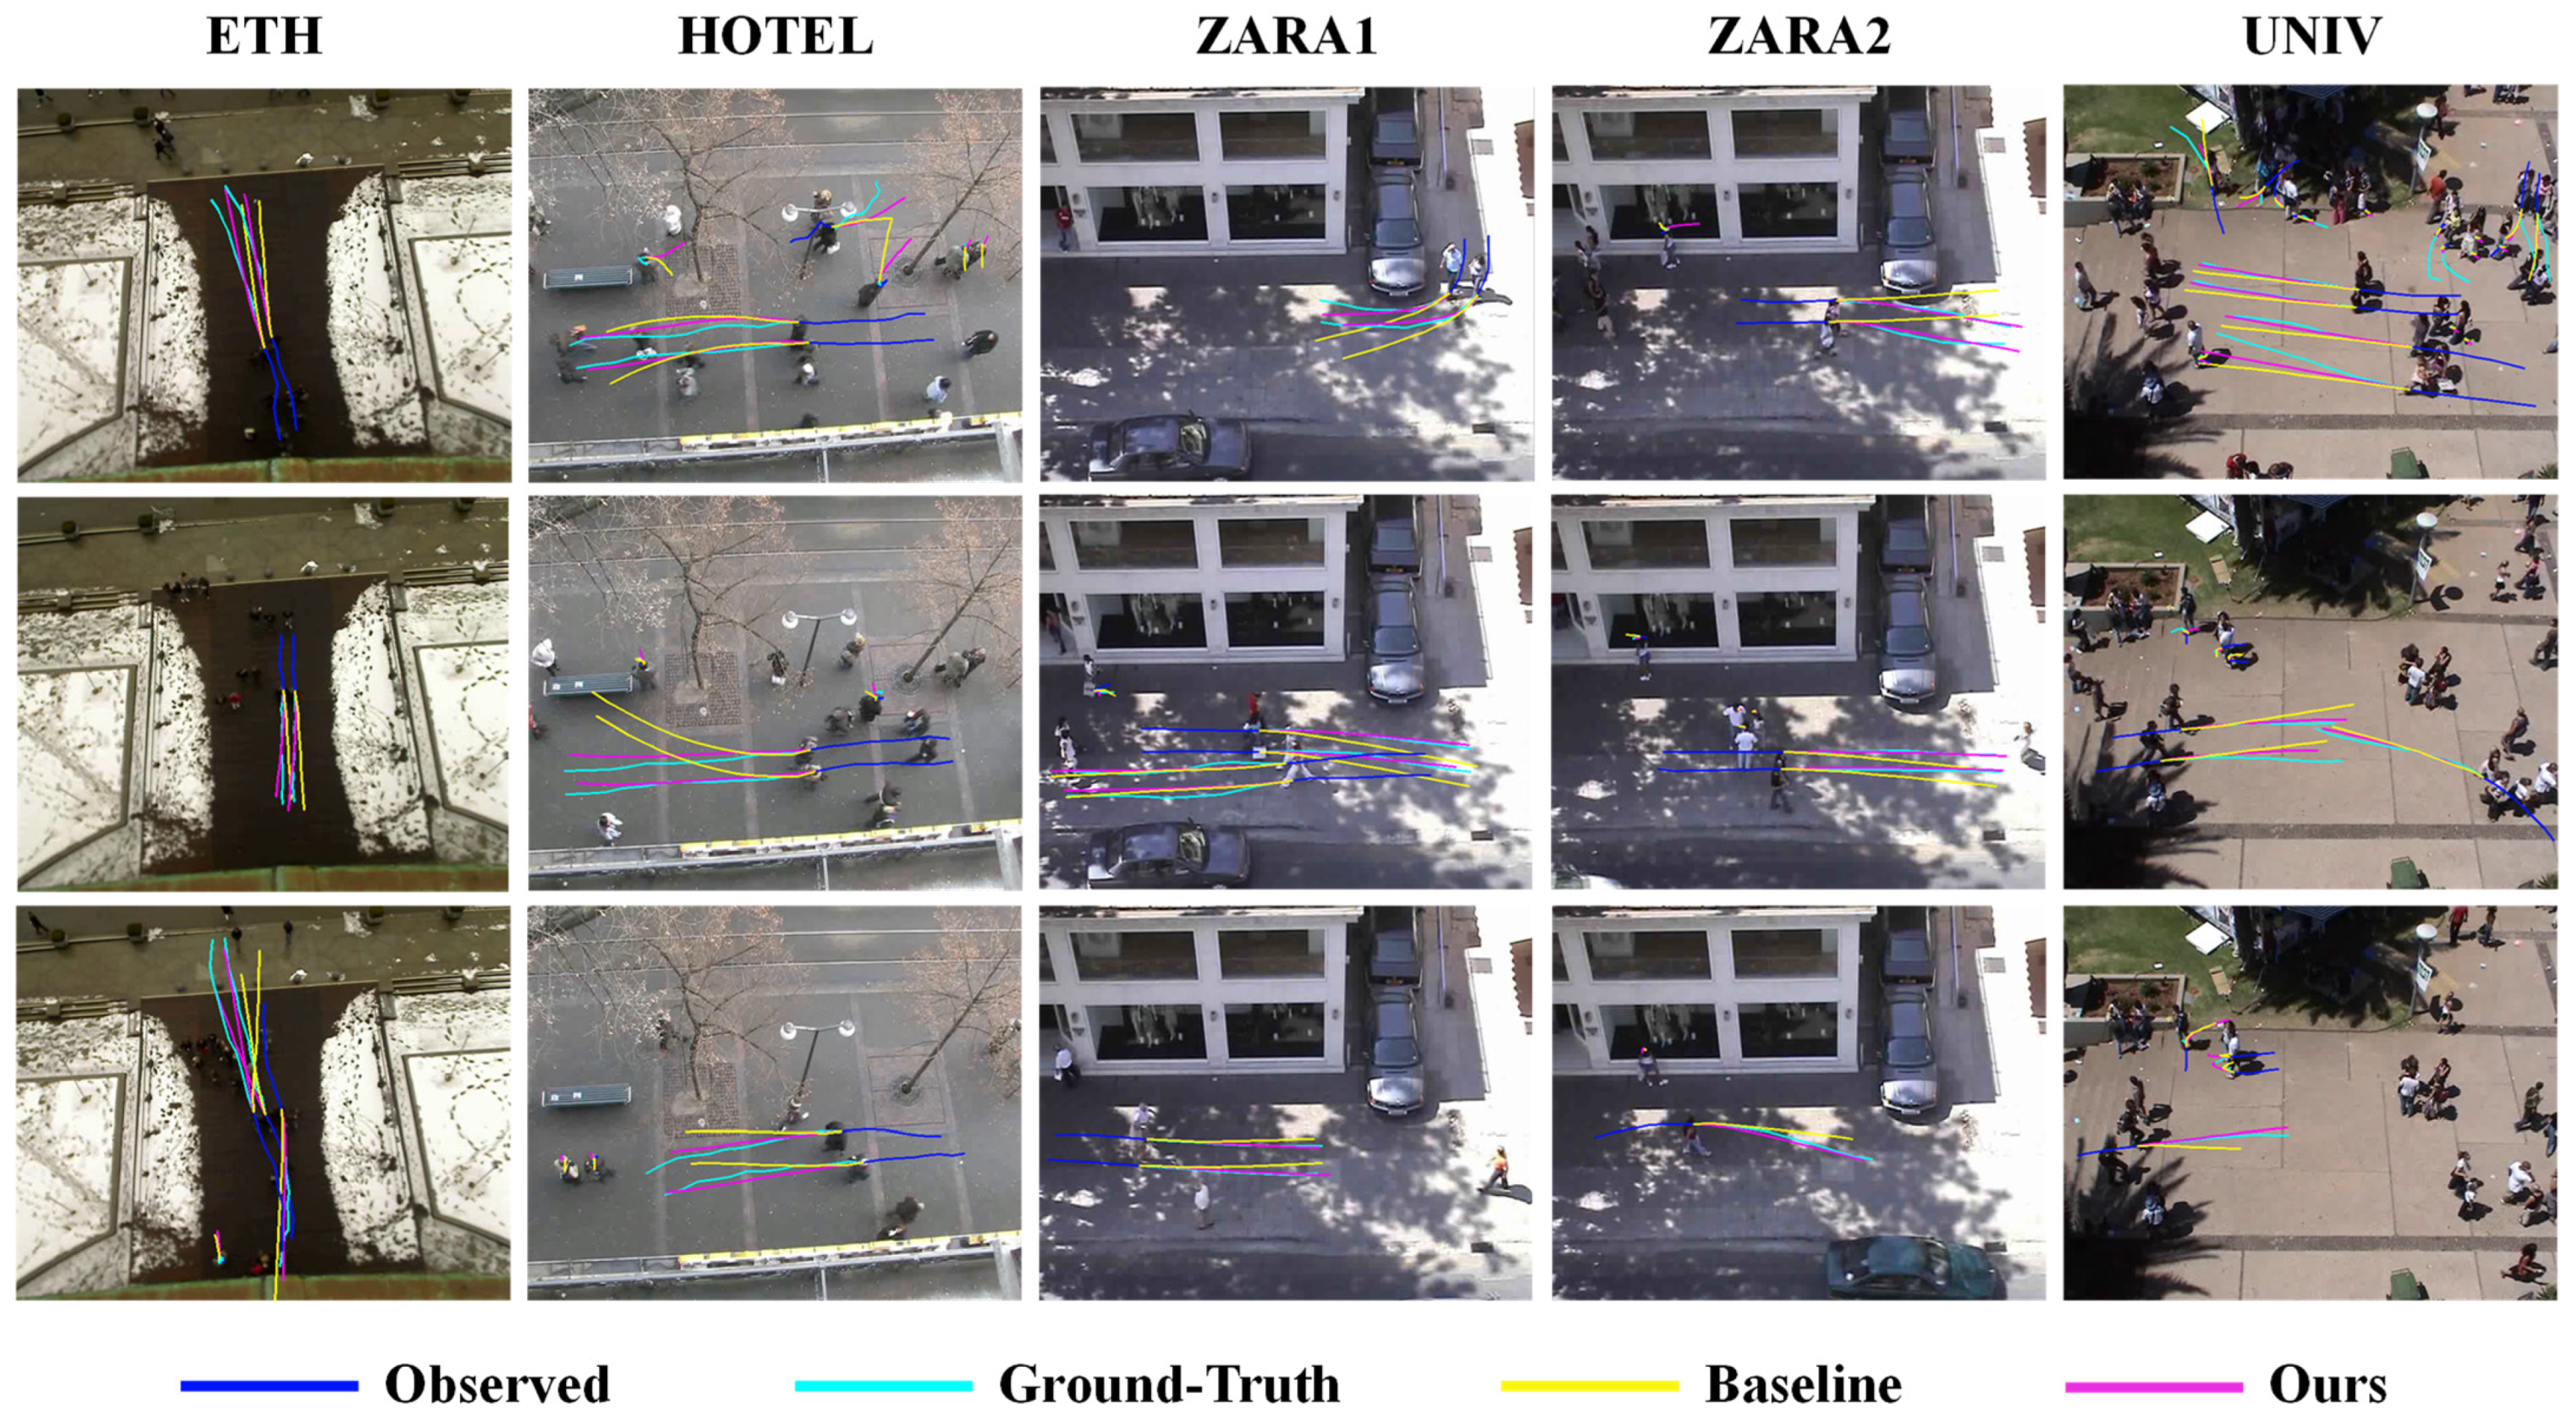
4.3. Visualization Presentation

To better visualize the improvement in trajectory prediction achieved by our two-stage motion pattern de-perturbation strategy compared with that achieved by the baseline models, in Figure 4 and Figure 5 we visualize the predicted trajectories of Ours–STGAT and Ours–SGAN with their corresponding baseline models in five different real-world scenarios. The overall accuracy of trajectory prediction using our method is significantly better than that of the baseline models, and the generated trajectories are more reliable. It should be noted that the visualization results for multiple scenarios indicate that the baseline models predict shorter trajectories for pedestrians who continue walking straight. Even for pedestrians with variable trajectories, the predicted trajectories tend to be closer to the actual trajectories after implementing our strategy. The reason for this is that the stochastic nature of latent vectors is not related to the pedestrians’ own motion characteristics. The introduction of latent vectors to construct trajectory multimodality in a crude and simple manner can have a redundant effect on the pedestrian’s motion pattern. This can result in irrational trajectories, as shown in the visualization figure.

5. Conclusions

In this paper, we propose a two-stage motion pattern de-perturbation strategy, introduce optimization features for eliminating the redundancy effects caused by latent vectors when constructing pedestrian motion patterns, design loss masks to decrease the interference of invalid training data, and model trajectory prediction models efficiently and accurately. Our approach is a plug-and-play module that maximizes the actual effectiveness of the baseline models and improves the trajectory prediction accuracy. Experimental results from multiple real-scene datasets demonstrate that our method significantly reduces the average trajectory prediction error across different baseline models, achieving superior prediction accuracy compared to advanced baseline models. In addition, a comparison of the experimental results with different training data confirms the universality of our method and shows that our method can indeed eliminate interference in modeling motion patterns and effectively guide a model to absorb additional training data. However, the use of latent vectors to model multimodal trajectories has limitations, as they are random numbers independent of pedestrian movement characteristics, resulting in the poor robustness of the modelled motion patterns. Future research should explore more efficient ways of modeling multimodal trajectories, such as incorporating scene information or combining multiple pedestrian motion features.

Author Contributions

Investigation, Y.D. (Yingjian Deng), L.Z. and J.C.; methodology, Y.D. (Yingjian Deng); validation, Y.D. (Yingjian Deng); writing—original draft, Y.D. (Yingjian Deng); writing—review and editing, L.Z., J.C., Y.D. (Yu Deng), Z.H., Y.L., Y.C., Z.W. and J.Z. All authors have read and agreed to the published version of the manuscript.

Funding

This work was supported in part by the National Natural Science Foundation of China under Grant 62001003, in part by the China Postdoctoral Science Foundation under Grant 2020M671851, and in part by Key Research and Development Plan (Industry) Project of Yancheng (BE2023002).

Data Availability Statement

Data are available upon request from the authors.

Conflicts of Interest

Author Jie Chen was employed by the company The 38th Research Institute of China Electronics Technology Group Corporation. The remaining authors declare that the research was conducted in the absence of any commercial or financial relationships that could be construed as a potential conflict of interest.

Appendix A

Appendix A.1. Exploration of the Effects of Redundancy in Latent Vectors

We experimentally explored whether there is a redundancy effect in introducing latent vectors in modeling. We used STGAT as the baseline model, and to ensure a fair comparison with STGAT w/o LZ, deterministic prediction (prediction of only one trajectory) was employed. As depicted in Table A1, the results for STGAT w/o LZ were significantly superior to those for STGAT, suggesting the occurrence of redundancy effects in the introduction of latent vectors. Furthermore, the results show that STGAT with OF outperformed STGAT, indicating that our proposed optimization feature can mitigate the redundancy effects caused by latent vectors. It is important to note the anomaly observed in the HOTEL dataset, which was attributable to the stochastic nature of the latent vectors. While the randomness of latent vectors has the potential to improve prediction accuracy, it does not mean that the introduction of latent vectors has no redundancy effect, as the results on the HOTEL dataset show that STGAT with OF achieves better prediction accuracy than STGAT.
Table A1. Redundancy effect exploration experiment (STGAT w/o LZ means no latent vectors; STGAT with OF means that our optimization features were added).
MethodPerformance (ADE/FDE)
ETHHOTELZARA1ZARA2UNIVAVG
STGAT0.90/1.760.48/0.990.43/0.920.33/0.720.55/1.180.54/1.11
STGAT w/o LZ0.84/1.740.50/1.050.41/0.880.32/0.710.52/1.120.52/1.10
STGAT with OF0.89/1.750.47/0.950.42/0.900.32/0.700.53/1.130.53/1.09

Appendix A.2. Evaluation Experiments on the SDD Dataset

The Stanford UAV dataset [39] is a benchmark dataset for trajectory prediction for multiple target classes; it contains trajectory information for six different intelligences in eight different real-world scenarios, with coordinates in pixels. Consistent with the work tested on SDD [36,37,38,40], we used eight frames of trajectories as input to predict twelve frames of future trajectories and used a dataset segmentation setup consistent with [40].
The * denotes the result of our direct training using the official code provided by SocialVAE. We conducted evaluation experiments on the SDD dataset using SocialVAE as the baseline model to complement the trajectory prediction efficacy of our strategy in more diverse real-world scenarios. We compared Ours–SocialVAE, which uses our method (optimized features and loss masks), with the baseline model SocialVAE*.
The trajectory prediction efficacy results of the baseline models SocialVAE* and Ours–SocialVAE on the SDD dataset for the multitarget category are reported in Table A2. Our approach achieves an effective improvement in average prediction performance over the baseline SocialVAE* on the SDD dataset. Our method also achieves performance improvements in most categories, not only for pedestrians. These results demonstrate the effectiveness of our method for different scenarios.
Table A2. Multicategory evaluation experiments on the SDD dataset. The table highlights the best results for ADE/FDE in bold.
MethodPerformance (ADE/FDE)
PedestrianSkaterBikerCarBusCartAVG
SocialVAE *9.41/15.8234.23/62.0828.79/53.4941.45/64.4725.84/50.5113.12/25.0425.47/45.24
Ours–SocialVAE9.26/14.8629.32/50.8325.97/48.9041.63/65.0824.64/49.3311.41/19.4023.71/41.40

References

  1. Alahi, A.; Goel, K.; Ramanathan, V.; Robicquet, A.; Li, F.-F.; Savarese, S. Social LSTM: Human Trajectory Prediction in Crowded Spaces. In Proceedings of the 2016 IEEE Conference on Computer Vision and Pattern Recognition (CVPR), Las Vegas, NV, USA, 27–30 June 2016; pp. 961–971. [Google Scholar]
  2. Gupta, A.; Johnson, J.; Li, F.-F.; Savarese, S.; Alahi, A. Social GAN: Socially Acceptable Trajectories with Generative Adversarial Networks. In Proceedings of the 2018 IEEE/CVF Conference on Computer Vision and Pattern Recognition, Salt Lake City, UT, USA, 18–23 June 2018; pp. 2255–2264. [Google Scholar]
  3. Huang, Y.; Bi, H.; Li, Z.; Mao, T.; Wang, Z. STGAT: Modeling Spatial-Temporal Interactions for Human Trajectory Prediction. In Proceedings of the 2019 IEEE/CVF International Conference on Computer Vision (ICCV), Seoul, Republic of Korea, 27 October–2 November 2019; pp. 6271–6280. [Google Scholar]
  4. Yu, C.; Ma, X.; Ren, J.; Zhao, H.; Yi, S. Spatio-temporal graph transformer networks for pedestrian trajectory prediction. In Computer Vision—ECCV 2020, Proceedings of the 16th European Conference, Glasgow, UK, 23–28, August 2020; Proceedings, Part XII 16; Springer International Publishing: Cham, Switzerland, 2020. [Google Scholar]
  5. Dendorfer, P.; Elflein, S.; Leal-Taixé, L. MG-GAN: A Multi-Generator Model Preventing Out-of-Distribution Samples in Pedestrian Trajectory Prediction. In Proceedings of the 2021 IEEE/CVF International Conference on Computer Vision (ICCV), Montreal, QC, Canada, 10–17 October 2021; pp. 13138–13147. [Google Scholar]
  6. Xu, P.; Hayet, J.B.; Karamouzas, I. Socialvae: Human trajectory prediction using timewise latents. In Computer Vision—ECCV 2022, Proceedings of the European Conference, Tel Aviv, Israel, 23–27 October 2022; Springer Nature: Cham, Switzerland, 2022. [Google Scholar]
  7. Chen, G.; Li, J.; Lu, J.; Zhou, J. Human trajectory prediction via counterfactual analysis. In Proceedings of the IEEE/CVF International Conference on Computer Vision, Montreal, QC, Canada, 10–17 October 2021. [Google Scholar]
  8. Johora, F.T.; Müller, J.P. Modeling interactions of multimodal road users in shared spaces. In Proceedings of the 2018 21st International Conference on Intelligent Transportation Systems (ITSC), Maui, HI, USA, 4–7 November 2018. [Google Scholar]
  9. Johora, F.T.; Müller, J.P. On transferability and calibration of pedestrian and car motion models in shared spaces. Transp. Lett. 2021, 13, 172–182. [Google Scholar] [CrossRef]
  10. Anvari, B.; Bell, M.G.; Sivakumar, A.; Ochieng, W.Y. Modelling shared space users via rule-based social force model. Transp. Res. Part C Emerg. Technol. 2015, 51, 83–103. [Google Scholar] [CrossRef]
  11. Jan, Q.H.; Kleen, J.M.A.; Berns, K. Self-aware Pedestrians Modeling for Testing Autonomous Vehicles in Simulation. In Proceedings of the 6th International Conference on Vehicle Technology and Intelligent Transport Systems (VEHITS 2020), Online, 2–4 May 2020. [Google Scholar]
  12. Seriani, S.; Fernandez, R. Pedestrian traffic management of boarding and alighting in metro stations. Transp. Res. Part C Emerg. Technol. 2015, 53, 76–92. [Google Scholar] [CrossRef]
  13. Dubroca-Voisin, M.; Kabalan, B.; Leurent, F. On pedestrian traffic management in railway stations: Simulation needs and model assessment. Transp. Res. Procedia 2019, 37, 3–10. [Google Scholar] [CrossRef]
  14. Sun, L.; Zhan, W.; Wang, D.; Tomizuka, M. Interactive prediction for multiple, heterogeneous traffic participants with multi-agent hybrid dynamic bayesian network. In Proceedings of the 2019 IEEE Intelligent Transportation Systems Conference (ITSC), Auckland, New Zealand, 27–30 October 2019. [Google Scholar]
  15. Nasernejad, P.; Sayed, T.; Alsaleh, R. Modeling pedestrian behavior in pedestrian-vehicle near misses: A continuous Gaussian Process Inverse Reinforcement Learning (GP-IRL) approach. Accid. Anal. Prev. 2021, 161, 106355. [Google Scholar] [CrossRef] [PubMed]
  16. Nasernejad, P.; Sayed, T.; Alsaleh, R. Multiagent modeling of pedestrian-vehicle conflicts using Adversarial Inverse Reinforcement Learning. Transp. A Transp. Sci. 2023, 19, 2061081. [Google Scholar] [CrossRef]
  17. Donahue, J.; Anne Hendricks, L.; Guadarrama, S.; Rohrbach, M.; Venugopalan, S.; Saenko, K.; Darrell, T. Long-term recurrent convolutional networks for visual recognition and description. In Proceedings of the 2015 IEEE Conference on Computer Vision and Pattern Recognition (CVPR), Boston, MA, USA, 7–12 June 2015; pp. 2625–2634. [Google Scholar] [CrossRef]
  18. Shu, T.; Todorovic, S.; Zhu, S.C. CERN: Confidence-Energy Recurrent Network for Group Activity Recognition. In Proceedings of the 2017 IEEE Conference on Computer Vision and Pattern Recognition (CVPR), Honolulu, HI, USA, 21–26 July 2017; pp. 4255–4263. [Google Scholar]
  19. Ma, Y.; Zhu, X.; Zhang, S.; Yang, R.; Wang, W.; Manocha, D. Trafficpredict: Trajectory prediction for heterogeneous traffic-agents. Proc. AAAI Conf. Artif. Intell. 2019, 33, 6120–6127. [Google Scholar] [CrossRef]
  20. Sadeghian, A.; Kosaraju, V.; Sadeghian, A.; Hirose, N.; Rezatofighi, H.; Savarese, S. Sophie: An attentive gan for predicting paths compliant to social and physical constraints. In Proceedings of the IEEE/CVF Conference on Computer Vision and Pattern Recognition, Seoul, Republic of Korea, 27 October–2 November 2019. [Google Scholar]
  21. Liang, J.; Jiang, L.; Niebles, J.C.; Hauptmann, A.G.; Li, F.-F. Peeking into the future: Predicting future person activities and locations in videos. In Proceedings of the IEEE/CVF Conference on Computer Vision and Pattern Recognition, Seoul, Republic of Korea, 27 October–2 November 2019. [Google Scholar]
  22. Amirian, J.; Hayet, J.B.; Pettré, J. Social ways: Learning multi-modal distributions of pedestrian trajectories with gans. In Proceedings of the IEEE Conference on Computer Vision and Pattern Recognition Workshops, Long Beach, CA, USA, 16–17 June 2019. [Google Scholar]
  23. Liang, J.; Jiang, L.; Murphy, K.; Yu, T.; Hauptmann, A. The garden of forking paths: Towards multi-future trajectory prediction. In Proceedings of the IEEE/CVF Conference on Computer Vision and Pattern Recognition, Seattle, WA, USA, 13–19 June 2020. [Google Scholar]
  24. Ma, Z.; An, R.; Liu, J.; Cui, Y.; Qi, J.; Teng, Y.; Sun, Z.; Li, J.; Zhang, G. A Pedestrian Trajectory Prediction Method for Generative Adversarial Networks Based on Scene Constraints. Electronics 2024, 13, 628. [Google Scholar] [CrossRef]
  25. Kosaraju, V.; Sadeghian, A.; Martín-Martín, R.; Reid, I.; Rezatofighi, H.; Savarese, S. Social-bigat: Multimodal trajectory forecasting using bicycle-gan and graph attention networks. In Proceedings of the Advances in Neural Information Processing Systems 32: Annual Conference on Neural Information Processing Systems 2019, NeurIPS 2019, Vancouver, BC, Canada, 8–14 December 2019. [Google Scholar]
  26. Mohamed, A.; Qian, K.; Elhoseiny, M.; Claudel, C. Social-stgcnn: A social spatio-temporal graph convolutional neural network for human trajectory prediction. In Proceedings of the IEEE/CVF Conference on Computer Vision and Pattern Recognition, Seattle, WA, USA, 13–19 June 2020. [Google Scholar]
  27. Shi, L.; Wang, L.; Long, C.; Zhou, S.; Zhou, M.; Niu, Z.; Hua, G. SGCN: Sparse graph convolution network for pedestrian trajectory prediction. In Proceedings of the IEEE/CVF Conference on Computer Vision and Pattern Recognition, Montreal, QC, Canada, 10–17 October 2021. [Google Scholar]
  28. Yue, J.; Manocha, D.; Wang, H. Human trajectory prediction via neural social physics. In Computer Vision—ECCV 2022, Proceedings of the European Conference, Tel Aviv, Israel, 23–27 October 2022; Springer Nature: Cham, Switzerland, 2022. [Google Scholar]
  29. Bae, I.; Park, J.H.; Jeon, H.G. Non-Probability Sampling Network for Stochastic Human Trajectory Prediction. In Proceedings of the 2022 IEEE/CVF Conference on Computer Vision and Pattern Recognition (CVPR), New Orleans, LA, USA, 18–24 June 2022; pp. 6467–6477. [Google Scholar]
  30. Pellegrini, S.; Ess, A.; Schindler, K.; van Gool, L. You’ll never walk alone: Modeling social behavior for multi-target tracking. In Proceedings of the 2009 IEEE 12th International Conference on Computer Vision, Kyoto, Japan, 29 September–2 October 2009; pp. 261–268. [Google Scholar]
  31. Lerner, A.; Chrysanthou, Y.; Lischinski, D. Crowds by Example. Comput. Graph. Forum 2007, 26, 655–664. [Google Scholar] [CrossRef]
  32. Raksincharoensak, P.; Hasegawa, T.; Nagai, M. Motion planning and control of autonomous driving intelligence system based on risk potential optimization framework. Int. J. Automot. Eng. 2016, 7, 53–60. [Google Scholar] [CrossRef] [PubMed]
  33. Zhang, P.; Ouyang, W.; Zhang, P.; Xue, J.; Zheng, N. Sr-lstm: State refinement for lstm towards pedestrian trajectory prediction. In Proceedings of the IEEE/CVF Conference on Computer Vision and Pattern Recognition, Seoul, Republic of Korea, 27 October–2 November 2019. [Google Scholar]
  34. Zhang, L.; She, Q.; Guo, P. Stochastic trajectory prediction with social graph network. arXiv 2019, arXiv:1907.10233. [Google Scholar]
  35. Zhao, T.; Xu, Y.; Monfort, M.; Choi, W.; Baker, C.; Zhao, Y.; Wang, Y.; Wu, Y.N. Multi-agent tensor fusion for contextual trajectory prediction. In Proceedings of the IEEE/CVF Conference on Computer Vision and Pattern Recognition, Seoul, Republic of Korea, 27 October–2 November 2019. [Google Scholar]
  36. Mangalam, K.; Girase, H.; Agarwal, S.; Lee, K.H.; Adeli, E.; Malik, J.; Gaidon, A. It is not the journey but the destination: Endpoint conditioned trajectory prediction. In Computer Vision—ECCV 2020, Proceedings of the 16th European Conference, Glasgow, UK, 23–28 August 2020; Proceedings, Part II 16; Springer International Publishing: Cham, Switzerland, 2020. [Google Scholar]
  37. Salzmann, T.; Ivanovic, B.; Chakravarty, P.; Pavone, M. Trajectron++: Dynamically-feasible trajectory forecasting with heterogeneous data. In Computer Vision—ECCV 2020, Proceedings of the 16th European Conference, Glasgow, UK, 23–28 August 2020; Proceedings, Part XVIII 16; Springer: Cham, Switzerland, 2020; pp. 683–700. [Google Scholar]
  38. Mohamed, A.; Zhu, D.; Vu, W.; Elhoseiny, M.; Claudel, C. Social-implicit: Rethinking trajectory prediction evaluation and the effectiveness of implicit maximum likelihood estimation. In Computer Vision—ECCV 2022, Proceedings of the European Conference, Tel Aviv, Israel, 23–27 October 2022; Springer Nature: Cham, Switzerland, 2022. [Google Scholar]
  39. Robicquet, A.; Sadeghian, A.; Alahi, A.; Savarese, S. Learning social etiquette: Human trajectory understanding in crowded scenes. In Computer Vision—ECCV 2016, Proceedings of the 14th European Conference, Amsterdam, The Netherlands, 11–14 October 2016; Proceedings, Part VIII 14; Springer International Publishing: Cham, Switzerland, 2016. [Google Scholar]
  40. Rainbow, B.A.; Men, Q.; Shum, H.P. Semantics-STGCNN: A semantics-guided spatial-temporal graph convolutional network for multi-class trajectory prediction. In Proceedings of the 2021 IEEE International Conference on Systems, Man, and Cybernetics (SMC), Melbourne, Australia, 17–20 October 2021. [Google Scholar]
Figure 1. Interference in pedestrian motion pattern construction and learning stages should be eliminated. (a) Constructing pedestrian motion patterns; (b) No loss mask; (c) Use of loss mask.
Electronics 13 01135 g001
Figure 2. The training process of our two-stage motion pattern optimization strategy.
Electronics 13 01135 g002
Figure 3. Performance of the model with different training dataset data volumes. (a) Comparison on ADE; (b) Comparison on FDE.
Electronics 13 01135 g003
Figure 4. Visualization of Ours–STGAT and STGAT in different real scenarios.
Electronics 13 01135 g004
Figure 5. Visualization of Ours–SGAN and SGAN in different real scenarios.
Electronics 13 01135 g005
Table 1. Summary of main notations.
NotationDescription
X i Past trajectory of agent i
Y i Future trajectory of agent i
m i Trajectory features of agent i
g i Interaction features of agent i
z Latent vectors sampled from a Gaussian distribution
W d Weight parameter in the baseline model decoder
| | Concatenation operation
h i Pedestrian motion patterns output by the baseline model decoder
ξ i Optimization factor utilized to construct optimization features
O F Optimization features
h i Decoder output using optimization features
W o Weight parameter of the output module in the baseline model
Y i ^ Final predicted trajectory obtained using optimization features
x i t 1 , y i t 1 Coordinate component of the displacement of agent i at time t 1
V A i Average speed of agent i over historical observation frames
L B Loss function defined by the baseline model
L M a s k i Loss mask for agent i
Table 2. Evaluation results of several advanced baseline models. Our two-stage optimization strategy improved the predictive efficacy of all three baseline methods. For both the ADE and FDE metrics, the lower the value is, the better the result. The table highlights the best results for ADE/FDE in bold.
Baseline 1Performance (ADE/FDE)
ETHHOTELZARA1ZARA2UNIVAVG
Social LSTM [1]1.09/2.350.86/1.910.41/0.880.52/1.110.61/1.310.70/1.52
SoPhie [20]0.70/1.430.76/1.670.30/0.630.38/0.780.54/1.240.54/1.15
SR-LSTM [33]0.63/1.250.37/0.740.41/0.900.32/0.700.51/1.100.45/0.94
STSGN [34]0.75/1.630.63/1.010.30/0.650.26/0.570.48/1.080.48/0.99
MATF [35]1.33/2.490.51/0.950.44/0.930.34/0.730.56/1.190.64/1.26
MATF GAN [35]1.01/1.750.43/0.800.26/0.450.26/0.570.44/0.910.48/0.90
PITF [21]0.73/1.650.30/0.590.38/0.810.31/0.680.60/1.270.46/1.00
Social-BiGAT [25]0.69/1.290.49/1.010.30/0.620.36/0.750.55/1.320.48/1.00
STGCNN [26]
STGAT [3]
0.64/1.11
0.65/1.12
0.49/0.85
0.35/0.66
0.34/0.53
0.34/0.69
0.30/0.48
0.29/0.60
0.44/0.79
0.52/1.10
0.44/0.75
0.43/0.83
STGAT *0.80/1.420.37/0.700.33/0.660.29/0.610.55/1.170.47/0.91
Ours–STGAT0.59/1.020.34/0.610.32/0.650.30/0.620.52/1.120.41/0.80
Baseline 2Performance (ADE/FDE)
ETHHOTELZARA1ZARA2UNIVAVG
SGAN [2]0.71/1.290.48/1.020.34/0.690.31/0.640.56/1.180.48/0.96
SGAN *0.75/1.360.41/0.820.33/0.680.30/0.640.53/1.130.46/0.93
Ours–SGAN0.64/1.150.39/0.750.33/0.670.29/0.620.53/1.150.44/0.87
Baseline 3Performance (ADE/FDE)
ETHHOTELZARA1ZARA2UNIVAVG
PECNet [36]0.54/0.870.18/0.240.22/0.390.17/0.300.35/0.600.29/0.48
Trajectron++ [37]0.54/0.940.16/0.280.21/0.420.16/0.310.28/0.550.27/0.50
SGCN [27]0.63/1.030.32/0.550.29/0.530.25/0.450.37/0.700.37/0.65
Social-Implicit [38]0.66/1.440.20/0.360.25/0.500.22/0.430.31/0.600.33/0.67
SocialVAE [6]0.49/0.770.15/0.240.19/0.370.15/0.280.25/0.470.25/0.43
SocialVAE *0.50/0.850.15/0.230.20/0.370.16/0.290.25/0.480.25/0.44
Ours–SocialVAE0.48/0.770.15/0.210.21/0.370.15/0.280.26/0.490.25/0.42
Table 3. The results were evaluated when using different forms of ξ i to construct the optimized features, where STGAT is the baseline model. The table highlights the best results for ADE/FDE in bold.
Performance (ADE/FDE)
ETHHOTELZARA1ZARA2UNIVAVG
STGAT* (Baseline)0.80/1.420.37/0.700.33/0.660.29/0.610.55/1.170.47/0.91
STGAT 10.59/1.020.34/0.610.32/0.650.30/0.620.52/1.120.41/0.80
STGAT 20.61/1.040.37/0.730.32/0.660.30/0.600.52/1.110.42/0.83
STGAT 30.71/1.250.35/0.640.33/0.650.30/0.610.56/1.170.45/0.86
STGAT 40.67/1.240.33/0.620.33/0.670.31/0.630.55/1.150.44/0.86
Note: 1 indicates that ξ i used zero vectors, 2 indicates that all the values in ξ i were 0.5, 3 indicates that ξ i was obtained by sampling from a uniform distribution, and 4 indicates that ξ i was obtained by sampling from a standard normal distribution.
Table 4. The separate contributions of the optimized features and loss masks were evaluated using STGAT as a baseline model. The table highlights the best results for ADE/FDE in bold.
Performance (ADE/FDE)
ETHHOTELZARA1ZARA2UNIVAVG
STGAT* (Baseline)0.80/1.420.37/0.700.33/0.660.29/0.610.55/1.170.47/0.91
STGAT w/o OF0.77/1.330.36/0.670.33/0.680.30/0.600.54/1.170.46/0.89
STGAT w/o LM0.61/1.050.32/0.610.33/0.660.28/0.580.52/1.110.41/0.80
Ours–STGAT0.59/1.020.34/0.610.32/0.650.30/0.620.52/1.120.41/0.80
Disclaimer/Publisher’s Note: The statements, opinions and data contained in all publications are solely those of the individual author(s) and contributor(s) and not of MDPI and/or the editor(s). MDPI and/or the editor(s) disclaim responsibility for any injury to people or property resulting from any ideas, methods, instructions or products referred to in the content.

