Abstract
In this study, Loran-C signals were collected throughout the day, and the characteristics of the received signals at different propagation distances were analyzed. Because the signal amplitude is small and difficult to recognize at a long distance and there is mutual interference between stations, a linear average method is used to process the received signal. At locations closer to the receiver, clear observations of the time delay and amplitude variation in the one-hop sky wave can be made by using the ground wave as a reference, which can be applied to studying the characteristics and parameter inversion of the lower ionosphere. When the distance is further, the significant enhancement of the sky-wave signal during the night may lead to decreased accuracy in timing and positioning. When the distance is much larger than the propagation range of the ground wave, only the sky-wave signal can be received, and the signal is more stable than when the distance is closer. During the night, multiple amplitude-comparable multi-path signals may appear in the sky wave, making the identification of the one-hop sky wave more difficult.
1. Introduction
As is well known, the Loran-C system is a land-based radio navigation system with a working frequency of 100 kHz [1]. The system’s signals propagate to the receiving point through two paths, the ground wave and sky wave, so that the received signal is a synthesized wave of the two. Currently, the Loran-C system utilizes the ground wave for timing, navigation, and positioning. However, the sky-wave signals are prone to distortion due to time, seasonal, and climatic variations in the ionosphere, leading to unstable synthesized signals at the receiving point that affect the final positioning results. Additionally, the propagation distance of ground waves is about 1200 km on land and about 1500 km at sea, with coverage limited to coastal areas and waters near where the transmitting station is located. To meet the demand for longer-distance positioning, one of the most cost-effective methods is to develop low-frequency (LF) sky-wave positioning technology. Therefore, whether it is to improve the positioning speed, accuracy, and reliability of the ground wave or to address the long-distance positioning problem, in-depth research on LF sky-wave signals is necessary.
The study of Loran-C sky-wave signals primarily involves two aspects of research.
Firstly, research has been conducted on the theoretical methods for Loran-C sky waves, including the propagation mechanism, simulation calculation methods for the propagation process, time delay estimation methods, and the impact of the channel parameters on propagation. Currently, there are three main methods, the waveguide method, wave-hop method, and Finite Difference Time Domain (FDTD) method, developed to predict the propagation of LF waves [2,3,4,5,6,7,8]. The prediction of Loran-C sky-wave time delays and the analysis of the impact of the propagation channel parameters are mainly based on these three methods [9,10,11,12,13].
Secondly, research has focused on the signal separation algorithms, primarily used to separate Loran-C sky-wave signals and ground-wave signals from the actual received signals. The early algorithms [14,15,16,17,18] relied heavily on FFT or modern spectrum analysis, leading to issues such as a low resolution, low accuracy, and poor noise resistance [19]. However, at that time, the main goal was to eliminate sky waves, so these issues had minimal impact. In recent years, with the continuous development of the Loran-C system and ionospheric models, using Loran-C sky waves for positioning has attracted attention. Various advanced algorithms [19,20,21] have been proposed, greatly improving the accuracy of separating Loran-C sky waves from ground waves.
During these research processes, measurements of actual Loran-C sky-wave signals have also been conducted. Most of these involved collecting small numbers of data to validate the correctness of the theories and methods, with limited measurements regarding the sky-wave availability and propagation characteristics [22,23,24]. Therefore, the current research is not sufficient to fully utilize LF sky-wave signals for positioning. In the study of sky-wave signals, in addition to theoretical research, a large number of actual data is needed to provide a basis for the practical application of the theoretical research. To achieve joint positioning of sky waves and ground waves on the receiver, a clearer understanding of the characteristics of the received signals at different distances is necessary.
Previously, we have conducted research on the separation methods for Loran-C sky waves and ground waves [21]. In Section 4.2 of [21], the proposed algorithm successfully separated the received signals. However, it did not specify which of the four signals, other than the ground wave, was the sky-wave signal. Based on this question and the need for further research, we collected and analyzed signals throughout one day. On the one hand, we answered this question and provided a method for obtaining a sky-wave signal when the ground-wave signal is relatively large and stable, which can be used for the study of the sky-wave signal’s characteristics or the inversion of the ionospheric parameters. On the other hand, based on the distances from various stations to the receiving point, we selected the North Sea chains (China) to analyze the characteristics of the received signals at different distances. In the research process, to obtain weak signals at long distances, the linear average method was used to significantly enhance the signal-to-noise ratio (SNR) of the received signals. This article consists of four parts: the data acquisition and processing methods in Section 2, presentation and analysis of the signal processing results in Section 3, and a summary of and outlook on the research results in Section 4.
2. The Data Acquisition and Processing Method
The method of data acquisition and processing is introduced in this section.
2.1. Loran-C Signals
Loran-C signals are not broadcast individually but are sent in groups of pulses. Loran-C stations are divided into a master station and secondary station according to the geographical location of the design. As shown in Figure 1, the master station transmits nine pulses as a group, and the secondary station transmits eight pulses as a group. The time delay between the two pulses is 1000 µs, while the interval between the eighth and ninth pulses of the master station is 2000 µs. The ninth pulse of the master station is a symbolic pulse, which is used to distinguish the signals of the master station and the secondary station, and can also send a warning in the form of a pulse flash. Every eight or nine pulse signals transmitted by the master or secondary station are defined as a pulse group. The length of time between successive transmissions of the master’s pulse groups is termed the group repetition interval (GRI) and is expressed in microseconds. The GRI designator is the GRI divided by ten and is used as a symbol to identify and designate the Loran-C chain [1]. The master station and each secondary station in the chain make transmissions in a specified and precisely timed sequence. First, the master station transmits. Then, after an interval sufficient to allow the master signal to propagate throughout the coverage area, the first secondary station in the sequence transmits, and so forth. The total elapsed time from the master transmission until the secondary transmission is termed the emission delay (ED).

Figure 1.
Schematic diagram of the transmission signal of Loran-C station.
Within each pulse group from the master and secondary stations, the phase of the radio frequency (RF) carrier is changed systematically from pulse to pulse in the pattern shown in Table 1. This procedure is known as phase coding. Patterns “A” and “B” alternate in sequence. The pattern of phase coding differs for the master and secondary transmitters. In Table 1, “+” represents phase 0, and “−” represents phase .

Table 1.
Loran-C phase codes for master and secondary transmitters.
2.2. Data Acquisition
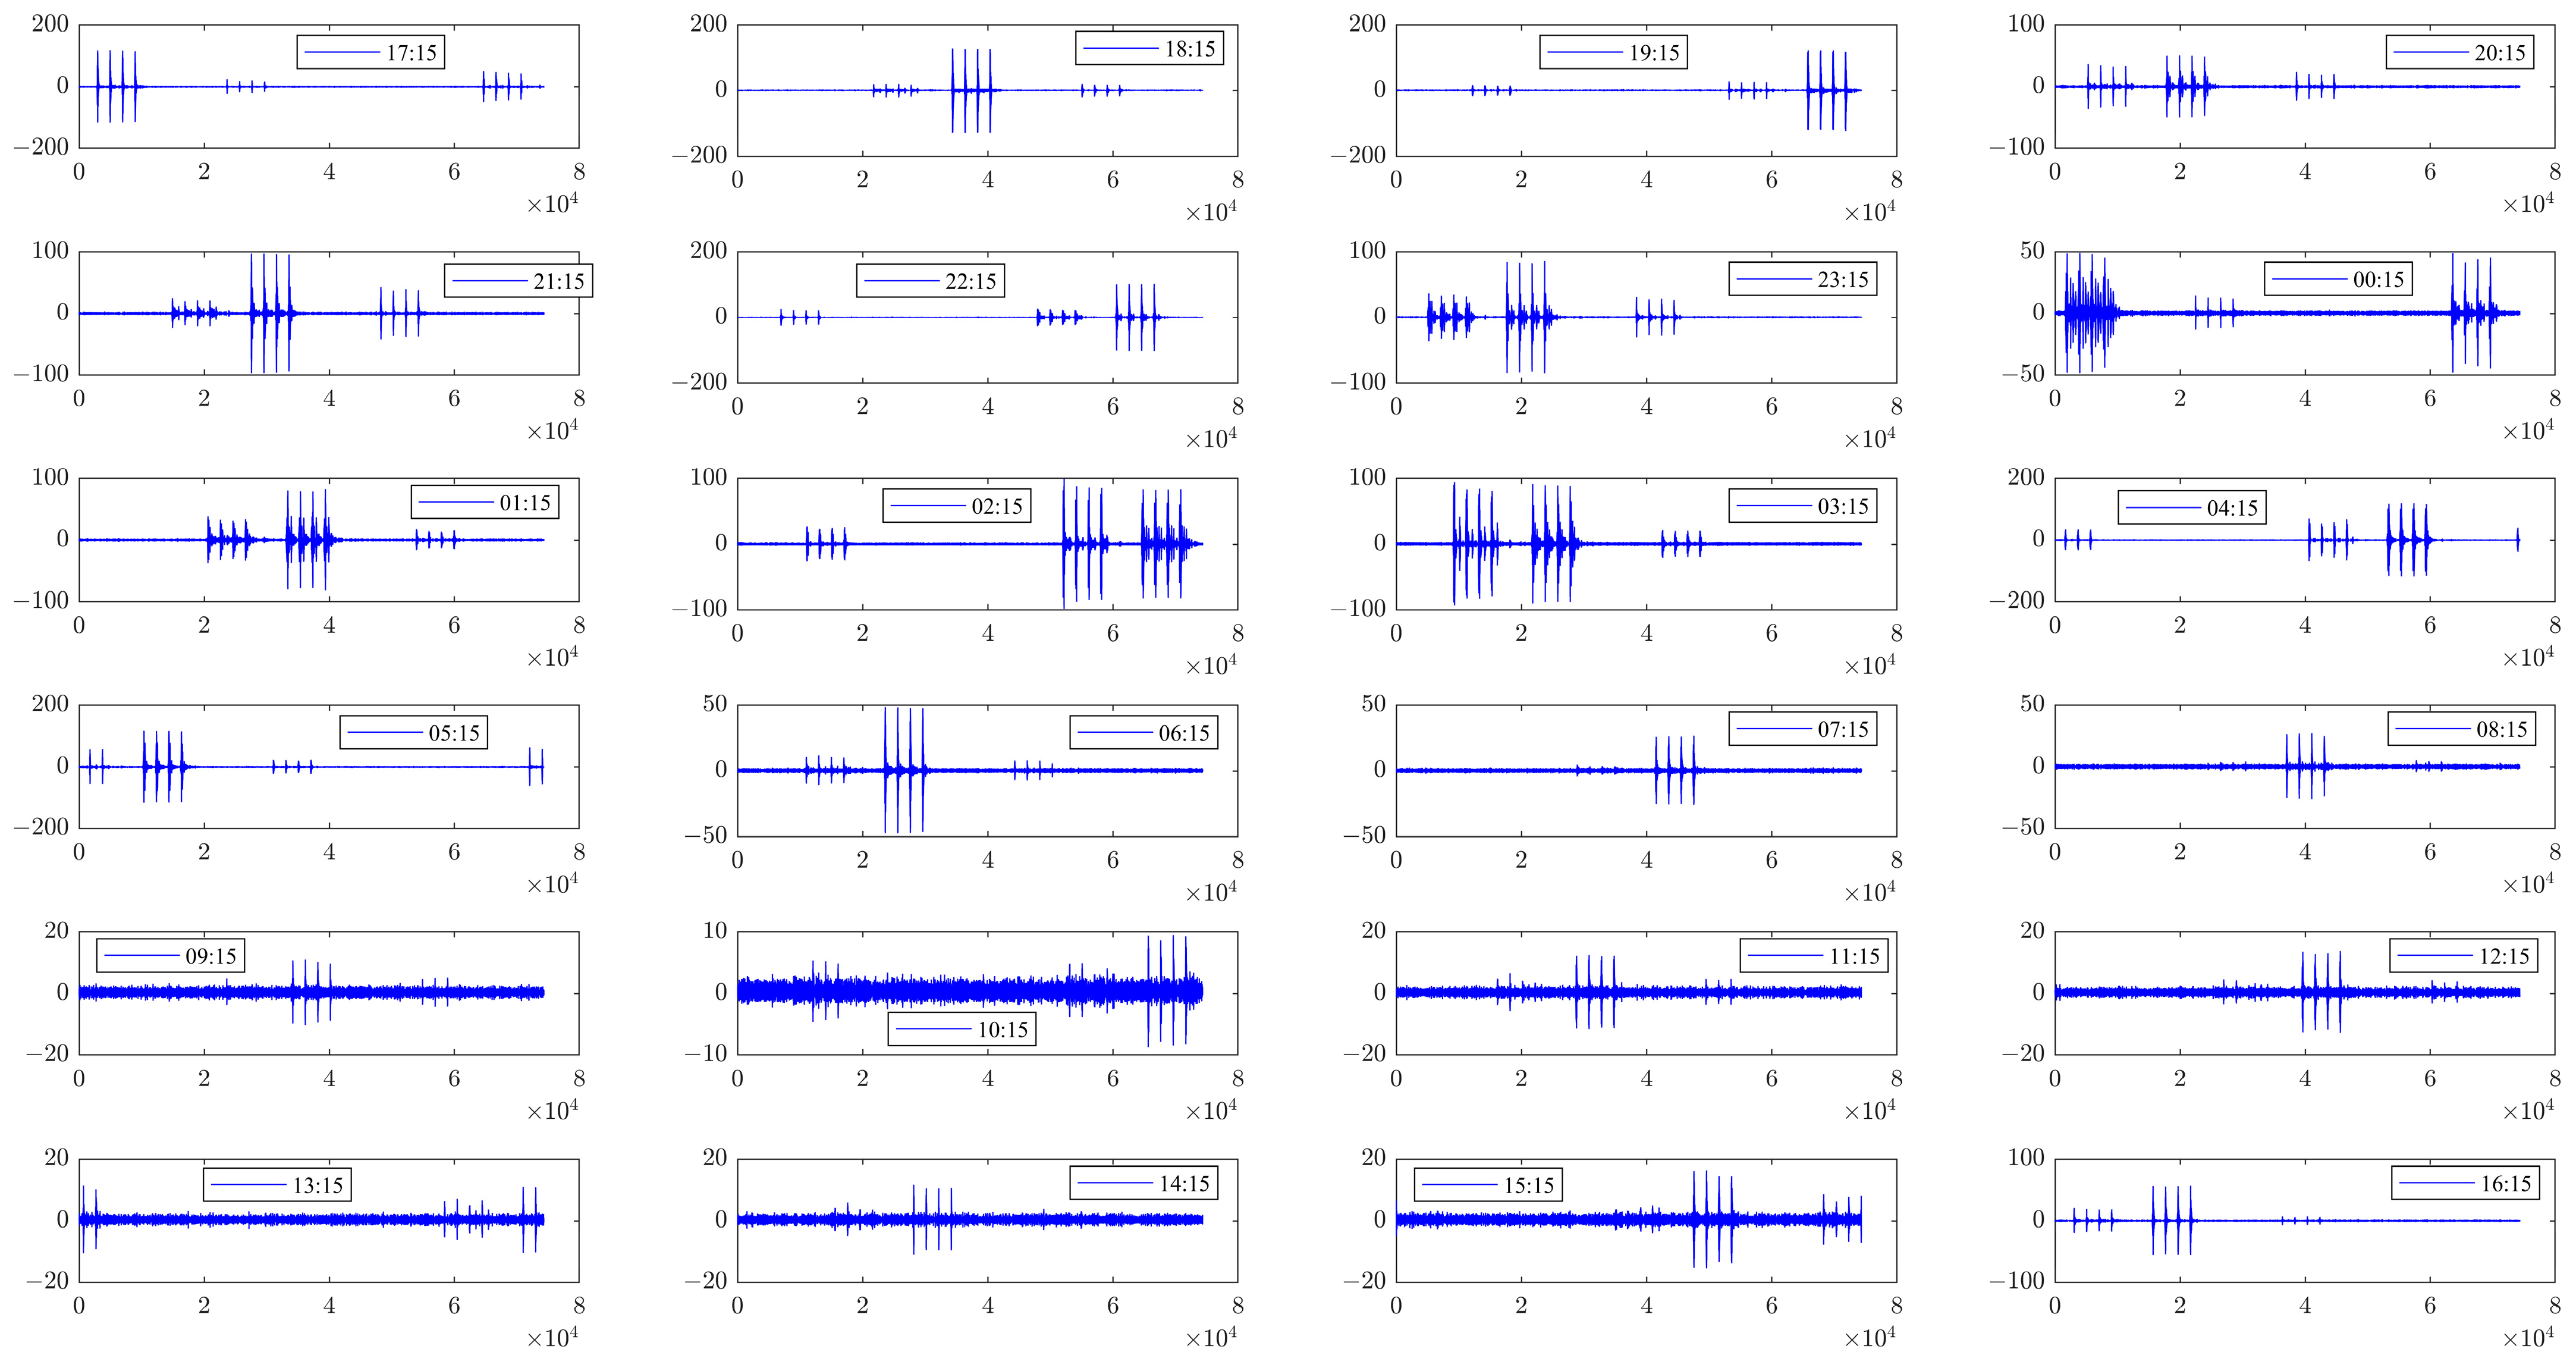
A schematic diagram of the signal acquisition process can be referred to in [21]. The final stored data are sampled at a rate of 1 MHz, with one file stored every five minutes. From 17:15 on 25 November to 18:00 on 26 November 2023, the Loran-C signals were collected at E and N. The time here is local time. All the data were normalized according to a uniform standard for the amplitude of the signal. Therefore, all the data in the graphs presented in this paper are the result of normalization. Part of the signal is shown in Figure 2. From Figure 2, we can see that the signal strength of each station is quite different, and the signals of each station obviously cross, so they are not easy to distinguish.
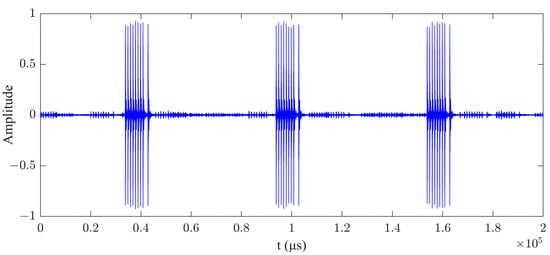
Figure 2.
Part of the signal on 25–26 November 2023 at and .
2.3. The Linear Average Method
Loran-C signals are easily affected by noise in the process of propagation and reception, resulting in envelope distortion and SNR reduction. Therefore, for a pulse signal with a low SNR, the linear digital averaging technique can be used to improve the SNR. Assume that the received signal vector is of the following form:
where is the vector form of the signal after superimposed noise, and is the quantized value. The input SNR is
where is the amplitude of the signal, and is the noise’s standard deviation. The result after M times accumulation of the signal and then the calculation of the linear digital average can be expressed as
With the linear digital averaging method, the standard deviation of the noise is . Therefore, The output SNR is
2.4. The Algorithm Applied to Loran-C
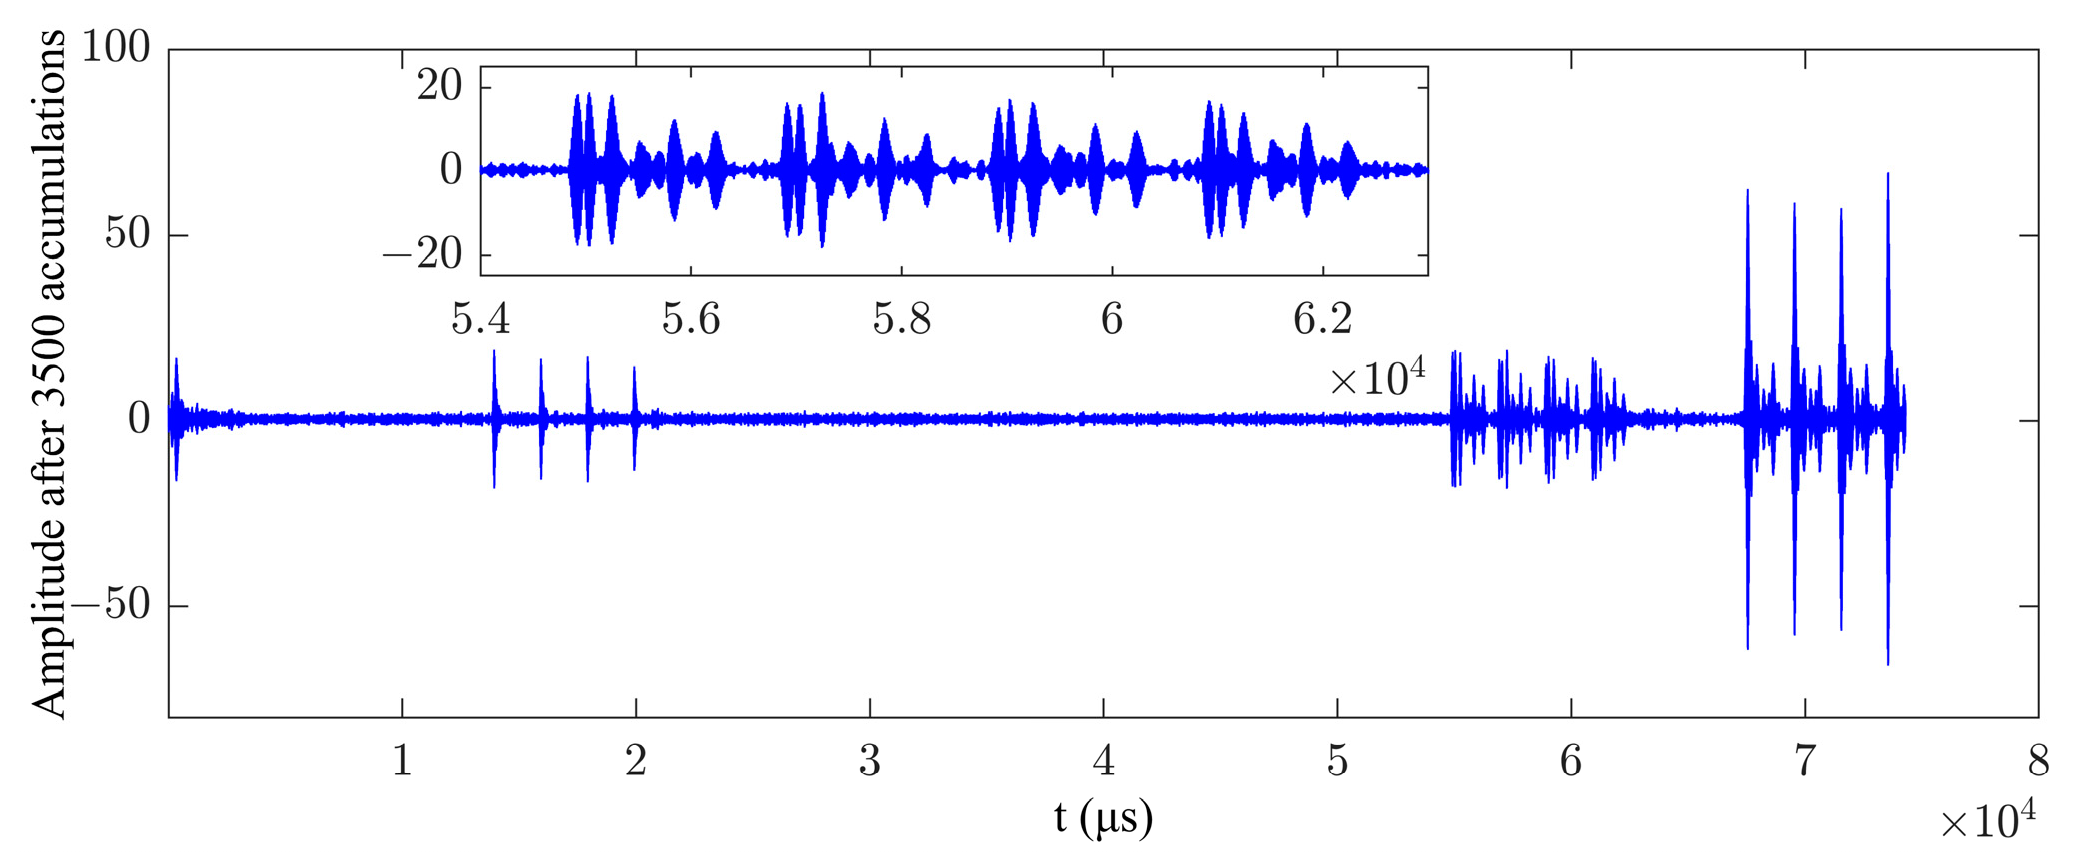
The station information contained in each station chain of China and the ground distance between the station and the receiving point are shown in Table 2. According to the GRI of each station chain of Loran-C signals in China, the data within five minutes are accumulated, and the result is shown in Figure 3. According to the distance from each station to the receiving position and the emission delay of the signal of each station chain in Table 2, the corresponding relationship between the signal and the transmitting station in Figure 3 can be clearly obtained and marked in Figure 3. Because the GRI of each chain is different, the number of GRIs contained in five minutes is not the same, and the number of times that they can be accumulated is not the same. In order to make sure all the signals have a uniform comparison standard, the same M is selected, which is 3500 in this paper. In order to also represent small signal amplitudes using an integer, in the subsequent analysis and drawing, the accumulated signals were not averaged. According to the principle of the linear average method, this does not affect the performance of the method. As can be seen from Figure 3, after processing using the linear average method, the SNR is not only significantly improved but also the interference from other stations is suppressed. Since the patterns “A” and “B” alternate in sequence, the even pulses cancel each other out after accumulation. To determine the arrival time of the sky wave, we just need to find the arrival time of the first pulse.
Table 2.
The station information contained in each station chain of China and the ground distance between the station and the receiving point.
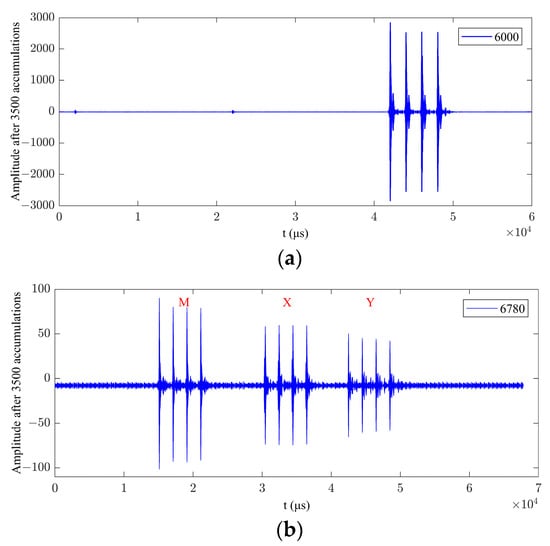
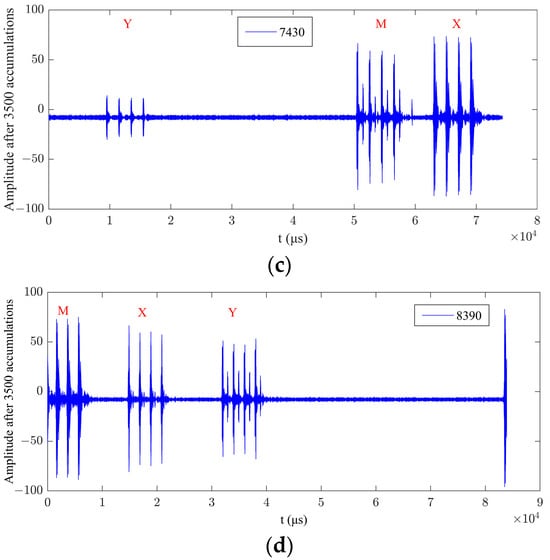
Figure 3.
After 3500 accumulations, the result of the signal. (a) 6000, (b) 6780, (c) 7430, and (d) 8390.
It should be noted here that in order to obtain a better signal quality, it is necessary to remove the large signal (6000) when the signals of the other stations are accumulated.
3. Analysis and Discussion of the Results
In this section, the received signals at Pucheng station and the North sea chain in one day are analyzed, and some thoughts and discussions are put forward.
3.1. The Results for Pucheng Station
The FFT/IFFT method is used to separate the signals received from Pucheng station in one day, and the results are shown in Figure 4. In previous research [21], the FFT/IFFT and L-M methods were used to separate the signals from Pucheng station. From Figures 10 and 11 in [21], we can see that there are five distinct signals. However, the research in [21] did not clearly identify which one was the sky-wave signal. The main focus of the paper in [21] was to validate the proposed algorithm, without analyzing the sources of each signal. Here, the issue becomes clear. From Figure 4, the ground-wave signal or multi-path signals from surrounding reflections remain unchanged throughout the day, while the time delay and amplitude differences between the sky wave and the ground wave vary significantly. Therefore, the sky-wave signal can be clearly identified.
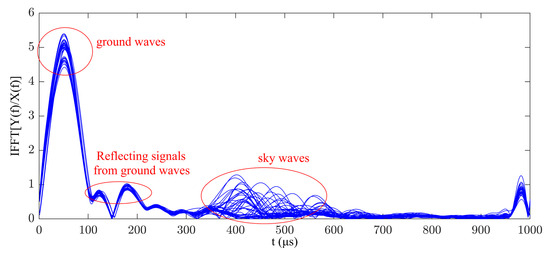
Figure 4.
The result of separation of signals from Pucheng station for one day.
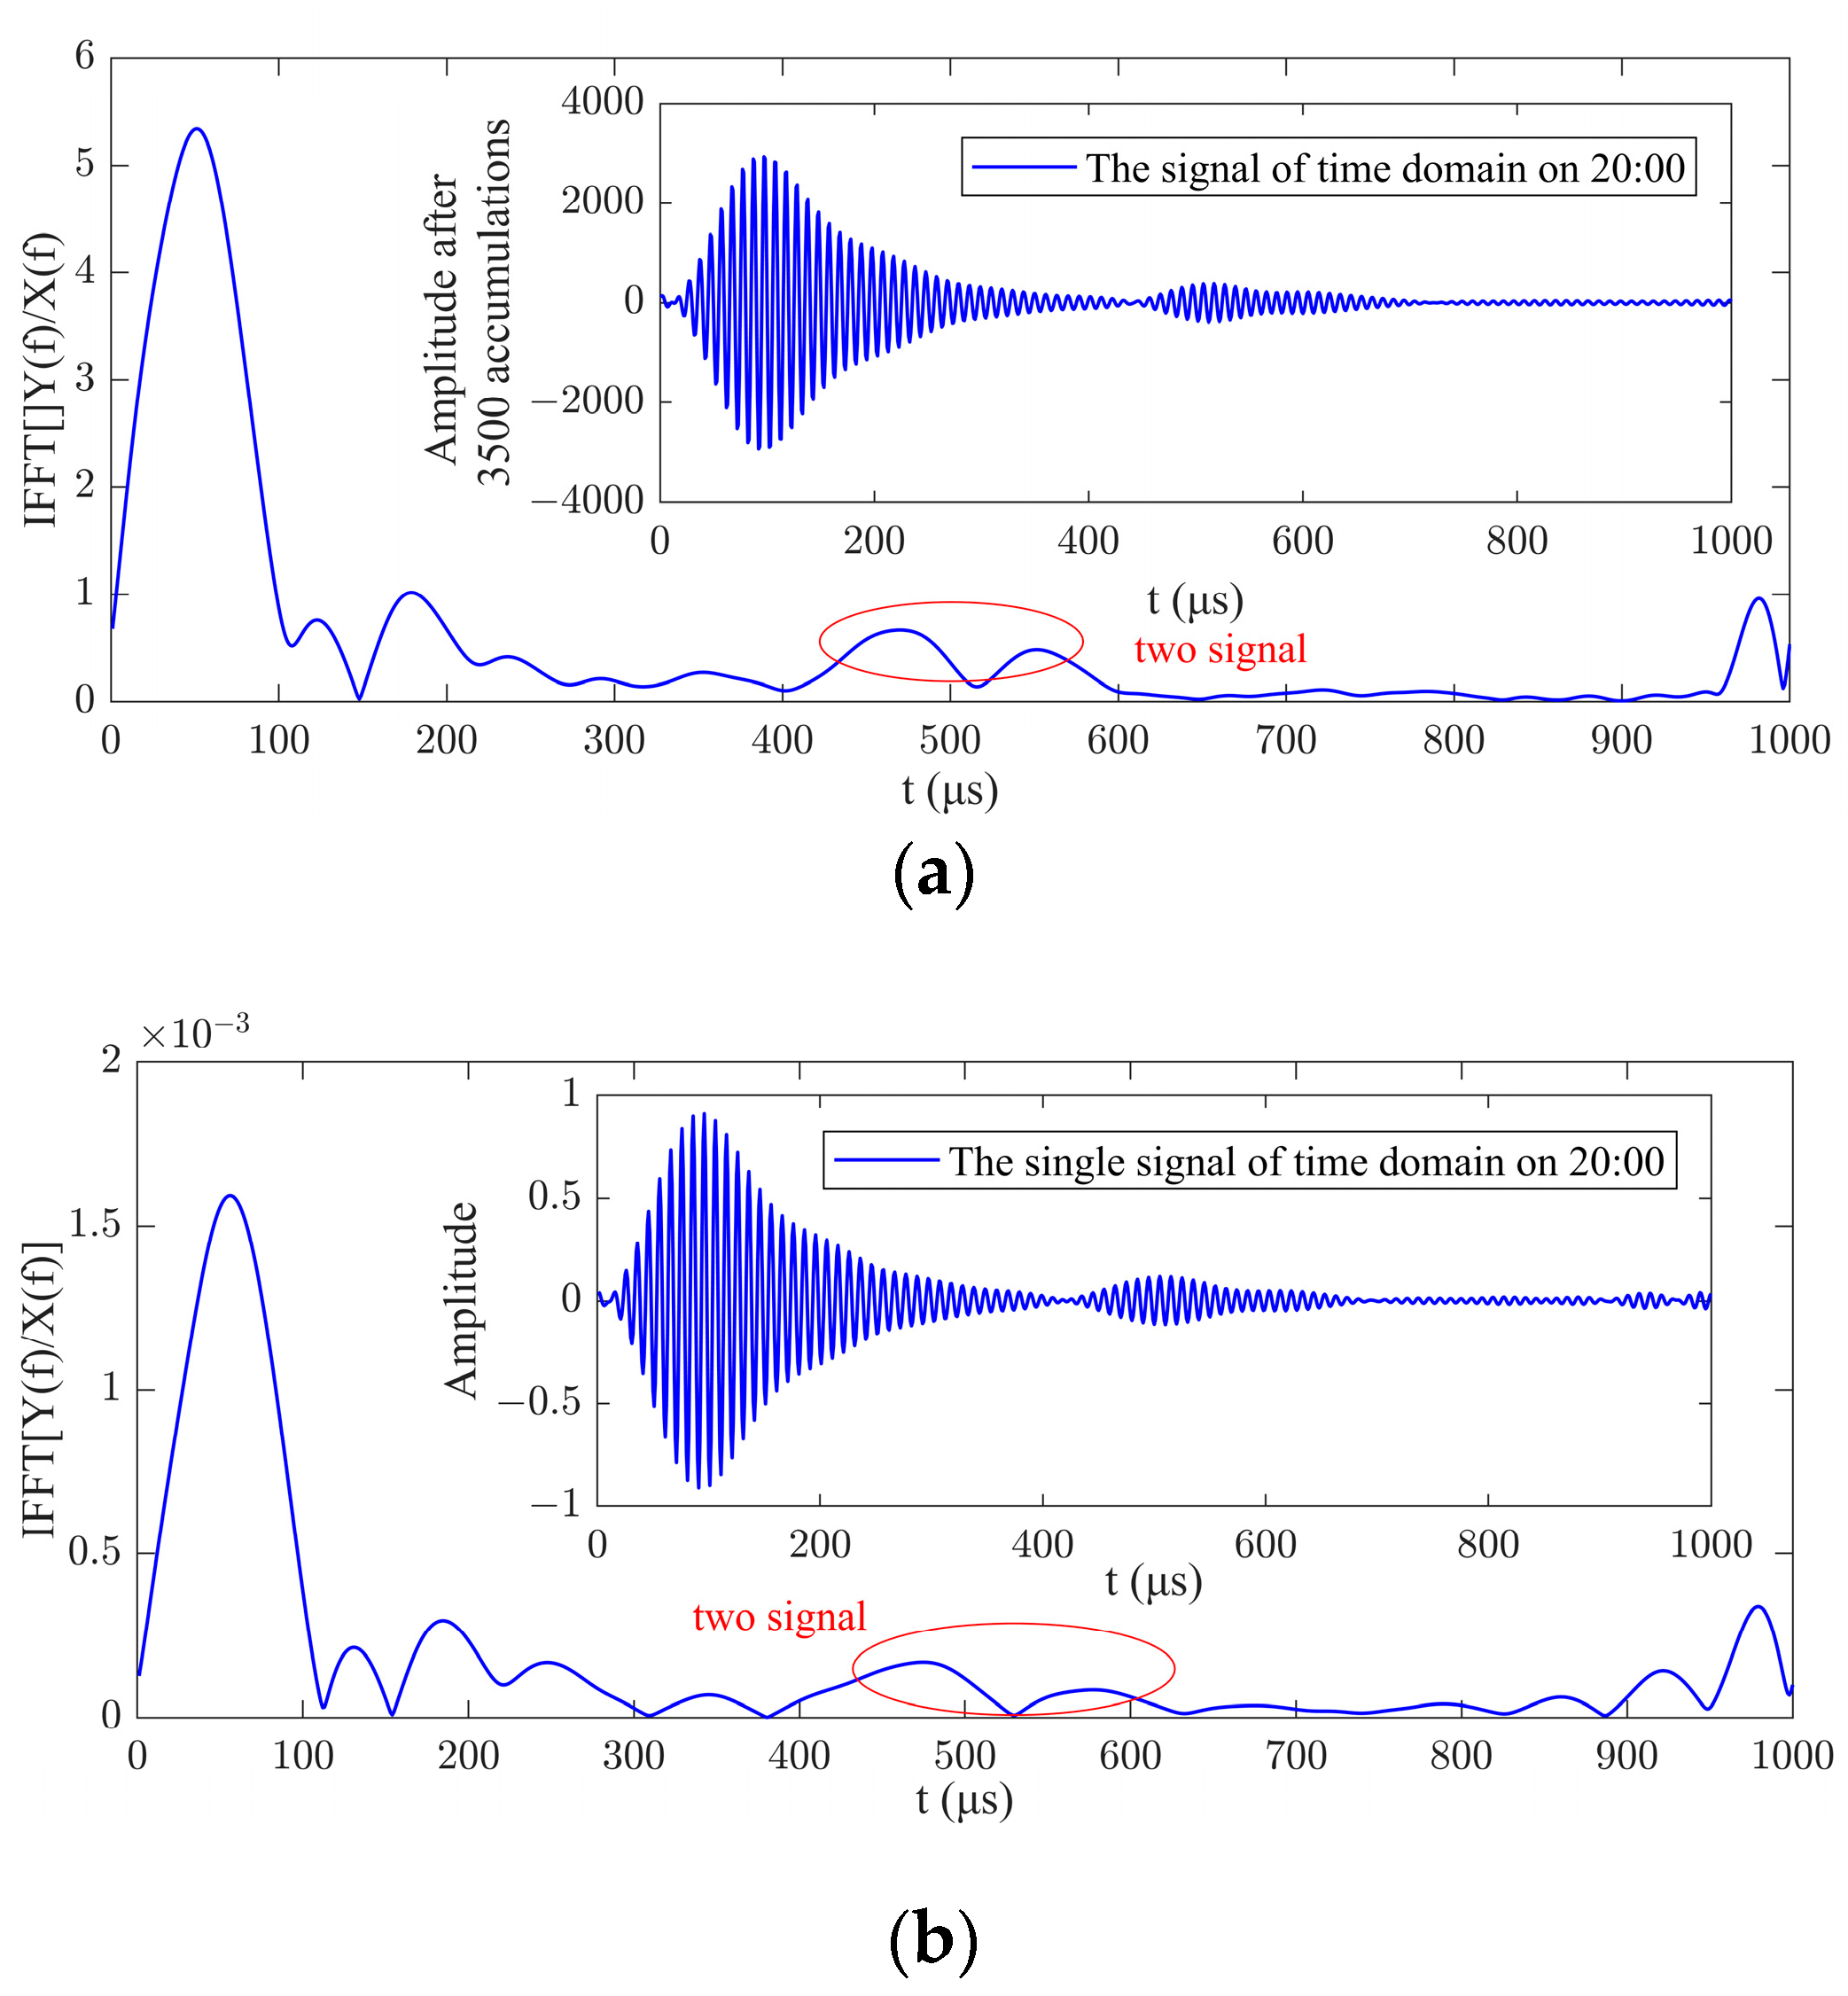
During the diurnal transition, two signals appear, as shown in Figure 5a. This phenomenon could be attributed to either the multi-path signals of the sky wave caused by multiple reflections in the ionosphere or the unstable propagation time delay in the sky wave during this time period leading to multiple signals or signal waveform distortion after linear averaging. To verify the second possibility, the signals were processed using FFT/IFFT before linear averaging, as shown in Figure 5b, which still resulted in two signals. Therefore, the multiple signals here are likely caused by multiple reflections in the ionosphere. Additionally, comparing Figure 5a,b, it can be seen that signals without linear averaging may contain cross-interference from other stations. The reflection of multi-path signals from surrounding structures, etc., for the sky wave was not considered here, as such multi-path signals are not always present.

Figure 5.
The result of separation of signals from Pucheng station at 20:00: (a) the signal after linear average (b) the signal before linear average.
3.2. The Results for the North Sea Chain
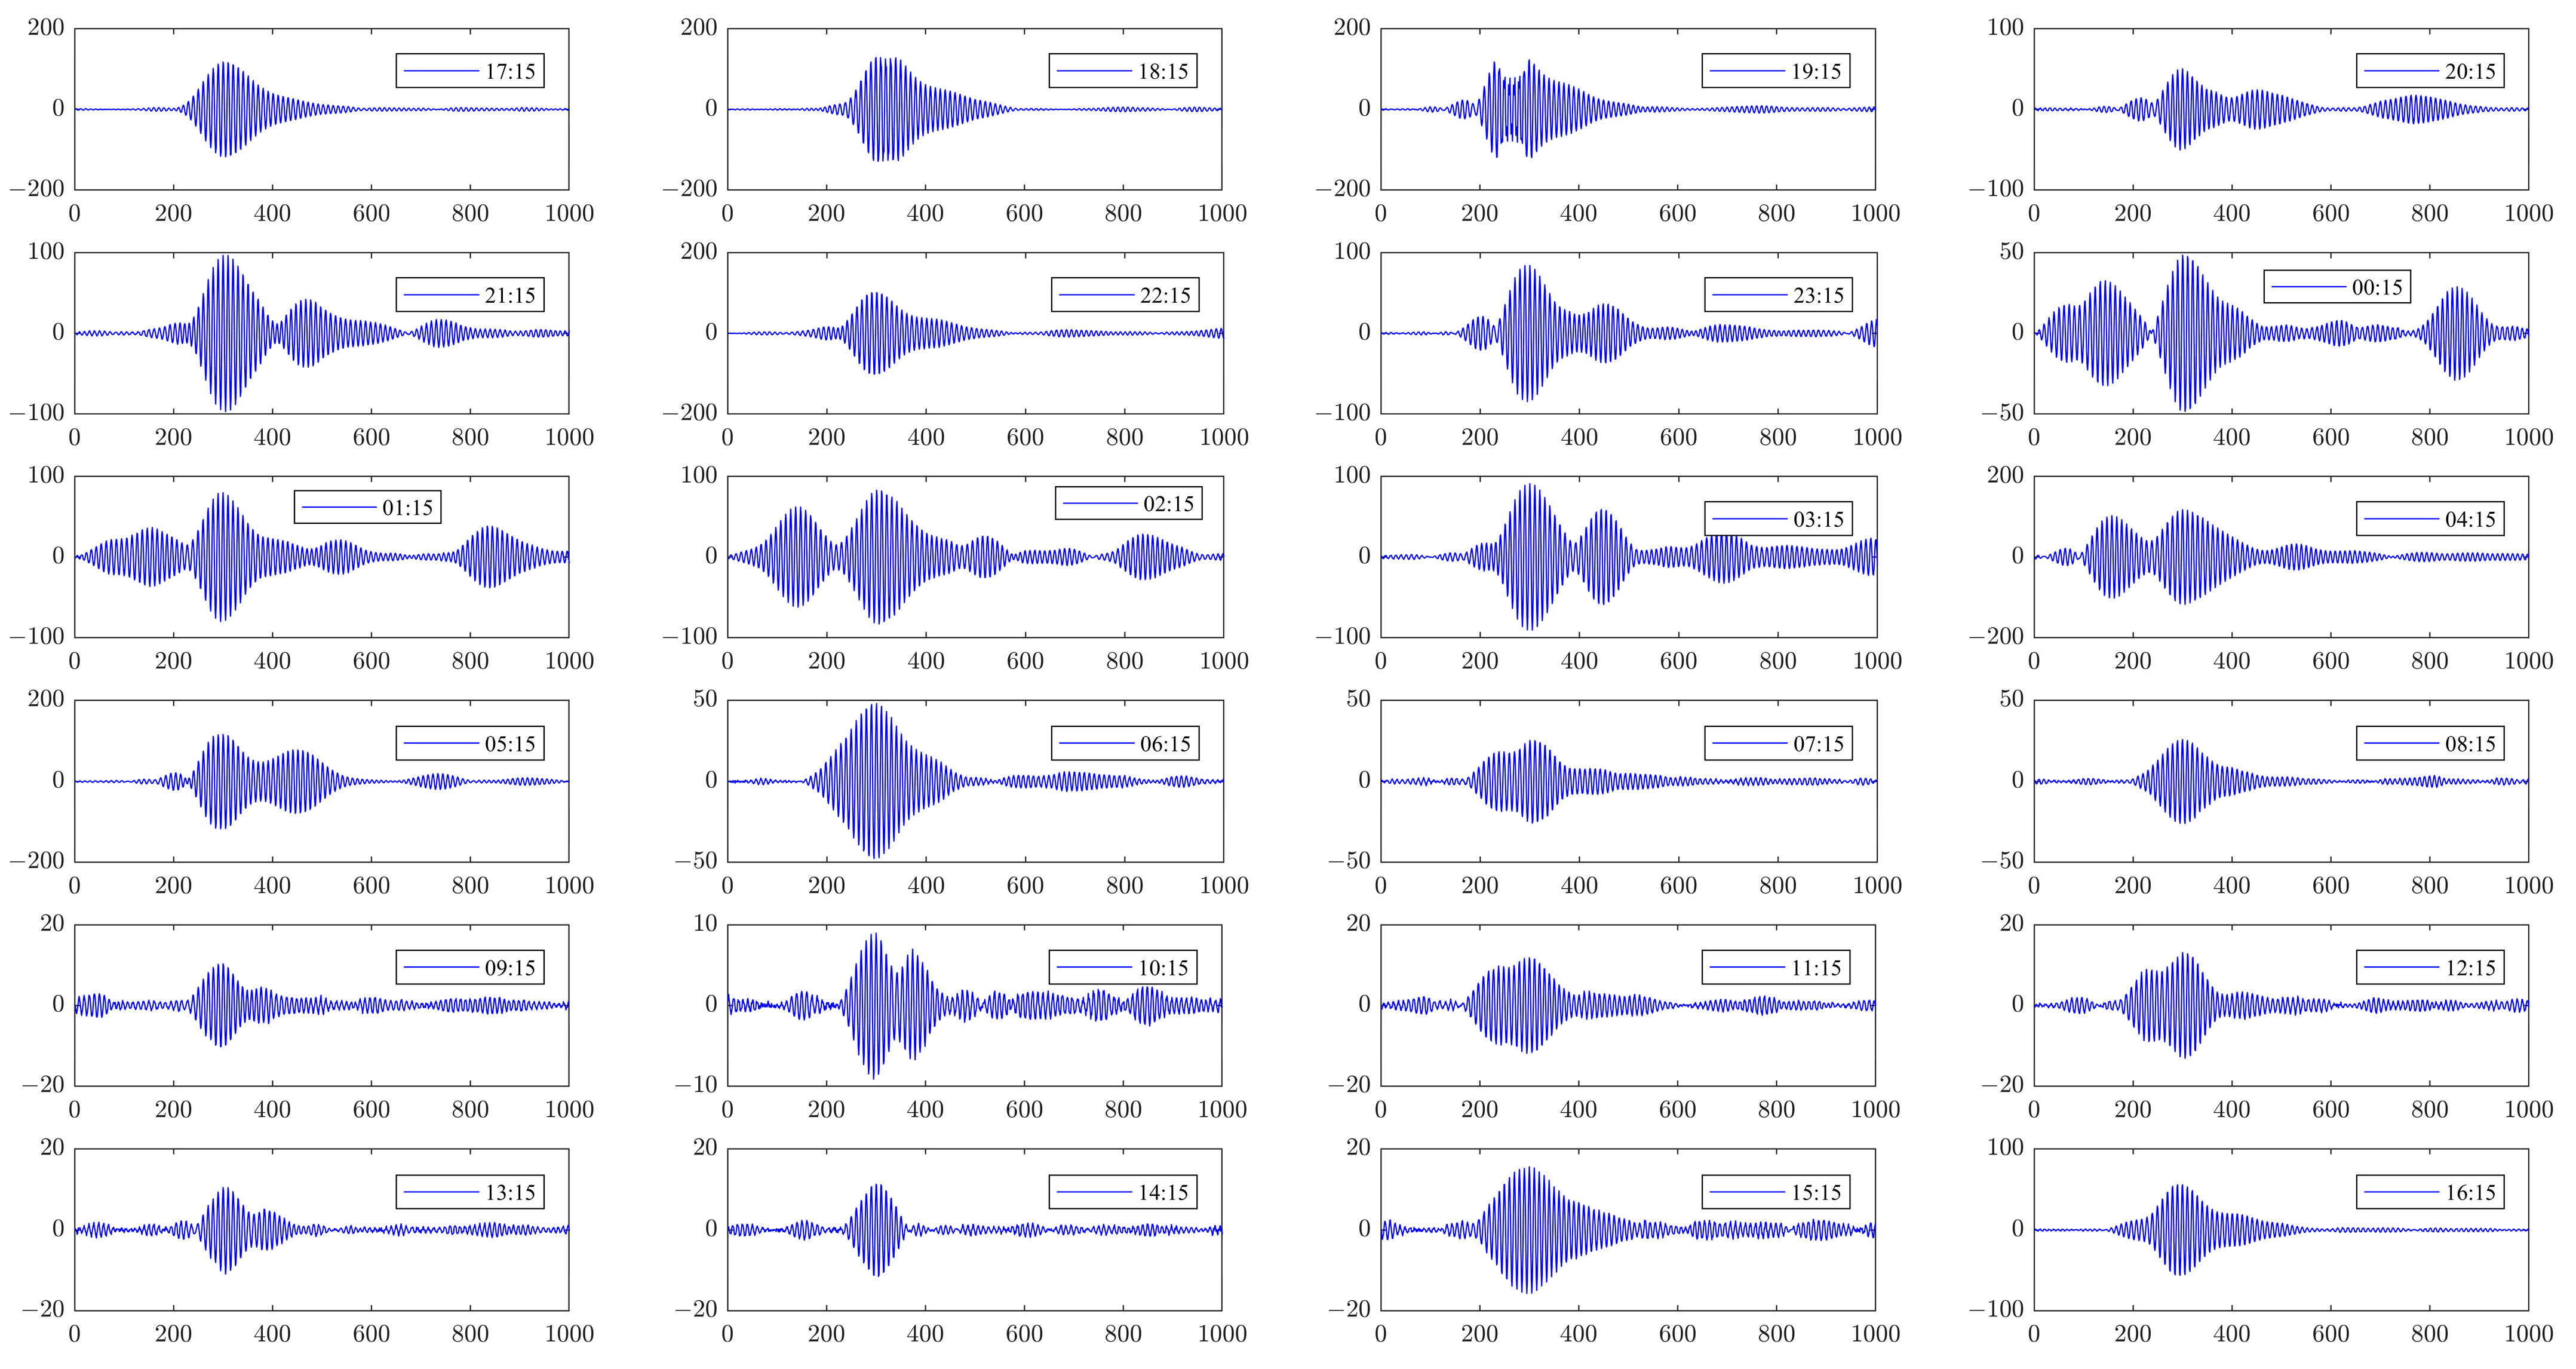
Three stations (Xuancheng, Rongcheng, and Helong) in the North sea chain were selected to analyze the received signals at different propagation distances. The signal waveform after linear averaging throughout the day is shown in Figure 6. From Figure 6, it can be observed that the signal during the day is significantly smaller than the signal during the night, and at certain moments, the signal is even submerged in noise, which is consistent with the characteristics of sky-wave propagation. The characteristics of the signal at each station throughout the day are analyzed below.
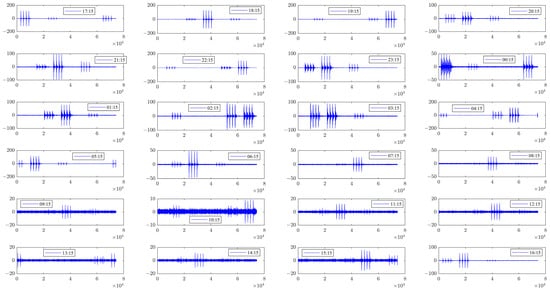
Figure 6.
The signal waveform after linear averaging of the North sea chain (7430) throughout the day.
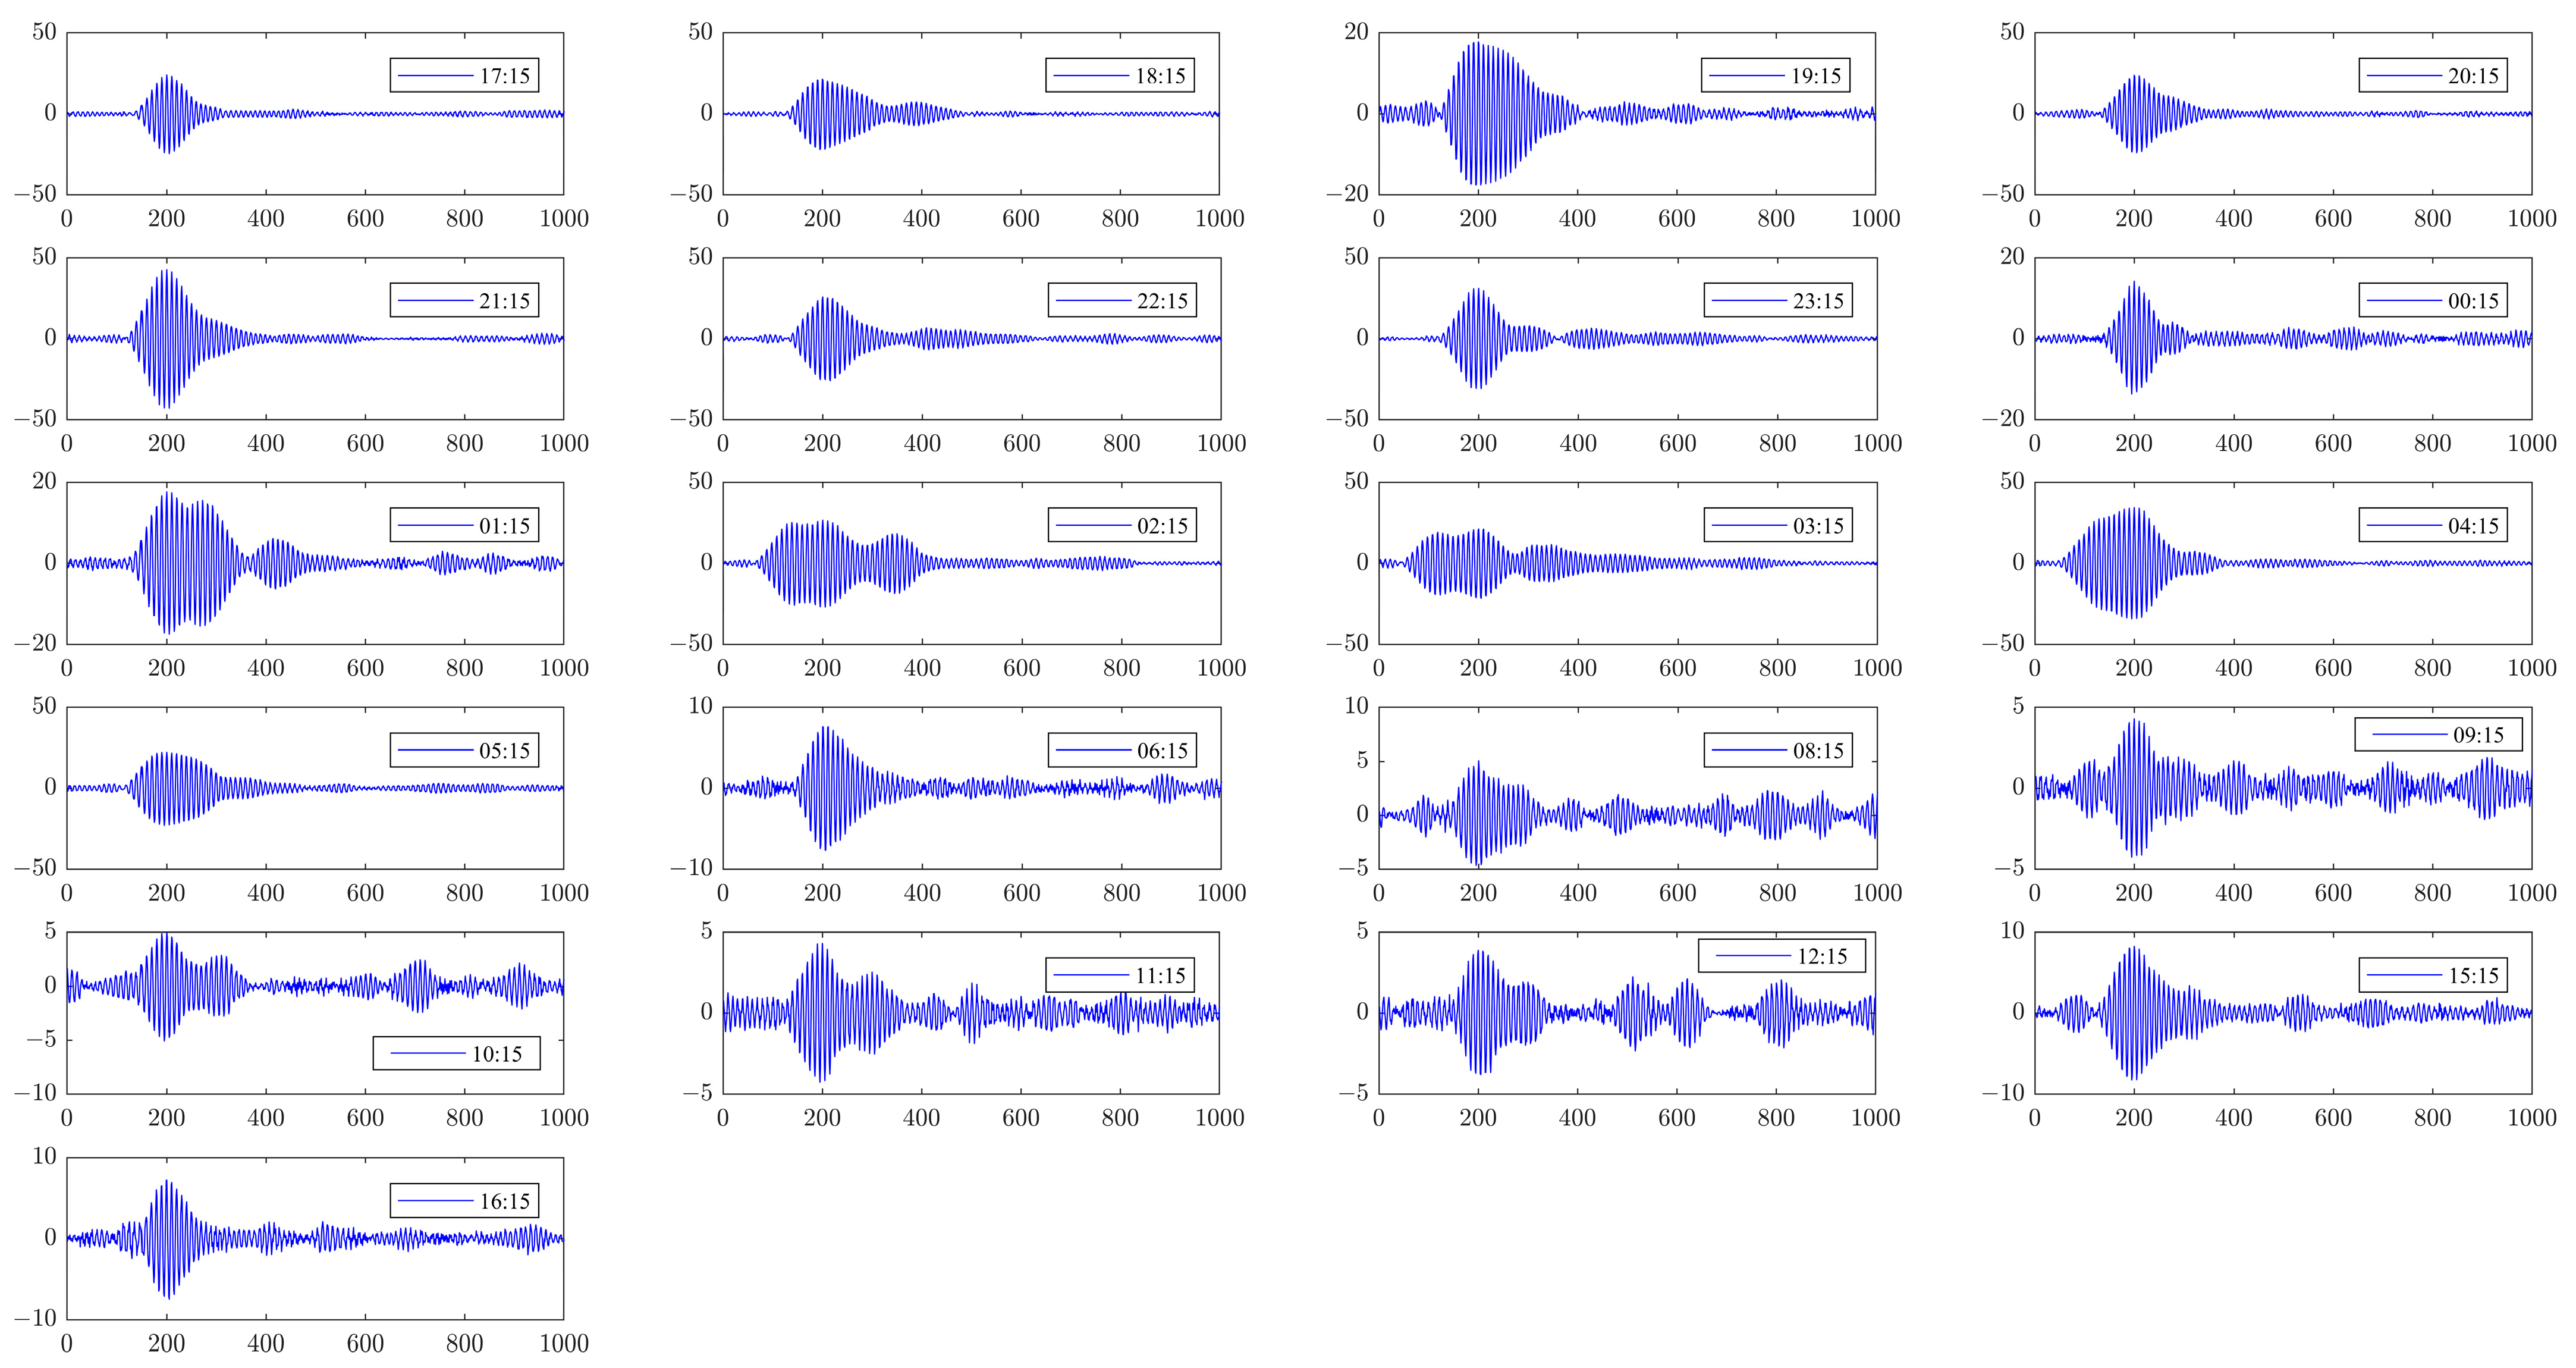
The first is Xuancheng station, which is closest to the receiving point among the three stations and is located within the land coverage of the ground-wave signal. However, the geographical characteristics of this path are complex, including mountains, plains, hills, and other terrain, and the attenuation of ground-wave signals is very serious. The signal waveform from Xuancheng station in one day is shown in Figure 7. From Figure 7, we can see that the maximum amplitude of the signal in a day is about 10 times the minimum amplitude value, and the maximum signal should be the sky-wave signal. During the day, the sky-wave signal becomes smaller. In the time period from 7:00 to 13:00, the ground-wave signal and the one-hop sky-wave signal can be obviously seen. The amplitude of the sky-wave signal has been slightly changed, and the ground-wave signal is relatively stable. At night, the sky-wave signal becomes larger, even multiple larger multi-path signals are generated, and the superposition of multiple signals can cause serious distortion of the signal waveform (19:15).
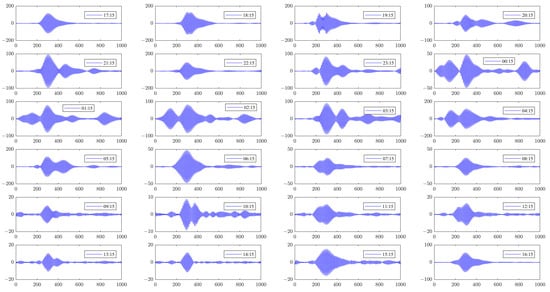
Figure 7.
The signal waveform after linear averaging of Xuancheng station throughout the day.
The second is Rongcheng station, which is far away, and its signal waveform is shown in Figure 8. Its signal is generally weaker than that of Xuancheng station but stronger than that of Helong station and even cannot be observed for a period of time (cannot receive ground-wave signals). But at night, when ionospheric reflection is strongest, its signal is even slightly stronger than that of Xuancheng station. This is related to various factors, such as the path length and ionospheric attenuation in the propagation path of the sky-wave signal.
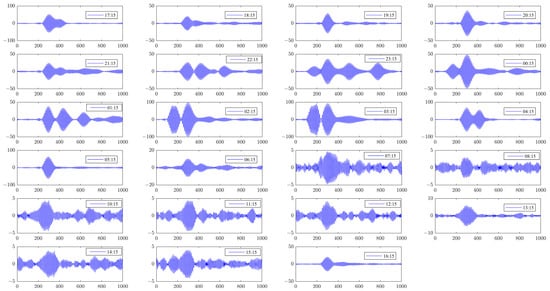
Figure 8.
The signal waveform after linear averaging of Rongcheng station throughout the day.
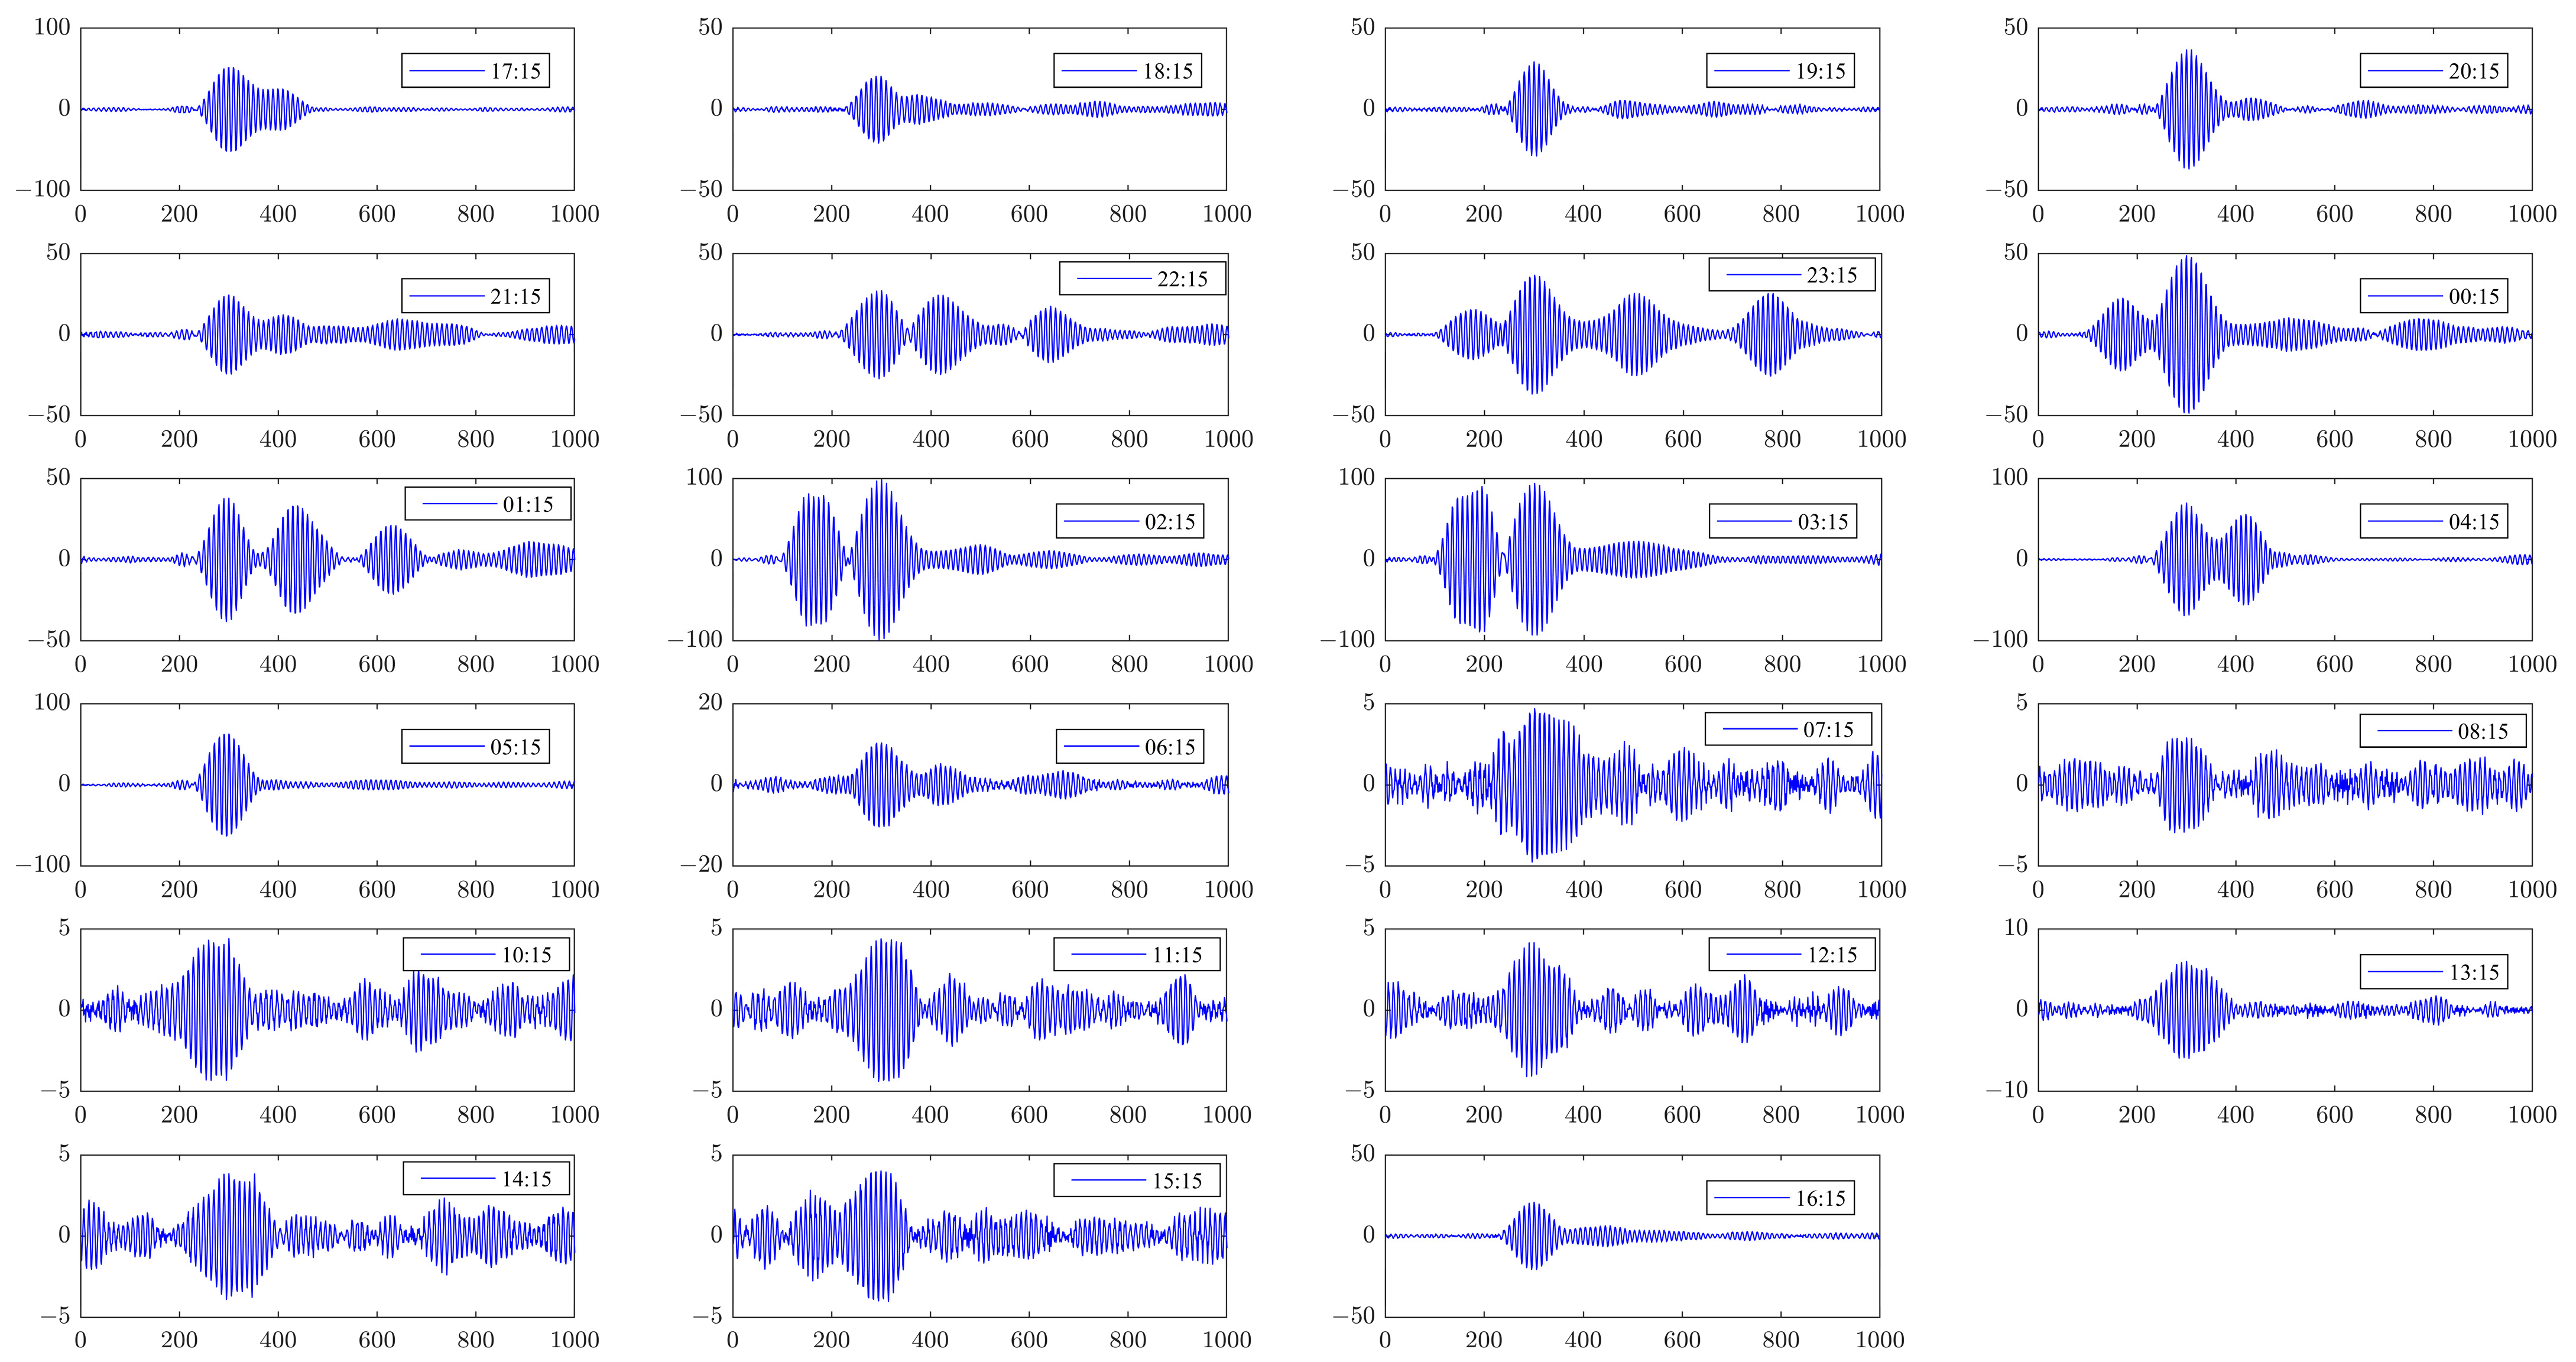
Last is Helong station, which represents the farthest distance. Ground waves are not applicable at all, and the received signal is a sky wave. The waveform of the signal received from Helong station in one day is shown in Figure 9. Consistent with the influence of the ionosphere on the radio waves, the signal is stronger at night than during the day, and at some times (7:00, 13:00, 14:00), the signal is not even observed. During a period of time at night (1:00–4:00), the multi-path signal of the sky wave is significantly enhanced.
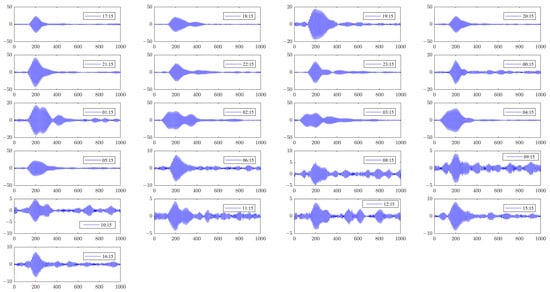
Figure 9.
The signal waveform after linear averaging of Helong station throughout the day.
3.3. Discussion
Based on the analysis of the ground-wave signal from Pucheng station, the time delay in the sky wave propagating through the ionosphere can be accurately obtained. This can be applied to studying the lower ionosphere [25]. The height of the ionospheric D layer ranges from 60 to 90 km, so it is not possible to study it using direct detection techniques such as satellite or balloon experiments. If we can obtain more accurate measurement results on the time delay in the LF wave propagation according to ionospheric reflection, we believe that this will provide a greater basis for studying and modeling the parameter inversion of the lower ionosphere.
From Figure 6, Figure 7, Figure 8 and Figure 9, we can see that the superposition of the ground wave and the sky wave and its multi-path signals can cause significant variations in the signal waveform. To use the sky wave for positioning, it is necessary to first separate the sky-wave signal and the ground-wave signal. Additionally, compared to daytime signals, during transition periods and at night, multiple signals with similar amplitudes but different time delays may be present, which can be attributed to multi-layer reflections in the ionosphere. It is necessary to determine which of these signals is the desired one-hop sky-wave signal.
In the Loran-C ground-wave receiver, a sliding correlation is usually performed between the reference signal and the received signal, with a corresponding capture threshold set to determine whether the Loran-C signal is captured. The effective operation of the ground-wave receiver is based on the ground wave being unaffected by the sky wave. In Figure 7, the signal from Xuancheng station shows the comparable amplitudes of the ground wave and the sky wave during the day, while the sky-wave signal is significantly enhanced during the night. Moreover, during the night, multiple multi-path signals can appear, and the ground-wave signal may be completely covered by the multi-path signals, or the waveform may be severely distorted. At this time, if the capture threshold is set too high, only the night sky-wave signal can be captured; if the threshold value is set near the boundary value of the ground wave, the signal captured during the day may be the ground wave, while during the night, it may be the sky wave. Therefore, it is also an important issue for the receiver to distinguish whether a received signal is a sky-wave signal or a ground-wave signal.
The signals from the Xuancheng and Rongcheng stations are shown at certain points in Figure 10. The superposition result for the signal is non-zero at even pulses. This could be due to a late-arriving multi-path signal or severe distortion of and random fluctuation in the signal at that moment. However, this phenomenon is not observed for Helong station, which represents the farthest distance. Therefore, it can be concluded that sky waves are more suitable for long-distance transmission. Although the signal strength is slightly weaker, the signal is more stable.

Figure 10.
The signal of South sea chain at 00:50 on 26 November 2023.
This study adopts the linear averaging method to observe weak signals from distant locations, which can be utilized for practical signal analysis or receivers capturing weak signals. However, it is important to note that this method has its limitations. On the one hand, it cannot provide information about the data channel using weak signals. This issue is not caused by the algorithm itself but rather by the inherent inability of the receivers to capture data channel information from weak signals. Moreover, for positioning using Loran-C signals, precise propagation time delays are sufficient. Regarding the timing, with the advancement of enhanced Loran-C, each station’s messages contain time information, using the nearest station to implement the timing. On the other hand, when the test location is very close to a station, the signal from that station may significantly overpower the signals from other stations, making direct linear averaging unable to avoid its interference. To address this issue, it is also mentioned in Section 2.4 of this paper that the large signal must be removed in order to obtain the other small signals. During receiver operation, if a sufficient amount of usable normal signals can be received, linear averaging may not be required. If necessary, signals with amplitudes much larger than those of other stations can be removed during the accumulation process based on the received signal amplitudes for each station.
4. Conclusions
This paper analyzes the characteristics of Loran-C reception signals throughout the day. At locations close to the receiving point, ground-wave signals are strong, and sky-wave signals can be accurately identified. The measured data can be applied to lower ionospheric studies. At this point, the influence of the sky waves on the ground waves is minimal, resulting in higher precision in ground-wave positioning. At more distant locations, the amplitude of the ground-wave signal and the sky-wave signal have comparable amplitudes during the day, while at night, the amplitude of the sky-wave signal is much larger than that of the ground-wave signal. This phenomenon may cause the third zero crossing of the receiver to have a relatively large variable, and the positioning accuracy is reduced. In propagation ranges far beyond the ground waves, sky-wave signals are relatively stable and suitable for sky-wave positioning. Achieving a higher sky-wave positioning accuracy requires real-time ionospheric forecasting systems to provide up-to-date information on ionospheric variations in positioning.
The study of the propagation characteristics of Loran-C sky waves is complementary to the study of the characteristics of the lower ionosphere. The improvement of the accuracy of either one will be of great help to the study of the other. Additionally, research on the lower ionosphere’s characteristics holds significant importance for the propagation of waves at frequencies below LF in the ground–ionosphere space. Building upon the theoretical research, we will conduct multi-region, multi-distance, long-term data collection and analysis. Continuous exploration and innovation in Loran-C technology is essential. We welcome further, deeper engagement from scholars to propose new measures, methods, data analysis results, and more.
Author Contributions
Conceptualization, X.X.; methodology, J.L. and J.Z.; investigation, Z.Z.; data curation, Z.Z. and J.S.; writing—original draft, Z.Z.; writing—review and editing, Y.Z.; supervision, J.Z.; project administration, X.X.; funding acquisition, X.X. All authors have read and agreed to the published version of the manuscript.
Funding
This work was supported in part by the National Natural Science Foundation of China under grant 61701398, grant 62101440, and grant 61771389.
Data Availability Statement
If the reader makes a reasonable request, the first author of this article may be contacted for the data presented in this article.
Conflicts of Interest
The authors declare no conflicts of interest.
References
- United States Coast Guard. Loran-C User Handbook; Department of Transportation, Coast Guard: Washington, DC, USA, 1992. [Google Scholar]
- Davies, K. Ionospheric Radio; Waves Series; IEEE: London, UK, 1990. [Google Scholar]
- Wang, J.C.H. An objective evaluation of available LF/MF sky-wave propagation models. Radio Sci. 1999, 34, 703–713. [Google Scholar] [CrossRef]
- Pan, W.Y. Long Wave Ultra Long Wave Extremely Long Wave Propagation; University of Electronic Science and Technology Press: Chengdu, China, 2004. (In Chinese) [Google Scholar]
- Berenger, J.P. Finite-Difference Computation of VLF-LF Propagation in the Earth-Ionosphere Waveguide. In Proceedings of the EUROEM Symposium, Bordeaux, France, 30 May–3 June 1994. [Google Scholar]
- Thèvenot, M.; Bérenger, J.-P.; Monedière, T.; Jecko, F. A FDTD scheme for the computation of VLF-LF propagation in the anisotropic earth-ionosphere waveguide. Ann. Telecommun. 1999, 54, 297–310. [Google Scholar] [CrossRef]
- Simpson, J.J.; Taflove, A. A Review of Progress in FDTD Maxwell’s Equations Modeling of Impulsive Subionospheric Propagation Below 300 kHz. IEEE Trans. Antennas Propag. 2007, 55, 1582–1590. [Google Scholar] [CrossRef]
- Bérenger, J.P. An implicit FDTD scheme for the propagation of VLF-LF radio waves in the Earth-ionosphere waveguide. Comptes Rendus Phys. 2014, 15, 393–402. [Google Scholar] [CrossRef]
- ITU-R. Prediction of Field Strength at Frequencies Below About 150 kHz; ITU-R: Geneva, Switzerland, 1990. [Google Scholar]
- Zhou, L.; Wang, Q.; Mu, Z.; Yan, J.; Zhu, J.; He, L. Decomposition of LF resultant waves with multi-propagation modes in the earth-ionosphere waveguide. IEEE Trans. Antennas Propag. 2020, 69, 3443–3450. [Google Scholar] [CrossRef]
- Zhou, L.; Jiang, Y.; Mu, Z.; Wang, Q.; Hu, X.; He, L. Study of Loran-C One-Hop Sky-Wave Fields at Different Altitudes Above the Ground. IEEE Antennas Wirel. Propag. Lett. 2021, 20, 2368–2371. [Google Scholar] [CrossRef]
- Zhao, Z.; Liu, J.; Pu, Y.; Zhang, J.; Xi, X. Analysis of low-frequency sky wave signal characteristics based on IRI ionospheric model. Chin. J. Radio Sci. 2022, 37, 898–904. (In Chinese) [Google Scholar]
- Zhao, Z.; Liu, J.; Zhang, J.; Pu, Y.; Xi, X. The Effect of Random Characteristics of Ionosphere on the Propagation of ELoran Sky Waves. IEEE Trans. Plasma Sci. 2023, 51, 2044–2054. [Google Scholar] [CrossRef]
- Yi, B.; Last, J.D. Novel techniques for loran-C skywave estimation. Navigation 1994, 41, 113–125. [Google Scholar]
- Mohammed, A.; Last, D. IFFT technique for skywave detection in Loran-C receivers. Electron. Lett. 2001, 37, 398–400. [Google Scholar] [CrossRef]
- Mohammed, A.; Last, D. Loran-C skywave delay detection using ARMA algorithm. Electron. Lett. 1998, 34, 1654–1655. [Google Scholar] [CrossRef]
- Yi, B.; Last, D. Eigen-decomposition techniques for Loran-C skywave estimation. IEEE Trans. Aerosp. Electron. Syst. 1997, 33, 117–125. [Google Scholar]
- Mohammed, A. Estimation of loran-C ionospheric signal parameters via ESPRIT algorithm. In Proceedings of the Second European Conference on Antennas and Propagation, EuCAP 2007, Edinburgh, UK, 11–16 November 2007; pp. 1–5. [Google Scholar]
- Kai, Z.; Guobin, W.; Xiaoli, X. Loran-C skywave delay estimation using hybrid-WRELAX algorithm. Electron. Lett. 2017, 53, 1426–1427. [Google Scholar]
- Kai, Z.; Guobin, W.; Xiaoli, X. Skywave delay estimation in Enhanced Loran based on Extended Invariance Principle Weighted Fourier transform and Relaxation algorithm. IET Radar Sonar Navig. 2019, 13, 1344–1349. [Google Scholar]
- Zhao, Z.; Liu, J.; Zhang, J.; Xi, X. Sky–ground wave signal separation in enhanced Loran based on Levenberg–Marquart algorithm. IET Radar Sonar Navig. 2021, 16, 1–8. [Google Scholar] [CrossRef]
- Shapiro, L.D. Loran-C Sky-Wave Delay Measurements. IEEE Trans. Instrum. Meas. 1968, 17, 366–372. [Google Scholar] [CrossRef]
- Wang, J. Seasonal Variation of LF/MF Sky-Wave Field Strengths. IEEE Trans. Broadcast. 2008, 54, 437–440. [Google Scholar] [CrossRef]
- Huaiyun, P.; Yu, C.; Weiyan, P. Analysis of influence of solar eclipse on long-wave sky wave propagation and lower ionosphere. Chin. J. Radio Sci. 2011, 25, 239–243. [Google Scholar]
- Weiyan, P.; Guangquan, H. A Method for Obtaining Equivalant Height and the Reflection Coefficient of Lower Ionosphere by Measuring Loran-C Signal Waveforms. Chin. J. Radio Sci. 1986, 1, 28–40. [Google Scholar]

Disclaimer/Publisher’s Note: The statements, opinions and data contained in all publications are solely those of the individual author(s) and contributor(s) and not of MDPI and/or the editor(s). MDPI and/or the editor(s) disclaim responsibility for any injury to people or property resulting from any ideas, methods, instructions or products referred to in the content. |
© 2024 by the authors. Licensee MDPI, Basel, Switzerland. This article is an open access article distributed under the terms and conditions of the Creative Commons Attribution (CC BY) license (https://creativecommons.org/licenses/by/4.0/).