
Research on the Short-Term Economic Dispatch Method of Power System Involving a Hydropower-Photovoltaic-Pumped Storage Plant


Abstract
:1. Introduction
2. Short-Term Dispatch Model of the HPPCS for Participation in Auxiliary Services
2.1. Objective Function
- (1)
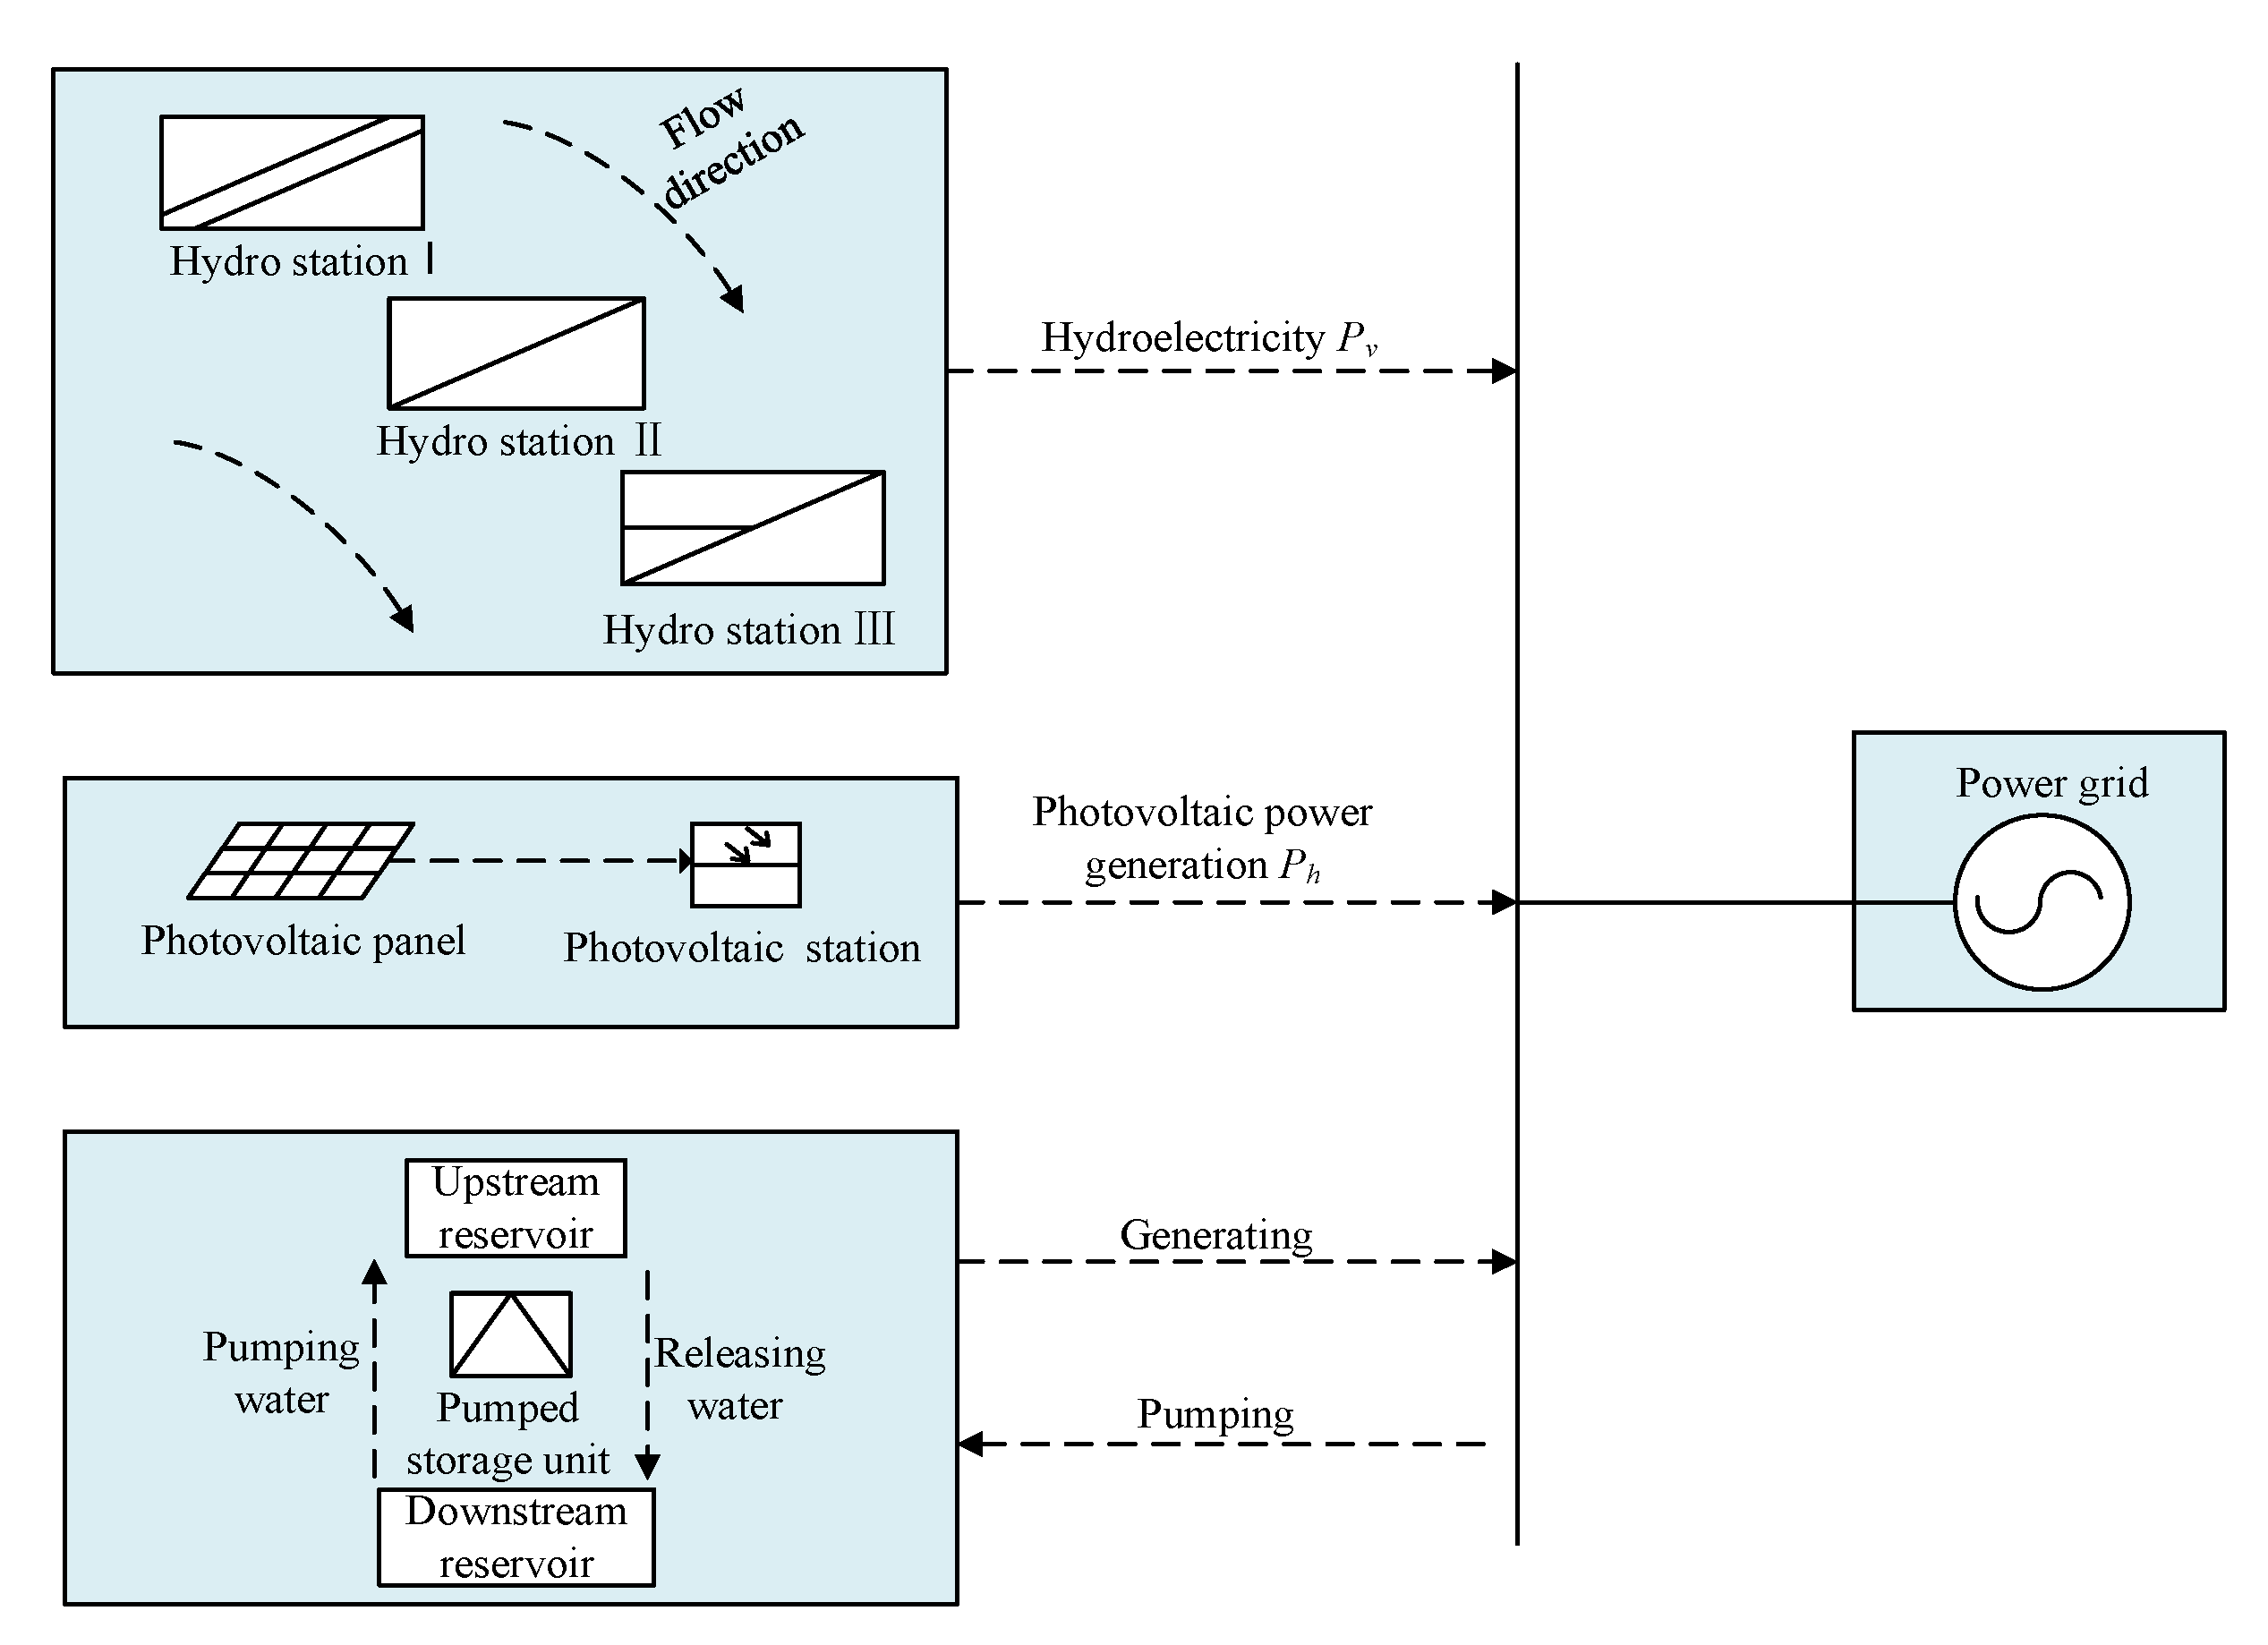
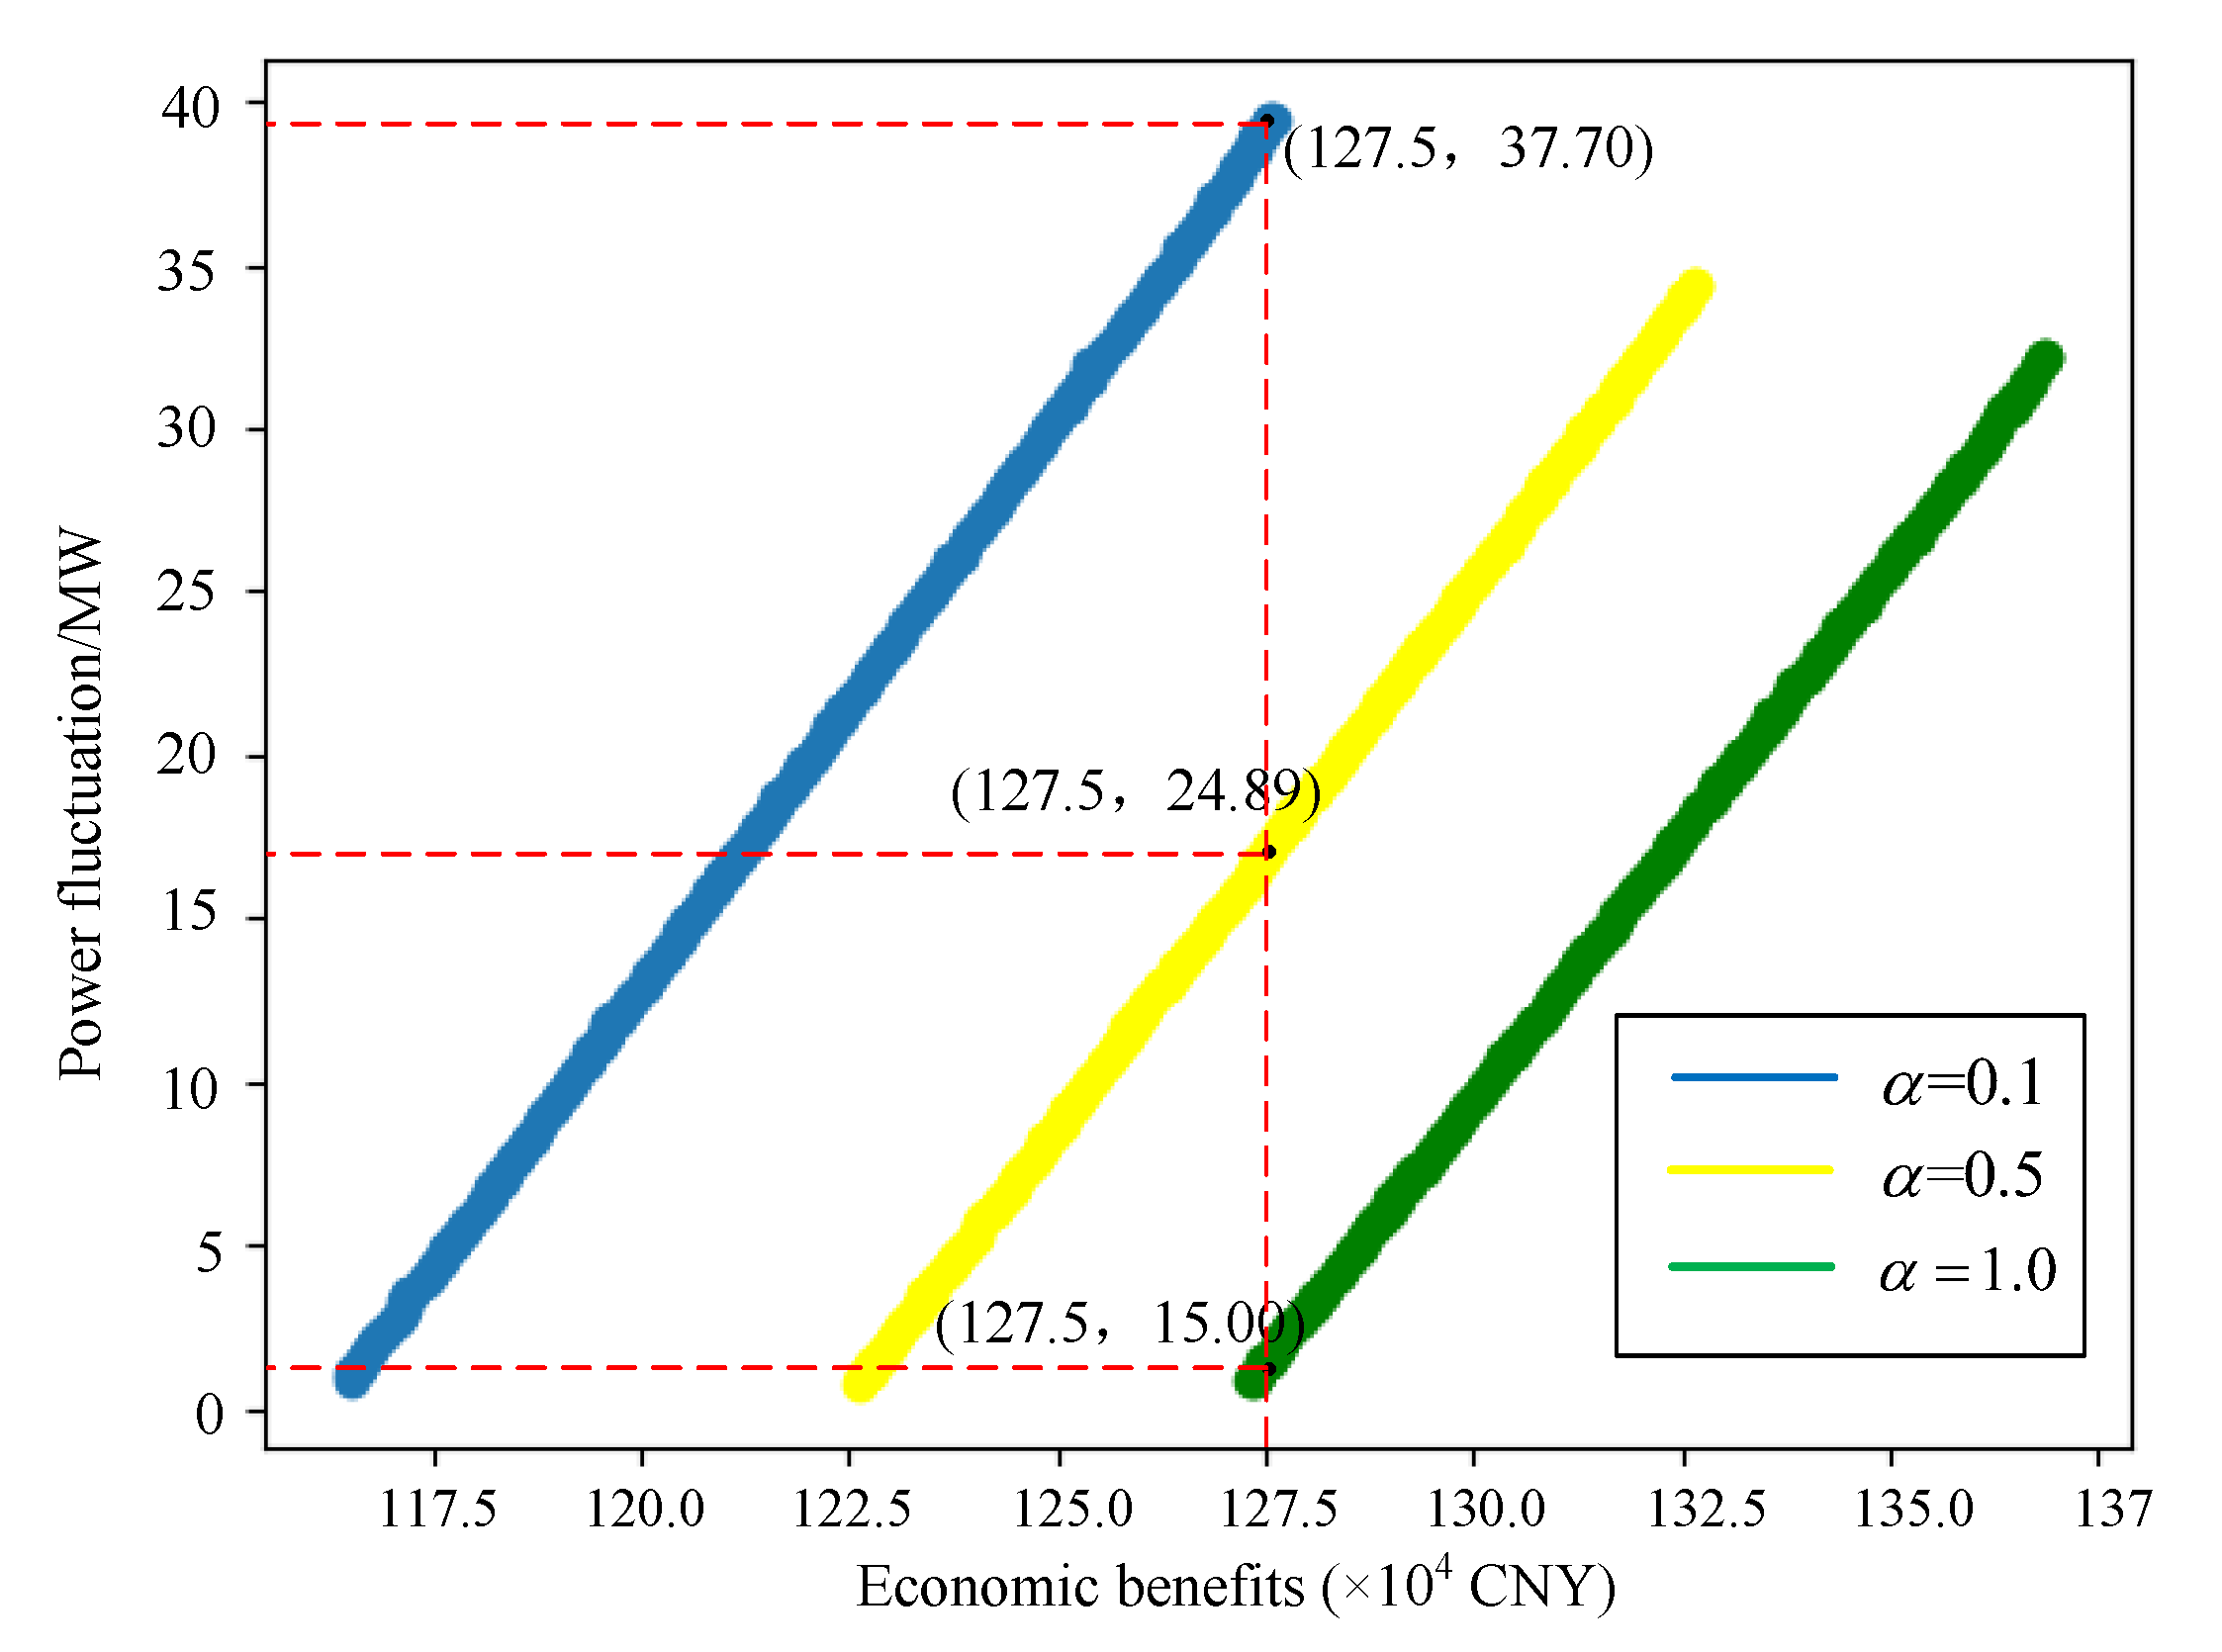
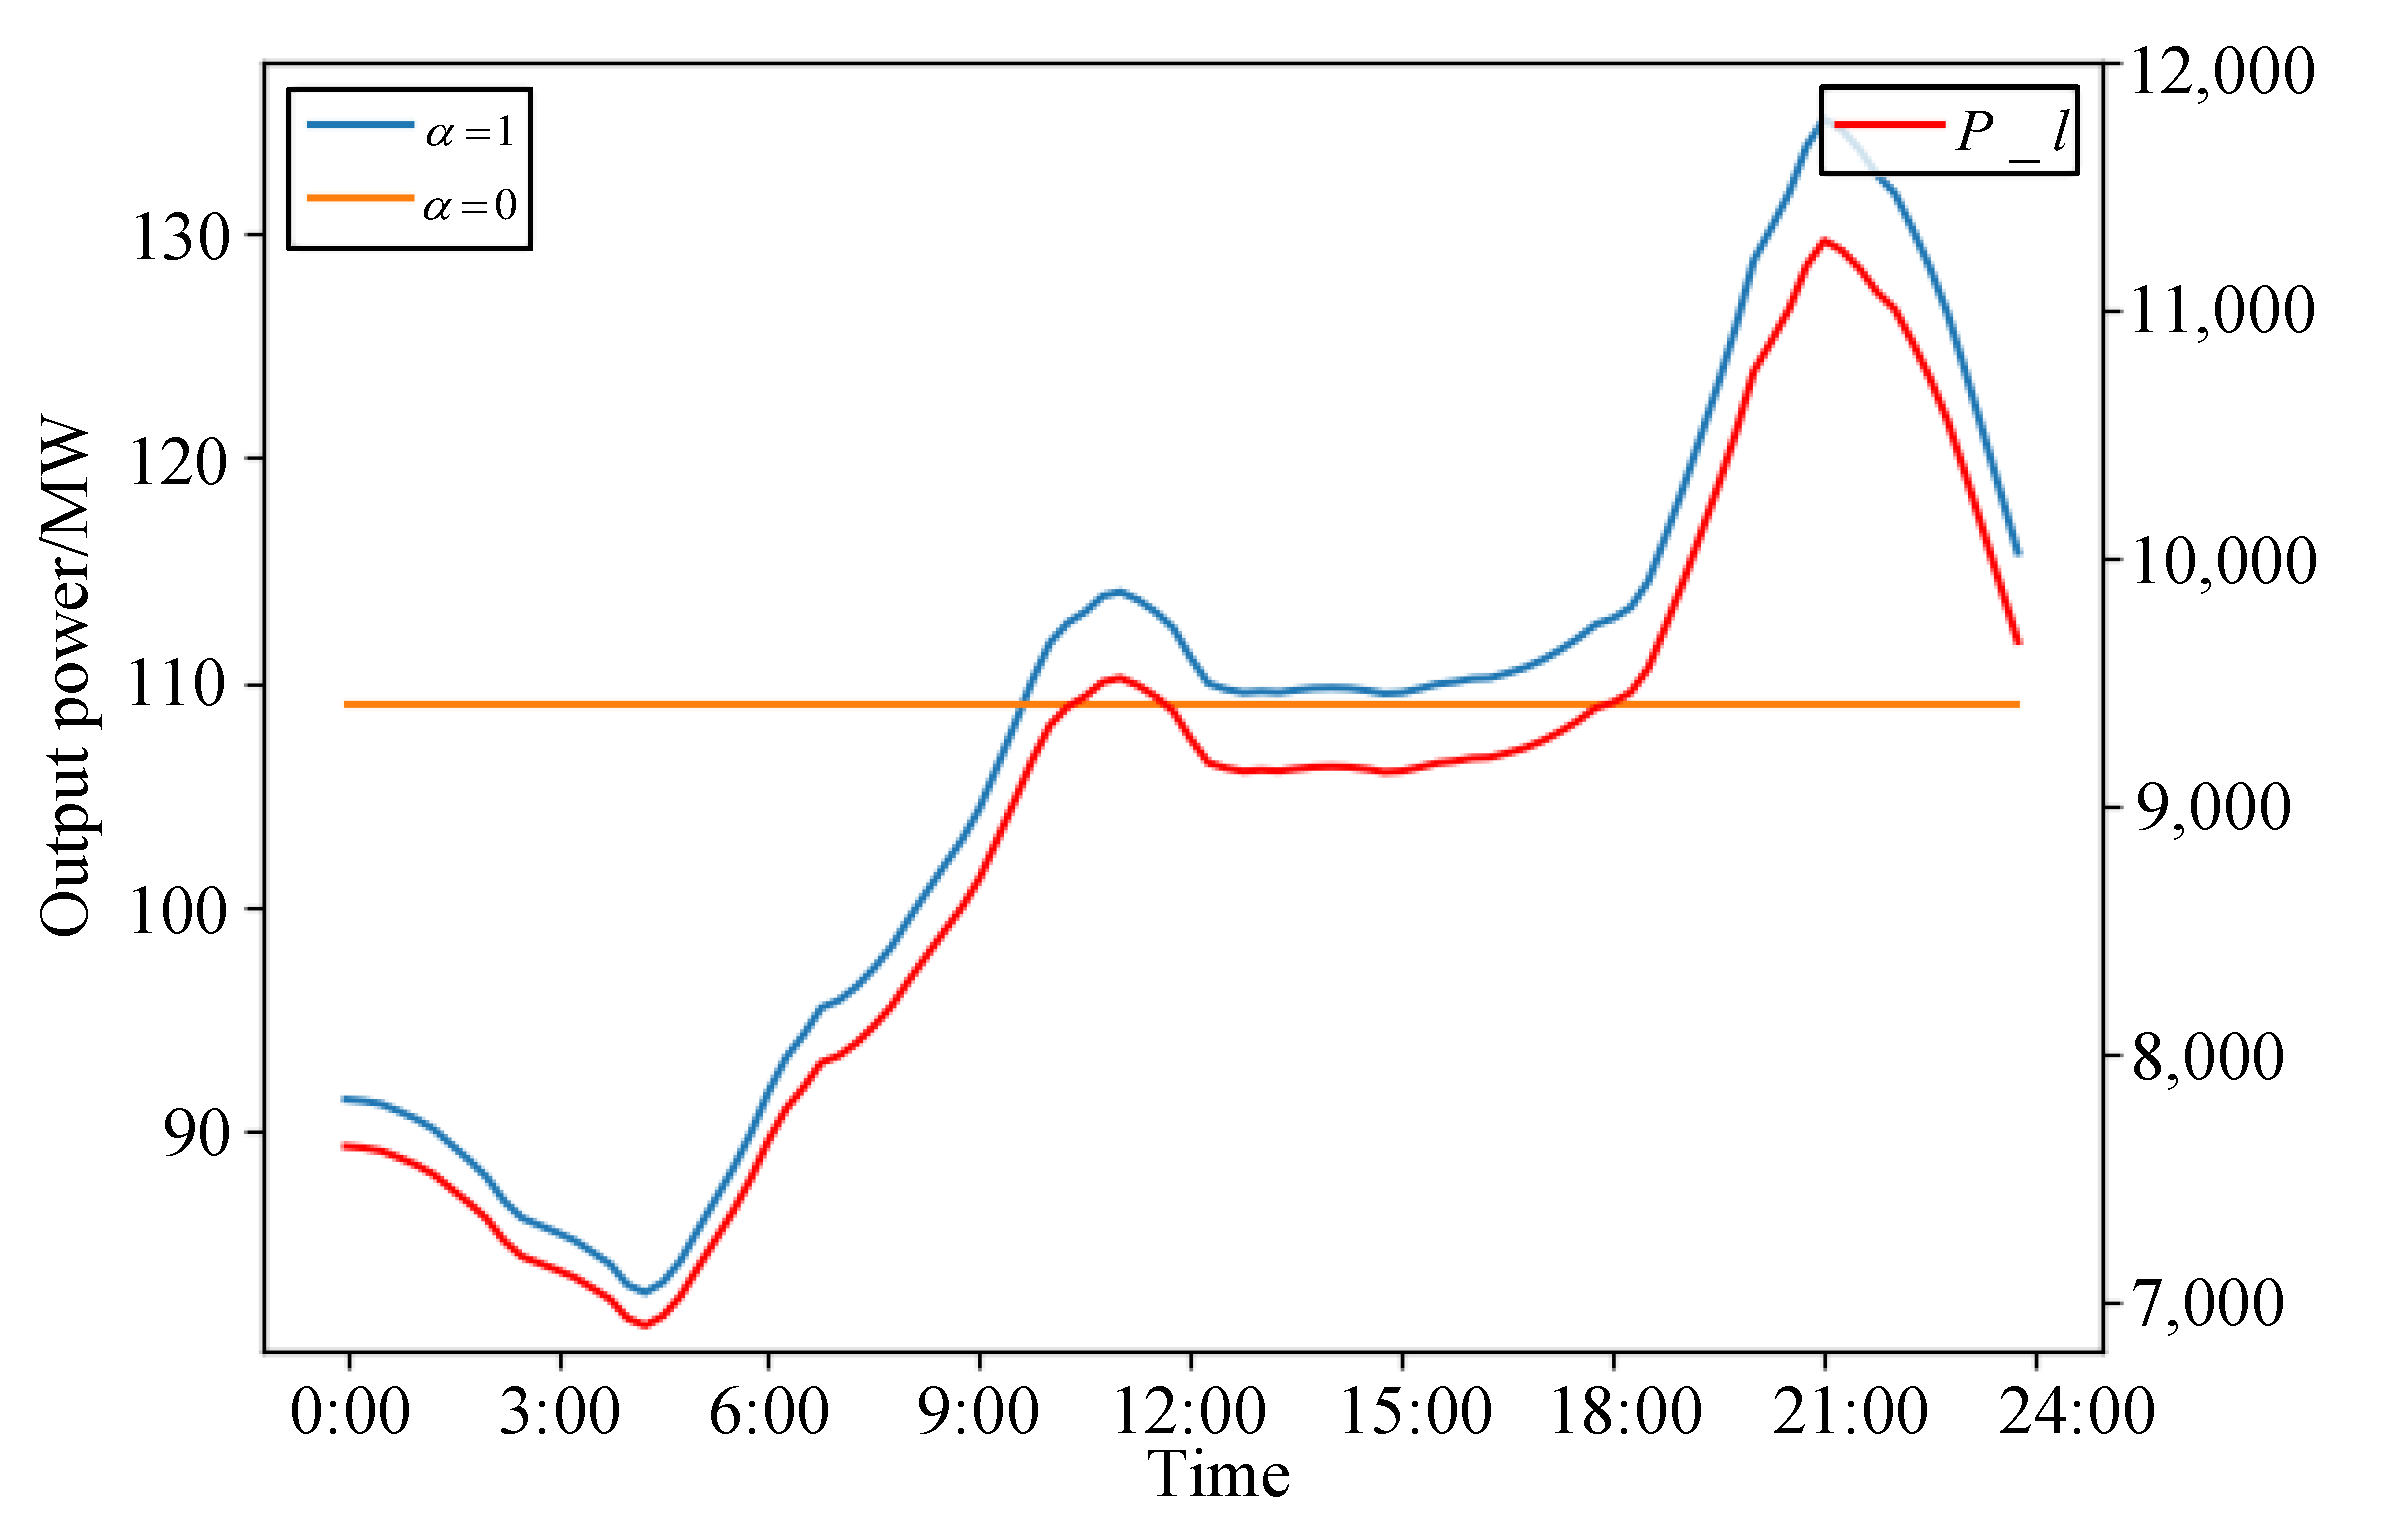
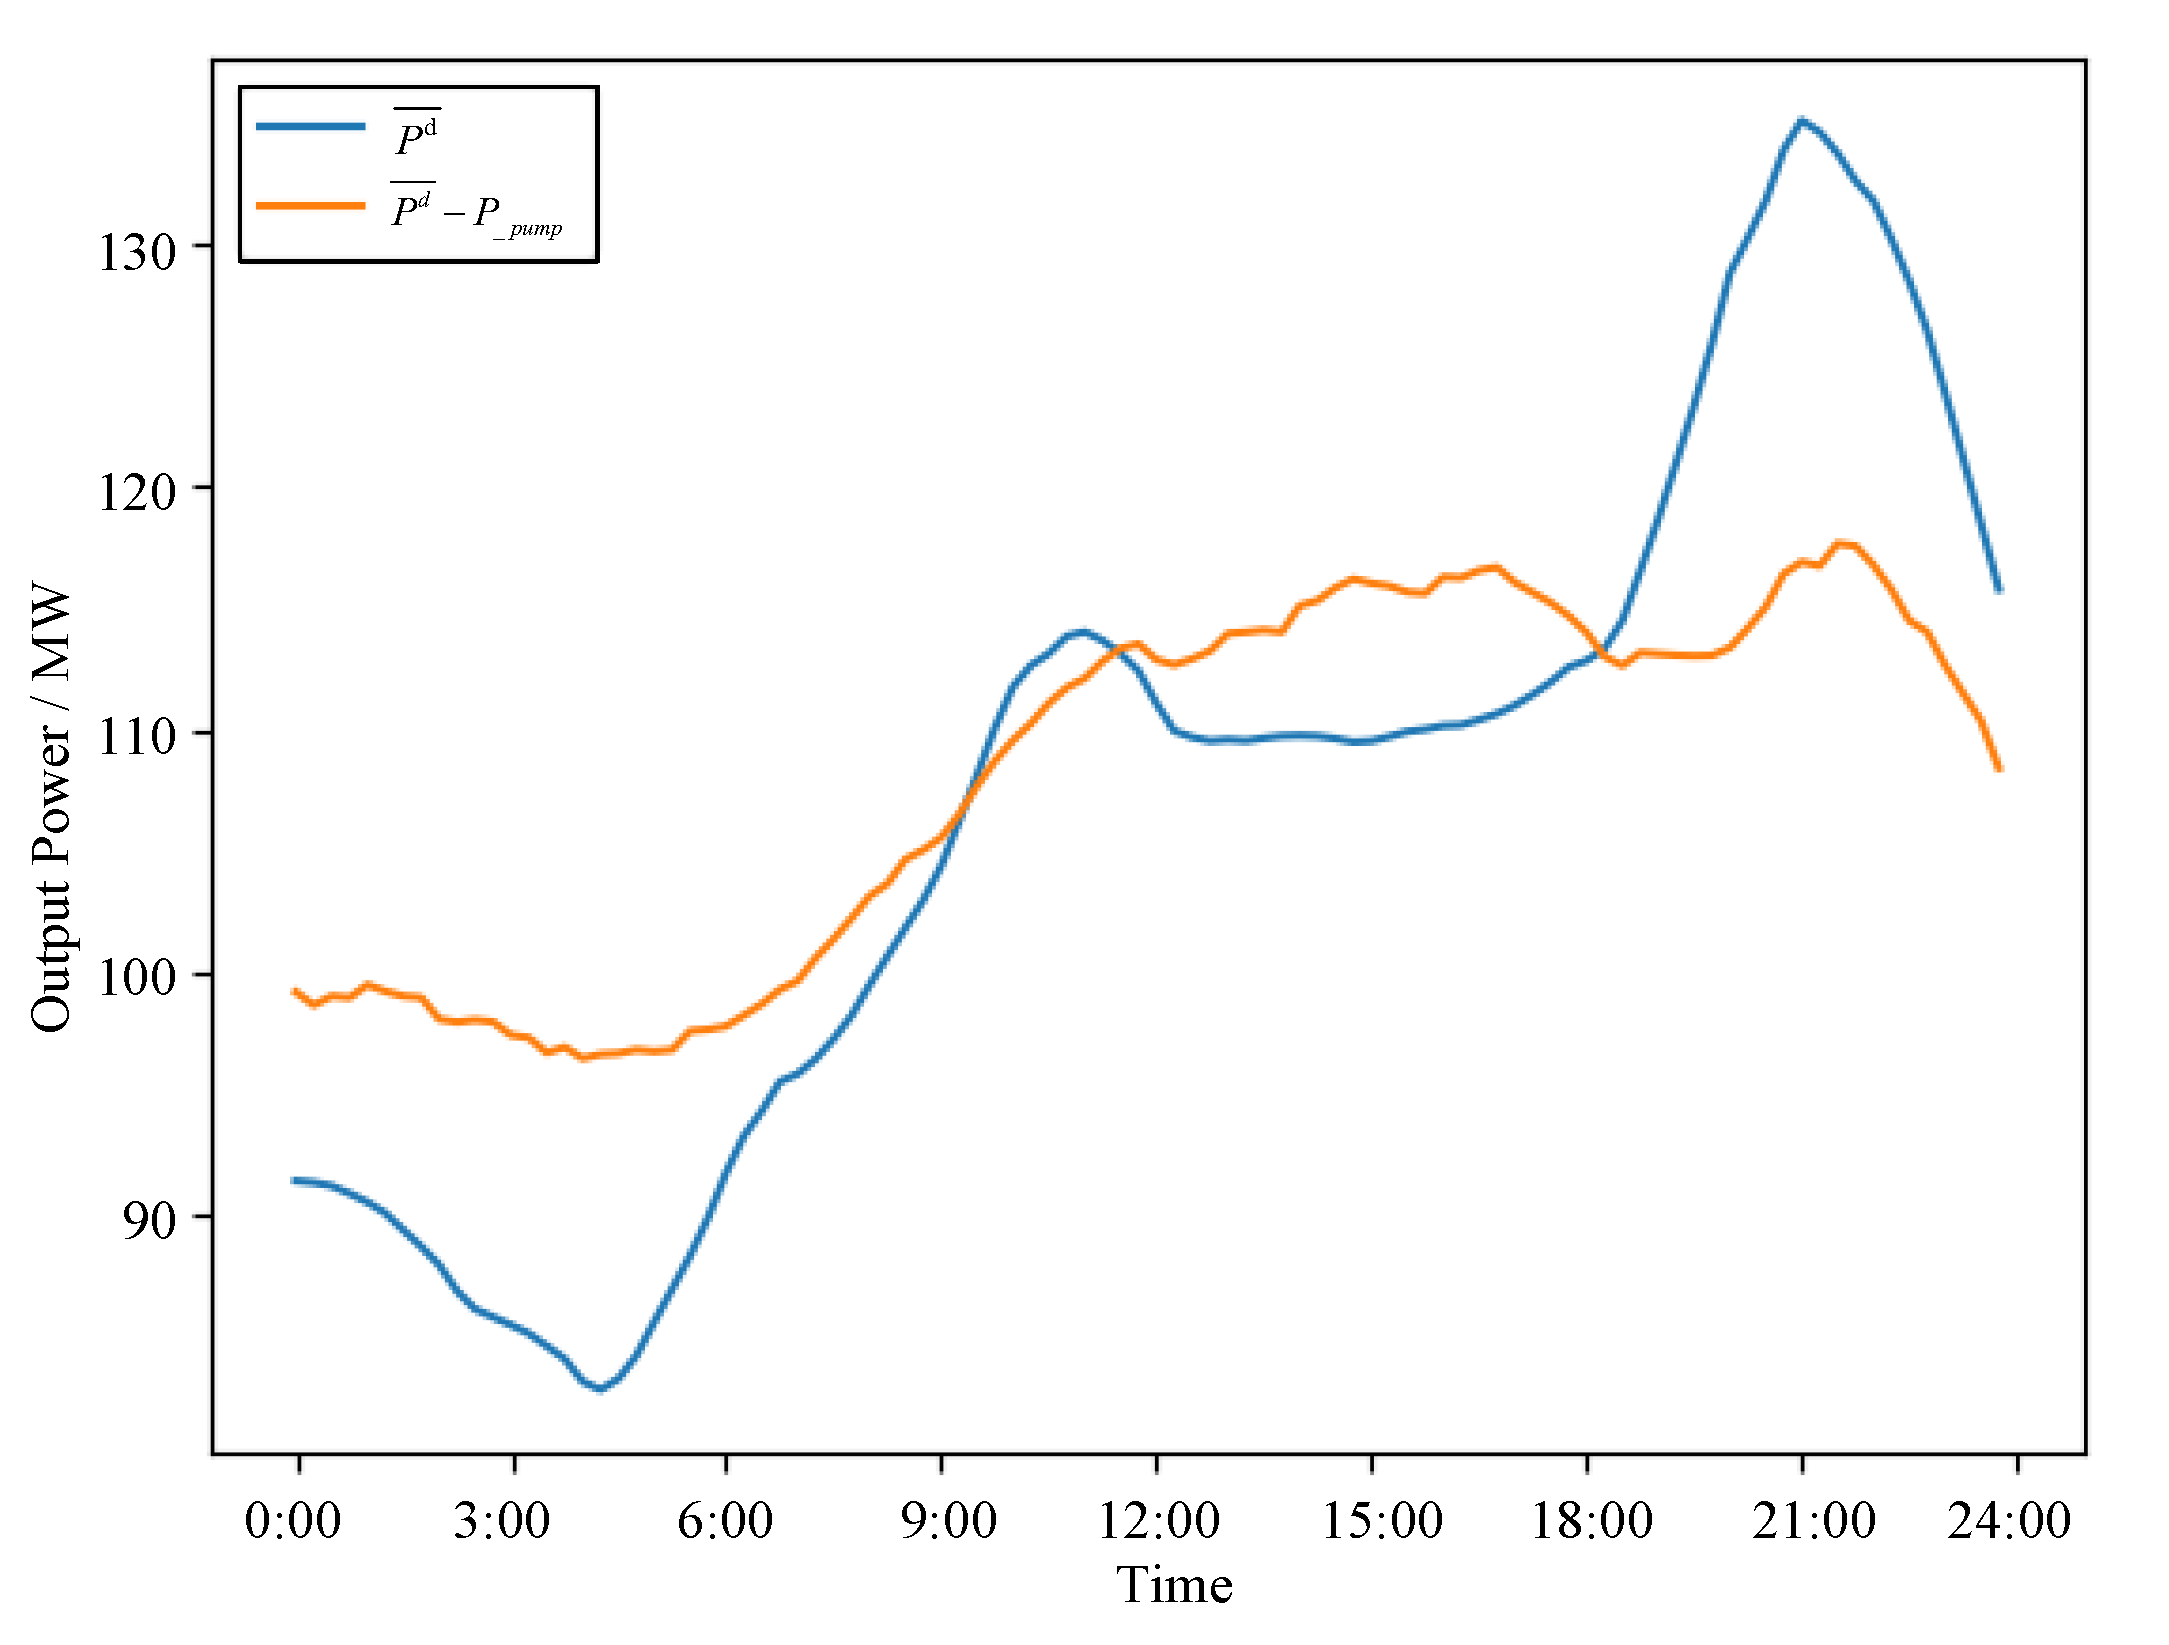
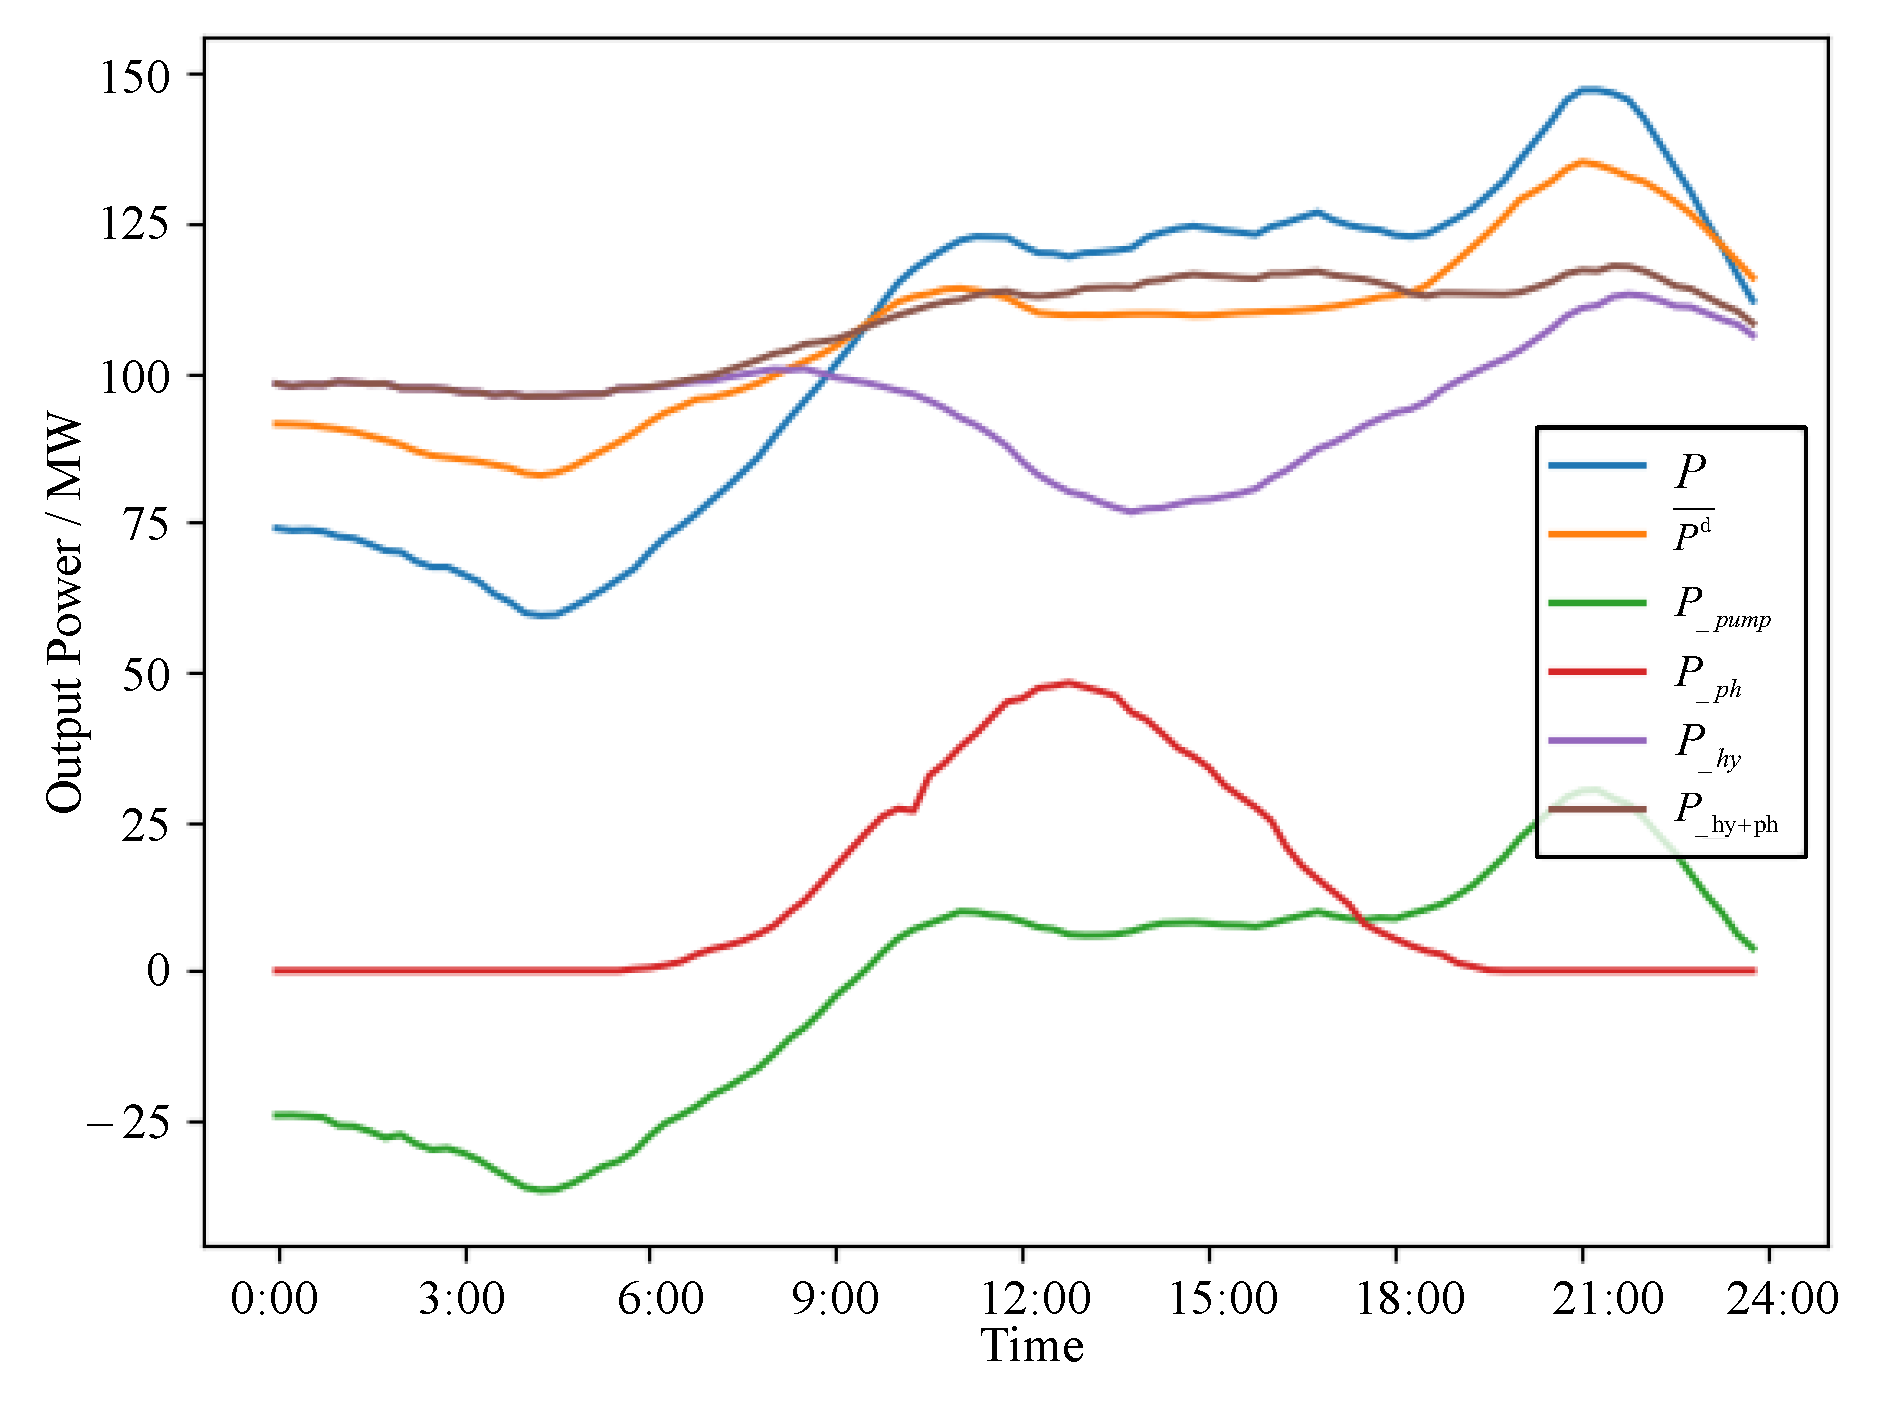
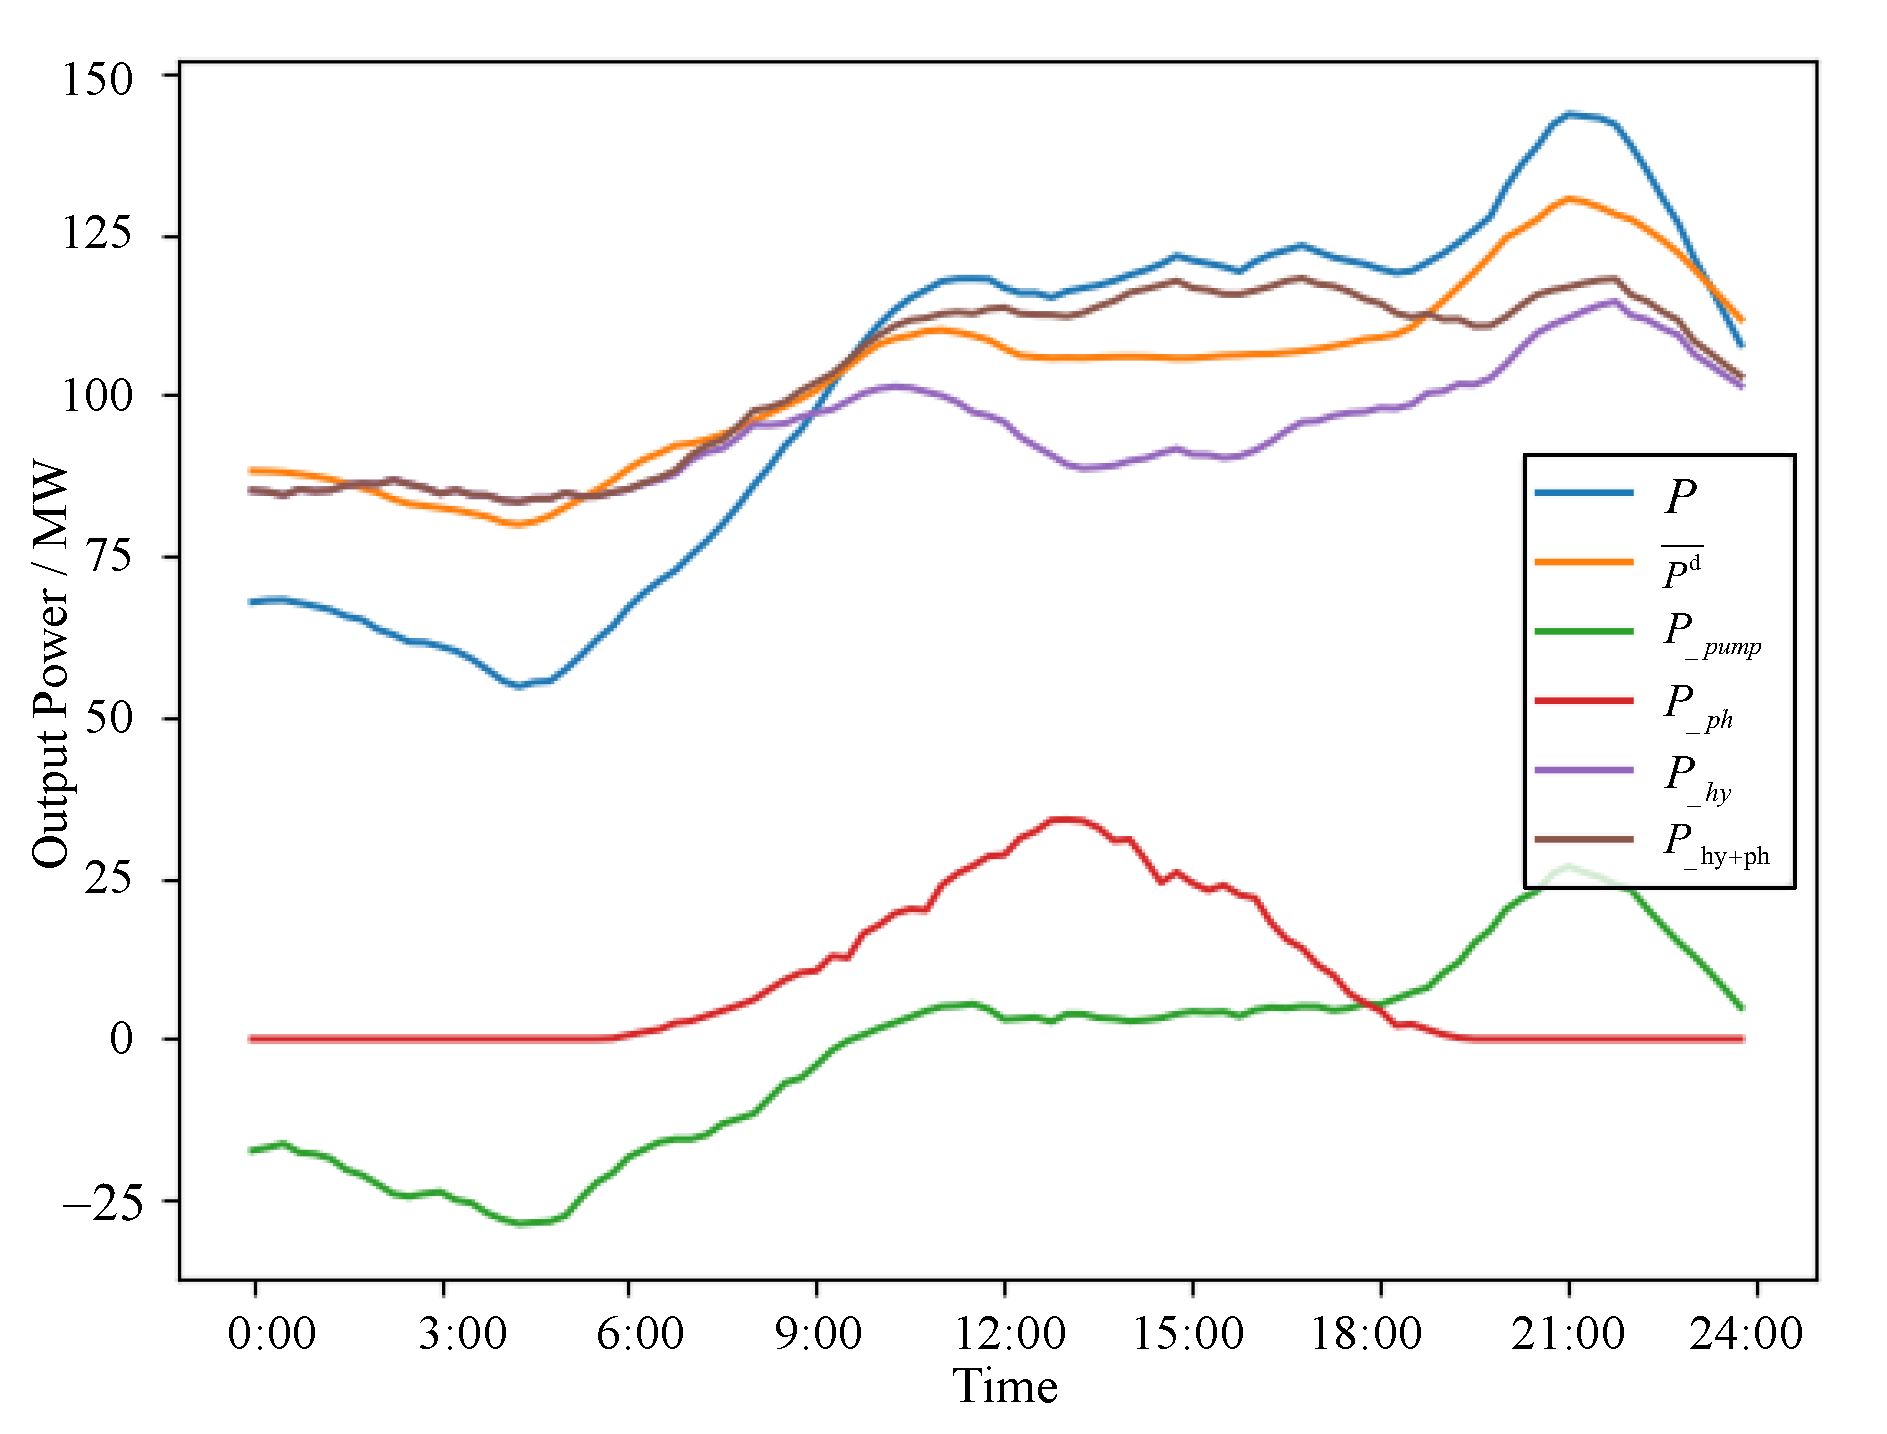
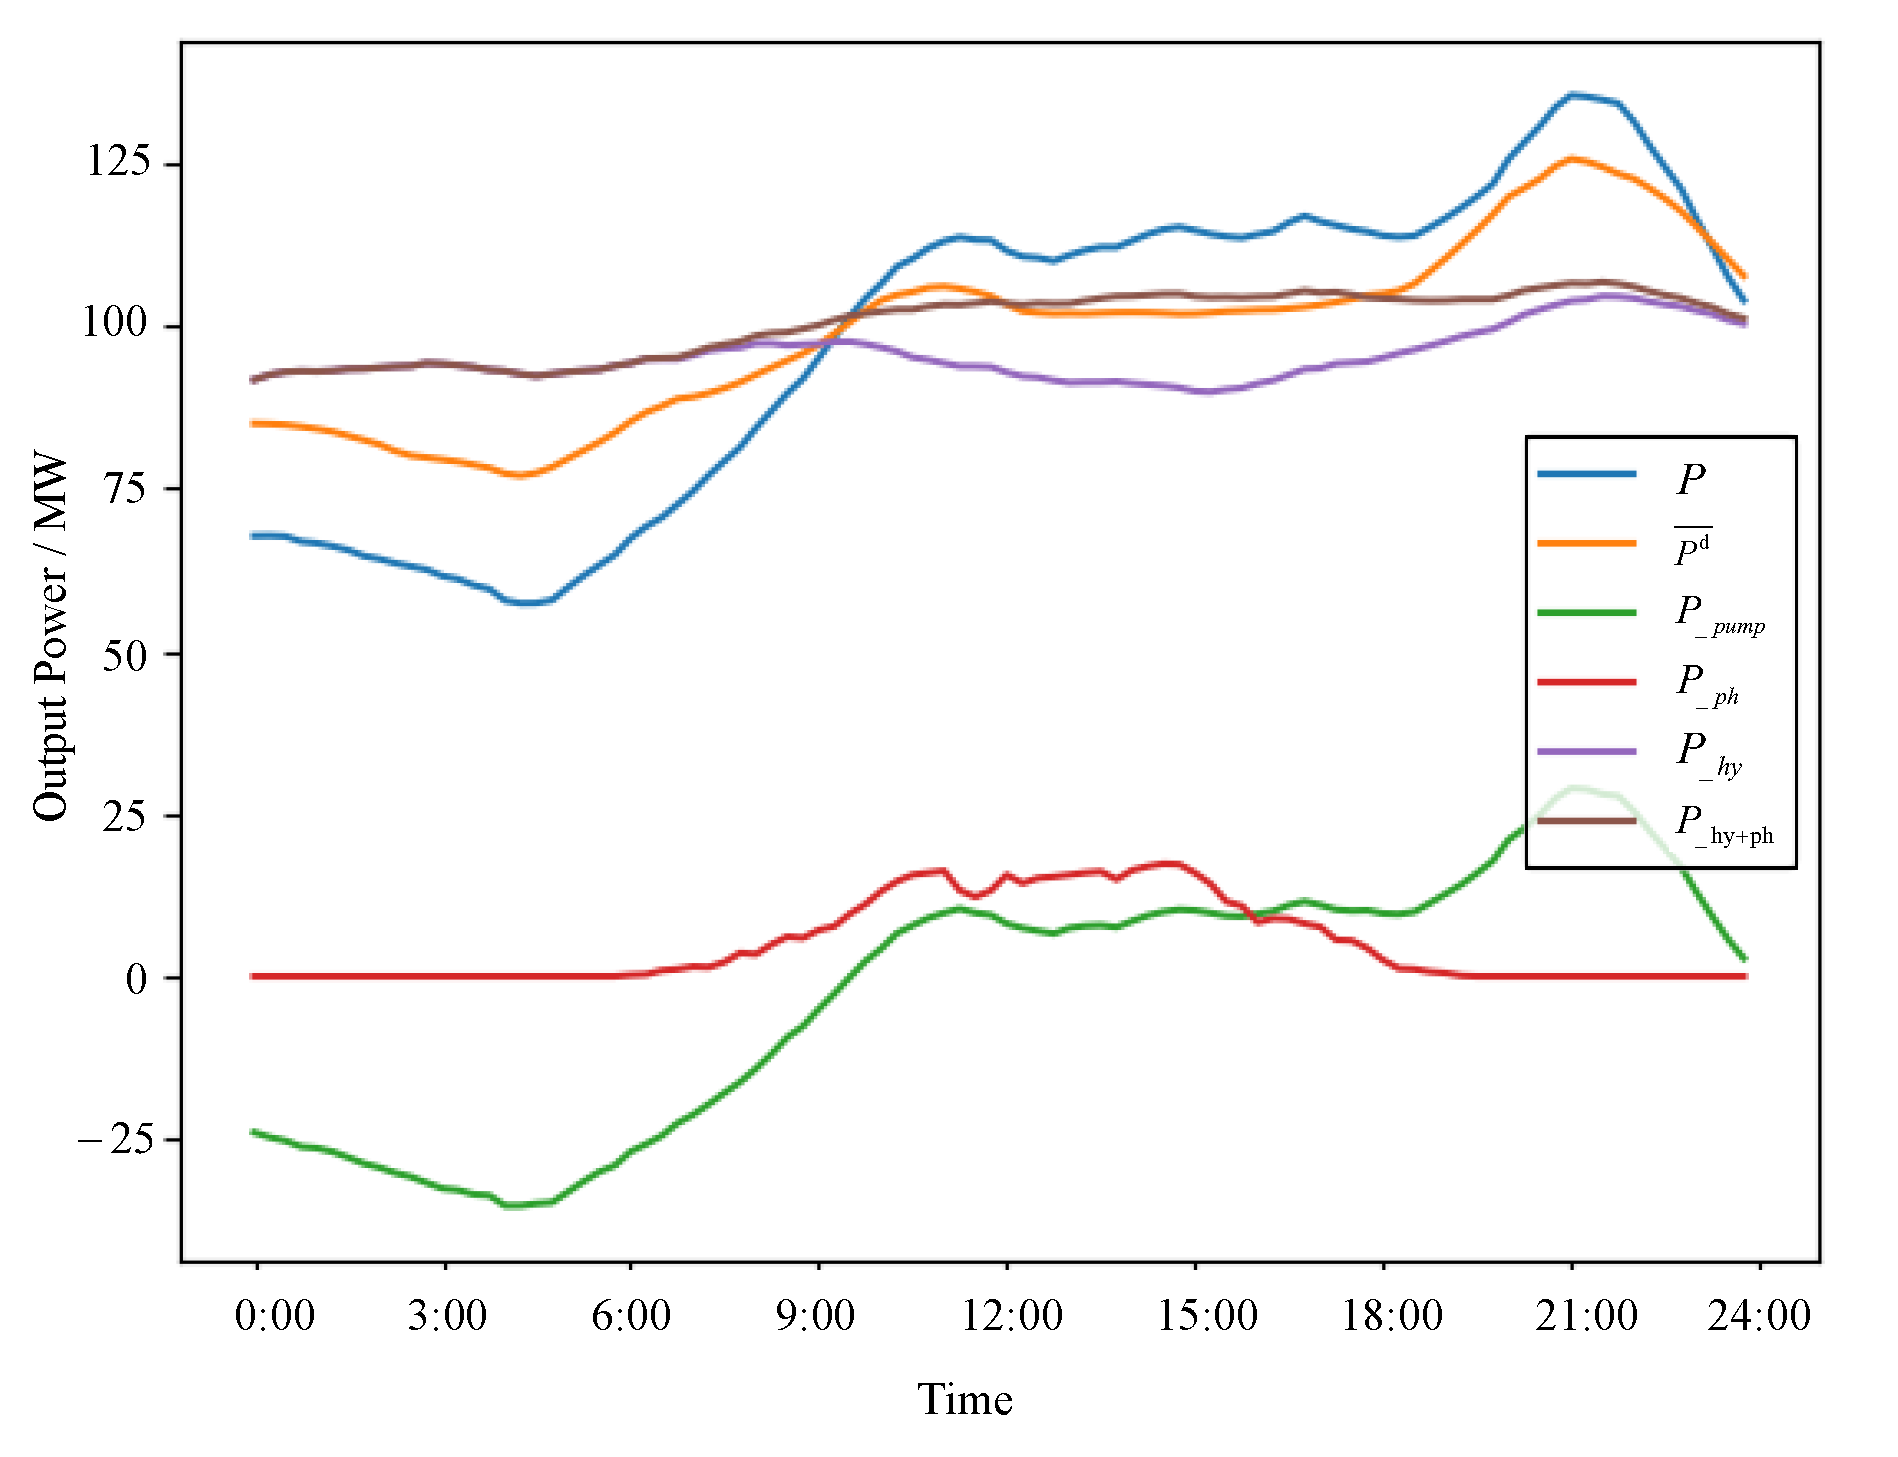
- The power fluctuation of model:Due to the fluctuating, random, and uncertain nature of solar photovoltaic (PV) output, in the HPPCS, cascaded hydroelectric and pumped-storage stations mitigate the PV output fluctuations. The power fluctuation of the system is defined as the mean-squared deviation of the combined output of the cascaded hydroelectric stations, PV stations, and pumped-storage stations from the system’s designed output. Based on the complementary evaluation index of the multi-energy-coordinated-generation system, minimizing power fluctuation is established as one of the model’s objective functions. The objective function is constructed as follows:where P represents the output power fluctuation of the HPPCS. T is the total number of time periods within a scheduling cycle, which, in this case, is one day. Data sampling occurs every 15 min throughout the day. The sampled data include the average water flow in the reservoir intervals of cascaded hydroelectric stations, the amount of water discharged, the average inflow into the reservoirs, and so on. The average data from these intervals are used as the sampling point data. T is set to 96, representing the total number of 15 min intervals in a day. ‘i’ represents the index of cascaded hydroelectric stations; ‘t’ represents the specific time interval, representd as the t-th interval; ‘n’ indicates the total number of cascaded hydroelectric stations in the system. represents the output of the i-th cascaded hydroelectric station during the t-th time interval. and , respectively, represent the output of the photovoltaic and pumped-storage stations during the t-th interval. represents the average designed output of the HPPCS for the t-th interval. The calculation equation for is as follows:where and represent the energy-storage efficiency and power-generation efficiency of the pumped-storage station, respectively. and represent the power of pumping and generating electricity by the pumped-storage station during the t-th interval, respectively. indicates the theoretical power generation of the pumped-storage station in the t-th interval, with a positive value indicating the station is in a pumping state, and a negative value indicating a power-generating state.In Equation (1), represents the average designed output of the HPPCS during the t-th interval. Considering the system’s participation in active power balance auxiliary services for the grid, its output fluctuates following the daily load curve trend of the grid: increasing output during peak load periods and reducing total output during low-demand periods. Meanwhile, the pumped-storage station utilizes excess electricity generated by the system for pumping storage. The average designed output of the system constrains the output of the hydroelectric and pumped-storage stations for each time interval. The calculation equation for is as follows:where represents the average load of the grid during the t-th time interval in the specified river basin, while represents the proportion of the hydropower–photovoltaic-pumped-storage-complementary system’s output used for participating in the grid’s active power balance services. This means that an proportion of the system’s output contributes to these power balance services. By adjusting the parameter , one can compare the Pareto solution sets for the HPPCS when it participates in auxiliary services at different proportions. The value of ranges from [0,1].
- (2)
- The economic benefits of the model:Another objective function of the scheduling model constructed in this paper is to maximize the economic benefits of electricity generation for the HPPCS. The formula for the system’s daily-electricity-generation benefits is as follows:where B represents the total daily economic benefits of the scheduling model; represents the unit time interval length for the scheduling period, which is 1/4 when T equals 96; n signifies the number of cascaded hydroelectric stations in the HPPCS; represents the output of the i-th cascaded hydroelectric station during the t-th time interval. and , respectively, represent the output of the photovoltaic and pumped-storage stations during the t-th interval. and , respectively, represent the varying electricity prices for grid connection and the fees for participating in active power balance auxiliary services, which change in each time interval.The two objective functions of the paper are addressed by calculating the minimum value of the system power fluctuation and the maximum value of the system’s total daily economic benefit. This method is key to achieving optimal outcomes in the HPPCS regarding both operational stability and economic performance.
2.2. Constraints
- (1)
- Cascaded hydroelectric station water balance constraints:where and () represent the reservoir water storage at the beginning and end of interval t for cascaded hydroelectric station i; (m3/s) is the average inflow to station ‘t’ during interval t; excluding other uses of reservoir release than for power generation, and (m3/s) are the average discharge flow and spillage flow of cascaded hydroelectric station ‘i’ in interval t, respectively. Their sum constitutes the total discharge flow of the station for that time period. represents the average water flow between the upstream and downstream reservoirs in the interval t for hydroelectric stations i and i + 1.The paper considers the time lag of water flow between reservoirs of cascaded hydroelectric stations. The lag coefficient represents the time it takes for the total discharge from the upstream hydroelectric station i to reach the downstream station i + λ. and represent the average discharge and spillage flows of station i, adjusted for the lag coefficient. is the inflow to hydroelectric station i + 1 in interval t, also adjusted for the lag. The water balance constraint among cascaded hydroelectric stations is essentially about establishing a physical link regarding the inflow and outflow of water between the stations.
- (2)
- Hydroelectric reservoir capacity and discharge constraints:where and represent the maximum and minimum storage capacities of hydroelectric station i, corresponding to the maximum reservoir capacity for flood control during the flood season and the dead storage capacity during the dry season, respectively. The upper and lower limits of the reservoir capacity of hydropower stations are constrained by the size and the relative location of the stations. The sum of and (m3/s) is the total discharge flow of station i in the t-th interval. and represent the maximum discharge flow required for downstream flood safety and the minimum discharge flow required to meet ecological demands, respectively. The storage capacity of reservoirs in each cascaded hydroelectric station is limited. The storage constraints in the reservoirs are converted into upper and lower water level constraints using the water-level-storage curve.
- (3)
- Cascaded hydroelectric station output constraints:where and represent the minimum allowable output and maximum installed capacity of hydroelectric station i during interval t, respectively. The power output of cascade hydropower stations is constrained by the relative positions of each station in the series. The constraint also provides a method for calculating the output of the hydroelectric station, where is the average flow rate of electricity generation for station i during interval t; (m) is the average net head of station i, ignoring head losses; g is the gravitational constant, usually taken as 9.81 × ; is the generation coefficient of the hydroelectric station. This equation establishes the physical relationship between the output of the hydroelectric station and its flow rate.
- (4)
- Water level fluctuation constraints:where (m) represents the reservoir water level of hydroelectric station i during interval t and is the function relating water level to reservoir capacity. To maintain efficient operation for the following day’s electricity generation, excessive fluctuation in the water level of cascaded hydroelectric stations from the beginning to the end of a day is not desirable. Therefore, (m) is established as the maximum allowable range of water level fluctuation for reservoir i from the start to the end of the day.
- (5)
- Pumped storage station output constraints:where represents the maximum installed capacity of the reversible turbine in the pumped-storage station. Pumped storage stations operate in two modes: pumping and releasing water. The output constraint ensures that, at any given moment, the pumping and releasing power of the station does not exceed the maximum installed capacity of the turbine. This constraint is vital for regulating the station’s operational limits for both energy storage and generation.
- (6)
- Pumped storage station inflow and outflow volume constraints:In the HPPCS, the pumped-storage station plays a role in energy storage and release without generating energy itself, but rather, transferring electrical energy. Over the course of a day, the sum of the pumping and releasing power of the pumped-storage station should be less than a minima , effectively limiting the daily water pumping and releasing volumes of the station to be equal. This constraint ensures the energy storage and release balance within the station.
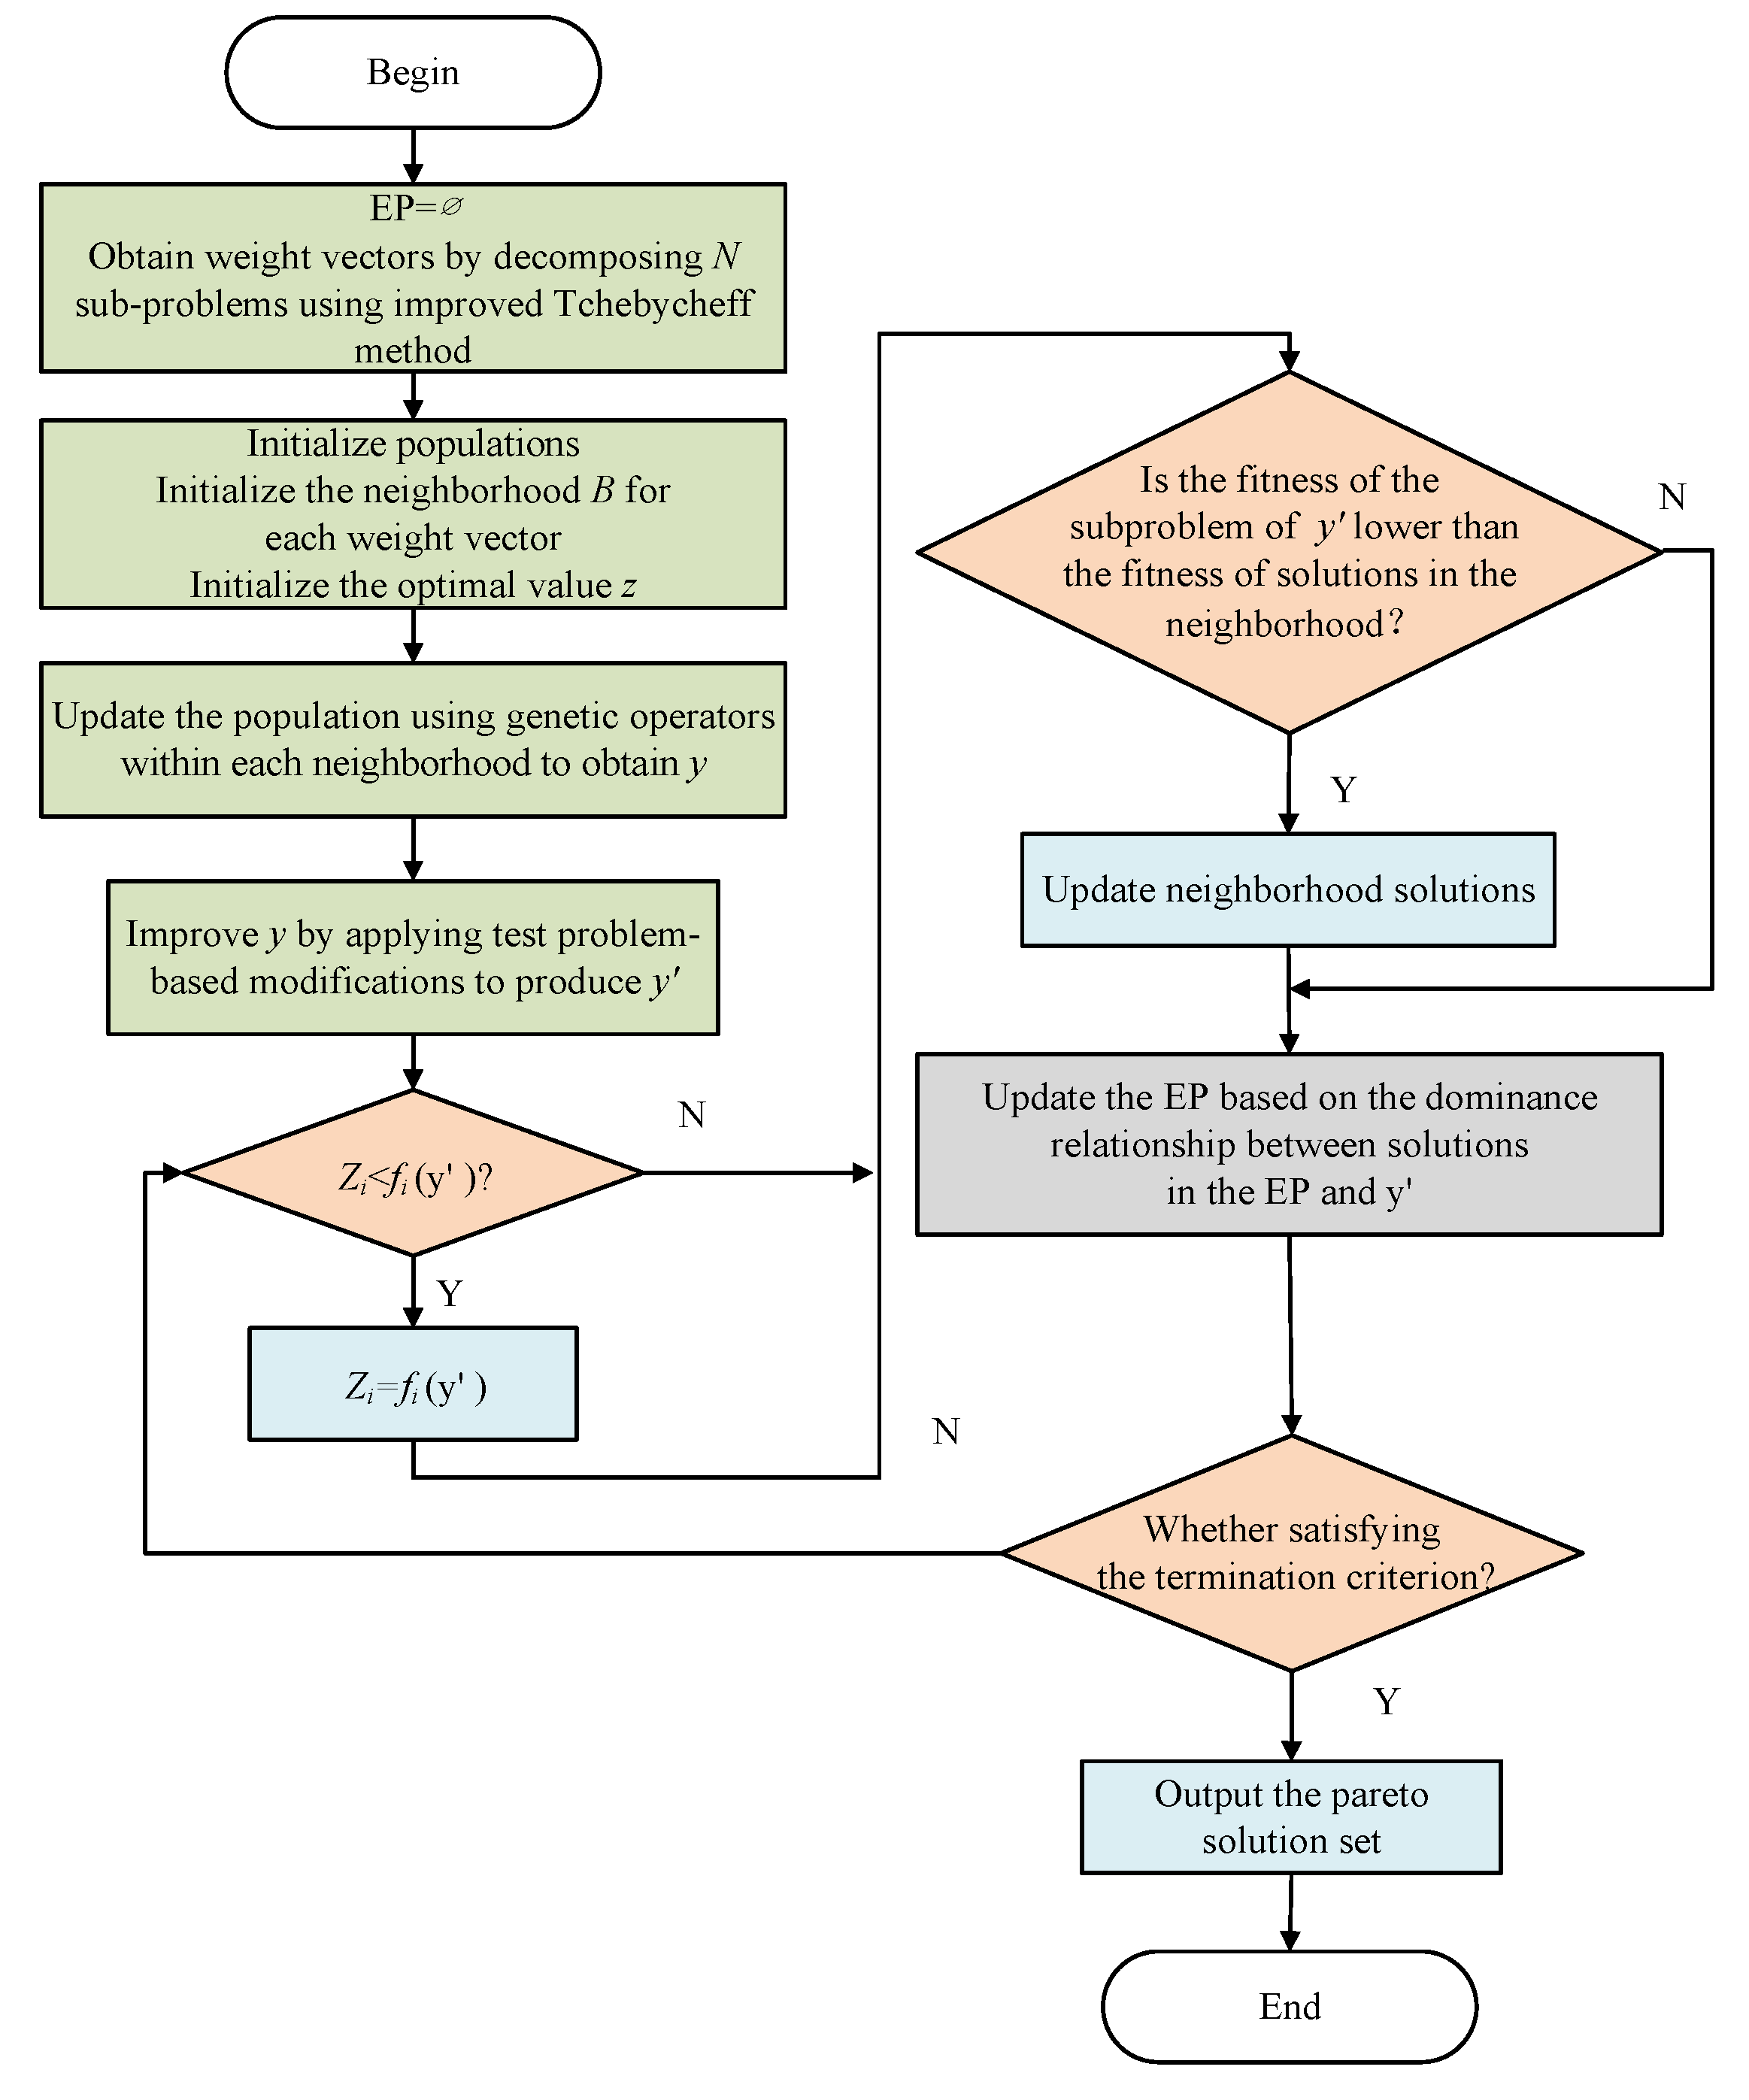
3. Multi-Objective-Optimization-Scheduling Model’s Algorithm Solution
4. Case Study
4.1. Experimental Parameter and Scenario Setting
4.1.1. The Parameters of Cascaded Hydroelectric Station
4.1.2. The Parameters of Pump Station
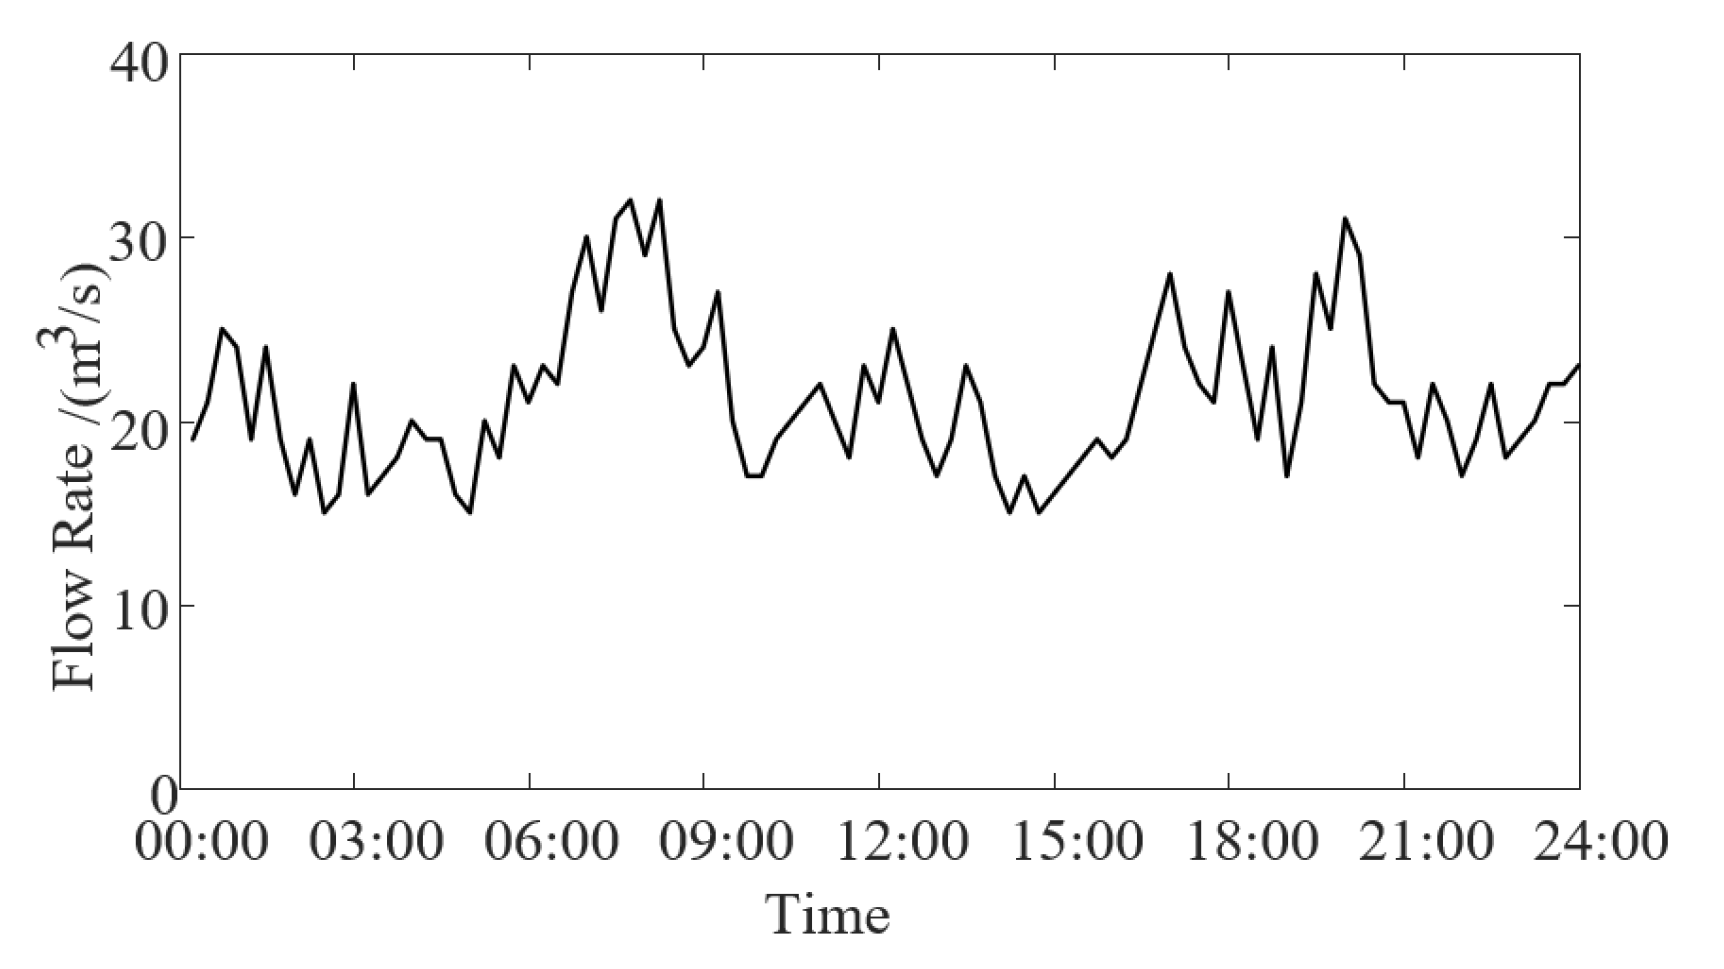
4.1.3. Photovoltaic Power Station Output Curve
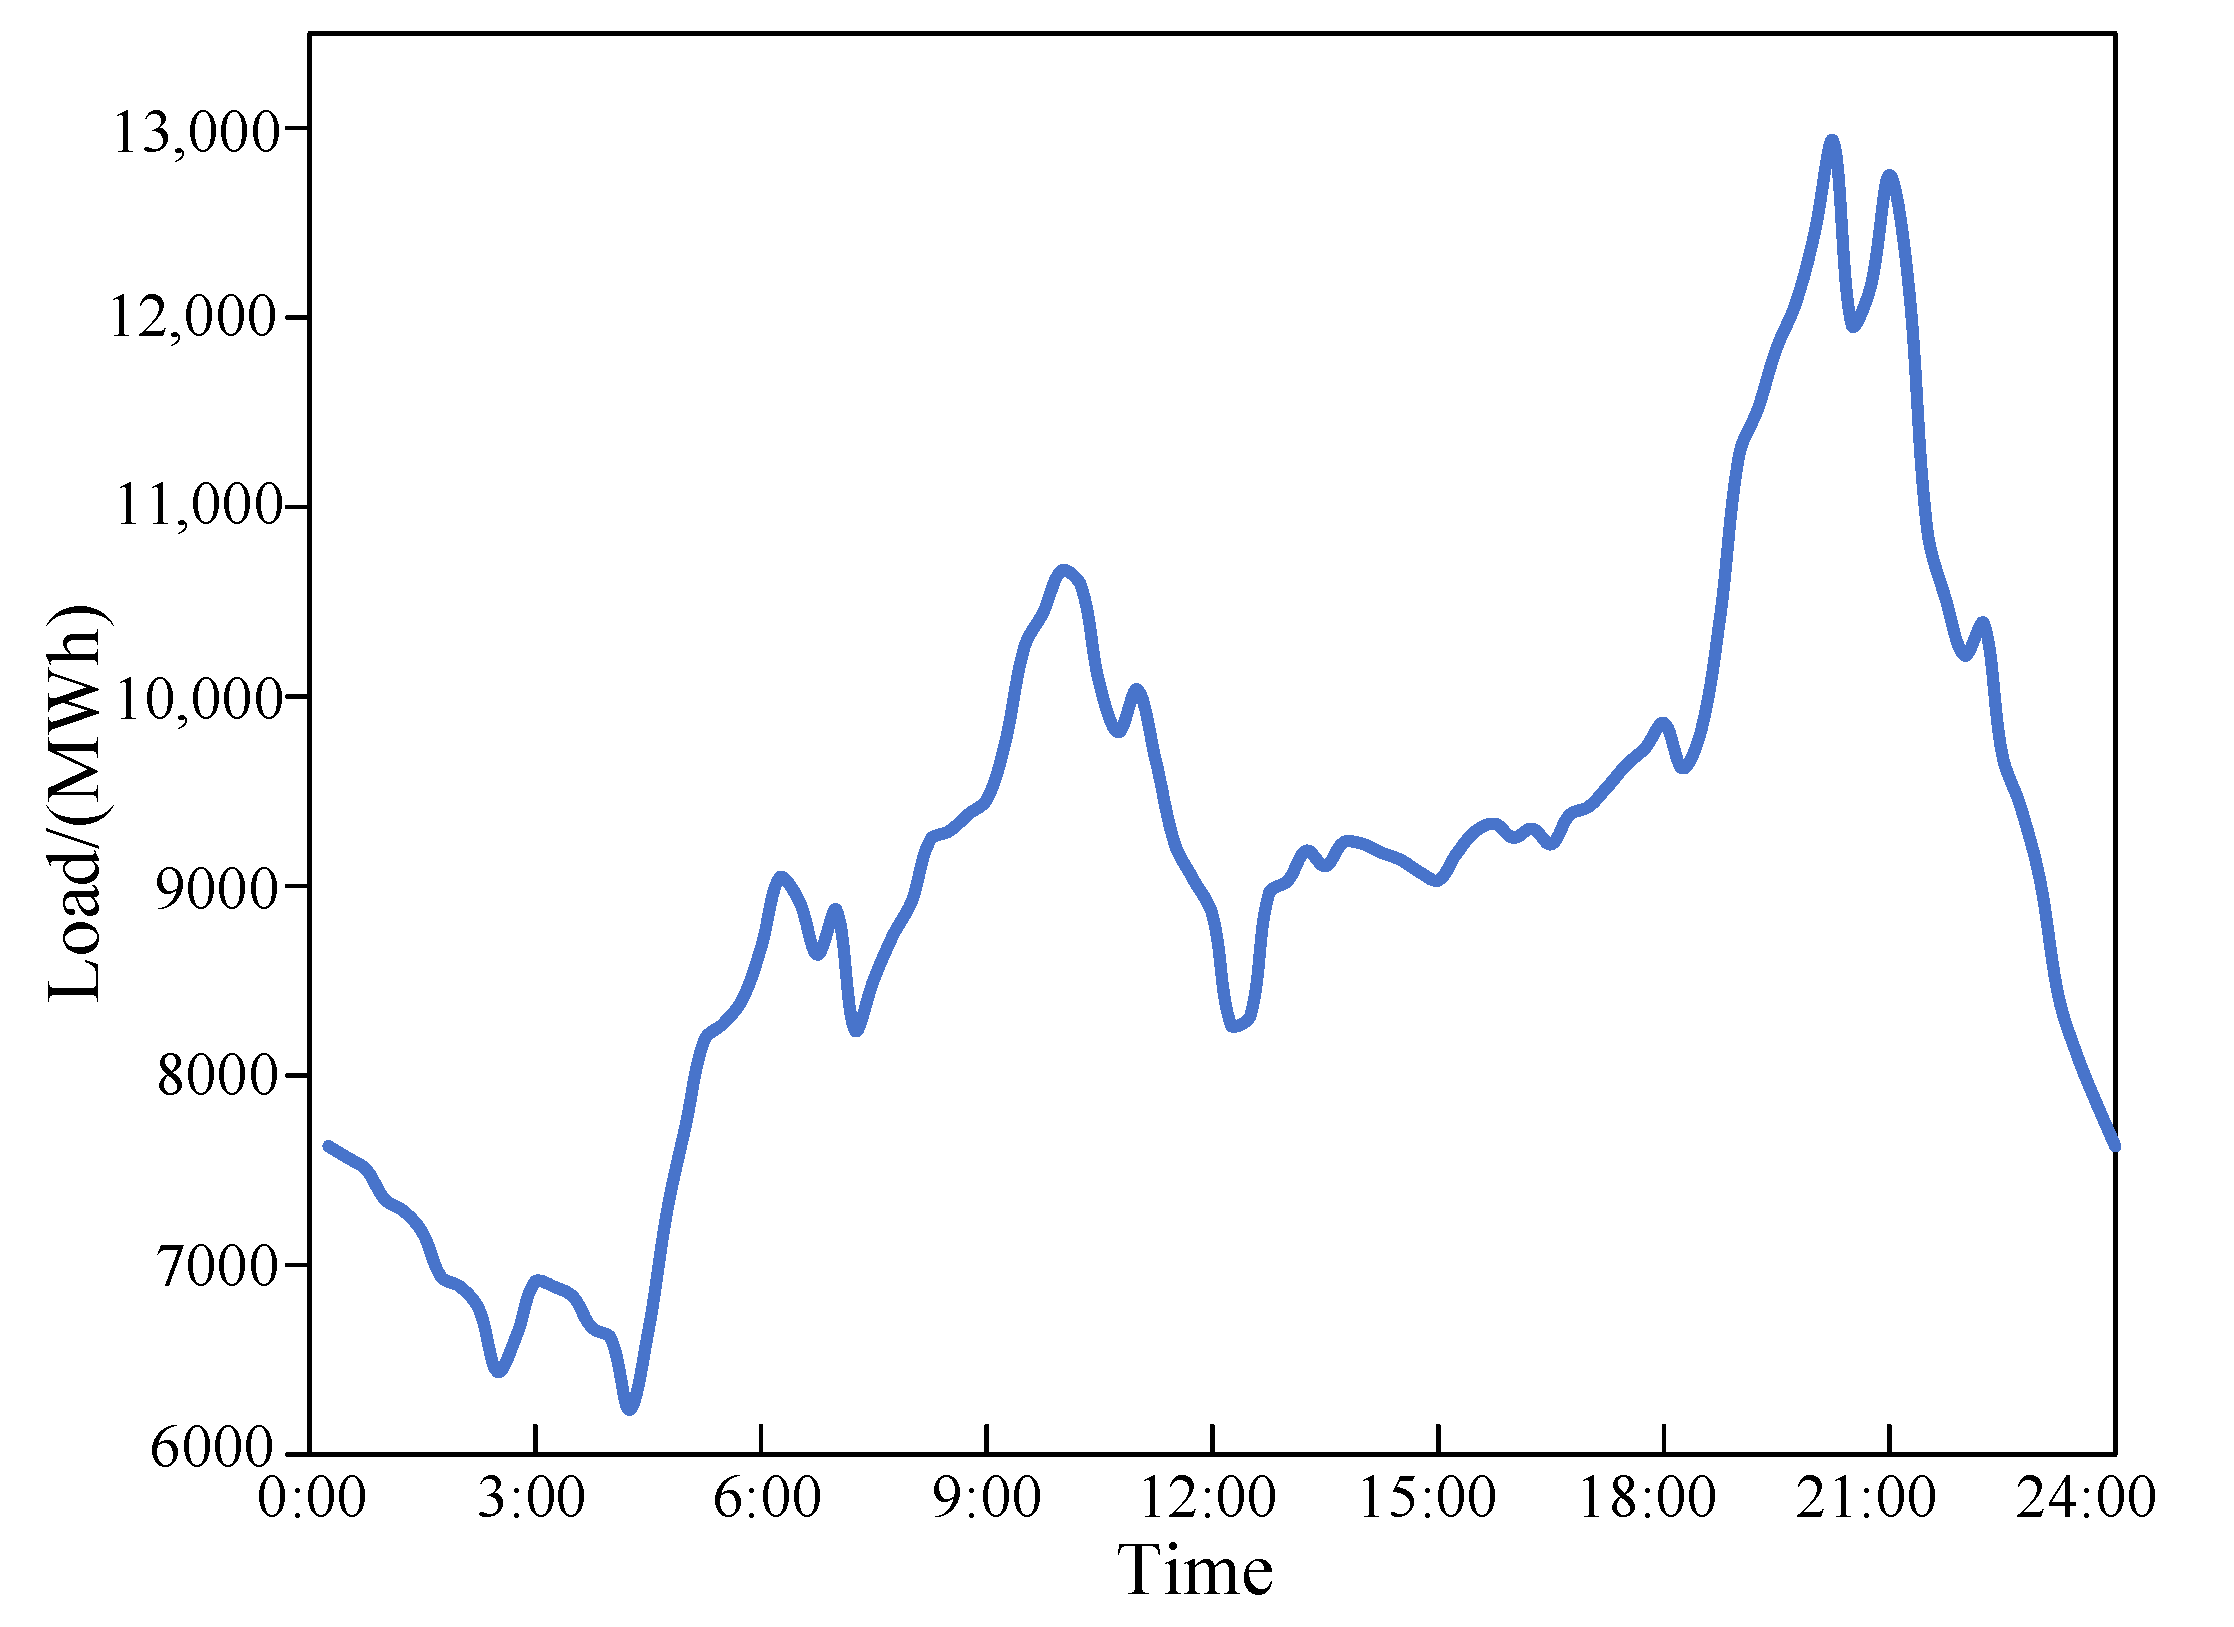
4.1.4. Daily Load Curve of the Grid
4.2. Experimental Results and Analysis
4.2.1. Optimized Scheduling Results with Different Auxiliary Service Participation Ratios
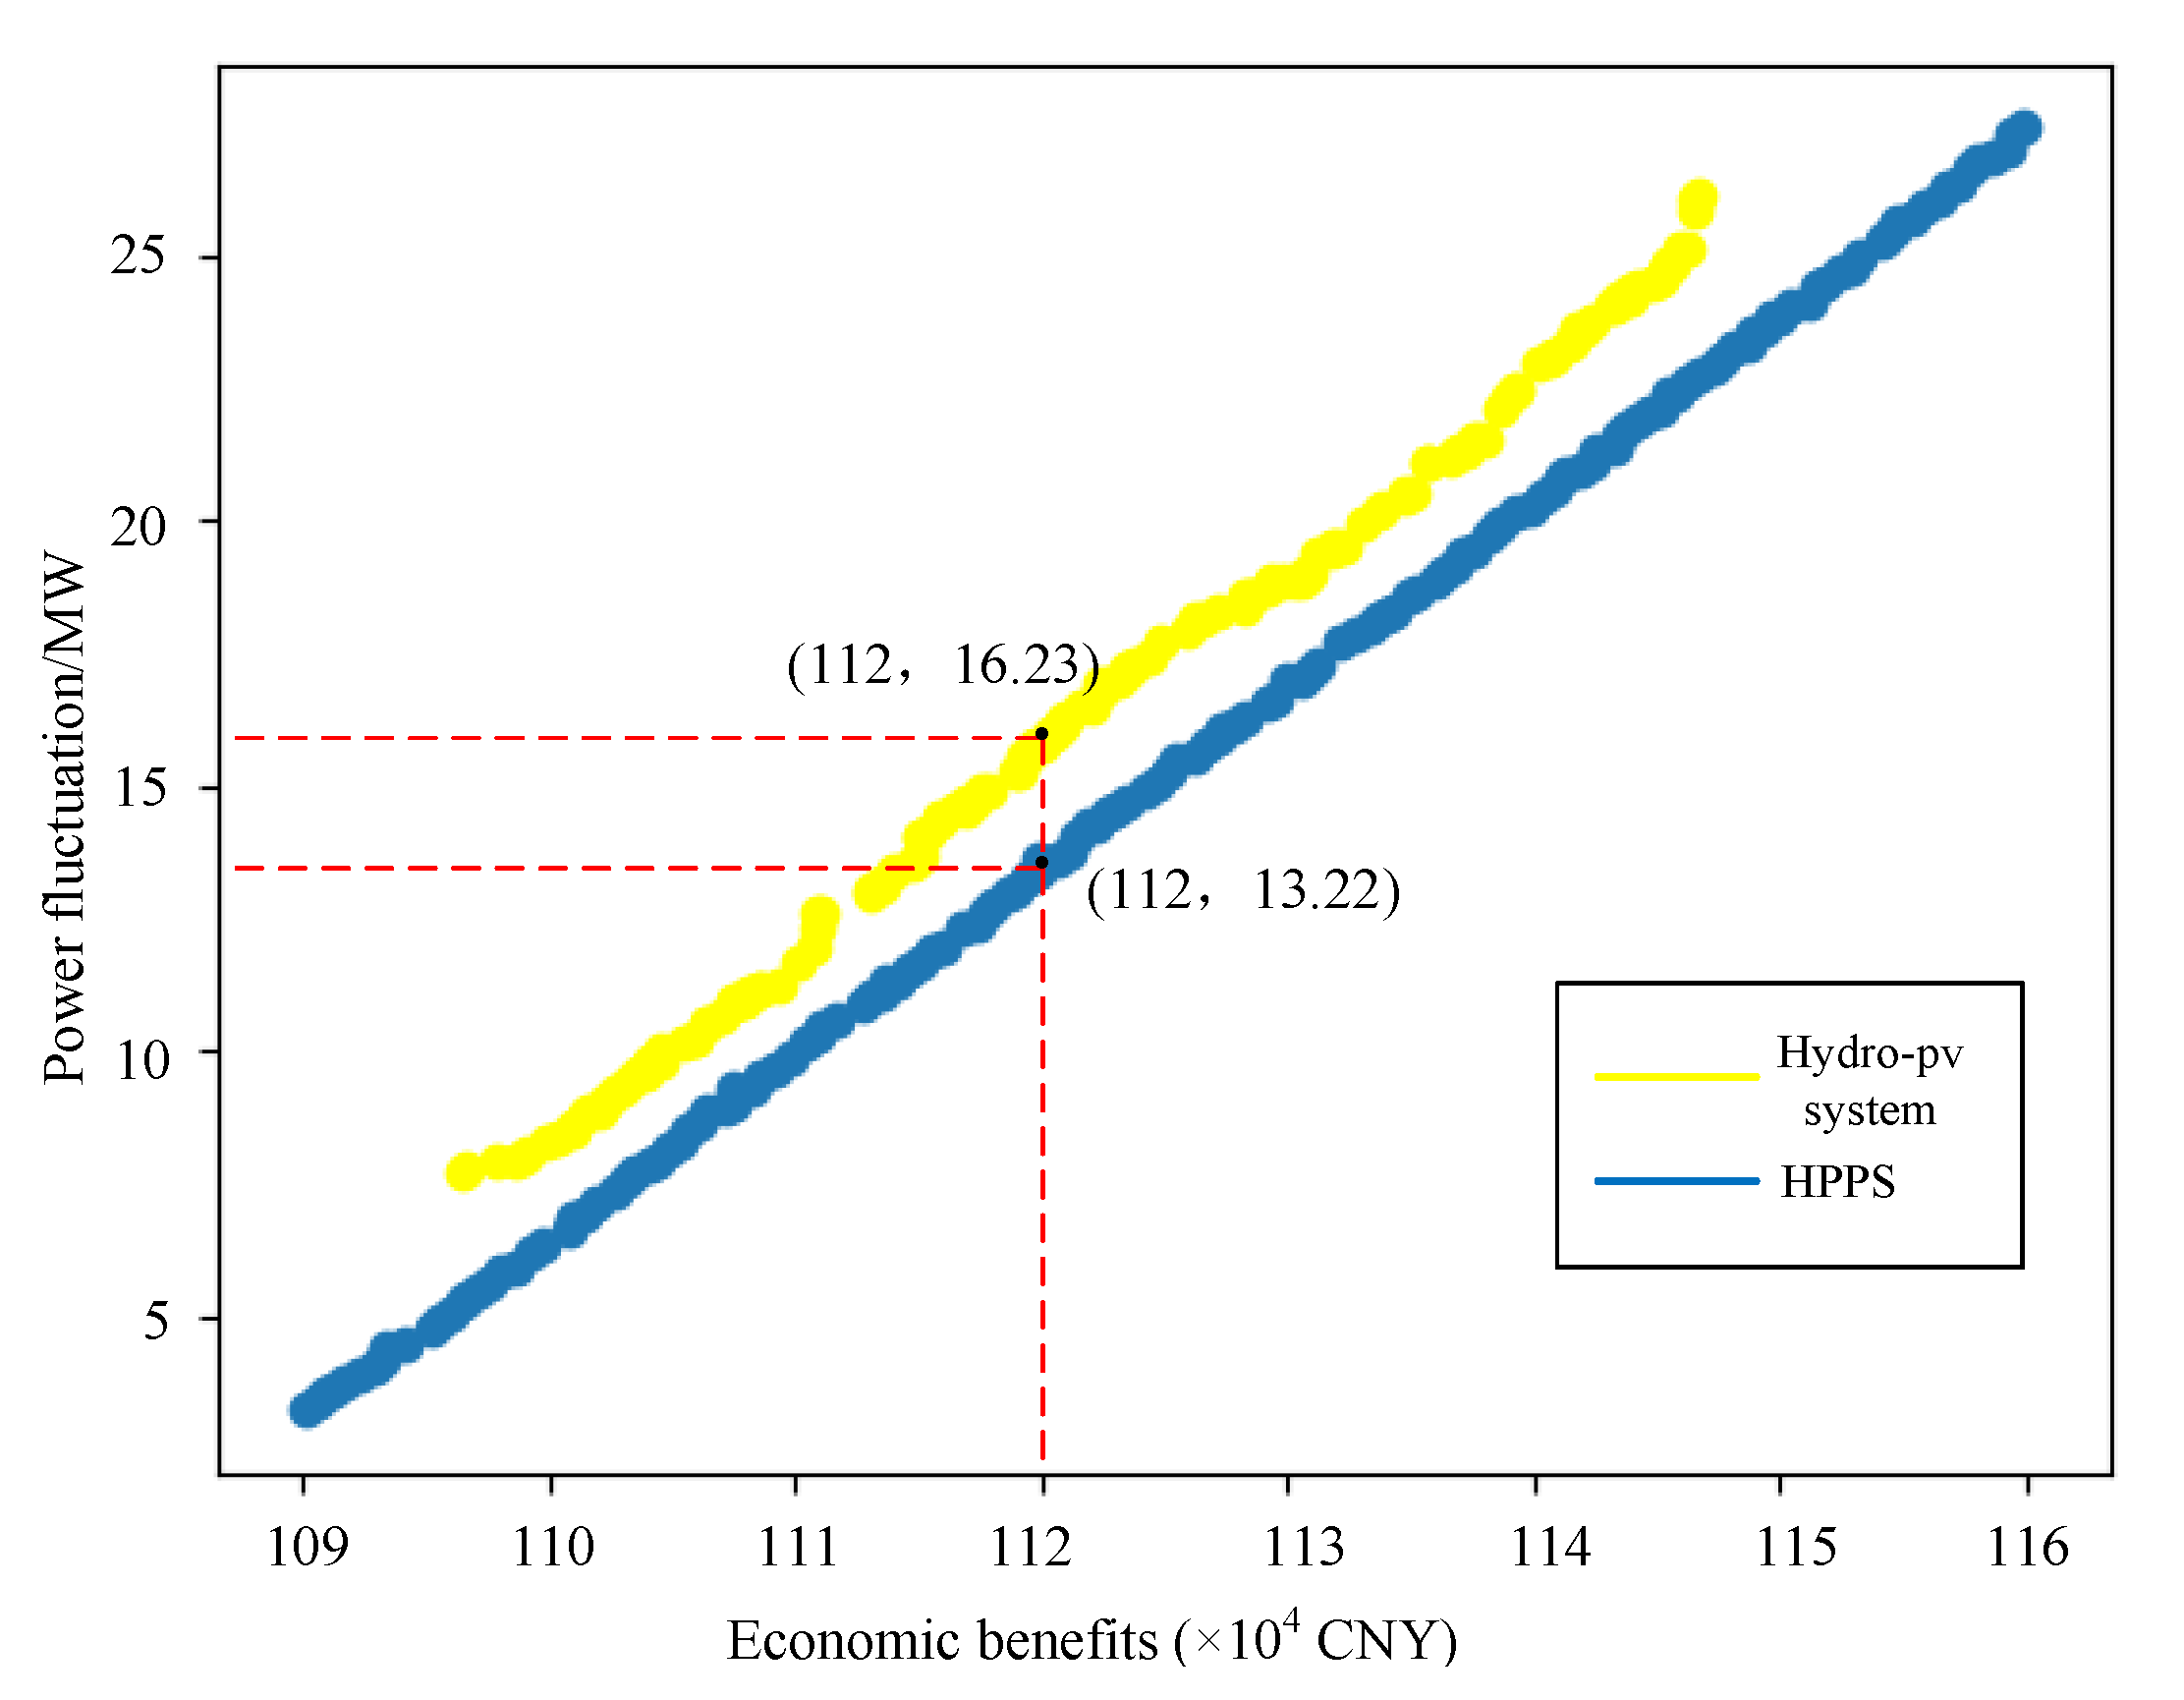
4.2.2. Comparative Analysis of Pareto Solution
4.2.3. Analysis of Extreme Pareto Solutions within the Scheduling Model
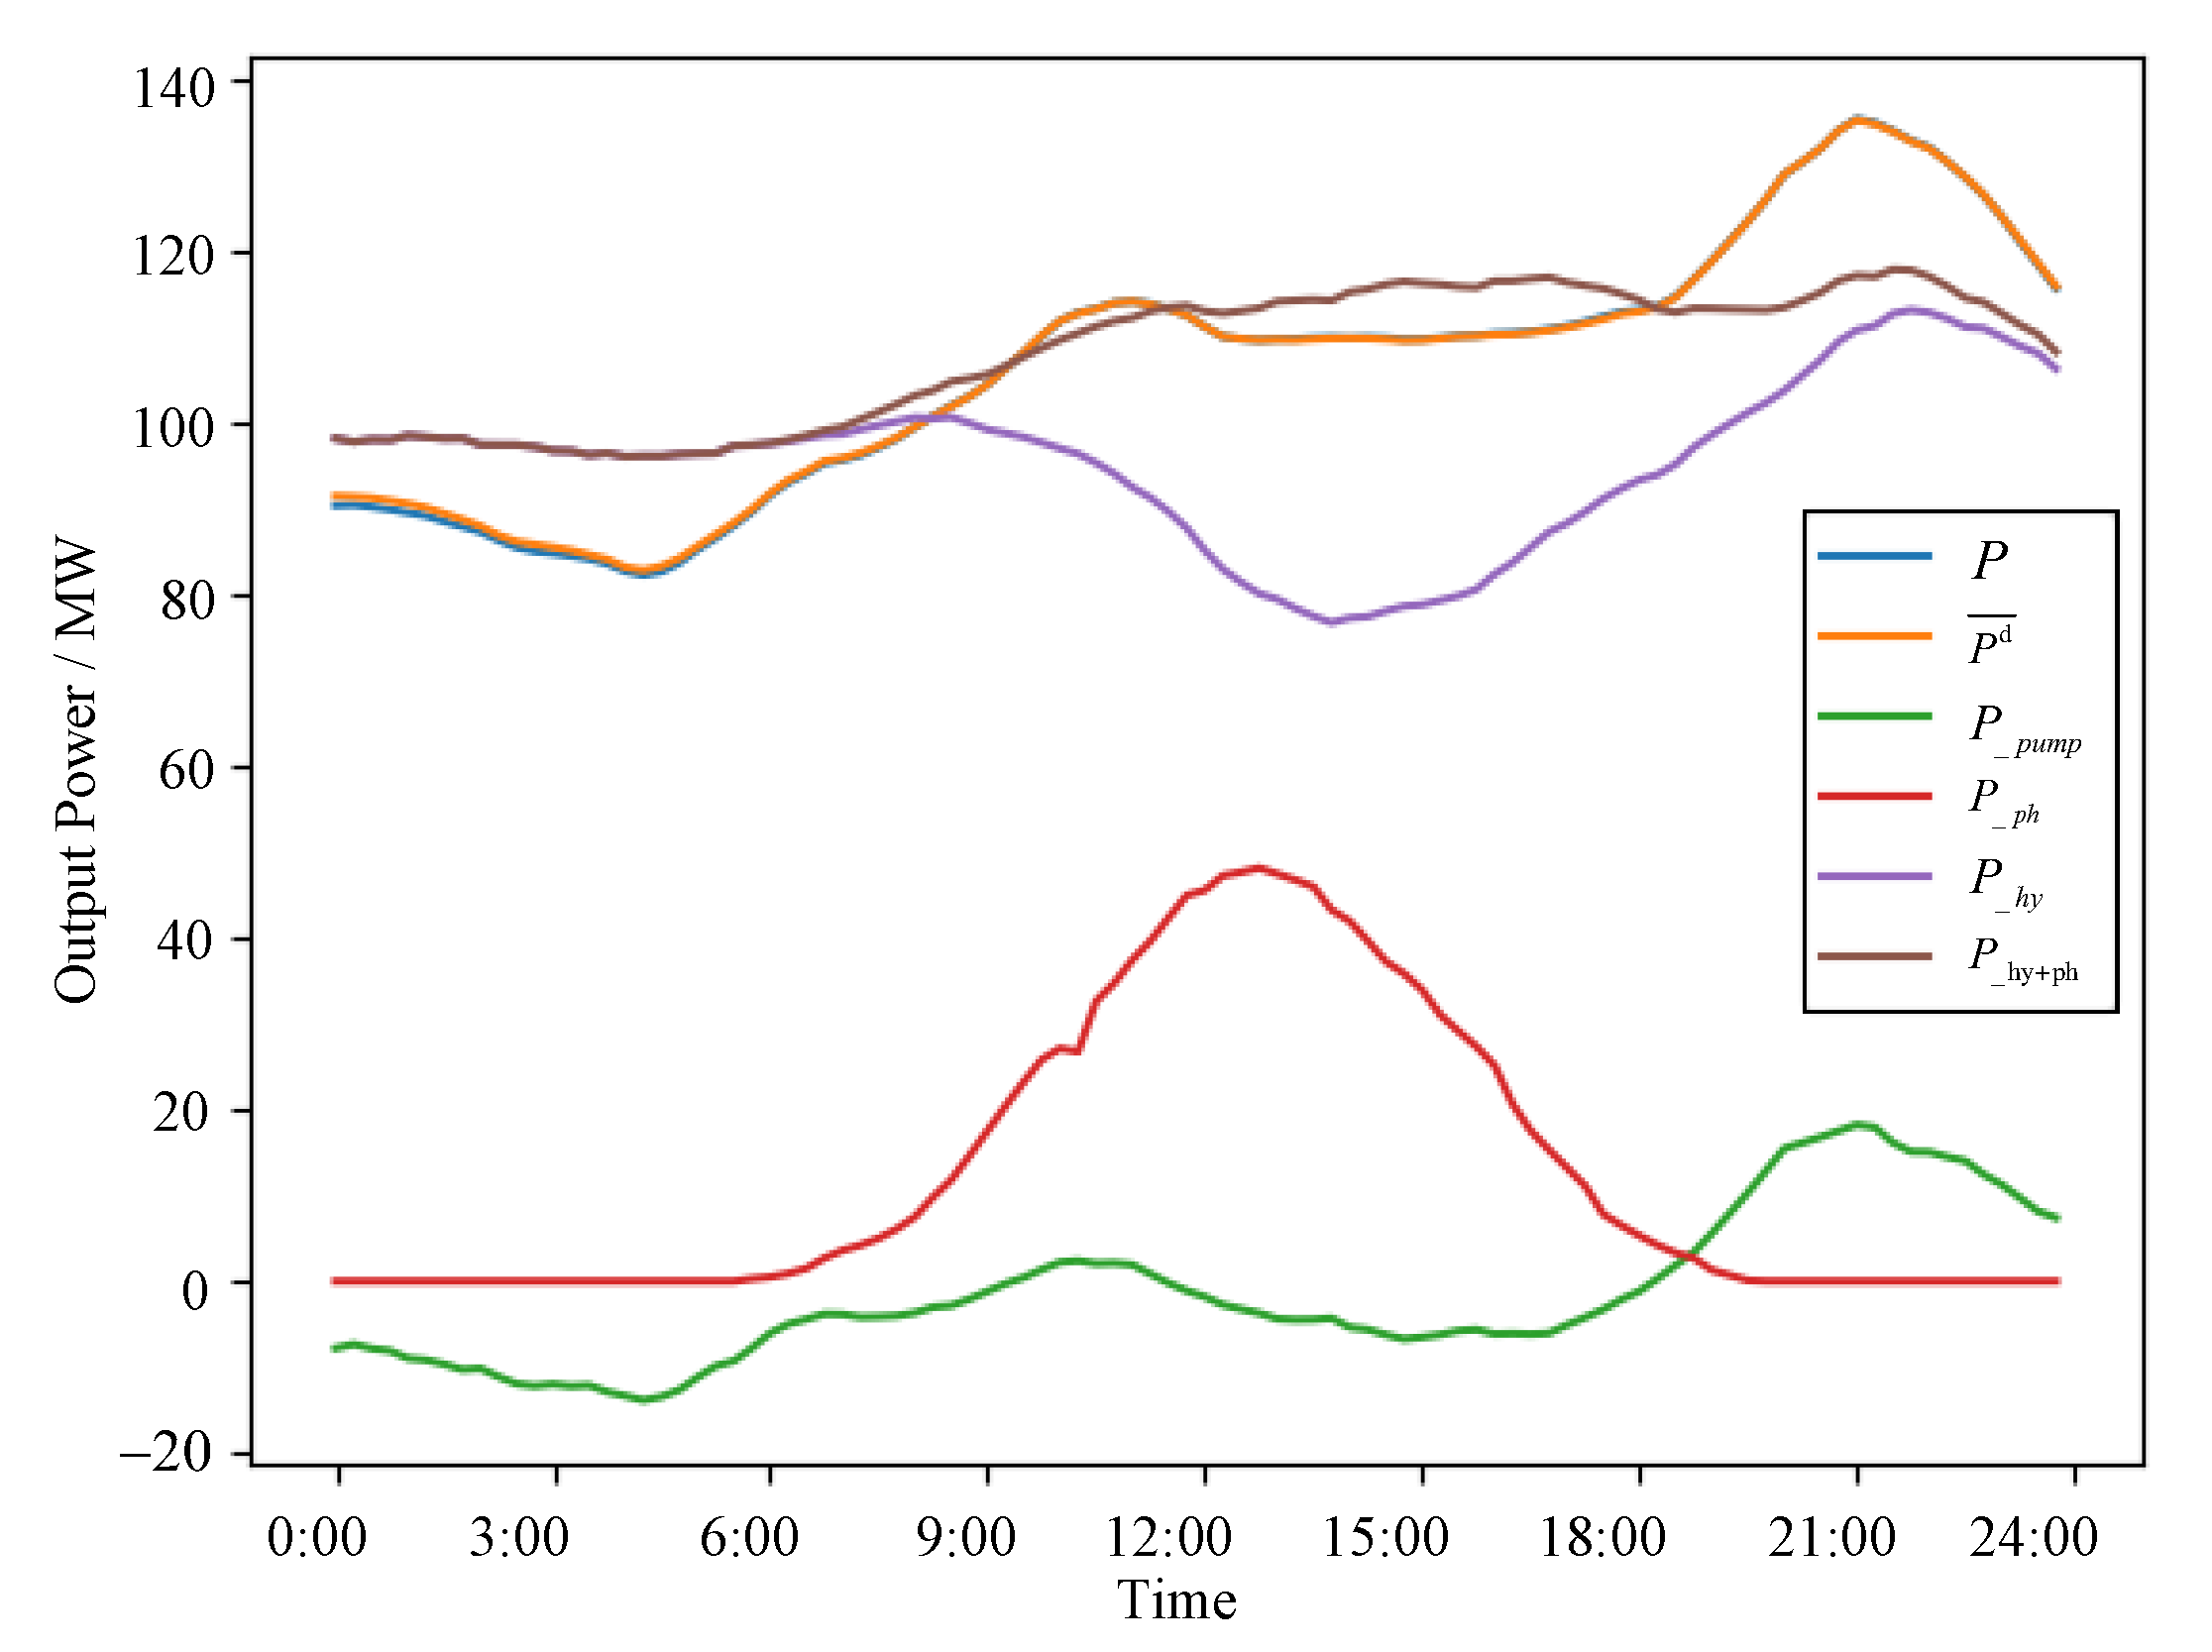
4.2.4. System Power Output under Pareto-Optimal Solutions
5. Conclusions
Author Contributions
Funding
Data Availability Statement
Conflicts of Interest
References
- Guo, C.; Wang, Y.; Liao, J.; Liu, X.; Tan, S.; Zhang, Y.; Wang, Q. Coordinated Control of Distributed Renewable Energy in Bipolar DC Microgrid Based on Modulus Transformation. Energy 2023, 9, 1807–1817. [Google Scholar] [CrossRef]
- Tan, Q.; Nie, Z.; Wen, X.; Su, H.; Fang, G.; Zhang, Z. Complementary Scheduling Rules for Hybrid Pumped Storage Hydropower-Photovoltaic Power System Reconstructing from Conventional Cascade Hydropower Stations. Appl. Energy 2024, 355, 122250. [Google Scholar] [CrossRef]
- Lou, N.; Zhang, Y.; Wang, Y.; Liu, Q.; Li, H.; Sun, Y.; Guo, Z. Two-Stage Congestion Management Considering Virtual Power Plant with Cascade Hydro-Photovoltaic-Pumped Storage Hybrid Generation. IEEE Access 2020, 8, 186335–186347. [Google Scholar] [CrossRef]
- Xia, Y.; Liu, J.; Liu, J. Optimal Scheduling Strategy of Cascaded Hydro-Photovoltaic-Pumped Storage Hybrid Generation System Based on Electric Energy Sharing. Electr. Power Autom. Equip. 2021, 41, 118–125. [Google Scholar]
- Qiu, L.; He, L.; Lu, H.; Liang, D. Pumped Hydropower Storage Potential and Its Contribution to Hybrid Renewable Energy Co-Development: A Case Study in the Qinghai-Tibet Plateau. J. Energy Storage 2022, 51, 104447. [Google Scholar] [CrossRef]
- Ming, B.; Liu, P.; Cheng, L.; Zhou, Y.; Wang, X. Optimal Daily Generation Scheduling of Large Hydro–Photovoltaic Hybrid Power Plants. Energy Convers. Manag. 2018, 171, 528–540. [Google Scholar] [CrossRef]
- Li, H.; Liu, P.; Guo, S.; Ming, B.; Cheng, L.; Yang, Z. Long-Term Complementary Operation of a Large-Scale Hydro-Photovoltaic Hybrid Power Plant Using Explicit Stochastic Optimization. Appl. Energy 2019, 238, 863–875. [Google Scholar] [CrossRef]
- Zhu, F.; Zhong, P.A.; Sun, Y.; Xu, B.; Ma, Y.; Liu, W.; Dawa, J. A Coordinated Optimization Framework for Long-Term Complementary Operation of a Large-Scale Hydro-Photovoltaic Hybrid System: Nonlinear Modeling, Multi-Objective Optimization and Robust Decision-Making. Energy Convers. Manag. 2020, 226, 113543. [Google Scholar] [CrossRef]
- Khabbouchi, I.; Said, D.; Oukaira, A.; Mellal, I.; Khoukhi, L. Machine learning and game-theoretic model for advanced wind energy management protocol (AWEMP). Energies 2023, 16, 2179. [Google Scholar] [CrossRef]
- Yuan, W.; Wang, X.; Su, C.; Cheng, C.; Liu, Z.; Wu, Z. Stochastic Optimization Model for the Short-Term Joint Operation of Photovoltaic Power and Hydropower Plants Based on Chance-Constrained Programming. Energy 2021, 222, 119996. [Google Scholar] [CrossRef]
- Zhang, J.; Cheng, C.; Yu, S.; Su, H. Chance-Constrained Co-Optimization for Day-Ahead Generation and Reserve Scheduling of Cascade Hydropower–Variable Renewable Energy Hybrid Systems. Appl. Energy 2022, 324, 119732. [Google Scholar] [CrossRef]
- Naval, N.; Yusta, J.M.; Sánchez, R.; Sebastián, F. Optimal Scheduling and Management of Pumped Hydro Storage Integrated with Grid-Connected Renewable Power Plants. J. Energy Storage 2023, 73, 108993. [Google Scholar] [CrossRef]
- Zhang, Y.; Ma, C.; Yang, Y.; Pang, X.; Liu, L.; Lian, J. Study on Short-Term Optimal Operation of Cascade Hydro-Photovoltaic Hybrid Systems. Appl. Energy 2021, 291, 116828. [Google Scholar] [CrossRef]
- Guo, S.; Zheng, K.; He, Y.; Kurban, A. The Artificial Intelligence-Assisted Short-Term Optimal Scheduling of a Cascade Hydro-Photovoltaic Complementary System with Hybrid Time Steps. Renew. Energy 2023, 202, 1169–1189. [Google Scholar] [CrossRef]
- Dan, Y.; Dai, P.; Lin, L. Modelling and Analysis of Coordinated Photovoltaic-Pumped-Storage Generation Systems. In Proceedings of the 2022 IEEE 5th International Conference on Automation, Electronics and Electrical Engineering (AUTEEE), Shenyang, China, 18–20 November 2022; pp. 550–554. [Google Scholar]
- Zhou, H.; Lu, L.; Wei, M.; Shen, L.; Liu, Y. Robust Scheduling of a Hybrid Hydro/Photovoltaic/Pumped-Storage System for Multiple Grids Peak-Shaving and Congestion Management. IEEE Access 2023, 12, 22230–22242. [Google Scholar] [CrossRef]
- Zhang, S.; Xiang, Y.; Liu, J.; Liu, J.; Yang, J.; Zhao, X.; Wang, J. A regulating capacity determination method for pumped storage hydropower to restrain PV generation fluctuations. Csee J. Power Energy Syst. 2020, 8, 304–316. [Google Scholar]
- Hong, L.; Wang, J.; Sun, Z.; Zhang, G. Multi-time-scale optimal scheduling control strategy for Cascade Hydro-PV-Pumped Storage complementary Generation System. In Proceedings of the 2022 IEEE 17th Conference on Industrial Electronics and Applications (ICIEA), Chengdu, China, 16–19 December 2022; pp. 1595–1600. [Google Scholar]
- Liaquat, S.; Zia, M.F.; Benbouzid, M. Modeling and Formulation of Optimization Problems for Optimal Scheduling of Multi-Generation and Hybrid Energy Systems: Review and Recommendations. Electronics 2021, 10, 1688. [Google Scholar] [CrossRef]
- Acuña, G.; Domínguez, R.; Arganis, M.L.; Fuentes, O. Optimal Schedule the Operation Policy of a Pumped Energy Storage Plant: Case Study Zimapán, México. Electronics 2022, 11, 4139. [Google Scholar] [CrossRef]
- Barbón, A.; Aparicio-Bermejo, J.; Bayón, L.; Georgious, R. Floating Photovoltaic Systems Coupled with Pumped Hydroplants under Day-Ahead Electricity Market condition: Parametric Analysis. Electronics 2023, 12, 2250. [Google Scholar] [CrossRef]
- Wang, Q.; Gu, Q.; Chen, L.; Guo, Y.; Xiong, N. A MOEA/D with Global and Local Cooperative Optimization for Complicated Bi-Objective Optimization Problems. Appl. Soft Comput. 2023, 137, 110162. [Google Scholar] [CrossRef]
- Liu, Z.; Zhao, P.; Cao, J.; Zhang, J.; Chen, Z. A Constrained Multi-Objective Evolutionary Algorithm with Pareto Estimation via Neural Network. Expert Syst. Appl. 2024, 237, 121718. [Google Scholar] [CrossRef]
- Said, D. Intelligent photovoltaic power forecasting methods for a sustainable electricity market of smart micro-grid. IEEE Commun. Mag. 2021, 59, 122–128. [Google Scholar] [CrossRef]
- Ma, X.; Liu, F.; Qi, Y.; Gong, M.; Yin, M.; Li, L.; Wu, J. MOEA/D with Opposition-Based Learning for Multiobjective Optimization Problem. Neurocomputing 2014, 146, 48–64. [Google Scholar] [CrossRef]
- Wang, J.; Su, Y.; Lin, Q.; Ma, L.; Gong, D.; Li, J.; Ming, Z. A Survey of Decomposition Approaches in Multiobjective Evolutionary Algorithms. Neurocomputing 2020, 408, 308–330. [Google Scholar] [CrossRef]
- Wu, X.; Chen, C.; Ding, S. A Modified MOEA/D Algorithm for Solving Bi-Objective Multi-Stage Weapon-Target Assignment Problem. IEEE Access 2021, 9, 71832–71848. [Google Scholar] [CrossRef]
- Qi, Y.; Ma, X.; Liu, F.; Jiao, L.; Sun, J.; Wu, J. MOEA/D with Adaptive Weight Adjustment. Evol. Comput. 2014, 22, 231–264. [Google Scholar] [CrossRef] [PubMed]
- Liu, H.L.; Gu, F.; Zhang, Q. Decomposition of a Multiobjective Optimization Problem into a Number of Simple Multiobjective Subproblems. IEEE Trans. Evol. Comput. 2013, 18, 450–455. [Google Scholar] [CrossRef]
- Trivedi, A.; Srinivasan, D.; Sanyal, K.; Ghosh, A. A Survey of Multiobjective Evolutionary Algorithms Based on Decomposition. IEEE Trans. Evol. Comput. 2016, 21, 440–462. [Google Scholar] [CrossRef]
- Deb, K.; Jain, H. Handling many-objective problems using an improved NSGA-II procedure. In Proceedings of the 2012 IEEE Congress on Evolutionary Computation, Brisbane, Australia, 10–15 June 2012; pp. 1–8. [Google Scholar] [CrossRef]
- Tanabe, R.; Ishibuchi, H. An Analysis of Control Parameters of MOEA/D Under Two Different Optimization Scenarios. Appl. Soft Comput. 2018, 70, 22–40. [Google Scholar] [CrossRef]


| Hydroelectric Station | I | II | III |
|---|---|---|---|
| Water level fluctuation constraint (m) | 2705–2709 | 2572–2574 | 2447.8–2449.8 |
| Water release flow constraints (m³/s) | 0–43.32 | 0–53.40 | 0–47.10 |
| Normal reservoir level (m) | 2705.8 | 2572.4 | 2448.2 |
| Output constraints (MW) | 0–45 | 0–72 | 0–60 |
| Average net head (m) | 12.5 | 16 | 15 |
| Output coefficient | 8.5 | 8.5 | 8.5 |
| Regulatory performance | Day | Day | Day |
| Maximum Installed Capacity (MW) | Pumping Efficiency | Generation Efficiency |
|---|---|---|
| 300 | 0.95 | 0.90 |
Disclaimer/Publisher’s Note: The statements, opinions and data contained in all publications are solely those of the individual author(s) and contributor(s) and not of MDPI and/or the editor(s). MDPI and/or the editor(s) disclaim responsibility for any injury to people or property resulting from any ideas, methods, instructions or products referred to in the content. |
© 2024 by the authors. Licensee MDPI, Basel, Switzerland. This article is an open access article distributed under the terms and conditions of the Creative Commons Attribution (CC BY) license (https://creativecommons.org/licenses/by/4.0/).
Share and Cite
Guo, L.; Liu, S.; Xi, L.; Zhang, G.; Liu, Z.; Zeng, Q.; Lü, F.; Wang, Y. Research on the Short-Term Economic Dispatch Method of Power System Involving a Hydropower-Photovoltaic-Pumped Storage Plant. Electronics 2024, 13, 1282. https://doi.org/10.3390/electronics13071282
Guo L, Liu S, Xi L, Zhang G, Liu Z, Zeng Q, Lü F, Wang Y. Research on the Short-Term Economic Dispatch Method of Power System Involving a Hydropower-Photovoltaic-Pumped Storage Plant. Electronics. 2024; 13(7):1282. https://doi.org/10.3390/electronics13071282
Chicago/Turabian StyleGuo, Liang, Shudi Liu, Litang Xi, Guofang Zhang, Ziqi Liu, Qi Zeng, Feipeng Lü, and Yuhong Wang. 2024. "Research on the Short-Term Economic Dispatch Method of Power System Involving a Hydropower-Photovoltaic-Pumped Storage Plant" Electronics 13, no. 7: 1282. https://doi.org/10.3390/electronics13071282