1. Introduction
The rapid development of virtual reality (VR) and augmented reality (AR) technologies has increased the size of the VR/AR markets. According to the global market research company IDC, global expenditure on VR/AR is expected to grow from
$13.8 billion in 2022 to
$50.9 billion in 2026 [
1]. This is because the advantage of VR in maximizing user immersion in a virtual space separated from the real space is being utilized in various industries. Consequently, the VR/AR technology is being actively used in experiential content (e.g., videos, games, and education) in the entertainment field, which requires a high degree of immersion. Various applications focusing on the realistic experience, which is an advantage of VR devices, are being developed [
2], and several studies have been conducted to improve the realistic experience of VR contents to develop better applications [
3,
4,
5].
In previous studies [
3,
4,
5,
6], emotion analysis was conducted to improve the realistic experience of VR content. This is because the emotions felt by users while using VR application are not only used as important data for evaluating VR content but also analyzed to develop better VR environments [
7]. Users can experience various emotions while using VR content, and the emotions felt by them are mainly recorded through a self-reporting survey. A method in which users only need to convey their felt emotions directly is easy to implement and remains the most popular approach in emotion analysis. However, the limitation is that the measured emotions may differ from the actual emotions if the user intentionally conveys other emotions or distorts the experience felt owing to a decrease in immersion [
3,
8].
To solve this problem, various studies have analyzed emotions using nonquestionnaire survey method [
9,
10,
11,
12,
13,
14,
15,
16,
17,
18,
19]. Emotion analysis can be conducted using the data collected via various methods, such as speech- or text-based voice, visual facial expressions, physiological sensors, and behavior. However, collecting data using nonquestionnaire survey method in a VR environment is challenging. In the case of an electroencephalogram (EEG), a physiological sensor mainly used for emotion analysis in a VR environment, there is considerable noise; therefore, a large amount of data is required to obtain meaningful information [
20]. This is because several types of noise can occur when recording brain waves, and several factors affect brain waves; therefore, specialized education to read normal brain waves is required [
21]. Moreover, EEG is difficult to use as a popular emotion analysis method in a VR environment because there is a limitation, i.e., a part of the head must be cut to reduce resistance, or a conductive gel must be applied and electrodes must be attached at the correct location for smooth collection [
20]. By contrast, in addition to brain waves, studies were conducted to analyze emotions using various sensor data, such as electrocardiogram (ECG) [
11,
12], galvanic skin response (GSR) [
22,
23], and heart rate variability (HRV) [
23,
24], but there was a limitation in that the number of datasets collected in VR environments was insufficient [
25].
Accordingly, a method for predicting the type of video (e.g., happy, sad, and fear) viewed by a user using sensor data has been proposed to overcome the limitations of existing studies. To predict a user’s emotion directly through sensor data, labeling the emotion of the measured sensor data is required, which is also challenging [
26]. However, in the case of a method for predicting the category (labeled) of a video viewed by a user in a VR environment, because the category of each video is classified by a trusted expert [
25], it is difficult for emotional distortion to occur; hence, more accurate emotions can be predicted. Although it is not possible to confirm that the category of the video provided to the user necessarily matches the emotion felt by the user who viewed the video, if the correlation is inferred by clustering the sensor data measured after viewing each video, the emotional distortion caused by directly evaluating the user’s emotions through the survey can be prevented. In addition, by predicting the type of video using sensor data, the valence and arousal of a user can be inferred from the immediate response of the user, which can prevent the loss of immersion [
8].
Therefore, we predicted the type of image viewed by the user utilizing the sensor dataset collected in the VR environment and analyzed the relationship between the predicted image type and emotion. By using the ECG and GSR sensor data of the VR Eyes: Emotions Dataset (VREED), exploratory data analysis (EDA) and algorithms, such as linear regression analysis, classification analysis, and tree-based methods, were applied to each dataset. The aim was to determine which method is more suitable for emotion analysis based on sensor data with high accuracy and simply predict the valence and arousal values of the user using sensor data. In addition, to confirm whether the predicted valence and arousal have a high relationship with the user’s emotions, the correlation between 10 emotions and valence and arousal evaluated by the user through self-reporting was analyzed. The user’s valence and arousal predicted using sensors can predict the user’s emotions more accurately than those responded through the survey; therefore, a new emotional dimension model can be presented in a VR environment.
This study aimed to demonstrate the potential for more accurate emotion analysis using sensor data. Furthermore, it sought to experimentally determine the most suitable algorithm for emotion analysis based on sensor data and propose a new emotional dimension model for the VR environment. The experimental results demonstrated that user emotions can be analyzed without relying on survey methods that reduce immersion. The proposed user emotion analysis method to improve VR content can be used for businesses targeting customers in various industries, such as marketing, games, education, and healthcare.
In this study, four research questions were established by dividing them into two stages to confirm that user emotions can be analyzed using sensor data measured in a VR environment.
RQ 1-1: How can sensor data be used to infer the valence and arousal of a user?
RQ 1-2: Which algorithm is best suited for emotion analysis using sensor data?
RQ 2-1: How can user emotions be classified based on the valence and arousal of a user?
RQ 2-2: Can a new emotional dimension model be developed using sensor data in the VR environment?
2. Literature Review
2.1. Emotion Analysis in VR
Emotion is a mental state caused by neurophysiological changes, and is associated with thoughts, feelings, and visual responses [
27,
28,
29]. There is no scientific consensus on the definition of emotion [
30]. Representative approaches to defining emotions divide emotions into categories and dimensions [
31]. The category method defines emotion as a separate label. The emotional model proposed by Ekman [
32] presents six basic emotions (fear, anger, sadness, happiness, disgust, and surprise) based on facial expressions. In the emotional model of Plutchik [
33], two classes (trust, anticipation) are added to express emotions by the combination of basic emotions and the difference between arousals. A representative dimensional method, i.e., Russell’s circumplex model [
34,
35], defines emotion by expressing it as a dot in the dimension using valence, which represents a measure of positive and negative emotions, and arousal, which represents a measure of high and low emotions. In the case of a category method that presents 10 basic emotions and 56 secondary emotions, such as Feidakis et al. [
36], there is a limitation that evaluation becomes difficult when the types of emotions increase because emotions are directly labeled [
9]. Additionally, in the case of similar emotions, the measured parameters are duplicated, making it difficult to classify emotions [
9]. Therefore, most studies evaluating emotions focus on the dimension method that includes the valence and arousal of emotions [
9].
There are two main ways to classify emotions: measuring emotions using a self-reporting survey and measuring emotions through various types of information from the human body using a machine [
9]. First, a survey method that measures emotions through a category method is popularly used in emotion analysis as it is easy to implement; however, there is a disadvantage that emotional distortion may occur in the measured emotion owing to the respondent’s deliberate selection of the wrong emotion [
37]. In addition, if the survey is long, respondents tend to answer carelessly because they need to pay attention for a longer time [
38]. It is necessary to verify that the measured emotions are not distorted owing to the administration of the questionnaire [
8]; however, this idea is difficult to grasp. In a VR environment, it is necessary to remove the VR device to conduct a survey, which makes it difficult to measure the user’s exact emotion because immersion in the VR environment is broken [
8]. Therefore, the nonquestionnaire survey method should be used to take advantage of the high immersion of VR.
The nonquestionnaire survey method measures human emotions using various physiological sensor data, such as ECGs [
11,
12] and brain waves [
13,
14,
15,
16,
17,
18], as well as speech [
39,
40], visual facial expressions [
41], and behavioral movements, such as gaze processing from the human body [
19,
42]. Sensor data can prevent users from choosing careless answers because immediate responses can be checked, and dimensional methods are used to distinguish emotions. However, most studies using sensor data have used EEG, but owing to the nature of data, it is not easy to use in VR environments. Emotion analysis studies using various sensor data have also been conducted; however, related studies are insufficient for these sensors owing to the lack of the datasets collected in VR environments. Therefore, to conduct emotion analysis in a VR environment, a nonquestionnaire survey method that can easily collect data while users use the content and is easy to analyze simultaneously is required.
2.2. Importance of Immersion in VR Contents
Immersion is the most important criterion for evaluating how well the VR content is created [
7]. VR allows users to experience it indirectly by providing a virtual environment that is different from reality and is used in various fields, such as games, movies, education, and medical care, based on a high sense of reality. Accordingly, to take advantage of VR, it is necessary to provide a sense of reality such that a given virtual environment can feel real. Bowman et al. [
4] studied the benefits of immersion from content provided in a VR environment and revealed that proper immersion had a positive effect on spatial understanding and interaction task performance. In addition, higher immersion can reduce information confusion. These characteristics show that immersion [
7], used as a measure of user satisfaction with service use, is applied equally in VR environments. Kim et al. [
5] showed that VR content in undergraduate education can be used to induce more active participation, as students are more immersed than in conventional 2D video methods. These characteristics indicate that when VR application conducts emotional analysis to receive better evaluation from users, a method that does not reduce immersion is needed.
Various studies were conducted to analyze the emotions of users by measuring user data from VR devices [
16,
17,
18,
19,
43]. However, because of the popularity of the surveys, several studies have used them in VR environments without considering immersion, and it has not been possible to solve the problem of increasing the possibility of classifying false emotions owing to distortions caused by reading and answering a questionnaire about what users felt while using VR content [
8]. To solve this problem, by constructing a survey environment within a VR environment, a study was conducted to prevent the reduction of immersion without removing VR devices; however, the reduction of immersion could not be completely prevented because of the characteristic of the survey method [
8]. Finally, to conduct accurate emotion analysis in a VR environment, it is necessary to maintain user immersion using a nonquestionnaire survey method. A representative reason for the use of VR by users is that the VR content provides a high sense of immersion. Therefore, it is crucial to avoid any decline in immersion during emotion analysis. As immersion is ultimately used to develop VR content that users want [
7], we intend to show that emotion analysis is possible with high accuracy while maintaining immersion in a VR environment.
3. Method
3.1. Overview of Analysis
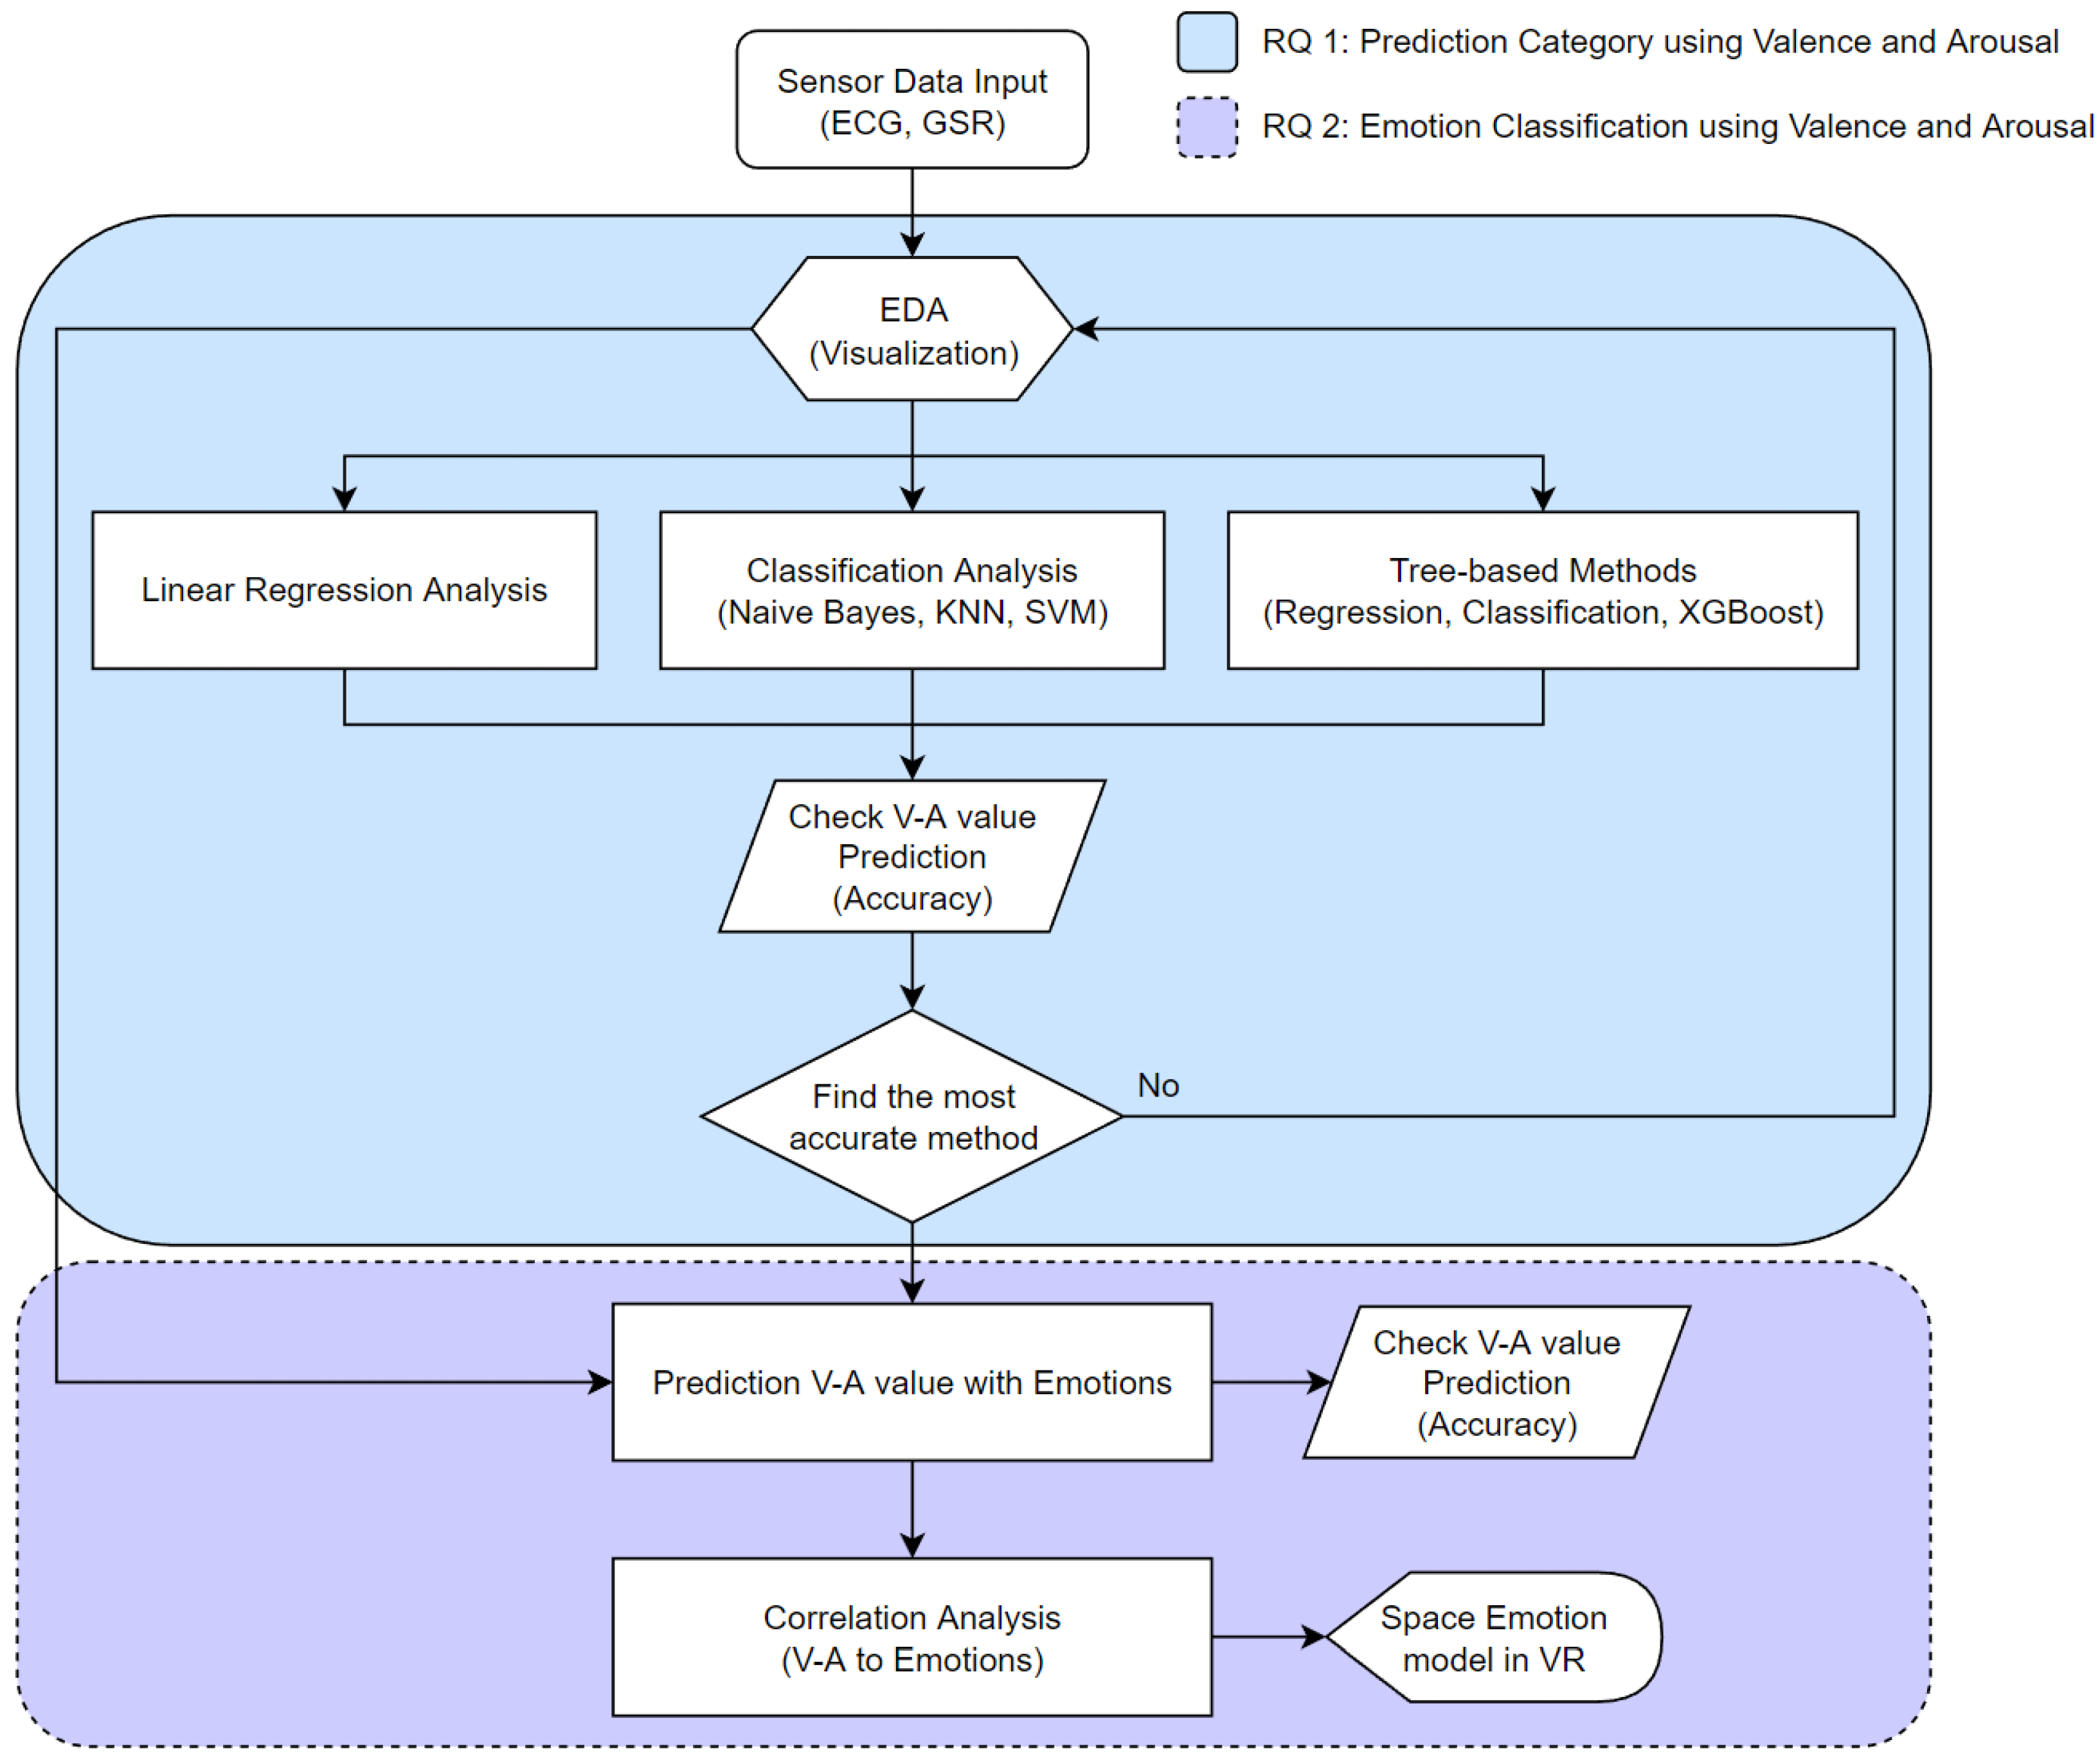
The framework of the emotion analysis method using sensor data proposed to answer each RQ stated earlier is shown in
Figure 1.
In the first step, we attempt to infer the valence and arousal values of the user using the sensor data of the user who viewed the VR video to infer the category of the video viewed by the user. The VR video viewed by the user is classified into four categories according to the height of the values of valence and arousal. If the category can be predicted through the measured sensor data values, the valence and arousal values of the user can be determined. To prove this, we intend to analyze the correlation between each sensor’s data and the valence and arousal values using various algorithms, and further check the algorithm with the highest category prediction accuracy to identify a suitable method for performing emotion analysis from the given sensor data.
In the second step, we intend to demonstrate that emotion classification is possible by confirming that the previously predicted valence and arousal values are closely correlated with the emotions felt by the user. An experiment was conducted to predict the valence and arousal values of the user for each emotional value using a method that showed high accuracy in the first step. The purpose of this experiment was to analyze how the valence and arousal values correlate with each emotion, and to confirm that the user’s emotions can be inferred from the valence and arousal values. The results of the experiment also showed that a new emotional dimension model can be presented based on the VR environment.
3.2. VREED
VREED [
25] is a dataset measured in a VR environment and is the first open dataset to integrate various types of data [
44]. An emotional dataset was measured in immersive 360° video-based virtual environments (360-VEs) with 34 participants equipped with VR headsets. The dataset was finally composed of 26 participants and 312 trials, excluding eight participants with low data quality owing to technical problems in the collection process. Six HCI and psychology experts set the selection criteria to select the appropriate 360-VEs for users, and 12 applicants evaluated the valence and arousal of each 360-VE using the self-assessment manikin [
24] and visual analog scale [
43] to select 12 360-VEs finally. The selected 360-VEs were classified into four categories (0 = high arousal, high valence; 1 = low arousal, high valence; 2 = low arousal, low valence; and 3 = high arousal, low valence) according to the values of valence and arousal.
Self-reported data of one’s emotions and valence and arousal values, along with behavioral (eye tracking) and physiological signals (ECG and GSR), were extracted from users viewing the classified 360-VEs. Among them, the ECG data consisted of the category value of the video viewed by the experimenter and 18 features (Mean, Min, Max, MeanRR, MedianRR, MinRR, MaxRR, LF, HF, VLF, Ibi, Bpm, Sdnn, Sdsd, Rmssd, Pnn50, Pnn20, and Pnn50Pnn20) in
Table 1. Similar to the ECG data, the GSR data consisted of the category value of the image viewed by the experimenter and eight features (Mean, SD, Variance, Minimum, Maximum, Number of Peaks, Number of Valleys, Ratio) in
Table 2. Self-reported data consist of data directly evaluated by the user through the survey method after viewing 360-VEs, which are divided into the degree of valence and arousal values (1 = low, 9 = high) and the degree of 10 emotions (joy, happiness, calmness, relaxation, anger, disgust, fear, anxiety, sadness, dizziness) (0 = low, 100 = high).
3.3. Prediction of Category Using Valence and Arousal
First, to prove whether the user’s valence and arousal can be measured using sensor data (RQ 1-1), an experiment was conducted to predict the category of the 360-VEs viewed by the user using the ECG and GSR sensor data. The sensor data measured while the user is viewing the 360-VEs are expected to be closely related to the video category viewed by the user. The video category is classified by the values of valence and arousal, and if the category of 360-VEs viewed by the user can be predicted through sensor data, the valence and arousal values of the user can also be predicted. As studies [
45,
46,
47] on several emotion dimension models have revealed that the values of valence and arousal are closely related to human emotions, if the sensor data can be used to predict the valence and arousal values of the user, the user’s emotions can be roughly inferred even without the user’s self-reporting response.
Therefore, various algorithms based on EDA, linear and logistic regression, and tree-based methods were used for VREED ECG and GSR sensor data, which were used for feature extraction, to predict the valence and arousal values (RQ 1 part of
Figure 1). All the experiments were performed using 10-fold cross-validation. First, we confirmed whether category prediction using the features of each sensor’s data was possible using linear regression analysis. In this method, variables of significant importance were identified by confirming high accuracy through a combination of several features and the individual features of each sensor’s data.
Second, classification by applying logistic regression analysis was conducted to compare the accuracy of the naive bayes, K-nearest neighbor (KNN), and support vector machine (SVM) methods. In the logistic regression analysis, based on the model using all the variables of the sensor data, the importance of predicting the valence and arousal values of each variable was analyzed based on the feature importance and
p-values [
48] of each variable, and an experiment was conducted to remove variables of low importance. After confirming the accuracy of the model using only the highly influential features based on the importance of the variable, additional experiments were conducted using the linear discriminant analysis (LDA), quadratic discriminant analysis (QDA), and KNN algorithms. In the case of the KNN, after confirming a suitable K value from 1 to 20, the performance of the model was confirmed based on the K value with the highest accuracy.
Finally, accuracy was measured experimentally using the tree-based regression, classification, and extreme gradient boosting (XGBoost) algorithms. In the tree-based methods, regression and classification trees were applied to confirm the appropriate method for emotion analysis using sensor data, and the accuracy of the model was compared by applying the XGBoost algorithm, which showed high accuracy based on the tree-based method.
Emotion analysis using sensor data is possible by analyzing the individual features of each sensor’s data using these methods. Thus, it is possible to check which algorithm is suitable by checking the characteristics of the sensor data that are important for analyzing the user’s emotion (RQ 1-2).
3.4. Prediction of Emotions Using Valence and Arousal
After predicting the valence and arousal values of the user from the sensor data, the correlation was verified to prove that the values were closely related to the user’s emotion (RQ 2-1). First, an experiment was conducted to predict which category of 360-VEs was viewed by the user based on the 10 emotion values answered by the user through the survey while viewing the 360-VEs. In addition, the feature importance for the emotions was compared to confirm whether the emotions the user felt were closely related to the valence and arousal values.
After viewing the 360-VEs, the users answered the valence and arousal values they felt through the self-reporting method, in addition to the video category. An experiment to predict the categories based on these answers was conducted in parallel to check for differences. As the category of the 360-VEs viewed by the user does not necessarily match the emotion felt by the user, it is necessary to confirm through an experiment that there is a high correlation between the user’s direct feelings and the valence and arousal values, even in the form of a survey.
In addition, the correlation between the valence and arousal and each emotion was confirmed through an experiment using the predictive model. A new emotional dimension model was presented by representing each emotion on the coordinate plane of valence and arousal based on the correlation value. Through this emotional dimension model, we can intuitively check how the values of valence and arousal were related to each emotion felt by the user; therefore, RQ 2-2 will be answered.
4. Results
4.1. Prediction of Category Using Valence and Arousal
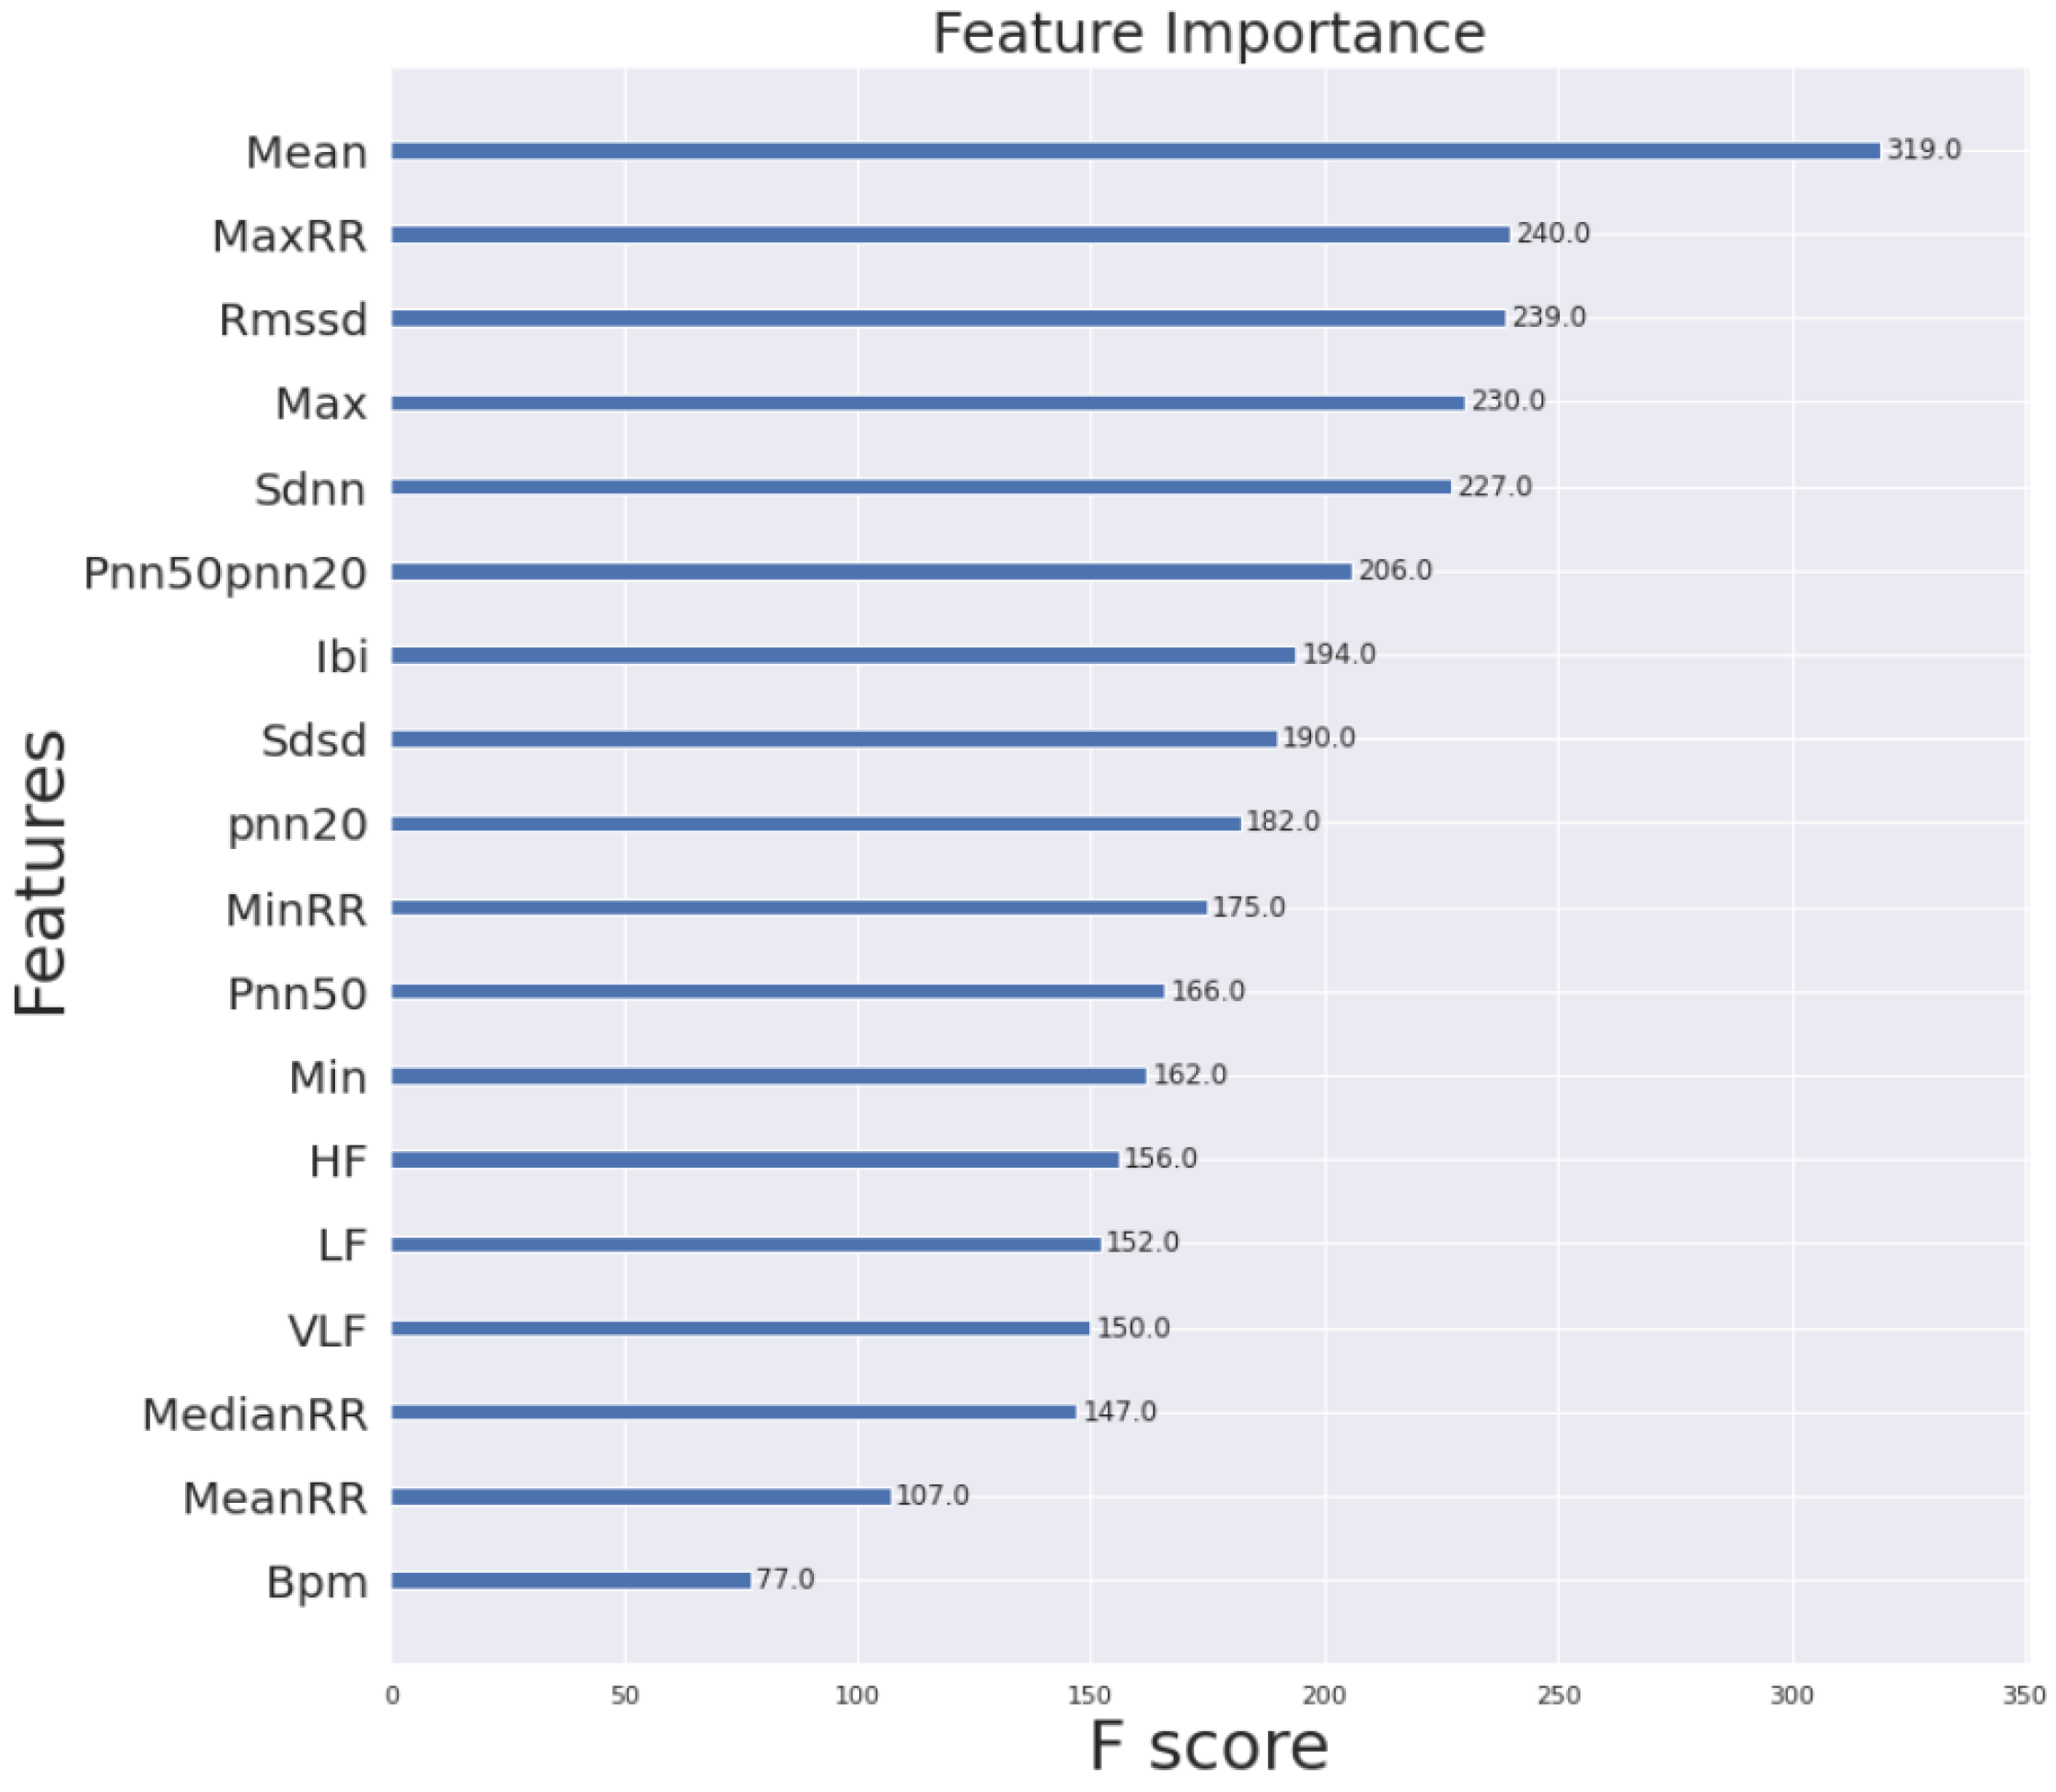
When predicting valence and arousal using ECG and GSR sensor data, the XGBoost algorithm was used to confirm the importance of each feature of the sensor data for the prediction. The ECG sensor data showed the highest feature importance with the Mean value among the 18 features, and showed a difference of approximately four times more than the lowest Bpm (
Figure 2). The Mean value among features of ECG data were used as important variable when predicting valence and arousal; however, in the case of bpm feature, the predictive influence was relatively low.
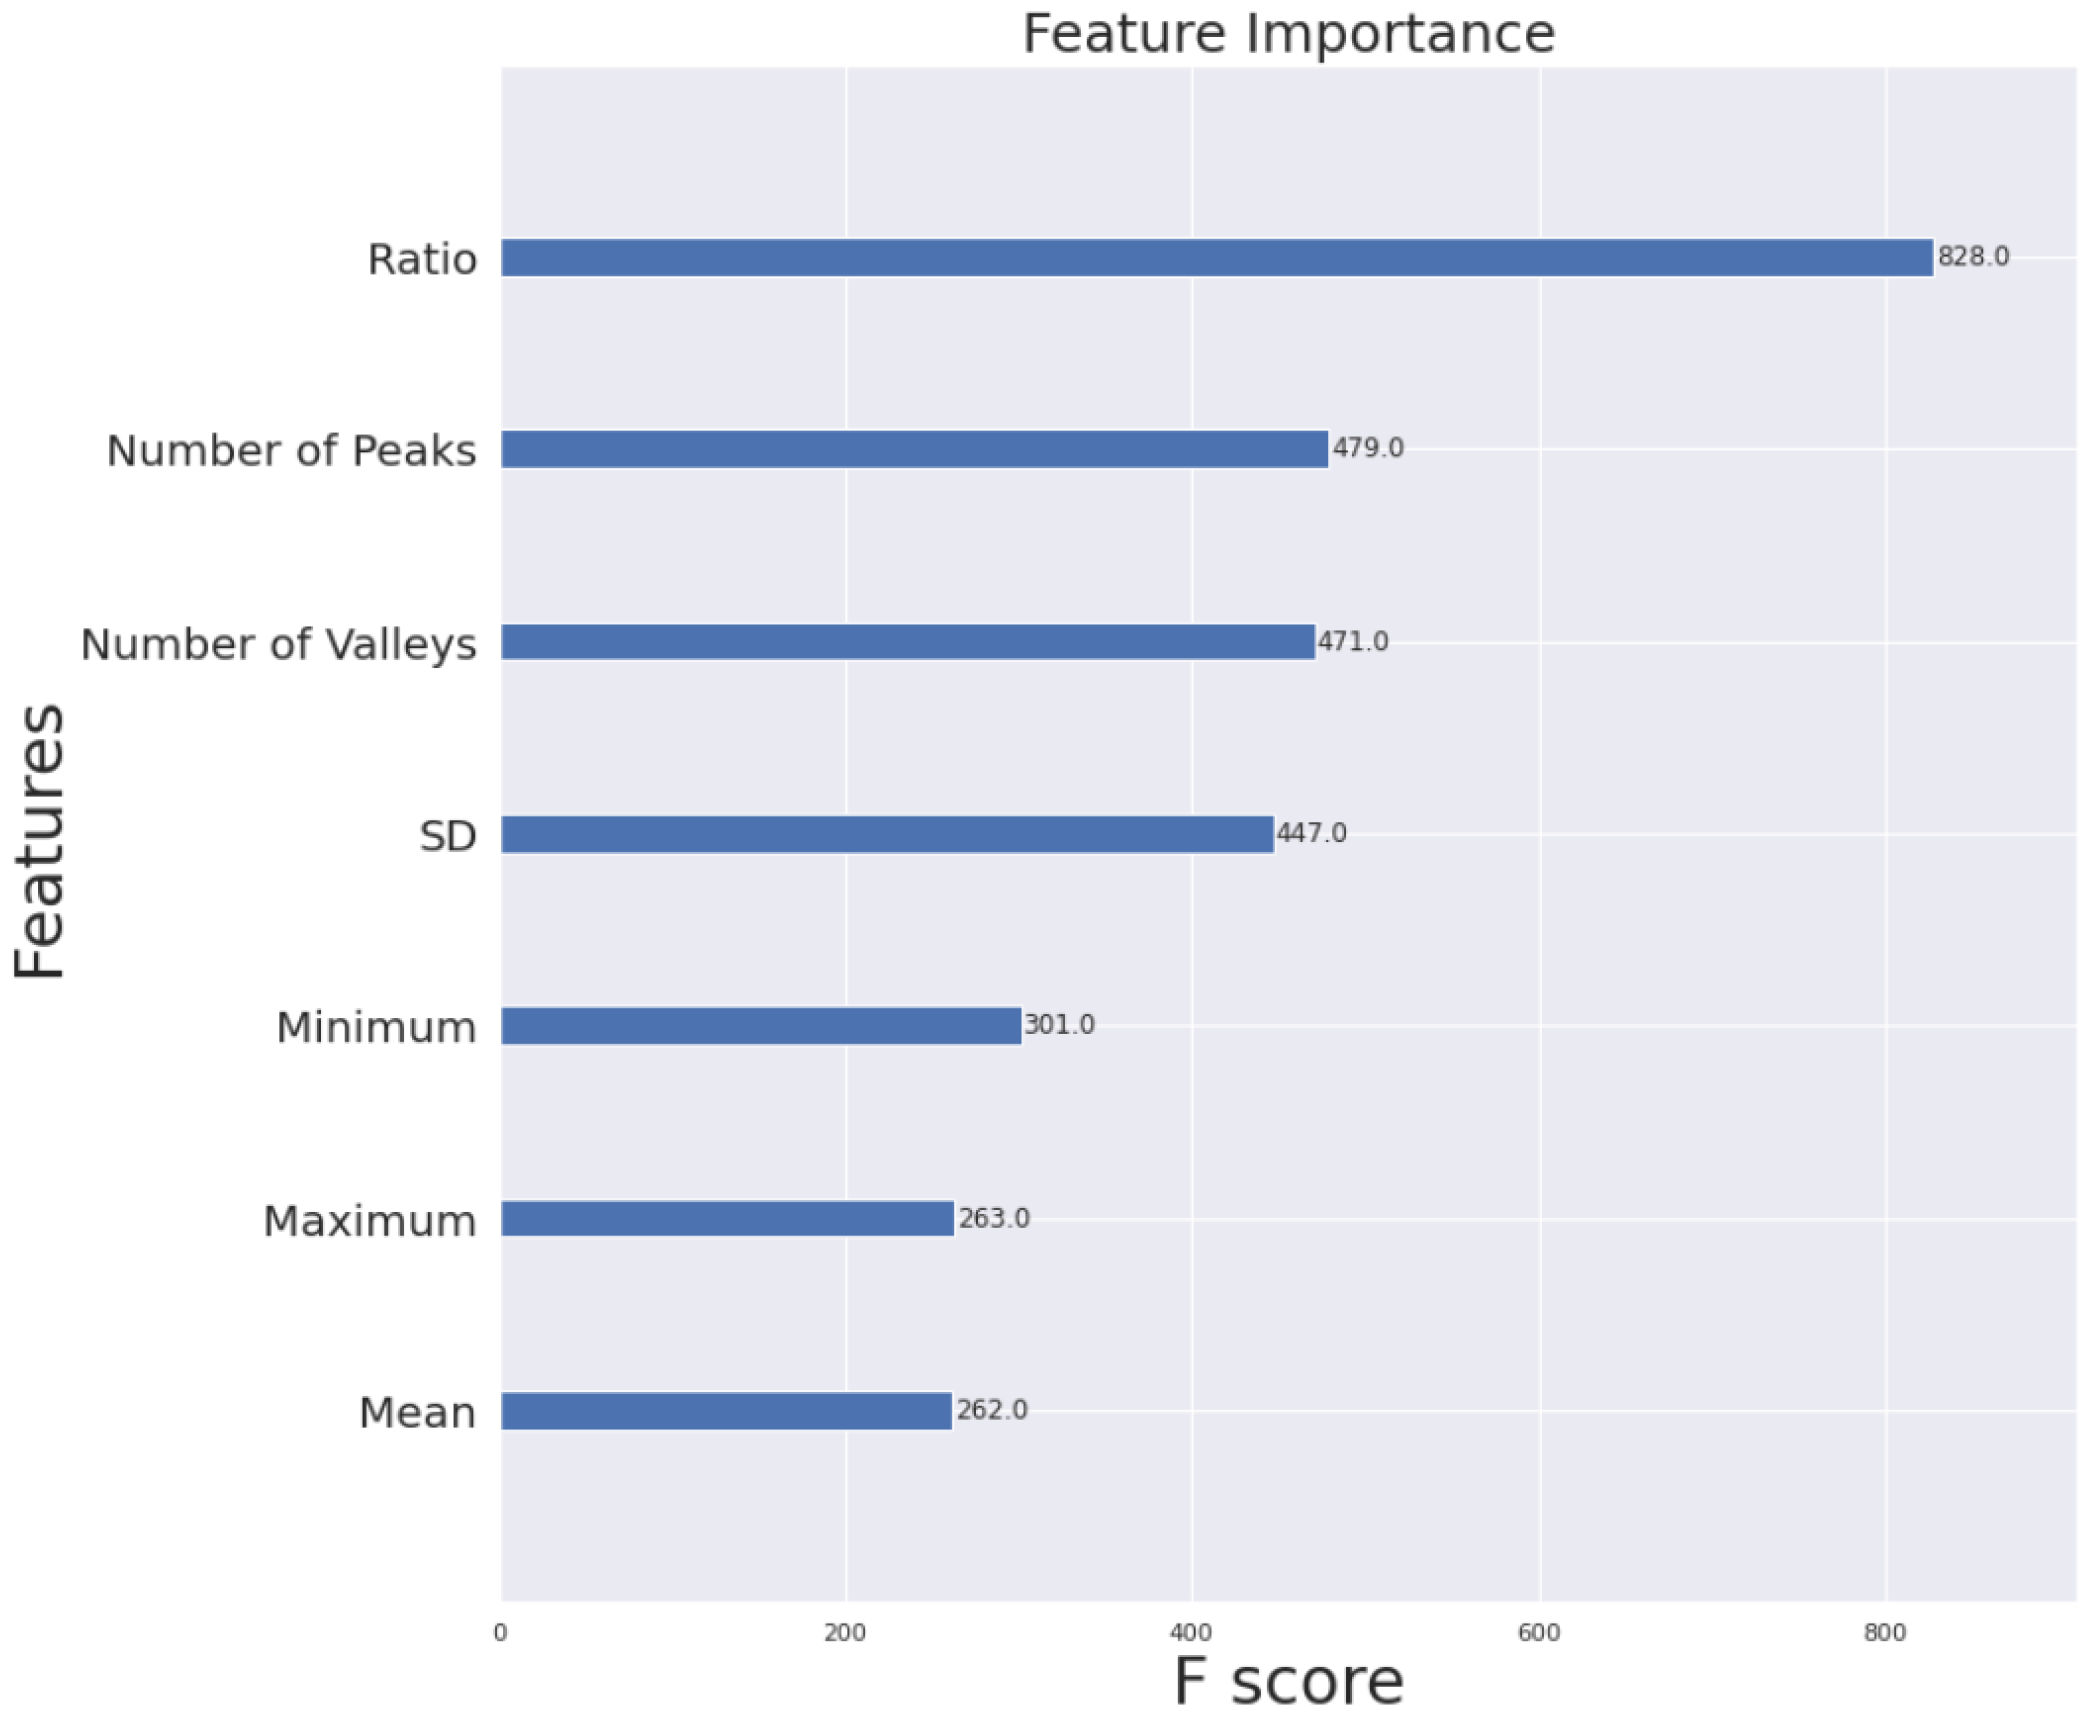
For the GSR sensor data, the ratio value showed the highest feature importance among the seven features and shows a difference of more than three times the lowest Mean (
Figure 3). The Ratio feature was used most importantly in predicting valence and arousal, but features, such as Minimum, Maximum, and Mean showed low influence. In particular, in GSR with a small number of features, Ratio feature showed a high possibility of maintaining the properties of the original data even if other features were ignored.
In addition, through the logistic regression analysis, variables of significance were identified by confirming high accuracy through a combination of several features and the individual features of each sensor’s data. Each sensor dataset showed higher accuracy when reducing the number of features with lower feature importance than when using all the features, particularly in predicting arousal values using GSR, with approximately 91.5% higher accuracy (
Table 3).
Table 3 presents the results of the experiments predicting the valence and arousal values from the ECG and GSR sensor data using various algorithms, from logistic regression to XGBoost. The KNN and tree-based methods were evaluated by finding the optimal k and pruning number p, respectively, to obtain the highest accuracy; however, both sensor datasets showed lower accuracy than the SVM method. In the case of the ECG, most tree-based methods, including LDA and QDA, showed lower accuracy than the SVM methods; however, in the case of GSR, the logistic regression and XGBoost methods using fewer features showed a higher accuracy than the SVM methods. In the case of XGBoost, as a result of applying to the GSR sensor data, in the case of valence, the accuracy was approximately 77% when only the top-scoring feature was used considering feature importance; in the case of arousal, the accuracy was approximately 92.3% when all the features were used.
The results of the experiment enabled both types of sensor data to predict the valence and arousal values with an accuracy of at least 75% using multiple algorithms, particularly in the case of GSR, which showed a high accuracy of more than 90% when predicting the arousal values. Thus, RQ 1-1 was answered in that the category of 360-VEs viewed by the user can be predicted using sensor data.
In addition, by analyzing the influence of the features of each sensor’s data on the prediction of the valence and arousal values, it was confirmed that the regression tree and SVM methods showed high accuracy in the ECG sensor data, and the logistic regression and XGBoost methods limited the number of features that showed better suitability in GSR sensor data. By confirming the characteristics of the sensor data that are important for user emotion analysis, RQ 1-2 was also answered to confirm the emotion analysis algorithm suitable for each sensor’s data.
4.2. Emotions Classification Using Valence and Arousal
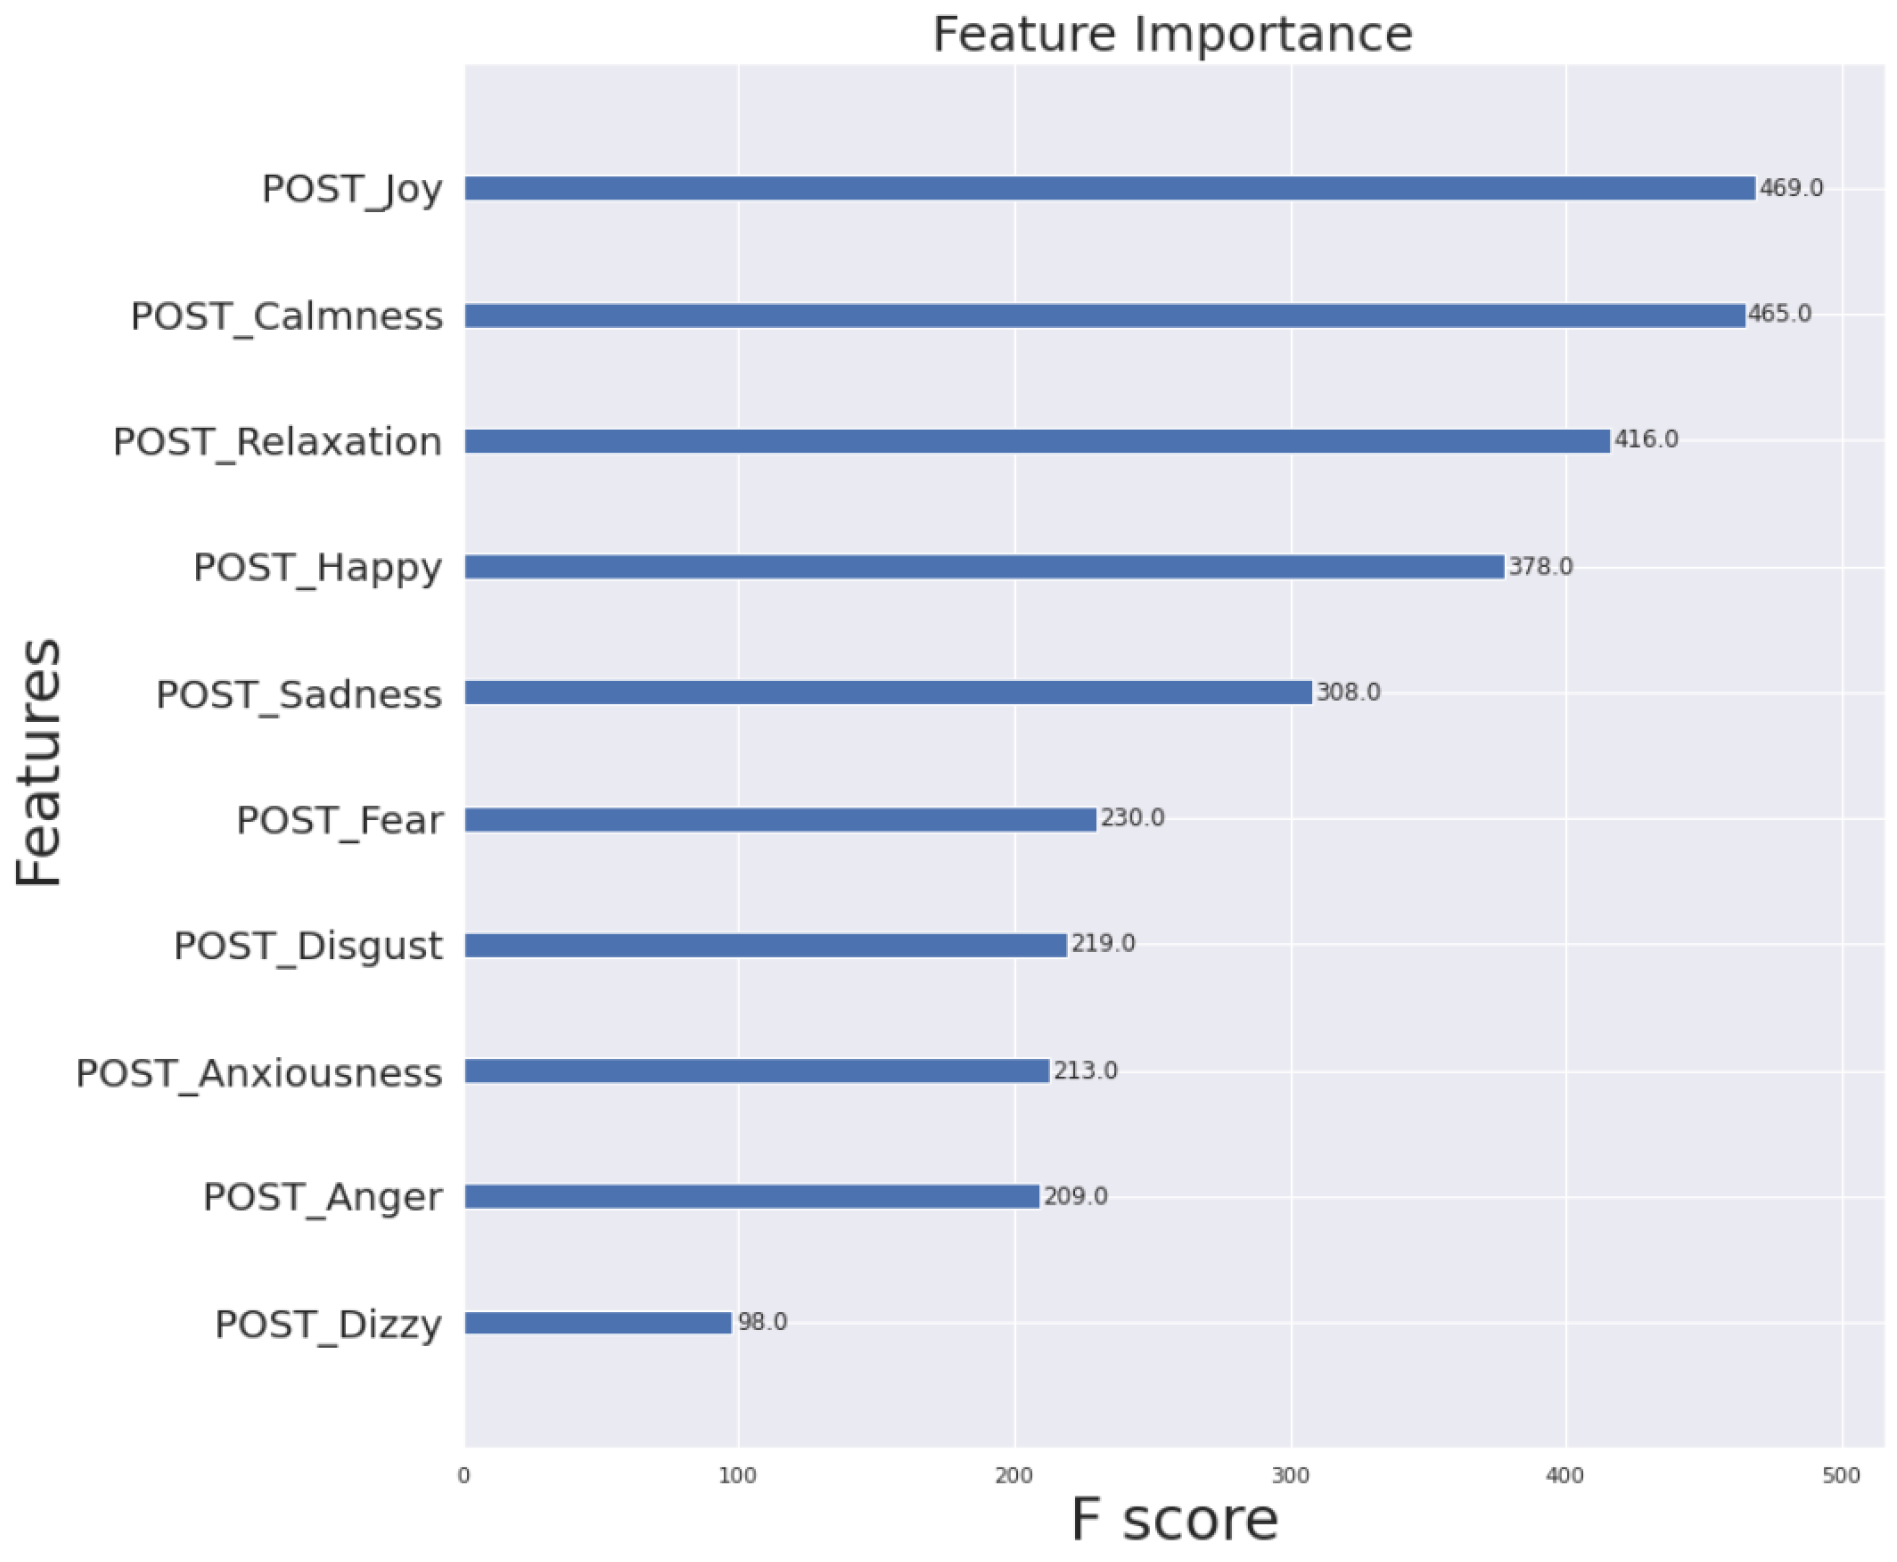
To analyze the correlation between the category of the video the user viewed and the emotions felt by the user after viewing the video, the accuracy was determined to be 71.6% by conducting a category prediction experiment using 10 emotions (
Table 4). The feature importance was calculated to confirm the influence of the emotions on the results in the prediction process. The influence of dizziness was very low compared with that of the other nine emotions (
Figure 4). Thus, dizziness had no significant influence on the classification of the category of the video viewed by the user, and the accuracy has increased to approximately 74% when predicting the category with only nine emotions, excluding dizziness (
Table 4). In addition, Post_Category was calculated based on the valence and arousal values self-reported by the user after viewing the 360-VEs, and the accuracy increased to 80.25% as a result of predicting using nine emotions.
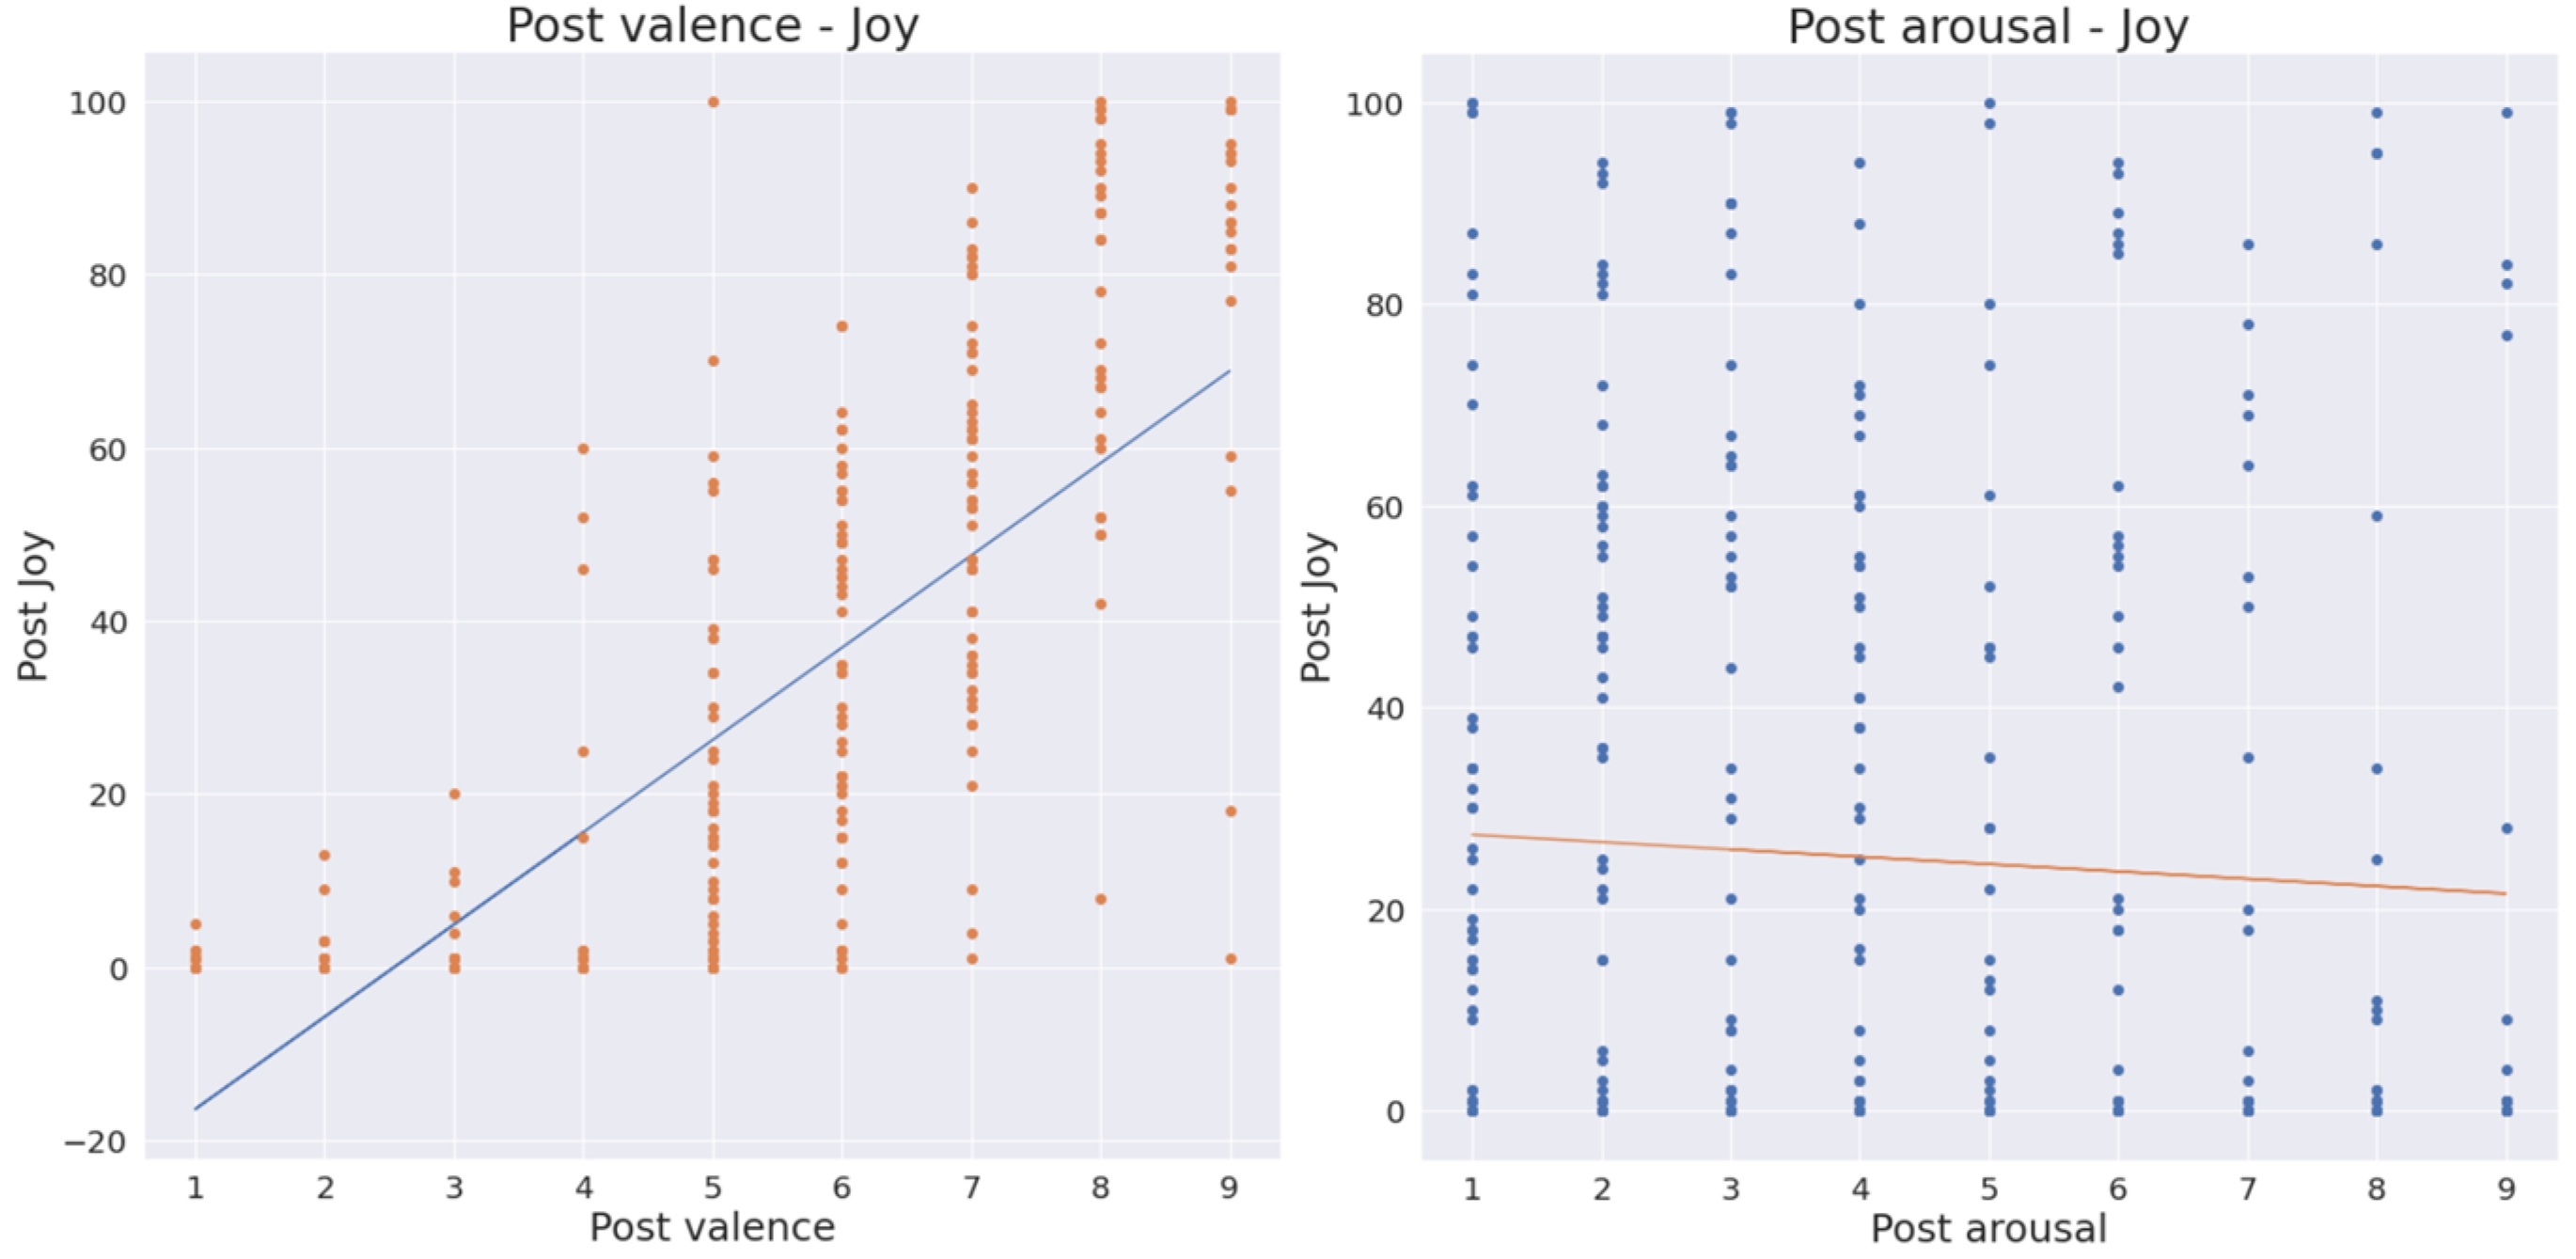
Through category prediction experiments using emotions, we observed how each of the nine emotions correlates with valence and arousal (
Figure 5). In the case of joy, a high positive correlation could be observed with valence and a low negative correlation could be observed with arousal. This indicates that the higher the valence value felt by the user, the more joy the user felt. Happiness also showed similar correlation as joy.
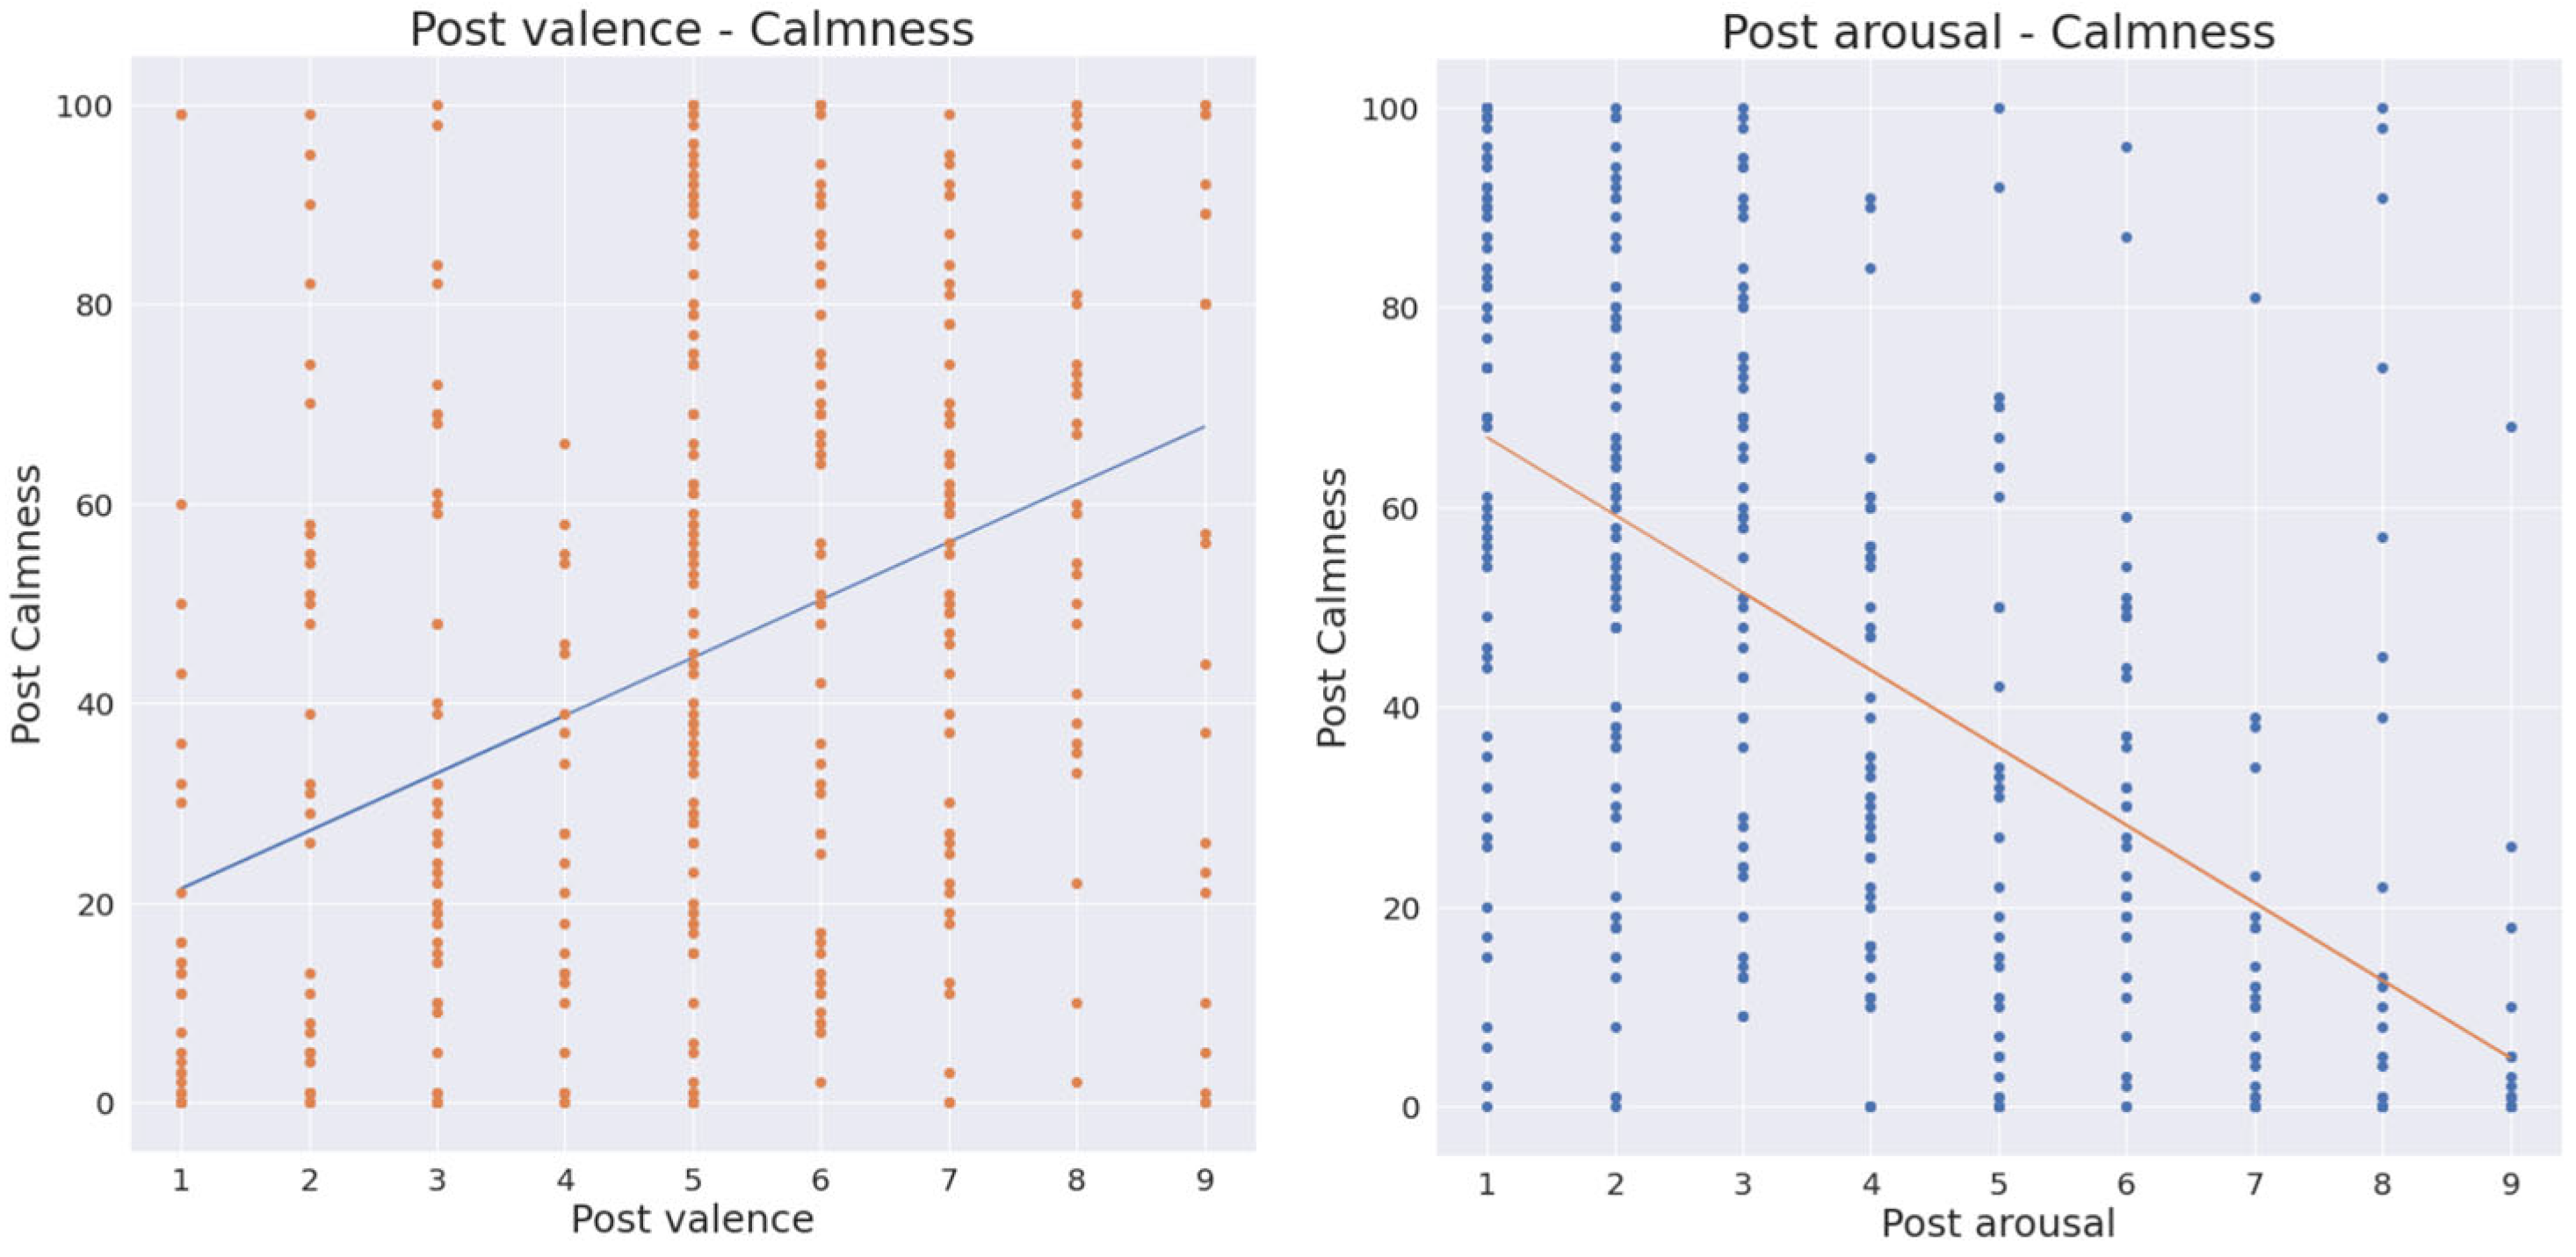
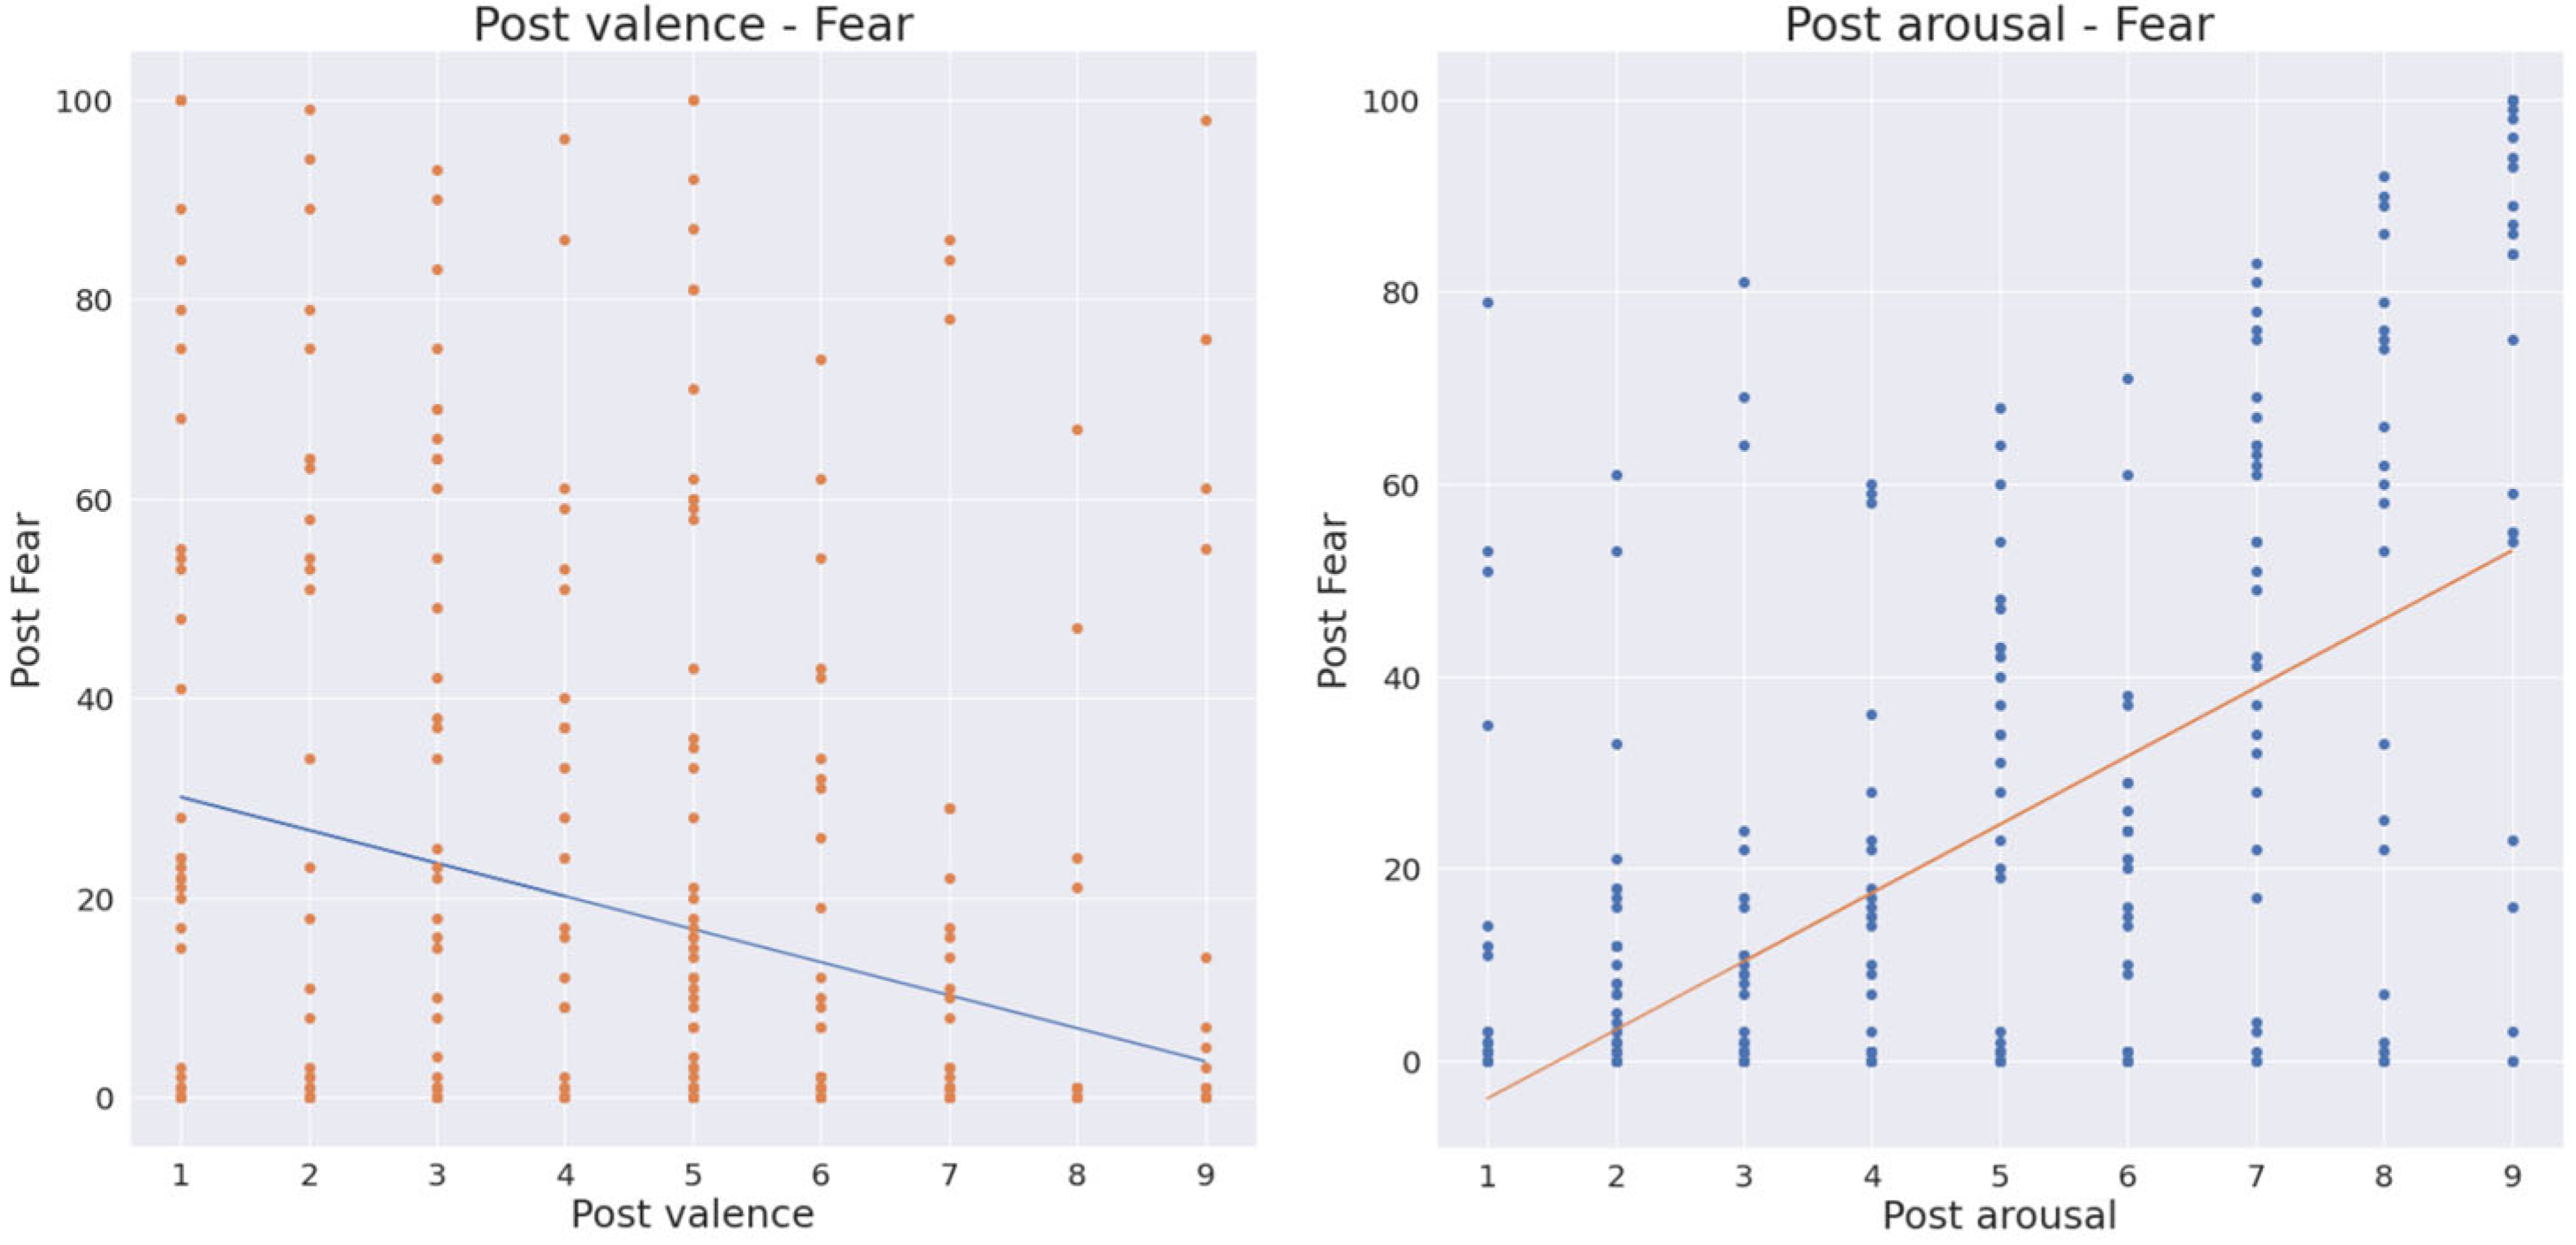
Calmness had a high positive correlation with valence, similar to joy; however, it also had a high negative correlation with arousal (
Figure 6). The results showed that emotions, such as calmness and relaxation, can be distinguished from joy and happiness through differences in arousal values. Conversely, emotions, such as fear, anger, disgust, and sadness, had a negative correlation with valence and a positive correlation with arousal. They appeared different from emotions, such as joy and calmness (
Figure 7).
Table 5 presents the values of calculating the covariance and correlation for the values of valence and arousal predicted with the nine emotions. The emotions can be divided into groups with high valence and neutral arousal, such as joy and happiness; groups with low valence and low arousal, such as calmness and relaxation; groups with low valence and high arousal, such as fear and anxiety; and groups with low valence and slightly lower arousal, such as sadness, anger, and disgust. Therefore, RQ 2-1 was answered in that the user’s emotional state can be classified according to the values of valence and arousal predicted by the sensor data.
In addition, based on
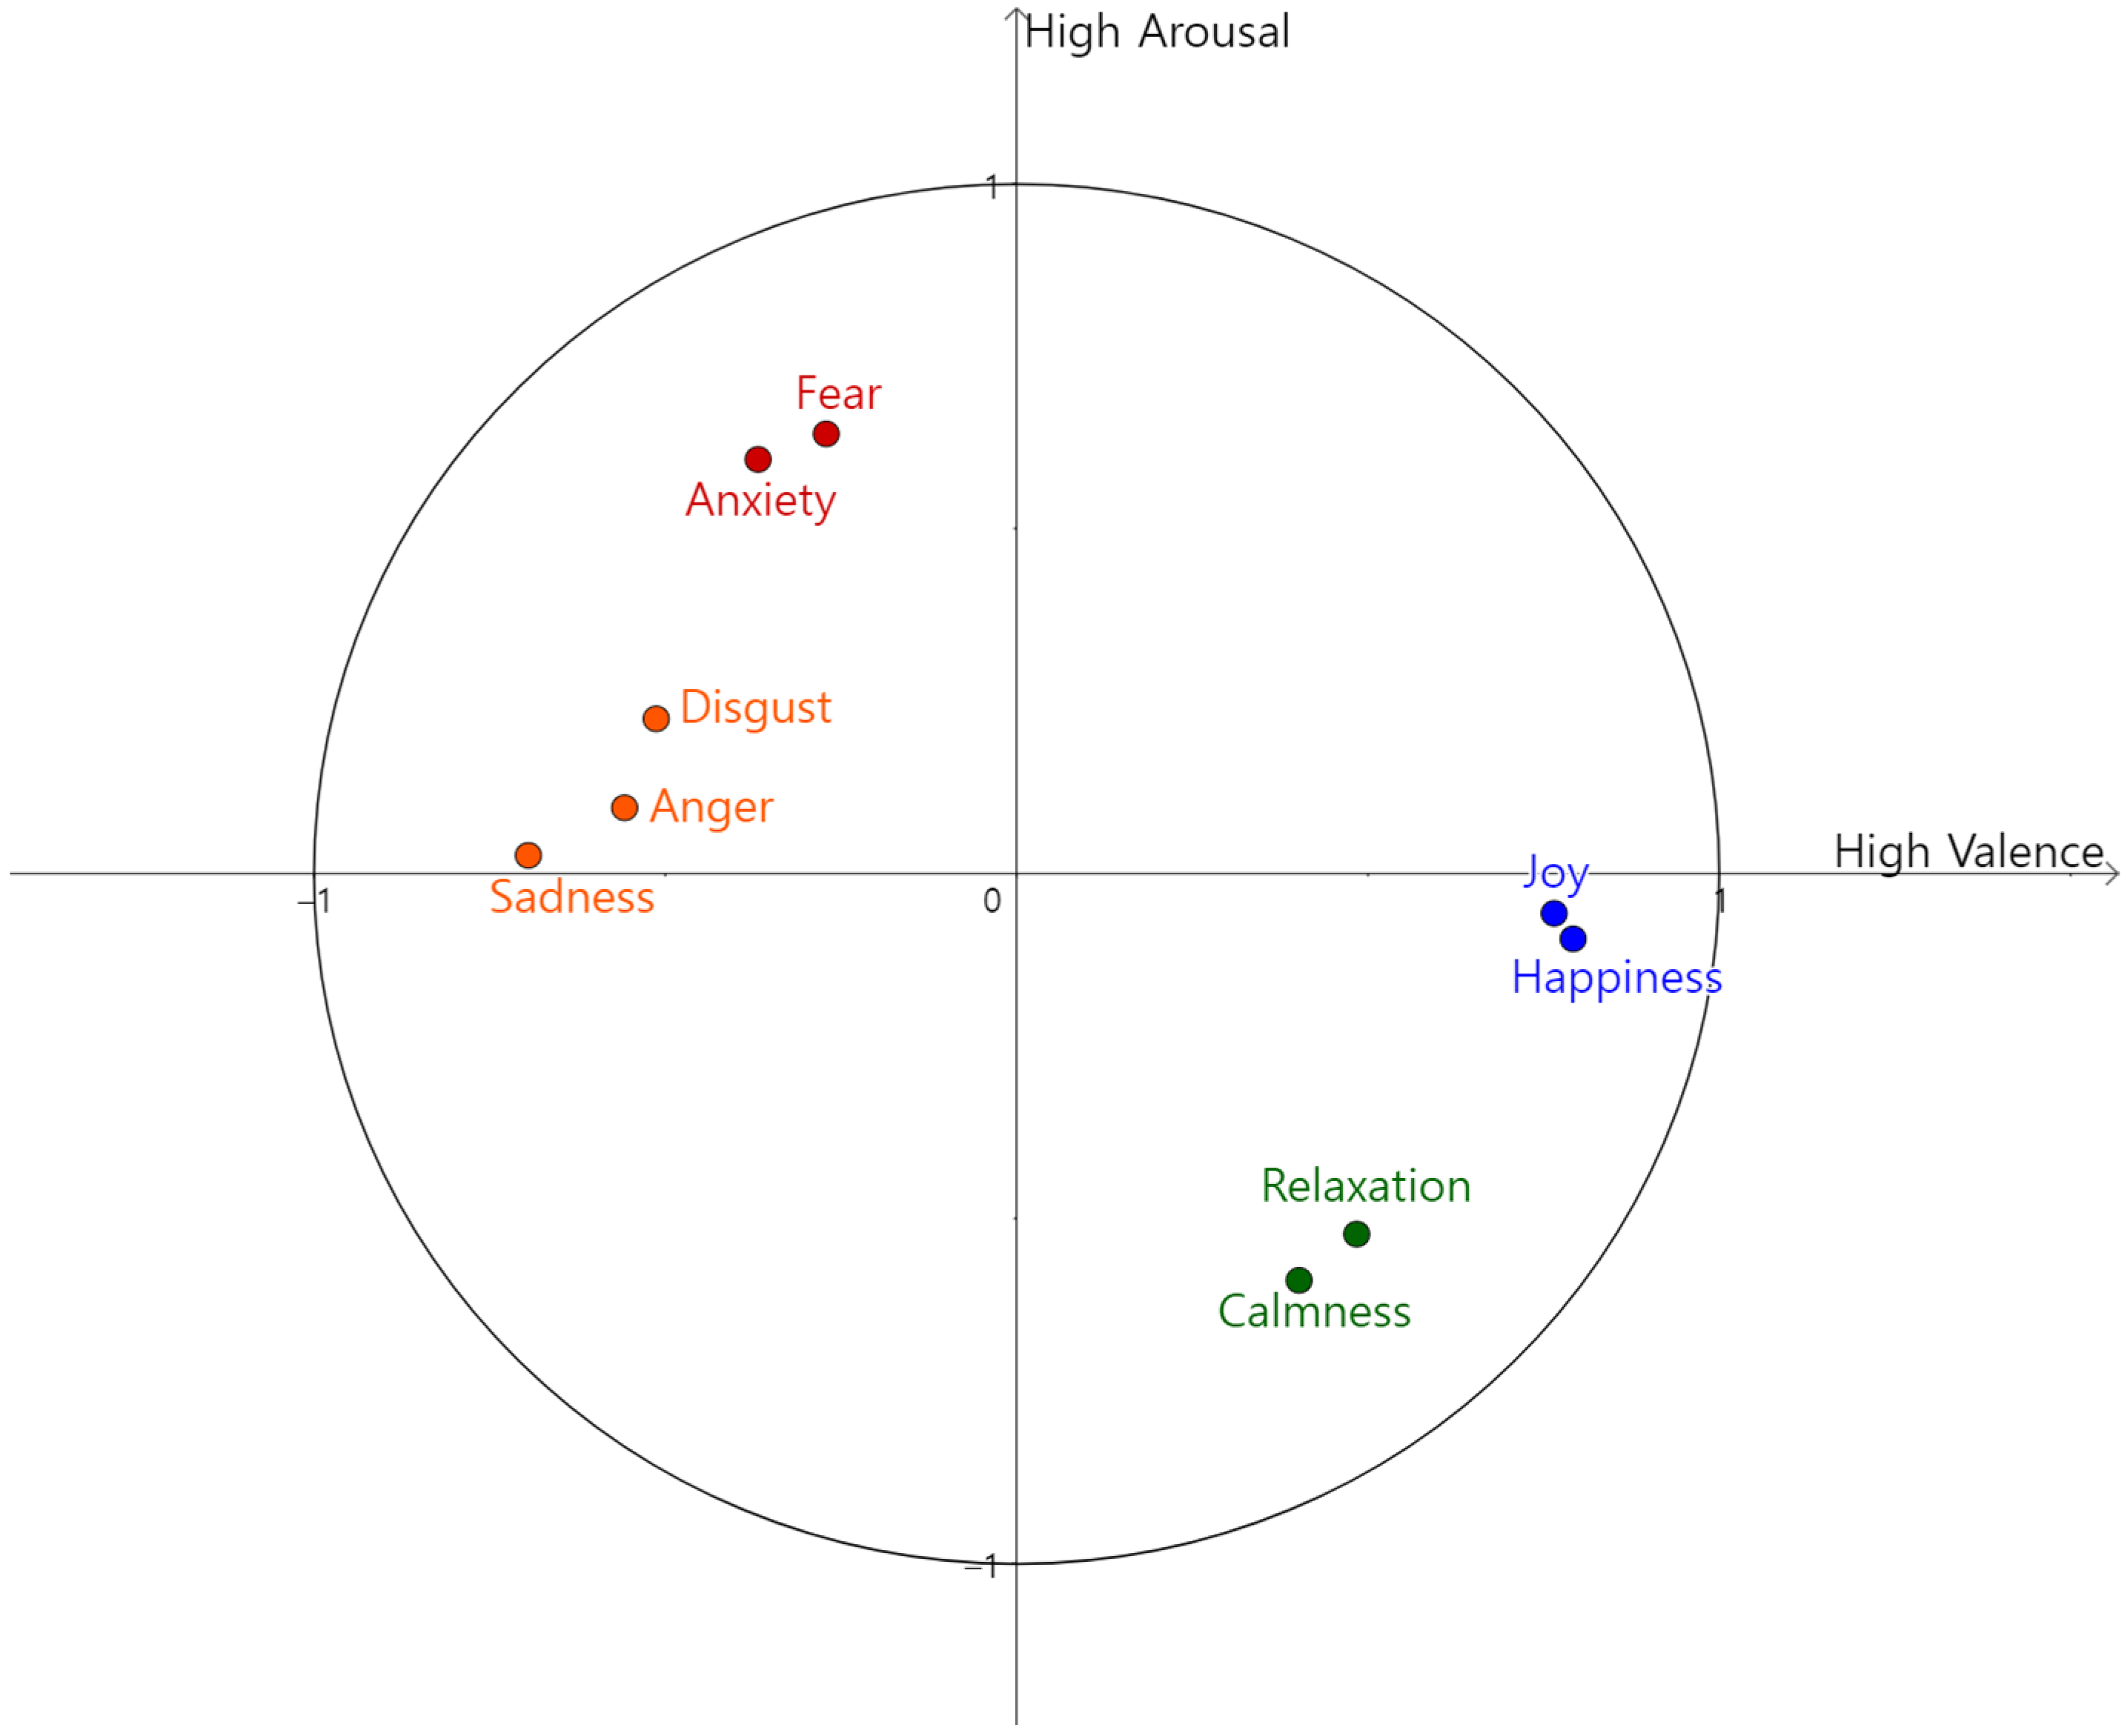
Table 5, emotions can be expressed on the coordinate plane of the valence and arousal values. We can observe how the nine emotions are classified on the coordinate plane according to their characteristics (
Figure 8).
In Russell’s circumplex model [
34], emotions, such as happiness and joy, were similar only in terms of valence; even in the proposed model, joy and happiness showed considerable similarity only in terms of valence (blue-colored emotions in
Figure 8). Emotions, such as relaxation and calmness, had a negative correlation with arousal, unlike happiness and joy, which also confirmed that the results of the two models were similar (green-colored emotions in
Figure 8). Fear had a positive correlation with arousal and a negative correlation with valence, and the results of the two models were similar because similar emotions, such as anxiety or fear, were located opposite to relaxation and calmness (red-colored emotions in
Figure 8). However, for emotions expressed in orange, there was a slight difference from Russell’s model. In particular, anger with a high arousal value was classified similarly to sadness rather than fear. Although the degree of arousal increased, the results of this model were slightly different from those of Russell’s model in terms of the classification of sadness, disgust, anger, and fear; however, most of the emotions, except for anger, were similar to Russell’s model. This allowed us to present a new emotional dimension model that could infer how a user felt using the values of valence and arousal measured through sensor data, even in a VR environment. Therefore, RQ 2-2 is also answered.
5. Discussion
In this paper, a method was proposed for analyzing emotions using sensor data to maintain a sense of immersion in a VR environment. In a survey, which is a popular method for analyzing the emotions of users in a VR environment, data can be distorted if the user deliberately selects the wrong answer. In addition, in the VR environment, the degree of immersion decreased when the VR device was removed to participate in the survey, and the emotion felt by the user could not be fully measured owing to the distortion of the user’s emotions. To solve this problem, a method of analyzing emotions that does not cause distortion in the user’s emotions was proposed using sensor data instead of a survey to prevent a decrease in immersion in the VR environment.
By checking whether the sensor data measured by the user could be used for emotion analysis (RQ 1), it was shown that the category of the video viewed by the user could be predicted more accurately when the GSR sensor data were used rather than the ECG data. This can be confirmed by analyzing the feature importance of the ECG and GSR data of the VREED because the ECG and GSR sensor data have 8 and 18 features, respectively, and the features of each sensor’s data are up to three times different. This indicates that, among the features used to predict the category of the video viewed by the user, there are features that are important and those that are not. Consequently, rather than using all the features, the method of selecting features that could be more useful for category prediction showed a higher accuracy (
Table 3).
Through the feature importance values of the data from the two sensor, algorithms that were more suitable for the ECG and GSR data were also confirmed. In the case of the ECG, each feature importance value showed similar values except for some features. Accordingly, most features play an important role in predicting the category; hence, algorithms, such as SVM and regression tree, that can make the most of influence of each feature are more suitable than simply reducing the number of features. However, in the case of GSR, the ratio feature has a higher feature importance than the other features. This indicates that, even if some variables related to the ratio are excluded, it is a very important variable when predicting the category compared with the other variables. Even when principal component analysis is performed, GSR data are concentrated in one dimension compared to the ECG data, which are generally uniform. Accordingly, it can be inferred that category prediction is possible with high accuracy even if only the ratio feature with the highest feature importance is used. Therefore, GSR data can achieve a higher accuracy than ECG data despite the relatively small number of features that can be collected, and methods, such as the XGBoost algorithm, that can remove variables with low feature importance help in obtaining a higher accuracy.
In addition, we checked whether the predicted category could be used as a user’s emotion classification (RQ 2). This also confirmed that each emotion and the valence and arousal values were closely related using the feature importance calculation. Among the emotions felt by the user, dizziness showed a lower F-score than the other nine emotions, and the feeling of dizziness in the VR environment itself does not show a direct connection with valence and arousal. According to Kaufeld et al. [
49], visibly induced motion scalability (VIMS) and the emotions felt during VR are related. Although the results of this study were inconsistent with the finding that arousal significantly increases when a user experience dizziness, the inability to reduce VIMS by using other emotions [
49] can be interpreted as dizziness being less affected by valence and arousal, unlike other emotions. This suggests that dizziness is not suitable for this study, which attempted to infer user emotions using valence and arousal, and that separate studies are required on the effect of dizziness on user’s emotions.
The results of predicting the valence and arousal values directly reported by the user through the survey showed a higher accuracy than the result of predicting the category with nine emotions, excluding dizziness. The valence and arousal values and the emotions felt by the user were closely related to each other. Even if a video category is classified using a professional method, not all users feel the same after viewing the video. As there are cases where the emotions felt by the user and the biological response do not match [
44], the limitations arising in the emotion analysis process using sensor data can be supplemented by applying the user’s expression or voice together in a VR environment. Integrating sensor data with various types of data measured from the user will be enable accurate emotion analysis without emotional distortion.
Russell’s emotional dimension model represents each emotion as a single dot. Human emotions have personal differences owing to various environmental factors. It is difficult to classify emotions accurately because various emotions are mixed and high dimensional [
35,
50]. Cowen et al. [
50] argued that emotions are high-dimensional, they contain more than 25 different types, and each emotion has a unique pattern profile for the relevant response. Therefore, the limitations of existing emotion dimension model can be resolved by analyzing the correlation between valence and arousal for each emotion and then applying various methods, including surveys. Moreover, each emotion can be clustered using valence and arousal, which completely excludes surveys in an unsupervised learning method that does not label emotions. Through this, a pattern for each of various types of emotions will be identified, and complex emotions can also be inferred.
Finally, by designing an emotional dimension model using the correlation between the nine emotions and valence and arousal (
Figure 8), emotions can be classified like Russell’s emotion dimension model [
34]. However, all nine emotions collected in the VREED were located only in high valence & low arousal and low valence & high arousal areas, and not in places where both valence and arousal were high or low. However, for the nine emotions presented, emotions with common characteristics could be classified according to the values of valence and arousal. In the case of emotions with opposite properties, such as joy, sadness, anxiety, and calmness, the difference could be distinguished. This indicates that, even in a VR environment, emotions can be presented according to the valence and arousal values predicted through sensor data based on Russell’s emotion dimension model.
6. Conclusions
In this study, we prevent the reduction of immersion in the VR environment by analyzing the user’s emotions using sensor data, which is a non-questionnaire survey method. First, we confirmed whether the user’s valence and arousal could be inferred using sensor data (RQ 1-1), and which algorithms that can be predicted with high accuracy from ECG and GSR sensor data were confirmed through comparative experiments (RQ 1-2). We also confirmed whether the predicted valence and arousal are related to the user’s emotions (RQ 2-1), and it was shown that emotion analysis using sensor data is possible by presenting an emotional dimension model of the VR environment (RQ 2-2).
In this study, by analyzing the features of data from two sensor, a method specializing for each sensor’s data was proposed, and emotion analysis was possible in a VR environment. As this method can be applied to new data that can be collected in a VR environment, even if the types of data that can be collected increase with the development of VR technology, this method can be used immediately for emotion analysis to check whether the data are valid. Emotion analysis using specialized sensor data can also be used in psychotherapy to grasp a user’s psychological state more accurately.
In addition, a decrease in immersion can be prevented because user emotions are analyzed without using surveys. Thus, this method can be used to improve VR content by checking the accurate and objective responses of users who use VR content. It also saves the time and effort required to conduct surveys by automating emotion analysis using sensor data. This also helps in solving the problem of changing the survey content when changing the VR content. Furthermore, as sensor data are based on physical reactions or physiological changes, they can measure user’s emotions without distortion, which helps overcome the limitations of emotional distortion occurring in the survey method. If the user’s emotions can be quickly and accurately grasped without compromising immersion, developing various contents using the advantages of VR devices is possible. This can be applied to VR psychotherapy, where accurate measurement of the user’s emotions is important, or to develop virtual characters that can interact with the user’s emotions.
However, the proposed method has some limitations. Although our study attempted to exclude surveys that reduced immersion, labeling emotions was essential for analysis because of the absence of a scientific consensus on the definition of emotions. Hence, data measured through user surveys were used for each emotion value. However, there was still a limitation in that user’s emotions may not be accurately expressed in the process. This corresponds to all datasets collected using survey methods from users; to overcome this, results can be analyzed through comparison with various datasets or solved by comparison with studies that have proposed other methods using popular datasets. As few sensor datasets have been collected in a VR environment, the survey method can be excluded by analyzing the patterns of each sensor’s data through clustering using an unsupervised learning method as a follow-up study.
In addition, in this study, only single-sensor data were analyzed, but the results from multimodal data incorporating data from various sensors were not analyzed. When applying data according to the proposed method, the feature importance value is checked to remove variables with low influence from the analysis. The proposed method may not be appropriate because the number of variables collected in the multimodal data is very large. Therefore, even with multimodal data collected in the VR environment, the proposed method can be used to find out which algorithm is suitable for that data. This study confirmed that valence and arousal play an important role in classifying emotions in the VR environment. This indicates that if valence and arousal can be inferred with different types of data, emotion analysis is possible in a new environment. We will confirm through subsequent studies whether different data, such as voice text or eye tracking, can be integrated.
Finally, in the new emotional dimension model proposed herein, nine emotions were located only in a specific quadrant; therefore, the proposed model did not show various types of emotions, similar to the existing emotional dimension model. The nine emotions used in the emotional dimension model were not located in the high valence & high arousal quadrant or in the low valence & low arousal quadrant (
Figure 8). However, repeated findings indicate that biological markers correspond closely to the two main emotional experience dimensions identified by emotion research through psychometrics. Researchers using uniform emotional stimuli have noted that changes in peripheral physiological reactions to these stimuli align progressively with self-reported assessments of valence and arousal [
51,
52,
53,
54]. This indicates that in addition to the nine emotions presented, various emotions can be inferred using valence and arousal through sensor data. In future studies, by adding various emotions suggested by the existing emotion dimension model, we will determine the analysis results that can be obtained for emotions, such as excited emotions, with both high valence and arousal, or bored emotions, with both low valence and arousal. Thus, various types of emotions can be classified using sensor data in a VR environment, as in the existing emotion dimension model.


