Article

An Attention-Driven Multi-Scale Framework for Rotating-Machinery Fault Diagnosis Under Noisy Conditions

1
Department of Electromechanical Engineering, University of Macau, Taipa 999078, Macau
2
The Hainan Institute of Zhejiang University, Zhejiang University, Sanya 572025, China
*
Author to whom correspondence should be addressed.
Electronics 2025, 14(19), 3805; https://doi.org/10.3390/electronics14193805
Submission received: 19 August 2025 / Revised: 5 September 2025 / Accepted: 10 September 2025 / Published: 25 September 2025
(This article belongs to the Special Issue Advances in Condition Monitoring and Fault Diagnosis)

Abstract

Failures of rotating machinery, such as bearings and gears, are a critical concern in industrial systems, leading to significant operational downtime and economic losses. A primary research challenge is achieving accurate fault diagnosis under complex industrial noise, where weak fault signatures are often masked by interference signals. This problem is particularly acute in demanding applications like offshore wind turbines, where harsh operating conditions and high maintenance costs necessitate highly robust and reliable diagnostic methods. To address this challenge, this paper proposes a novel Multi-Scale Domain Convolutional Attention Network (MSDCAN). The method integrates enhanced adaptive multi-domain feature extraction with a hybrid attention mechanism, combining information from the time, frequency, wavelet, and cyclic spectral domains with domain-specific attention weighting. A core innovation is the hybrid attention fusion mechanism, which enables cross-modal interaction between deep convolutional features and domain-specific features, enhanced by channel attention modules. The model’s effectiveness is validated on two public benchmark datasets for key rotating components. On the Case Western Reserve University (CWRU) bearing dataset, the MSDCAN achieves accuracies of 97.3% under clean conditions, 96.6% at 15 dB signal-to-noise ratio (SNR), 94.4% at 10 dB SNR, and a robust 85.5% under severe 5 dB SNR. To further validate its generalization, on the Xi’an Jiaotong University (XJTU) gear dataset, the model attains accuracies of 94.8% under clean conditions, 95.0% at 15 dB SNR, 83.6% at 10 dB SNR, and 63.8% at 5 dB SNR. These comprehensive results quantitatively validate the model’s superior diagnostic accuracy and exceptional noise robustness for rotating machinery, establishing a strong foundation for its application in reliable condition monitoring for complex systems, including wind turbines.

1. Introduction

Failures of rotating machinery, such as bearings and gears, are a critical challenge in industrial systems, often leading to significant economic losses and reduced operational efficiency [1]. This challenge is particularly pronounced in demanding applications like offshore wind turbines, which operate under severe conditions, including variable loads, fluctuating speeds, and harsh weather [2]. The complex noise profiles in these environments, stemming from mechanical vibrations, electromagnetic interference, and environmental factors, can mask subtle fault signatures and degrade diagnostic performance [3]. Consequently, traditional diagnostic approaches often struggle with reliability under such noise interference, leading to missed detections or false alarms that compromise maintenance decisions and system availability [4]. While signal preprocessing techniques have been explored to mitigate noise effects [5], the dynamic operating conditions inherent in many industrial systems demand more adaptive and robust diagnostic methods. Therefore, developing fault diagnosis techniques capable of functioning effectively under strong noise interference remains a critical research goal for improving the reliability of rotating machinery.
Feature extraction plays a pivotal role in the fault diagnosis of rotating machinery [6]. Under complex operating conditions characterized by variable loads [7] and speeds, the fault signatures of rotating components often exhibit non-stationary characteristics [8], posing significant challenges for accurate feature identification and extraction [9]. With the emergence of advanced signal processing and machine learning, multi-domain feature fusion has become a key strategy. Researchers commonly employ time-domain statistical features [10], frequency-domain spectral analysis [11], and time–frequency representations [12] to characterize mechanical faults. However, many existing approaches lack the adaptive capability to handle the strong non-stationary noise typical in industrial environments. When confronted with intense background noise, conventional feature-extraction methods often fail to distinguish weak fault patterns from interference, resulting in degraded diagnostic performance. Integrating domain knowledge, such as the physical characteristics of specific fault types and their harmonic frequency components, represents a promising direction for more targeted and noise-immune feature extraction. Therefore, the first challenge this work addresses is the development of a comprehensive multi-domain feature fusion strategy that effectively captures fault characteristics under strong noise interference.
Accurate fault classification is the subsequent critical step in automated diagnosis. Under complex operating conditions, fault signals from rotating-machinery components exhibit high non-stationarity and low signal-to-noise ratios, challenging the capabilities of classification algorithms. Traditional machine learning approaches, including Support Vector Machines (SVMs) [13] and Random Forests [14], have been widely employed. Although effective in controlled environments, their performance often degrades when applied to noisy data from real-world industrial settings [15] as their ability to learn discriminative features from complex signals is limited. Deep learning architectures offer a powerful alternative due to their superior hierarchical feature learning capabilities [16]. By automatically extracting salient features from raw or minimally processed data, deep neural networks can overcome the limitations of handcrafted feature-based methods. Specifically, integrating attention mechanisms with multi-scale convolutional structures allows a model to simultaneously capture local transient impacts and global periodic patterns characteristic of mechanical faults [17]. Therefore, the second challenge of this work is to develop an advanced deep learning architecture that can effectively capture multi-scale dependencies while maintaining robustness against strong background noise.
Despite significant advancements in condition monitoring, a critical gap persists in developing diagnostic tools for rotating machinery that are both highly accurate and robust against the severe noise encountered in demanding industrial applications. While the existing research has often focused on specific subsystems [18,19,20] or operated under controlled conditions, the fundamental challenge of vibration-based diagnosis for core rotating components (e.g., bearings and gears) under extreme non-stationary noise remains inadequately addressed [21]. This gap is particularly critical from an operational standpoint as failures in these components represent a significant portion of mechanical faults in industrial drivetrains [22]. In high-value systems such as offshore wind turbines, the failure of traditional signal processing approaches often leads to missed detections or false alarms, resulting in extended downtime and substantial maintenance costs. To bridge this gap, this study proposes an innovative Multi-Scale Domain Convolutional Attention Network (MSDCAN) for the robust fault diagnosis of rotating machinery. The method is designed to function as an automated diagnostic engine within condition monitoring systems (CMSs) [1], translating complex vibration data into clear actionable alerts regarding component health. This empowers maintenance teams to shift from reactive to predictive maintenance strategies [18], delivering two principal benefits for industrial applications: (1) significant cost savings by preventing catastrophic failures and avoiding unnecessary interventions triggered by false alarms, and (2) reduced unscheduled downtime through earlier and more reliable fault detection. These practical advantages are delivered through three key technical innovations: (1) an enhanced adaptive feature extractor that integrates time, frequency, wavelet, and cyclic spectral domains with domain-specific attention weighting to emphasize the most discriminative information; (2) a hybrid attention fusion mechanism that enables cross-modal interaction between deep convolutional features and domain-specific features for a more comprehensive fault representation; and (3) a multi-scale convolutional architecture, enhanced with channel attention modules and adaptive pooling, that robustly captures fault patterns across different temporal scales. By enabling more accurate and noise-resistant component condition monitoring through mechanisms like multi-head cross-attention and layer normalization, the proposed MSDCAN approach directly contributes to improving the availability and operational efficiency of critical rotating machinery.
This paper presents a novel fault diagnosis system for rotating machinery operating under challenging conditions. Two featured contributions of this work are summarized as follows: (1) a multi-domain feature fusion strategy that combines statistical parameters, characteristic frequencies, and wavelet energy features, incorporating domain knowledge of mechanical fault mechanisms; and (2) a novel MSDCAN architecture that leverages multi-head cross-attention and multi-scale convolution to simultaneously capture local and global fault patterns. The rest of this work is organized as follows: Section 2 reviews a spectrum characteristic analysis of mechanical faults and feature-extraction methods ranging from traditional handcrafted approaches to deep learning techniques, Section 3 constructs the MSDCAN architecture, Section 4 provides the experimental results regarding the Case Western Reserve University (CWRU) and Xi’an Jiaotong University (XJTU) datasets, and Section 5 outlines the conclusion of this work.

2. Relevant Studies and Methodological Strategy

2.1. Spectrum Characteristic Analysis

Rotating-machinery components often operate in harsh environments characterized by variable loads, speeds, and severe external conditions, making them particularly susceptible to premature failures. In demanding industrial applications, such as offshore wind farms where accessibility is limited and maintenance costs are substantially higher, early and accurate fault diagnosis is crucial for implementing condition-based maintenance strategies and reducing operational expenditures. Vibration-based mechanical fault diagnosis has emerged as one of the most effective approaches for monitoring the health condition of these components due to its non-intrusive nature and sensitivity to incipient faults.
The mechanical defects in rotating machinery generate characteristic vibration signatures that propagate through the machine’s structure, manifesting as periodic impulses in the time domain and specific frequency components in the spectrum domain. For rotating-machinery components, the characteristic fault frequencies are calculated using standard mechanical geometry equations [23]:
BPFO = n b 2 f r 1 d b d p cos α ,
BPFI = n b 2 f r 1 + d b d p cos α ,
BSF = d p 2 d b f r 1 d b d p cos α 2 ,
FTF = f r 2 1 d b d p cos α ,
where n b is the number of rolling elements, f r is the shaft rotational frequency, d b is the diameter of the rolling element, d p is the pitch diameter, and α is the contact angle.
In demanding applications like offshore wind turbines, vibration signals are often contaminated by various noise sources, including aerodynamic, mechanical, electromagnetic, and environmental noise. Additionally, the non-stationary nature of wind turbine operation introduces further complexity to the analysis.
Envelope analysis is particularly effective for mechanical fault diagnosis in rotating machinery. This technique involves bandpass filtering the signal around the resonance frequency, followed by envelope extraction through Hilbert transform and spectral analysis. The mathematical representation of the Hilbert transform is [24]
H [ x ( t ) ] = 1 π x ( τ ) t τ d τ .
The envelope is computed as the magnitude of the analytic signal:
e ( t ) = | z ( t ) | = x ( t ) 2 + H [ x ( t ) ] 2 .
The spectrum characteristic analysis was conducted on vibration data sampled at 12 kHz. The dataset includes rotating components with three distinct fault locations (rolling element, outer race, and inner race damage) plus one normal condition for comprehensive analysis.
Figure 1 shows time domain waveforms and envelope signals for different component conditions. Normal components show stable amplitude patterns, while faulty components display characteristic impulse patterns specific to each fault type. Inner race faults produce varying amplitude impacts, outer race faults generate regular impulse patterns, and rolling element faults exhibit complex waveform characteristics.
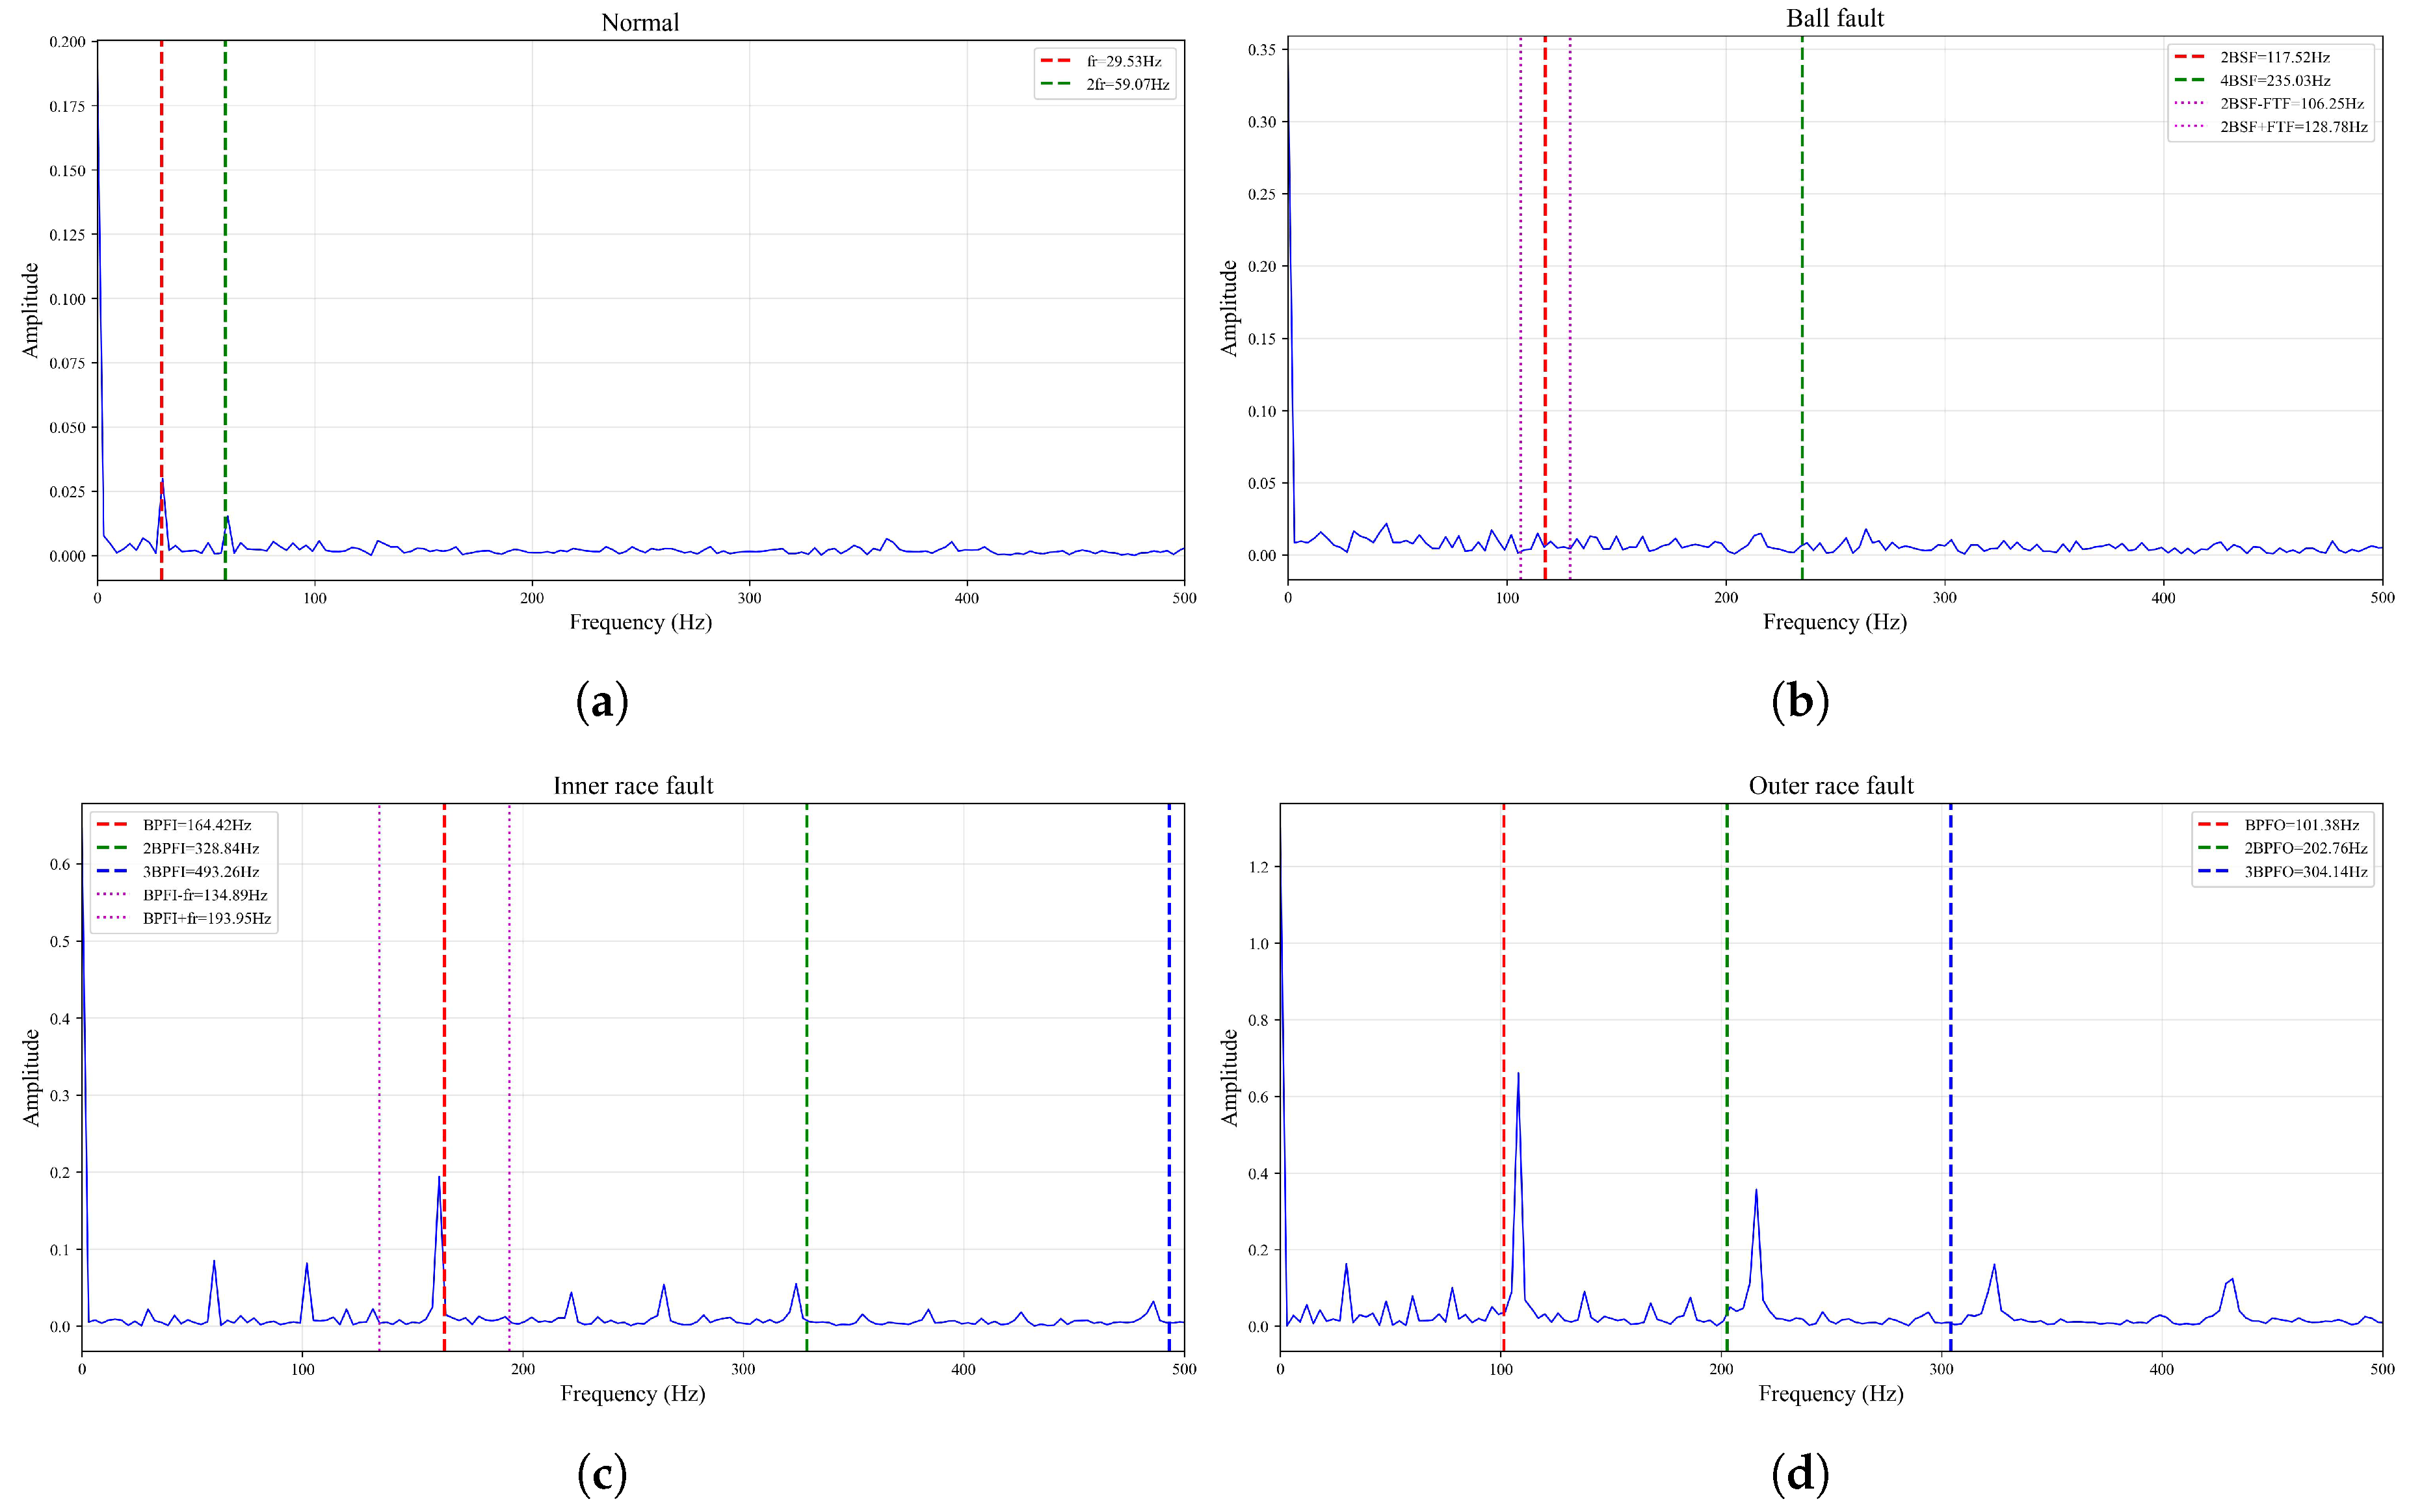
Figure 2 presents the envelope spectrum analysis results for different component conditions. The normal component spectrum primarily exhibits the shaft rotation frequency ( f r = 29.53 Hz) and its second harmonic ( 2 f r = 59.07 Hz) with relatively low amplitudes and no significant fault features. The inner race fault spectrum distinctly reveals the ball pass frequency inner race (BPFI = 164.42 Hz) and its harmonics (2BPFI = 328.84 Hz and 3BPFI = 493.26 Hz), accompanied by prominent modulation sidebands (BPFI ± f r = 134.89 Hz and 193.95 Hz). The outer race fault spectrum is characterized by the ball pass frequency outer race (BPFO = 101.38 Hz) and its harmonics (2BPFO = 202.76 Hz and 3BPFO = 304.14 Hz), displaying high-amplitude peaks with clear harmonic structure. The rolling element fault spectrum demonstrates the double ball spin frequency (2BSF = 117.52 Hz) and its harmonics (4BSF = 235.03 Hz), along with corresponding sidebands (2BSF ± FTF = 106.25 Hz and 128.78 Hz). Each fault type can be effectively identified through the presence of these characteristic frequencies and their harmonic patterns.

2.2. Feature-Extraction Methods for Mechanical Fault Diagnosis

Feature extraction plays a pivotal role in mechanical fault diagnosis, serving as the foundation for accurate fault classification. This section systematically reviews the evolution of feature extraction techniques from traditional handcrafted approaches to modern end-to-end deep learning methods, highlighting their principles, advantages, and limitations.
Traditional machine learning models such as Support Vector Machines (SVMs) and Back-Propagation Neural Networks (BPNNs) rely heavily on manually designed features. These are broadly categorized by the domain from which they are extracted: time, frequency, or time–frequency. A key time-domain feature is Kurtosis, which quantifies the impulsiveness of a signal and is particularly sensitive to the sharp impacts caused by mechanical defects. It is calculated as [25]
Kurtosis = 1 N i = 1 N x i μ σ 4 ,
where N is the total number of data points, x i represents the i data point in the signal, μ is the mean of the signal, and σ denotes its standard deviation.
Frequency-domain features are extracted after applying a fast Fourier transform (FFT). These features are highly effective as different fault types often manifest as distinct frequency components. The spectral centroid, for instance, is a measure of the center of mass of the power spectrum, effectively representing the weighted average frequency of the signal. A higher spectral centroid value indicates that the signal’s energy is concentrated in higher-frequency regions, whereas a lower value suggests the energy is concentrated in lower frequencies. It is defined as
S C = k = 1 N k · | X ( k ) | k = 1 N | X ( k ) | ,
where k is the frequency bin index, and | X ( k ) | represents the magnitude of the signal at that frequency bin. The summation is performed over all N frequency bins. In traditional approaches, these diverse handcrafted features are concatenated into a single vector to train a classifier. While effective, this methodology requires significant domain expertise and may not generalize well to new operating conditions.
In contrast, modern deep learning models such as Convolutional Neural Network (CNN) and transformer have revolutionized the field by automatically learning hierarchical features directly from raw signals. A one-dimensional CNN applies a series of convolutional layers to the raw time-series data. The core operation is [26]
h i l = f j = 1 C l 1 k = 1 K w i , j , k l · x j , i + k 1 l 1 + b i l ,
where h i l is the output of the i-th filter in layer l; f is a nonlinear activation function; w i , j , k l represents a learned weight of the filter; x j , i + k 1 l 1 is the input from the previous layer; and b i l is the corresponding bias term. This allows CNNs to automatically discover discriminative features.
Transformer-based models utilize a self-attention mechanism to capture global dependencies within the signal. This mechanism weighs the influence of different parts of the signal on each other, allowing the model to focus on the most relevant information. The foundational self-attention operation is calculated as [27]
Attention ( Q , K , V ) = softmax Q K T d k V ,
where Q, K, and V are the query, key, and value matrices, respectively, which are linear projections of the input signal. The term d k represents the dimension of the keys, serving as a scaling factor to ensure numerical stability, and the softmax function normalizes the attention scores.
Handcrafted feature methods are highly interpretable and computationally less demanding but are constrained by the predefined features. Conversely, deep learning approaches offer superior performance through automatic feature learning but suffer from a lack of interpretability and significant demand for large datasets. These limitations motivate the development of hybrid approaches that combine the strengths of both paradigms, a direction explored in the subsequent chapter.

2.3. Comparative Analysis and Research Gaps

A concise comparison of representative rotating-machinery fault diagnosis frameworks is provided to position the present approach within the current research progress. Table 1 lists core architectures together with their noise handling strategies and brief functional descriptions so that methodological emphases can be examined without excessive architectural detail.
The current methods reflect three main paradigms for noise robustness. The first paradigm applies explicit signal decomposition and reconstruction, such as improved CEEMDAN with statistical intrinsic mode function screening combined with phase-space reconstruction, to preserve nonlinear temporal dynamics under strong noise. The second paradigm performs multi-domain spectral or time–frequency fusion such as pipelines using fast Fourier transform and continuous wavelet transform sometimes coupled with generative augmentation to relieve class imbalance. The third paradigm relies on implicit feature stabilization through multi-scale convolution attention mechanisms or dual-branch representations that fuse raw sequences with time–frequency coefficients.
Several research gaps remain prominent. There is limited integration of statistically guided denoising with manifold reconstruction that preserves nonlinear dynamics under severe noise while maintaining downstream discriminability. Handling of simultaneous strong noise and pronounced class imbalance is still fragmented since generative augmentation frameworks rarely incorporate dynamic state reconstruction and decomposition-based models seldom include balanced synthetic sample generation. Adaptive regulation of reservoir depth or recurrent stacking is insufficiently explored compared with the widespread use of fixed-depth convolution, recurrent, or attention architectures. Evaluation under extreme low signal-to-noise ratios and heterogeneous real offshore operating conditions is sparse because most studies emphasize laboratory datasets with moderate interference. Ablation design lacks standardization since many reports do not isolate denoising dynamic reconstruction reservoir adaptation and bidirectional temporal modeling under identical multi-dataset and multi-SNR grids. The balance between interpretability and robustness is unresolved because dual-branch or attention structures provide partial transparency yet seldom embed explicit nonlinear dynamical invariants or attractor geometry descriptors into end-to-end learning. A unified taxonomy aligning decomposition-based, augmentation-based, and attention-based noise robustness strategies within a consistent experimental framework is rarely articulated.
These research limitations highlight the need for an integrated approach that handles strong noise and small-sample challenges in rotating-machinery fault diagnosis. The following section introduces a methodology designed for robust diagnostic performance under challenging conditions of small sample sizes and intense noise interference in rotating-machinery systems.

3. Proposed Algorithm

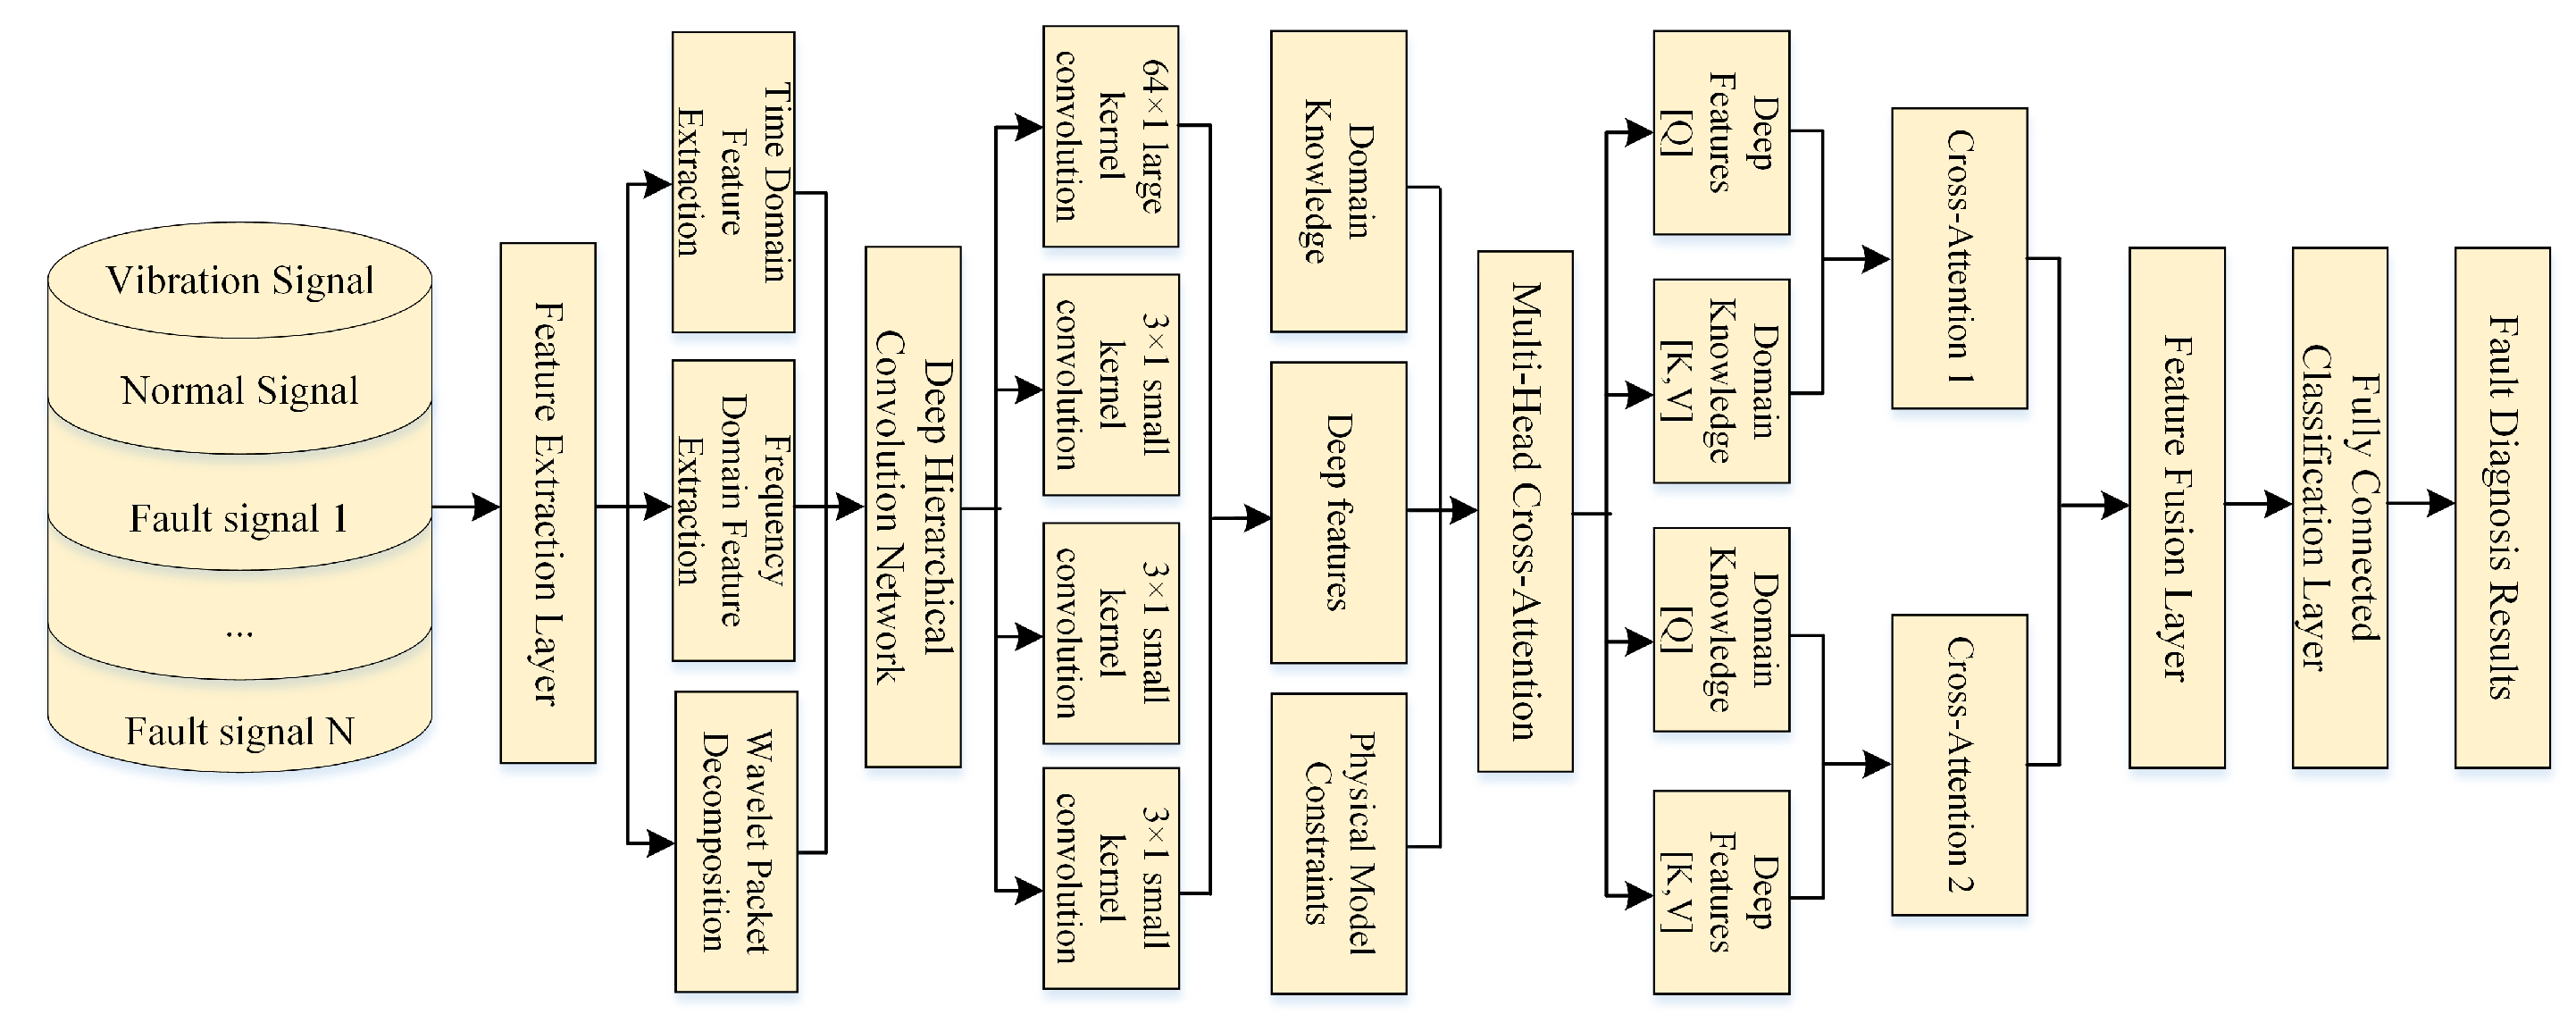
This section proposes the MSDCAN, which integrates domain knowledge with deep learning to address challenges in rotating-machinery fault diagnosis, such as data imbalance and feature extraction difficulties under noisy conditions. The MSDCAN employs a three-stage hybrid architecture: first, an adaptive feature extractor systematically captures multi-domain physical characteristics across time, frequency, wavelet, and cyclic spectral domains; second, a deep hierarchical convolutional encoder with progressive multi-scale kernels (from 64 to 3) automatically learns abstract representations from raw vibration signals; finally, an enhanced hybrid attention fusion mechanism intelligently integrates heterogeneous features through bidirectional cross-attention interactions, enabling domain-knowledge features to guide deep feature interpretation while allowing data-driven patterns to enhance physical representations. The overall framework of the MSDCAN hybrid intelligent diagnosis method is illustrated in Figure 3.

3.1. Domain Knowledge-Driven Adaptive Feature Extraction

Rotating-machinery fault diagnosis presents unique challenges due to the complexity of the machinery and the diverse manifestations of fault signatures across different domains. An adaptive feature extraction approach integrating domain knowledge and data-driven techniques is presented to characterize rotating-machinery health conditions.
The proposed adaptive feature extractor systematically extracts discriminative features from raw vibration signals across four complementary domains: time domain, frequency domain, wavelet domain, and cyclic domain. This multi-domain approach ensures that both global and local fault characteristics are captured effectively.
To analyze transient and non-stationary characteristics of rotating-machinery faults, wavelet packet decomposition and envelope analysis are employed. The wavelet packet transform decomposes the signal into different frequency bands with adaptive time–frequency resolution, providing a multi-resolution analysis. For a signal x ( t ) , the wavelet packet coefficients at level j and position k are computed as [29]
W j , k p = n h p ( n 2 k ) W j 1 , n p / 2 ,
where h p represents the filter coefficients, and p is the oscillation parameter. The energy distribution across different wavelet nodes captures the time–frequency characteristics of fault-induced vibrations.
The proposed adaptive feature extraction approach provides a comprehensive characterization of rotating-machinery health conditions by systematically extracting physically meaningful features across multiple domains. This domain knowledge-driven approach not only enhances the interpretability of the diagnostic results but also provides a solid foundation for the subsequent deep learning modules to further improve diagnostic performance.

3.2. Deep Hierarchical Convolutional Feature Learning

While domain knowledge-driven feature extraction provides interpretable and physically meaningful features, it may not fully capture the complex nonlinear relationships inherent in rotating-machinery fault signals. To address this limitation, a deep hierarchical convolutional feature-learning approach is proposed to extract high-level representations directly from raw vibration signals, complementing domain knowledge-driven features through an intelligent hybrid architecture.
The proposed deep hierarchical convolutional network is designed to capture fault-related patterns at different abstraction levels through progressive feature learning. The network employs a hierarchical architecture with varying receptive fields, enabling the extraction of both fine-grained local patterns and global contextual information [30]. Each layer processes the input at progressively higher abstraction levels, allowing the network to simultaneously focus on detailed temporal features and broader fault signatures.
The input to the network is a raw vibration signal segment x R 1 × L , where L is the segment length. The signal is processed through a sequence of hierarchical convolutional layers with adaptive receptive fields. The deep-feature learning architecture consists of four progressive stages [26]:
z 1 = Conv 1 D [ x ; k 1 = 64 , s 1 = 8 , p 1 = 28 ] ,
h 1 = ReLU [ BN ( z 1 ) ] ,
z 2 = Conv 1 D [ h 1 ; k 2 = 3 , s 2 = 1 , p 2 = 1 ] ,
h 2 = MaxPool [ ReLU ( BN ( z 2 ) ) ] ,
z 3 = Conv 1 D [ h 2 ; k 3 = 3 , s 3 = 1 , p 3 = 1 ] ,
h 3 = MaxPool [ ReLU ( BN ( z 3 ) ) ] ,
z 4 = Conv 1 D [ h 3 ; k 4 = 3 , s 4 = 1 , p 4 = 1 ] ,
f deep = GAP [ MaxPool ( ReLU ( BN ( z 4 ) ) ) ] ,
where k i , s i , and p i represent the kernel size, stride, and padding for the i convolutional layer, respectively. BN denotes batch normalization, GAP represents global average pooling, and z i denotes the intermediate convolutional output before activation. The first layer employs a large kernel size (64) with stride 8 to capture long-range temporal dependencies, while subsequent layers use smaller kernels (3) to extract fine-grained local features. The progressive reduction in spatial dimensions through max pooling operations enables hierarchical feature abstraction.
The deep hierarchical convolutional feature-learning approach offers several advantages over traditional feature-extraction methods. First, it automatically learns hierarchical representations from raw data without requiring explicit feature engineering, capturing complex nonlinear patterns that may be missed by conventional approaches. Second, the progressive architecture with adaptive receptive fields captures fault signatures at multiple abstraction levels, making it robust to variations in operating conditions and fault manifestations. Finally, the hierarchical design ensures computational efficiency while maintaining high representational capacity for complex fault pattern recognition.

3.3. Enhanced Hybrid Attention Fusion and Classification

The proposed enhanced hybrid attention fusion mechanism aims to effectively integrate complementary information from domain knowledge-driven features and deep convolutional features through cross-attention interactions. This integration is crucial for accurate rotating-machinery fault diagnosis, where complex operating conditions and signal characteristics necessitate a comprehensive feature representation approach that leverages both physical insights and data-driven patterns.
The hybrid attention mechanism operates on two heterogeneous feature sets: domain knowledge-based features f domain R 64 representing physical characteristics of rotating-machinery faults, and deep convolutional features f deep R 128 representing hierarchical data-driven patterns extracted through multi-scale processing. To enable effective cross-attention fusion, both feature sets are first projected into a common embedding space using linear transformations with layer normalization [31,32]:
h deep a = LayerNorm ( W deep f deep + b deep ) ,
h domain a = LayerNorm ( W domain f domain + b domain ) ,
where W deep R 256 × 128 , W domain R 256 × 64 are learnable projection matrices that map both feature types to a common 256-dimensional embedding space.
The core innovation lies in the bidirectional cross-attention mechanism that enables each feature type to attend to the other, facilitating comprehensive information exchange. The deep features attend to domain-knowledge features to incorporate physical insights:
Q deep = h deep a , K domain = V domain = h domain a ,
f deep domain = MultiHeadAttention ( Q deep , K domain , V domain ) ,
where Q deep represents the query matrix derived from deep features; K domain and V domain represent the key and value matrices derived from domain-knowledge features; f deep domain represents the features resulting from deep features attending to domain-knowledge features; MultiHeadAttention is the attention operation that allows deep features to selectively focus on relevant aspects of domain-knowledge features.
Simultaneously, domain-knowledge features attend to deep features to capture data-driven patterns:
Q domain = h domain a , K deep = V deep = h deep a ,
where Q domain represents the query matrix derived from domain-knowledge features, while K deep and V deep represent the key and value matrices derived from deep features. This reverses the attention direction compared to Equation (22).
f domain deep = MultiHeadAttention ( Q domain , K deep , V deep ) ,
where f domain deep represents the features resulting from domain-knowledge features attending to deep features, enabling domain knowledge to be enhanced by data-driven patterns.
The multi-head attention mechanism with 4 attention heads operates as
MultiHeadAttention ( Q , K , V ) = Concat ( head 1 , , head 4 ) W O ,
where Concat represents the concatenation operation that joins the outputs from all attention heads, head i represents the output of the i-th attention head, and W O R 256 × 256 is a learnable output projection matrix that transforms the concatenated attention heads back to the embedding dimension.
Each attention head is computed as
head i = Attention ( Q W i Q , K W i K , V W i V ) = softmax Q W i Q K T W i K T d k V W i V ,
where W i Q , W i K , W i V R 64 × 256 are learnable parameter matrices for the i-th attention head that project the query, key, and value matrices to lower-dimensional spaces, d k = 64 is the dimension of the keys serving as a scaling factor to prevent extremely small gradients, and softmax normalizes the attention scores to form a probability distribution.
The bidirectional attention outputs are then fused through concatenation and linear transformation:
f cross = concat ( f deep domain , f domain deep ) ,
where f cross represents the concatenated cross-attention features, and concat is the concatenation operation that joins the two directional attention outputs along the feature dimension, resulting in a 512-dimensional feature vector.
f fused = ReLU ( LayerNorm ( W fusion f cross + b fusion ) ) ,
where f fused represents the final fused features, W fusion R 256 × 512 is a learnable weight matrix that reduces the dimensionality of the concatenated features from 512 to 256, b fusion is the corresponding bias term, LayerNorm normalizes the features, and ReLU adds nonlinearity.
For classification, a three-layer perceptron with Dropout regularization is employed to prevent overfitting and ensure robust generalization:
h 1 c = Dropout ( ReLU ( W 1 f fused + b 1 ) ) ,
where h 1 c represents the output of the first fully connected layer, W 1 R 256 × 256 is a weight matrix, b 1 is the bias term, ReLU adds nonlinearity, and Dropout randomly sets a fraction of input units to zero during training to prevent co-adaptation of neurons and reduce overfitting.
h 2 c = Dropout ( ReLU ( W 2 h 1 c + b 2 ) ) ,
where h 2 c represents the output of the second fully connected layer, W 2 R 128 × 256 is a weight matrix that reduces the feature dimension from 256 to 128, b 2 is the bias term, and ReLU and Dropout serve the same functions as in Equation (30).
y ^ = softmax ( W 3 h 2 c + b 3 ) ,
where y ^ represents the predicted class probabilities, W 3 R C × 128 is the weight matrix of the final classification layer with C being the number of fault classes, b 3 is the bias term, and softmax normalizes the outputs into a probability distribution over the fault classes.
The model is trained using cross-entropy loss with L2 regularization and AdamW optimizer (PyTorch, version 2.5.1+cu118):
L = 1 N i = 1 N c = 1 C y i , c log ( y ^ i , c ) + λ θ | θ | 2 2 ,
where L represents the total loss function, N is the number of samples in the batch, C is the number of fault classes, y i , c is the true label (1 if sample i belongs to class c; 0 otherwise), y ^ i , c is the predicted probability that sample i belongs to class c, λ is the L2 regularization coefficient that controls the strength of weight decay, and θ represents all trainable parameters in the model.
The enhanced hybrid attention mechanism provides several key advantages over traditional fusion approaches. Unlike simple concatenation or element-wise operations, the cross-attention mechanism enables dynamic feature interaction where each feature type can selectively focus on relevant information from the other. This bidirectional attention allows domain-knowledge features to guide the interpretation of deep features while enabling deep features to enhance the representation of domain knowledge, creating a synergistic effect that improves diagnostic accuracy.
The multi-head attention enables the model to attend to different aspects of the feature relationships simultaneously, capturing diverse interaction patterns between physical insights and learned representations. The layer normalization and Dropout mechanisms ensure training stability and prevent overfitting, which is particularly important when dealing with limited fault data in industrial applications.
This architecture differs significantly from CNN–LSTM models [26] that process features sequentially as the cross-attention mechanism enables parallel and bidirectional information flow. Compared to CNN–transformer models [28] that typically apply self-attention within individual feature types, the proposed hybrid attention explicitly models cross-modal interactions, leading to more effective feature fusion for rotating-machinery fault diagnosis under varying operational conditions.

4. Experimental Results

This section presents comprehensive experimental validation of the proposed MSDCAN model using two widely recognized rotating-machinery fault datasets. All the experiments were conducted under controlled conditions with standardized hardware and software configurations to ensure reproducibility and fair comparison.
To ensure reproducibility and provide transparency, the specifications of the hardware and software environments used throughout this study are detailed. All the experiments were implemented in Python and conducted on a high-performance computing system. The computer configuration is as follows: an AMD Ryzen 7 4800H with Radeon Graphics (Advanced Micro Devices, Inc., Santa Clara, CA, USA) (eight physical cores; sixteen logical processors), 32 GB of DDR4-3200 RAM (2 × 16 GB), SSD storage for fast data loading, and an NVIDIA GeForce RTX 2060 GPU (NVIDIA Corporation, Santa Clara, CA, USA). The operating system is Windows 10. The software environment was configured using Python 3.9.20 with PyTorch 2.5.1+cu118 and CUDA 11.8 for GPU acceleration. Additional libraries, including scikit-learn (version 1.5.2), NumPy (version 1.26.3), SciPy (version 1.13.1), PyWavelets (version 1.6.0), and Matplotlib (version 3.9.2), were utilized for data processing, feature extraction, and visualization.
To ensure fair comparison across all the deep learning models, standardized hyperparameters were employed for CNN, transformer, and MSDCAN throughout the experimental validation. The AdamW optimizer was utilized with the ReduceLROnPlateau learning rate scheduler across all the models, as detailed in Table 2.
For other model configurations, the multi-layer perceptron (MLP) utilized a two-hidden-layer architecture with dimensions H = ( 256 , 128 ) , incorporating ReLU activation functions f and the Adam optimizer. The L2 regularization coefficient was set to α = 0.0001 to prevent overfitting. The Support Vector Machine (SVM) models underwent systematic optimization through exhaustive grid search across multiple hyperparameter combinations. The evaluation encompassed both radial basis function (RBF) and linear kernels K, with the regularization parameters spanning C { 0.1 , 1 , 10 , 100 } and kernel coefficients configured as γ S V M { scale , auto } . This comprehensive hyperparameter optimization strategy ensures optimal baseline performance for fair comparative analysis across all the experimental datasets.
The experimental evaluation employs four essential performance metrics to assess model effectiveness under varying noise conditions. Accuracy measures overall prediction correctness as the ratio of correctly classified samples to total test samples. Precision evaluates the model’s ability to minimize false positives by calculating the proportion of true positive predictions among all the positive classifications for each fault class. Recall assesses the model’s sensitivity in detecting all the actual fault instances, measuring the fraction of correctly identified positive cases. F1-score provides a balanced evaluation through the harmonic mean of precision and recall, particularly valuable for fault diagnosis applications where both false positives and false negatives are critical. All the metrics utilize macro-averaging to ensure equal weight for each fault class, preventing bias toward frequent fault types. The results are visualized through accuracy trend lines and individual bar charts, enabling a comprehensive comparison of the diagnostic performance across different noise levels and rotating-machinery conditions.

4.1. Case I: Rotating-Machinery Fault Classification Results Using CWRU Dataset

4.1.1. Data Preparation

In this study, the CWRU rotating-machinery dataset with a sampling frequency of 12 kHz was used. The dataset includes rotating-machinery components with three fault locations (ball damage, inner race damage, and outer race damage) at three severity levels (0.007-, 0.014-, and 0.021-inch defect diameters), plus the normal condition, yielding ten rotating-machinery health states in total.
The raw vibration signals were segmented into samples of 1024 data points with 30% overlap between adjacent segments to create a challenging small-sample learning scenario. To simulate practical industrial applications where labeled fault data is scarce, a small-sample learning configuration was adopted with only 20 training samples and 100 testing samples allocated to each of the ten rotating-machinery conditions.
To evaluate model robustness under realistic industrial noise conditions, additive white Gaussian noise (AWGN) was added at four signal-to-noise ratio (SNR) levels: clean (no noise), 15 dB, 10 dB, and 5 dB. The noise-contaminated signals were generated according to the following equation [33]:
x noisy ( t ) = x ( t ) + n ( t ) ,
where x ( t ) represents the original signal, and n ( t ) is additive white Gaussian noise with zero mean and variance calculated based on the desired SNR:
SNR ( dB ) = 10 log 10 P signal P noise ,
where P signal is the average power of the original signal, and P noise is the noise power.
The noise power is calculated as
P noise = P signal 10 SNR ( dB ) / 10 ,
The Gaussian noise is then generated with variance σ 2 = P noise :
n ( t ) N ( 0 , σ 2 ) ,
This small-sample learning setup with multiple noise levels creates a challenging yet realistic evaluation scenario that closely mimics practical industrial fault diagnosis applications. The configuration addresses three key challenges: limited labeled fault data availability for training, various levels of background noise introduced by industrial environments, and the requirement for models to demonstrate robust performance across different operating conditions. The class distribution remained balanced across all the noise levels, with the data organized into separate directories for each combination of noise level and dataset split. This preprocessing procedure enables comprehensive evaluation of the proposed fault diagnosis models under both ideal and noise-contaminated conditions while addressing the practical constraint of limited training data availability.

4.1.2. Rotating-Machinery Fault Diagnosis Results

To validate the effectiveness of the proposed MSDCAN model for rotating-machinery fault diagnosis, a comprehensive evaluation was conducted against several established baseline methods under varying noise conditions. The experimental results demonstrate that the proposed approach achieves superior diagnostic performance, particularly in challenging noise environments.
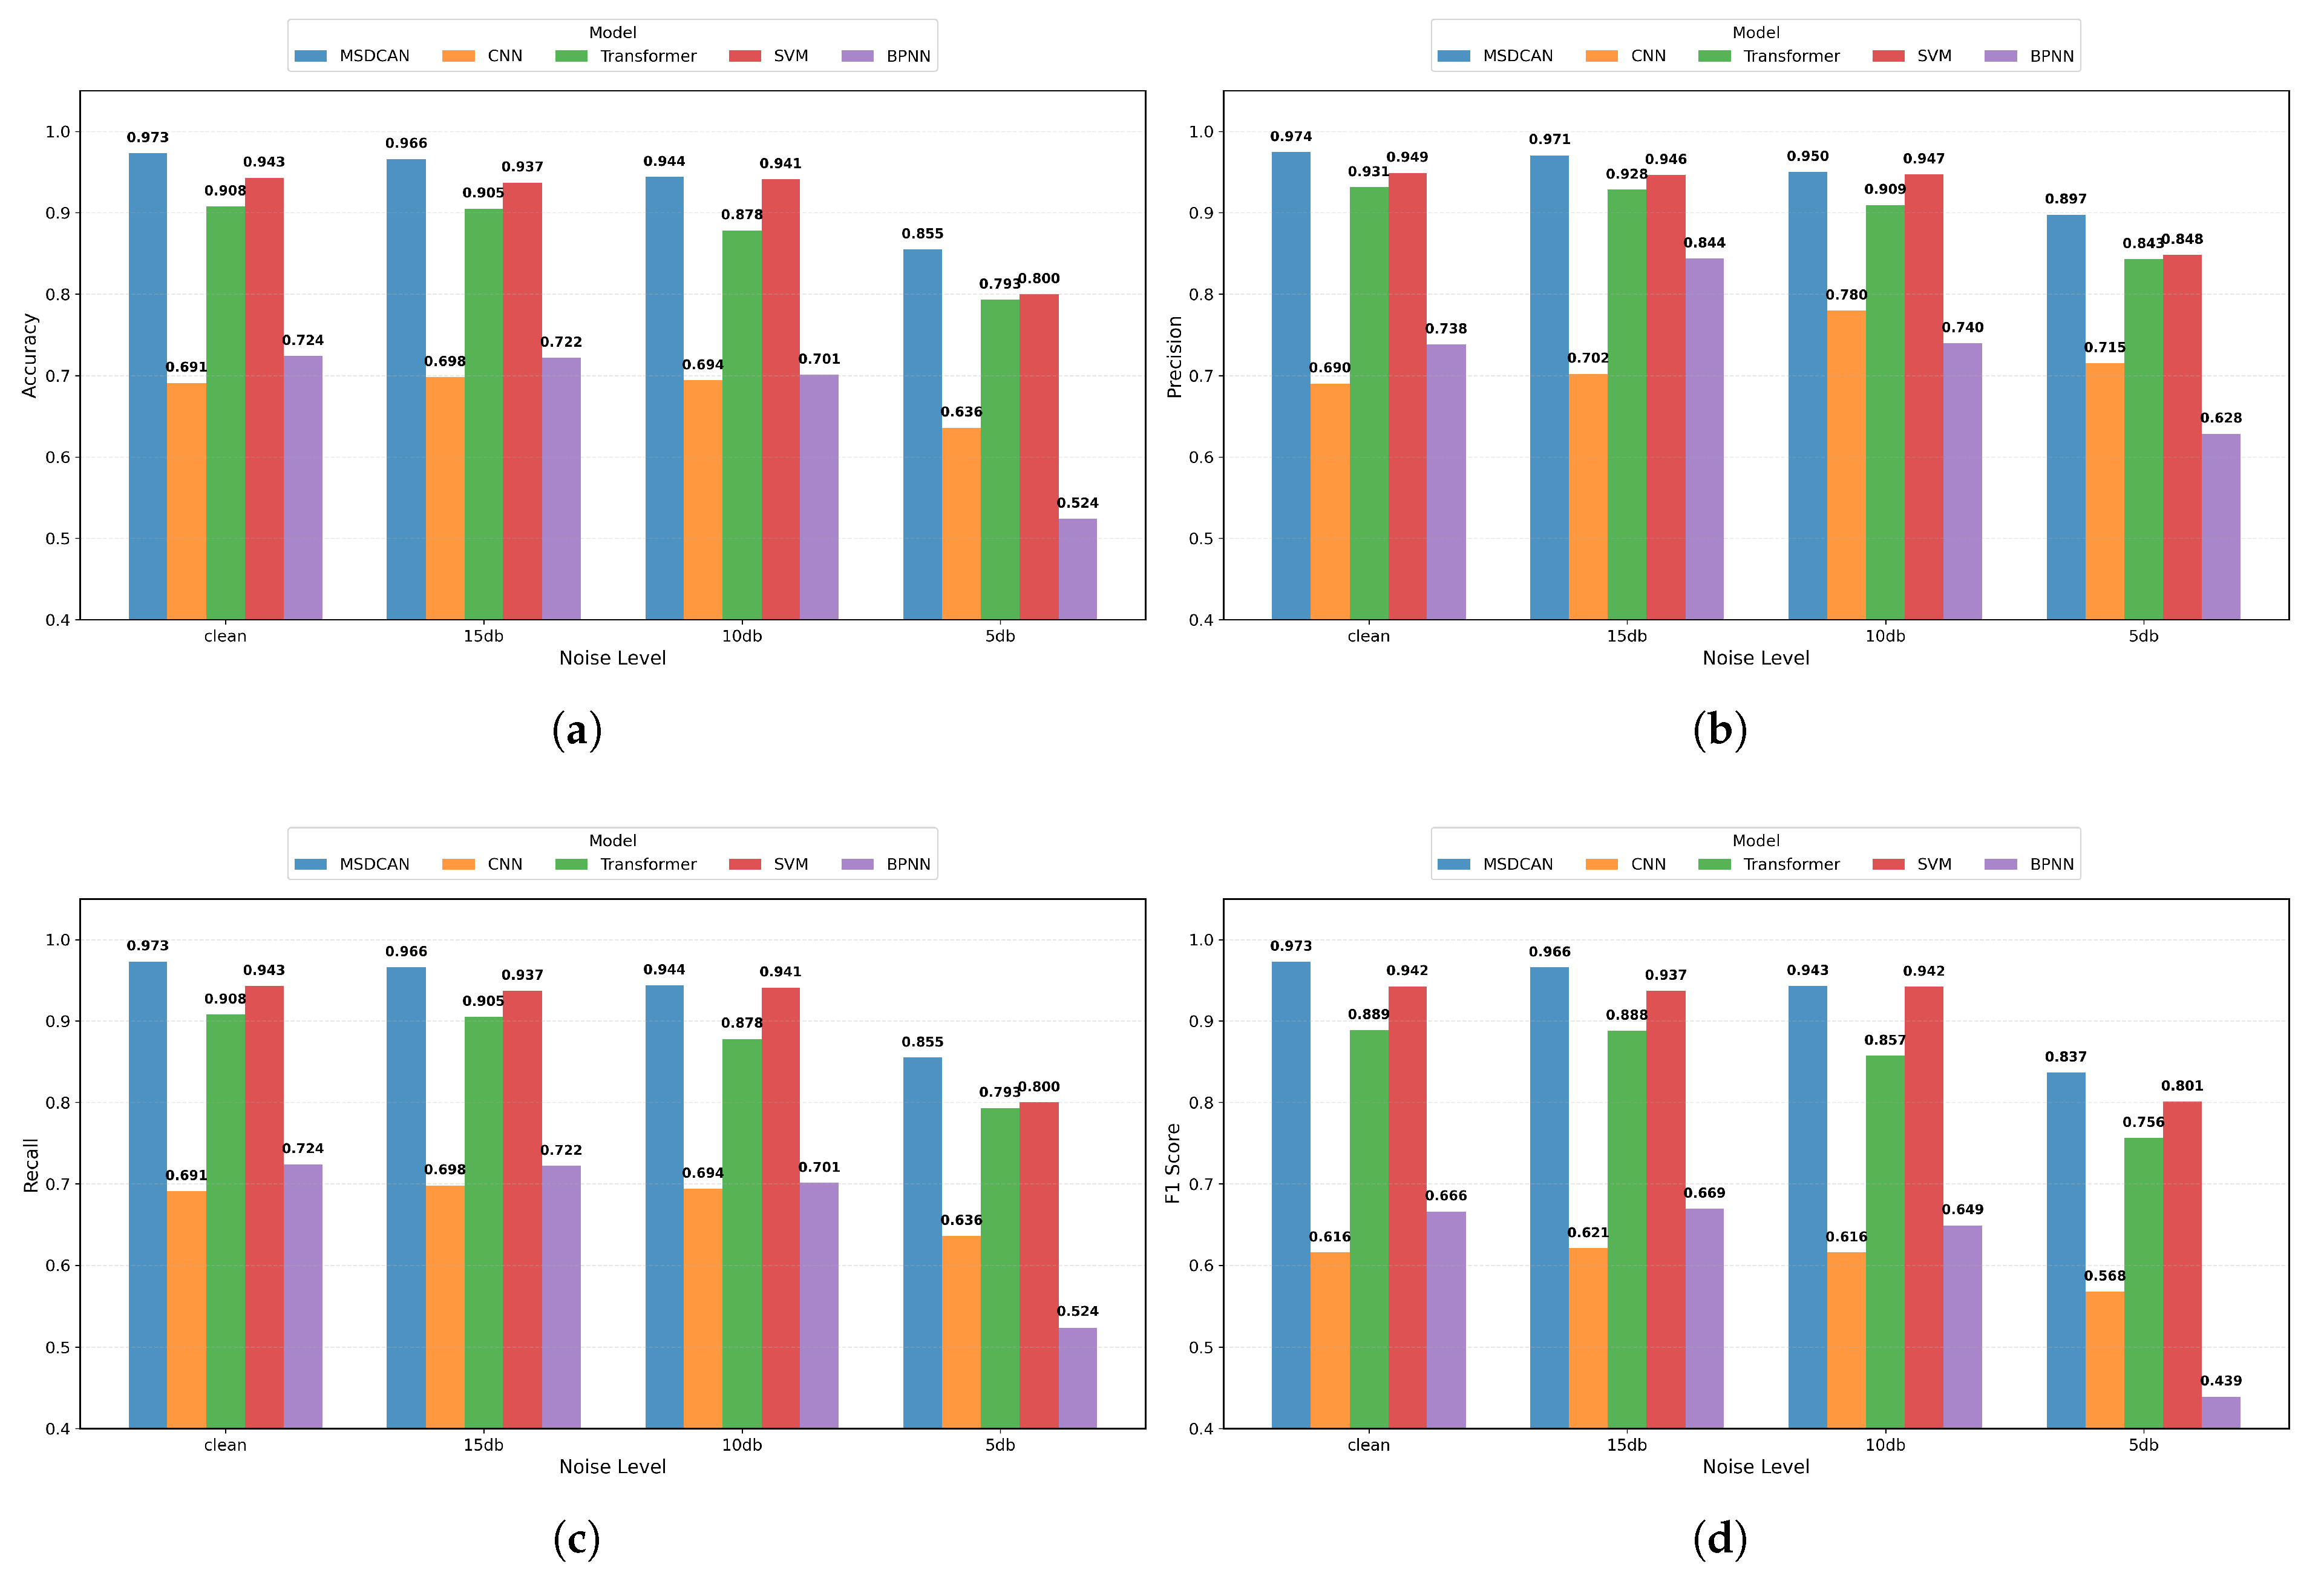
The diagnostic capabilities of five different models—MSDCAN, CNN, transformer, SVM, and BPNN—were evaluated under four distinct noise conditions: clean, 15 dB, 10 dB, and 5 dB SNR. As shown in Table 3 and Figure 4, the MSDCAN consistently outperforms all the baseline methods across all the noise levels. Under clean conditions, the MSDCAN achieves the highest accuracy of 0.973, followed by SVM (0.943) and transformer (0.908). As the noise levels increase, the performance gap becomes more pronounced. At the most challenging 5 dB SNR condition, the MSDCAN maintains superior performance with an accuracy of 0.855, significantly outperforming CNN (0.636), transformer (0.793), SVM (0.800), and BPNN (0.524). The detailed performance metrics including precision, recall, and F1-scores are presented in Figure 4a–d, which further demonstrate the robustness and superiority of the proposed MSDCAN model under various noise conditions.
The precision analysis reveals that the MSDCAN maintains the highest precision across all the noise conditions, achieving 0.974 under clean conditions and 0.897 at a 5 dB SNR. The recall metrics demonstrate identical performance patterns to accuracy, confirming the consistency of the proposed method. The F1-score analysis further validates the balanced performance of the MSDCAN, achieving 0.973 under clean conditions and maintaining 0.837 even at a 5 dB SNR. Notably, while traditional methods like CNN and BPNN show significant performance degradation as noise increases, the MSDCAN exhibits remarkable robustness, maintaining relatively stable performance even under severe noise conditions.
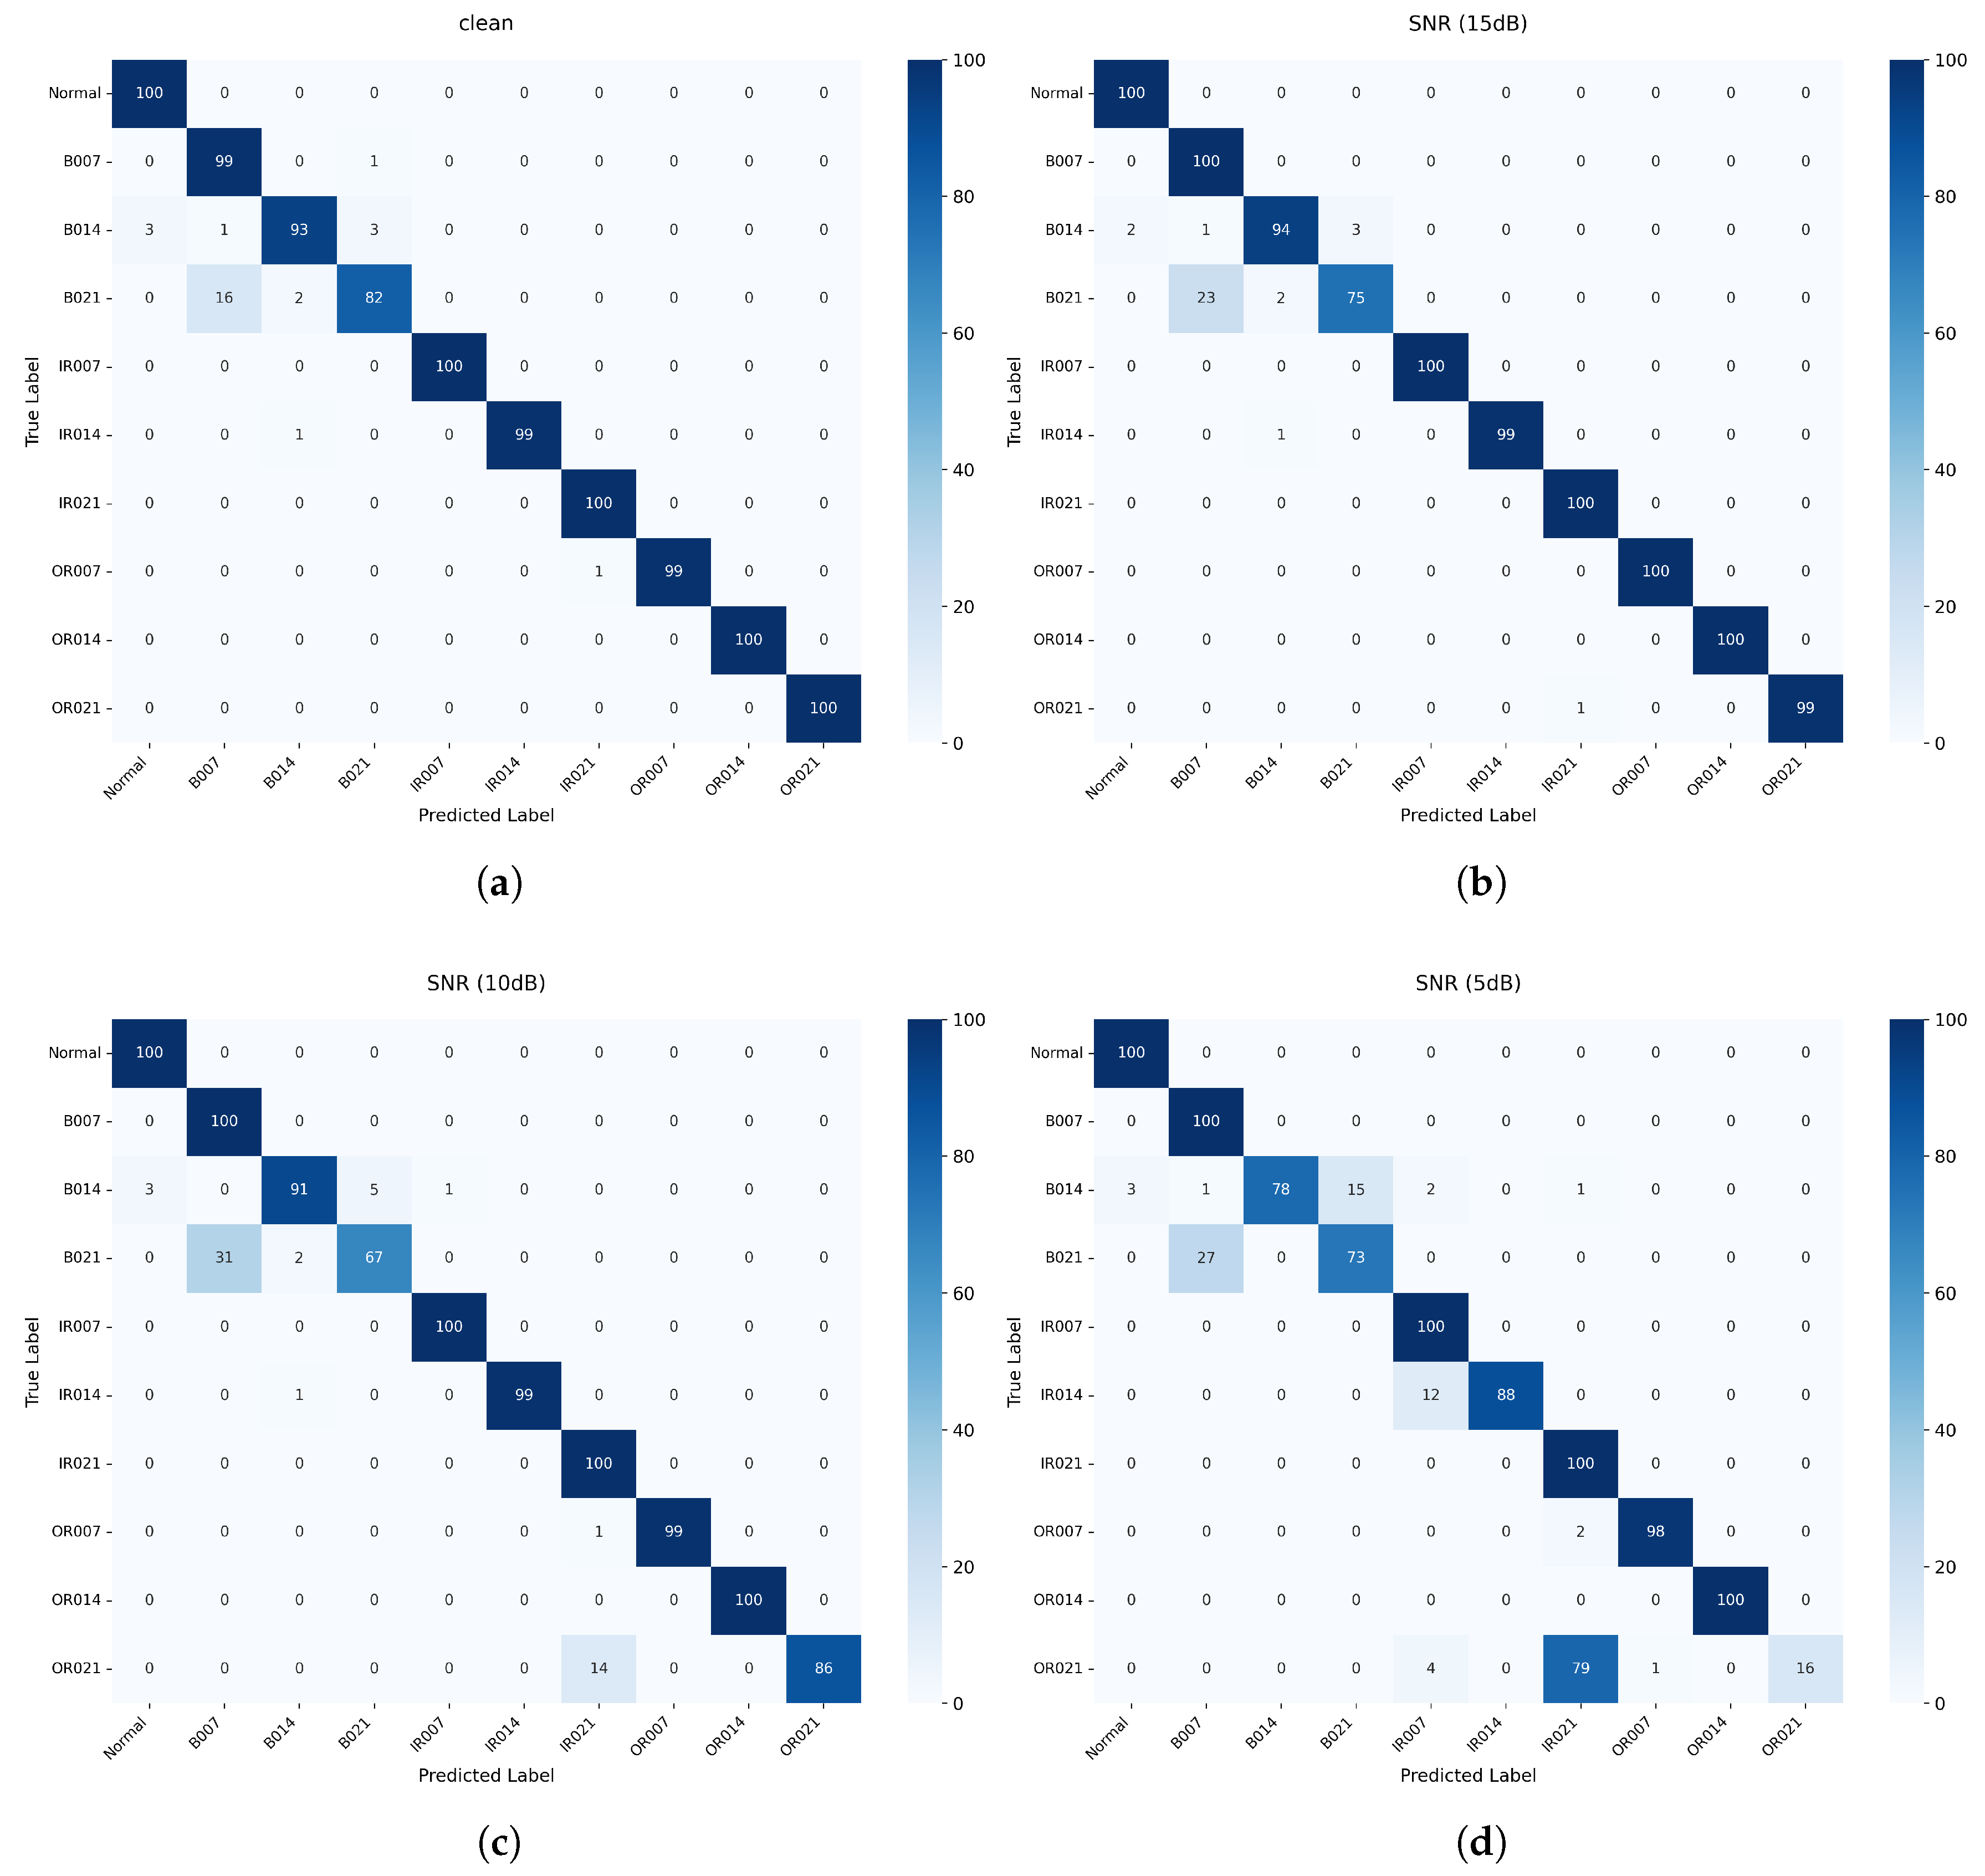
To further evaluate the diagnostic precision of the MSDCAN model, confusion matrices were generated for all the noise conditions, as illustrated in Figure 5. Under clean conditions, the MSDCAN model achieves excellent classification with an overall accuracy of 97.3%. The confusion matrix shows that most fault types are correctly classified, with minor misclassifications primarily occurring between similar bearing-fault conditions (B014 and B021) due to their inherent signal similarities in the frequency domain.
At a 15 dB SNR, the model maintains strong performance with 96.6% accuracy, showing only minimal degradation compared to the clean conditions. The confusion matrix reveals that the model continues to distinguish effectively between different fault types, with slight cross-classification errors mainly between B014 and B021 bearing faults. At a 10 dB SNR, the accuracy decreases to 94.4%, but the model still demonstrates robust diagnostic capabilities with clear diagonal patterns indicating correct classifications for most fault categories.
Under the most challenging 5 dB SNR condition, the MSDCAN achieves 85.5% accuracy, which represents remarkable performance considering the severe noise interference. The confusion matrix shows increased misclassifications, particularly affecting bearing outer race faults (B014 and B021) and some inner race faults (IR014 OR021), but the model maintains perfect classification for several fault types, including normal conditions B007, IR007, IR021, OR007, and OR014.
The multi-scale convolution component also demonstrates significant importance, as shown in Figure 6, with its removal resulting in performance degradation from approximately 0.967 in clean conditions to approximately 0.961 at 5 dB SNR. Meanwhile, the attention mechanism shows relatively stable performance, fluctuating around approximately 0.937–0.951 across different noise levels. The domain features component exhibits the most dramatic performance decline under noise conditions, dropping from approximately 0.963 in clean conditions to approximately 0.916 at 5 dB SNR. Under the most challenging noise conditions (5 dB SNR), the component importance hierarchy becomes clearly evident: the full model (approximately 0.981) significantly outperforms the variants without multi-scale convolution (approximately 0.961), without attention (approximately 0.949), and without domain features (approximately 0.916), as illustrated in Figure 6.
This comprehensive ablation analysis confirms that the synergistic integration of domain features, multi-scale convolution, and attention mechanisms creates a diagnostic system with superior robustness to noise interference, making the MSDCAN particularly well-suited for challenging industrial environments where signal quality is frequently compromised.

4.2. Case II: Gear Fault Classification Results Using XJTU Dataset

4.2.1. Data Preparation

The XJTUSpurgear dataset provided by the Institute of Aero-engine at Xi’an Jiaotong University was utilized in this research. This dataset contains vibration signals collected from a spur gear test rig under various fault conditions. Specifically, the analysis focused on the 20 Hz rotation speed data (corresponding to 1200 rpm), which includes five different gear health states: the normal condition and four levels of root crack severity (0.2 mm, 0.6 mm, 1.0 mm, and 1.4 mm).
The experimental platform consists of a driving motor, a belt, a shaft, and a gearbox. Twelve accelerometers (PCB333B32) were mounted on the gearbox to collect vibration signals at a sampling frequency of 10 kHz. For the analysis, signals from the first sensor position were utilized. The gear specifications include a module of 2, with the large gear having 75 teeth and the small gear having 55 teeth, both manufactured from 20CrMnTi steel.
To prepare the data for fault diagnosis, the raw vibration signals were segmented into samples of 2048 data points with 30% overlap between adjacent segments. Similar to the CWRU case study, a small-sample learning configuration was adopted, with only 20 training samples and 100 testing samples allocated to each of the five gear conditions, creating a challenging yet realistic scenario for industrial applications where labeled fault data is often scarce.
To evaluate model robustness under realistic industrial noise conditions, additive white Gaussian noise (AWGN) was added at four signal-to-noise ratio (SNR) levels: clean (no noise), 15 dB, 10 dB, and 5 dB. The noise-contaminated signals were generated according to Equation (37).
The dataset organization followed a hierarchical structure, with the top level divided by noise conditions (clean, 15 dB, 10 dB, and 5 dB) and each noise level containing separate training and testing subsets. Within each subset, the data was balanced across all five gear health states: the normal condition, 0.2 mm crack, 0.6 mm crack, 1.0 mm crack, and 1.4 mm crack. This organization facilitates systematic evaluation of model performance across different noise levels and fault conditions.
The key characteristic of the XJTUSpurgear dataset that makes it particularly valuable for this study is its progression of fault severity levels, allowing for evaluation of the model’s ability to distinguish between similar fault conditions with different degrees of severity. This presents a more challenging diagnostic task compared to the CWRU dataset, where the fault types are more distinctly different from each other. Additionally, the gear mesh frequency of 1100 Hz (calculated as the product of a rotation frequency of 20 Hz and the number of teeth 55) provides an important domain-specific feature that can be leveraged by diagnostic models.
This experimental setup enables comprehensive evaluation of the proposed MSDCAN model’s performance on gear fault diagnosis under both ideal and noise-contaminated conditions while addressing the practical constraint of limited training data availability through the small-sample learning paradigm.

4.2.2. Gear Fault Diagnosis Results

To validate the effectiveness of the proposed MSDCAN model for gear fault diagnosis using the XJTUSpurgear dataset, a comprehensive evaluation was conducted against several established baseline methods under varying noise conditions. The experimental results demonstrate that the proposed approach achieves superior diagnostic performance across different gear fault types.
The diagnostic performance of five different models—MSDCAN, CNN, transformer, SVM, and BPNN—was evaluated using the XJTU gear dataset under four distinct noise conditions. As illustrated in Table 4 and Figure 7, the performance comparison reveals distinct behavioral patterns among different models across varying noise levels. Under clean conditions and 15 dB SNR, MSDCAN demonstrates exceptional performance, achieving the highest accuracy of approximately 0.948 under clean conditions and maintaining superior performance with approximately 0.950 at 15 dB SNR. However, the performance dynamics change significantly under higher noise conditions.
The performance analysis reveals interesting dynamics across different noise levels. While MSDCAN excels under clean and low-noise conditions, the transformer model exhibits remarkable resilience under high-noise scenarios, actually improving from clean conditions (0.816) to 10 dB SNR (0.850) and maintaining the highest performance at both 10 dB (0.850) and 5 dB (0.788) noise levels. This superior performance under severe noise conditions suggests that the transformer’s attention mechanism is particularly effective at handling noise interference and extracting relevant features from corrupted signals. In contrast, MSDCAN shows more significant degradation under severe noise, dropping to 0.836 at 10 dB and 0.638 at 5 dB SNR, falling behind the transformer model in these challenging conditions.
SVM shows excellent performance under clean conditions (0.876) but experiences the most dramatic degradation as noise increases, dropping precipitously to 0.310 at 5 dB SNR—representing the most severe performance decline among all methods. CNN maintains relatively stable but modest performance across all the noise conditions, ranging from 0.568 to 0.650, while BPNN consistently shows the poorest performance, particularly struggling under noisy conditions with severe degradation from 0.582 to 0.384. The precision, recall, and F1-score metrics further confirm these trends, with MSDCAN excelling under clean and low-noise conditions, while transformer demonstrates superior robustness under high-noise scenarios, achieving the best precision, recall, and F1-score at both 10 dB and 5 dB SNR levels.
CNN maintains relatively stable but modest performance across all the noise conditions, ranging from 0.568 to 0.650, while BPNN consistently shows the poorest performance, particularly struggling under noisy conditions with severe degradation from 0.582 to 0.384. The precision analysis reveals that the MSDCAN maintains the highest precision across all the noise conditions, achieving 0.949 under clean conditions and 0.807 even at the challenging 5 dB SNR level. The recall and F1-score metrics further confirm the MSDCAN’s superiority, demonstrating balanced and consistent performance across all the evaluation metrics.
The confusion matrices in Figure 8 provide detailed insights into the classification performance of the MSDCAN across different gear fault categories on the XJTU dataset. Under clean conditions, the model achieves an outstanding classification accuracy of 94.8% with minimal misclassification errors. The diagonal dominance in the confusion matrix indicates excellent discrimination between the normal, 0.2 mm crack, 0.6 mm crack, 1.0 mm crack, and 1.4 mm crack conditions, with individual class accuracies of 83%, 93%, 100%, 100%, and 98%, respectively.
At a 15 dB SNR, the model maintains exceptional performance with 95.0% overall accuracy, showing only minimal degradation compared to clean conditions. The normal condition achieves 84% accuracy, while crack detection remains highly reliable, with 0.2 mm crack at 92% and perfect classification for both 0.6 mm and 1.0 mm cracks (100% each). The 1.4 mm crack maintains excellent 99% accuracy, demonstrating the model’s consistent performance across different fault severities even under noise interference.
As noise increases to a 10 dB SNR, some performance degradation becomes evident, with the overall accuracy dropping to 83.6%. The normal condition classification decreases to 70%, and 0.2 mm crack detection drops to 80%. However, the model continues to perfectly identify 0.6 mm and 1.0 mm cracks (100% each), while the 1.4 mm crack classification experiences a more significant impact, dropping to 68% due to increased confusion with other crack conditions.
Under the most challenging 5 dB SNR condition, the model achieves 63.8% overall accuracy, facing significant difficulties, particularly with normal condition classification (7% accuracy), where most normal samples are misclassified as 1.0 mm crack (87%). The 0.2 mm crack detection suffers substantially, achieving only 32% accuracy with considerable confusion with 1.0 mm crack conditions (63%). Remarkably, the 0.6 mm and 1.0 mm cracks maintain perfect classification (100% each), while the 1.4 mm crack achieves 80% accuracy, indicating the model’s ability to reliably detect more severe fault conditions even under extreme noise.
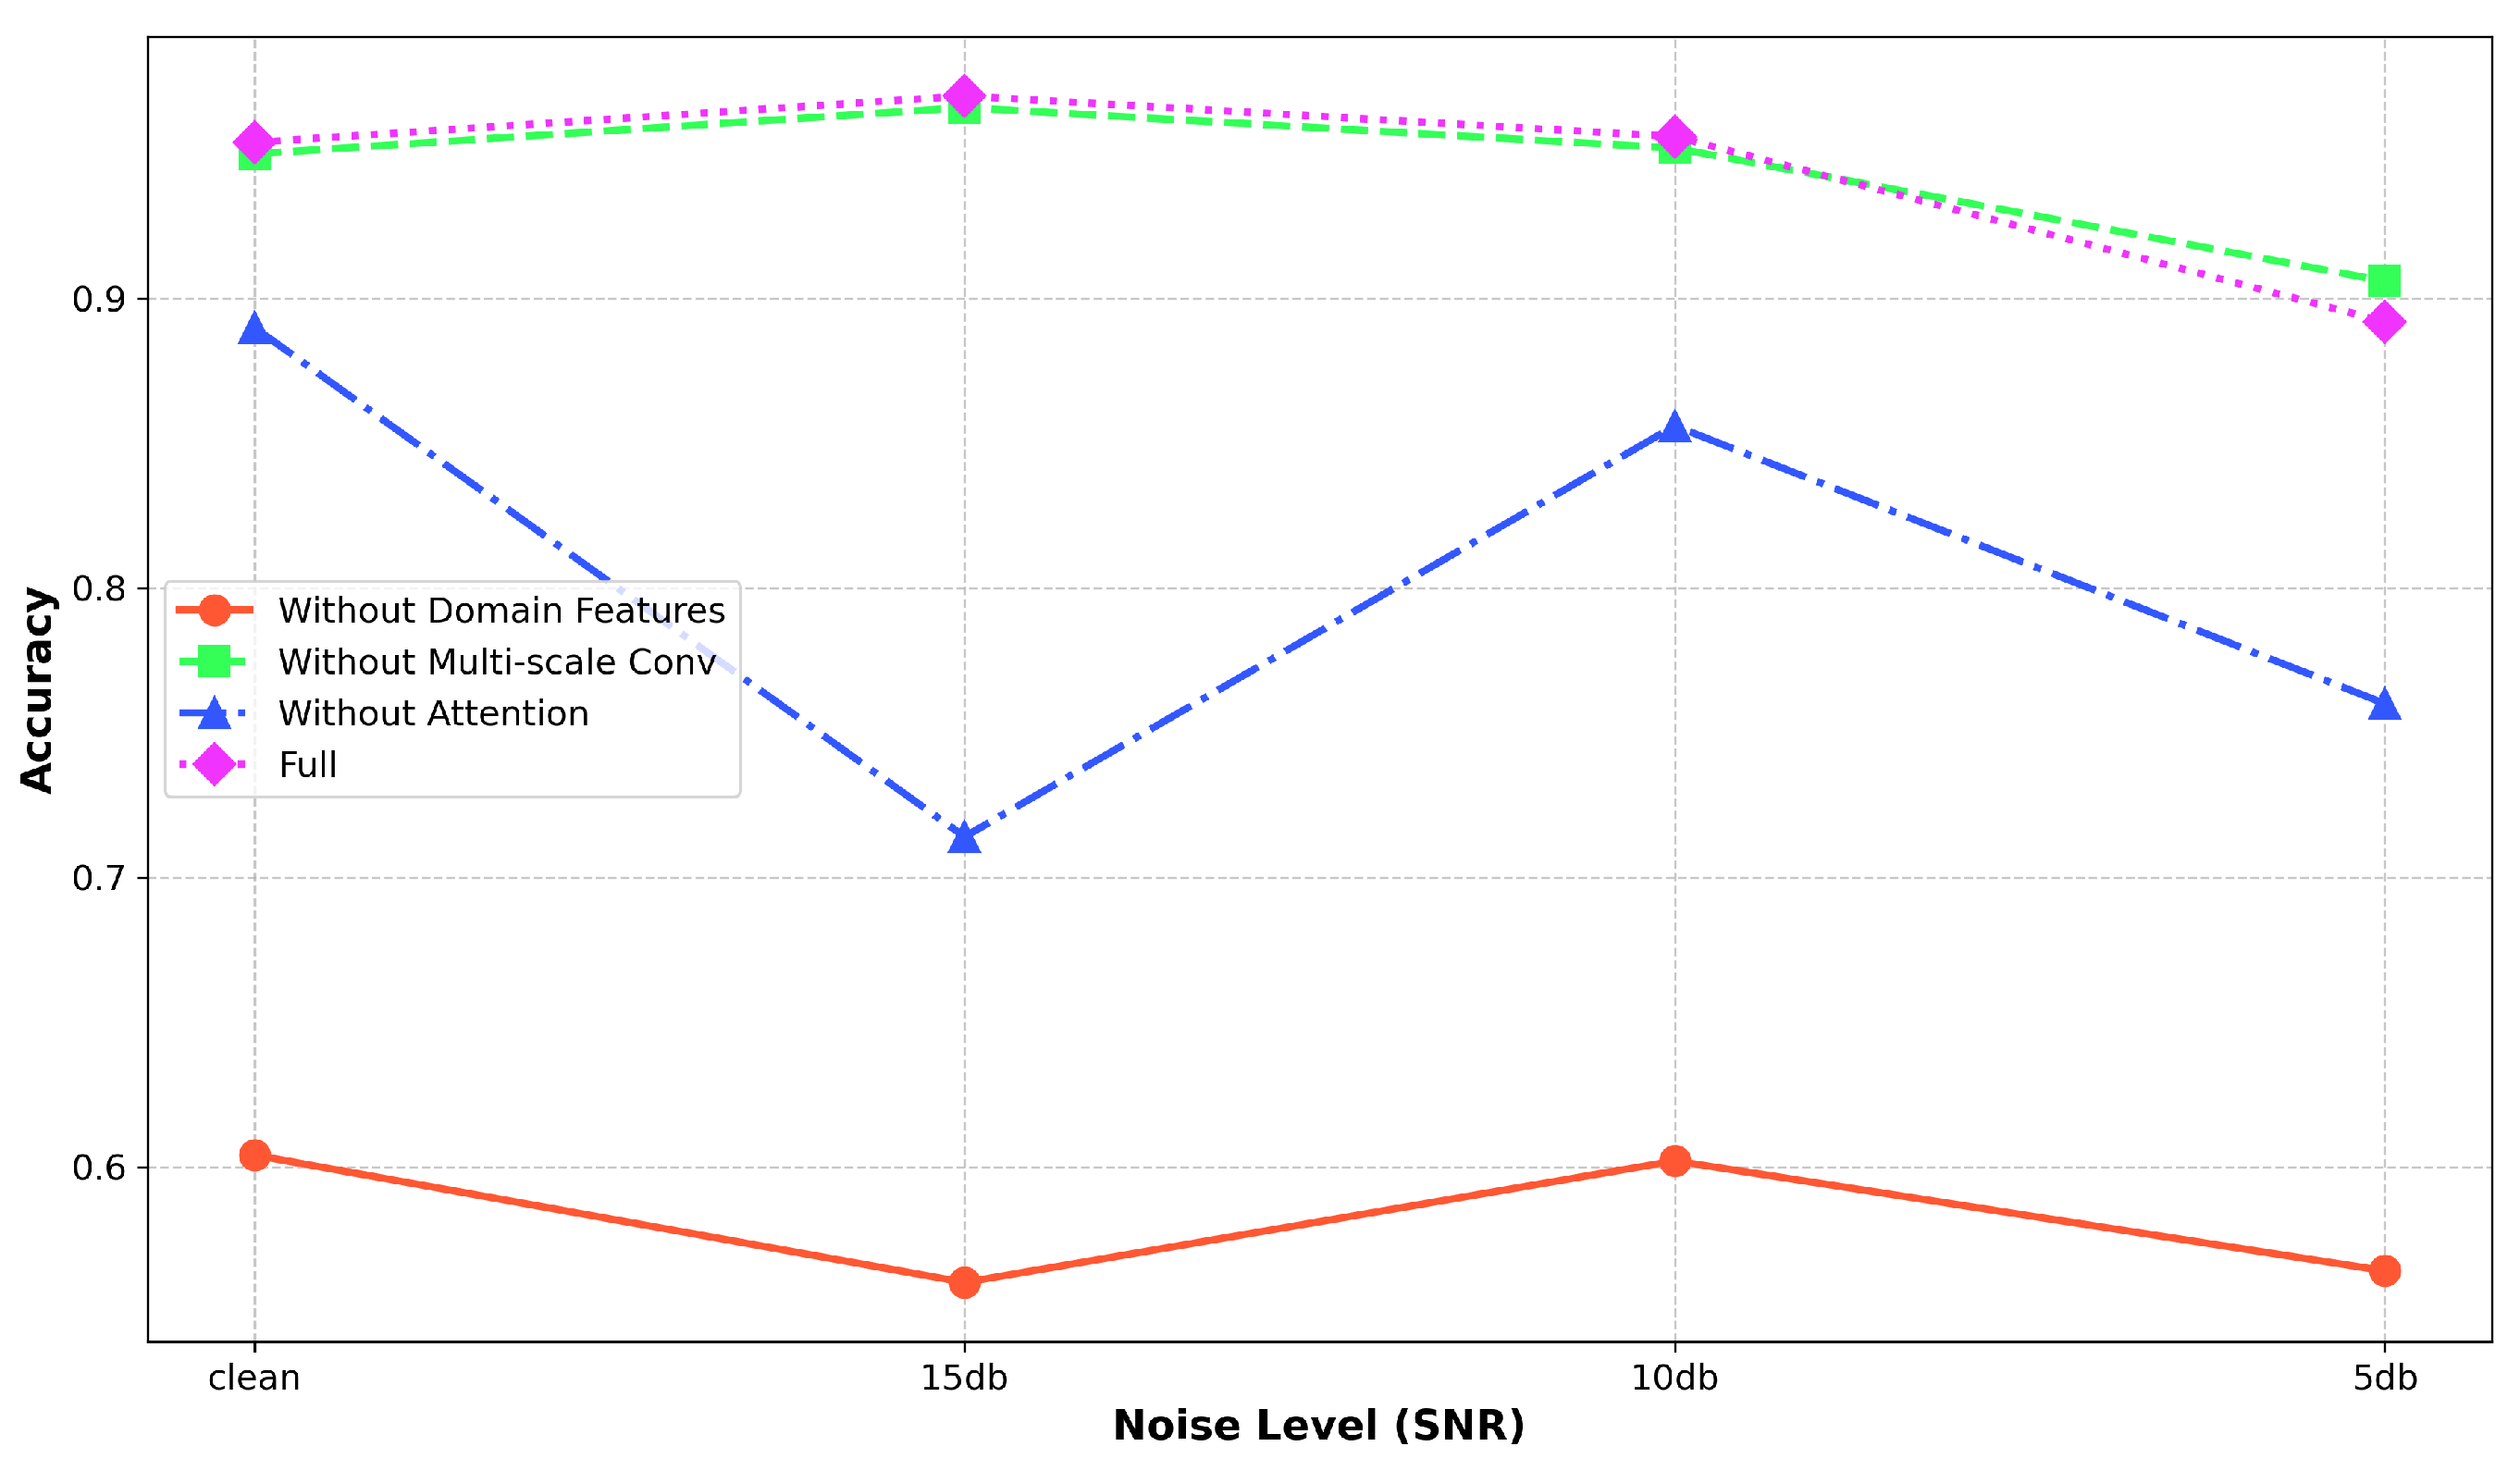
The ablation study presented in Figure 9 evaluates the contribution of each key component to the model’s performance across various noise levels. Four model configurations were tested: the full model and three variants with one component removed (domain features, multi-scale convolution, or attention mechanism).
The results clearly demonstrate that the full model achieves the highest accuracy under most noise conditions, maintaining performance above 0.95 in clean conditions and at 15 dB and 10 dB SNRs, with only a slight decrease to approximately 0.89 at a 5 dB SNR.
Removing the attention mechanism causes the most substantial performance degradation across all the noise levels, with accuracy dropping to approximately 0.71 at a 15 dB SNR, indicating this component’s critical importance for noise robustness.
The variant without multi-scale convolution performs similarly to the full model in cleaner conditions but shows increased vulnerability at the lowest SNR (5 dB).
The model without domain features consistently performs worst across all the conditions, with accuracy ranging from approximately 0.55 to 0.60, highlighting that domain-specific features are fundamental to the model’s diagnostic capabilities.
These findings confirm that each component makes a significant contribution to the model’s overall performance, with their integration enabling robust fault diagnosis even under challenging noise conditions.

5. Conclusions

This study proposes a novel MSDCAN for rotating machinery fault diagnosis and validates its effectiveness under various noise conditions through comprehensive comparison with traditional machine learning and deep learning methods. Based on the experimental results, the following conclusions are summarized:
(1) The proposed multi-domain feature fusion strategy effectively integrates domain knowledge with data-driven approaches by combining time-domain, frequency-domain, and wavelet-domain features. The adaptive signal preprocessing and domain knowledge-driven feature extraction successfully suppress industrial noise while preserving critical fault information, providing a robust foundation for rotating machinery fault diagnosis in demanding applications. Ablation studies reveal that domain features are most critical for bearing fault diagnosis noise robustness, while multi-scale convolution and attention mechanisms prove more crucial for gear fault diagnosis in distinguishing between similar crack severities.
(2) The multi-scale attention mechanism demonstrates superior capability in capturing both local transient impacts and global periodic patterns characteristic of rotating machinery faults. The bidirectional cross-attention fusion enables dynamic feature interaction between domain knowledge features and deep learned features, allowing the model to focus on discriminative signal components. The architecture’s adaptability across different fault diagnosis scenarios confirms its versatility for various rotating machinery components and fault characteristics.
(3) Comprehensive experimental validation on two distinct datasets confirms the effectiveness of MSDCAN across different noise conditions and fault types, demonstrating robust performance characteristics across diverse application scenarios. On the CWRU bearing dataset, MSDCAN achieves consistent superiority across all noise conditions, with 97.3% accuracy under clean conditions and maintaining 85.5% accuracy at 5dB SNR, significantly outperforming CNN (63.6%), Transformer (79.3%), SVM (80.0%), and BPNN (52.4%) under challenging noise conditions. On the XJTU gear dataset, MSDCAN demonstrates excellent performance under clean (94.8%) and low-noise conditions (95.0% at 15dB SNR), establishing clear superiority in these scenarios. However, under high-noise conditions, the Transformer model exhibits superior resilience, achieving 85.0% and 78.8% accuracy at 10dB and 5dB SNR respectively, compared to MSDCAN’s 83.6% and 63.8%. Overall, MSDCAN demonstrates consistent superiority across the majority of testing scenarios, establishing its robustness and effectiveness for rotating machinery fault diagnosis under diverse operational conditions.
While the proposed MSDCAN demonstrates overall superior performance across the majority of tested conditions, achieving comprehensive leadership on the CWRU bearing dataset and excelling under clean and moderate noise conditions on the XJTU gear dataset, the study acknowledges performance variations under extreme noise scenarios for specific fault types. The current validation, conducted under controlled laboratory conditions, may not fully capture the complexity of real-world operational environments, such as those found in offshore wind turbines. Despite these limitations, the comprehensive experimental results establish MSDCAN as a robust and generalizable approach for rotating machinery fault diagnosis. Future work will focus on bridging this gap through comprehensive experimental validation using vibration data collected from operational offshore wind turbines, and exploring enhanced noise-resilient mechanisms to further improve performance consistency across all industrial scenarios and extreme noise conditions.

Author Contributions

Conceptualization, L.-M.X. and X.-B.W.; methodology, L.-M.X. and X.-B.W.; software, L.-M.X.; validation, L.-M.X. and P.K.W.; formal analysis, L.-M.X.; resources, L.-M.X.; data curation, L.-M.X. and X.-B.W.; writing—original draft preparation, L.-M.X.; writing—review and editing, L.-M.X., P.K.W., Z.-J.G. and X.-B.W.; visualization, L.-M.X. and Z.-J.G.; supervision, X.-B.W., P.K.W., J.Z. and Z.-X.Y.; project administration, P.K.W.; funding acquisition, X.-B.W., P.K.W., J.Z. and Z.-X.Y. All authors have read and agreed to the published version of the manuscript.

Funding

This research was funded by the National Key Research and Development Program of China (Grant No. 2023YFE0204700), by the National Natural Science Foundation of China (Grant Nos. 52175127, 52467024, and 62461160260), by the National Key Research and Development Program of China (Grant No. 2023YFE0205800), by the Guangdong Basic and Applied Basic Research Foundation (Grant No. 2023A1515012327), by Guangdong Science and Technology Department (Grant No. 2023A0505030003), by the International Science and Technology project of Guangzhou Development District (Grant No. 2022GH09), by the Zhuhai Science and Technology Innovation Bureau (Grant no. ZH2220004003107), by the Science and Technology Development Fund, Macau SAR (Grant Nos. 0075/2023/AMJ, 0091/2023/AMJ, 0092/2024/AFJ, 0003/2023/RIB1, and 001/2024/SKL), by the research grant of the Natural Science Foundation of Shandong Province (Grant No. ZR2023ME133), by the Hainan Provincial Sanya Yazhou Bay Science and Technology Innovation Joint Project (Grant No. ZDYF2025GXJS142), by the Hainan Provincial Natural Science Foundation of China (Grant No. 525MS108), and by the Funding for Guangzhou Science and Technology Project (Grant No. 2025B01J2002).

Data Availability Statement

The data used in this study can be found on the Case Western Reserve University Fault Diagnosis Dataset website at https://engineering.case.edu/bearingdatacenter/download-data-file (accessed on 1 August 2025) and the XJTUSpurgear dataset website at https://drive.google.com/drive/folders/1ejGZu9oeL1D9nKN07Q7z72O8eFrWQTay (accessed on 1 August 2025).

Conflicts of Interest

The authors declare that they have no known competing financial interests or personal relationships that could have appeared to influence the work reported in this paper.

References

  1. Artigao, E.; Martín-Martínez, S.; Honrubia-Escribano, A.; Gómez-Lázaro, E. Wind Turbine Reliability: A Comprehensive Review towards Effective Condition Monitoring Development. Appl. Energy 2018, 228, 1569–1583. [Google Scholar] [CrossRef]
  2. Du, Y.; Geng, X.; Zhou, Q.; Cheng, S. A Fault Diagnosis Method for Offshore Wind Turbine Bearing Based on Adaptive Deep Echo State Network and Bidirectional Long Short Term Memory Network in Noisy Environment. Ocean Eng. 2024, 312, 119101. [Google Scholar] [CrossRef]
  3. Zhong, J.-H.; Liang, J.; Yang, Z.-X.; Wong, P.K.; Wang, X.-B. An Effective Fault Feature Extraction Method for Gas Turbine Generator System Diagnosis. Shock Vib. 2016, 2016, 9359426. [Google Scholar] [CrossRef]
  4. Jalayer, M.; Kaboli, A.; Orsenigo, C.; Vercellis, C. Fault Detection and Diagnosis with Imbalanced and Noisy Data: A Hybrid Framework for Rotating Machinery. Machines 2022, 10, 237. [Google Scholar] [CrossRef]
  5. Jing, Q.; Yan, J.; Wang, Y.; Huang, J.; Xiao, H.; Ding, R.; Wang, J.; Geng, Y. A Novel Small-Sample Diagnosis Method for GIS Partial Discharge by Transfer Robust Support Matrix Machine. Measurement 2025, 255, 118054. [Google Scholar] [CrossRef]
  6. Wang, Y.; Wang, T.; Liu, L. A Fault Segment Location Method for Distribution Networks Based on Spiking Neural P Systems and Bayesian Estimation. Prot. Control Mod. Power Syst. 2023, 8, 47. [Google Scholar] [CrossRef]
  7. Chen, R.; Li, X.; Chen, Y. Optimal Layout Model of Feeder Automation Equipment Oriented to the Type of Fault Detection and Local Action. Prot. Control Mod. Power Syst. 2023, 8, 2. [Google Scholar] [CrossRef]
  8. Zhang, Y.; Sun, H.; Li, H.; Qi, D.; Yan, Y.; Chen, Z.; Huang, X. Bird Pecking Damage Risk Assessment of UHV Transmission Line Composite Insulators Based on Deep Learning. IET Gener. Trans. Dist. 2023, 17, 2788–2798. [Google Scholar] [CrossRef]
  9. Lan, L.; Liu, G.; Zhu, S.; Hou, M.; Liu, X. Fault Recovery Strategy for Urban Distribution Networks Using Soft Open Points. Energy Convers. Econom. 2024, 5, 42–53. [Google Scholar] [CrossRef]
  10. Li, D.; Lu, J.; Zhang, T.; Ding, J. Feature Hybrid Fusion-Based Fault Diagnosis of Multi-Scale and Multi-Stage Industrial Processes. J. Process Control 2025, 152, 103460. [Google Scholar] [CrossRef]
  11. Zhang, Y.; Zhao, X.; Peng, Z.; Hui, Y.; Xu, R.; Chen, P. An Interpretable Frequency-Enhanced Domain Adaptive Network for Cross-Domain Fault Diagnosis of Rotating Machinery. Appl. Acoust. 2025, 240, 110934. [Google Scholar] [CrossRef]
  12. Chen, Z.; Zhang, H.; Tao, Z.; Wang, Y. Intelligent Fault Diagnosis of Rolling Bearing Based on Time–Frequency Processing and DLKA-YOLO. Franklin Open 2025, 10, 100228. [Google Scholar] [CrossRef]
  13. Wei, J.; Chen, H.; Yuan, Y.; Huang, H.; Wen, L.; Jiao, W. Novel Imbalanced Multi-Class Fault Diagnosis Method Using Transfer Learning and Oversampling Strategies-Based Multi-Layer Support Vector Machines (ML-SVMs). Appl. Soft Comput. 2024, 167, 112324. [Google Scholar] [CrossRef]
  14. Qin, H.; Yang, R.; Guo, C.; Wang, W. Fault Diagnosis of Electric Rudder System Using PSOFOA-BP Neural Network. Measurement 2021, 186, 110058. [Google Scholar] [CrossRef]
  15. Yang, T.; Jiang, L.; Guo, Y.; Han, Q.; Li, X. LTFM-Net Framework: Advanced Intelligent Diagnostics and Interpretability of Insulated Bearing Faults in Offshore Wind Turbines under Complex Operational Conditions. Ocean Eng. 2024, 309, 118533. [Google Scholar] [CrossRef]
  16. Tang, S.; Ma, J.; Yan, Z.; Zhu, Y.; Khoo, B.C. Deep Transfer Learning Strategy in Intelligent Fault Diagnosis of Rotating Machinery. Eng. Appl. Artif. Intell. 2024, 134, 108678. [Google Scholar] [CrossRef]
  17. Xu, Z.; Li, C.; Yang, Y. Fault Diagnosis of Rolling Bearings Using an Improved Multi-Scale Convolutional Neural Network with Feature Attention Mechanism. ISA Trans. 2021, 110, 379–393. [Google Scholar] [CrossRef]
  18. Lei, Y.; Yang, B.; Jiang, X.; Jia, F.; Li, N.; Nandi, A.K. Applications of Machine Learning to Machine Fault Diagnosis: A Review and Roadmap. Mech. Syst. Signal Process. 2020, 138, 106587. [Google Scholar] [CrossRef]
  19. Chen, H.; Li, J.; Wang, X.-B.; Yu, L.-Q.; Yang, Z.-X. Review of Intelligent Fault Diagnosis for Rotating Machinery under Imperfect Data Conditions. Expert Syst. Appl. 2025, 285, 127726. [Google Scholar] [CrossRef]
  20. Yang, D.; Karimi, H.R.; Pawelczyk, M. A New Intelligent Fault Diagnosis Framework for Rotating Machinery Based on Deep Transfer Reinforcement Learning. Control Eng. Pract. 2023, 134, 105475. [Google Scholar] [CrossRef]
  21. Zhao, R.; Yan, R.; Chen, Z.; Mao, K.; Wang, P.; Gao, R.X. Deep Learning and Its Applications to Machine Health Monitoring. Mech. Syst. Signal Process. 2019, 115, 213–237. [Google Scholar] [CrossRef]
  22. Arabian-Hoseynabadi, H.; Oraee, H.; Tavner, P.J. Failure Modes and Effects Analysis (FMEA) for Wind Turbines. Int. J. Electr. Power Energy Syst. 2010, 32, 817–824. [Google Scholar] [CrossRef]
  23. Xin, G.; Zhong, Q.; Jin, Y.; Li, Z.; Chen, Y.; Li, Y.-F.; Antoni, J. Autonomous Bearing Fault Diagnosis Based on Fault-Induced Envelope Spectrum and Moving Peaks-Over-Threshold Approach. IEEE Trans. Instrum. Meas. 2024, 73, 1–12. [Google Scholar] [CrossRef]
  24. Djemili, I.; Medoued, A.; Soufi, Y. A Wind Turbine Bearing Fault Detection Method Based on Improved CEEMDAN and AR-MEDA. J. Vib. Eng. Technol. 2024, 12, 4225–4246. [Google Scholar] [CrossRef]
  25. Nayana, B.R.; Geethanjali, P. Analysis of Statistical Time-Domain Features Effectiveness in Identification of Bearing Faults from Vibration Signal. IEEE Sens. J. 2017, 17, 5618–5625. [Google Scholar] [CrossRef]
  26. Zhou, Q.; Tang, J. An Interpretable Parallel Spatial CNN-LSTM Architecture for Fault Diagnosis in Rotating Machinery. IEEE Internet Things J. 2024, 11, 31730–31744. [Google Scholar] [CrossRef]
  27. Missaoui, I.; Lachiri, Z. Stationary Wavelet Filtering Cepstral Coefficients (SWFCC) for Robust Speaker Identification. Appl. Acoust. 2025, 231, 110435. [Google Scholar] [CrossRef]
  28. Lu, Z.; Liang, L.; Zhu, J.; Zou, W.; Mao, L. Rotating Machinery Fault Diagnosis Under Multiple Working Conditions via a Time-Series Transformer Enhanced by Convolutional Neural Network. IEEE Trans. Instrum. Meas. 2023, 72, 1–11. [Google Scholar] [CrossRef]
  29. Wang, C.; Deng, X.; Sun, Y.; Yan, L. Research on Image Classification Based on Residual Group Multi-Scale Enhanced Attention Network. Comput. Electr. Eng. 2024, 118, 109351. [Google Scholar] [CrossRef]
  30. Li, H.; Yu, H.; Liu, Z.; Li, F.; Wu, X.; Cao, B.; Zhang, C.; Liu, D. Long-term Scenario Generation of Renewable Energy Generation Using Attention-based Conditional Generative Adversarial Networks. Energy Convers. Econ. 2024, 5, 15–27. [Google Scholar] [CrossRef]
  31. Wang, J.; Chen, Y.; Gu, Y.; Yan, Y.; Li, Q.; Gao, M.; Dong, Z. A Lightweight Vehicle Mounted Multi-Scale Traffic Sign Detector Using Attention Fusion Pyramid. J. Supercomput. 2024, 80, 3360–3381. [Google Scholar] [CrossRef]
  32. Yin, H.; Chen, Q.; Chen, L.; Shen, C. Cross-Attention Transformer-Based Domain Adaptation: A Novel Method for Fault Diagnosis of Rotating Machinery with High Generalizability and Alignment Capability. IEEE Sens. J. 2024, 24, 40049–40058. [Google Scholar] [CrossRef]
  33. Wang, X.; Chen, H.; Zhao, J.; Song, C.; Zhang, Y.; Yang, Z.-X.; Wong, P.K. Wind Turbine Fault Diagnosis for Class-Imbalance and Small-Size Data Based on Stacked Capsule Autoencoder. IEEE Trans. Ind. Inf. 2024, 20, 12694–12704. [Google Scholar] [CrossRef]
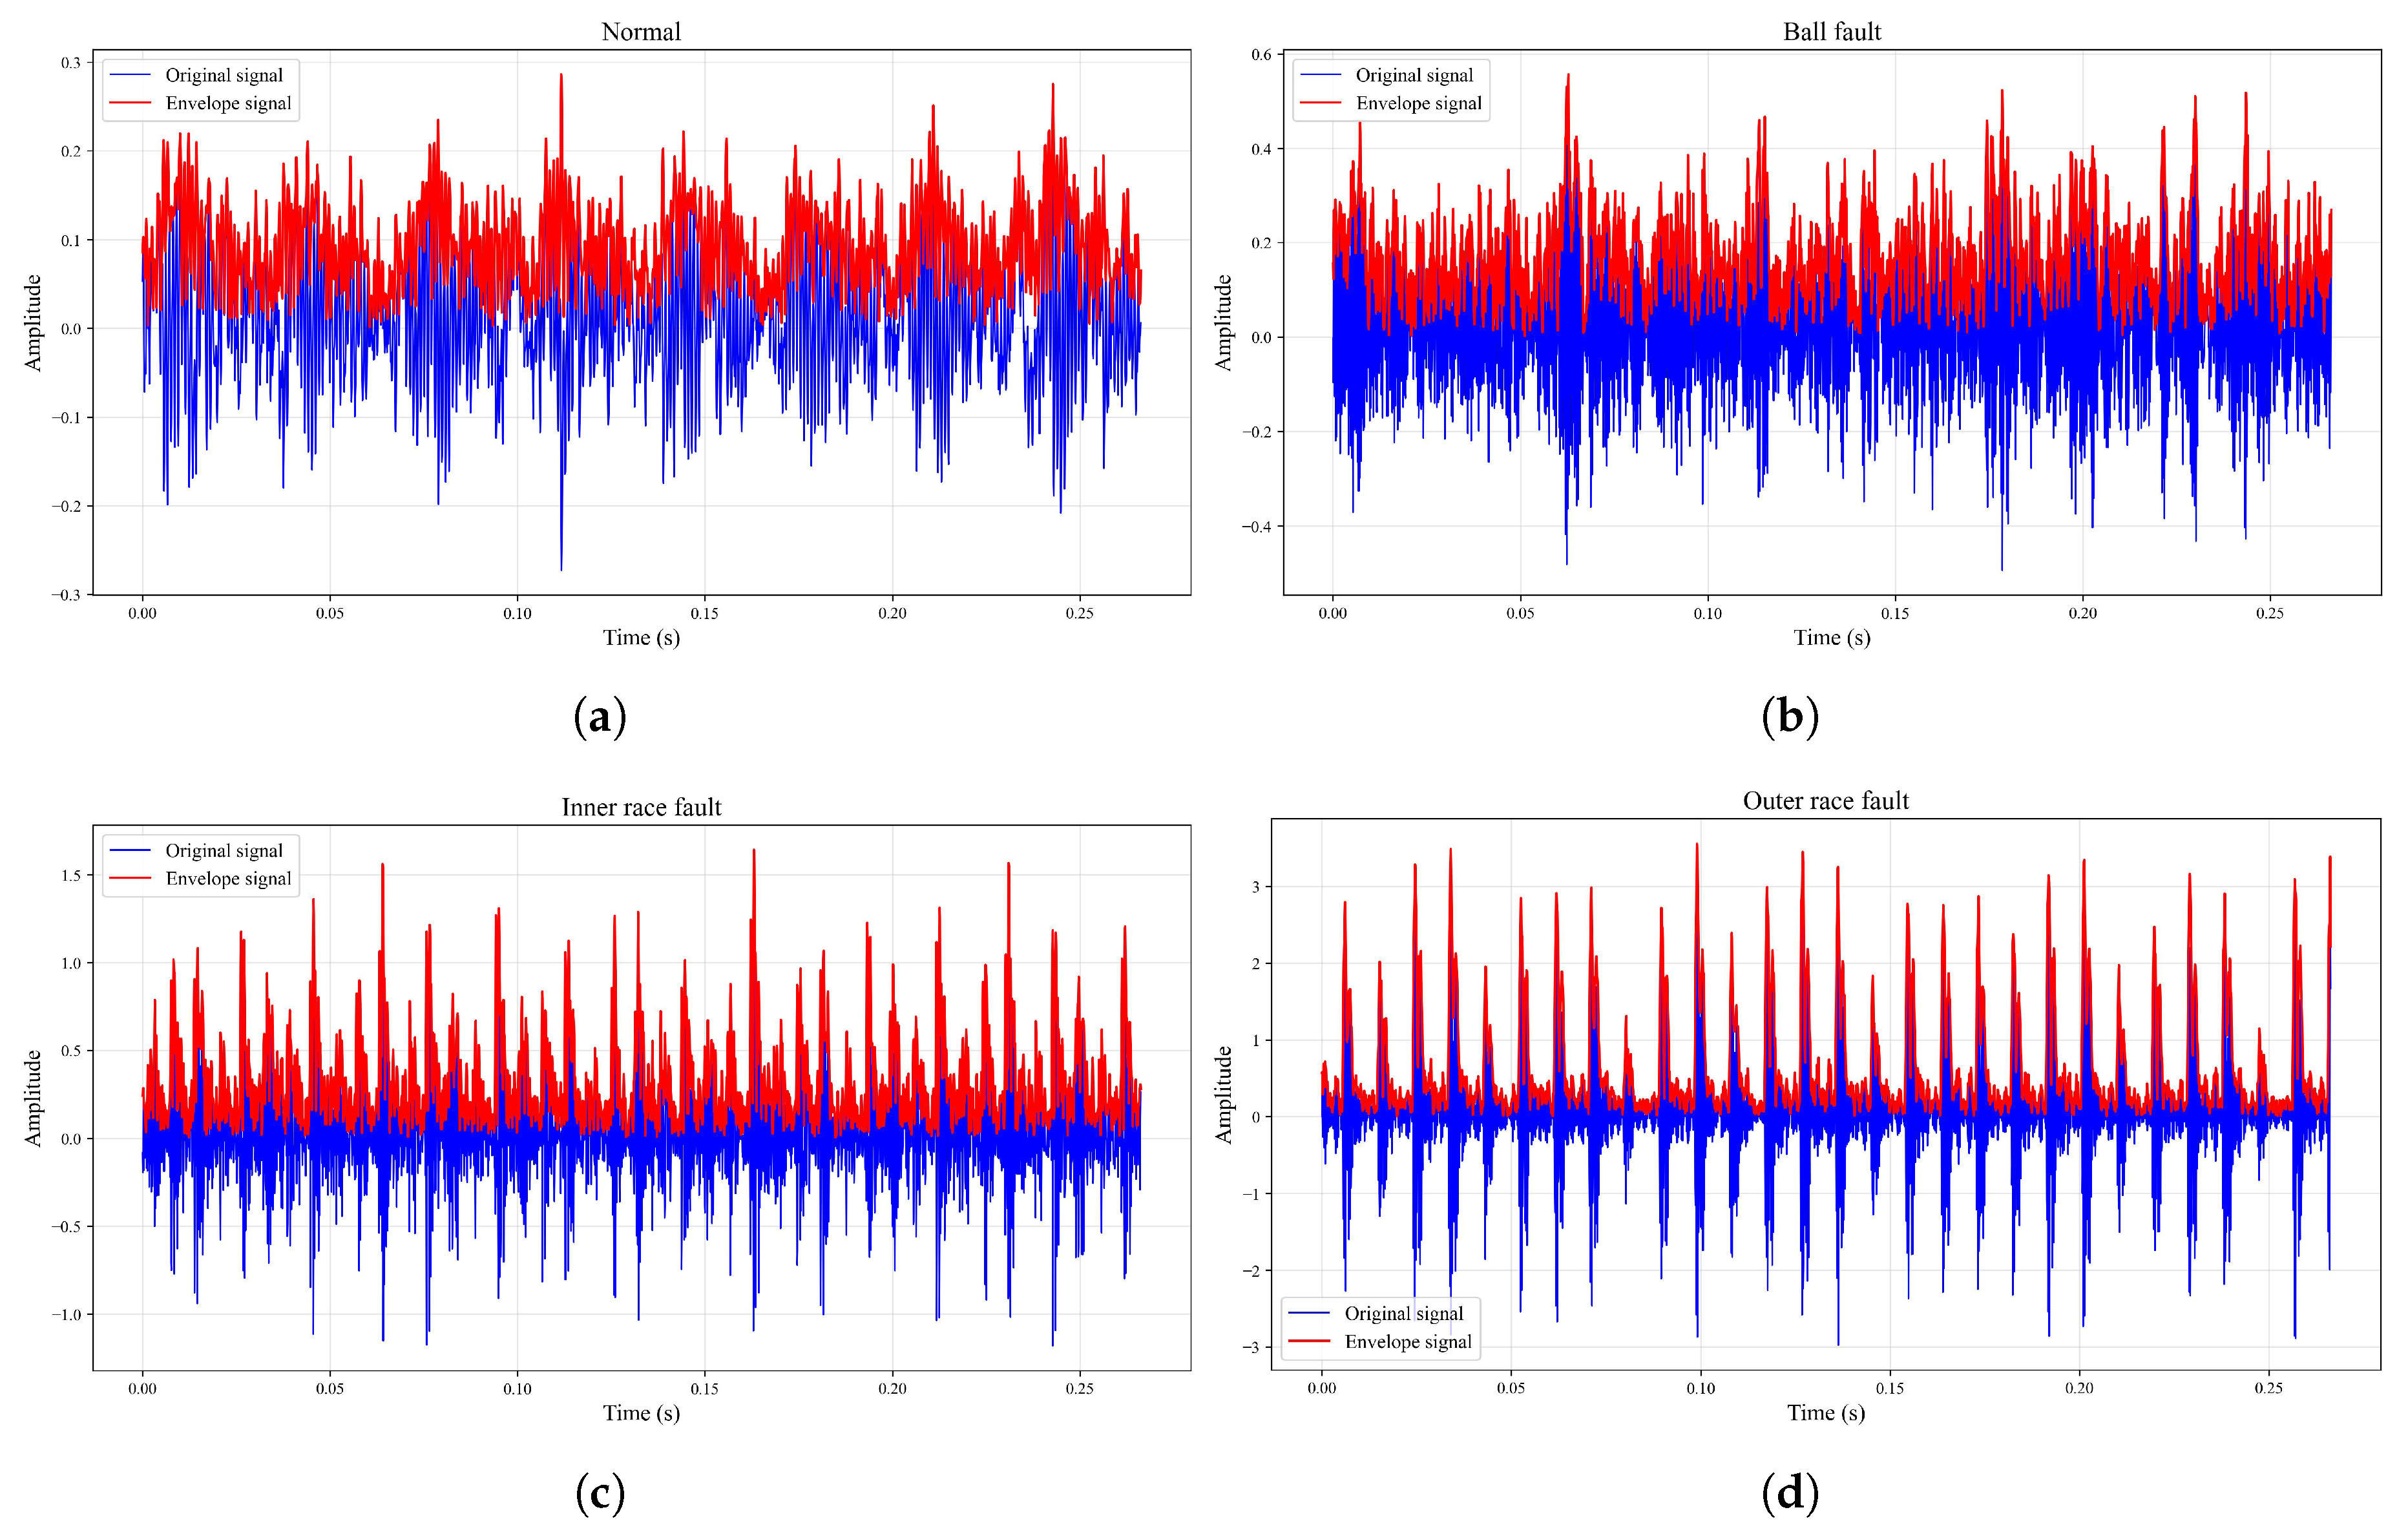
Figure 1. Time-domainwaveforms and their corresponding envelope signals for four different bearing health conditions: (a) normal condition with a stable low-amplitude signal; (b) ball fault with complex and less periodic impulses; (c) inner race fault with distinct periodic impulses; (d) outer race fault with a highly regular and prominent impulse pattern.
Electronics 14 03805 g001
Figure 2. Envelopespectra analysis for fault identification based on characteristic frequencies and harmonic patterns: (a) envelope spectrum for the normal condition; (b) envelope spectrum for the rolling element fault; (c) envelope spectrum for the inner race fault; (d) envelope spectrum for the outer race fault.
Electronics 14 03805 g002
Figure 3. The architecture of MSDCAN.
Electronics 14 03805 g003
Figure 4. Performance comparison of the proposed MSDCAN model with CNN, transformer, SVM, and BPNN on the CWUR dataset under clean, 15 dB, 10 dB, and 5 dB noise levels. The bar charts illustrate the results for four key evaluation metrics: (a) a comparison of the diagnostic accuracy scores; (b) a comparison of the precision scores; (c) a comparison of the recall scores; (d) a comparison of the F1-scores for each model.
Electronics 14 03805 g004
Figure 5. Confusion matrices illustrating the diagnostic robustness of the proposed MSDCAN model on the CWUR dataset under four distinct signal conditions: (a) the baseline condition with no added noise; (b) the low-noise condition with an added 15 dB signal-to-noise ratio (SNR); (c) the moderate-noise condition with an added 10 dB SNR; (d) the high-noise condition with an added 5 dB SNR.
Electronics 14 03805 g005
Figure 6. Performance comparison of the full model and its ablated variants on the CWUR dataset under different signal-to-noise ratio (SNR) conditions.
Electronics 14 03805 g006
Figure 7. Performance comparison of the proposed MSDCAN model with CNN, transformer, SVM, and BPNN on the XJTUSpurgear dataset under clean, 15 dB, 10 dB, and 5 dB noise levels. The bar charts illustrate the results for four key evaluation metrics: (a) a comparison of the diagnostic accuracy scores; (b) a comparison of the precision scores; (c) a comparison of the recall scores; (d) a comparison of the F1-scores for each model.
Electronics 14 03805 g007
Figure 8. Confusion matrices illustrating the diagnostic robustness of the proposed MSDCAN model on the XJTUSpurgear dataset under four distinct signal conditions: (a) the baseline condition with no added noise; (b) the low-noise condition with an added 15 dB signal-to-noise ratio (SNR); (c) the moderate-noise condition with an added 10 dB SNR; (d) the high-noise condition with an added 5 dB SNR.
Electronics 14 03805 g008
Figure 9. Performance comparison of the full model and its ablated variants on the XJTUSpurgear dataset under different signal-to-noise ratio (SNR) conditions.
Electronics 14 03805 g009
Table 1. Comparative analysis of mechanical fault diagnosis methods.
FrameworkNoise Handling StrategiesDescriptionReference
CPAEBLImproved CEEMDAN with correlation–skewness IMF selection plus phase-space reconstruction suppresses noise while preserving nonlinear dynamics.Integrates noise-robust IMF selection and phase-space reconstruction with adaptive deep reservoir and BiLSTM for high-noise bearing diagnosis.[2]
GAN-CLSTM-ELMFFT/CWT multi-domain feature extraction and WGAN-GP augmentation mitigate random noise and imbalance.Uses spectral–time–frequency fusion plus GAN augmentation and weighted ELM to address noise and class imbalance.[4]
C-TransMulti-scale convolutions and attention highlight salient fault patterns under noisy multi-condition signals.Combines multi-scale CNN feature extraction with transformer attention to relate fault patterns to classes.[28]
Parallel CNN–LSTMParallel raw and wavelet branches exploit time–frequency localization to attenuate background noise.Dual branches fuse raw temporal features and wavelet coefficients to enhance discriminative representation with minimal manual features.[26]
Table 2. Training hyperparameters and model configurations.
SymbolValueParameter
B32Batch Size
η 0.0001Learning Rate
λ 1 × 10 4 Weight Decay
E40Number of Epochs
p d r o p 0.3Dropout Rate
τ 1.0Gradient Clipping
P5Scheduler Patience
γ 0.5Scheduler Factor
Table 3. Comparative analysis of model performance across various noise conditions on the CWRU bearing dataset.
ModelCleanSNR (15 dB)SNR (10 dB)SNR (5 dB)
CNN0.6910.6980.6940.636
Transformer0.9080.9050.8780.793
SVM0.9430.9370.9410.800
BPNN0.7240.7220.7010.524
MSDCAN0.9730.9660.9440.855
Table 4. Comparative analysis of model performance on XJTU dataset across various noise conditions.
ModelCleanSNR (15 dB)SNR (10 dB)SNR (5 dB)
CNN0.6280.6500.6340.568
Transformer0.8160.8380.8500.788
SVM0.8760.6940.5520.310
BPNN0.5820.4100.4040.384
MSDCAN0.9480.9500.8360.638
Disclaimer/Publisher’s Note: The statements, opinions and data contained in all publications are solely those of the individual author(s) and contributor(s) and not of MDPI and/or the editor(s). MDPI and/or the editor(s) disclaim responsibility for any injury to people or property resulting from any ideas, methods, instructions or products referred to in the content.