Abstract
Understanding the cultural and environmental influences on roadway crash patterns is essential for designing effective prevention strategies. This study applies advanced AI techniques, including Bidirectional Encoder Representations from Transformers (BERT) and Shapley Additive Explanations (SHAP), to examine traffic crash patterns in the United States and Jordan. By analyzing tabular data and crash narratives, the research reveals significant regional differences: in the USA, vehicle overturns and roadway conditions, such as guardrails, are major factors in fatal crashes, whereas in Jordan, technical defects and driver behavior play a more critical role. SHAP analysis identifies “driver” and “damage” as pivotal terms across both regions, while country-specific terms such as “overturn” in the USA and “technical” in Jordan highlight regional disparities. Using BERT/Bi-LSTM models, the study achieves up to 99.5% accuracy in crash severity prediction, demonstrating the robustness of AI in traffic safety analysis. These findings underscore the value of contextualized AI-driven insights in developing targeted, region-specific road safety policies and interventions. By bridging the gap between developed and developing country contexts, the study contributes to the global effort to reduce road traffic injuries and fatalities.
1. Introduction
Road crash injuries are projected to become the fifth leading cause of mortality globally by 2030, highlighting the pressing need for effective prevention strategies in transportation safety management [1]. Accurate forecasting of traffic crashes is a critical component of these strategies, as it enables the identification of potential risks and the development of targeted interventions [2,3]. Crash pattern analysis, which involves examining the factors contributing to road crashes, plays a vital role in identifying these risks. However, it is essential to recognize that crash patterns and contributing factors can vary significantly across cultural and geographical contexts. Traditional crash analysis methods often rely on statistical models that struggle to capture the nuanced and non-linear relationships present in crash narratives. Additionally, there is a lack of cross-cultural comparisons that leverage advanced AI techniques to address these gaps. Studying crash patterns in diverse regions provides valuable insights into how cultural, social, and environmental factors influence road safety, enabling the formulation of more tailored and effective prevention measures [4].
This study focuses on crash patterns in two culturally and infrastructurally distinct regions, the United States and Jordan, to explore how varying socio-economic, legal, and environmental factors shape traffic safety outcomes. The United States, as a developed nation with extensive road networks and advanced traffic safety measures, presents a markedly different context compared to Jordan, a developing country facing challenges such as older vehicle fleets, variable enforcement of traffic laws, and unique cultural driving behaviors. By analyzing these contrasting settings, the study aims to uncover shared and region-specific factors influencing road safety, enhancing understanding of diverse traffic safety challenges.
By leveraging state-of-the-art natural language processing (NLP) techniques, this research performs a detailed analysis of crash narratives from the two regions, focusing on fatal and non-fatal crashes. Bidirectional Encoder Representations from Transformers (BERT) are employed for topic modeling and classification tasks, while Shapley Additive Explanations (SHAP) enhance model interpretability. This approach fills a critical research gap by providing a detailed, AI-driven comparative analysis of crash patterns across developed and developing countries, enabling a more comprehensive understanding of global traffic safety challenges. By addressing gaps in existing research, this study uncovers novel insights into cultural, infrastructural, and legal factors influencing crash outcomes and develops actionable recommendations for improving road safety in both developed and developing countries. The objectives of this study are threefold:
- To analyze crash patterns in the USA and Jordan, identifying cultural, infrastructural, and legal factors that contribute to crash outcomes.
- To apply BERT-based models and SHAP to enhance predictive accuracy and model transparency, uncovering critical risk factors.
- To provide region-specific policy recommendations for road safety, including infrastructure improvements, vehicle safety standards, and emergency response strategies.
By integrating AI-driven methods and focusing on two distinct cultural contexts, this research aims to bridge methodological gaps and contribute to global road safety efforts.
2. Literature Review
Traditional data-driven regression models have been widely used to model crash severity, offering valuable mathematical interpretations and insights into individual predictor variables. However, these models are limited by their reliance on underlying assumptions, such as linear link functions and error distribution terms, which, if violated, can lead to biased estimates and reduced predictive accuracy [5,6]. This limitation is particularly critical when modeling complex crash dynamics, where interactions between factors are non-linear and highly context-dependent. Advanced data collection techniques, such as mobile LiDAR systems and point cloud applications, have significantly improved traffic safety analysis by capturing detailed spatial and environmental data [7]. Despite their contributions, these technologies often fall short of providing contextual insights, such as driver behavior and cultural factors that significantly influence crash dynamics.
In contrast, text-based Natural Language Processing (NLP) methods like BERT enable the extraction of nuanced crash factors from narrative reports, offering insights into the cultural and behavioral elements surrounding crash incidents. A recent study highlighted the potential of deep NLP approaches, including ensemble learning with pre-trained transformers, for improving crash severity classification, demonstrating their capability in harnessing unconventional data sources for traffic safety analysis [8]. Integrating narrative analysis with spatial data facilitates a holistic understanding of road safety factors, addressing gaps left by traditional approaches.
Various methodologies, including association rule mining, spatial statistical analysis, kernel density estimation (KDE), and sequence analysis, to investigate crash patterns and understand crash patterns [1,2,3,4,5]. These methods have proven effective in identifying spatial and temporal crash trends, crash-prone areas, and crash sequences, forming a foundation for targeted safety measures [1,2,3,4,5]. Machine learning-based models, including support vector machines, decision trees, and deep learning, have emerged as promising tools in road safety research, particularly in addressing the limitations of traditional statistical approaches [6,9,10,11,12]. These models leverage real-time traffic data, such as traffic flow, speed, and volume, to identify crash-related trends and circumstances [13,14,15,16,17]. Resampling approaches have been recommended to enhance the predictive performance of machine learning algorithms in handling imbalanced crash datasets [18,19], thereby improving the reliability of predictions. A recent study by Jaradat et al. (2024) introduced a multitask learning framework that utilizes social media data, specifically Twitter, to analyze and detect real-time crash patterns, enabling faster and more targeted traffic management responses in dynamic conditions [20]. This innovation demonstrates the potential of AI in harnessing unconventional data sources for road safety improvements.
NLP techniques, such as BERT, facilitate the extraction of nuanced crash factors, allowing for a richer understanding of the elements influencing road safety in diverse cultural contexts. The flexibility and scalability of BERT in processing unstructured text have expanded the horizons of crash data analysis, enabling researchers to explore complex relationships within narrative data [21].
Numerous studies have investigated the factors affecting road crashes. Researchers investigated the effectiveness of artificial neural network models in simulating motorway crashes and established that the core reason for the occurrence of crashes is the average daily traffic volume and average vehicle speed [22]. Text-mining analyses have been employed to classify road traffic injury collision features, demonstrating their utility in road injury prevention [23]. Giummarra et al. (2022) performed text mining to classify crash circumstances by road user group and found that it can be used to uncover the features of road traffic injury [23]. These studies emphasize the value of text analysis in understanding crash dynamics across various contexts. Wang et al. (2017) analyzed the severity of traffic crash injuries at intersections and different sections of roads and showed the importance of understanding the differences in collision injury severity and their contributing factors [19]. This is complemented by studies like Darus et al. (2022), which highlight road characteristics and traffic conditions as critical contributors to collision severity and emphasize the necessity of incorporating multiple parameters into injury classification models [24]. Donnelly-Swift and Kelly (2015) used generalized linear regression models to identify variables related to fatal or serious injuries in single-vehicle road traffic crashes. Their study was important because it provided insight into the multidimensional aspects that result in injury severity [25].
Text mining methods, including thematic analysis, content analysis, and NLP, have been used to mine and analyze crash narrative textual data [26,27,28]. These methods can be employed to identify the contributing components that characterize crash patterns and explore the causation of crashes within unstructured narrative reports [27,29]. Association rule mining has played an instrumental role in identifying parameters associated with crash types, such as senior-driver crossing crashes [28]. Combining real-time traffic data with insights gleaned from crash narratives yields a more complete understanding of crash risk and causation. This holistic mechanism establishes the foundation for developing forecasting models for crashes in real-time, which are reliable, effective, and fundamental for proactive traffic management and safety enhancement [6,30].
Topic modeling is an unsupervised machine learning technique aimed at identifying abstract “topics” by clustering groups of words within a set of documents. The evolution of topic modeling techniques has significantly advanced the field of NLP, beginning with the introduction of Latent Semantic Analysis (LSA) and culminating in the development of Bidirectional Encoder Representations from Transformers (BERT) [31]. LSA, introduced by Deerwester et al. [32], marked the inception of extracting latent topics from text by decomposing term-document matrices, thereby uncovering the underlying semantic structure of the corpus. Following LSA, Blei et al. [33] introduced Latent Dirichlet Allocation (LDA). This generative probabilistic model improved upon LSA by allowing documents to be represented as mixtures of multiple topics, thus providing a more flexible and detailed method for topic discovery. Despite their effectiveness, both LSA and LDA are limited by their reliance on bag-of-words representations, which ignore the order of words and the contextual nuances of language. The advent of deep learning brought about significant advancements in topic modeling, with the introduction of models that could understand the context and semantics of words in text. BERT [34] represents a paradigm shift, leveraging a transformer architecture to generate deep contextualized word embeddings. Although LDA and BERT are established techniques in natural language processing, the present study distinguishes itself by applying these methods to a novel cross-cultural context in traffic safety analysis. The integration of BERT for topic modeling and text classification with the addition of SHAP for model interpretability offers a fresh perspective that enhances the understanding of crash patterns in different cultural settings. This approach applies advanced NLP techniques to a new domain and introduces a comprehensive methodology that can be adapted for broader applications in road safety research. This work, therefore, contributes meaningfully to the field by bridging the gap between methodological rigor and practical application in a critical public safety domain.
Traffic crashes have been studied from a cross-cultural perspective in numerous research. These studies have assessed risks in road behavior, the incidence of aggressive driving, and driving behaviors across various nations and cultures [35,36,37,38]. The results reveal that driver anger and road safety behaviors are significantly influenced by cultural factors, underscoring the interplay between societal norms and driving practices [39,40,41].
Given the global nature of road safety challenges, there is a critical need for research that transcends national boundaries and incorporates cross-cultural comparisons. Existing studies have left significant gaps in understanding how diverse socio-economic, infrastructural, and cultural contexts influence crash patterns and outcomes. Moreover, while advancements in analytical methods, such as Natural Language Processing (NLP) and machine learning, have greatly enhanced crash analysis, their application to cross-cultural comparisons remains limited. Despite progress in leveraging advanced models, many studies predominantly focus on single-country analyses or specific datasets, failing to account for the complex interplay of cultural, legal, and environmental contexts in crash causation.
This gap is particularly evident in the comparison of crash narratives between countries with vastly different socio-economic and cultural contexts. For instance, the United States, a highly motorized and developed nation, features extensive roadway networks and advanced traffic safety measures. In contrast, a developing nation, Jordan presents challenges such as varied traffic law enforcement and distinct driving behaviors. This study addresses these gaps by integrating BERT-based topic modeling and text classification with SHAP interpretability to analyze crash data from the USA and Jordan. Unlike prior studies focusing solely on infrastructural or behavioral factors, this research incorporates cultural, legal, and environmental elements to inform region-specific road safety interventions. The contributions of this study are as follows:
- Evaluate state-of-the-art AI models, such as BERT, for crash severity classification, thereby enhancing predictive accuracy.
- Leverage SHAP for AI model transparency, offering actionable insights into crash severity factors for informed policymaking.
- Analyze crash narratives to uncover nuanced safety risks and support comprehensive safety measures.
- Provide cross-cultural safety insights, facilitating the adaptation of successful interventions globally.
- Identify unique and shared crash severity factors in the USA and Jordan, guiding targeted safety interventions.
- Safety countermeasures are recommended to prevent crashes and reduce their severity in both countries.
3. Methodology
3.1. Proposed Framework
This study utilizes state-of-the-art AI techniques, including BERT and BERT/Bi-LSTM, to analyze factors contributing to fatal and non-fatal crashes using datasets from the USA and Jordan. The proposed research framework, illustrated in Figure 1, involves multiple stages:

Figure 1.
Proposed framework flowchart for cross-cultural road crash analysis.
- Data Collection from USA and Jordan crash datasets, encompassing both tabular and narrative data.
- Preprocessing to standardize and prepare the data for analysis.
- Exploratory and Textual Visualizations, including Exploratory Data Analysis (EDA), Topic Modeling, unigrams, bigrams, similarity matrices, and hierarchical structuring.
- Text Classification using BERT/Bi-LSTM with SHAP interpretability.
- Generating actionable insights and policy recommendations based on the analysis.
This comprehensive framework thoroughly compares crash patterns and highlights region-specific factors influencing road safety.
3.2. Dataset
This study utilizes crash data from two distinct regions: Jordan and the USA. Each dataset contains both tabular and narrative crash data. The tabular data includes core variables such as Severity, Crash Type, Light Condition, and Number of Vehicles. Additional contextual features like Weekday, Month, Season, Car Type, Accident Time, and Driver Age were extracted for deeper analysis.
3.2.1. Jordan Dataset
The Jordan dataset consists of 6359 traffic narrative reports from five major freeways: Airport Roads, Desert Highways, Jordan Highway, Route 30, and Route 35. These reports, obtained from the Jordan Traffic Institute (JTI), include both tabular and narrative data. Crashes were categorized into four levels: Fatal, Severe Injury, Moderate Injury, and Minor Injury.
3.2.2. USA Dataset
The USA dataset was obtained from the Missouri State Highway Patrol, covering reports from 2019–2020. Crashes were classified into three categories: Fatal, Property Damage, and Personal Injury. An equal sample size of 6359 crashes was selected from the USA dataset to ensure comparability, maintaining balance across categories.
3.2.3. Narrative Data and NLP Analysis
Crash narratives provided a rich source of contextual information. Given structural differences between datasets, these narratives became the primary focus for comparison. Using BERT and BERT/Bi-LSTM, the study analyzed key factors contributing to crash severity. This approach enhanced understanding of underlying crash dynamics in Jordan and the USA, as illustrated by sample narratives in Table 1 and Table 2.

Table 1.
USA dataset of fatal and non-fatal crash samples.
Table 2.
Jordan dataset of fatal and non-fatal crash samples.
3.3. Data Preprocessing
3.3.1. Standardization for Cross-Cultural Analysis
To enable meaningful comparisons between the Jordan and USA crash datasets, crash severity levels were standardized into two categories: Fatal and Non-fatal. Shared variables, including Severity, Crash Type, Light Condition, and Number of Vehicles, were retained for core analysis. Additional contextual features, such as Weekday, Month, Season, Car Type, Accident Time, and Driver Age, were extracted for deeper investigation. Unique variables were excluded to maintain cross-dataset comparability.
3.3.2. Text Preprocessing
A systematic preprocessing approach was implemented to ensure consistency and data quality. Key steps included:
Text Normalization: Text was converted to lowercase, and non-textual characters, URLs, and commonly repeated irrelevant terms (e.g., “VEHICLE”, “KIN”, “PRONOUNCED”, “FATALITY”) were removed to reduce noise while preserving critical crash-related terms, such as “death”, “killing”, and “notified”.
Minimal Preprocessing: Techniques such as tokenization, stop-word removal, and stemming were deliberately avoided to retain important contextual information, particularly region-specific nuances such as rollover dynamics in the USA or vehicle-related terms in Jordan.
3.3.3. Advanced Encoding
Advanced transformer models like BERT were employed to process crash narratives effectively. Raw text inputs were encoded using DistilBERT, with each narrative truncated or padded to a maximum length of 200 tokens to standardize input dimensions. This approach aligns with modern research emphasizing minimal preprocessing for deep learning models, ensuring that nuanced meanings and contextual details are preserved.
Following preprocessing, exploratory data analysis (EDA) was conducted to uncover initial insights and patterns. This included descriptive statistics and visualization techniques to highlight prevalent terms and relationships in the data. The standardized and refined datasets provided a robust foundation for downstream analyses, including the application of BERT/Bi-LSTM models and SHAP-based interpretations to uncover key crash factors.
3.4. Exploratory Data Analysis (EDA)
Following preprocessing, we conducted Exploratory Data Analysis (EDA) to uncover patterns, trends, and potential outliers in the data. Descriptive statistics and graphical representations, such as unigram and bigram frequency visualizations, highlighted prevalent terms and relationships, providing valuable insights into crash dynamics across the two datasets. However, we acknowledge that aligning crash severity categories during data standardization may introduce potential biases, as cultural and contextual differences in reporting practices could affect the comparability of datasets. For example, terms describing technical defects in Jordan may differ in granularity from terminology used in the USA, necessitating careful interpretation of results.
This robustly refined dataset, which retained its contextual integrity, provided a solid foundation for subsequent analysis, as summarized in Table 3 and Table 4.
Table 3.
USA data descriptive statistics.
Table 4.
Jordan data descriptive statistics.
Based on the descriptive statistics provided in Table 3 and Table 4, we conducted a comparative analysis of traffic crash patterns between Jordan and the USA, revealing notable differences and similarities across various dimensions. In terms of crash severity, both countries predominantly experience personal injury outcomes, yet Jordan has a significantly lower fatality rate (1.93%) compared to the USA (7.49%). Crash types in Jordan are overwhelmingly collisions (93.22%), in stark contrast to the USA’s diverse crash types, including fixed object collisions and overturns. Light conditions further differentiate the two, with most crashes in Jordan occurring during daylight (69.52%) and the USA experiencing a majority under dark-unlighted conditions (67.40%). Jordan exhibits a higher incidence of multi-vehicle collisions (71.62%), whereas single-vehicle crashes are more prevalent in the USA (54.85%).
Seasonal trends show Jordan peaked in crashes during Autumn (71%), aligning more closely with the USA’s increased crashes in colder months. Vehicle types involved in crashes also vary, with Jordan dominated by small ride-on cars (64.08%) and the USA showing a broader distribution, including motor vehicles and trucks. Crash timing indicates Jordan’s crashes peak during evening and midday, contrasting with the USA’s pattern of nighttime crashes. Lastly, the driver age group involved in crashes in Jordan is predominantly the 25–54 age group (73.91%), whereas the USA sees a broader age distribution, including a notable involvement of younger drivers. These findings underscore the complex interplay of environmental, societal, and regulatory factors influencing road safety in each country, highlighting the need for tailored road safety measures and policies. In the USA, a vast majority of crashes occur during the day, with a significant drop-off as lighting conditions worsen, suggesting that visibility plays a critical role in traffic safety.
Conversely, in Jordan, crashes are more evenly distributed between daylight and dark but lighted conditions, with fewer incidents occurring in the dark unlighted, which may indicate better adaptation or less traffic during these times. This comparison reveals stark differences in how light conditions affect driving safety in the two countries. While the USA clearly prefers daytime driving safety, Jordan displays a higher tolerance for less optimal lighting conditions. This insight could inform targeted strategies for improving road safety tailored to the unique driving environments of each country.
3.5. Topic Modeling Using BERT
BERT’s ability to capture bidirectional contexts has advanced the development of sophisticated topic modeling approaches that go beyond simple word co-occurrence, allowing for the extraction of semantically coherent and contextually relevant topics. This evolution from earlier models like Latent Semantic Analysis (LSA) to BERT highlights the shift from linear algebra-based and probabilistic methods to deep learning, marking significant progress toward richer, more nuanced text representations for topic modeling. The use of contextual embeddings has made BERT a valuable tool for identifying underlying themes in crash narratives. A critical component of topic modeling involves selecting a hyperparameter, denoted as , which represents the number of latent topics. However, determining the optimal number of topics is often challenging, as it affects the quality and meaningfulness of the extracted topics [34].
BERT continues to be widely employed for natural language processing (NLP) tasks due to its ability to capture deep contextual information. This strength lies in its foundation on the transformer architecture introduced by Vaswani et al., which employs protocol-defined encoder blocks to process text in parallel rather than sequentially [42]. BERT leverages its bidirectional and context-sensitive nature to improve language understanding and prediction accuracy. Since textual data can often include symbols and numbers that introduce noise during data processing, standard preprocessing techniques like text cleaning, stop-word removal, tokenization, stemming, and word embedding are applied. However, these preprocessing steps can sometimes remove valuable contextual or semantic information from sentences or phrases. BERT addresses this limitation by being fine-tuned with an additional output layer, making it adaptable for a wide range of NLP tasks—such as question answering and language inference—without significant task-specific architecture changes.
Pre-trained on large datasets like English Wikipedia and the Book Corpus (800 M words), BERT is capable of handling tasks in over 100 languages. Its training in next-sentence prediction and masked language modeling further enhances its versatility. BERT incorporates three embedding layers: token, segment, and position embeddings [31]. In classification tasks, the Bi-Directional Long Short-Term Memory (Bi-LSTM) network processes the 768 hidden states of the [CLS] token representation produced by BERT.
Models like TK-BERT and BERT-LDA have been shown to outperform traditional methods such as Latent Dirichlet Allocation (LDA) and Non-negative Matrix Factorization (NMF) by integrating contextual semantics and thematic narratives [43]. Coherence was the primary metric in this study, as it reflects the logical association between words within a topic, ensuring the validity and relevance of the generated topics. Hyperparameter selection for k was performed in collaboration with domain expert to maximize coherence and interpretability. While Coherence was central to our evaluation, future studies may benefit from incorporating additional metrics, such as exclusivity, to further enhance the uniqueness and interpretability of topics.
3.6. Text Classification Using BERT/Bi-LSTM
Long Short-Term Memory (LSTM), a form of recurrent neural network (RNN), has been extensively used in natural language processing and sequential data analysis, due to its ability to capture long-term dependencies [44]. Unlike RNNs, LSTM networks utilize memory cells and gating techniques to store and retrieve information over long sequences in an elegant manner. This architectural design resolves the vanishing and exploding gradient issues when training deep networks on sequential data, making LSTMs particularly suitable for language modeling, text classification, and time series prediction, among other applications. Their ability to model sequential relationships is critical in analyzing crash narratives, where temporal context plays a vital role.
The LSTM network, a specialized variant of recurrent neural networks (RNNs), exhibits unique capabilities in handling short- and long-term correlations within time series data. The network’s architecture includes a memory unit, where a central memory cell, denoted by the red circle, plays a pivotal role. This structure enables the LSTM network to effectively capture dependencies and patterns in sequential data, making it particularly advantageous for various applications where understanding short- and long-term relationships is essential [44].
3.7. Evaluation Metrics
The BERT/Bi-LSTM model was validated on the test dataset. Key metrics included accuracy, precision, recall, F1-score, SHAP, and coherence score.
- Accuracy measures the overall correctness of the model in classifying fatal and non-fatal crashes. The BERT/Bi-LSTM model achieved 99.5% accuracy for the USA dataset and 99% accuracy for the Jordan dataset, highlighting its effectiveness in classifying crash severity.
- Precision indicates the proportion of correctly predicted fatal crashes out of all predicted fatal crashes. High precision reduces the occurrence of false positives, which is critical for reliable crash severity prediction.
- Recall evaluates the model’s ability to capture all actual fatal crashes out of the total true fatal crashes. This metric is vital for ensuring that no fatal crashes are overlooked.
- The F1-score balances precision and recall, ensuring the model performs well in both aspects. It is particularly important in this study to ensure both false positives and false negatives are minimized. The F1-scores for BERT/Bi-LSTM models exceeded 98% for both datasets.
SHAP interpretability values were employed to interpret the model predictions, identifying key features such as “overturned” and “attempted” for fatal crashes in the USA, and “damage” and “technical” issues for Jordan. This interpretability is crucial for understanding the underlying factors contributing to crashes in different cultural contexts.
For topic modeling, the coherence score was used to evaluate the semantic association of words within each topic. Higher coherence indicates better quality topics. The USA dataset achieved the highest coherence with 25 topics, while Jordan peaked with 10 topics, reflecting the differences in crash narratives between the two regions.
The coherence score was computed using four different statistics: the segment of confirmed co-occurrences of two words, the probability of these two words appearing together, and their probabilities. The for a single topic is as follows [45]:
where is the coherence score for a single topic, measuring the logical association between words within that topic; is the number of words in a topic; is the positions of words in a topic; and is a function that calculates a score for the relationship between two words, and , at positions and within the topic.
4. Experimental Setup
4.1. Model Selection
The BERT and BERT/Bi-LSTM models were selected for this study due to their proven superiority in handling complex natural language processing (NLP) tasks, especially when context and sequence play a crucial role, as in the analysis of crash narratives. These models were chosen over traditional approaches such as Naive Bayes, Support Vector Machines (SVM), and Random Forests for several reasons:
- Contextual UnderstandingBERT’s bidirectional nature captures the full context of words by analyzing both preceding and following text. This makes it well-suited for interpreting nuanced crash narratives, where the sequence of events and relationships between terms can significantly affect crash severity analysis [46].
- Handling Sequential DataThe integration of Bi-LSTM (Bidirectional Long Short-Term Memory) enhances BERT’s ability to process sequential data in both forward and backward directions. This is critical for understanding the progression of events leading up to crashes, as it captures long-range dependencies within crash narratives [47,48]. This feature is especially important for temporal event analysis, where the order of events directly impacts the interpretation of severity.
- Interpretability with SHAPThe inclusion of SHAP (Shapley Additive Explanations) provides transparency into the model’s predictions, offering insights into the most influential factors driving crash severity. This interpretability ensures that complex models, like BERT/Bi-LSTM, do not function as “black boxes”, but instead provide clear explanations for decision-making processes [49].
- Generalization Across DatasetsBERT’s pre-trained architecture and its ability to be fine-tuned on large datasets provide excellent generalization capabilities, making it suitable for cross-cultural crash analysis. This generalization is particularly useful when analyzing datasets from different regions, such as the USA and Jordan [50].
4.2. Classification Models
In this experiment, three models: Naive Bayes, AdaBoost, and BERT/Bi-LSTM were evaluated. These models were selected for their relevance to text classification tasks and their ability to capture both simple and complex relationships within crash narratives [51,52]. Based on the initial results, BERT/Bi-LSTM outperformed the other baseline classifiers and was subsequently used for the remainder of the experiment.
We selected the BERT/Bi-LSTM model because it combines BERT’s contextual understanding with Bi-LSTM’s sequential processing capabilities. Compared to GPT-based models, which are primarily designed for generative tasks, BERT/Bi-LSTM is better suited for classification and interpretability in analyzing structured crash data.
The conceptual framework integrated an LSTM-based language model (i.e., BERT/Bi-LSTM), as illustrated in Figure 2. To enhance the model’s performance, we divided the dataset into three subsets: training, validation, and testing, constituting 70%, 15%, and 15% of the data, respectively. The last layer weights generated by the pre-trained models were fed into the Bi-LSTM layer to perform the fine-tuning classification task. The optimization of the LSTM model involved experimenting with configurations, resulting in three types of dense layers. The first layer has 64 units with ReLU activation and a 0.2 dropout layer, followed by another layer with 32 units, ReLU activation, and a 0.2 dropout layer. The final layer is an output layer with two units using the SoftMax activation function. Furthermore, our configuration includes 128 LSTM cells with a learning rate of , a batch size of 32, Adam optimizer, and Cross Entropy Loss as the chosen loss function [34]. The hyperparameters used in the BERT/Bi-LSTM configuration are presented in Table 5.
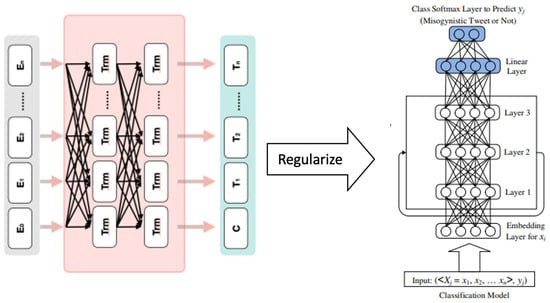
Figure 2.
Conceptual LSTM-based language model classifier (i.e., BERT/Bi-LSTM).
Table 5.
BERT/Bi-LSTM model configurations.
4.3. SHAP Interpretability
Shapley Additive Explanations (SHAP), a method grounded in Shapley values, is implemented to interpret the predictions of the classification models globally [53]. SHAP assigns each feature a value that reflects its contribution to a prediction, providing a comprehensive understanding of feature importance. This technique enhances transparency and trust by offering insights into the decision-making process of complex models.
By elucidating how specific features, such as crash type or driver-related factors, influence fatal and non-fatal crash outcomes, SHAP facilitates both global and local interpretability. This enables the identification of the most influential factors across the dataset, ensuring a deeper understanding of model behavior and its alignment with real-world crash dynamics.
SHAP was chosen over other interpretability frameworks, such as LIME, because it provides consistent, additive feature attributions for global and local explanations. Unlike LIME, which relies on perturbation and is model-agnostic, SHAP’s game-theoretic foundation ensures stability and robustness when applied to complex deep learning models like BERT/Bi-LSTM.
In the final stage, we integrated the outcomes of topic modeling and text classification by combining the identified themes and topics with the interpretability provided by SHAP. This holistic approach allows us to comprehensively understand the datasets, revealing nuanced insights into the factors that influence crash occurrence and severity. By integrating these analyses, this study aims to provide actionable insights for policymakers and practitioners, contributing to advancing road safety research and interventions.
5. Analysis and Results
5.1. Modeling Results
Table 6 and Table 7 display the experimental outcomes for the USA and Jordan datasets. The USA classification models, including NB-TFIDF and AdaBoost-TFIDF, showed high accuracy (96–98%). The BERT/Bi-LSTM model achieved superior performance with 99.5% accuracy and macro metrics (precision, recall, and F1-score) exceeding 98%. In the Jordan dataset, NB-TFIDF and AdaBoost-TFIDF exhibited 99% accuracy, while BERT/Bi-LSTM maintained 99% accuracy with balanced macro/weighted metrics (precision, recall, and F1-score exceeding 0.87). This suggests BERT/Bi-LSTM’s efficacy in capturing crash narrative nuances in diverse contexts. Jordan’s models showed slightly lower recall, indicating the complexity of classifying crash narratives in this context. Further insights into model convergence and generalization are provided by the visual representation of training and validation accuracy in Figure 3 and Figure 4.
Table 6.
Experiment results: USA dataset.
Table 7.
Experiment results: Jordan dataset.
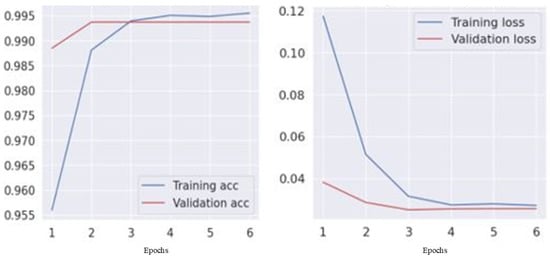
Figure 3.
Training and validation (accuracy vs. loss) for the USA dataset.
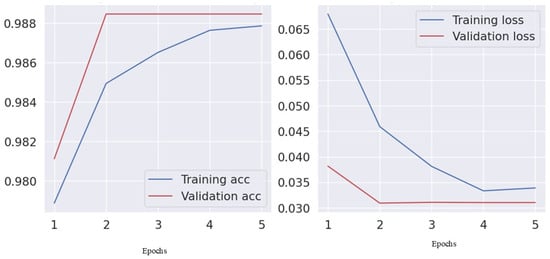
Figure 4.
Training and validation (accuracy vs. loss) for the Jordan dataset.
5.2. Topic Modeling Results
The coherence score graphs for topic modeling in the USA and Jordan datasets show distinct peaks, indicating each dataset’s optimal number of topics. For the USA, the peak coherence is achieved with about 25 topics, suggesting a wider variety of distinct discussion points within crash narratives. In contrast, Jordan’s dataset reaches peak coherence with approximately ten topics, indicating a more concentrated range of themes that best capture the discussions within the crash data. This comparison highlights the complexity of the USA’s crash narratives and a more focused thematic structure within Jordan’s dataset. The larger number of topics in the USA dataset reflects its more diverse crash circumstances, potentially linked to differences in infrastructure, driving behaviors, and reporting practices.
Figure 5 shows the USA and Jordan Topics per dataset. The following insights are extracted from the figure. In the USA dataset, topics like “overturned” and “roadway” suggest a concentration on accidents and road conditions, which may be indicative of the country’s extensive road networks and the higher incidence of vehicle rollovers on highways. Conversely, Jordan’s topics, such as “lane” and “change”, reflect concerns more closely related to driver behavior and road usage, possibly due to denser traffic conditions and the importance of maneuvering in more constrained driving environments. The keywords presented in Figure 5 further emphasize these regional differences, with the USA dataset reflecting challenges associated with high-speed driving and wildlife interactions, while the Jordan dataset highlights technical issues and traffic safety measures.

Figure 5.
Comparison of topic results: USA (left) vs. Jordan (right).
These topic insights reveal key differences in driving culture and infrastructure between the two countries. For the USA, terms like “deer” and “guardrail” appear, highlighting interactions with wildlife and road safety features unique to sprawling, diverse landscapes. In Jordan, the recurrence of “precautions” and “safety” indicates a heightened awareness and perhaps a more precautionary approach to driving, influenced by regional driving norms and infrastructure development stages. The figure underscores how regional themes drive distinct safety priorities, with the USA focusing on mitigating high-speed risks and Jordan emphasizing adherence to safety precautions in urban contexts.
In this experiment, the coherence score is systematically computed for topics ranging from 2 to 50. The results in Figure 5 revealed that the highest coherence score is achieved at and for the US and Jordan datasets, respectively. Table 8 provides an illustrative example of some topics identified in the process. This analysis highlights the adaptability of the topic modeling approach to identify region-specific issues, which can inform tailored policy interventions.
Table 8.
Top 10 words across the first three topics per dataset.
5.3. SHAP Interpretation of Crash Outcomes in the USA and Jordan
The SHAP analysis provides insights into the influential factors associated with fatal and non-fatal crashes in the USA and Jordan, revealing distinct and shared contributors across both regions. While SHAP values offer valuable interpretability by indicating which factors have a strong association with crash outcomes, it is essential to recognize that SHAP relies on observed data and does not establish causation. SHAP’s correlation-based approach cannot account for unobserved variables, which may also play critical roles in crash dynamics.
5.3.1. Causality Limitations and Unobserved Factors
One major limitation of the SHAP framework, as noted, is its inability to identify root causes or account for unobserved factors influencing crash outcomes. This limitation is particularly important in real-world crash analysis, where certain influential factors, such as driver distraction, road conditions, or unseen vehicle malfunctions, may not be explicitly captured in the dataset. While SHAP highlights important associations, a well-posed causal discovery framework could provide a more comprehensive understanding by directly identifying relationships beyond those observed.
Future research could incorporate causal inference methods alongside SHAP to better address unobserved variables. Techniques such as structural equation modeling, propensity score matching, or latent variable models could help capture hidden factors influencing crashes. By expanding the analytical approach in this way, researchers could develop a more nuanced understanding of crash causality, enhancing the insights provided by SHAP.
5.3.2. Key Findings in the USA
In the USA dataset, SHAP analysis identifies prominent factors for fatal crashes, with terms such as “overturned” and “attempted” indicating rollover risks and failed evasive maneuvers as significant dangers. Other factors, including “hours”, “scene”, “hospital”, and “alcohol”, highlight the role of delayed emergency response, serious injuries, and substance impairment in fatal outcomes. Environmental factors like “tree” and “fire” also appear in fatal cases, underscoring the impact of roadside obstacles on crash severity (see Figure 6: USA dataset SHAP values for fatal and non-fatal).

Figure 6.
USA dataset SHAP values for fatal and non-fatal.
For non-fatal crashes, terms such as “control”, “wheels”, “fence”, and “facing” suggest that vehicle stability issues and interactions with roadside structures are common influences on injury outcomes.
5.3.3. Key Findings in Jordan
In Jordan, the SHAP analysis indicates a distinct pattern in crash outcomes, with keywords like “damage” and “resulted” serving as primary factors in both fatal and non-fatal crashes, suggesting a direct correlation between the extent of damage and crash severity (see Figure 7: Jordan dataset SHAP values for fatal and non-fatal).
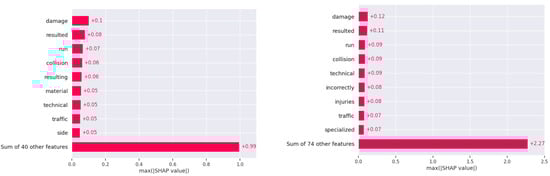
Figure 7.
Jordan dataset SHAP values for fatal and non-fatal.
Additional factors in fatal incidents include “towards”, “highway”, “bridge”, and “violation”, which emphasize the influence of high-speed roadways, infrastructure elements, and traffic violations. The presence of “technical” issues in fatal cases suggests that vehicle maintenance and technical faults are common concerns in Jordan, where older vehicle fleets may increase crash risks. For non-fatal crashes in Jordan, terms such as “island”, “pedestrian”, “defect”, and “device” point to pedestrian involvement and technical vehicle issues as prominent factors.
5.4. Hierarchical Clustering
The clustering dendrograms for Jordan and the USA depict the thematic structures of each country’s crash reports. Jordan’s data suggests focusing on specific issues like vehicle damage and driver skills, along with safety and prevention measures. It also shows distinct discussions on fuel and animal interactions. The USA’s dendrogram, in contrast, reveals a more complex array of topics that intertwine various aspects of road incidents, including animal crossings, vehicular dynamics, and legal responses, suggesting richer narrative detail and a broader spectrum of crash-related factors. Figure 8 and Figure 9 show the topics for the USA and Jordanian datasets, respectively.
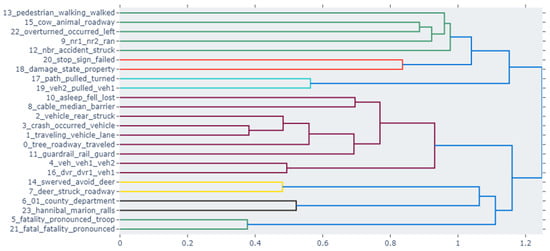
Figure 8.
USA hierarchical clustering.
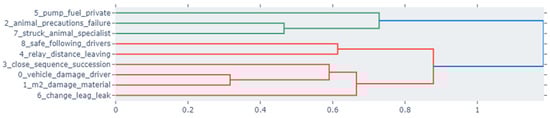
Figure 9.
Jordan hierarchical clustering.
5.5. Similarity Matrix
A similarity matrix is a mathematical representation used in text analysis to measure the pairwise similarity between data points, such as documents, words, or topics. In crash data analysis, similarity matrices are employed to identify thematic overlaps and clusters, offering insights into patterns within the dataset. For instance, the USA’s crash data similarity matrix (Figure 10) highlights thematic overlaps in vehicle-related damage and human factors, forming distinct clusters for specialized incidents such as pedestrian injuries and animal-related crashes. This clustering reflects a clear separation of themes, capturing specific regional crash characteristics in the USA. Conversely, Jordan’s similarity matrix (Figure 11) reveals a more intricate web of interrelated topics, often emphasizing infrastructure and vehicle dynamics. Distinct intersections in crash narratives, such as those linking road conditions, vehicle types, and crash scenarios, suggest a high degree of thematic connectivity. Both datasets exhibit unique patterns that mirror their regional traffic incident characteristics, with the USA showing greater thematic integration and Jordan displaying more defined separations in specific themes. Such matrices provide a nuanced understanding of the structural and thematic differences in crash data reporting, revealing how regional factors influence traffic incident analysis [54,55,56].
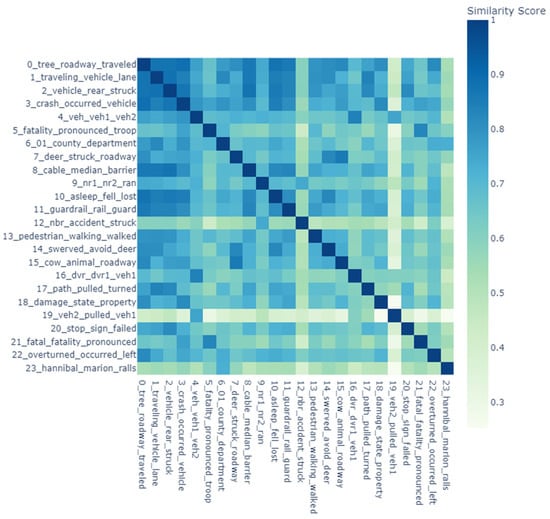
Figure 10.
USA similarity matrix.
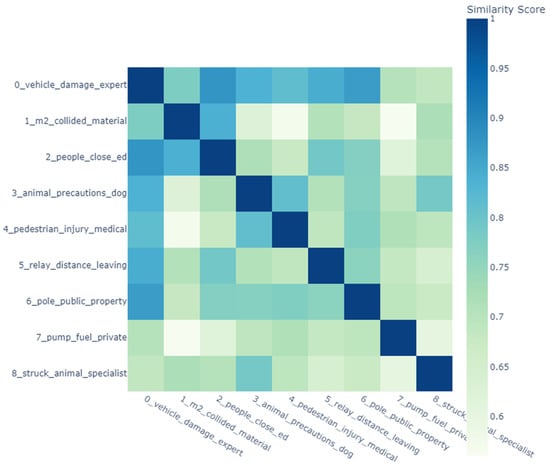
Figure 11.
Jordan similarity matrix.
5.6. Unigrams
In both the USA and Jordan datasets, “driver” and “damage” are vital terms in fatal crashes, highlighting the role of driver behavior and the extent of vehicular damage. “Expert” and “specialized” terms in Jordan’s data emphasize technical analysis, whereas “strike”, “roadway”, and “overturn” in the USA data point to collision dynamics and road conditions. For non-fatal crashes, “technical” and “violation” terms in Jordan imply rule violations and technical issues, while “strike” and “travel” in the USA indicate movement and collisions as common themes. Despite similarities, each dataset reflects unique regional traffic issues and reporting nuances, as shown in Figure 12, Figure 13, Figure 14 and Figure 15.
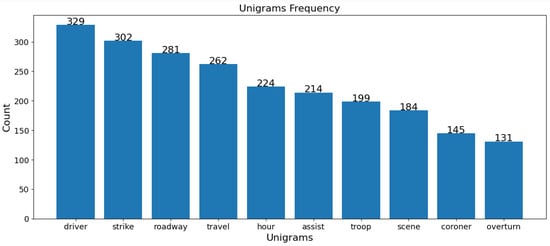
Figure 12.
USA unigrams of non-fatal crashes.
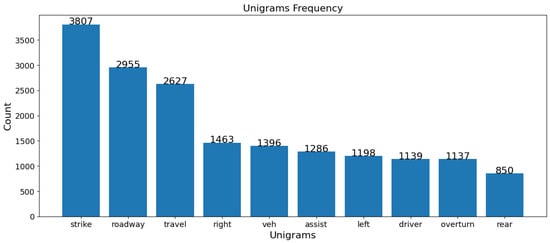
Figure 13.
USA unigrams of fatal crashes.
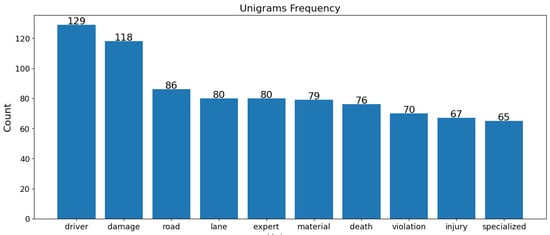
Figure 14.
Jordan unigrams of fatal crashes.

Figure 15.
Jordan unigrams of non-fatal crashes.
5.7. Crash Narratives
In both the USA and Jordan datasets, non-fatal crash narratives are generally shorter, suggesting a direct recounting of events. Fatal crash narratives are longer and more varied, likely due to the need for detailed descriptions in fatal cases. The length and detail in narratives correlate with the crash’s severity, reflecting the thoroughness required in fatal crash reporting, as shown in Figure 16 and Figure 17.
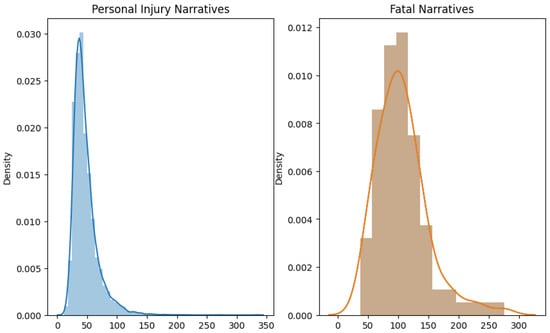
Figure 16.
USA narrative length.
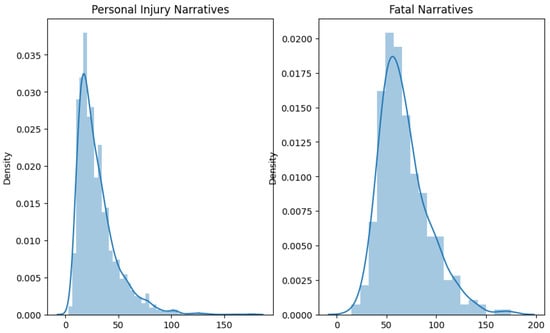
Figure 17.
Jordan’s narrative length.
6. Discussion
The study presented in this paper provides a comprehensive analysis of traffic crash patterns between the United States and Jordan, employing advanced Natural Language Processing (NLP) techniques, specifically Bidirectional Encoder Representations from Transformers (BERT), combined with Shapley Additive Explanations (SHAP) for interpretability. This cross-cultural examination sheds light on significant differences and underlying factors contributing to crash types and outcomes in developed versus developing country contexts.
The utilization of BERT and SHAP in this research represents a significant advancement in crash pattern analysis. Traditional statistical models, while helpful, often fall short of capturing the nuanced and complex nature of crash data narratives. The application of BERT allows for a more nuanced understanding of textual data, capturing the context and subtleties within crash reports. Coupled with SHAP, this approach provides clear insights into factors contributing to crash severity, enabling a more detailed and understandable analysis than previously possible with conventional methods. For example, SHAP analysis in Jordan identified “technical issues” as a critical factor, pointing to the need for stricter vehicle inspection policies and public awareness about vehicle maintenance. Similarly, in the USA, “alcohol-related incidents” emerged as a significant risk factor, emphasizing the importance of enhanced DUI enforcement and community education campaigns. These insights demonstrate the potential of SHAP to bridge the gap between data-driven findings and actionable policy measures.
The findings highlight distinct differences in crash characteristics between the two countries. In the United States, factors such as vehicle overturns and attempted maneuvers are prevalent in fatal crashes, possibly reflecting a higher incidence of high-speed or evasive driving scenarios. Conversely, in Jordan, crash severity is more closely associated with damage extent and resultant actions, suggesting variations in vehicle safety standards and road conditions. Seasonal variation in crash occurrences, with higher rates in Autumn for Jordan and winter for the USA, indicates environmental and cultural influences on driving patterns.
To provide a clearer visualization of these regional differences, Figure 18: Comparative Analysis of Key Crash Factors (SHAP Values): USA vs. Jordan has been added. This figure consolidates the SHAP-derived insights for fatal and non-fatal crashes across the two regions, highlighting the key contributing factors and their relative importance.

Figure 18.
Comparative Comparative analysis of key crash factors (SHAP values): (a) USA Non-Fatal, (b) USA Fatal, (c) Jordan Non-Fatal, and (d) Jordan Fatal.
Moreover, the high accuracy of the BERT/Bi-LSTM models in predicting crash severity demonstrates the potential of machine learning in enhancing traffic safety research by identifying specific risk factors and informing targeted interventions. This adaptability is particularly relevant for other regions, as BERT models can be fine-tuned for additional languages and cultural contexts, ensuring a flexible framework for crash narrative analysis worldwide. Table 9 compares our study’s findings with other relevant studies, showing the relative accuracy and objectives across different research contexts.
Table 9.
Comparison of our study with relevant studies.
6.1. Results in Relation to Existing Literature
The findings of this research align with existing literature on traffic safety and accident analysis. Key elements such as driver error, vehicle overturning, and mechanical issues are consistent with studies that identify these factors as significant contributors to accident severity. Both datasets highlight the substantial impact of human error, reinforcing earlier research that emphasizes the universal influence of driver conduct on road incidents [60,61,62,63,64,65]. Additionally, the increase in crash severity during nighttime driving is supported by road safety trends, where reduced visibility is linked to higher accident risks [66]
This study also advances the understanding of vehicle-related factors by identifying technical defects as a major predictor of crash severity in Jordan, which reflects challenges seen in other developing regions where aging vehicle fleets and inadequate maintenance standards prevail. Unlike in Western contexts, where impaired driving, particularly related to alcohol use, is a dominant factor, this study emphasizes the importance of vehicle age and technical defects in shaping crash risks, offering insights into region-specific road safety challenges [67]. These insights illustrate the methodology’s ability to generalize findings for diverse cultural and infrastructural contexts, enabling its application to datasets from other countries with minimal adaptation.
6.2. Implications for Road Safety Policy and Practice
This study’s cross-cultural analysis highlights important regional differences and shared risk factors in road safety for the USA and Jordan, underscoring the necessity of tailoring road safety strategies to local conditions. By utilizing BERT and SHAP models, we ensure that key crash patterns are interpretable, enhancing the validity of the cross-cultural analysis by identifying distinct and shared contributors without relying solely on observed correlations. The methodology’s modular design allows it to be extended to other countries, facilitating comparative studies across regions with varying socio-economic and infrastructural conditions.
6.2.1. United States Road Safety Policy
The frequent occurrence of rollover accidents and high-speed incidents in rural areas suggests a need for targeted rural highway safety strategies. Decision-makers could consider increased guardrail usage, road curve optimization, and adjusted speed limits in rural zones to reduce rollover risks. Additionally, the prevalence of terms like “attempted” in crash reports indicates that evasive maneuvers may contribute to crash severity. Strengthening driver training programs, especially for emergency responses, could help mitigate such risks.
6.2.2. Jordan Road Safety Policy
In Jordan, where crash reports frequently highlight issues related to vehicle age and technical defects, policy efforts could benefit from more rigorous inspection criteria and improved maintenance regulations. Given the aging vehicle fleet, periodic inspections to enforce safety standards are essential. Public education campaigns that emphasize the importance of vehicle maintenance could also reduce crash risks associated with mechanical failures.
6.2.3. Global Road Safety Insights
This study reveals common factors affecting road safety in both countries, including driver behavior and environmental conditions, such as nighttime driving and adverse weather. These insights offer valuable guidance for international road safety organizations in developing awareness campaigns that address global risks, such as inadequate lighting and poor weather conditions.
6.2.4. AI Application in Road Safety Monitoring
The use of BERT/Bi-LSTM models with SHAP values improves the precision and transparency of crash predictions. These technologies can be integrated into road safety monitoring systems for real-time crash analysis, enabling authorities to identify emerging risk factors more effectively. SHAP’s explainability makes the models accessible to policymakers, allowing them to make informed, data-driven decisions.
7. Policy Recommendations
The comparative analysis of crash patterns between the USA and Jordan highlights critical policy implications for both nations. This research suggests several key areas where targeted interventions can improve road safety outcomes tailored to the unique driving environments and crash dynamics observed in each country.
7.1. Road Infrastructure Improvements
In the USA, the high frequency of overturned vehicles in crash narratives indicates a need for enhanced road infrastructure, particularly on highways and rural roads. Investing in improved guardrails, better road curvature design, and enhanced road signage could help mitigate rollovers and vehicle ejections, which are prevalent in fatal crashes. On the other hand, Jordan’s crash narratives emphasize multi-vehicle collisions and technical issues, suggesting that improving urban road designs—such as clearer lane markings and dedicated lanes for high-traffic areas—would address common road usage challenges. Enhancing road maintenance efforts to accommodate Jordan’s aging vehicle fleet could also play a pivotal role in reducing crashes related to technical defects.
7.2. Vehicle Safety Standards and Maintenance Regulations
The prominence of technical issues in Jordanian crashes highlights the need for more rigorous vehicle inspection and maintenance standards. Implementing regular vehicle safety checks and enforcing strict penalties for non-compliance could help prevent crashes caused by mechanical failures. Additionally, promoting public awareness campaigns on the importance of vehicle maintenance would ensure better upkeep, especially in regions where older vehicles are more common. In contrast, the USA might benefit from focusing on driver safety education to prevent rollovers and single-vehicle crashes. Advanced driver assistance systems (ADAS), such as electronic stability control, should be more widely promoted to help reduce the number of fatal crashes.
7.3. Emergency Response and Medical Preparedness
The USA’s crash data reveals a higher fatality rate, with many fatalities involving multiple vehicles and complex crash dynamics like vehicle ejections and rollovers. Improving emergency response times and equipping rural and highway areas with advanced medical response systems could save lives in these fatal cases. Furthermore, training first responders to deal with high-severity crash scenarios, especially involving overturned vehicles, could lead to better outcomes. Jordan’s crash narratives, while generally involving less fatal crashes, suggest that enhancing emergency medical services (EMS), particularly in rural and underdeveloped regions, could significantly reduce fatality rates by ensuring faster and more effective medical interventions.
7.4. Targeted Road Safety Campaigns
The distinct differences in crash factors between the USA and Jordan underscore the need for tailored road safety campaigns. In the USA, the prominence of terms like “alcohol”, “roadway”, and “overturn” suggests a need for campaigns targeting substance abuse prevention and safe driving practices on rural roads. Conversely, Jordan’s crash narratives, which emphasize technical issues and vehicle defects, indicate the need for public education around safe vehicle operation, regular maintenance, and road safety measures. Focusing on these specific areas would better align safety interventions with the realities of driving conditions in each country.
7.5. Data Collection and Reporting Improvements
The study’s findings highlight the importance of standardizing data collection and reporting practices to enable more accurate cross-cultural comparisons. In the USA, the detailed reporting of environmental conditions and vehicle dynamics provides valuable insights but could be enhanced by capturing real-time driving conditions, such as weather, road surface, and visibility at the time of the crash. In Jordan, improving the completeness and consistency of crash reports, especially in rural areas, could provide more reliable data for analysis. Both countries could benefit from adopting unified data collection protocols, incorporating comprehensive vehicle, environmental, and behavioral factors to enhance the quality of crash data and, ultimately, road safety policies.
7.6. International Collaboration and Knowledge Sharing
The cross-cultural differences observed in this study highlight the need for global collaboration in road safety. By establishing data-sharing partnerships and engaging in international research efforts, both countries can benefit from shared insights into effective road safety strategies. The USA’s focus on mitigating rollovers and addressing wildlife interactions, and Jordan’s emphasis on technical defects and urban collisions, suggest that combining these insights could lead to innovative road safety interventions that address a broader range of risk factors across different regions.
8. Conclusions
This study pioneers a cross-cultural examination of road traffic crashes in the United States and Jordan by deploying advanced text-mining techniques to elucidate the nuanced factors that influence injury severity outcomes. Utilizing traffic crash narratives alongside quantitative data, the research aims to extract distinctive contributory elements from two divergent driving contexts, thereby offering a richer understanding of the factors correlating with injury severities. The study is grounded in a methodical framework encompassing standardization and harmonization of datasets, exploratory data analysis (EDA), and sophisticated AI modeling with BERT classifiers, supplemented by SHAP interpretability to ensure transparency in AI predictions. This multifaceted approach allows for an in-depth comparative analysis of crash severity determinants between the culturally distinct regions, highlighting unique and shared factors. A balanced sample size of 6359 crashes from each country’s national transportation agency data ensures a bias-free comparison.
The USA models display high accuracy in crash severity classification (99.5%), while Jordan’s models maintain 99% accuracy and slightly lower recall, underscoring the complex narrative classification in this context. SHAP analysis reveals that ‘overturned’ and ‘attempted’ actions dominate USA fatalities, while ‘damage’ and ‘resulted’ are more critical in Jordan. For non-fatal, ‘failed,’ ‘one’, and ‘yield’ issues dominate in the USA, whereas ’technical’ concerns and ‘collision’ are prevalent in Jordan. Topic modeling further distinguishes the datasets: the USA narratives are diverse, covering wildlife and legal entities, whereas Jordan focuses on technical vehicle details. The USA’s thematic complexity is mirrored in its broader range of topics discussed in crash narratives, as opposed to Jordan’s focused themes.
This analysis underscores the significance of environmental, societal, and regulatory factors shaping road safety. The cultural disparity is evident, for instance, in the prominence of alcohol-related incidents in the USA, absent in Jordan’s data due to cultural differences. Jordan’s emphasis on technical aspects, like vehicle defects, contrasts with the USA’s broader safety and legal discussions. The study presents an intricate portrayal of crash dynamics, emphasizing the importance of culturally informed interventions. It showcases the need for tailored road safety measures reflecting the specific conditions and behavioral patterns in each country to effectively mitigate the occurrence of road traffic crashes and their repercussions.
Limitations and Future Research Directions
While this study provides valuable insights into crash severity factors across diverse cultural contexts, several limitations must be acknowledged. The reliance on SHAP for interpreting model predictions, though effective, is constrained by its dependency on observed data, leaving unobserved variables—such as road conditions, driver fatigue, and environmental factors—unaccounted for [68]. Latent factors, such as infrastructure quality or vehicle maintenance, which could significantly influence crash severity, remain unexplored due to data unavailability. These constraints are particularly critical in complex crash scenarios, where such variables play a significant role but are challenging to capture.
To address causality more comprehensively, future research could integrate causal inference frameworks such as Directed Acyclic Graphs (DAGs), structural equation modeling, or Bayesian Networks for Latent Variables (BN-LV) [69,70]. These approaches would complement SHAP by systematically identifying and modeling relationships between observed and unobserved factors, enabling a more nuanced understanding of crash dynamics and mitigating current methodological limitations.
The topic modeling approach primarily relies on the Coherence metric to assess topic relevance. While useful, this reliance may lead to broad topics dominated by common terms, reducing the granularity of insights and limiting their practical application for tailored road safety interventions. Future research could refine topic modeling by incorporating additional metrics like exclusivity or by integrating expert input, to ensure more contextually meaningful and actionable results.
Although model performance was validated using precision, recall, and F1 metrics, future studies could benefit from simulation-based approaches to enhance findings. Simulations replicating various crash scenarios would provide a dynamic perspective on real-world implications, enabling evaluations of road safety interventions under diverse environmental and cultural contexts. This approach would supplement performance metrics and deepen the analysis of causal relationships between crash factors and outcomes.
The imbalance between fatal and non-fatal crashes in the dataset poses another challenge, as the prevalence of non-fatal cases may bias model predictions. Future research should explore techniques such as data augmentation or resampling to address this imbalance, thereby enhancing model robustness. Furthermore, incomplete crash reports and differences in reporting practices between regions limit the comprehensiveness of the analysis. Standardizing crash reporting protocols across regions could mitigate these gaps and provide a more uniform basis for analysis.
Finally, incorporating real-time data and additional contextual variables—such as road type, weather conditions, and traffic density—would improve the model’s applicability to road safety research. Leveraging real-time monitoring systems could enhance prediction accuracy and enable proactive safety measures. Extending this cross-cultural analysis to other regions and adapting the methodology to various cultural and infrastructural contexts would support targeted interventions tailored to specific regional road safety challenges. These directions build upon the unique elements of this study, providing a roadmap for future advancements in traffic safety research.
Author Contributions
Conceptualization, S.J., M.E. and R.N.; Methodology, R.N.; Software, S.J.; Validation, S.J. and M.E.; Formal analysis, S.J.; Resources, S.J. and M.E.; Data curation, S.J. and T.I.A.; Writing—original draft, S.J.; Writing—review & editing, T.I.A. and H.I.A.; Supervision, M.E., A.P. and R.N.; Project administration, M.E.; Funding acquisition, S.J. All authors have read and agreed to the published version of the manuscript.
Funding
This research received no external funding.
Data Availability Statement
Dataset available on request from the authors.
Conflicts of Interest
The authors declare no conflict of interest.
References
- Yang, Y.; Tian, N.; Wang, Y.; Yuan, Z. A Parallel FP-Growth Mining Algorithm With Load Balancing Constraints for Traffic Crash Data. Int. J. Comput. Commun. Control 2022, 17, 4806. [Google Scholar] [CrossRef]
- Lee, M.; Khattak, A.J. Case Study of Crash Severity Spatial Pattern Identification in Hot Spot Analysis. Transp. Res. Rec. J. Transp. Res. Board 2019, 2673, 684–695. [Google Scholar] [CrossRef]
- Song, Y.; Chitturi, M.; Noyce, D.A. Automated Vehicle Crash Sequences: Patterns and Potential Uses in Safety Testing. Accid. Anal. Prev. 2021, 153, 106017. [Google Scholar] [CrossRef] [PubMed]
- López, G.; Abellán, J.; Montella, A.; Oña, J.d. Patterns of Single-Vehicle Crashes on Two-Lane Rural Highways in Granada Province, Spain. Transp. Res. Rec. J. Transp. Res. Board 2014, 2432, 133–141. [Google Scholar] [CrossRef]
- Kjeldgård, L.; Stigson, H.; Alexanderson, K.; Friberg, E. Sequence Analysis of Sickness Absence and Disability Pension in the Year Before and the Three Years Following a Bicycle Crash; A Nationwide Longitudinal Cohort Study of 6353 Injured Individuals. BMC Public Health 2020, 20, 1710. [Google Scholar] [CrossRef]
- Hossain, M.; Abdel-Aty, M.; Quddus, M.; Muromachi, Y.; Sadeek, S.N. Real-Time Crash Prediction Models: State-of-the-Art, Design Pathways and Ubiquitous Requirements. Accid. Anal. Prev. 2019, 124, 66–84. [Google Scholar] [CrossRef]
- Wang, Y.; Chen, Q.; Zhu, Q.; Liu, L.; Li, C.; Zheng, D. A Survey of Mobile Laser Scanning Applications and Key Techniques over Urban Areas. Remote Sens. 2019, 11, 1540. [Google Scholar] [CrossRef]
- Jaradat, S.; Nayak, R.; Paz, A.; Elhenawy, M. Ensemble Learning with Pre-Trained Transformers for Crash Severity Classification: A Deep NLP Approach. Algorithms 2024, 17, 284. [Google Scholar] [CrossRef]
- Sun, J.; Sun, J.; Chen, P. Use of Support Vector Machine Models for Real-Time Prediction of Crash Risk on Urban Expressways. Transp. Res. Rec. J. Transp. Res. Board 2014, 2432, 91–98. [Google Scholar] [CrossRef]
- Zhang, H.; Li, S.; Wu, C.; Zhang, Q.; Wang, Y. Predicting Crash Frequency for Urban Expressway Considering Collision Types Using Real-Time Traffic Data. J. Adv. Transp. 2020, 2020, 8523818. [Google Scholar] [CrossRef]
- Tian, L.; Peng, J.; Liu, X.; Luo, Q. Crash Prediction on Expressway Incorporating Traffic Flow Continuity Parameters Based on Machine Learning Approach. J. Adv. Transp. 2021, 2021, 8820402. [Google Scholar] [CrossRef]
- Wei, Z.; Das, S.; Zhang, Y. Short Duration Crash Prediction for Rural Two-Lane Roadways: Applying Explainable Artificial Intelligence. Transp. Res. Rec. J. Transp. Res. Board 2022, 2676, 535–549. [Google Scholar] [CrossRef]
- Dong, C.-D.; Shao, C.; Li, J.; Xiong, Z. An Improved Deep Learning Model for Traffic Crash Prediction. J. Adv. Transp. 2018, 2018, 3869106. [Google Scholar] [CrossRef]
- Abdulhafedh, A. Road Crash Prediction Models: Different Statistical Modeling Approaches. J. Transp. Technol. 2017, 7, 190–205. [Google Scholar] [CrossRef]
- Omer, I.; Gitelman, V.; Rofè, Y.; Lerman, Y.; Kaplan, N.; Doveh, E. Evaluating Crash Risk in Urban Areas Based on Vehicle and Pedestrian Modeling. Geogr. Anal. 2017, 49, 387–408. [Google Scholar] [CrossRef]
- Xu, C.; Liu, P.; Wang, W.; Zhang, Y. Real-time Identification of Traffic Conditions Prone to Injury and Non-injury Crashes on Freeways Using Genetic Programming. J. Adv. Transp. 2016, 50, 701–716. [Google Scholar] [CrossRef]
- Ashqar, H.I.; Shaheen, Q.H.Q.; Ashur, S.A.; Rakha, H.A. Impact of Risk Factors on Work Zone Crashes Using Logistic Models and Random Forest. In Proceedings of the 2021 IEEE International Intelligent Transportation Systems Conference (ITSC), Indianapolis, IN, USA, 19–22 September 2021; pp. 1815–1820. [Google Scholar] [CrossRef]
- Davis, G.A.; Chatterjee, I.; Gao, J.; Hourdos, J. Traffic Density Versus Rear-End Crash Risk on Freeways: Empirical Model, Mechanism Model, and Transfer to Automated Vehicles. J. Transp. Eng. A Syst. 2021, 147, 04021007. [Google Scholar] [CrossRef]
- Wang, L.; Wang, Y.; Wang, L. Stability Analysis for Urban Traffic Evolution Process Using Temporal Traffic State Patterns. Transport 2022, 37, 310–317. [Google Scholar] [CrossRef]
- Jaradat, S.; Nayak, R.; Paz, A.; Ashqar, H.I.; Elhenawy, M. Multitask Learning for Crash Analysis: A Fine-Tuned LLM Framework Using Twitter Data. Smart Cities 2024, 7, 2422–2465. [Google Scholar] [CrossRef]
- Park, S.M.; Park, S.; Jeong, H.; Yun, I.; So, J. Scenario-Mining for Level 4 Automated Vehicle Safety Assessment From Real Accident Situations in Urban Areas Using a Natural Language Process. Sensors 2021, 21, 6929. [Google Scholar] [CrossRef]
- Khanali, Z.S.; Mosleh, M. The Study of the Effect of Reducing Input Variables in the Modeling Process of Tehran-Saveh Freeway Accidents. Data Envel. Anal. Decis. Sci. 2015, 2015, 145–155. [Google Scholar] [CrossRef]
- Giummarra, M.J.; Beck, B.; Gabbe, B.J. Classification of Road Traffic Injury Collision Characteristics Using Text Mining Analysis: Implications for Road Injury Prevention. PLoS ONE 2021, 16, e0245636. [Google Scholar] [CrossRef]
- Darus, N.S.; Borhan, M.N.; Ishak, S.Z.; Ismail, R.; Razali, S.F.M.; Yunin, N.A.M.; Hamidun, R. The Effect of Physical Environment Risk Factors on Vehicle Collisions Severity Involving Child-Pedestrians in Malaysia. Sage Open 2022, 12, 21582440211068494. [Google Scholar] [CrossRef]
- Donnelly-Swift, E.; Kelly, A. Factors Associated With Single-Vehicle and Multi-Vehicle Road Traffic Collision Injuries in Ireland. Int. J. Inj. Contr. Saf. Promot. 2015, 23, 351–361. [Google Scholar] [CrossRef] [PubMed]
- Pei, X.; Sze, N.N.; Wong, S.C.; Yao, D. Bootstrap Resampling Approach to Disaggregate Analysis of Road Crashes in Hong Kong. Accid. Anal. Prev. 2016, 95, 512–520. [Google Scholar] [CrossRef]
- Das, S.; Dutta, A.; Tsapakis, I. Topic Models From Crash Narrative Reports of Motorcycle Crash Causation Study. Transp. Res. Rec. J. Transp. Res. Board 2021, 2675, 449–462. [Google Scholar] [CrossRef]
- Das, S.; Mudgal, A.; Dutta, A.; Geedipally, S.R. Vehicle Consumer Complaint Reports Involving Severe Incidents: Mining Large Contingency Tables. Transp. Res. Rec. J. Transp. Res. Board 2018, 2672, 72–82. [Google Scholar] [CrossRef]
- Das, S.; Oliaee, A.H.; Le, M.; Pratt, M.P.; Wu, D. Classifying Pedestrian Maneuver Types Using the Advanced Language Model. Transp. Res. Rec. J. Transp. Res. Board 2023, 2677, 599–611. [Google Scholar] [CrossRef]
- Yang, J.; Higuchi, K.; Ando, R.; Nishihori, Y. Examining the Environmental, Vehicle, and Driver Factors Associated With Crossing Crashes of Elderly Drivers Using Association Rules Mining. J. Adv. Transp. 2020, 2020, 2593410. [Google Scholar] [CrossRef]
- Devlin, J.; Chang, M.-W.; Lee, K.; Toutanova, K. Bert: Pre-Training of Deep Bidirectional Transformers for Language Understanding. arXiv 2018, arXiv:1810.04805. [Google Scholar]
- Deerwester, S.; Dumais, S.T.; Furnas, G.W.; Landauer, T.K.; Harshman, R. Indexing by Latent Semantic Analysis. J. Am. Soc. Inf. Sci. 1990, 41, 391–407. [Google Scholar] [CrossRef]
- Blei, D.M.; Ng, A.Y.; Jordan, M.I. Latent Dirichlet Allocation. J. Mach. Learn. Res. 2003, 3, 993–1022. [Google Scholar]
- Roque, C.; Cardoso, J.L.; Connell, T.; Schermers, G.; Weber, R. Topic Analysis of Road Safety Inspections Using Latent Dirichlet Allocation: A Case Study of Roadside Safety in Irish Main Roads. Accid. Anal. Prev. 2019, 131, 336–349. [Google Scholar] [CrossRef] [PubMed]
- Paichadze, N.; Pandey, V.; Bari, I.; Monclús, J.; Hyder, A.A. 104 Socio-Cultural Context of Road Safety (SOCCR). BMJ Inj. Prev. 2022, 28, A14–A15. [Google Scholar] [CrossRef]
- Khanfar, N.O.; Elhenawy, M.; Ashqar, H.I.; Hussain, Q.; Alhajyaseen, W.K.M. Driving Behavior Classification at Signalized Intersections Using Vehicle Kinematics: Application of Unsupervised Machine Learning. Int. J. Inj. Contr. Saf. Promot. 2022, 30, 34–44. [Google Scholar] [CrossRef]
- Dwekat, T.M.; Almsre, A.A.; Ashqar, H.I. Effect of Roundabout Design on the Behavior of Road Users: A Case Study of Roundabouts with Application of Unsupervised Machine Learning. arXiv 2023, arXiv:2309.14540. [Google Scholar]
- Hamad, F.A.; Hasiba, R.; Shahwan, D.; Ashqar, H.I. How Do Drivers Behave at Roundabouts in a Mixed Traffic? A Case Study Using Machine Learning. arXiv 2023, arXiv:2309.13442. [Google Scholar]
- Austin, E.; Otto, J.; Green, K.; Watson, H.; Ward, N.J.; Dively, K. Guidance for Evaluating Traffic Safety Culture Strategies; Montana Deptartment of Transportation: Helena, MT, USA, 2021.
- Austin, E.; Ward, N.; Otto, J.; Green, K.; Watson, H. Assessing the Impact of Culture: A Systematic Analysis of Culture-Based Interventions and Evaluations. Front. Future Transp. 2022, 3, 917915. [Google Scholar] [CrossRef]
- Khanfar, N.O.; Ashqar, H.I.; Elhenawy, M.; Hussain, Q.; Hasasneh, A.; Alhajyaseen, W.K.M. Application of Unsupervised Machine Learning Classification for the Analysis of Driver Behavior in Work Zones in the State of Qatar. Sustainability 2022, 14, 15184. [Google Scholar] [CrossRef]
- Vaswani, A.; Shazeer, N.; Parmar, N.; Uszkoreit, J.; Jones, L.; Gomez, A.N.; Kaiser, Ł.; Polosukhin, I. Attention Is All You Need. Adv. Neural Inf. Process Syst. 2017, 30, 6000–6010. [Google Scholar]
- Zhou, M.; Kong, Y.; Lin, J. Financial Topic Modeling Based on the BERT-LDA Embedding. In Proceedings of the 2022 IEEE 20th International Conference on Industrial Informatics (INDIN), Perth, Australia, 25–28 July 2022; pp. 495–500. [Google Scholar]
- Hochreiter, S.; Schmidhuber, J. Long Short-Term Memory. Neural Comput. 1997, 9, 1735–1780. [Google Scholar] [CrossRef]
- Röder, M.; Both, A.; Hinneburg, A. Exploring the Space of Topic Coherence Measures. In Proceedings of the Eighth ACM International Conference on Web Search and Data Mining, Shanghai, China, 2–6 February 2015; pp. 399–408. [Google Scholar]
- Agrawal, A.; Tripathi, S.; Vardhan, M.; Sihag, V.; Choudhary, G.; Dragoni, N. BERT-Based Transfer-Learning Approach for Nested Named-Entity Recognition Using Joint Labeling. Appl. Sci. 2022, 12, 976. [Google Scholar] [CrossRef]
- Xia, L.; Ye, J.; Luo, D.; Guan, M.; Liu, J.; Cao, X. Short Text Automatic Scoring System Based on BERT-BiLSTM Model. J. Shenzhen Univ. Sci. Eng. 2022, 39, 349–354. [Google Scholar] [CrossRef]
- Phyu, M.S.; Nwet, K.T. Comparative Analysis of Deep Learning Models for Myanmar Text Classification. In Proceedings of the Intelligent Information and Database Systems (ACIIDS 2020), Phuket, Thailand, 23–26 March 2020; pp. 76–85. [Google Scholar]
- Yao, J.; Alabousi, A.; Mironov, O. Evaluation of a BERT Natural Language Processing Model for Automating CT and MRI Triage and Protocol Selection. Can. Assoc. Radiol. J. 2024, 08465371241255895. [Google Scholar] [CrossRef]
- Mahdi, A.F.; Farhan, R.N.; Al-Rawi, S.S. Improvement of Semantic-BERT Model with Bidirectional LSTM for Arabic Language. In Proceedings of the 8th International Conference on Contemporary Information Technology and Mathematics (ICCITM), Mosul, Iraq, 31 August–1 September 2022; pp. 202–207. [Google Scholar]
- Zhang, X.; Green, E.; Chen, M.; Souleyrette, R.R. Identifying Secondary Crashes Using Text Mining Techniques. J. Transp. Saf. Secur. 2020, 12, 1338–1358. [Google Scholar] [CrossRef]
- Boggs, A.M.; Wali, B.; Khattak, A.J. Exploratory Analysis of Automated Vehicle Crashes in California: A Text Analytics & Hierarchical Bayesian Heterogeneity-Based Approach. Accid. Anal. Prev. 2020, 135, 105354. [Google Scholar] [CrossRef]
- Rodríguez-Pérez, R.; Bajorath, J. Interpretation of Compound Activity Predictions from Complex Machine Learning Models Using Local Approximations and Shapley Values. J. Med. Chem. 2020, 63, 8761–8777. [Google Scholar] [CrossRef]
- Niewiarowski, A.; Plichta, A. Matrix Similarity Analysis of Texts Written In Romanian And Spanish. Commun. ECMS 2023, 37, 507–512. [Google Scholar] [CrossRef]
- Kreines, M.G.; Kreines, E.M. Matrix Models of Texts: Models of Texts and Content Similarity of Text Documents. Math. Models Comput. Simul. 2020, 12, 696–705. [Google Scholar] [CrossRef]
- Ma, C. Text Sentiment Analysis Based on Similarity and Cloud Model. In Proceedings of the 34th Chinese Control and Decision Conference (CCDC), Hefei, China, 15–17 August 2022; pp. 4350–4354. [Google Scholar]
- Yuan, S.; Wang, Q. Imbalanced Traffic Accident Text Classification Based on Bert-RCNN. In Journal of Physics: Conference Series; IOP Publishing: Bristol, UK, 2022; Volume 2170, p. 012003. [Google Scholar]
- Putra, A.D.; Girsang, A.S. Analysis of Named-Entity Effect on Text Classification of Traffic Accident Data Using Machine Learning. Indones. J. Electr. Eng. Comput. Sci. 2022, 25, 1672–1678. [Google Scholar] [CrossRef]
- Krause, S.; Busch, F. New Insights into Road Accident Analysis through the Use of Text Mining Methods. In Proceedings of the 6th International Conference on Models and Technologies for Intelligent Transportation Systems (MT-ITS), Cracow, Poland, 5–7 June 2019. [Google Scholar]
- Mofolasayo, A. Towards ‘Vision-Zero’ in Road Traffic Fatalities: The Need for Reasonable Degrees of Automation to Complement Human Efforts in Driving Operation. Systems 2024, 12, 40. [Google Scholar] [CrossRef]
- Bouhsissin, S.; Sael, N.; Benabbou, F. Driver Behavior Classification: A Systematic Literature Review. IEEE Access 2023, 11, 14128–14153. [Google Scholar] [CrossRef]
- Medina, A.L.; Lee, S.E.; Wierwille, W.W.; Hanowski, R.J. Relationship between Infrastructure, Driver Error, and Critical Incidents. In Proceedings of the Human Factors and Ergonomics Society Annual Meeting; SAGE Publications: Los Angeles, CA, USA, 2004; Volume 48, pp. 2075–2079. [Google Scholar] [CrossRef]
- Kwakye, K.; Seong, Y.; Yi, S.; Aboah, A. All You Need Is Data: A Multimodal Approach in Understanding Driver Behavior. In Proceedings of the Human Factors and Ergonomics Society Annual Meeting; SAGE Publications: Los Angeles, CA, USA, 2024; Volume 68, pp. 1298–1304. [Google Scholar] [CrossRef]
- Dangisso, S.S. Effect of Human Factors on Road Traffic Accidents (RTAs): The Case of Hawassa City, SNRS, Ethiopia. PanAfrican J. Gov. Dev. PJGD 2023, 4, 53–84. [Google Scholar] [CrossRef]
- Pan, B.; Demiryurek, U.; Gupta, C.; Shahabi, C. Forecasting Spatiotemporal Impact of Traffic Incidents for Next-Generation Navigation Systems. Knowl. Inf. Syst. 2015, 45, 75–104. [Google Scholar] [CrossRef]
- Wood, J.M. Nighttime Driving: Visual, Lighting and Visibility Challenges. Ophthalmic Physiol. Opt. 2020, 40, 187–201. [Google Scholar] [CrossRef] [PubMed]
- Gill, G.; Sakrani, T.; Cheng, W.; Zhou, J. Investigaton of Roadway Geometric and Traffic Flow Factors for Vehicle Crashes Using Spatiotemporal Interaction. Int. Arch. Photogramm. Remote Sens. Spat. Inf. Sci. 2017, XLII-2/W7, 1163–1166. [Google Scholar] [CrossRef]
- Park, K.; Park, C.; Kim, D.; Kim, J. Redefining Pixel Circuit Analysis: Causal Discovery and Probabilistic Modeling. SID Symp. Dig. Tech. Pap. 2024, 55, 1383–1387. [Google Scholar] [CrossRef]
- Huynh, P.; Irish, L.; Yadav, O.P.; Setty, A.; Le, T.T.Q. Causal Inference in Longitudinal Studies Using Causal Bayesian Network with Latent Variables. In Proceedings of the Reliability and Maintainability Symposium (RAMS), Tucson, AZ, USA, 24–27 January 2022. [Google Scholar]
- Deng, O.; Nishimura, S.; Ogihara, A.; Jin, Q. Evolutionary Causal Discovery with Relative Impact Stratification for Interpretable Data Analysis. arXiv 2024, arXiv:2404.16361. [Google Scholar] [CrossRef]
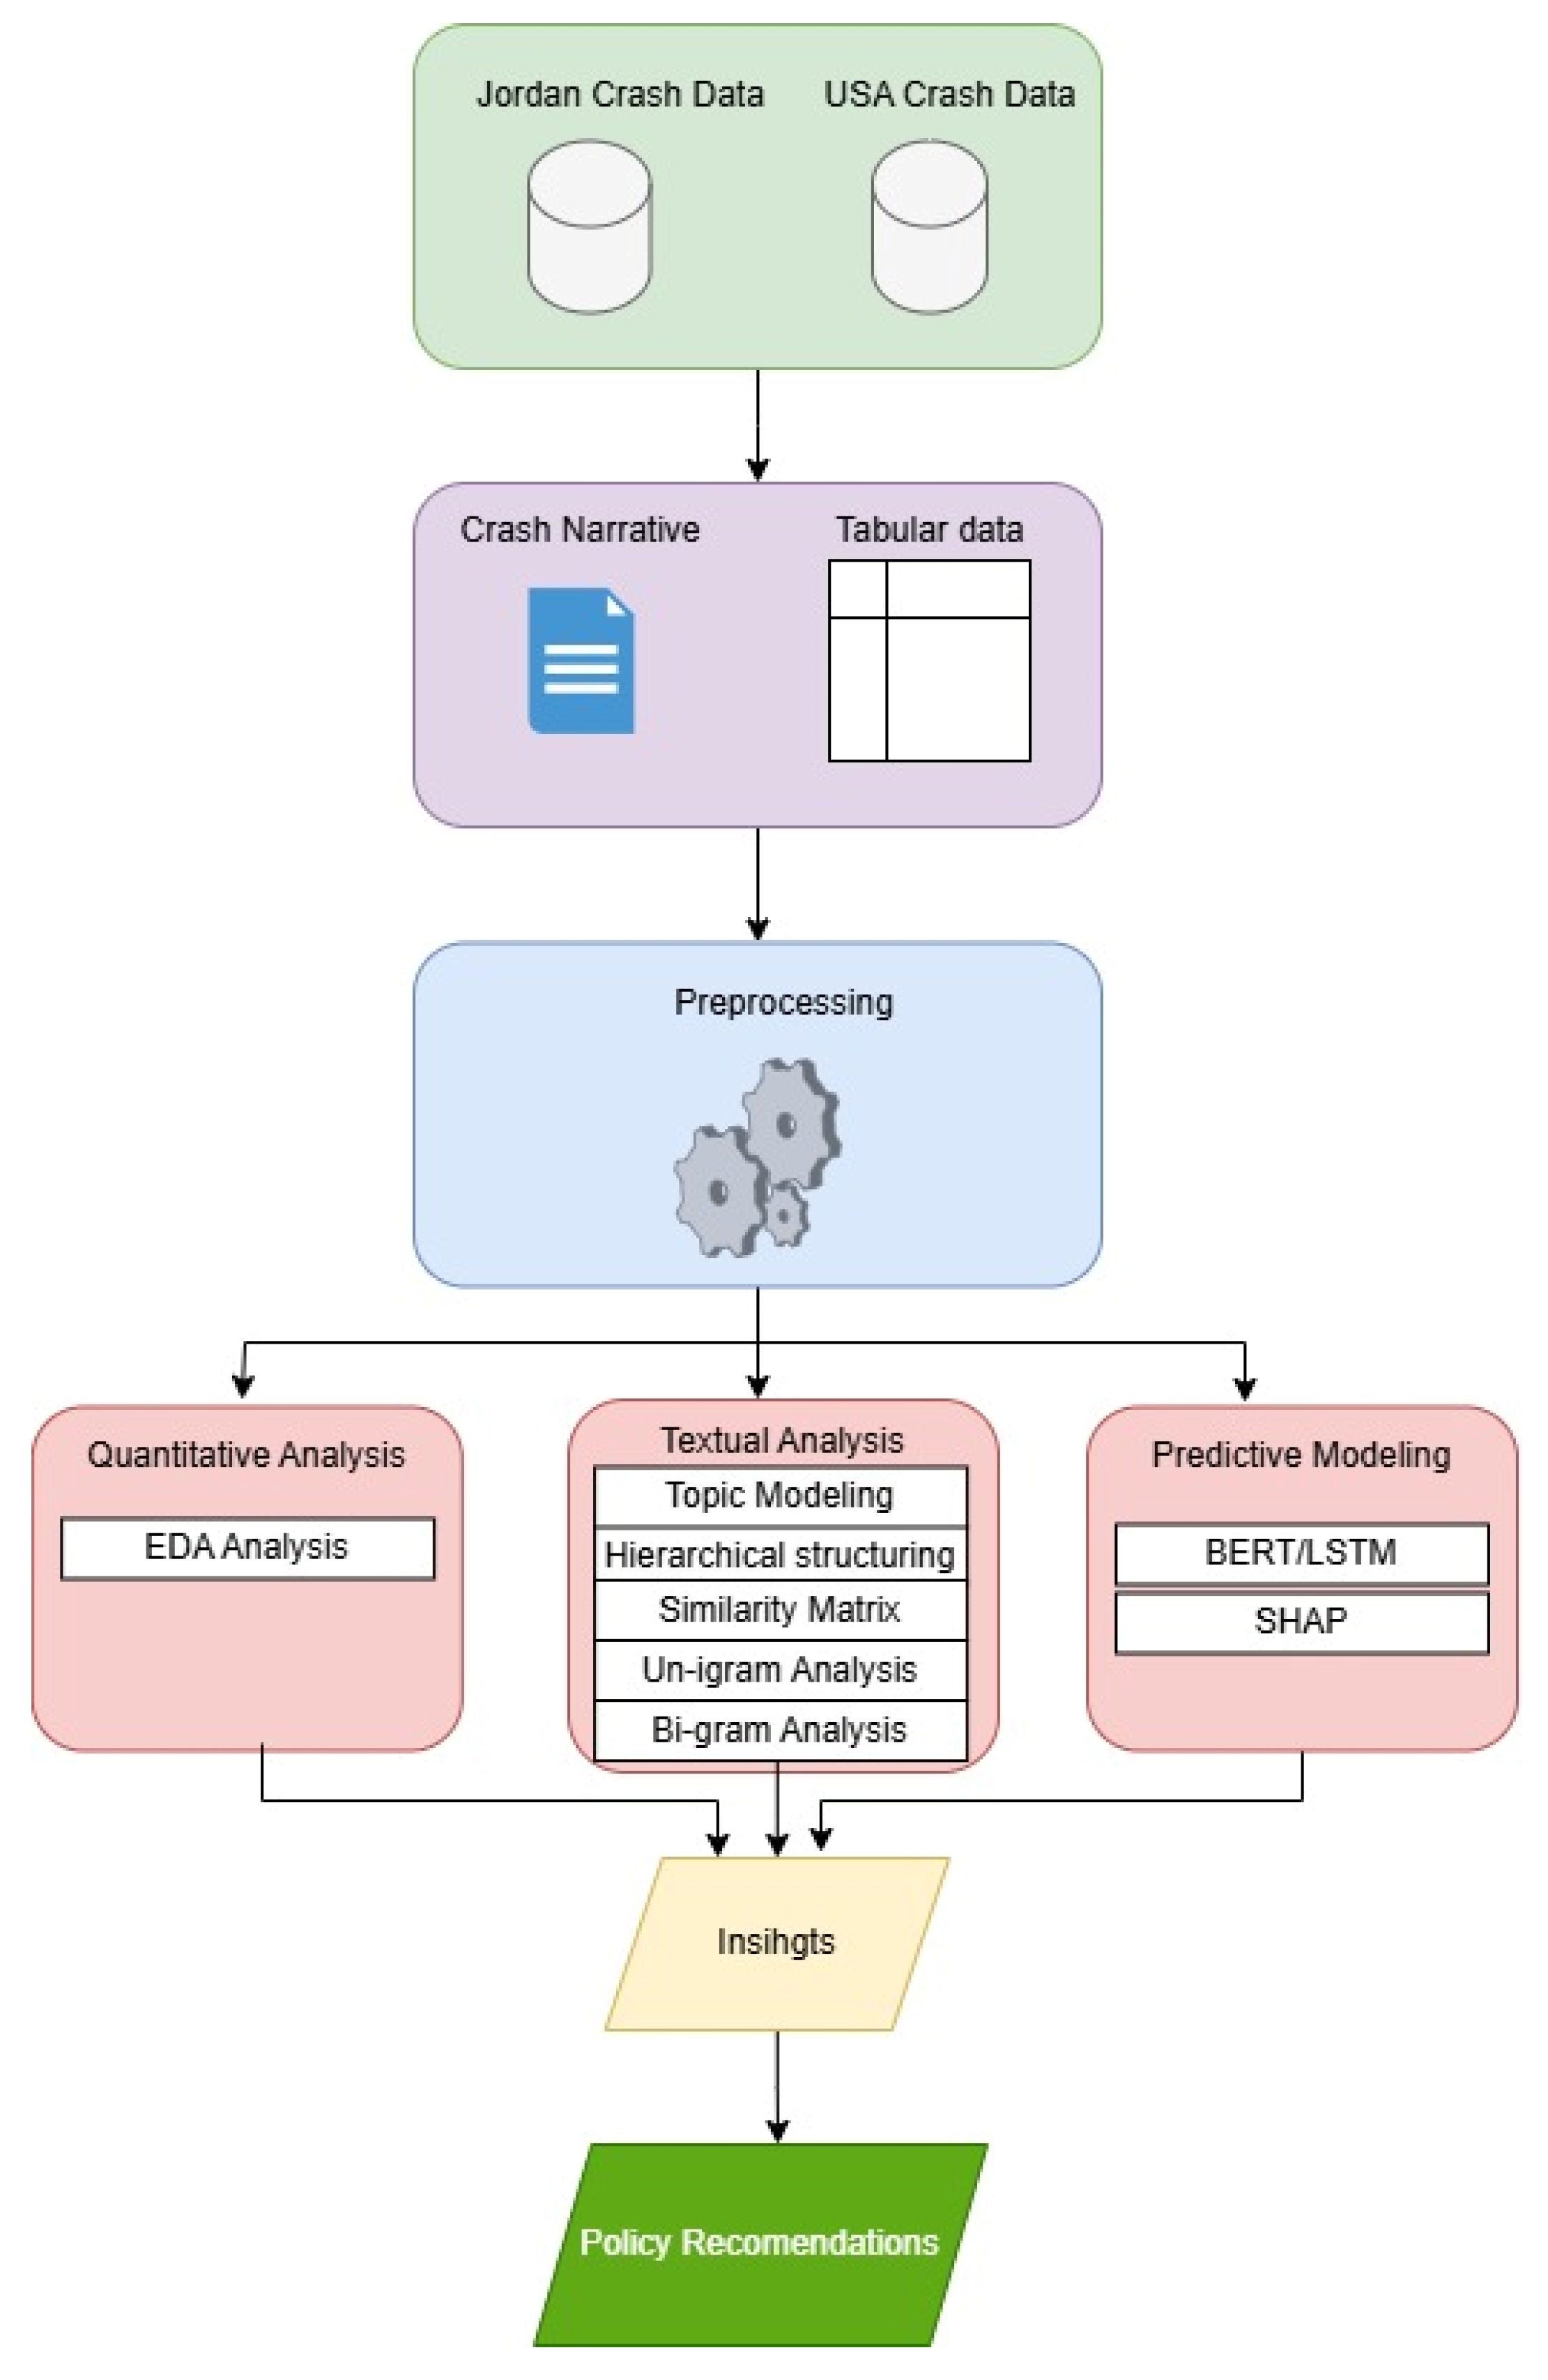
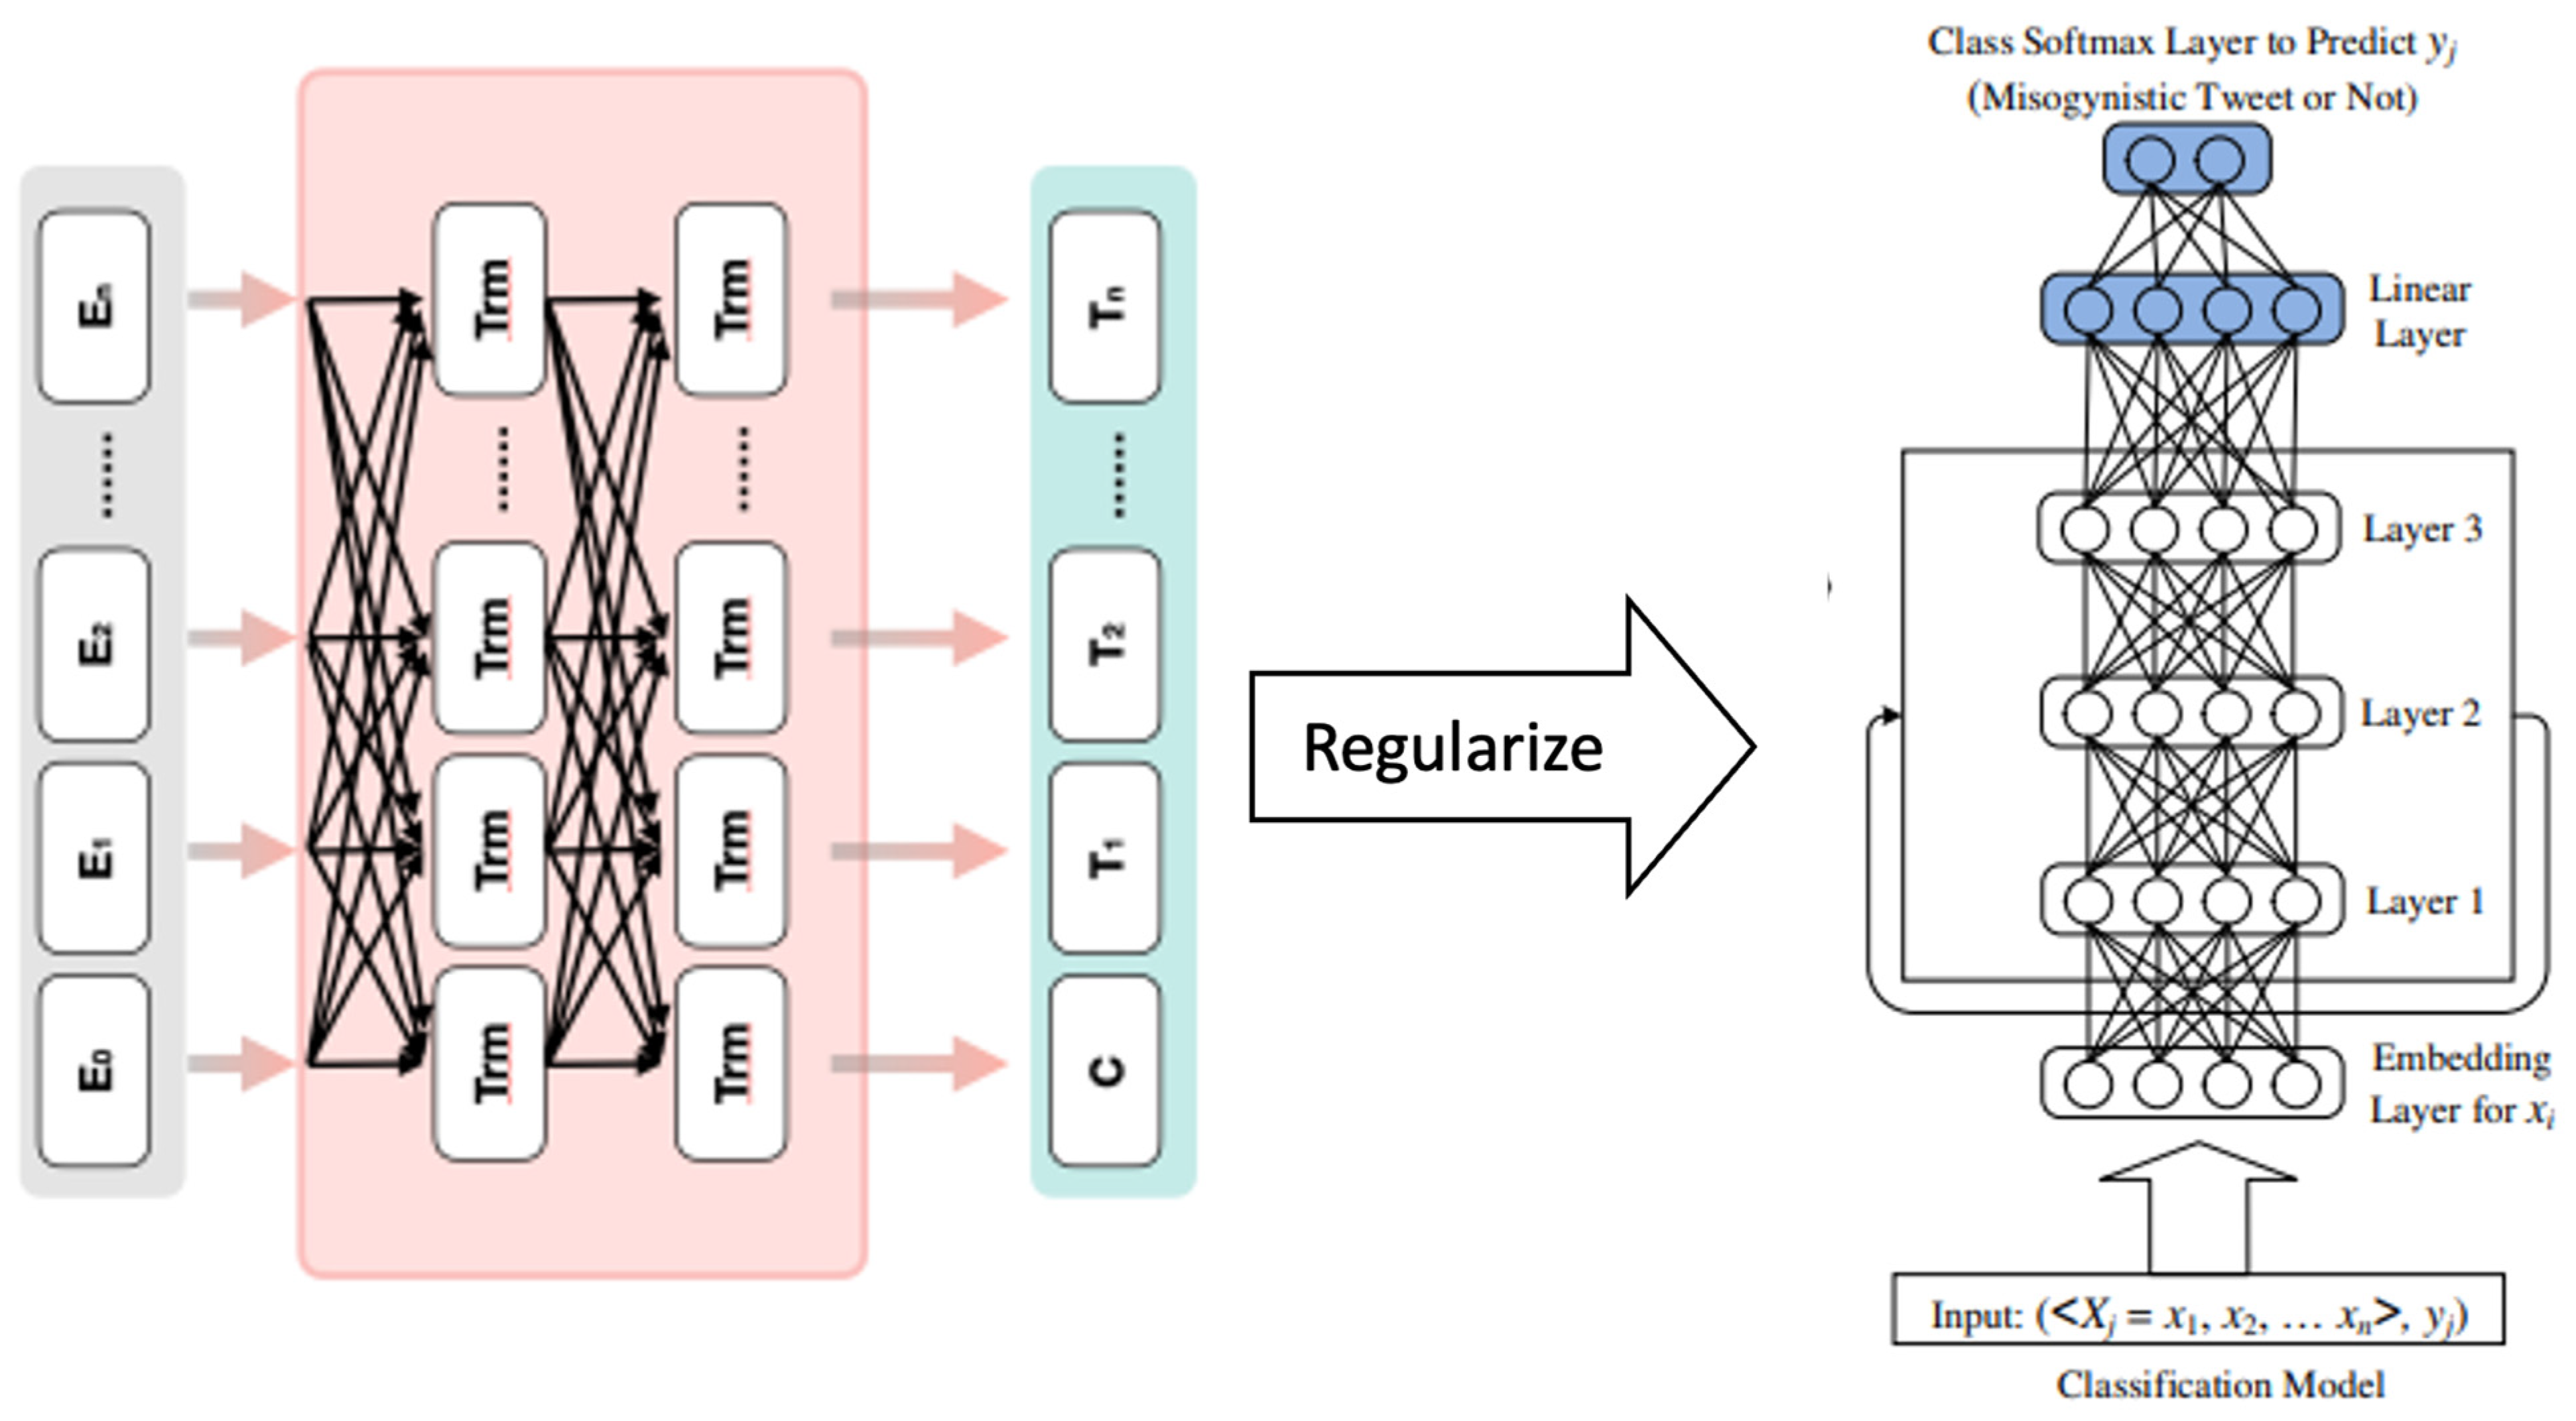
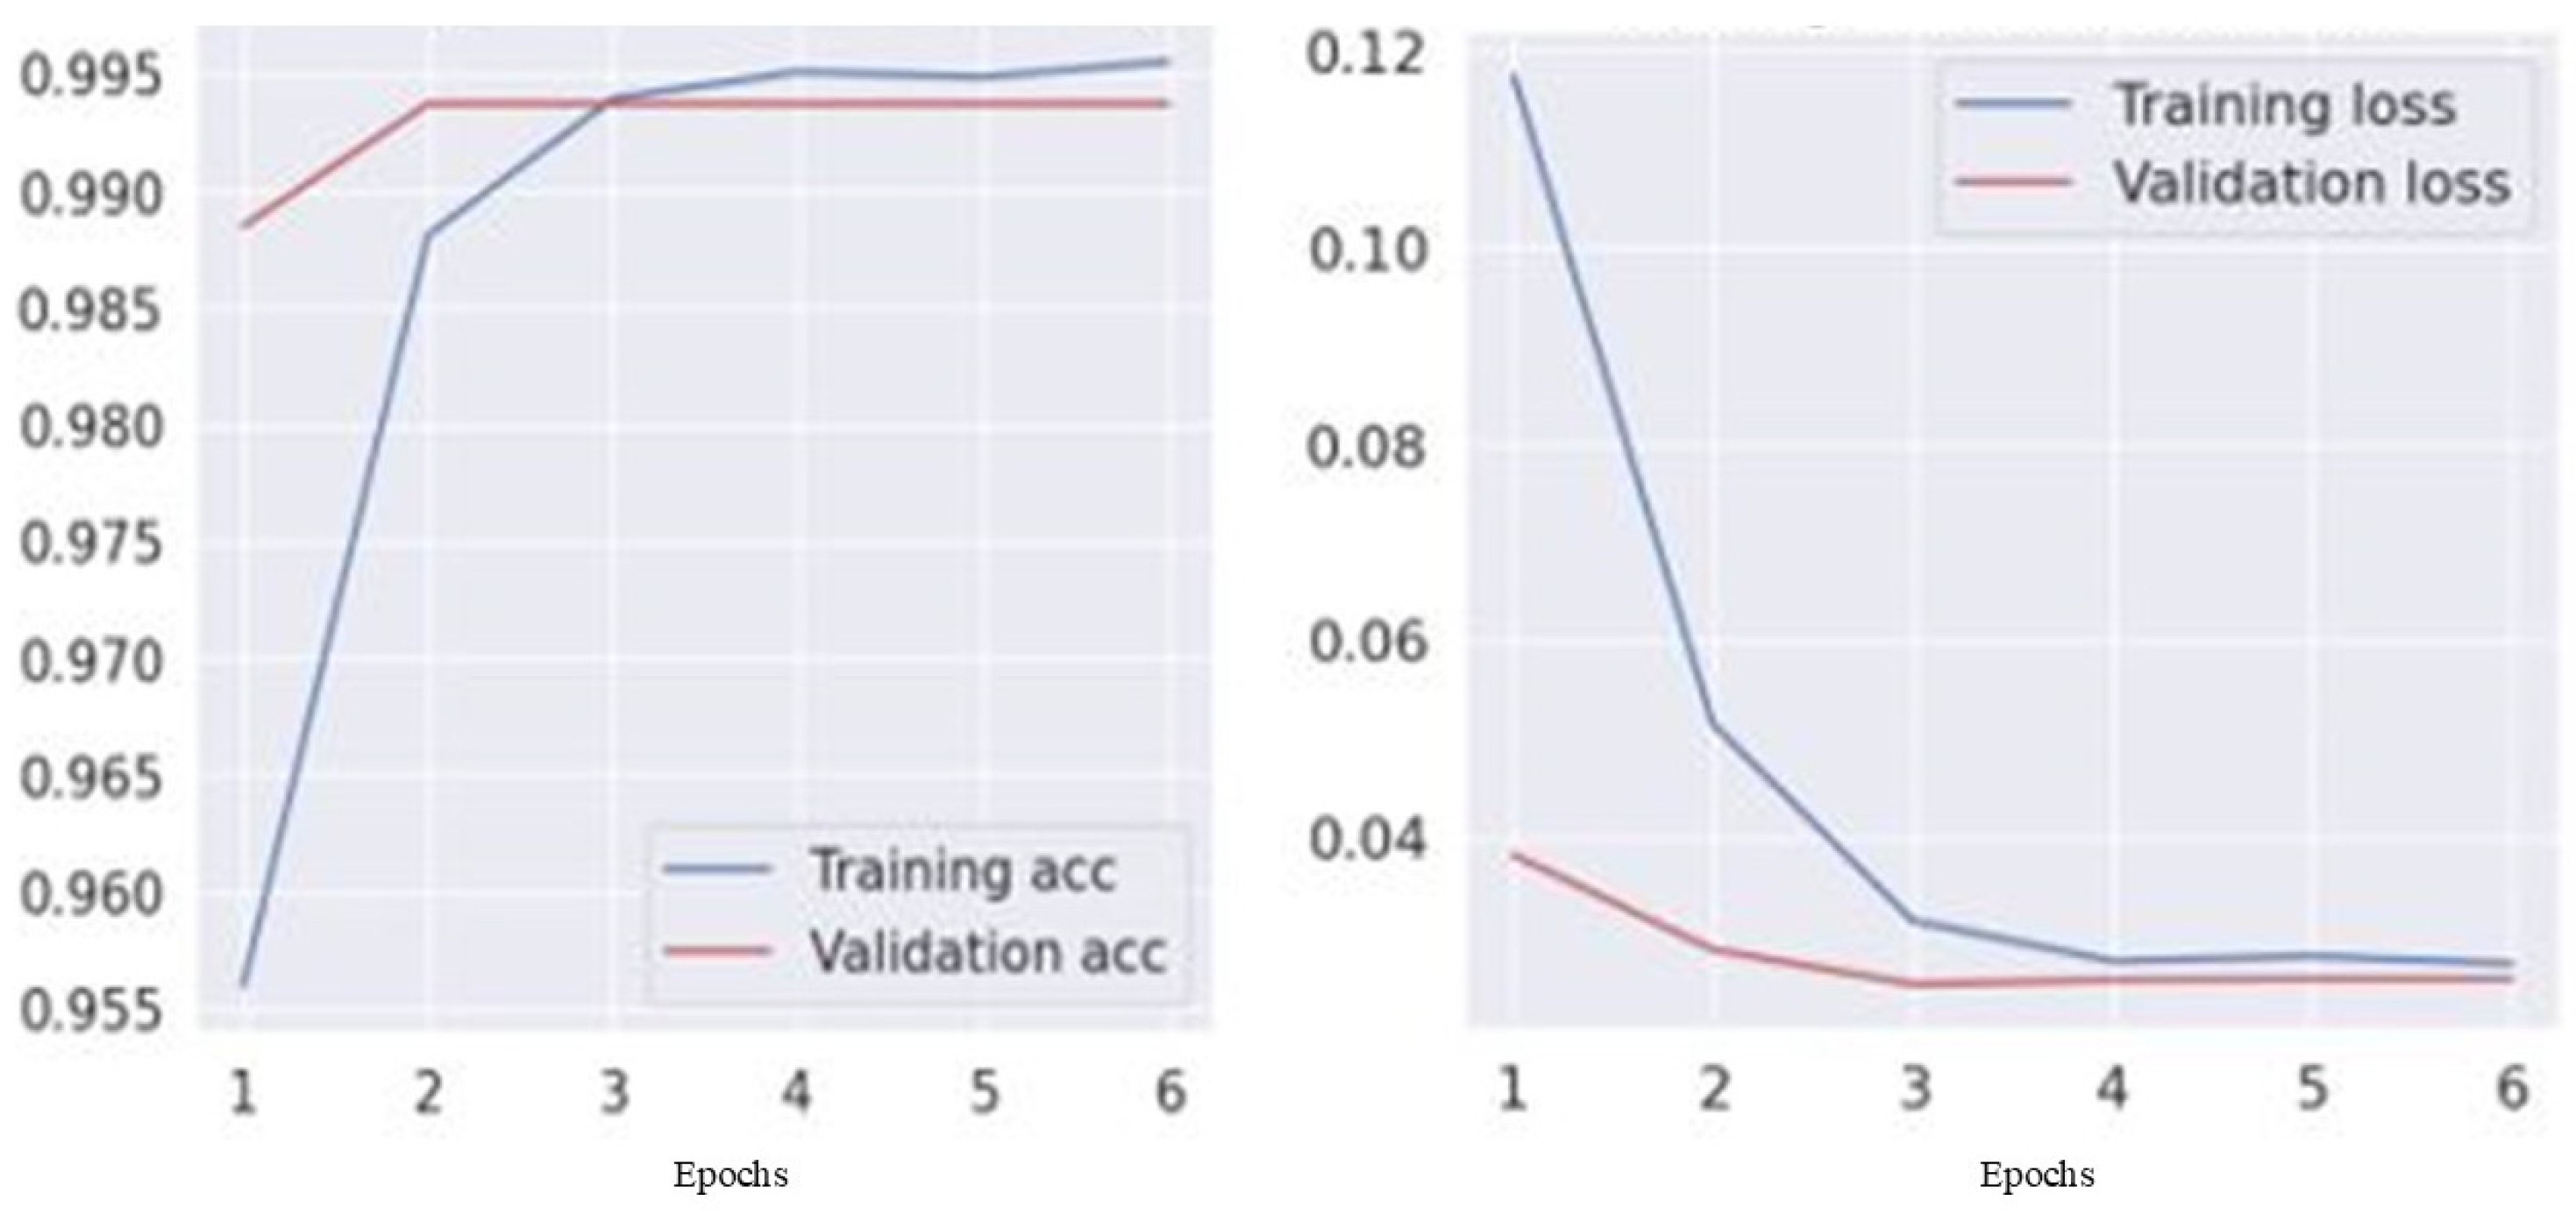
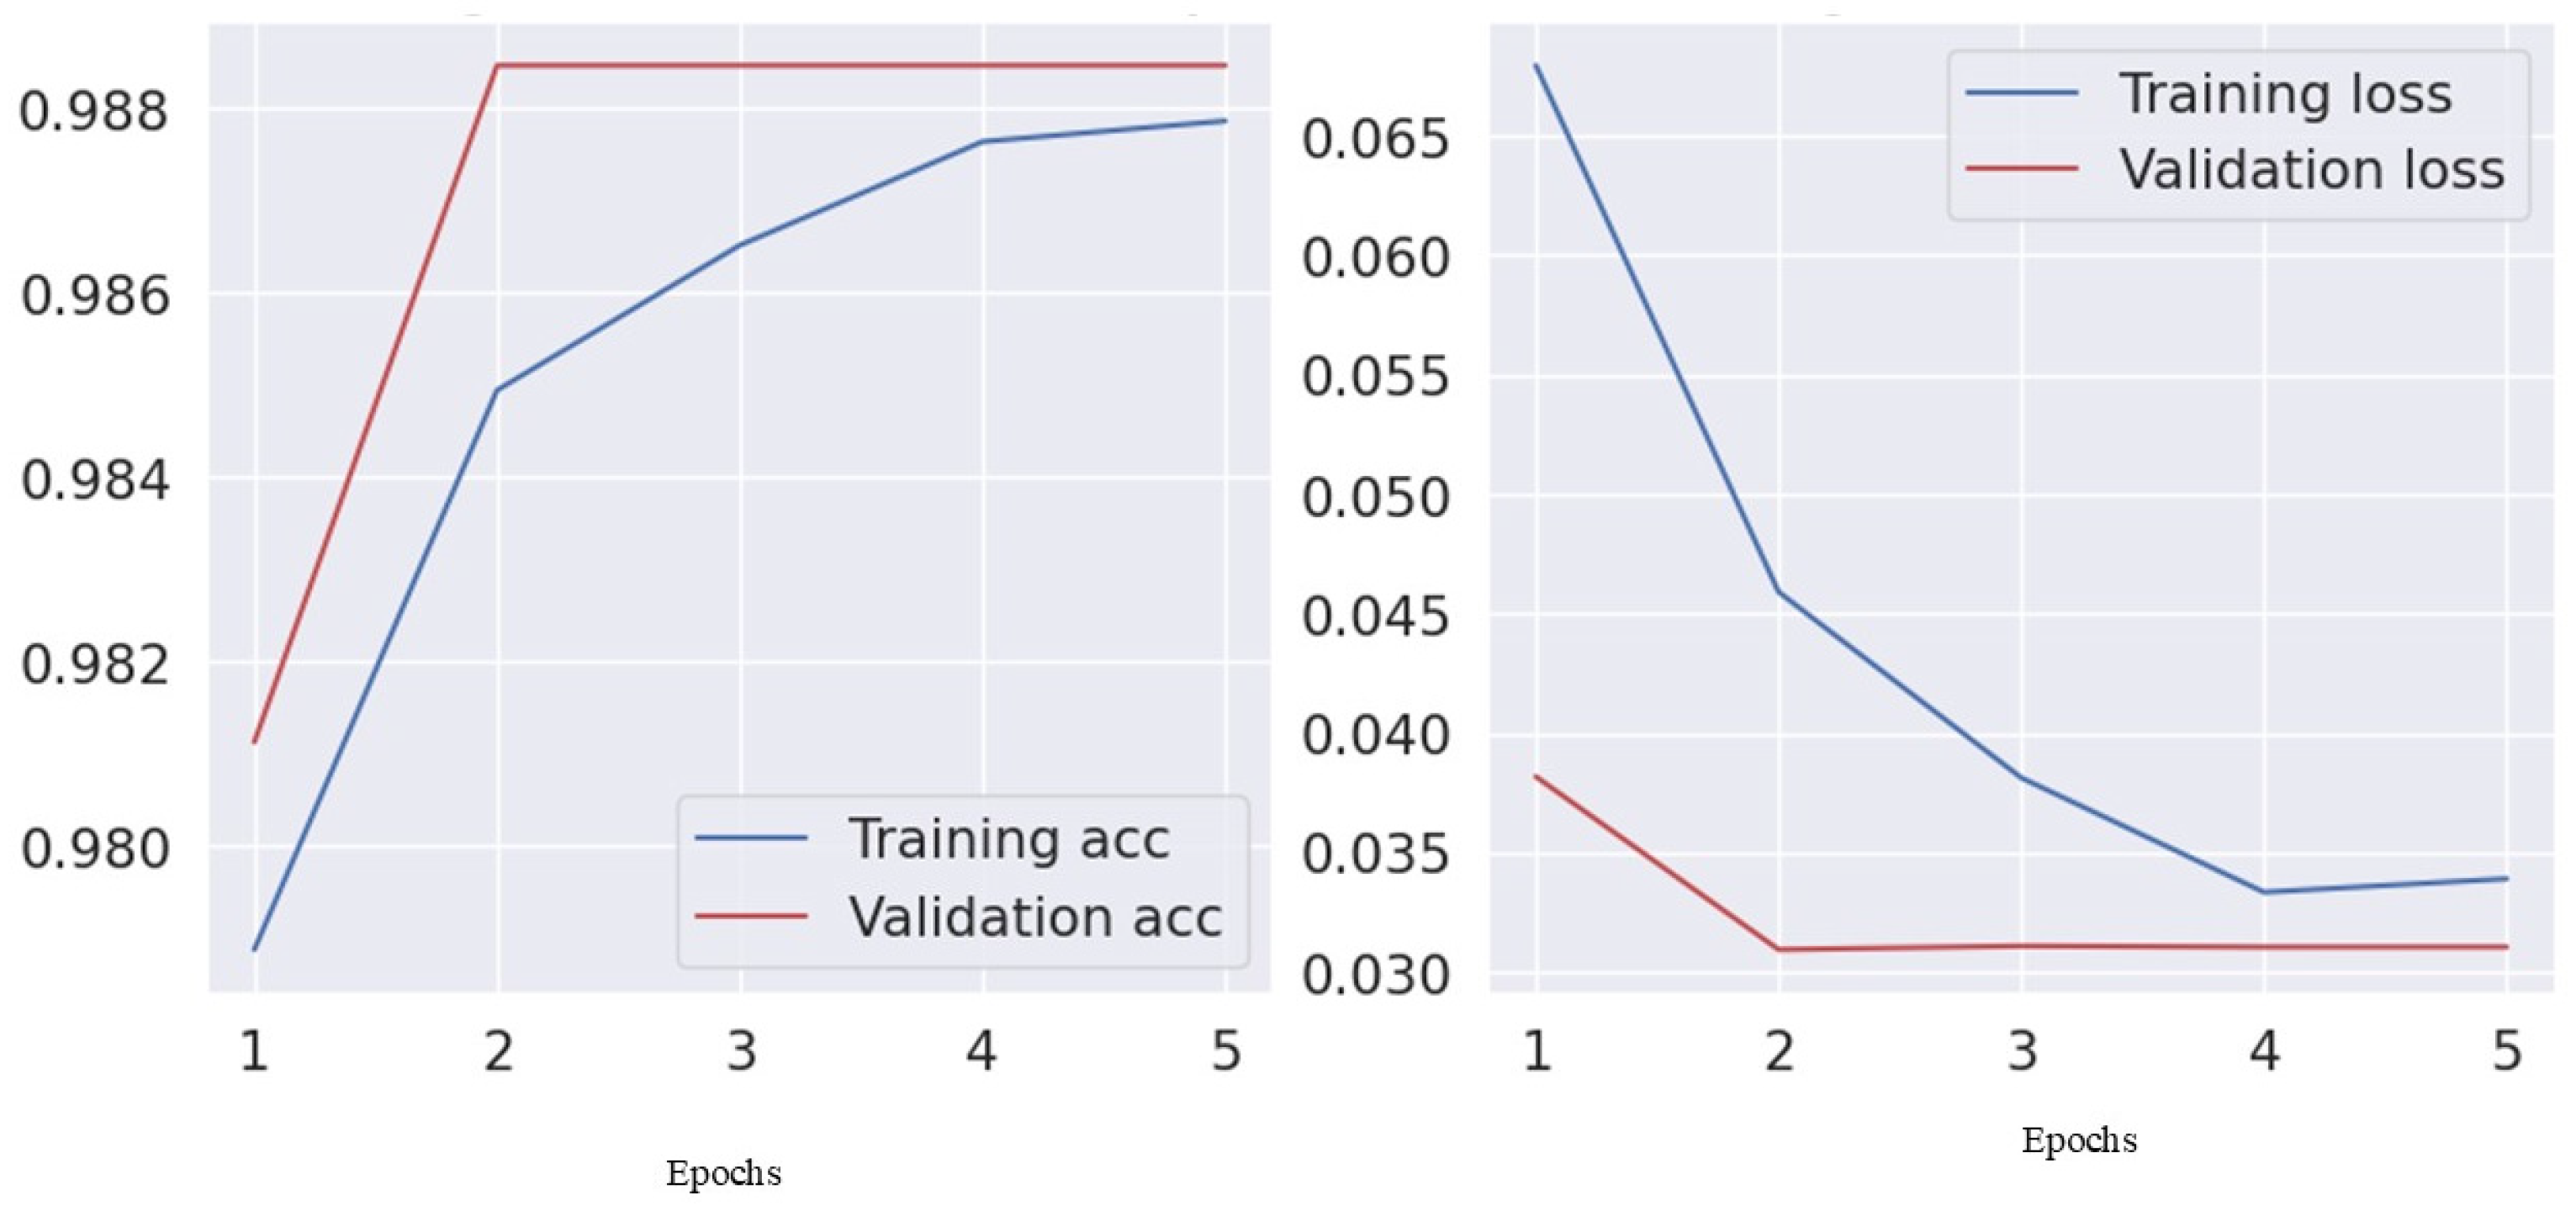
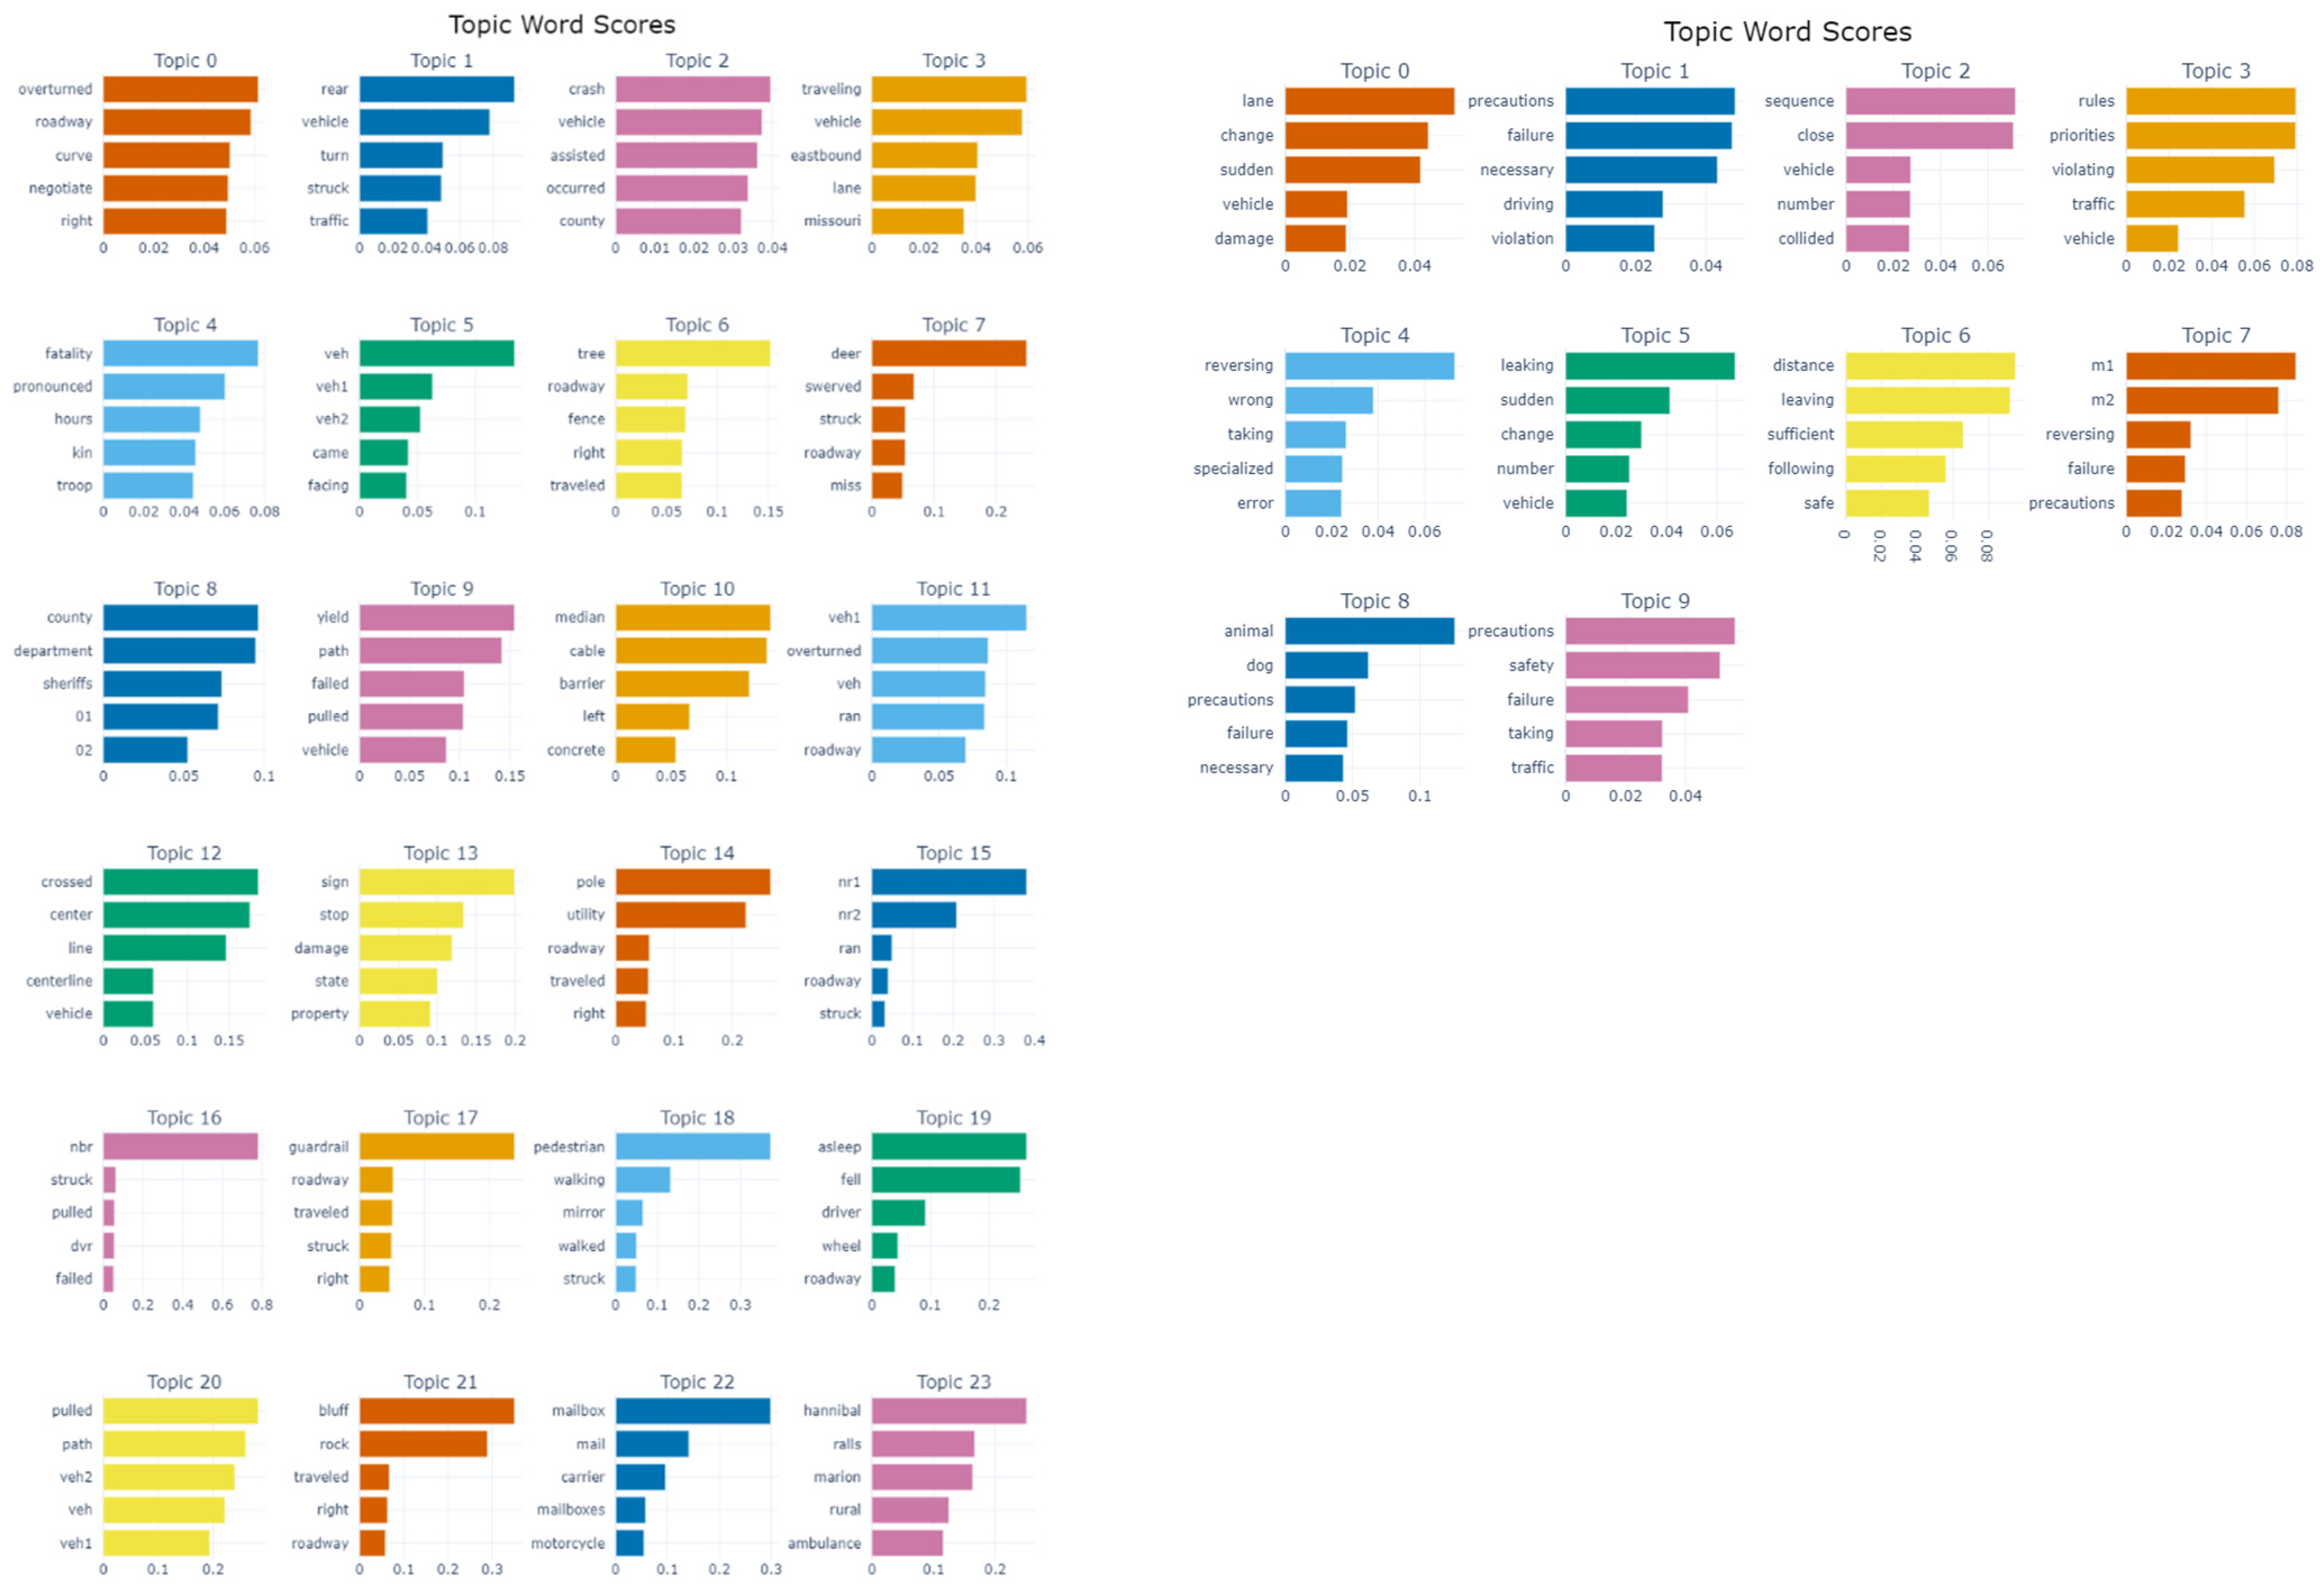
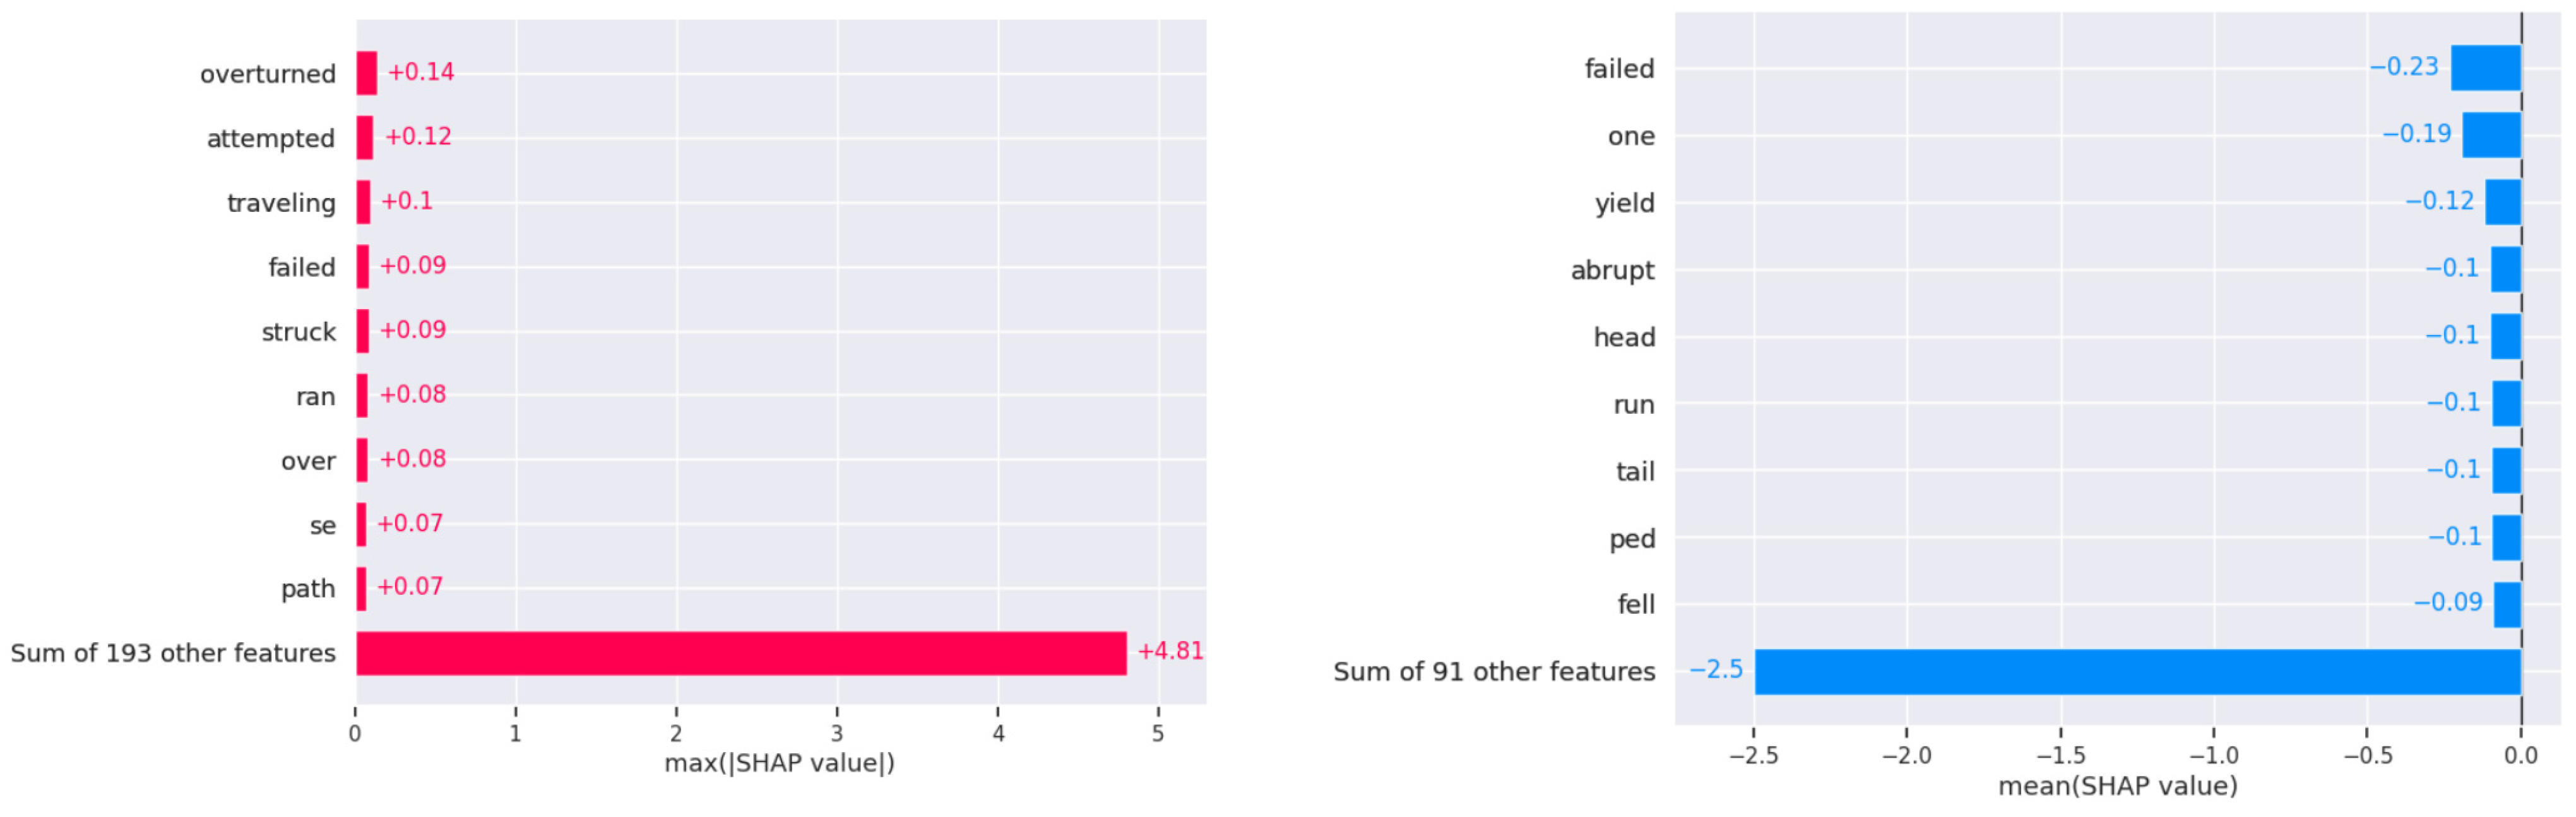
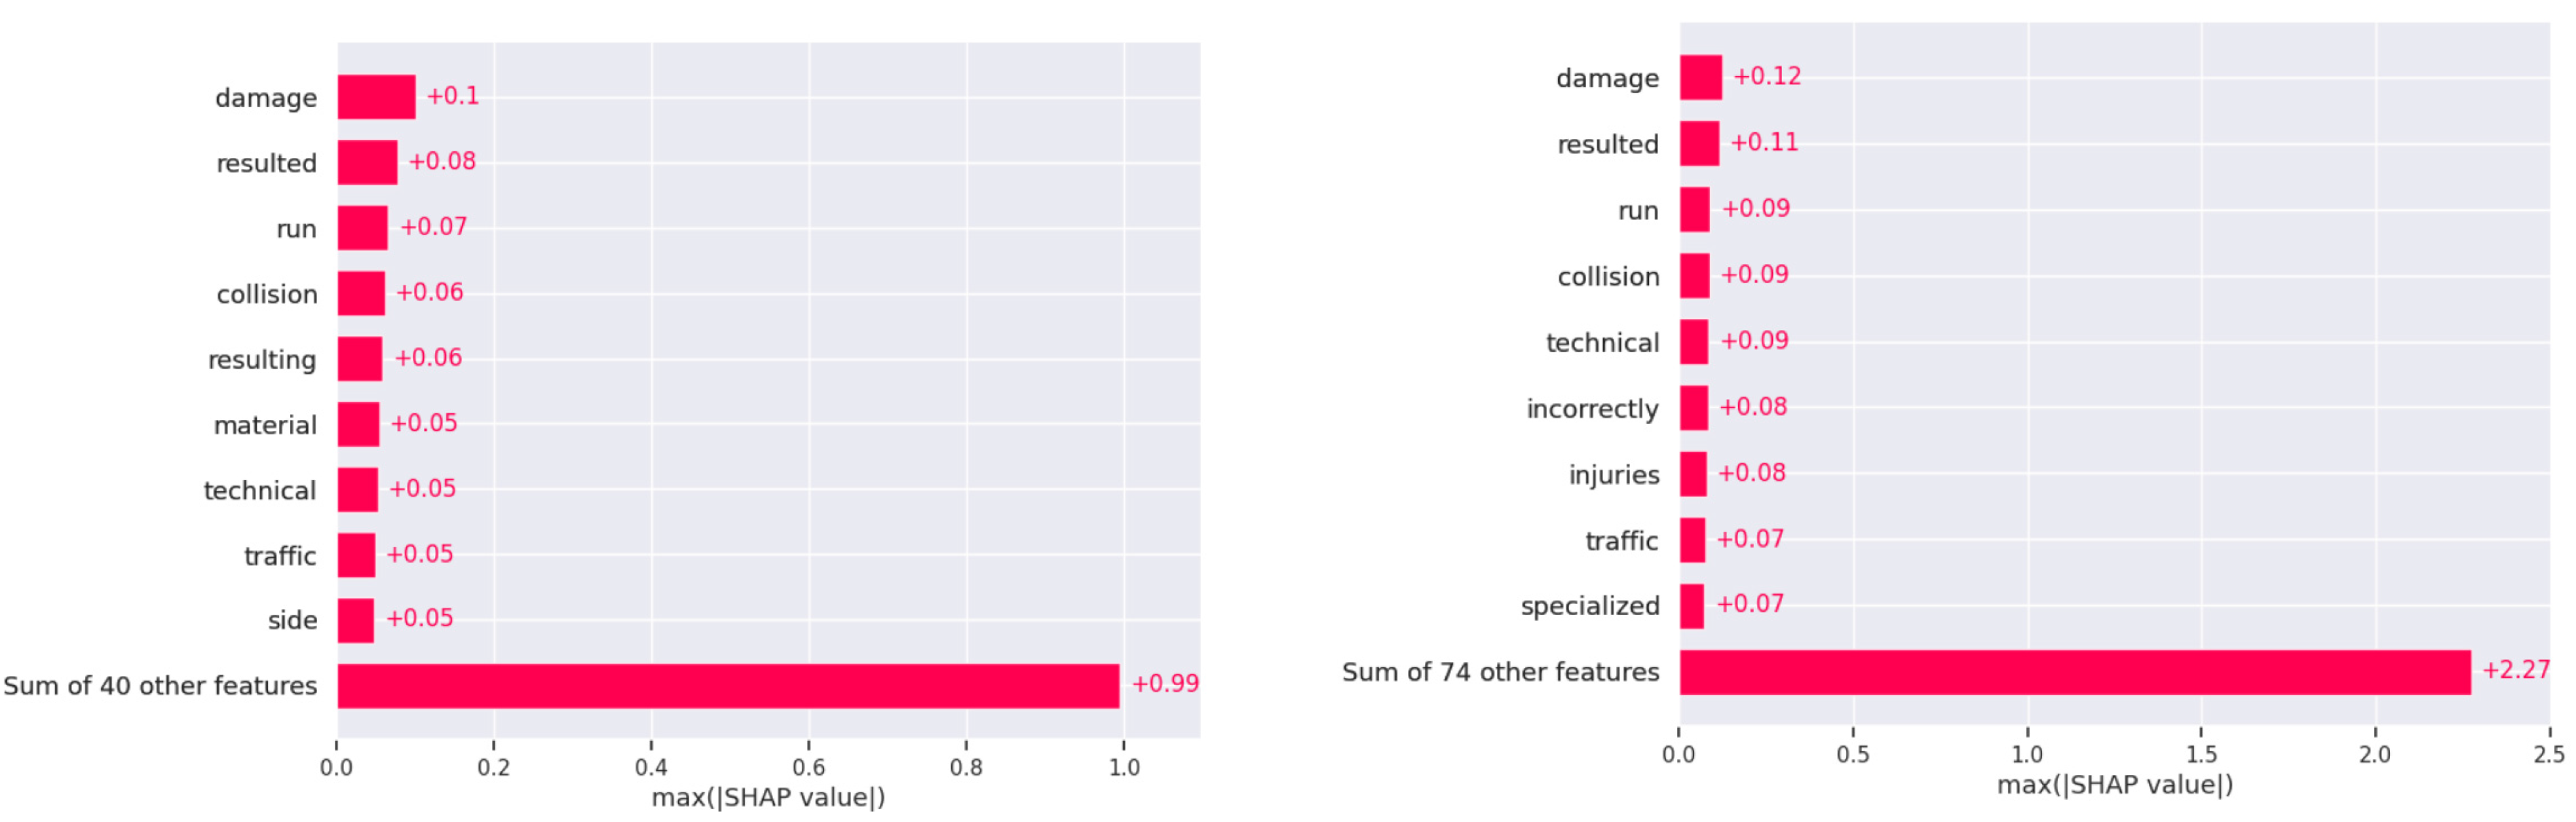

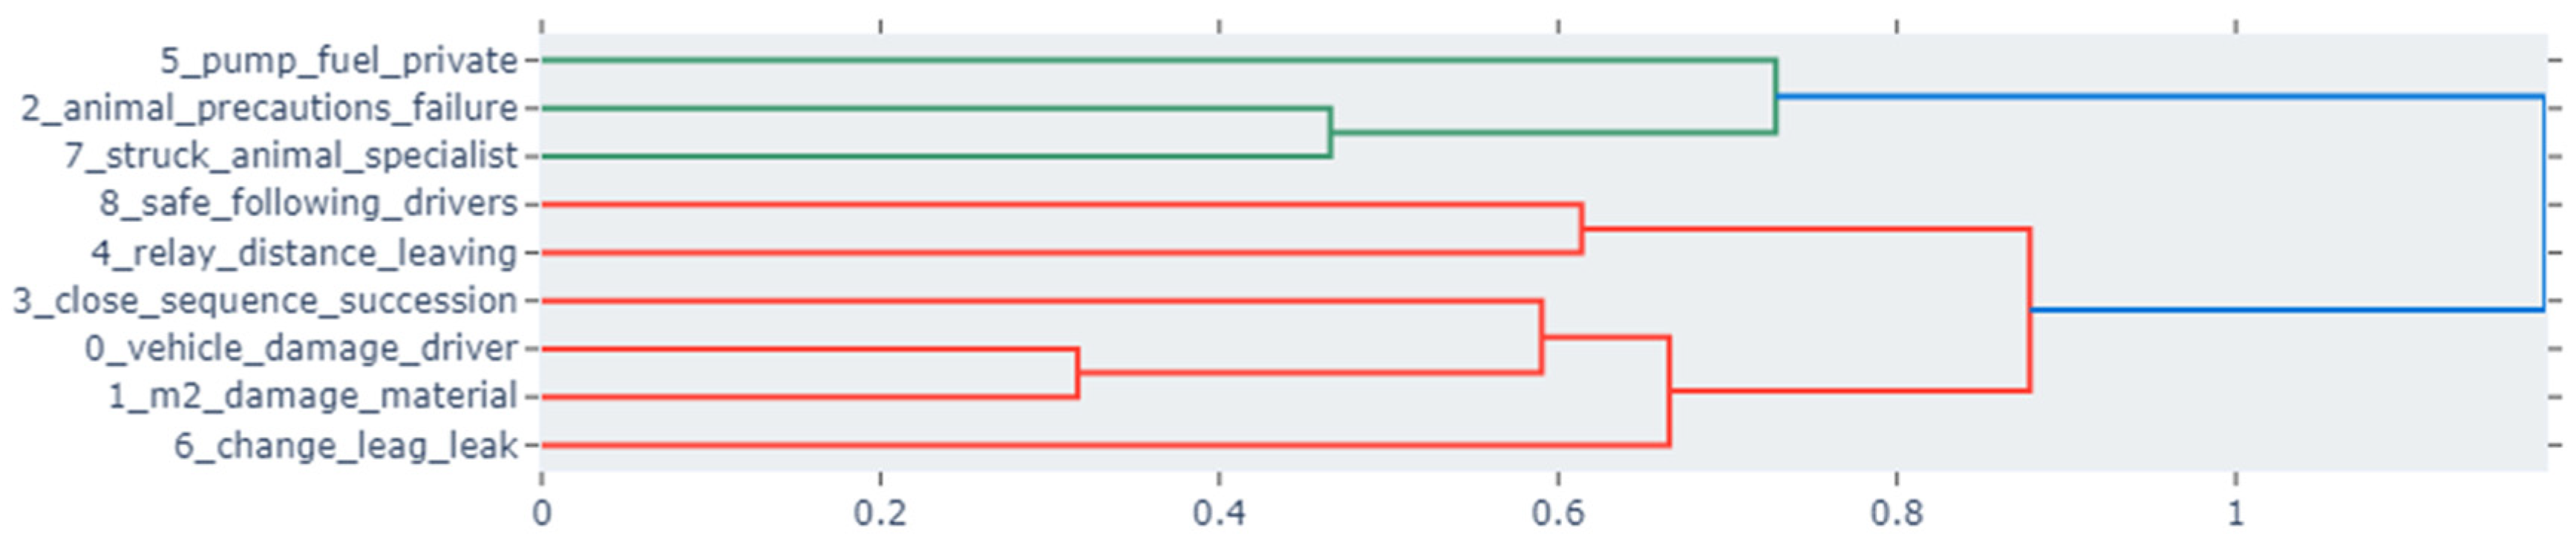
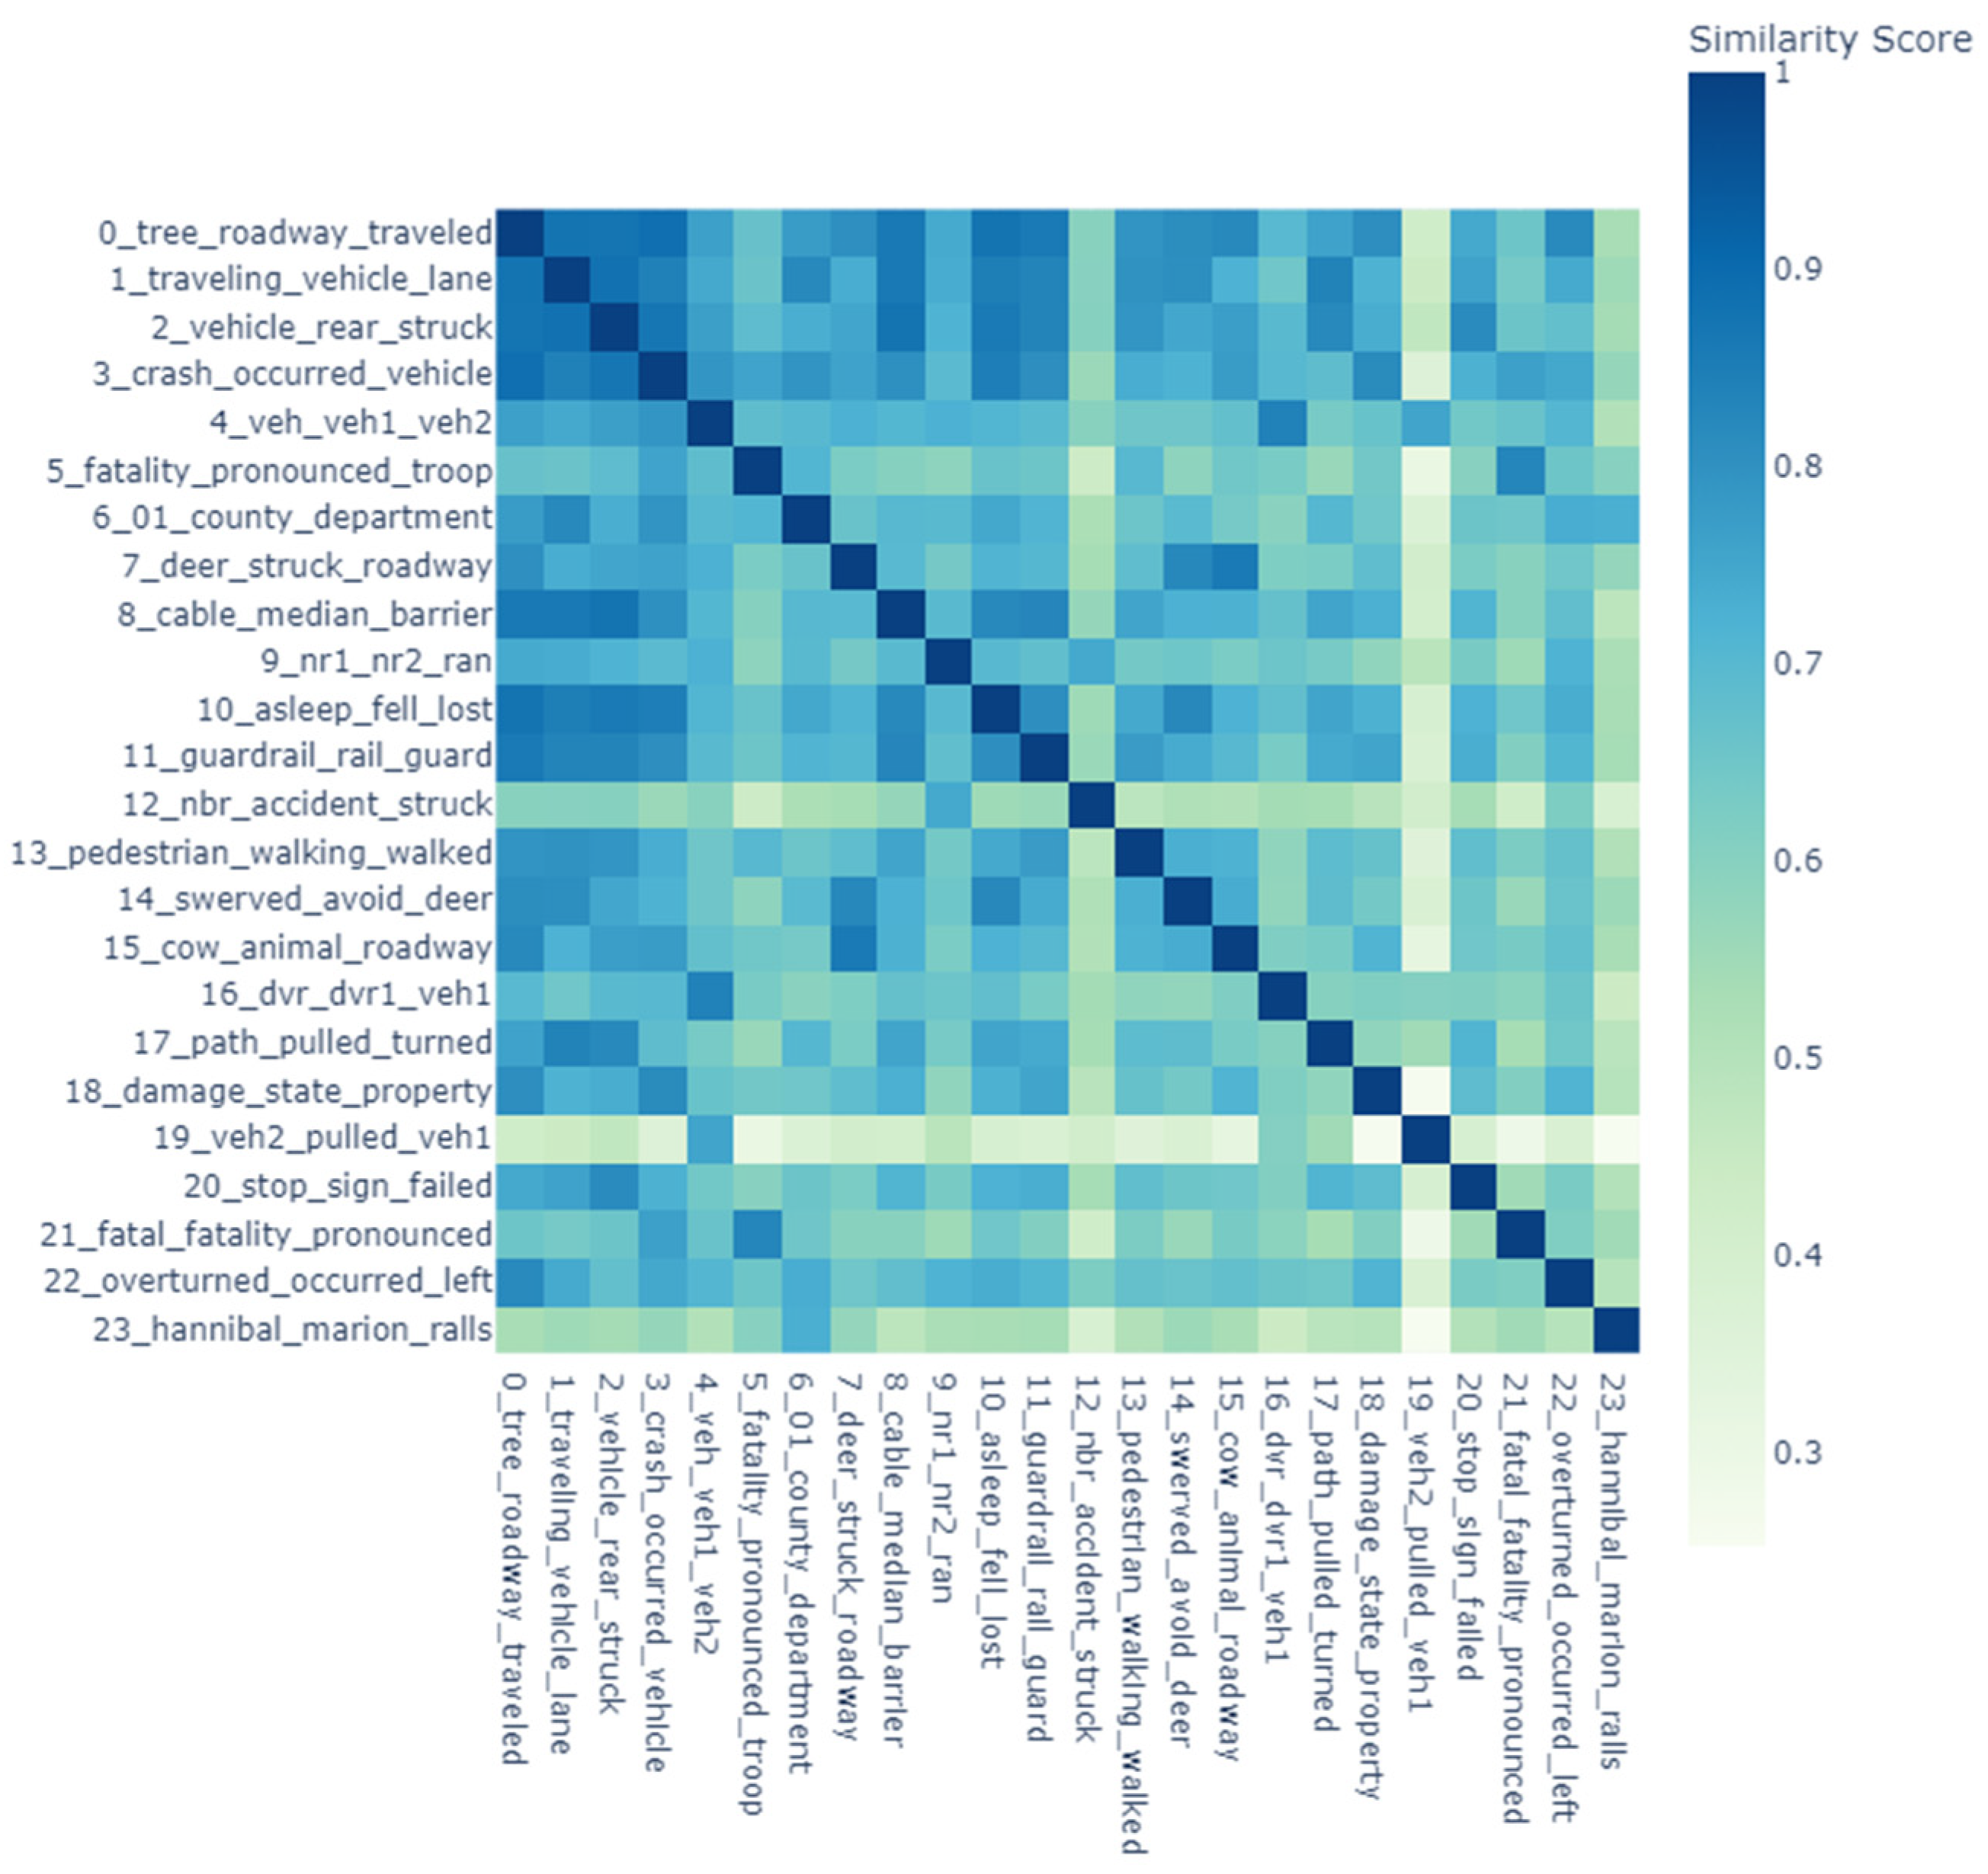


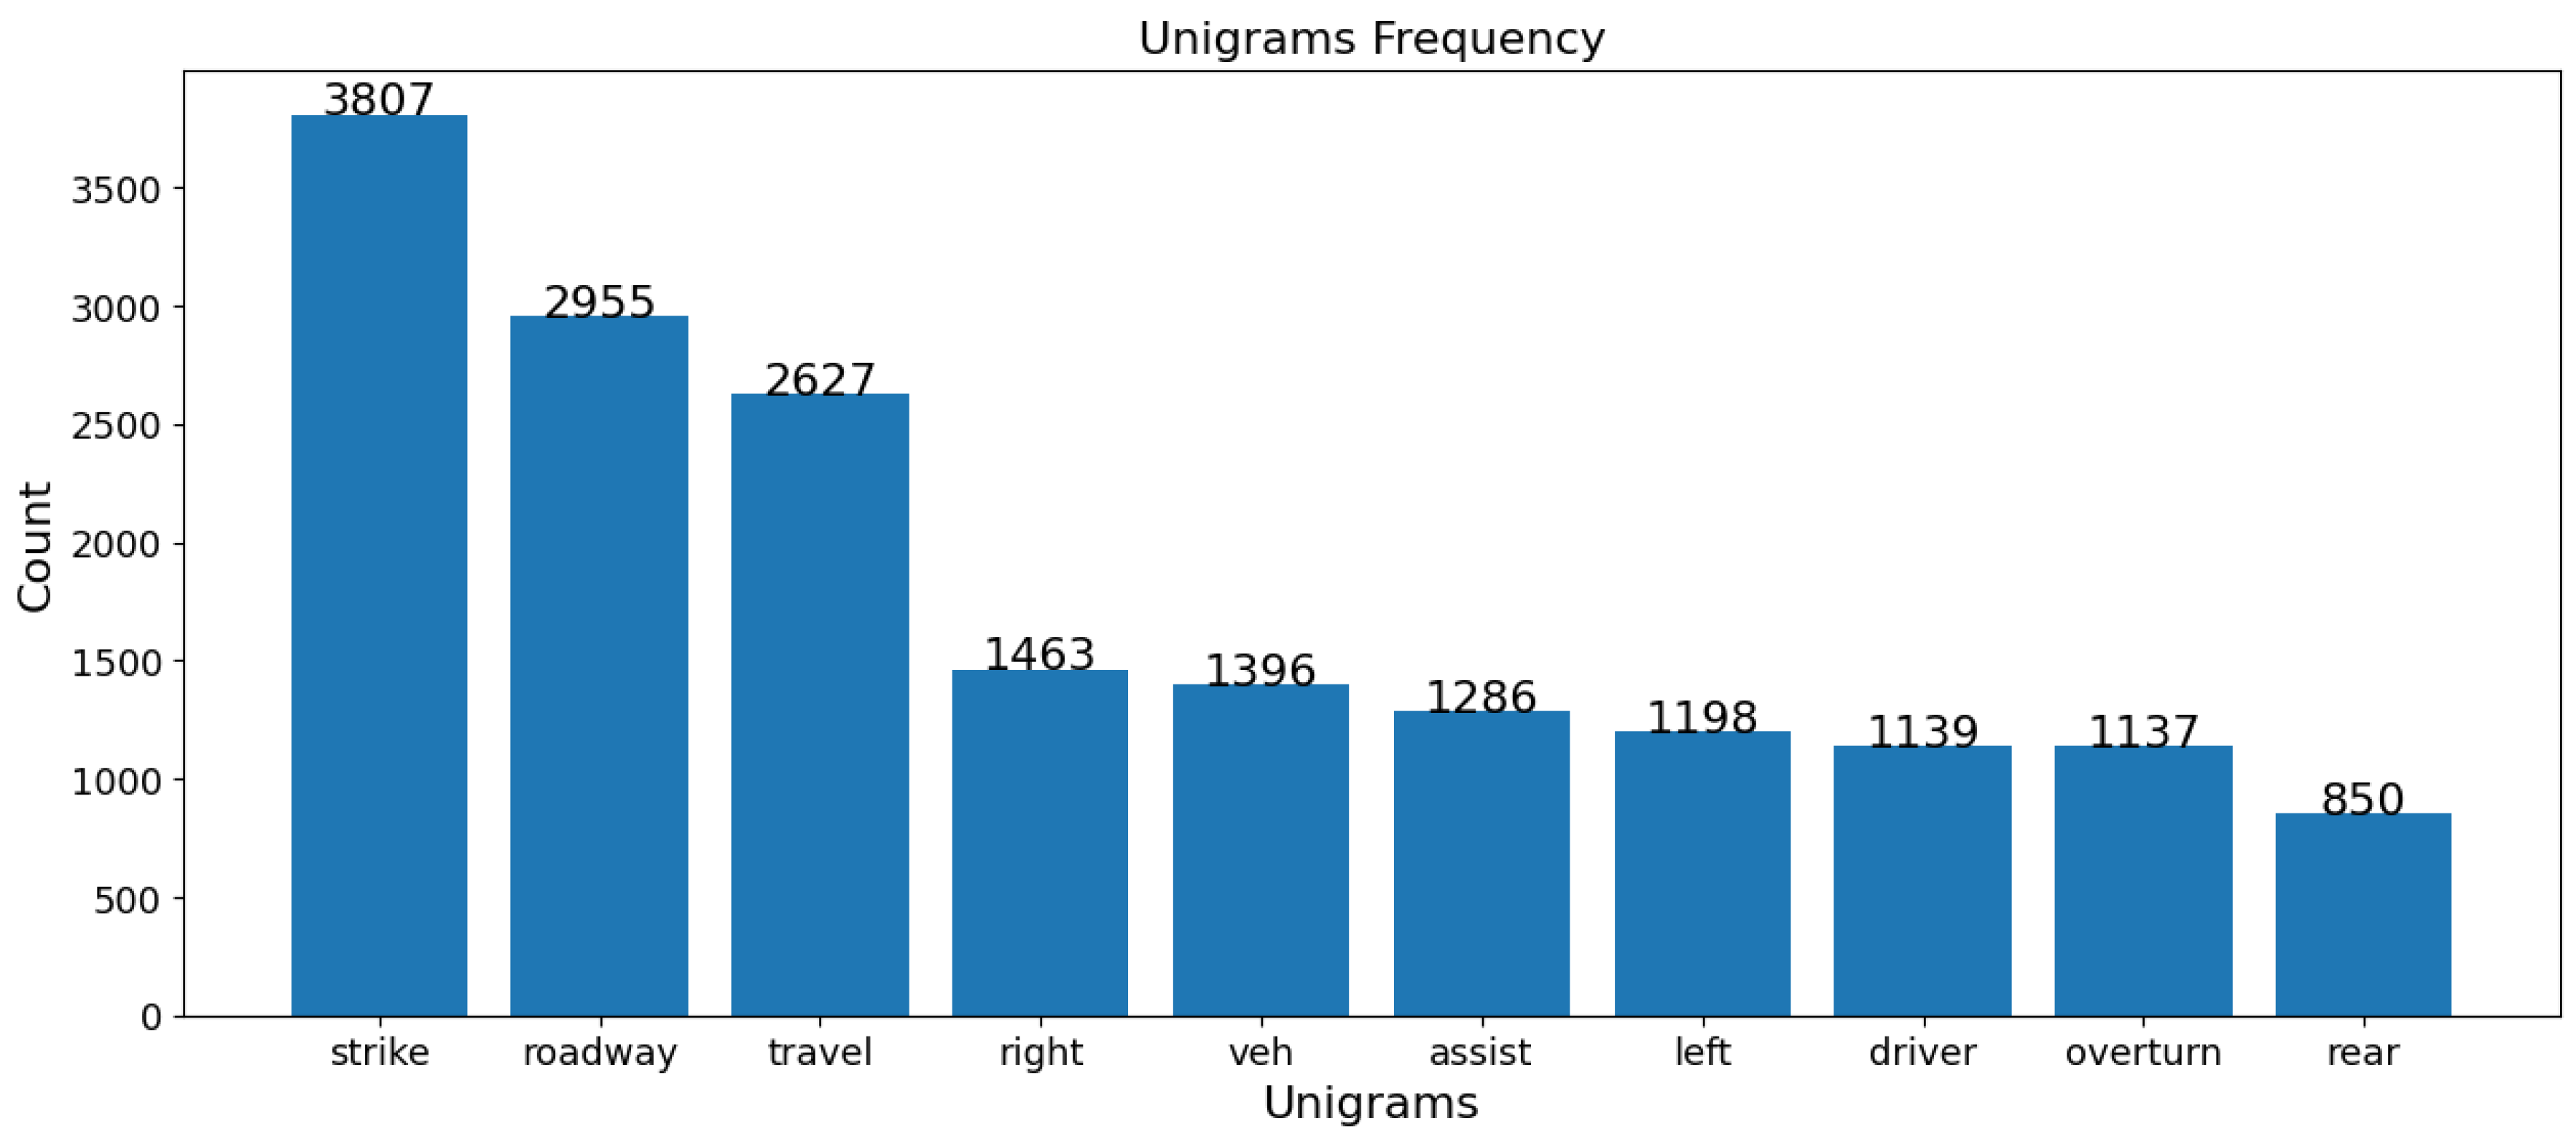

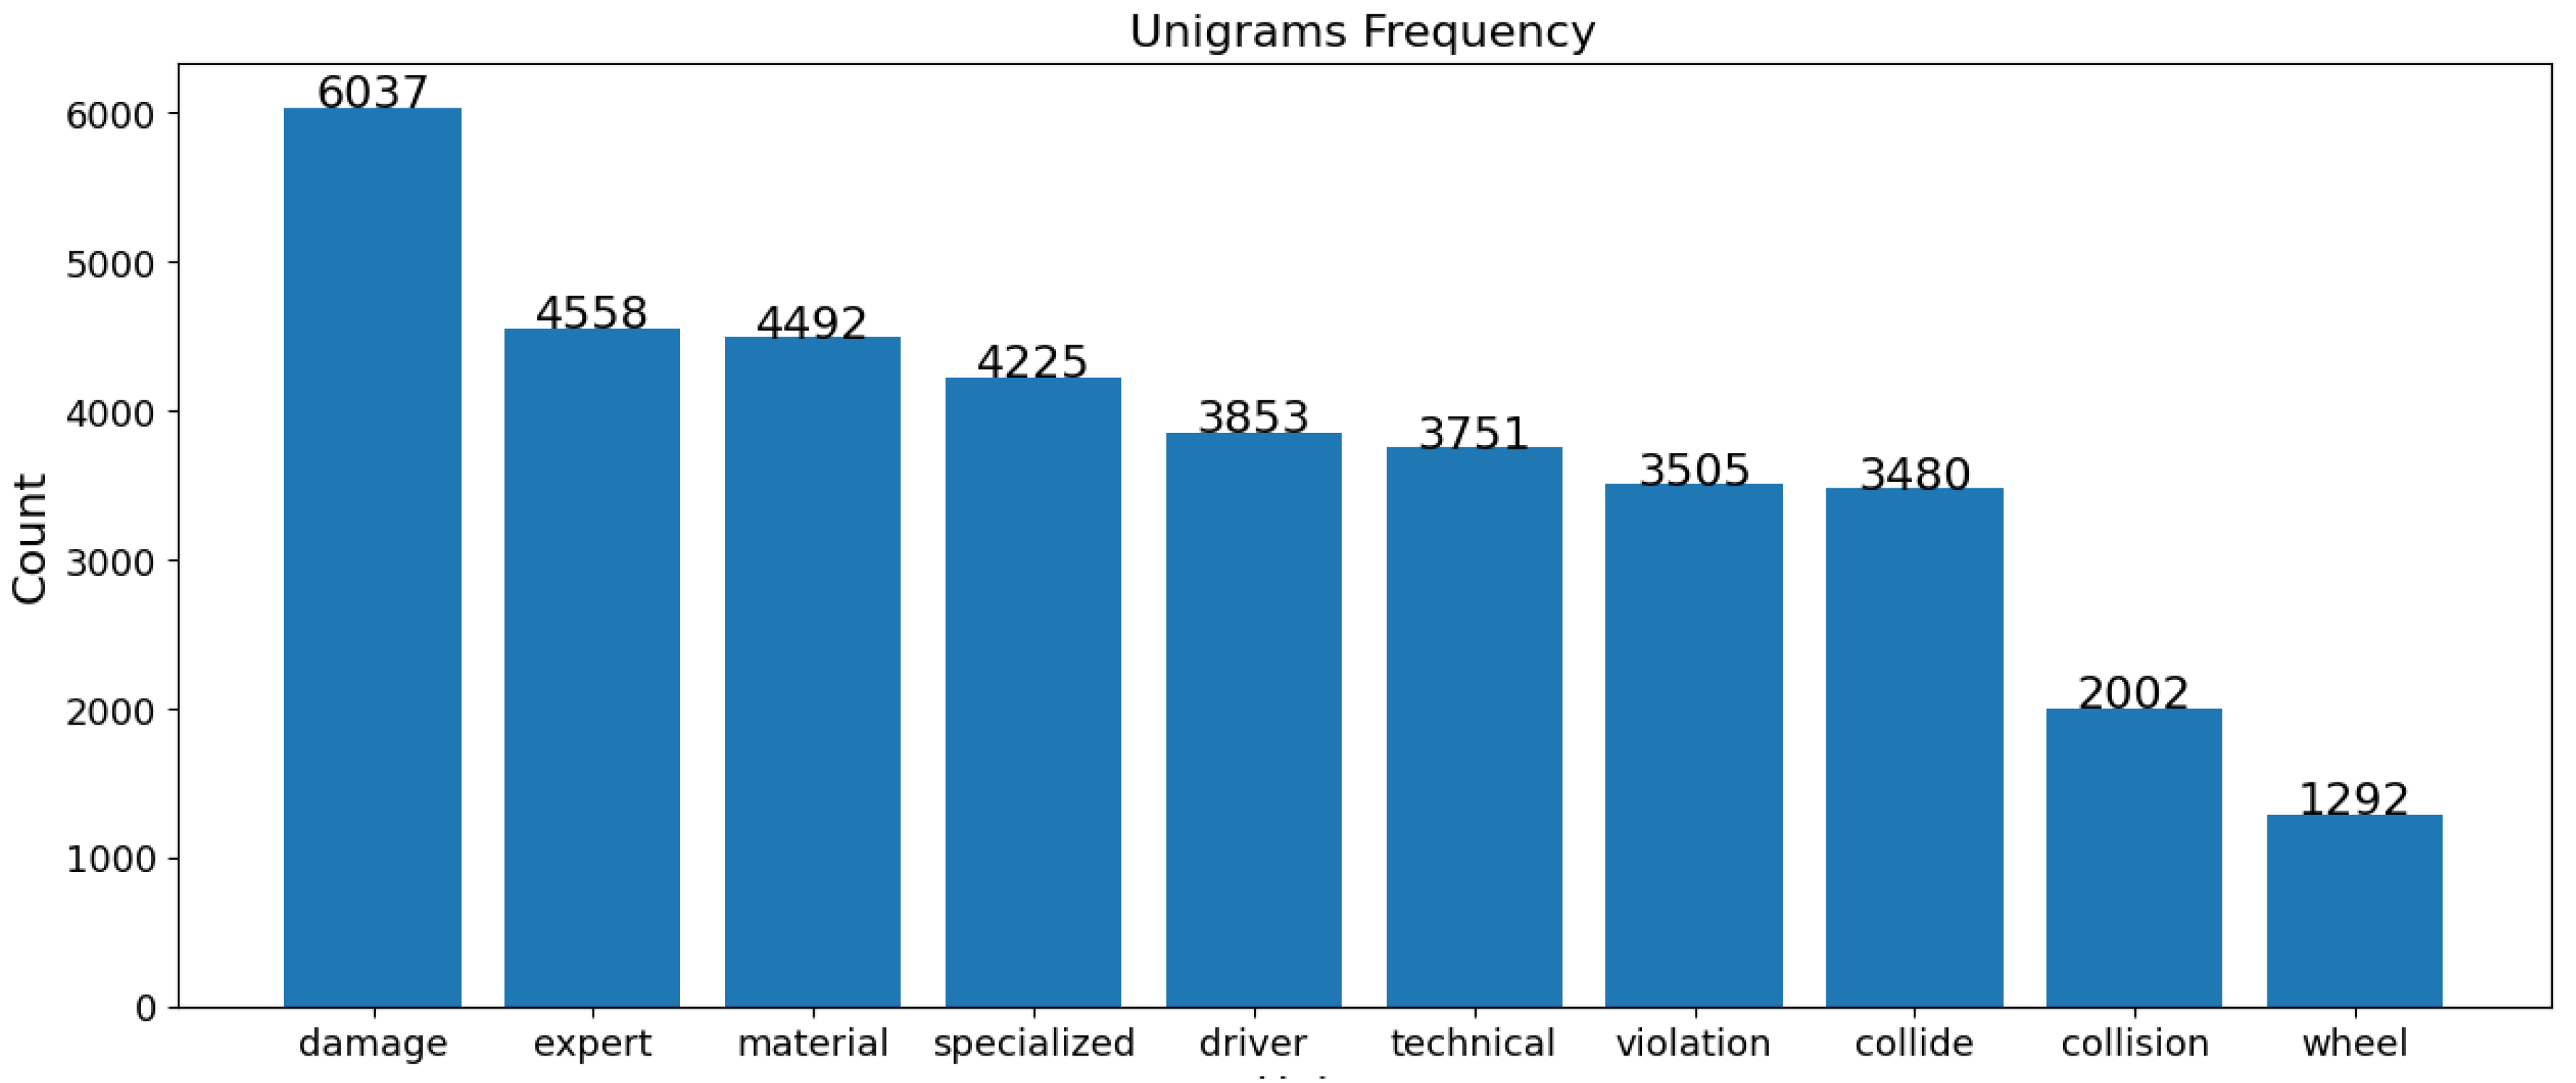
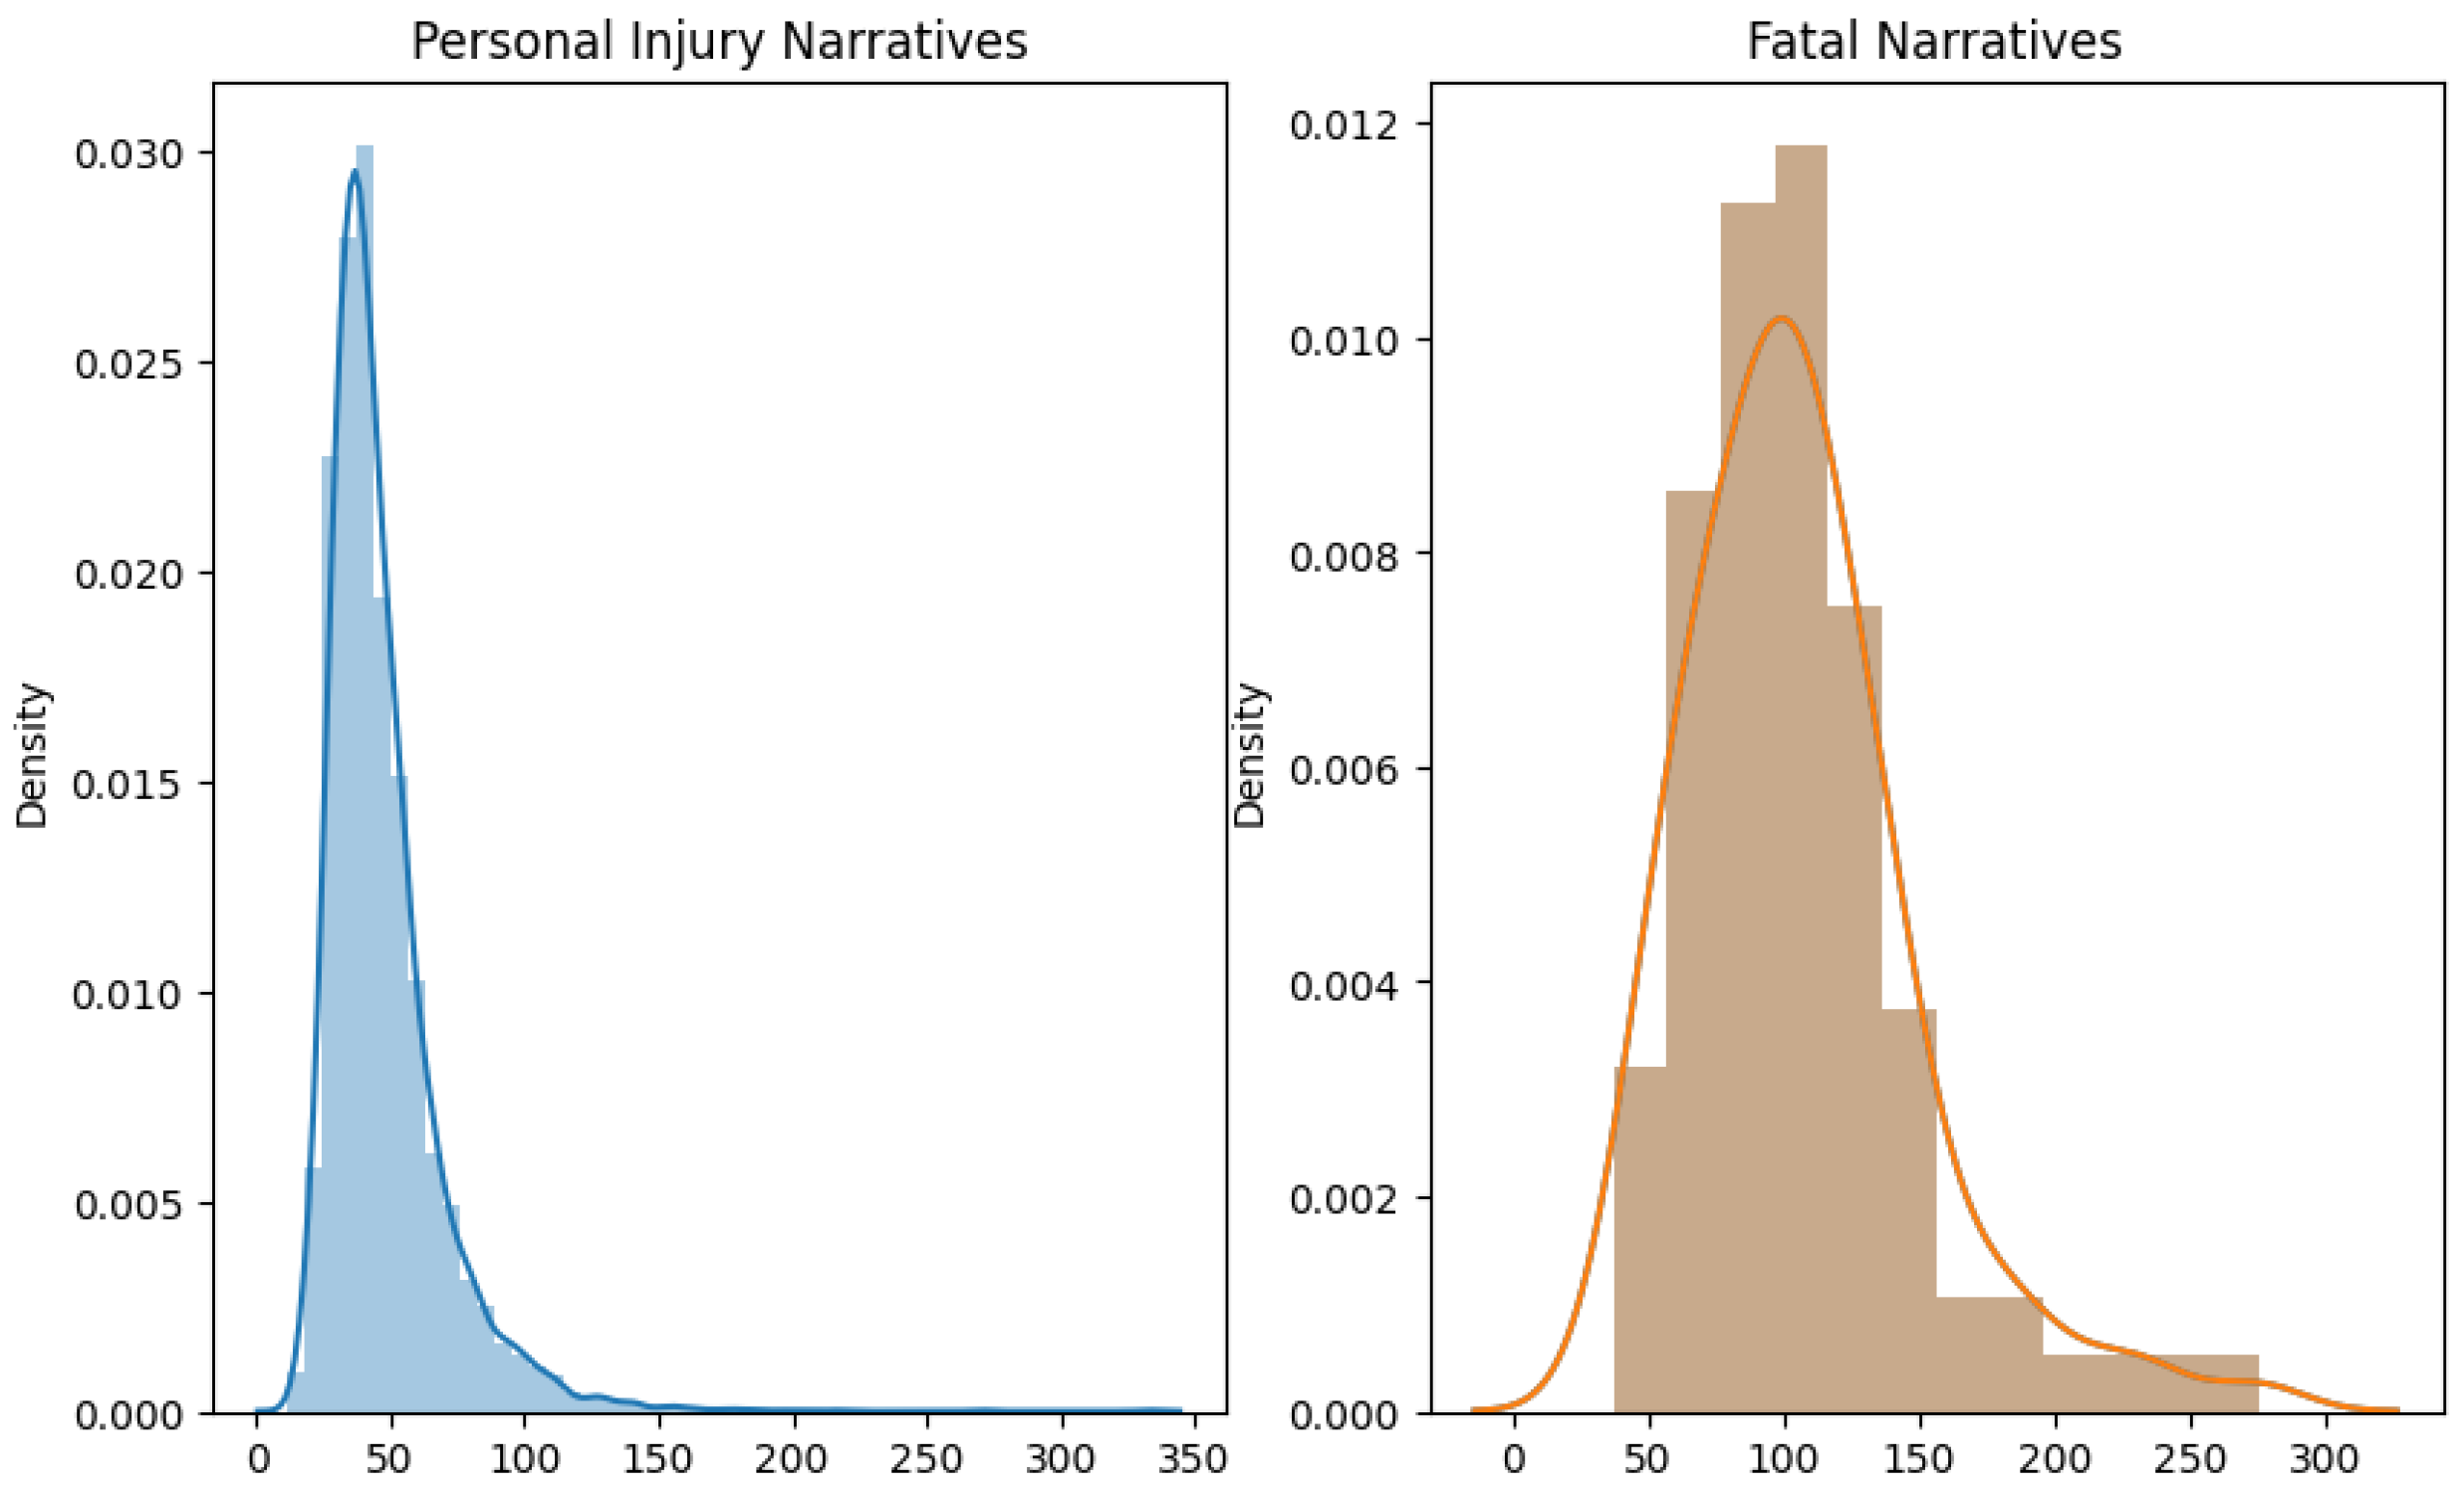
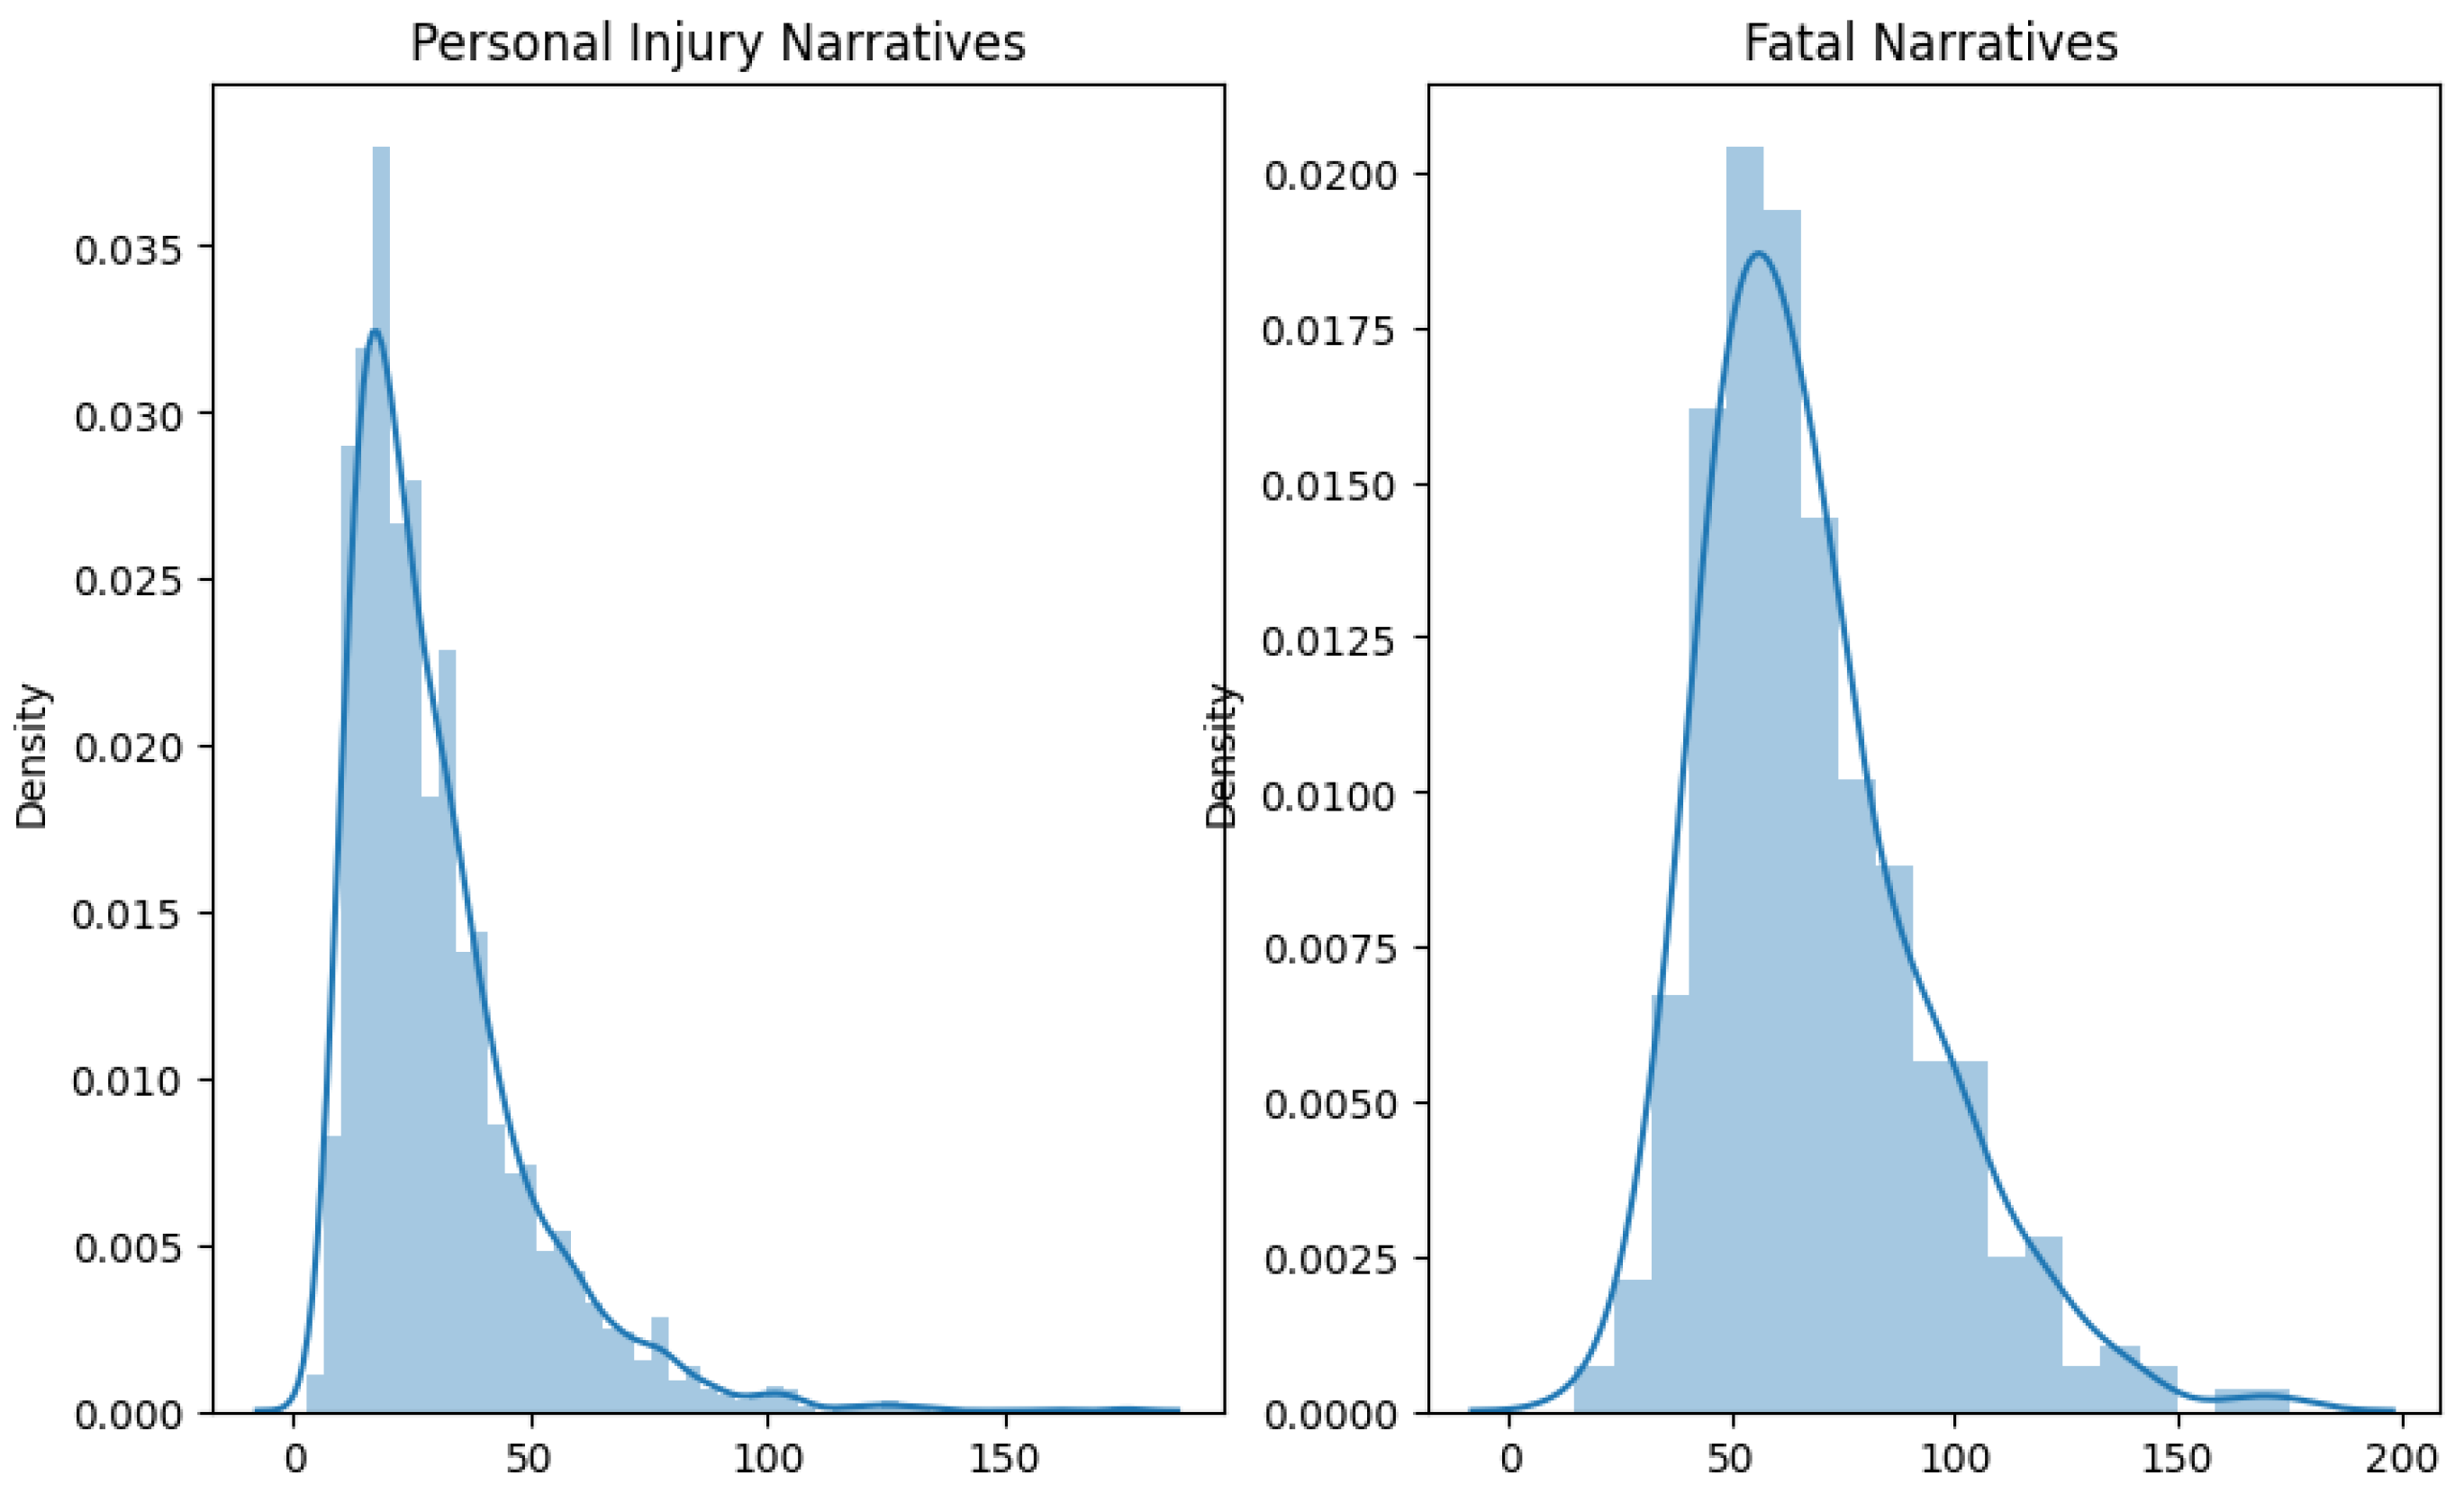
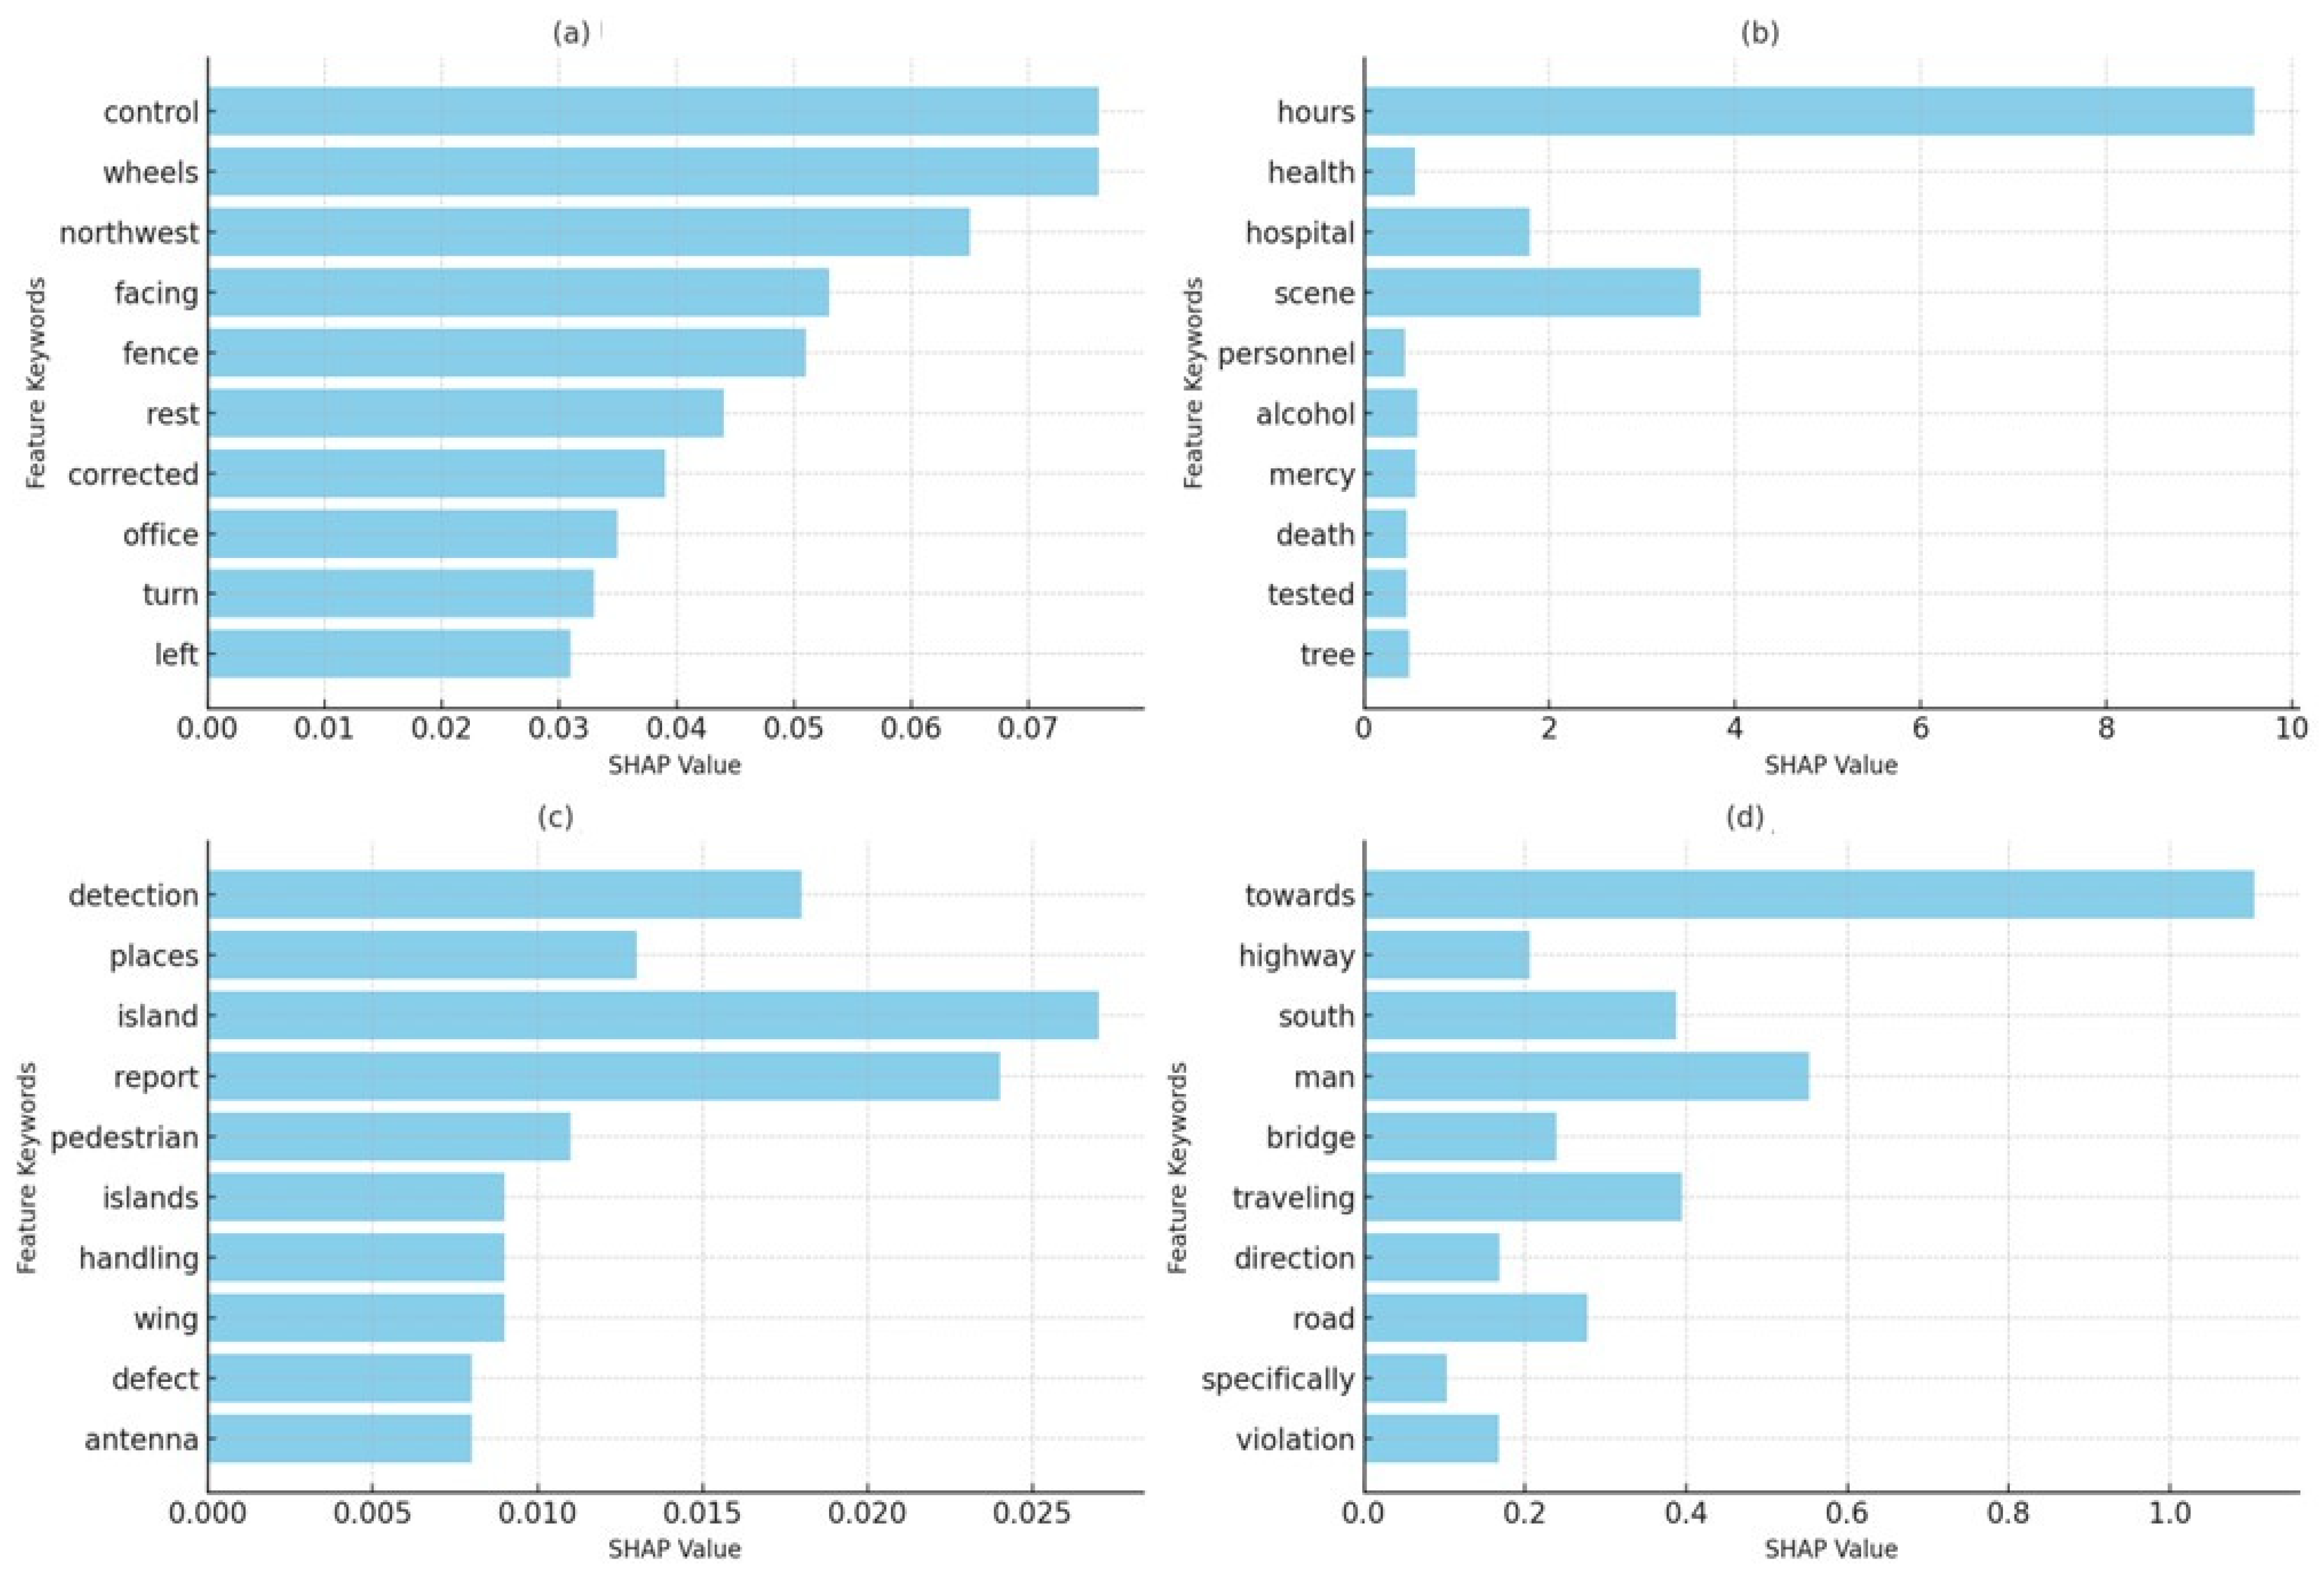
Disclaimer/Publisher’s Note: The statements, opinions and data contained in all publications are solely those of the individual author(s) and contributor(s) and not of MDPI and/or the editor(s). MDPI and/or the editor(s) disclaim responsibility for any injury to people or property resulting from any ideas, methods, instructions or products referred to in the content. |
© 2025 by the authors. Licensee MDPI, Basel, Switzerland. This article is an open access article distributed under the terms and conditions of the Creative Commons Attribution (CC BY) license (https://creativecommons.org/licenses/by/4.0/).