Abstract
This study analyzes the key factors influencing player rank prediction in PlayerUnknown’s Battlegrounds (PUBG), using machine learning models to evaluate in-game performance. By examining variables such as “walkDistance”, “boosts”, and “weaponsAcquired”, the study identifies these as critical predictors, with “walkDistance” emerging as the most significant across all match types. Utilizing models including random forest (RF), gradient descent (GD), extreme gradient boosting (XGBoost), and feedforward neural network (FNN), the analysis reveals performance variation by match type: XGBoost achieves the highest accuracy in solo matches (88.07%), GD performs best in duo matches (84.75%), and RF records the highest accuracy in squad matches (78.21%). These findings provide valuable insights for game developers in balancing gameplay and offer personalized strategic recommendations for players. Future research may enhance predictive performance by incorporating additional variables and exploring alternative models applicable to PUBG and similar battle royale games.
Keywords:
PUBG; rank prediction; machine learning; battle royale; feature importance; game analytics 1. Introduction
The battle royale genre has gained widespread popularity in the global gaming industry over the past decade, attracting millions of players across diverse platforms. Characterized by its last-man-standing gameplay, large-scale multiplayer modes, and dynamic survival strategies, the genre offers intense, high-stakes competition that appeals to both casual and competitive gamers. Games such as Fortnite, Apex Legends, and Call of Duty: Warzone have further solidified the genre’s presence by fostering massive player communities and hosting global e-sports events. This rise in popularity highlights the growing interest in competitive survival-based games, making them a prominent focus of game developers and researchers alike [1,2]. Among these titles, PlayerUnknown’s Battlegrounds (PUBG) stands out as a pioneering example of the battle royale genre, achieving global success and amassing a significant player base. In PUBG, multiple players compete in a survival-based game mode on a single map, with the ultimate goal of being the last player or team standing. A player’s rank in PUBG is primarily determined by how long they survive and how many opponents they eliminate, making ranking an essential metric of performance within the game [1,2,3].
A variety of factors influence a player’s rank in battle royale games such as PUBG. Given the high level of difficulty, randomness, and competitive nature of the game, predicting a player’s rank is a complex problem [4,5]. As a result, research on rank prediction focuses on leveraging data analysis and machine learning techniques to understand how various in-game factors affect player rankings. Rank prediction provides a systematic framework for evaluating a user’s current performance level, enabling the delivery of precise, data-informed feedback to support strategic goal-setting and the identification of specific areas for improvement. Moreover, it equips game developers and platform operators with advanced analytical tools to segment user groups effectively, facilitating the allocation of resources in a manner that is both targeted and efficient, thereby enhancing overall system performance and user engagement. Therefore, this study aims to analyze the key factors that influence a player’s rank in PUBG and to build a predictive model based on these factors.
Several elements can impact a player’s rank, including gameplay experience, strategic decision-making, teamwork, and the effective use of weapons and items [6,7]. Additionally, random in-game factors such as the location of safe zones, the frequency and distribution of item spawns, and early engagements with other players play a critical role in determining rank [8,9,10]. This study will explore how these factors interact and contribute to a player’s overall performance in the game.
In particular, this study will utilize data from PUBG to examine the influence of various variables on rank prediction. A range of in-game statistics will be collected and analyzed to identify correlations between these variables and player rankings. Furthermore, machine learning techniques including deep learning will be applied to develop a model capable of accurately predicting a player’s rank based on these factors. In doing so, the study will investigate how individual skill, random game elements, and in-game dynamics are reflected in the prediction model. Therefore, this study seeks to explore the factors that play a significant role in predicting player performance in PUBG and to analyze how these factors affect ranking in a data-driven manner. The results are expected to provide insights into how different in-game elements interact and contribute to player success. Ultimately, the findings of this study may not only improve rank prediction in PUBG, but also reveal general patterns applicable to other similar battle royale games.
The significance of this study can be discussed from two perspectives:
- First, to enhance the accuracy of rank prediction in PUBG by leveraging data analysis and machine learning techniques, thereby identifying generalizable patterns that can be applied to other battle royale games.
- Second, to provide actionable insights for game developers regarding game mechanics, balancing, and design improvements, while simultaneously offering personalized strategic recommendations to players. This dual focus aims to improve player performance and elevate the overall user experience in competitive gaming environments.
2. Study Backgrounds
2.1. Related Works
Many studies on PUBG have been conducted across diverse fields [1,2,3,4,5,6,7,8,9,10]; in particular, undergraduate students have frequently analyzed PUBG as part of their course projects. Consequently, this paper aims to exclude undergraduate reports available online and focus on presenting research works published in SCI-level journals. These studies encompass a wide range of topics within the literature review, e-sports studies, and machine learning domains, as outlined below.
Shin et al. [9] proposed battle sound, a benchmark for sound event detection (SED) in the context of PUBG game sound analysis. The study leverages deep learning methods to detect in-game sound events, such as weapon sounds and voice chat, in real-time. Based on these detections, the system generates haptic feedback for an enhanced player experience. Notably, the model improves real-time detection performance by utilizing annotated data at 0.5 s intervals.
Kim [8] studied game data from Season 13 of League of Legends to predict player churn. The results indicate that factors such as player identity (level, tier), game performance (win rate, tier advancement/demotion), and social play (number of team participations, win rate) significantly influence player churn. These findings provide valuable insights for game developers in formulating strategies to prevent player attrition.
Kang et al. [4] focused on analyzing large-scale game data from PUBG to identify user behavior patterns and develop effective game strategies. By applying data mining techniques, the research aims to detect abnormal activities within the game and use these insights to predict user behavior and optimize game strategies. The analysis contributes to improving the game environment and detecting cheating behaviors.
Gwak et al. [3] analyzed the challenges that PUBG faces in establishing itself as a successful e-sport, and proposed solutions to address these issues. Despite its popularity, PUBG’s e-sports development is hindered by several factors, including difficulties in spectating, the complexity of event preparation, and the growing problem of unauthorized software usage. Their paper suggests strategies such as enhancing fandom engagement and improving match structures to overcome these limitations.
Park et al. [7] developed a battle engagement recommendation algorithm designed for novice players in PUBG. By utilizing artificial neural networks, the system considers factors such as weapon types, armor, distance, and terrain to recommend whether to engage in combat. The algorithm was experimentally validated, demonstrating its effectiveness in improving gameplay for beginners and increasing their win rate.
The analysis of relevant studies revealed that none had predicted player ranks across solo, duo, and squad matches comprehensively. Furthermore, while machine learning techniques were commonly applied for game analysis, deep learning methods were notably absent in these studies.
2.2. Machine Learning Methods
In this paper, study is conducted using four machine learning algorithms. A brief introduction to each algorithm is provided below. Random forest (RF) is an ensemble learning algorithm that aggregates multiple decision trees [11]. Each tree is trained on different data samples and features, and the final prediction is made by combining the results from all trees [12]. It is commonly used for classification and regression tasks, and is highly effective in reducing overfitting while providing robust predictive performance [13,14,15]. Random forest plays a crucial role in identifying and evaluating the importance of various in-game factors that influence player performance and rank. By utilizing multiple decision trees, it effectively handles the complex data generated in PUBG (e.g., kill count, survival time, weapon usage, positioning) and performs predictions by considering the interactions between these factors. Due to its ability to prevent overfitting and provide robust predictions, random forest is well-suited to the dynamic and stochastic nature of battle royale games. This algorithm offers valuable insights into the relative importance of each gameplay factor in determining player rank.
Gradient descent (GD) modeling is an optimization algorithm used to minimize the loss function by iteratively updating the model parameters in the direction that reduces the gradient of the loss function [16,17]. The algorithm adjusts the parameters based on the learning rate to find the optimal values that minimize the loss [16,17,18]. Variants of gradient descent include batch, stochastic, and mini-batch gradient descent [19]. Gradient descent plays a pivotal role in optimizing model parameters by minimizing the loss function. In the context of rank prediction in PUBG, it fine-tunes the parameters of models such as neural networks, enabling effective learning from the data. This algorithm iteratively adjusts the model’s weights and biases, reducing prediction errors to converge towards an optimal solution, thereby enhancing the accuracy of rank predictions.
Feedforward neural network (FNN) is the most basic type of artificial neural network, where information flows in one direction from the input layer, through hidden layers, to the output layer [20]. There are no loops or cycles in this network, and it is widely used for solving classification and regression problems. It is particularly powerful in handling non-linear problems [21]. It contributes to modeling the complex nonlinear relationships between input data (such as player statistics, in-game events, and match conditions) and rank outcomes. FNN is particularly useful in understanding how various gameplay metrics (e.g., damage dealt, items acquired, strategic movement) interact to influence player rank. By utilizing multiple layers and neurons, FNN captures these intricate interactions, enabling more precise and sophisticated rank predictions based on the complex patterns within the data.
Extreme gradient boosting (XGBoost) is an extension of gradient boosting that significantly improves both speed and performance [22]. It builds decision trees sequentially while applying optimization techniques like parallel processing, regularization, and early stopping [23]. It is known for its accuracy and is particularly effective for large-scale datasets, making it a popular choice in machine learning competitions [22,23]. XGBoost plays a critical role in enhancing the performance of rank prediction models. As an advanced extension of gradient boosting, it sequentially trains decision trees, correcting errors from previous iterations. In the context of PUBG rank prediction, it effectively models the sequential and hierarchical nature of gameplay data, capturing how factors such as survival strategy, kill efficiency, and positioning influence rank over time. Additionally, it is well-suited for handling large-scale datasets and excels in managing missing or noisy data, providing more accurate rank predictions.
Each of these four algorithms possesses unique strengths and characteristics, making significant contributions to predicting player ranks in PUBG. Through the application of these algorithms, a deeper understanding can be gained regarding how individual and team behaviors, as well as in-game events, impact player rankings in PUBG. Moreover, these models enhance predictive accuracy, providing valuable insights for game analysis and improving the overall performance of prediction models.
3. Materials and Methods
3.1. Database
Initially, the PUBG training dataset (4,446,966 rows × 29 columns) provided by Kaggle [24] was employed. Subsequently, a preprocessing stage was conducted, which involved handling outliers and missing values through their removal and imputation. Table 1 illustrates the variables present in the PUBG training dataset [4,9].

Table 1.
Variables of PUBG training dataset [4,9].
3.2. PUBG Game Data Preprocessing
The data preprocessing was divided into two parts: the removal of missing values and the removal of outliers. Furthermore, to conduct analysis by match type—solo, duo, and squad—unnecessary columns were eliminated. Initially, missing values in the dependent variable “winPlacePerc” were removed, as they likely corresponded to matches with only a single player. Upon reviewing the distribution plots of various variables, it was found that variables such as “kills”, “longestKill”, “walkDistance”, “rideDistance”, and “swimDistance” exhibited significant distribution imbalances, indicating their potential influence on the target variable. Thus, outlier removal was necessary for these variables. Specifically, for the “totalDistance” variable, any instance where a player recorded at least one kill without any movement during the game was considered an outlier and excluded. Moreover, for the “roadKills” variable, instances where a player recorded more than 10 road kills were deemed outliers and removed. The “longestKill” variable was treated as an outlier when values exceeded 1 km. Lastly, for “walkDistance”, “rideDistance”, and “swimDistance”, values greater than 10 km, 20 km, and 2 km, respectively, were identified as outliers and removed. Additionally, the data were reorganized to facilitate analysis by match types: solo, duo, and squad.
Lastly, variables such as “id”, “groupId”, and “matchId”, which do not affect the dependent variable, were excluded as they serve only as identifiers. In solo matches, the variables “DBNOs”, “revives”, and “teamKills”, which do not occur, were excluded. Moreover, since “killPoints”, “rankPoints”, and “winPoints” represent past rankings and do not influence the determination of rank in each game, they were removed. “matchDuration” was excluded as it holds the same value for each match and thus does not affect rankings. The “numGroups” variable was also removed due to its similarity in meaning to “maxPlace”, and “matchType” was excluded as well.
3.3. Variables Selection Method
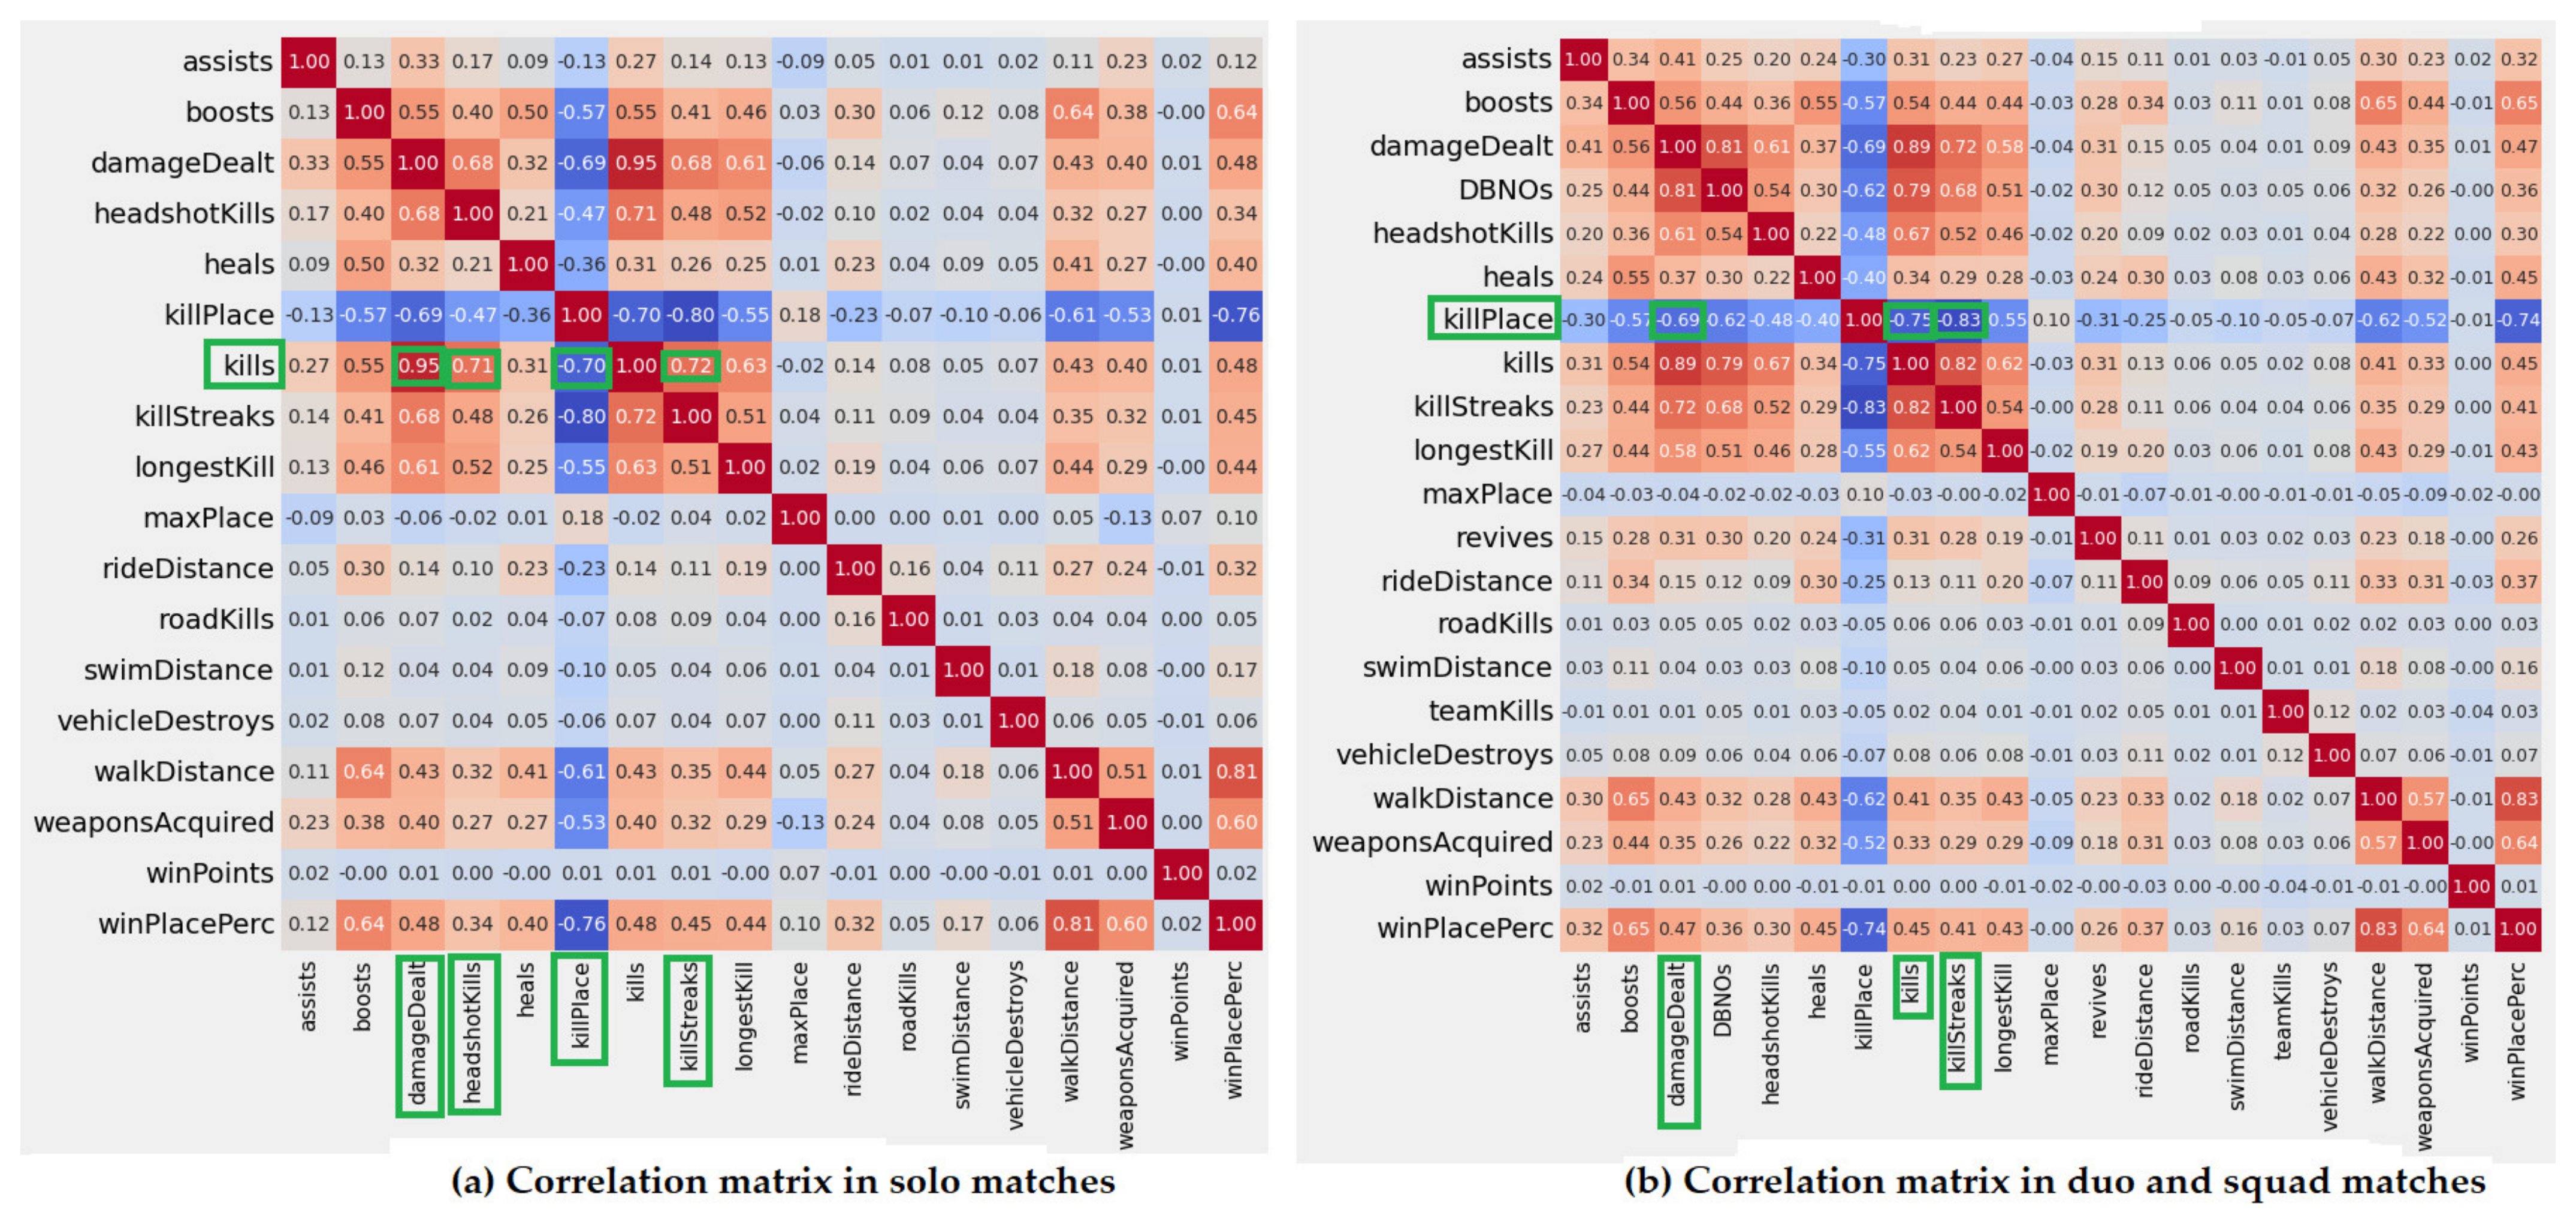
After data preprocessing, the variance inflation factor (VIF) [25] was calculated for all variables in solo, duo, and squad matches. Table 2 presents the results of this analysis. In solo matches, the “kills” variable exhibited the highest VIF value at 12.549613. However, considering that “kills” is a crucial factor in predicting the win rate in survival games, it was deemed inappropriate to remove it. Therefore, to better understand the relationships between “kills” and other variables, a correlation analysis was conducted, as illustrated in Figure 1a. Based on the results of the correlation analysis, variables with high VIF, such as “damageDealt” and “killPlace”, which showed strong relationships with the “kills” variable, were removed to address multicollinearity. In the case of duo and squad matches, the variable “killPlace” exhibited the highest VIF value of 10.331870. Following the same approach used in the correlation analysis for solo matches, both “damageDealt” and “killStreaks” variables were removed, excluding the key variable “kills”. This can be observed in the correlation matrix shown in Figure 1b.
Table 2.
VIF values in solo, duo, and squad matches.
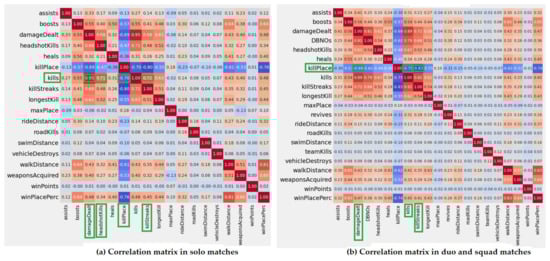
Figure 1.
Correlation matrixes in solo, duo, and squad matches.
4. Results
4.1. Exporatory Data Analysis (EDA)
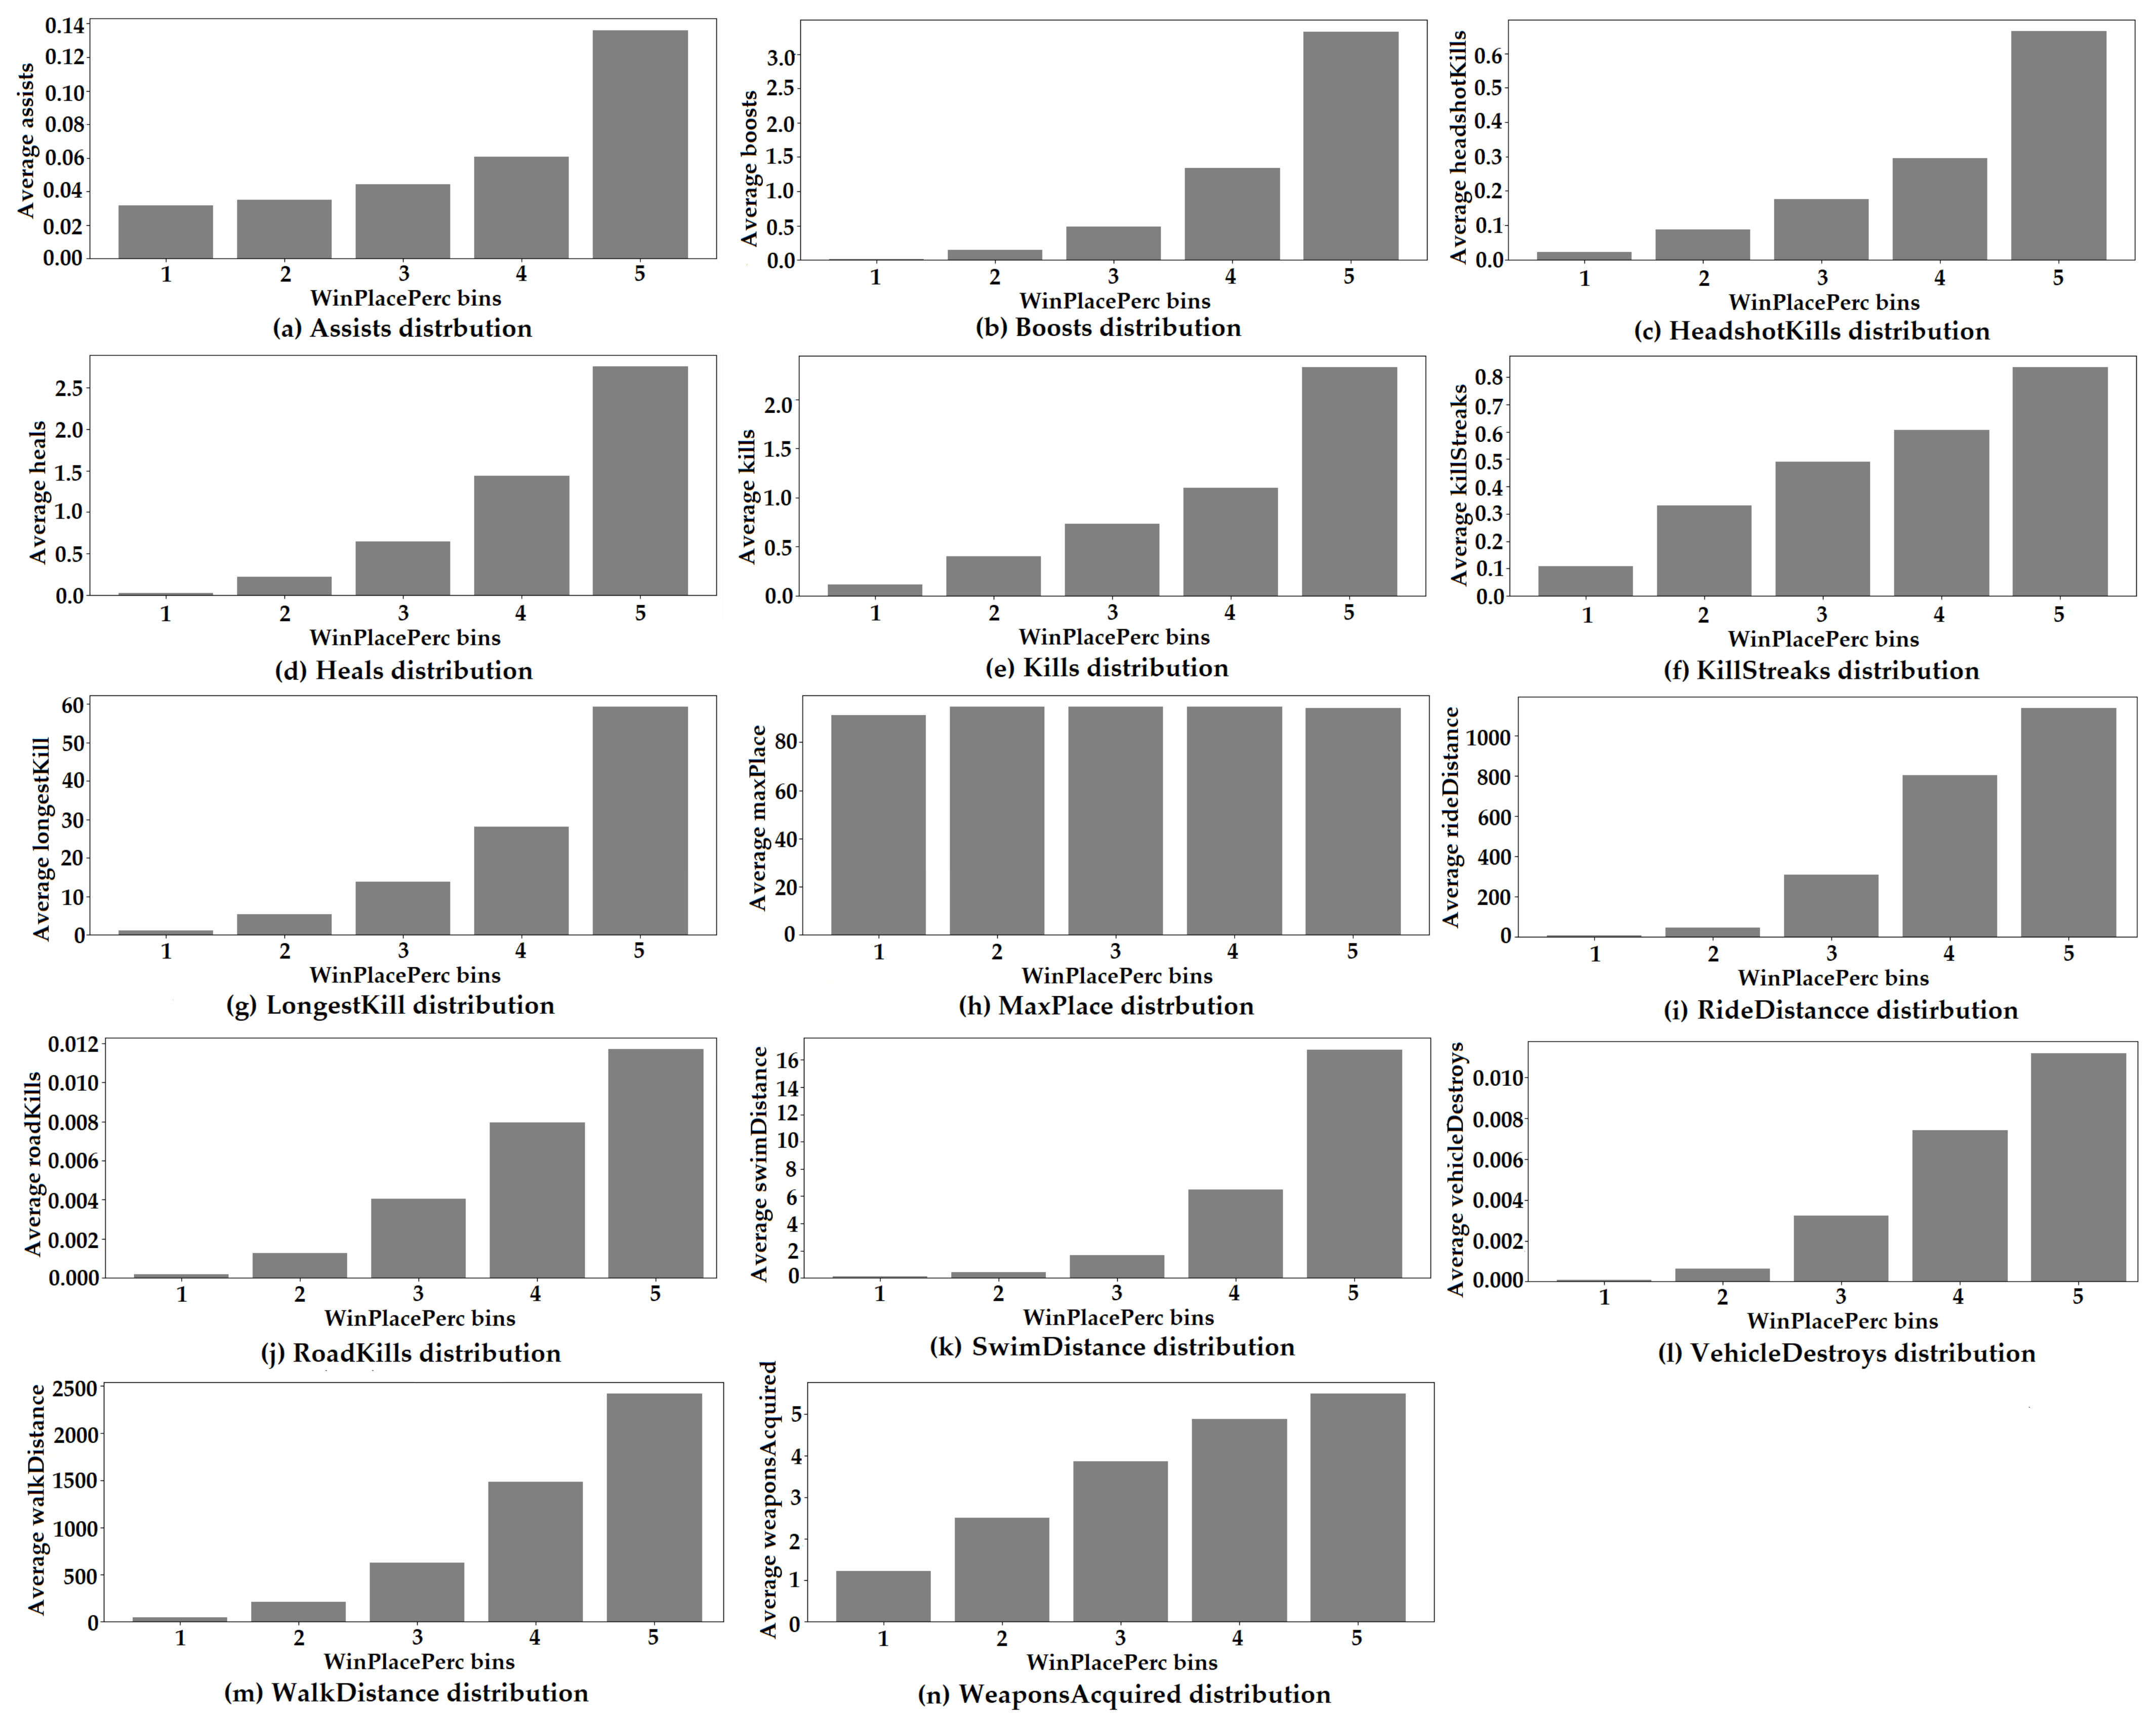
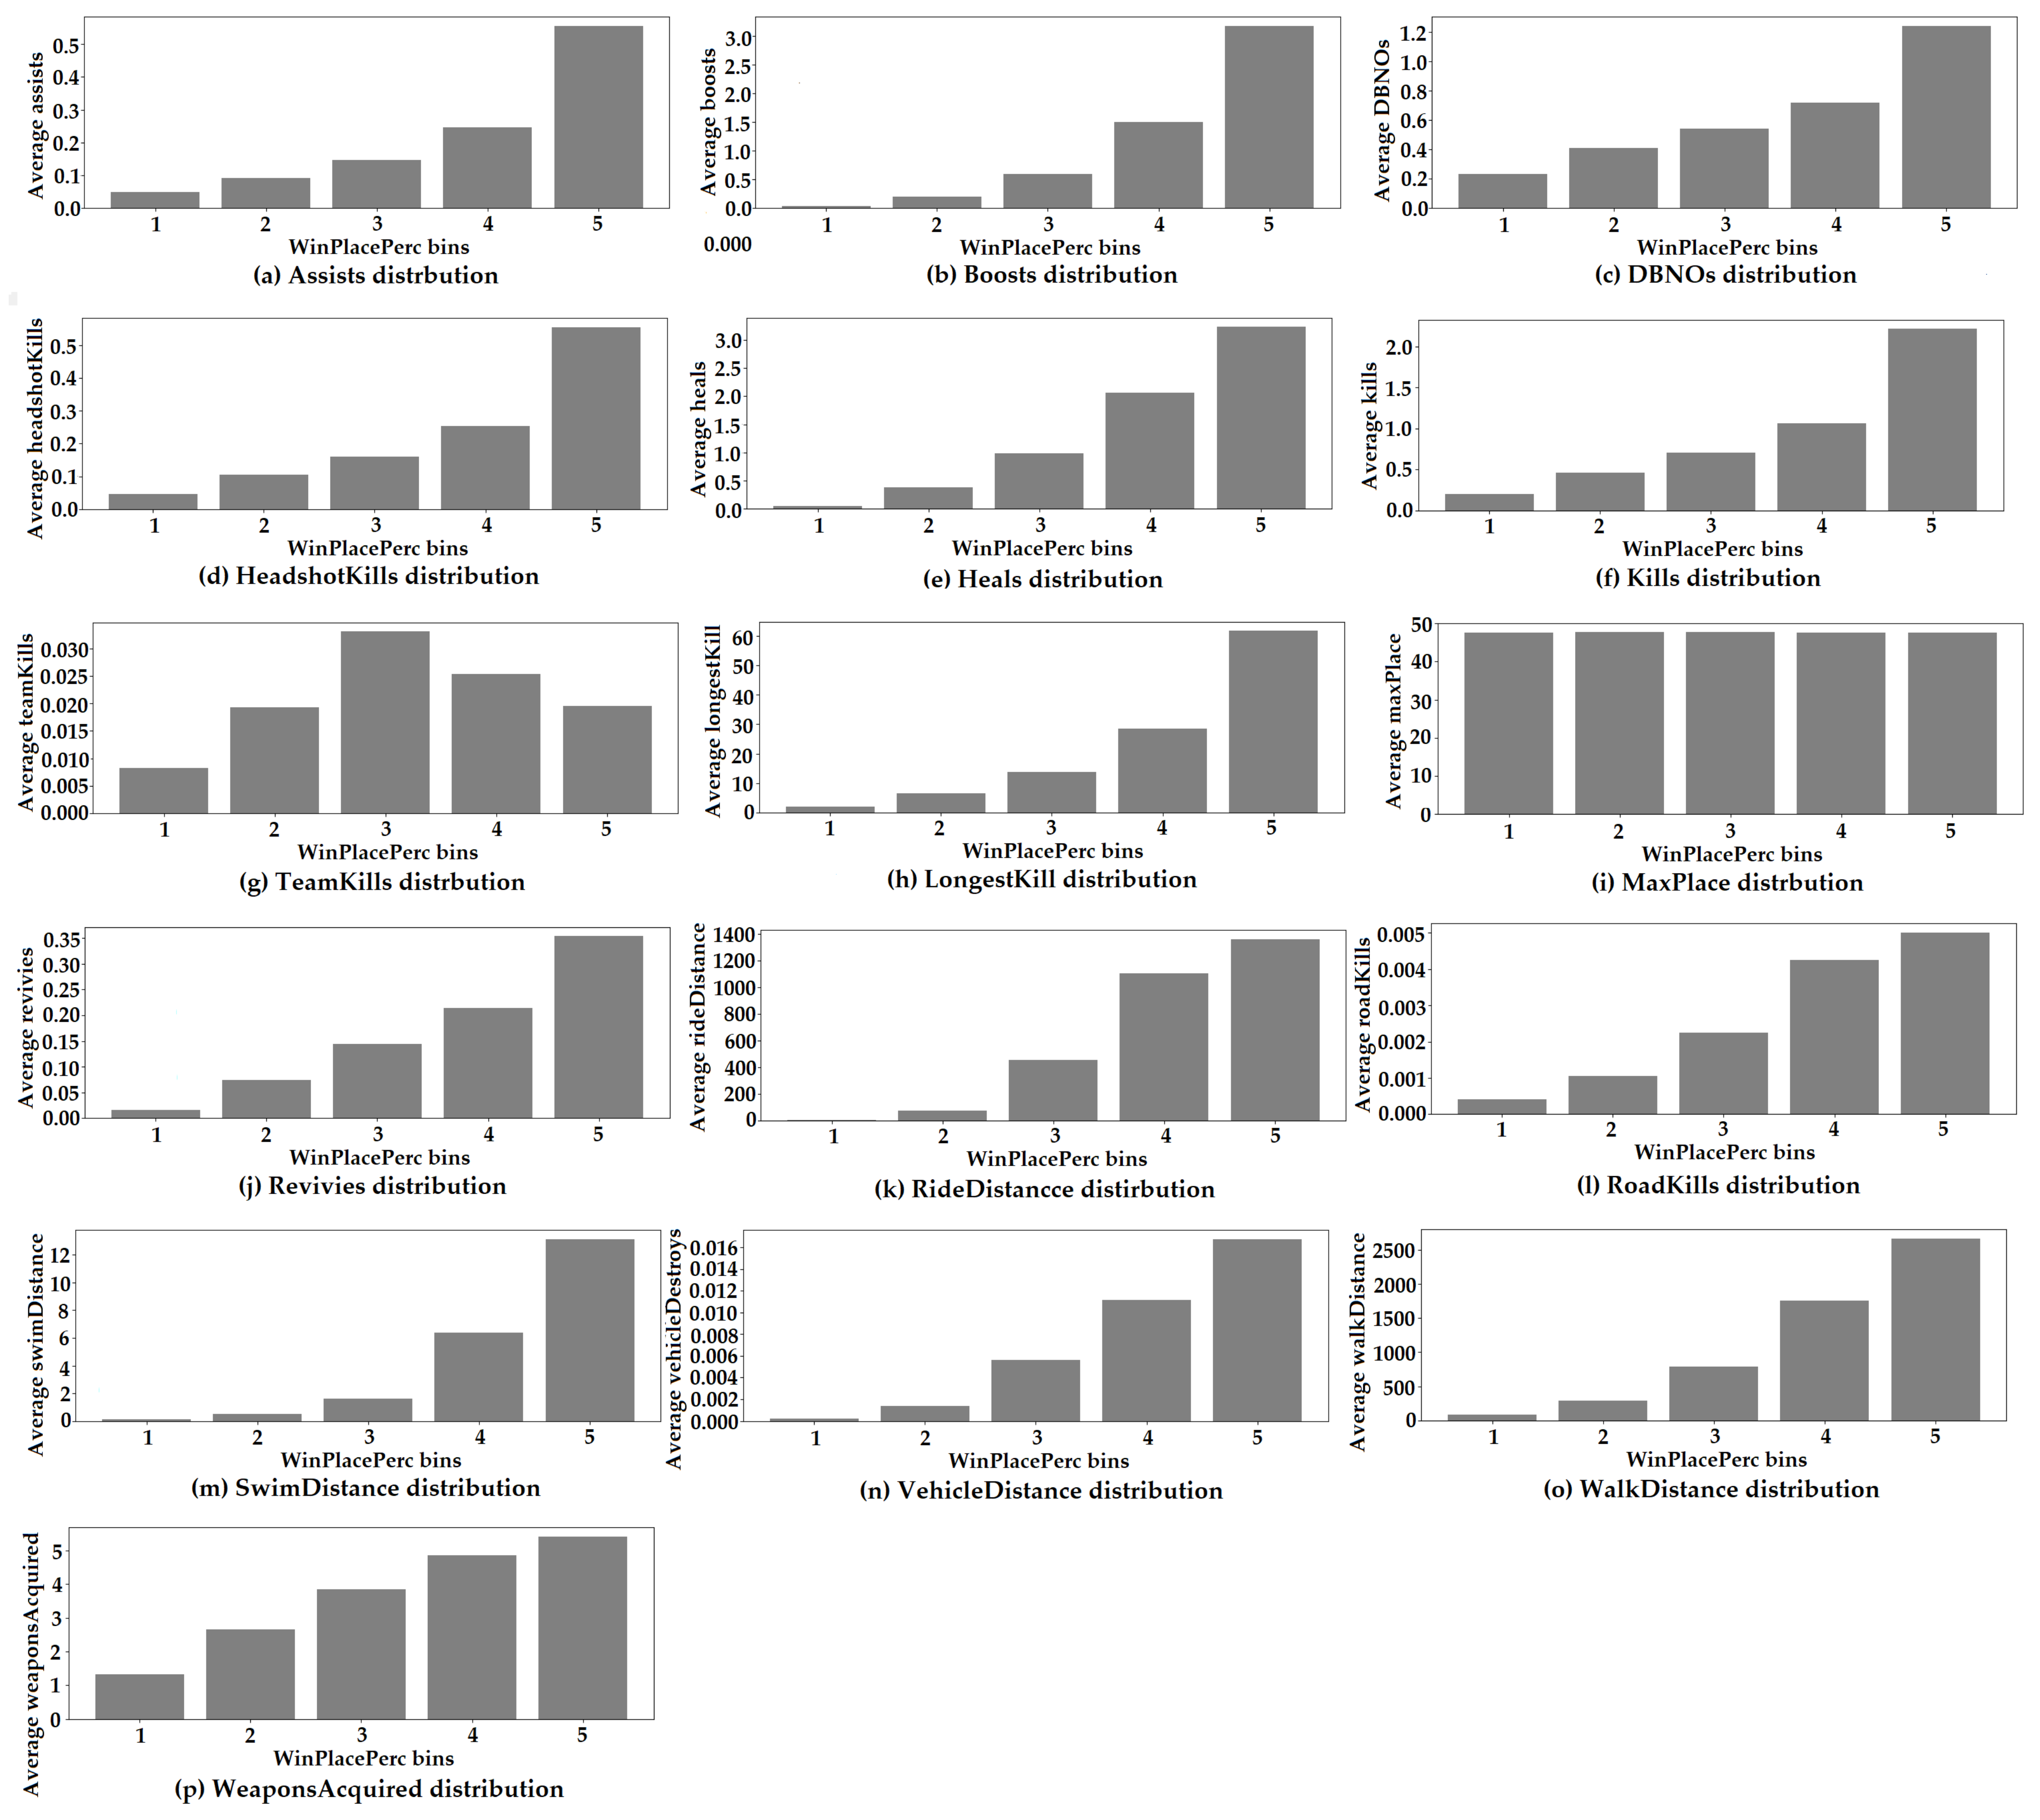
In Figure 2, “winPlacePerc” was divided into five percentile-based intervals to represent rank percentiles, and a comprehensive analysis was conducted to visualize the distribution of various game performance metrics across these intervals. It shows the distributions of various variables utilized in solo matches. Combat and survival activities, such as “assists”, “boosts”, “heals”, “kills”, and “headshotKills”, showed a significant increase in the upper percentile range (winPlacePerc = 5). Notably, in solo mode, where players cannot rely on support from teammates, the positive correlation between “assists” and high rankings was particularly intriguing. Additionally, the use of “boosts” and “heals” was found to be essential for achieving top placements, while “kills” and “headshotKills” highlighted the direct relationship between individual combat proficiency and higher ranks. Distance-related variables, including “longestKill”, “rideDistance”, and “walkDistance”, also demonstrated notable increases in the upper ranking percentiles. “longestKill”, in particular, increased substantially in the highest “winPlacePerc” bins, indicating that accurate long-distance engagements have a significant impact on securing victories. “rideDistance” showed higher averages in the mid to upper percentiles, suggesting that the strategic use of vehicles for positioning or evasion is a characteristic of top-ranked players.

Figure 2.
Distributions of various variables utilized in solo matches.
“walkDistance” increased progressively in higher percentiles, indicating that substantial movement is critical for survival in solo mode. Variables such as “roadKills” and “swimDistance” exhibited relatively minor variations, indicating a limited correlation with higher rankings. This suggests that actions like running over opponents or swimming do not play a significant role in survival in solo mode. “vehicleDestroys” showed a slight increase in the upper percentiles, but the difference was not substantial enough to be considered a major determinant of game performance. Finally, “weaponsAcquired” showed an increasing trend in higher percentiles, suggesting that obtaining and utilizing a diverse array of weapons contributes positively to achieving higher ranks. In conclusion, the key variables for securing high ranks in solo mode are combat proficiency (kills, headshotKills), survival activities (heals, boosts), and mobility (walkDistance, rideDistance). Notably, “longestKill” emphasizes the importance of precise long-range engagements for top-tier players. In contrast, “roadKills” and “swimDistance” were found to be less impactful, while the acquisition of various weapons was identified as a common characteristic of high-ranking players.
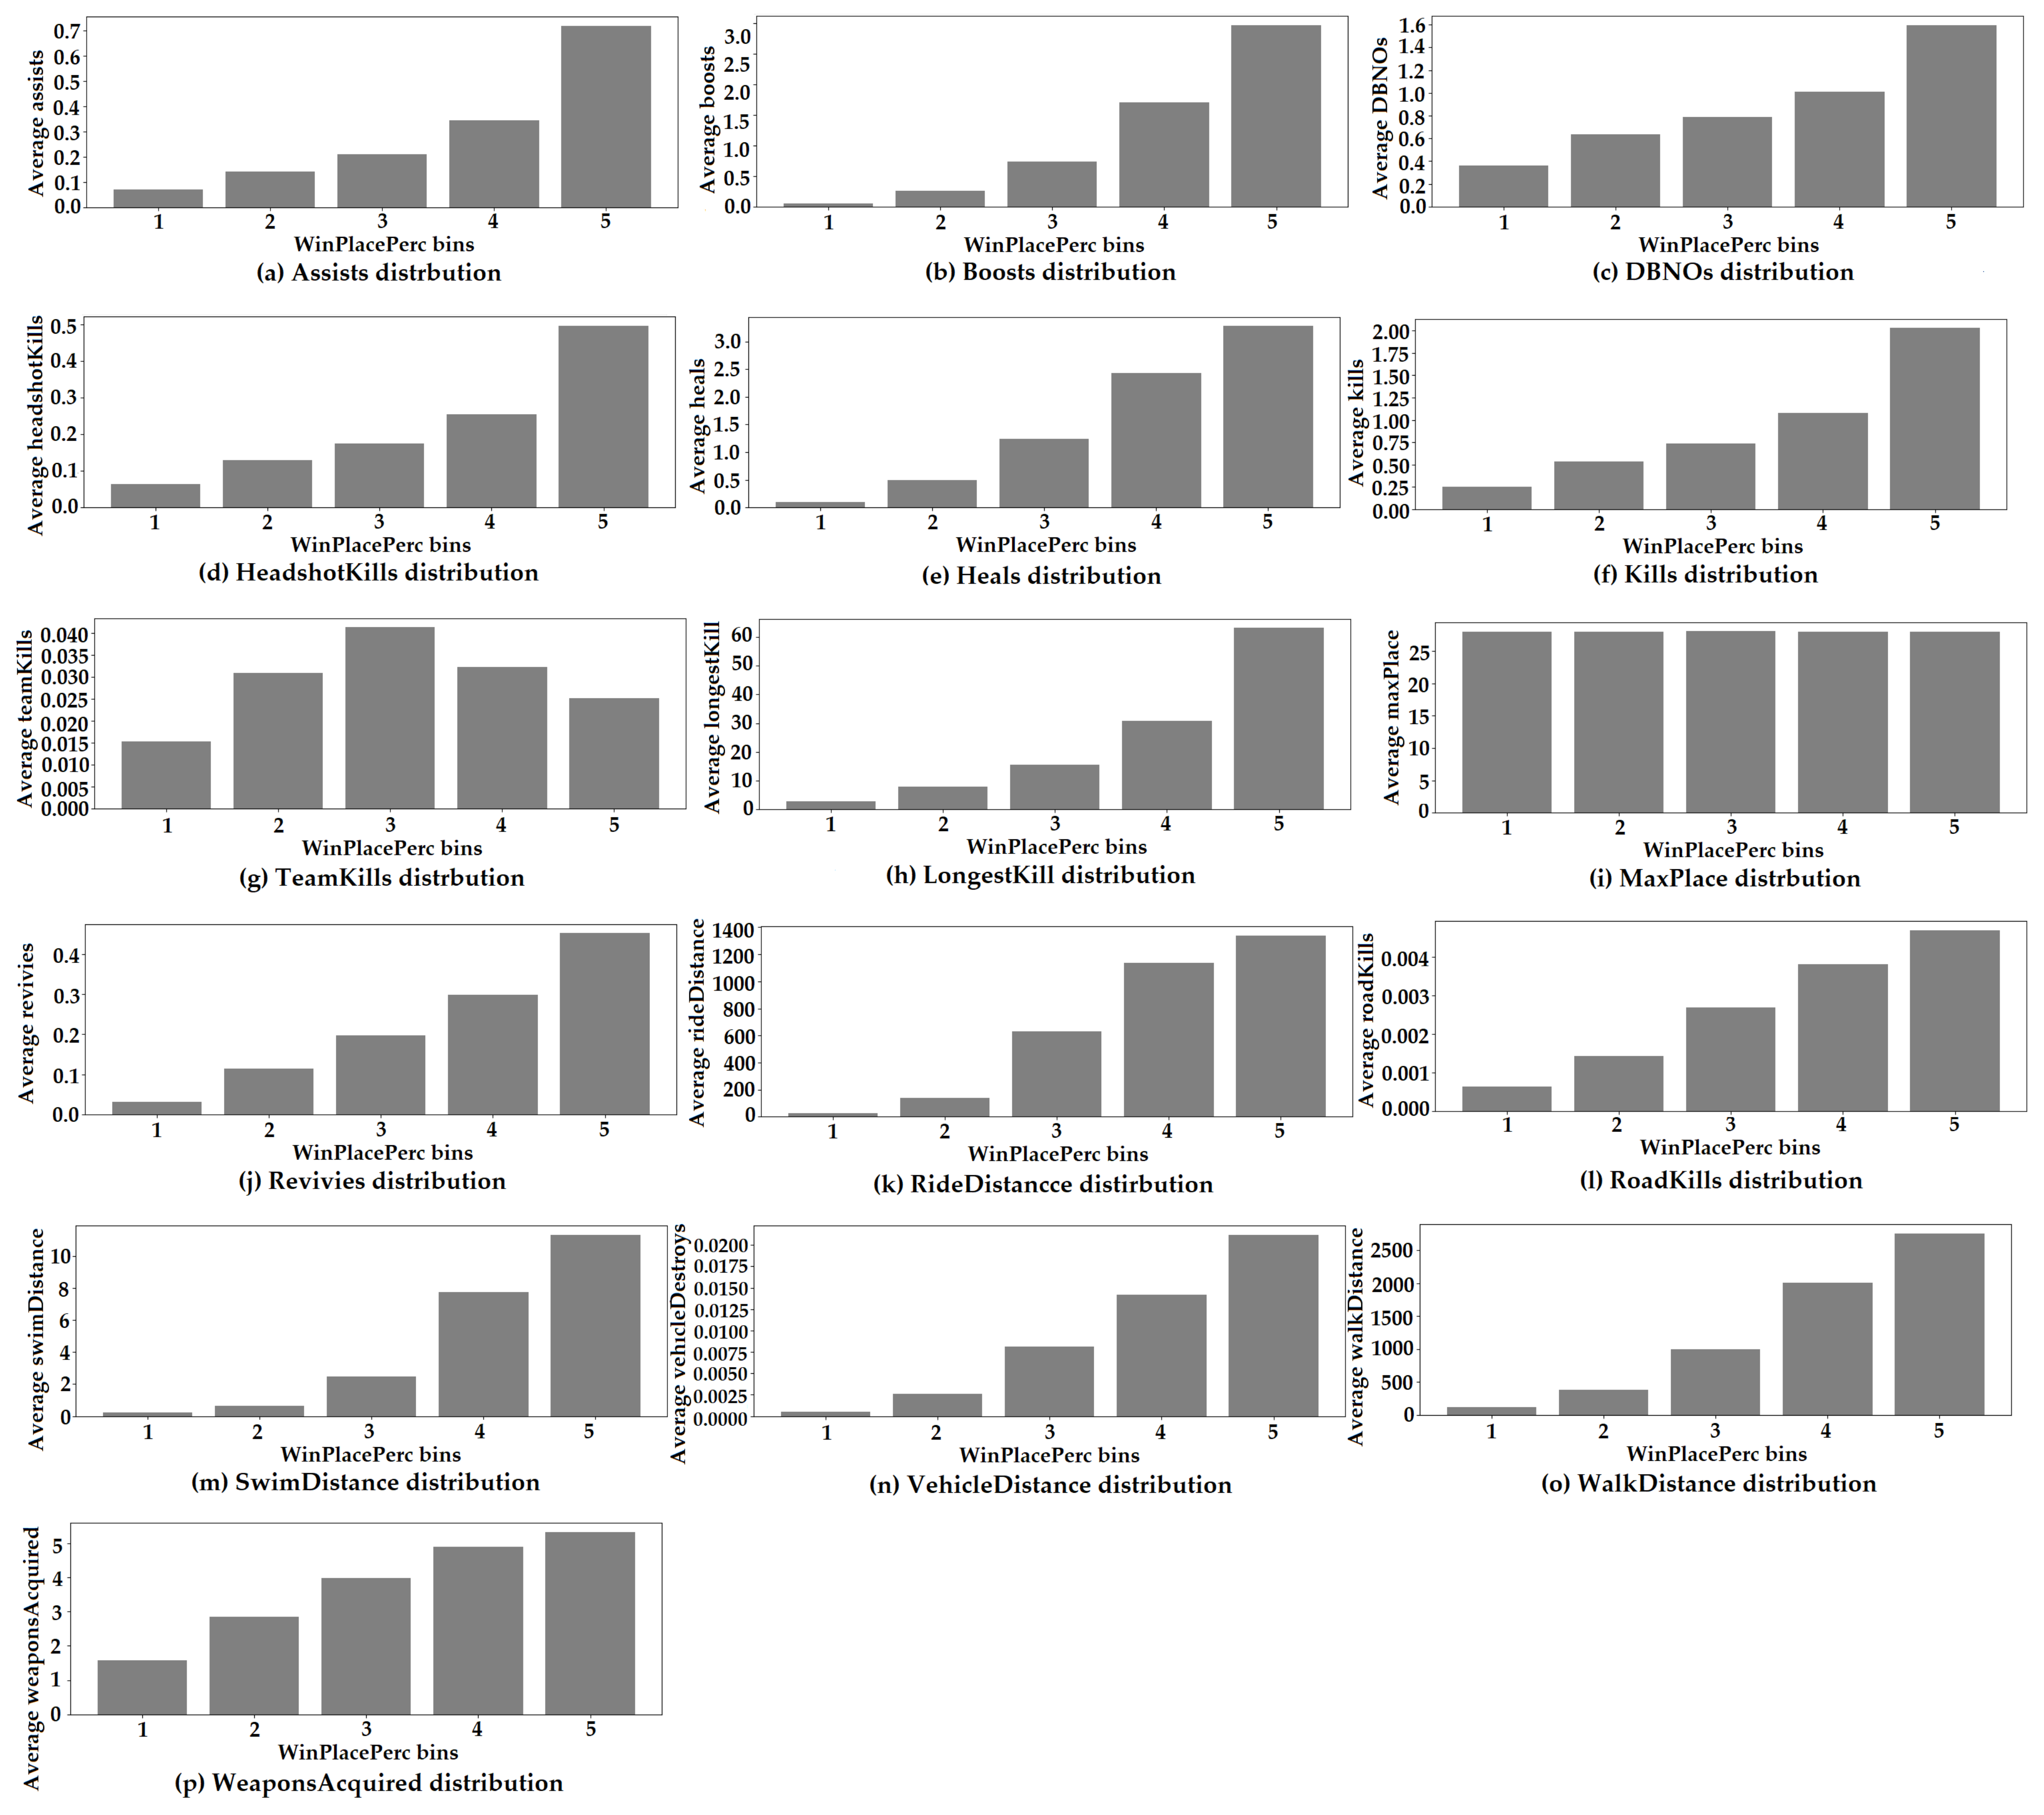
Figure 3 visualizes various game performance metrics across different “winPlacePerc” bins for duo games. In terms of combat and survival activities, “assists” showed the highest values in the upper percentile (winPlacePerc = 5) and exhibited a steady increase in the mid-percentile ranges. This suggests that cooperative play and supportive actions contribute significantly to achieving high ranks in duo mode. The usage of “boosts” and “heals” also increased as ranks improved, indicating that the use of healing items is essential for reaching higher placements. “kills” and “headshotKills” showed an upward trend with higher ranks, emphasizing that combat proficiency is a critical factor for success in duo mode. Among team-related variables, “DBNOs” (knockdowns) increased in the higher percentiles, indicating that the ability to incapacitate opponents is crucial for success in duo mode. On the other hand, “teamKills” showed some variability in the mid-percentile ranges but did not exhibit high average values in the top percentiles. This underscores the importance of teamwork and suggests that unintended team kills may hinder achieving higher placements. “revives” demonstrated a consistent increase in higher percentiles, highlighting the importance of reviving teammates for survival and rank progression. For distance-related variables, “longestKill” increased in higher percentiles, showing that precise long-distance shooting contributes significantly to winning in duo mode. “rideDistance” showed growth in the mid to upper percentiles, suggesting that the strategic use of vehicles for positioning and evasion is a characteristic of top-ranked players. “walkDistance” also increased in the higher percentiles, indicating that substantial movement is necessary for survival. Other variables, such as “roadKills”, showed a slight increase in higher percentiles but were not major influencers of performance. “swimDistance” remained relatively constant across percentiles, indicating that swimming does not play a significant role in achieving high ranks in duo mode. “vehicleDestroys” showed a slight increase in higher percentiles but did not have a substantial impact on game performance. “weaponsAcquired” showed a consistent increase in higher percentiles, suggesting that acquiring a variety of weapons is associated with better performance and higher ranks in duo mode. In conclusion, the key factors for achieving high ranks in duo mode include cooperative activities (assists, revives), combat skills (kills, headshotKills), survival strategies (heals, boosts), and mobility (walkDistance, rideDistance). Notably, “DBNOs” emphasize the importance of incapacitating opponents for rank improvement. In contrast, “roadKills” and “swimDistance” were identified as relatively less important variables, while acquiring a diverse set of weapons was associated with higher performance and success.

Figure 3.
Distributions of various variables utilized in duo matches.
Figure 4 visualizes various game performance metrics across different “winPlacePerc” bins for squad matches. In terms of combat and survival activities, Assists showed a significant increase in the upper percentile, indicating that teamwork and support play a crucial role in achieving high ranks. The usage of “boosts” and “heals” also increased with higher ranks, suggesting that the use of survival items is essential for securing top placements. “kills” and “headshotKills” demonstrated an upward trend as ranks improved, emphasizing that not only individual combat skills but also the overall combat effectiveness of the team are strongly linked to higher performance. Among team-related variables, “DBNOs” increased with higher ranks, highlighting that the ability to incapacitate opponents is a critical factor for success in squad mode. “TeamKills” exhibited variability in the mid-percentile range, but did not significantly increase in the upper percentiles, underscoring the importance of teamwork and indicating that unintended team kills can negatively impact performance. “revives” increased on average in higher percentiles, showing that reviving teammates is a vital activity for survival and achieving high ranks. For distance-related variables, “longestKill” increased in higher percentiles, demonstrating that precise long-range shooting is impactful for success even in squad mode. “rideDistance” showed higher values in the mid to upper percentiles, suggesting that strategic vehicle use for positioning plays an important role in team survival and success. “walkDistance” also increased in the upper percentiles, indicating that extensive movement is necessary for survival and achieving high ranks in squad mode. Other variables, such as “roadKills”, showed a slight increase in the upper percentiles but were not major influencers of overall performance. “swimDistance” remained relatively constant across different rank bins, suggesting that swimming does not significantly affect performance in squad mode. “vehicleDestroys” showed a slight increase in higher percentiles but had a limited impact on game outcomes. “weaponsAcquired” exhibited a consistent increase in higher percentiles, indicating that acquiring a diverse array of weapons is associated with better performance and higher ranks. In conclusion, the key factors for achieving high ranks in squad mode include cooperative activities (assists, revives), combat skills (kills, headshotKills), survival strategies (heals, boosts), and mobility (walkDistance, rideDistance). “DBNOs” emphasize the importance of incapacitating opponents as a critical component of team success, whereas ”roadKills” and “swimDistance” were found to be less significant. Acquiring weapons was also identified as a major factor associated with strong performance and higher rankings.

Figure 4.
Distributions of various variables utilized in squad matches.
4.2. Performances of Machine Learning Methods
Table 3 compares the hyperparameter configurations of machine learning models applied to different types of PUBG matches: solo, duo, and squad. Each match type has distinct variable counts and model components tailored to its specific characteristics. Solo matches use 14 input variables, while duo and squad matches incorporate 17 variables to account for collaborative gameplay elements. In the case of the RF model, solo matches utilize 300 estimators to effectively leverage a larger number of trees, allowing for diverse variable coverage. Conversely, duo and squad matches use 80 estimators, enabling faster training with fewer trees. For all match types, the parameters “min_samples_leaf” and “max_features” are set to 3 and “sqrt”, respectively, to balance model complexity and prevent overfitting. The GD model employs a consistent configuration across all match types, with 300 estimators, a learning rate of 0.1, and a maximum depth of 6. This setup aims to maintain stable performance across different match types without specific tuning. For the XGBoost model, slightly different learning rates and estimator counts are assigned according to the match type. Solo matches are configured with a learning rate of 0.001 and 50,000 estimators, aiming for slower but more stable training. Duo matches utilize a learning rate of 0.01 and 9000 estimators, providing a moderate training speed and complexity. Squad matches are set with a learning rate of 0.1 and 1000 estimators to achieve faster training. XGBoost, therefore, adjusts its training speed and model performance based on the unique characteristics of each match type. The FNN model uses varying hidden layer counts, activation functions, optimization methods, and learning rates for each match type. Solo matches employ two hidden layers with the Adam optimizer and a learning rate of 0.001 over 10,000 epochs for stable training. Duo matches, also with two hidden layers, use SGD optimization with a batch size of 500 and a learning rate of 0.01, allowing faster training. Squad matches include five hidden layers with Adam optimization and a learning rate of 0.001 for more in-depth training. In summary, each model is optimized according to the unique characteristics of PUBG match types, with hyperparameters adjusted to maximize training efficiency and predictive accuracy across solo, duo, and squad matches.
Table 3.
Parameter setting information in machine learning models.
Table 4 presents the accuracy achieved by each machine learning model across PUBG match types (solo, duo, and squad). An in-depth analysis of model performance across these match types reveals the following insights. In solo matches, XGBoost achieved the highest accuracy at 88.07%, closely followed by gradient descent at 88.05%. FNN recorded an accuracy of 87.96%, while RF achieved 87.67%. All models demonstrated high accuracy within the 87–88% range, with XGBoost showing a slight advantage. This result suggests that the relatively simpler variable set in solo matches enables models to perform at a high level of accuracy. In duo matches, gradient descent reached the highest accuracy at 84.75%, with XGBoost closely following at 84.73%. FNN and RF exhibited similar performance, with accuracies of 84.55% and 84.24%, respectively. Duo matches, which involve additional variables related to team collaboration, yielded slightly lower accuracy compared to solo matches. GD and XGBoost displayed comparable performances, indicating their robustness even with the added complexity of duo match variables. For squad matches, RF achieved the highest accuracy at 78.21%, while GD, XGBoost, and FNN each recorded similar accuracies within the 77% range. Squad matches, due to their team-based nature, incorporate a higher degree of variable complexity, resulting in reduced accuracy across all models compared to solo and duo matches. This performance drop likely reflects the impact of collaborative and team-oriented variables on model prediction. Overall, XGBoost demonstrated the best performance for solo matches, while GD outperformed other models in duo matches. For squad matches, although all models exhibited relatively lower accuracy, RF showed a slight edge. These findings highlight that model performance varies with match type due to differences in variable characteristics and complexity.
Table 4.
Performances of machine learning models.
Figure 5 illustrates the feature importance [26] assigned by the top-performing models (XGBoost, GD, and RF) for each match type (solo, duo, and squad) in PUBG. This visualization highlights the variables that play a critical role in predictive accuracy for each match type. In solo matches, XGBoost indicates that “walkDistance” is the most significant variable, with an importance score exceeding 0.6, which is markedly higher than other variables. Following this, “boosts” and “weaponsAcquired” show moderate importance scores of approximately 0.2 and 0.1, respectively. Other variables, such as “longestKill”, “heals”, “kills”, and “swimDistance”, exhibit relatively low importance. For duo matches, GD reveals that “walkDistance remains the most influential variable, with an importance score close to 1, similar to its role in solo matches. “Boosts” and “weaponsAcquired” follow, with lower importance scores, while “maxPlace”, “heals”, “longestKill”, and “rideDistance” have minimal impacts. In squad matches, RF also ranks “walkDistance” as the most important feature, though its importance is slightly reduced, around 0.4, compared to solo and duo matches. “Boosts” retains substantial importance with a score above 0.3, and “weaponsAcquired” is also considered significant. Variables such as “heals”, “rideDistance”, “longestKill”, and “kills” exhibit moderate levels of importance. Overall, “walkDistance” emerges as the most critical feature across all match types, indicating that player movement distance has a significant impact on match outcomes. Additionally, “boosts” and “weaponsAcquired” are consistently important across all match types, suggesting that resource utilization and weapon acquisition play crucial roles in player performance.
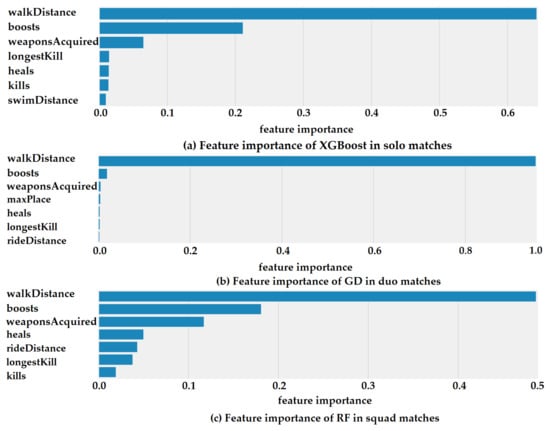
Figure 5.
Feature importance in each match.
5. Discussion
This study provides valuable insights into the factors influencing player rank prediction in PUBG [27,28] by analyzing various gameplay elements and evaluating the performance of different machine learning models [11,17,21,22] across solo, duo, and squad match types. Through this analysis, the interactions between player actions and in-game variables and their impact on rank were understood, highlighting the potential use of data-driven approaches in battle royale game analytics. First, this study reveals that “walkDistance” consistently emerged as the most influential variable across all match types, underscoring the importance of player movement in achieving higher ranks. The high importance of “walkDistance” indicates that strategic movement is critical for survival in survival-based games, where players must secure safe zones and avoid enemy attacks. This finding suggests that a player’s movement strategy significantly contributes to performance, enhancing their chances of survival and ultimately impacting their rank. Such results not only apply to PUBG, but may also extend to other battle royale games, offering valuable insights for game developers and analysts.
The variables “boosts” and “weaponsAcquired” also demonstrated high importance across all match types, indicating that resource management and weapon acquisition play essential roles in player performance. The use of “boost” items, which allows players to recover health and enhance mobility, was found to positively affect rank. Additionally, the importance of “weaponsAcquired” highlights the critical role of weapon diversity in battle royale games. Players who effectively acquire and utilize a variety of weapons are more likely to eliminate opponents and, consequently, achieve higher ranks. This insight reflects the significance of combat preparedness and adaptability, reinforcing the impact of resource acquisition on performance in competitive gaming environments.
In terms of model performance, different machine learning models [12,19,20,23] were found to perform best in each match type. XGBoost achieved the highest accuracy in solo matches, likely due to its ability to capture complex interactions between individual player skills and variables. In duo matches, GD performed best, suggesting that this model may be more effective in capturing the complexity of team collaboration and cooperative gameplay that characterizes duo mode. In squad matches, RF showed a slight advantage, indicating that its ensemble approach, which combines multiple decision trees, may better handle the diverse interactions and team dynamics present in squad gameplay. These findings highlight that model performance varies by match type, emphasizing the need for match-type-specific optimization.
This study also examined the relationships between various gameplay variables and identified the critical factors influencing rank prediction, while removing less impactful variables to enhance model efficiency. For example, while variables such as “kills”, “longestKill”, and “rideDistance” were found to significantly impact rank, “roadKills” and “swimDistance” showed relatively low importance. This distinction between relevant and less relevant variables demonstrates that certain actions may have limited influence on rank, allowing for the optimization of prediction models by excluding non-essential factors.
This study distinguishes itself by conducting a VIF analysis to eliminate variables across all match types—solo, duo, and squad—and performing extensive exploratory data analysis. By examining the importance of variables within each match type, the study demonstrates how specific actions impact a player’s rank. Furthermore, as the first study to utilize an FNN in this context, it provides a performance analysis showing that FNN performs well in solo and duo matches, but tends to lag slightly in squad matches. These findings underscore the need for optimization according to match type, suggesting that FNN is well suited to individual and small-team interactions, such as those in solo and duo matches, but requires additional tuning in more complex team-based environments.
The findings of this study offer practical implications for game developers and data analysts. Game developers can leverage these insights to adjust game balance or enhance strategic elements that contribute to player success. For instance, by emphasizing key elements such as movement, resource management, and weapon acquisition, developers could create in-game tutorials or feedback systems that assist players in improving their performance. Additionally, providing players with information about factors positively associated with higher ranks may enable them to design personalized strategies and achieve better outcomes. Furthermore, this study underscores the potential use of data analytics and machine learning in predicting outcomes in battle royale games. Future research could explore additional variables and alternative models to further enhance predictive accuracy, as well as extending these analyses to other battle royale games. By refining the accuracy of game data analysis and deepening our understanding of the complex interactions within battle royale games, this study contributes to the broader field of game analytics and player performance prediction.
6. Conclusions
This study analyzed the factors influencing player rank prediction in PUBG and evaluated the predictive performance of several machine learning models. The analysis revealed that “walkDistance” is a critical predictor across solo, duo, and squad match types, indicating that a player’s movement strategy significantly impacts rank. Additionally, “boosts” and “weaponsAcquired” were found to play essential roles in determining player performance across all match types. In terms of model performance, XGBoost achieved the highest accuracy in solo matches, at 88.07%, while GD performed best in duo matches, with an accuracy of 84.75%. For squad matches, RF recorded the highest accuracy at 78.21%.
These findings provide valuable insights for game developers seeking to improve game balance and design enhancements, as well as for players who could benefit from personalized strategic guidance to improve their performance. Future studies could further enhance predictive accuracy for battle royale games such as PUBG by incorporating additional variables and exploring a wider range of models.
Author Contributions
Data collection and analysis, J.-N.L.; conceptualization, J.-N.L.; methodology, J.-Y.L.; software, J.-Y.L.; validation, J.-Y.L.; original draft preparation, J.-N.L. and J.-Y.L.; writing—review and editing, J.-Y.L.; visualization, J.-N.L. All authors have read and agreed to the published version of the manuscript.
Funding
This research received no external funding.
Institutional Review Board Statement
Ethical review and approval were waived for this study due to the usage of an open public dataset.
Data Availability Statement
The original data presented in the study are openly available in kaggle at https://www.kaggle.com/datasets/razamh/pubg-dataset (accessed on 24 January 2025).
Conflicts of Interest
The authors declare no conflicts of interest.
References
- Kim, J.; Lee, T. How to Activate eSports Using Mobile App Review Analysis: Focusing on Mobile Battlegrounds. Korea Sport Soc. 2023, 21, 27–42. [Google Scholar] [CrossRef]
- Xu, Z.; Xiang, M.; Pang, L. Study on the influence factors of college students’ loyalty in PUBG game. IOP Conf. Ser. Mater. Sci. Eng. 2018, 439, 032059. [Google Scholar] [CrossRef]
- Gwak, Y.H.; Kim, H.N. A Study on e-Sports of BattleGround Game. In Proceedings of the Korean Society of Computer Information Conference, Incheon, Republic of Korea, 4 June 2018; Volume 26, pp. 104–105. [Google Scholar]
- Kang, H.N.; Kang, H.R.; Hwang, H.S. An Analysis of Game Strategy and User Behavior Pattern Using Big Data: Focused on Battlegrounds Game. J. Korea Game Soc. 2019, 19, 27–35. [Google Scholar] [CrossRef]
- Park, C.I. A Study on Immersion Degree of Players Depending on Figurative Characteristics of Game Characters. Soc. Digit. Policy Manag. 2020, 18, 271–276. [Google Scholar]
- Song, D.H. Analysis of User Transfer of Successful Battle Royale Games—From Player Unknown’s Battleground to Fortnite. J. Korea Inst. Inf. Commun. Eng. 2020, 24, 71–76. [Google Scholar]
- Park, H.M.; Byun, H.W. Battle Recommendation Algorithm for Player unknown’s Battleground Game. J. Digit. Contents Soc. 2018, 19, 2067–2076. [Google Scholar] [CrossRef]
- Kim, J.H. Study on Predictive Factors for League of Legends Game Churn Using Match Record Data. J. Korea Game Soc. 2023, 23, 67–79. [Google Scholar] [CrossRef]
- Shin, S.; Lee, S.; Jun, C.; Lee, K. BattleSound: A Game Sound Benchmark for the Sound-Specific Feedback Generation in a Battle Game. Sensors 2023, 23, 770. [Google Scholar] [CrossRef]
- Chung, S.; Kim, J.S.; Song, D.H. A Comparative Analysis of First Person Shooter Games on Battle Style and Equipment/Skill Patterns—Overwatch vs A.V.A. Online vs Battleground. In Proceedings of the 2017 Autumn Conference of the Korean Institute of Information and Communication Sciences, Jeju, Republic of Korea, 4–7 July 2017; Volume 10, pp. 443–446. [Google Scholar]
- Gilles, L. Understanding Random Forests: From Theory to Practice. arXiv 2014, arXiv:1407.7502. [Google Scholar]
- Breiman, L. Random Forests. Mach. Learn. 2001, 45, 5–32. [Google Scholar] [CrossRef]
- Zhigang, S.; Guotao, W.; Pengfei, L.; Hui, W.; Min, Z.; Xiaowen, L. An improved random forest based on the classification accuracy and correlation measurement of decision trees. Expert Syst. Appl. 2024, 237, 121549. [Google Scholar]
- Iskandaryan, D.; Ramos, F.; Palinggi, D.A.; Trilles, S. The Effect of Weather in Soccer Results: An Approach Using Machine Learning Techniques. Appl. Sci. 2020, 10, 6750. [Google Scholar] [CrossRef]
- Breiman, L. Bagging predictors. Mach. Learn. 1996, 24, 123–140. [Google Scholar] [CrossRef]
- Keskar, N.S.; Socher, R. Improving Generalization Performance by Switching from Adam to SGD. arXiv 2017, arXiv:1712.07628. [Google Scholar]
- Bottou, L. Stochastic gradient descent tricks. In Neural Networks: Tricks of the Trade; Springer: Berlin/Heidelberg, Germany, 2012; pp. 421–436. [Google Scholar]
- Ndou, N.; Nontongana, N. Performance Evaluation of Gradient Descent Optimizers in Estuarine Turbidity Estimation with Multilayer Perceptron and Sentinel-2 Imagery. Hydrology 2024, 11, 164. [Google Scholar] [CrossRef]
- Bhattacharjee, P.; Augustyniak, P. Comparative Evaluation of Neural Network Models for Optimizing ECG Signal in Non-Uniform Sampling Domain. Appl. Sci. 2024, 14, 8772. [Google Scholar] [CrossRef]
- Lee, J.Y. Experimental Evaluation of Deep Learning Methods for an Intelligent Pathological Voice Detection System Using the Saarbruecken Voice Database. Appl. Sci. 2021, 11, 7149. [Google Scholar] [CrossRef]
- Evangelista, L.; Móller, D.; Brentan, B.; Meirelles, G. Application of Feedforward Artificial Neural Networks to Predict the Hydraulic State of a Water Distribution Network. Eng. Proc. 2024, 69, 49. [Google Scholar] [CrossRef]
- Chen, T.; Guestrin, C. XGBoost: A Scalable Tree Boosting System. In Proceedings of the 22nd ACM SIGKDD International Conference on Knowledge Discovery and Data Mining, San Francisco, CA, USA, 13–17 August 2016; ACM: San Francisco, CA, USA, 2016; pp. 785–794. [Google Scholar]
- Ke, G.; Meng, Q.; Finley, T.; Wang, T.; Chen, W.; Ma, W.; Ye, Q.; Liu, T.-Y. LightGBM: A Highly Efficient Gradient Boosting Decision Tree. In Proceedings of the 31st International Conference on Neural Information Processing Systems, Long Beach, CA, USA, 4–9 December 2017. [Google Scholar]
- Kaggle. Available online: https://www.kaggle.com (accessed on 15 January 2025).
- Marcoulides, K.M.; Raykov, T. Evaluation of Variance Inflation Factors in Regression Models Using Latent Variable Modeling Methods. Educ. Psychol. Meas. 2019, 79, 874–882. [Google Scholar] [CrossRef]
- Maksymilian, W.; Ke, C. Feature Importance Ranking for Deep Learning. arXiv 2020, arXiv:2010.08973v1. [Google Scholar]
- Gałka, P.; Strzelecki, A. How Randomness Affects Player Ability to Predict the Chance to Win at PlayerUnknown’s Battlegrounds (PUBG). Comput. Games J. 2021, 10, 1–18. [Google Scholar] [CrossRef]
- Dehpanah, A.; Ghori, M.F.; Gemmell, J.; Mobasher, B. The Evaluation of Rating Systems in Team-based Battle Royale Games. arXiv 2021, arXiv:2105.14069. [Google Scholar]

Disclaimer/Publisher’s Note: The statements, opinions and data contained in all publications are solely those of the individual author(s) and contributor(s) and not of MDPI and/or the editor(s). MDPI and/or the editor(s) disclaim responsibility for any injury to people or property resulting from any ideas, methods, instructions or products referred to in the content. |
© 2025 by the authors. Licensee MDPI, Basel, Switzerland. This article is an open access article distributed under the terms and conditions of the Creative Commons Attribution (CC BY) license (https://creativecommons.org/licenses/by/4.0/).