
γ-Fe2O3-Based MEMS Gas Sensor for Propane Detection


Abstract
:
1. Introduction
2. Materials and Methods
2.1. Chemicals
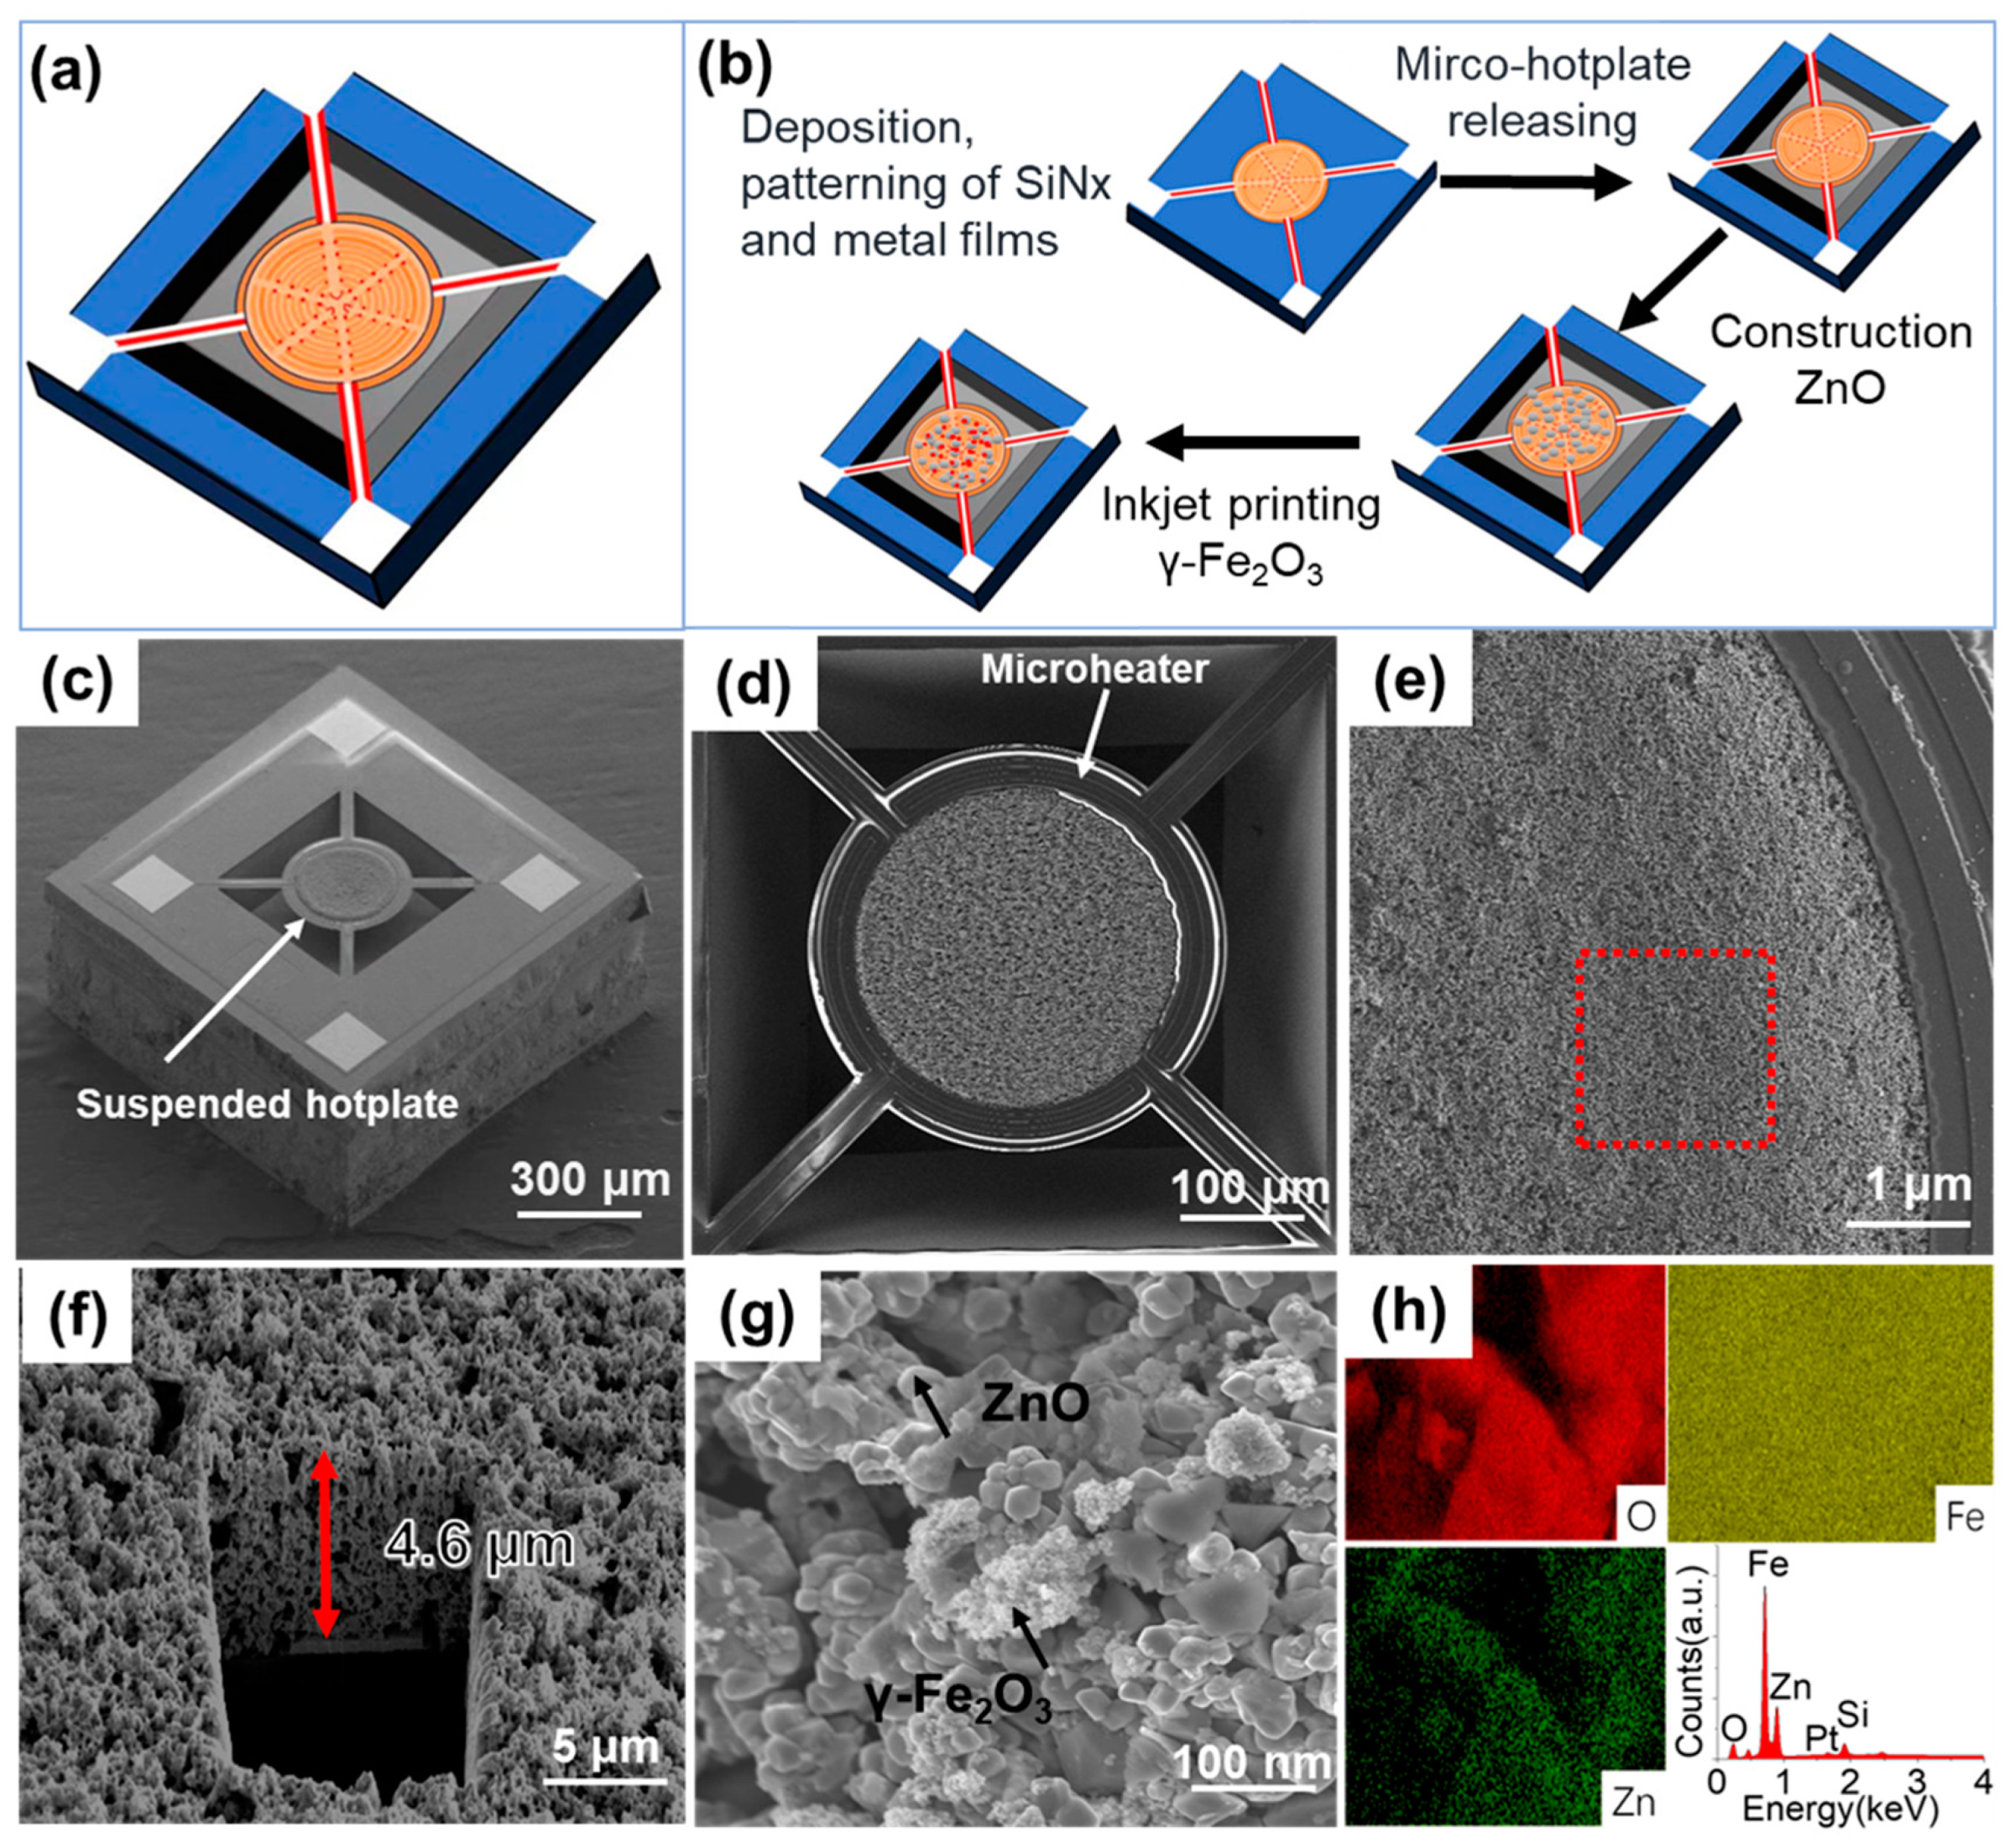
2.2. Construction of ZnO Material on Micro-Hotplate
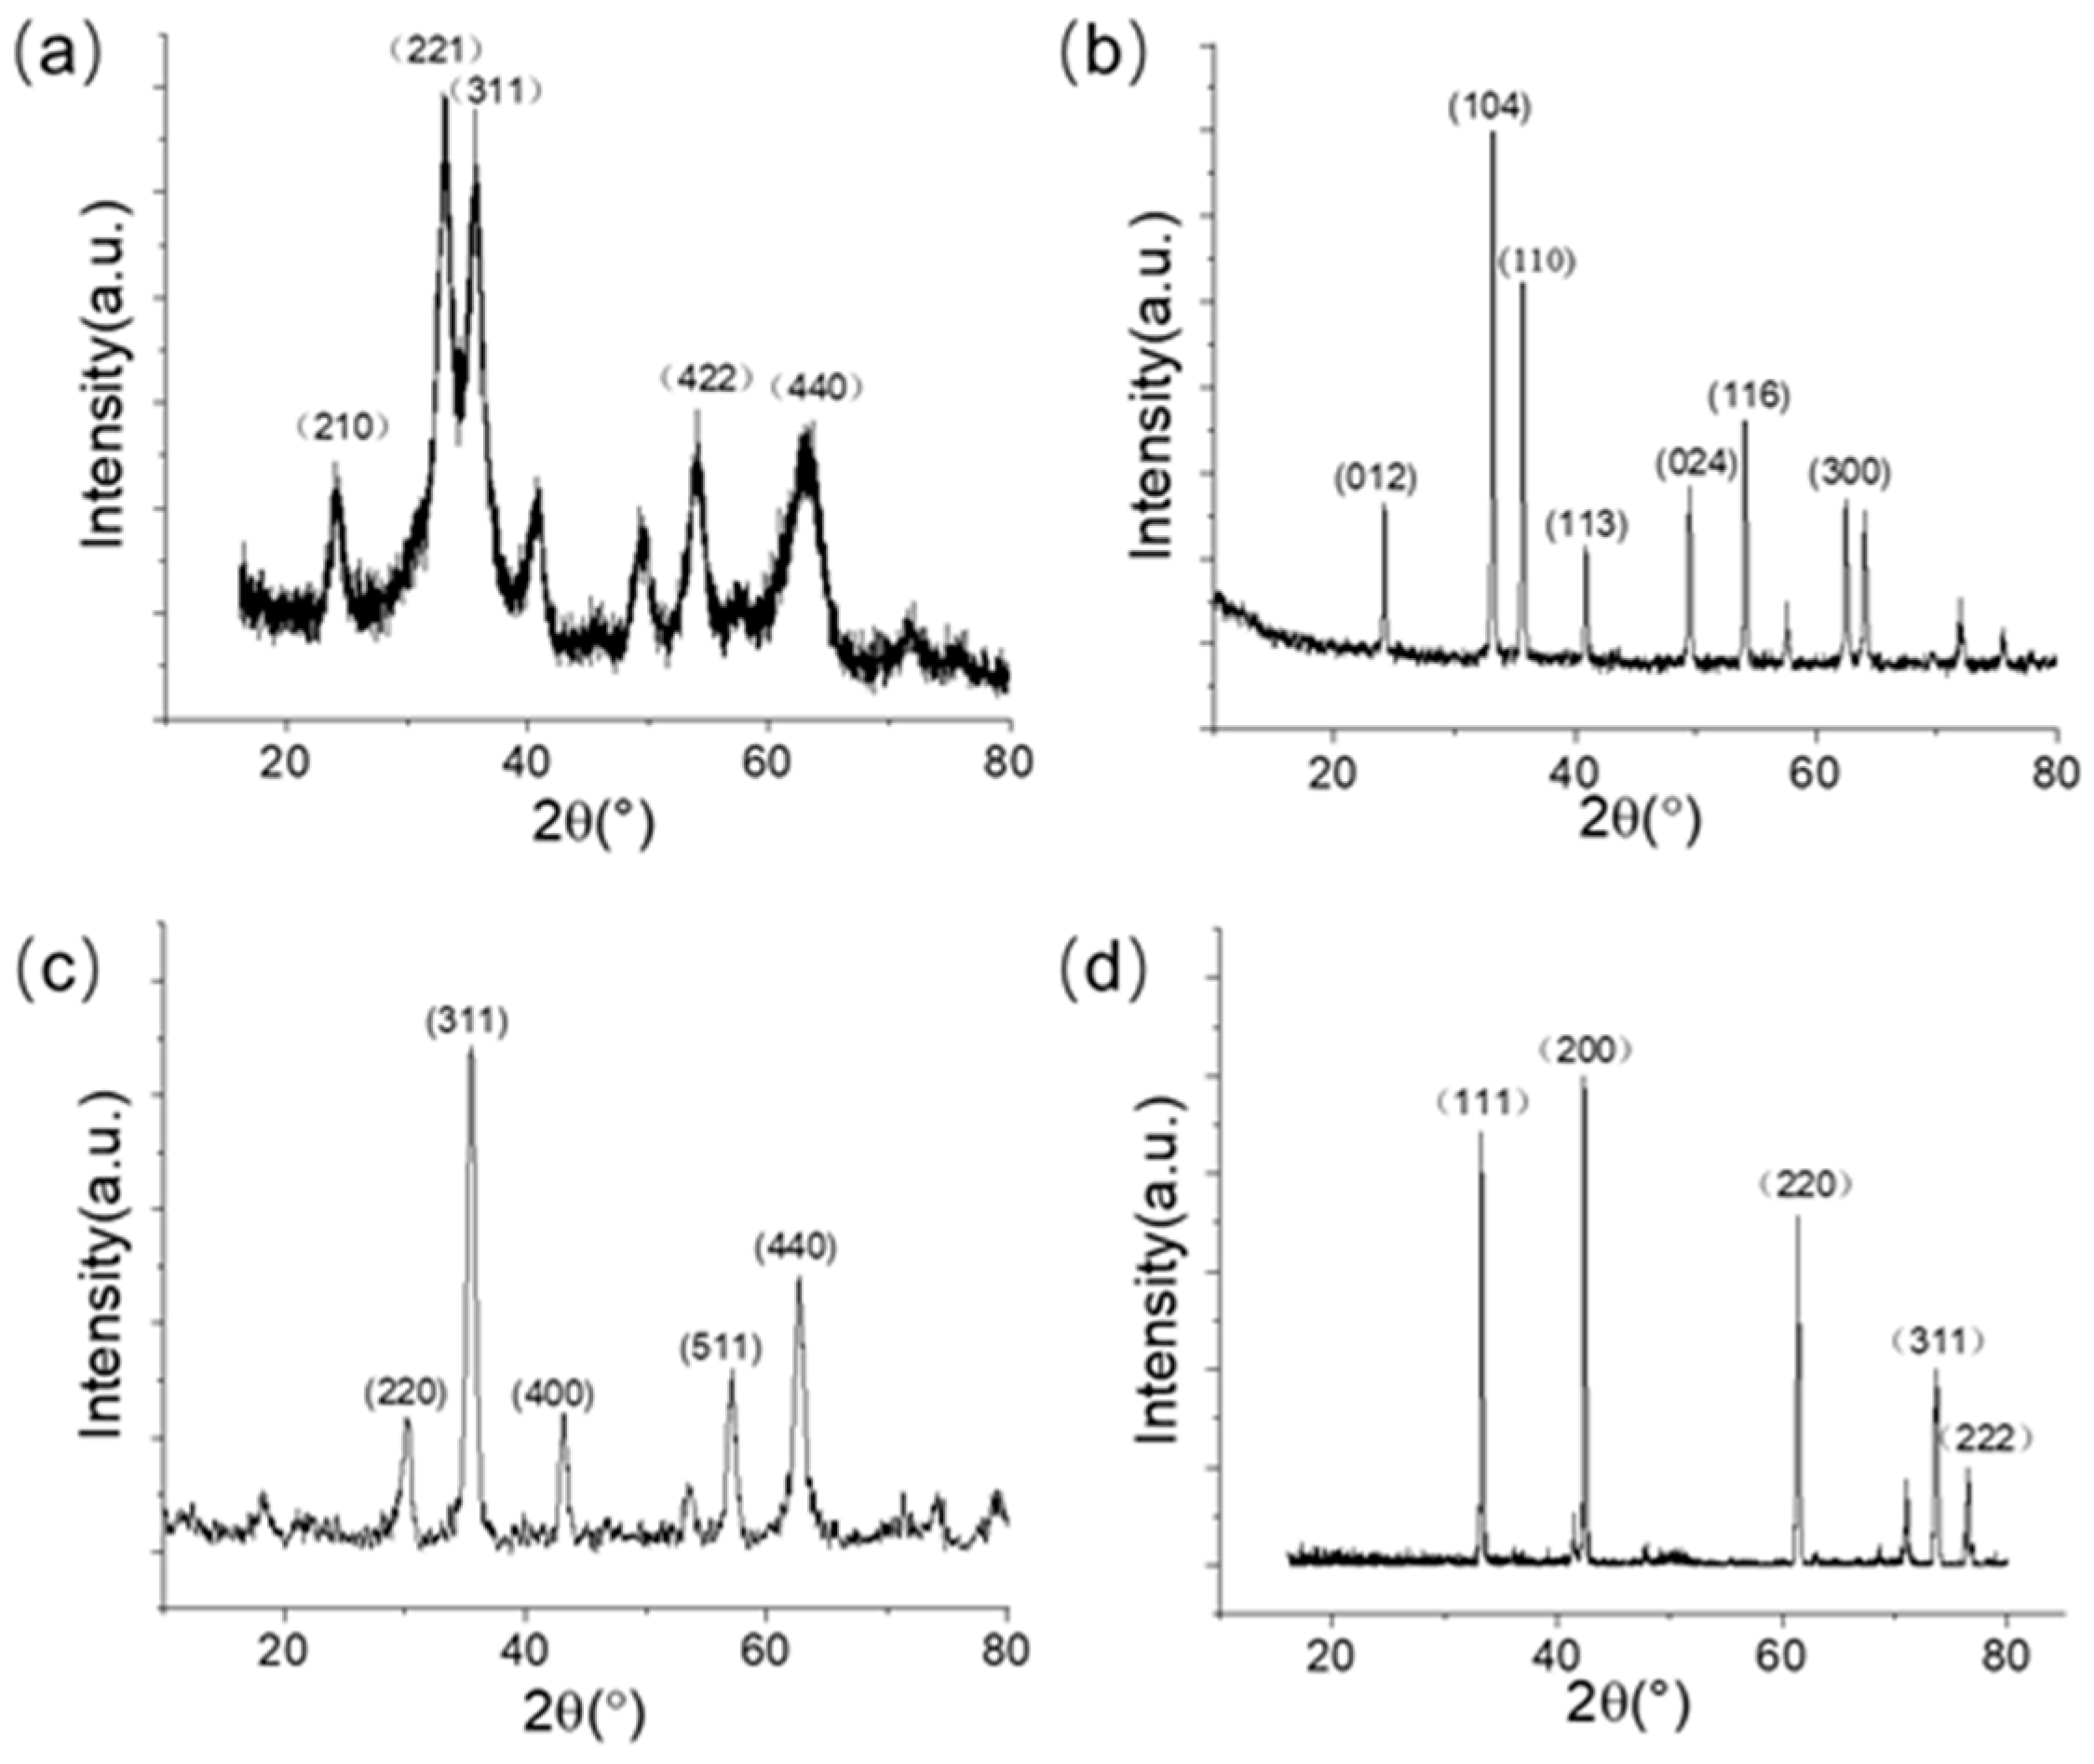
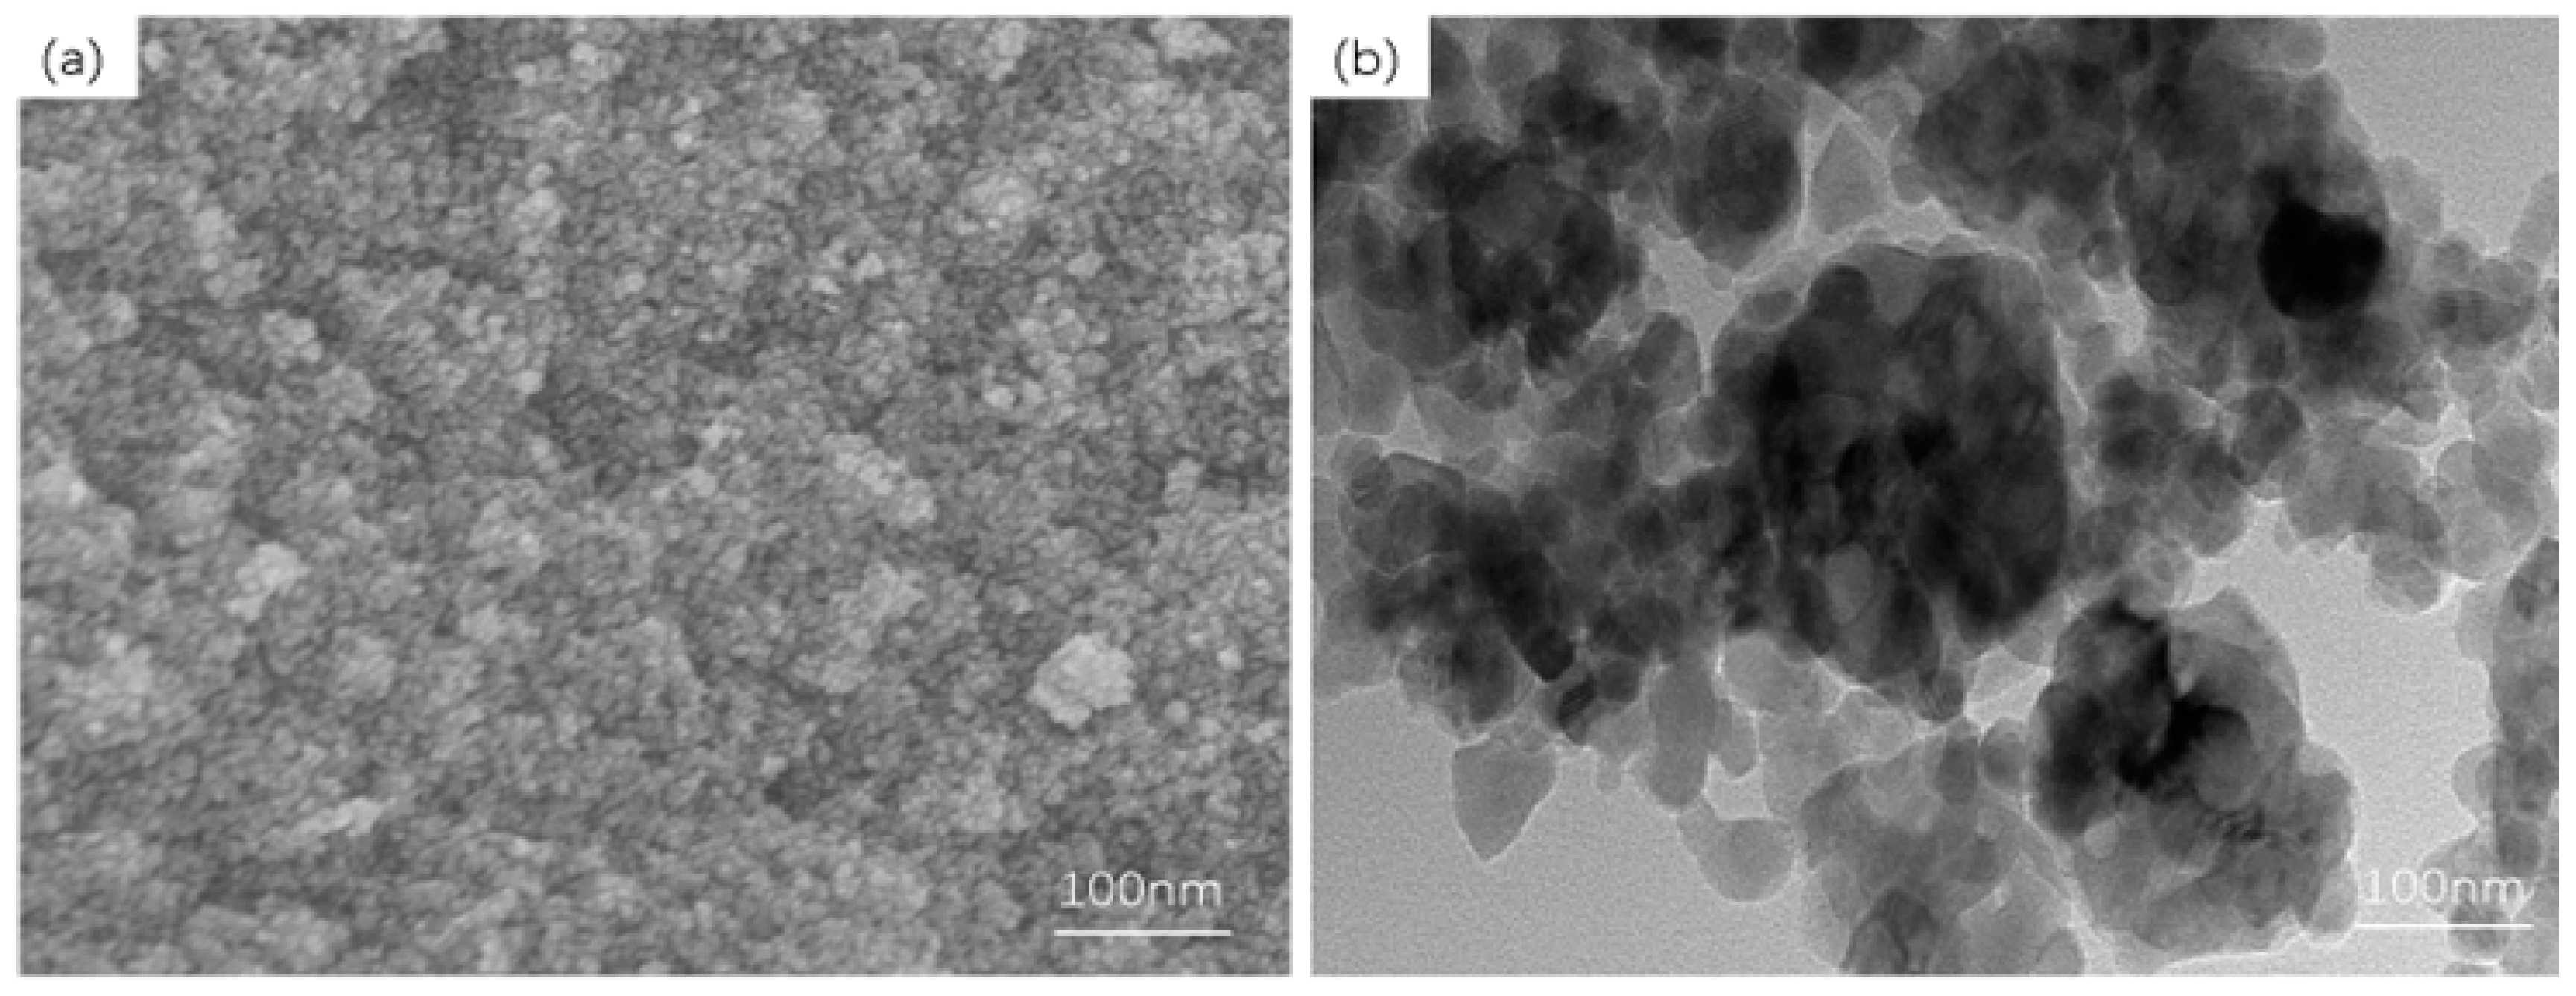
2.3. Synthesis of γ-Fe2O3
2.4. Synthesis of α-Fe2O3
2.5. Synthesis of Fe3O4
2.6. Synthesis of FeO
2.7. Fabrication of R290 Gas Sensor
2.8. Gas Sensing Experiment
2.9. Characterization of Materials
3. Results and Discussion
4. Conclusions
Author Contributions
Funding
Data Availability Statement
Conflicts of Interest
References
- Lepre, L.F.; Andre, D.; Denis-Quanquin, S.; Gautier, A.; Pádua, A.A.H.; Costa Gomes, M. Ionic Liquids Can Enable the Recycling of Fluorinated Greenhouse Gases. ACS Sustain. Chem. Eng. 2019, 7, 16900–16906. [Google Scholar] [CrossRef]
- Makhnatch, P.; Mota-Babiloni, A.; López-Belchí, A.; Khodabandeh, R. R450A and R513A as lower GWP mixtures for high ambient temperature countries: Experimental comparison with R134a. Energy 2019, 166, 223–235. [Google Scholar] [CrossRef]
- Pardo, F.; Gutiérrez-Hernández, S.V.; Zarca, G.; Urtiaga, A. Toward the Recycling of Low-GWP Hydrofluorocarbon/Hydrofluoroolefin Refrigerant Mixtures Using Composite Ionic Liquid–Polymer Membranes. ACS Sustain. Chem. Eng. 2021, 9, 7012–7021. [Google Scholar] [CrossRef]
- Kang, G.H.; Na, S.-I.; Kim, M.S. Reasonable performance comparison for a refrigeration system using different refrigerants: Case with propane and isobutane mixtures with several compositions. Int. J. Refrig. 2022, 135, 41–50. [Google Scholar] [CrossRef]
- Li, F.; Qian, X.; Li, P.; Liu, Z.; Yuan, M.; Chen, J. Investigation on the flammability limit and limiting oxygen concentration of propane/propylene mixture at elevated temperature and pressure. Energy 2023, 285, 129549. [Google Scholar] [CrossRef]
- Li, Y.; Yang, J.; Wu, X.; Liu, Y.; Zhou, P.; Yan, Y.; Han, X. Research on the field strength characteristics and the flammable area of refrigerants leakage into a confined space. Int. J. Refrig. 2023, 153, 308–322. [Google Scholar] [CrossRef]
- Ning, Q.; He, G.; Li, B.; Li, T. Theoretical and simulation analysis for R290 leakage from split-type air conditioners. Int. J. Refrig. 2024, 166, 139–148. [Google Scholar] [CrossRef]
- Ning, Q.; He, G.; Sun, W.; Fan, M.; Li, X.; Hong, Z. R290 leakage hazards assessment of a 1 HP split-type household air conditioner by concentration detection and ignition experiment. Int. J. Refrig. 2022, 139, 70–83. [Google Scholar] [CrossRef]
- Tang, W.; He, G.; Zhou, S.; Sun, W.; Cai, D.; Mei, K. The performance and risk assessment of R290 in a 13 kW air source heat pump. Appl. Therm. Eng. 2018, 144, 392–402. [Google Scholar] [CrossRef]
- Moldovan, Z.; Covaciu, F.D.; Turcu, I.; Ion, G. Determination of the Light Hydrocarbons in Sediment Porewater from the Black Sea by Gas Chromatography (GC). Anal. Lett. 2020, 54, 295–301. [Google Scholar] [CrossRef]
- Rhoderick, G.C. Differences between propane in nitrogen versus air matrix analyzed using gas chromatography with flame-ionization detection. J. Chromatogr. A 2008, 1187, 226–231. [Google Scholar] [CrossRef] [PubMed]
- Smith, F.; Augsburger, M.; Varlet, V. Accuracy profile validation of a new analytical method for propane measurement using headspace-gas chromatography-mass spectrometry. J. Anal. Toxicol. 2014, 38, 73–79. [Google Scholar] [CrossRef] [PubMed]
- Gabrienko, A.A.; Stepanov, A.G. Propene disproportionation on ZnO. Chem. Phys. Lett. 2012, 552, 88–91. [Google Scholar] [CrossRef]
- Zhivonitko, V.V.; Telkki, V.V.; Leppaniemi, J.; Scotti, G.; Franssila, S.; Koptyug, I.V. Remote detection NMR imaging of gas phase hydrogenation in microfluidic chips. Lab Chip 2013, 13, 1554–1561. [Google Scholar] [CrossRef]
- Mei, H.; Wang, G.; Xu, Y.; He, H.; Yao, J.; He, S. Simultaneous measurement of methane, propane and isobutane using a compact mid-infrared photoacoustic spectrophone. Photoacoustics 2024, 39, 100635. [Google Scholar] [CrossRef]
- Prakash, N.; Ramachandran, A.; Varma, R.; Chen, J.; Mazzoleni, C.; Du, K. Near-infrared incoherent broadband cavity enhanced absorption spectroscopy (NIR-IBBCEAS) for detection and quantification of natural gas components. Analyst 2018, 143, 3284–3291. [Google Scholar] [CrossRef]
- Wang, Y.; Wei, Y.; Liu, T.; Sun, T.; Grattan, K.T. TDLAS Detection of Propane/Butane Gas Mixture by Using Reference Gas Absorption Cells and Partial Least Square Approach. IEEE Sens. J. 2018, 18, 8587–8596. [Google Scholar] [CrossRef]
- Barsan, N.; Koziej, D.; Weimar, U. Metal oxide-based gas sensor research: How to? Sens. Actuators B Chem. 2007, 121, 18–35. [Google Scholar] [CrossRef]
- Kim, H.-J.; Lee, J.-H. Highly sensitive and selective gas sensors using p-type oxide semiconductors: Overview. Sens. Actuators B Chem. 2014, 192, 607–627. [Google Scholar] [CrossRef]
- Hu, J.; Zhang, T.; Chen, Y.; Xu, P.; Zheng, D.; Li, X. CO2 sensing properties and mechanism of ZnMn2O4 nanotubes under air and inert conditions. J. Mater. Chem. C 2022, 10, 7087–7092. [Google Scholar] [CrossRef]
- van den Bossche, M.; Rose, N.T.; De Wekker, S.F.J. Potential of a low-cost gas sensor for atmospheric methane monitoring. Sens. Actuators B Chem. 2017, 238, 501–509. [Google Scholar] [CrossRef]
- Wei, W.; Zhang, H.; Tao, T.; Xia, X.; Bao, Y.; Lourenço, M.; Homewood, K.; Huang, Z.; Gao, Y. A CuO/TiO2 Heterojunction Based CO Sensor with High Response and Selectivity. Energy Environ. Mater. 2023, 6, 12570. [Google Scholar] [CrossRef]
- Kerlau, M.; Reichel, P.; Bârsan, N.; Weimar, U.; Delsarte-Guéguen, S.; Merdrignac-Conanec, O. Detection of propane by “GaON” thick-film gas sensors. Sens. Actuators B Chem. 2007, 122, 14–19. [Google Scholar] [CrossRef]
- Aguilar-Leyva, J.; Maldonado, A.; Olvera, M.D.L.L. Gas-sensing characteristics of undoped-SnO2 thin films and Ag/SnO2 and SnO2/Ag structures in a propane atmosphere. Mater. Charact. 2007, 58, 740–744. [Google Scholar] [CrossRef]
- Huizar-Padilla, E.; Guillen-Bonilla, H.; Guillen-Bonilla, A.; Rodriguez-Betancourtt, V.M.; Sanchez-Martinez, A.; Guillen-Bonilla, J.T.; Gildo-Ortiz, L.; Reyes-Gomez, J. Synthesis of ZnAl(2)O(4) and Evaluation of the Response in Propane Atmospheres of Pellets and Thick Films Manufactured with Powders of the Oxide. Sensors 2021, 21, 2362. [Google Scholar] [CrossRef]
- Wasfi, A.; Sulieman, M.; Sefelnasr, Z.; Alteneiji, A.; Shafiqurrahman, A.; Alharairi, A.; Awwad, F. Detection of butane and propane gases via C(2)N sensors: First principles modeling. Sci. Rep. 2023, 13, 19314. [Google Scholar] [CrossRef]
- Hsueh, T.-J.; Peng, C.-H.; Chen, W.-S. A transparent ZnO nanowire MEMS gas sensor prepared by an ITO micro-heater. Sens. Actuators B Chem. 2020, 304, 127319. [Google Scholar] [CrossRef]
- Li, M.; Luo, W.; Liu, X.; Niu, G.; Wang, F. Wafer-Level Patterning of Tin Oxide Nanosheets for MEMS Gas Sensors. In Proceedings of the 2023 IEEE 36th International Conference on Micro Electro Mechanical Systems (MEMS), Munich, Germany, 15–19 January 2023; pp. 893–896. [Google Scholar]
- Nagarjuna, Y.; Hsiao, Y.-J. CuO/ZnO Heterojunction Nanostructured Sensor Prepared on MEMS Device for Enhanced H2S Gas Detection. J. Electrochem. Soc. 2021, 168, 067521. [Google Scholar] [CrossRef]
- Yoon, J.-H.; Kim, J.-S. Study on the MEMS-type gas sensor for detecting a nitrogen oxide gas. Solid State Ion. 2011, 192, 668–671. [Google Scholar] [CrossRef]
- Zhang, T.; Tan, R.; Shen, W.; Lv, D.; Yin, J.; Chen, W.; Fu, H.; Song, W. Inkjet-printed ZnO-based MEMS sensor array combined with feature selection algorithm for VOCs gas analysis. Sens. Actuators B Chem. 2023, 382, 133555. [Google Scholar] [CrossRef]
- Zhuang, Y.; Niu, G.; Wu, L.; Wang, F. Millisecond-Level Pulse-Heating Sensing System for MEMS-based Gas Sensors. In Proceedings of the 2023 IEEE 36th International Conference on Micro Electro Mechanical Systems (MEMS), Munich, Germany, 15–19 January 2023; pp. 913–916. [Google Scholar]
- Lee, J.-M.; Moon, B.-U.; Shim, C.-H.; Kim, B.-C.; Lee, M.-B.; Lee, D.-D.; Lee, J.-H. H2S microgas sensor fabricated by thermal oxidation of Cu/Sn double layer. Sens. Actuators B Chem. 2005, 108, 84–88. [Google Scholar] [CrossRef]
- Vaezi, M.R. SnO2/ZnO double-layer thin films: A novel economical preparation and investigation of sensitivity and stability of double-layer gas sensors. Mater. Chem. Phys. 2008, 110, 89–94. [Google Scholar] [CrossRef]
- Xu, H.; Ju, D.; Li, W.; Gong, H.; Zhang, J.; Wang, J.; Cao, B. Low-working-temperature, fast-response-speed NO2 sensor with nanoporous-SnO2/polyaniline double-layered film. Sens. Actuators B Chem. 2016, 224, 654–660. [Google Scholar] [CrossRef]
- Cao, D.; Li, H.; Pan, L.; Li, J.; Wang, X.; Jing, P.; Cheng, X.; Wang, W.; Wang, J.; Liu, Q. High saturation magnetization of gamma-Fe2O3 nano-particles by a facile one-step synthesis approach. Sci. Rep. 2016, 6, 32360. [Google Scholar] [CrossRef]
- Balezin, M.E.; Sokovnin, S.Y.; Uimin, M.A. Preparation of iron oxide nanopowders by the radiation-chemical method. J. Phys. Conf. Ser. 2021, 2064, 012086. [Google Scholar] [CrossRef]
- Liu, Z.-Q.; Kan, F.-J.; Xu, S.-X.; Liu, R.-C.; Jiang, F.-Y. Research Progress of the Preparation of Nano-Ferric Oxide. Asian J. Chem. 2013, 25, 8843–8847. [Google Scholar] [CrossRef]
- Periyasamy, S.; Gopalakannan, V.; Viswanathan, N. Enhanced Chromium Sorption and Quick Separation of Magnetic Hydrotalcite Anchored Biopolymeric Composites Using the Hydrothermal Method. J. Chem. Eng. Data 2018, 63, 1286–1299. [Google Scholar] [CrossRef]
- Kahani, S.A.; Jafari, M. A new method for preparation of magnetite from iron oxyhydroxide or iron oxide and ferrous salt in aqueous solution. J. Magn. Magn. Mater. 2009, 321, 1951–1954. [Google Scholar] [CrossRef]
- Wang, X.; Li, M.; Xu, P.; Chen, Y.; Yu, H.; Li, X. In Situ TEM Technique Revealing the Deactivation Mechanism of Bimetallic Pd-Ag Nanoparticles in Hydrogen Sensors. Nano Lett. 2022, 22, 3157–3164. [Google Scholar] [CrossRef]
- Chen, Y.; Xu, P.; Li, X.; Ren, Y.; Deng, Y. High-performance H2 sensors with selectively hydrophobic micro-plate for self-aligned upload of Pd nanodots modified mesoporous In2O3 sensing-material. Sens. Actuators B Chem. 2018, 267, 83–92. [Google Scholar] [CrossRef]
- Zhang, T.; Zhou, Y.; Li, X.; Chen, Y.; Zheng, D.; Li, X.; Xu, P. Catalytic decomposition sensing mechanism of mesoporous gamma alumina for freon R134a detection. Sens. Actuators B Chem. 2023, 380, 133302. [Google Scholar] [CrossRef]

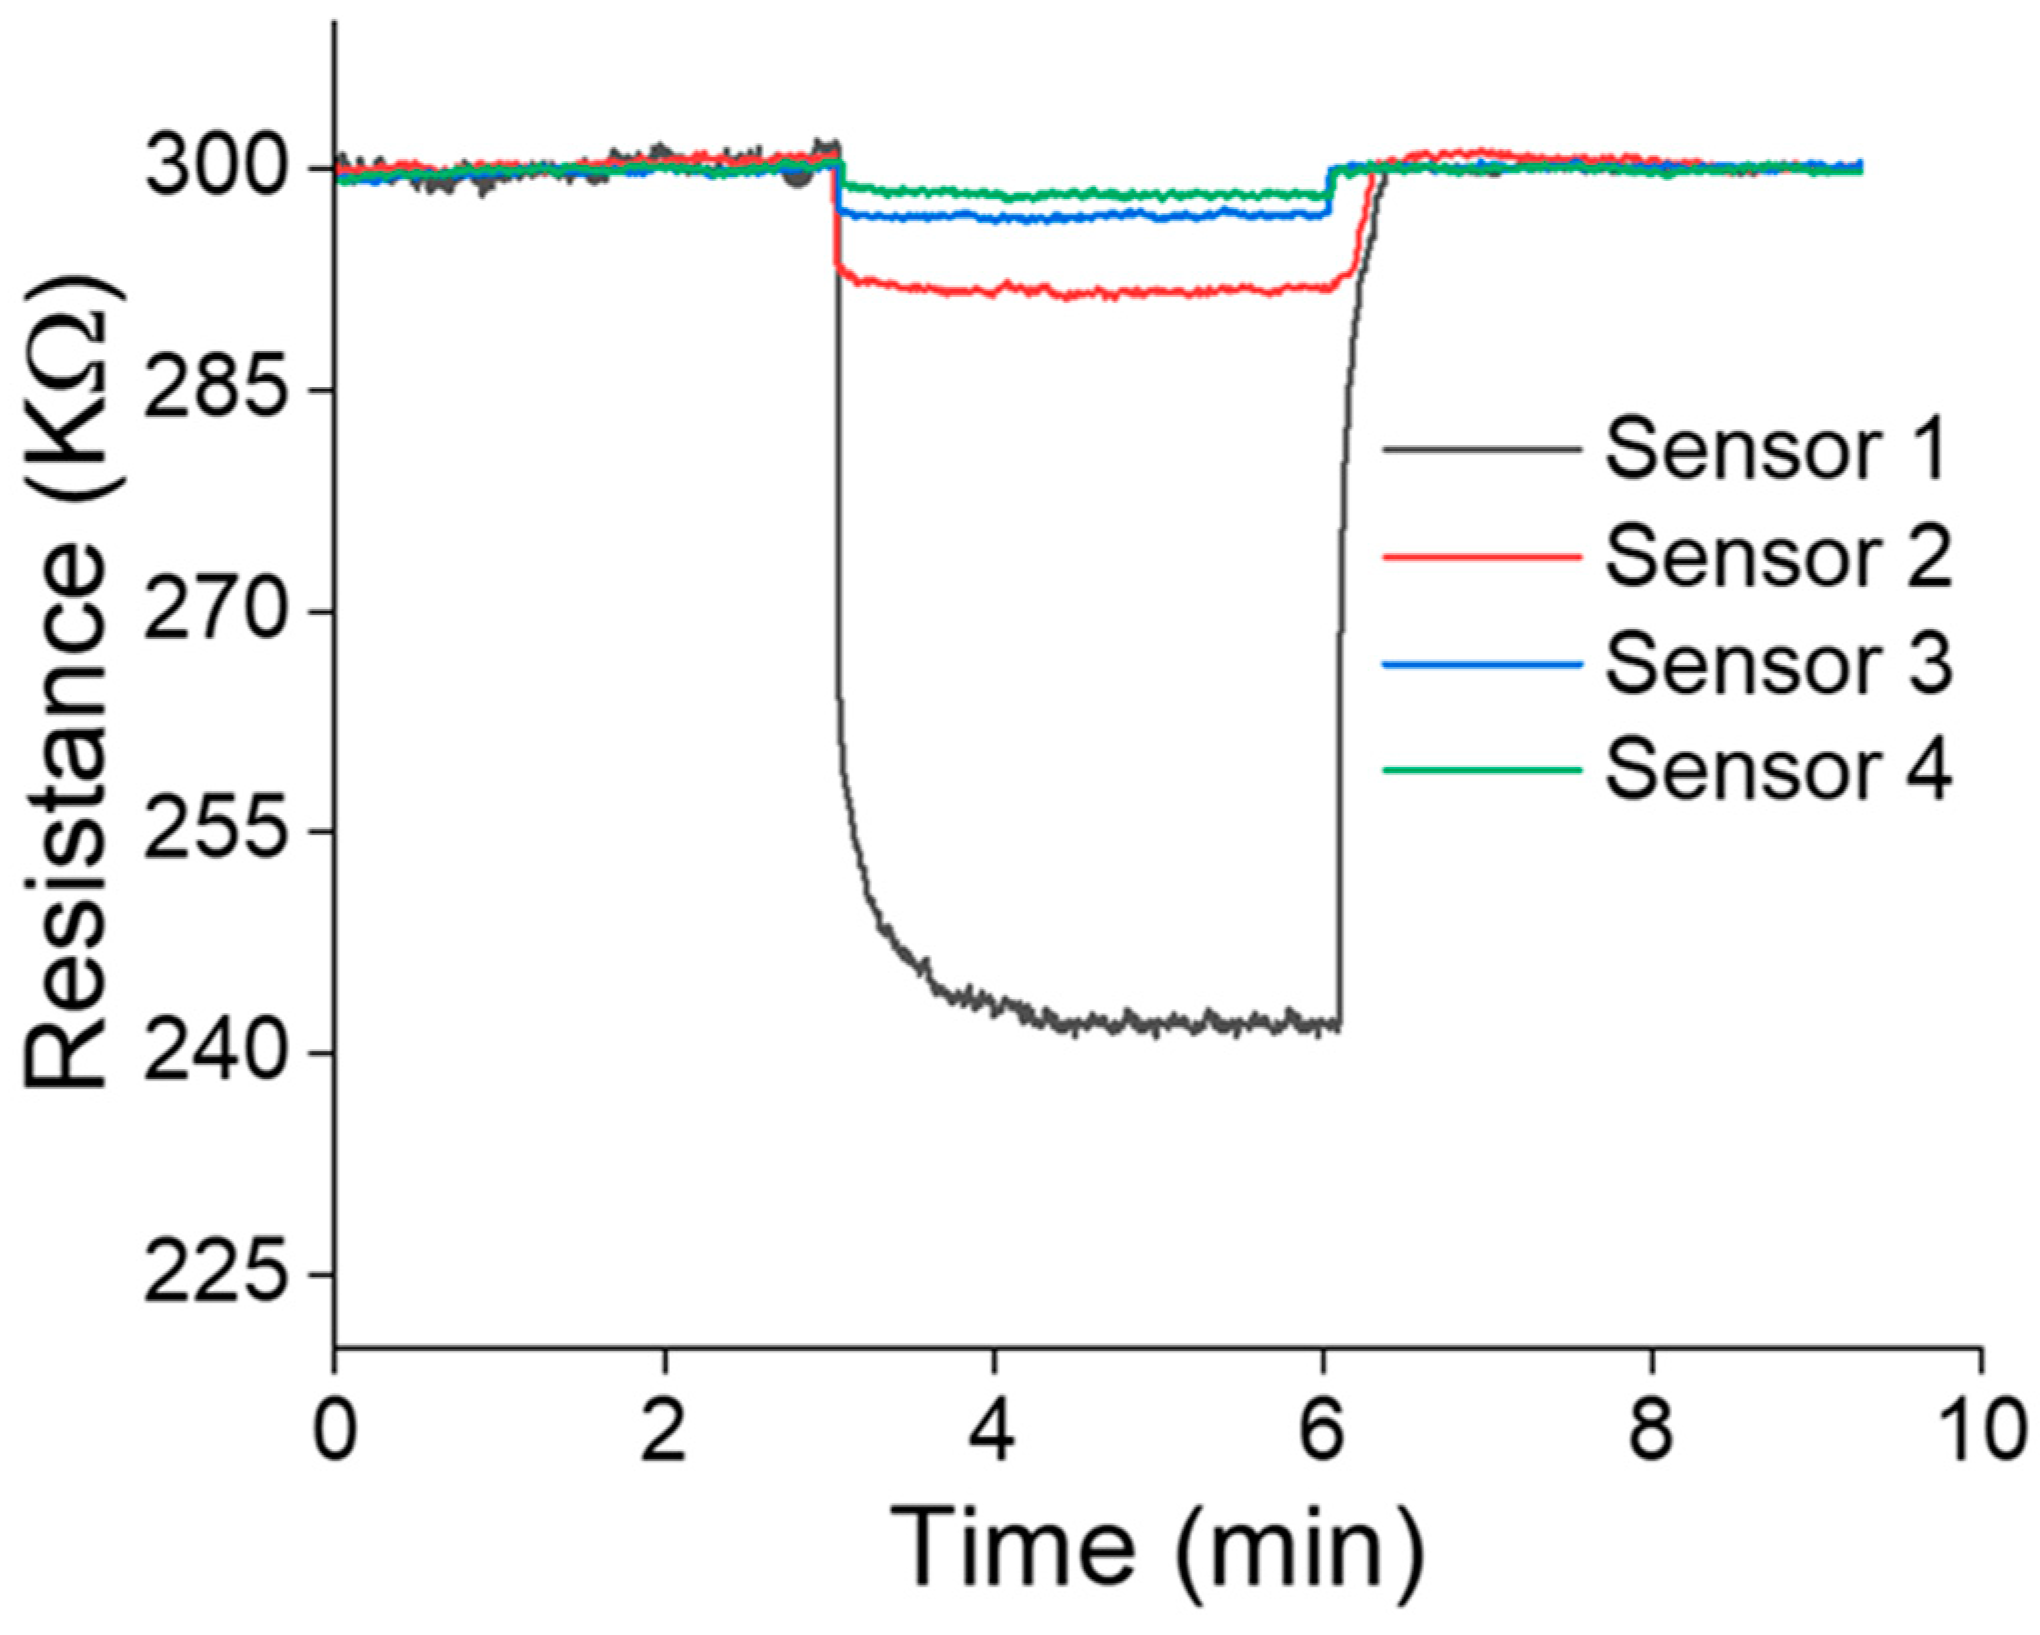
| Sensor No. | Catalyst | Sensor Response: S |
|---|---|---|
| Sensor1 | γ-Fe2O3 | 20.12% |
| Sensor 2 | α-Fe2O3 | 2.67% |
| Sensor 3 | Fe3O4 | 1.33% |
| Sensor 4 | FeO | 0.67% |
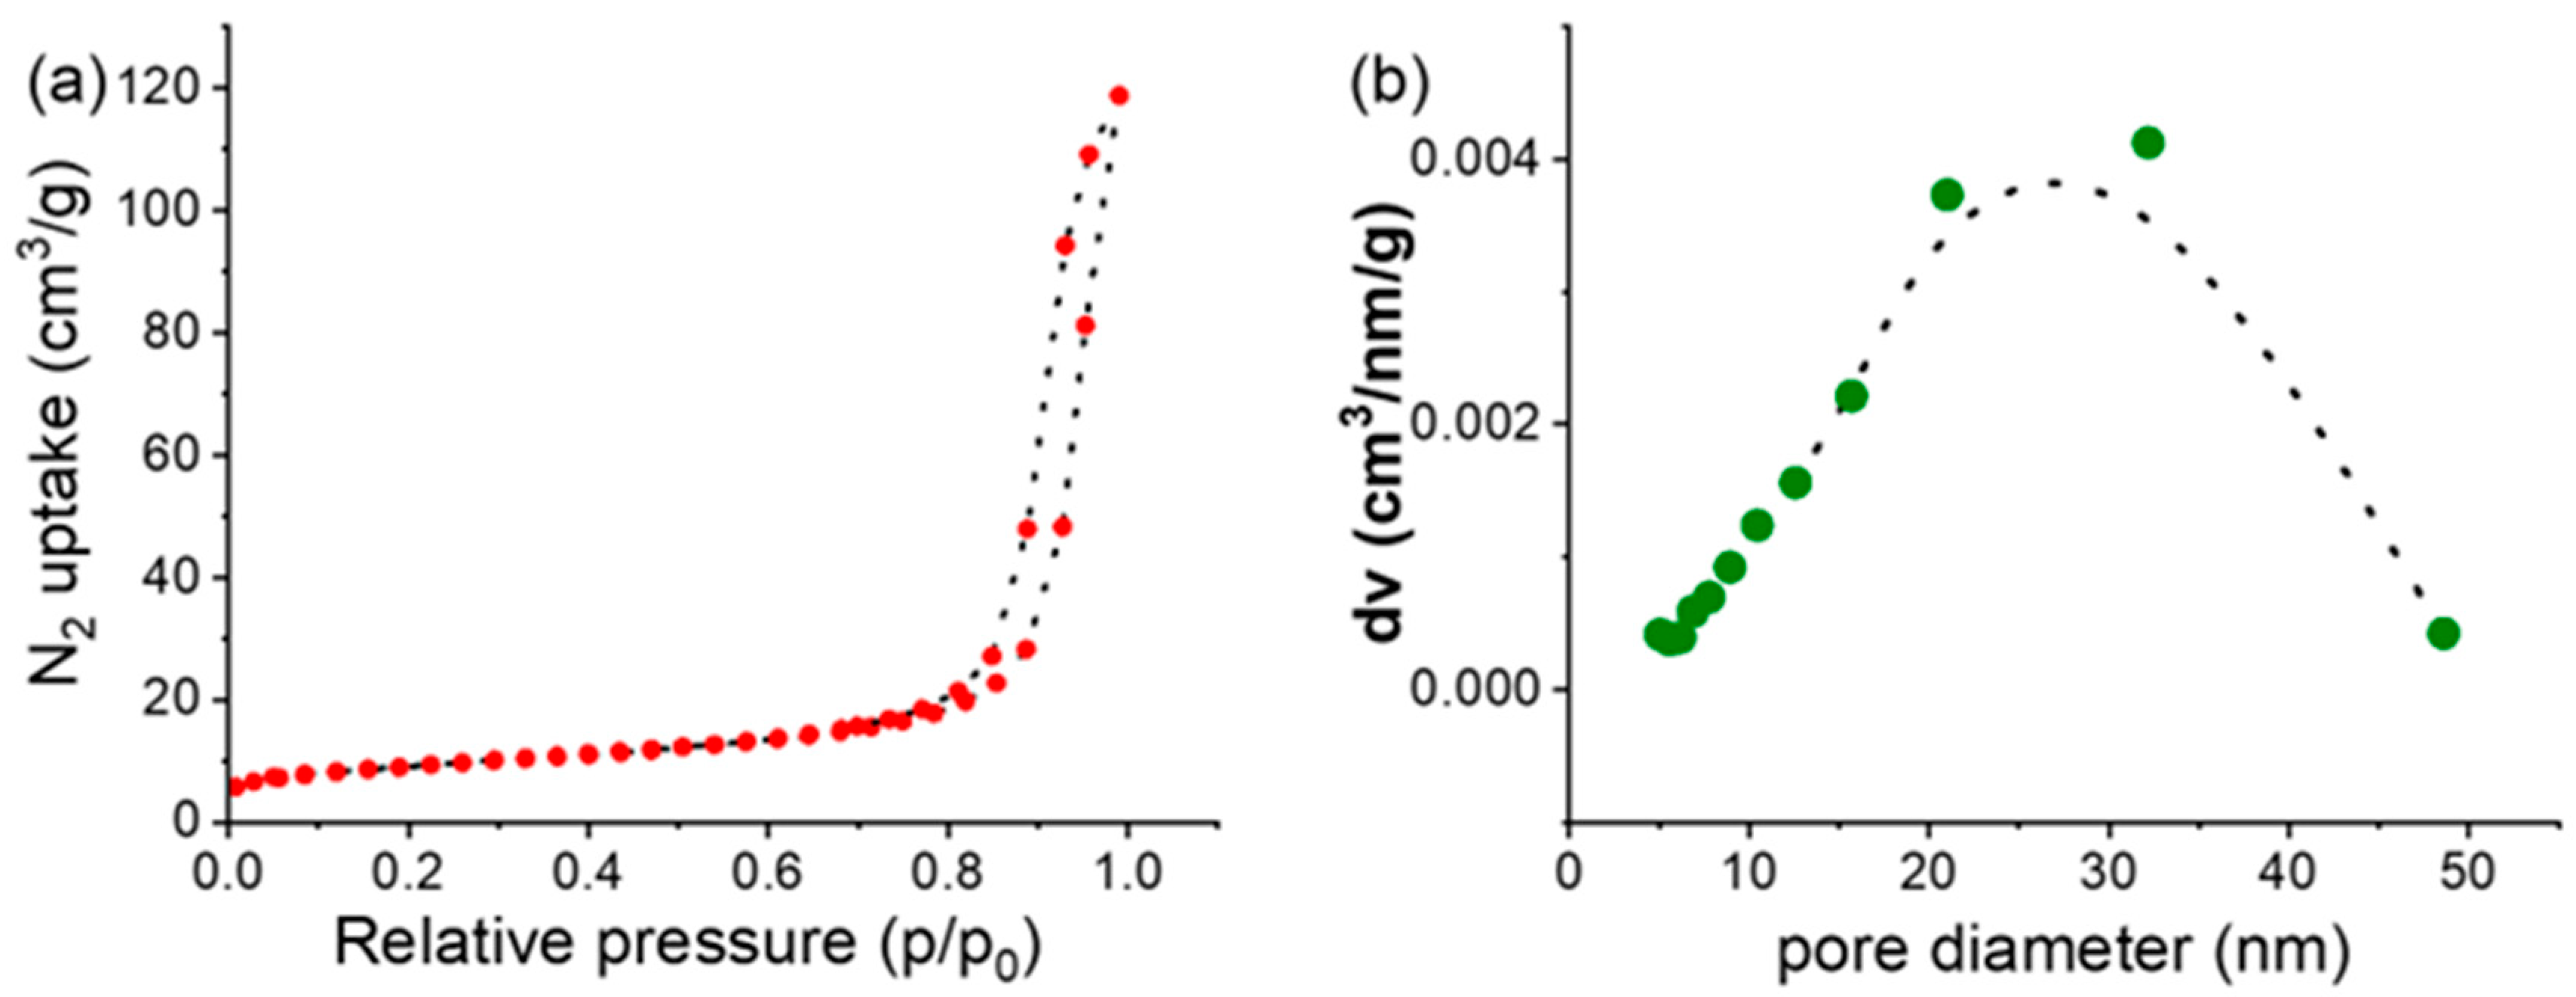
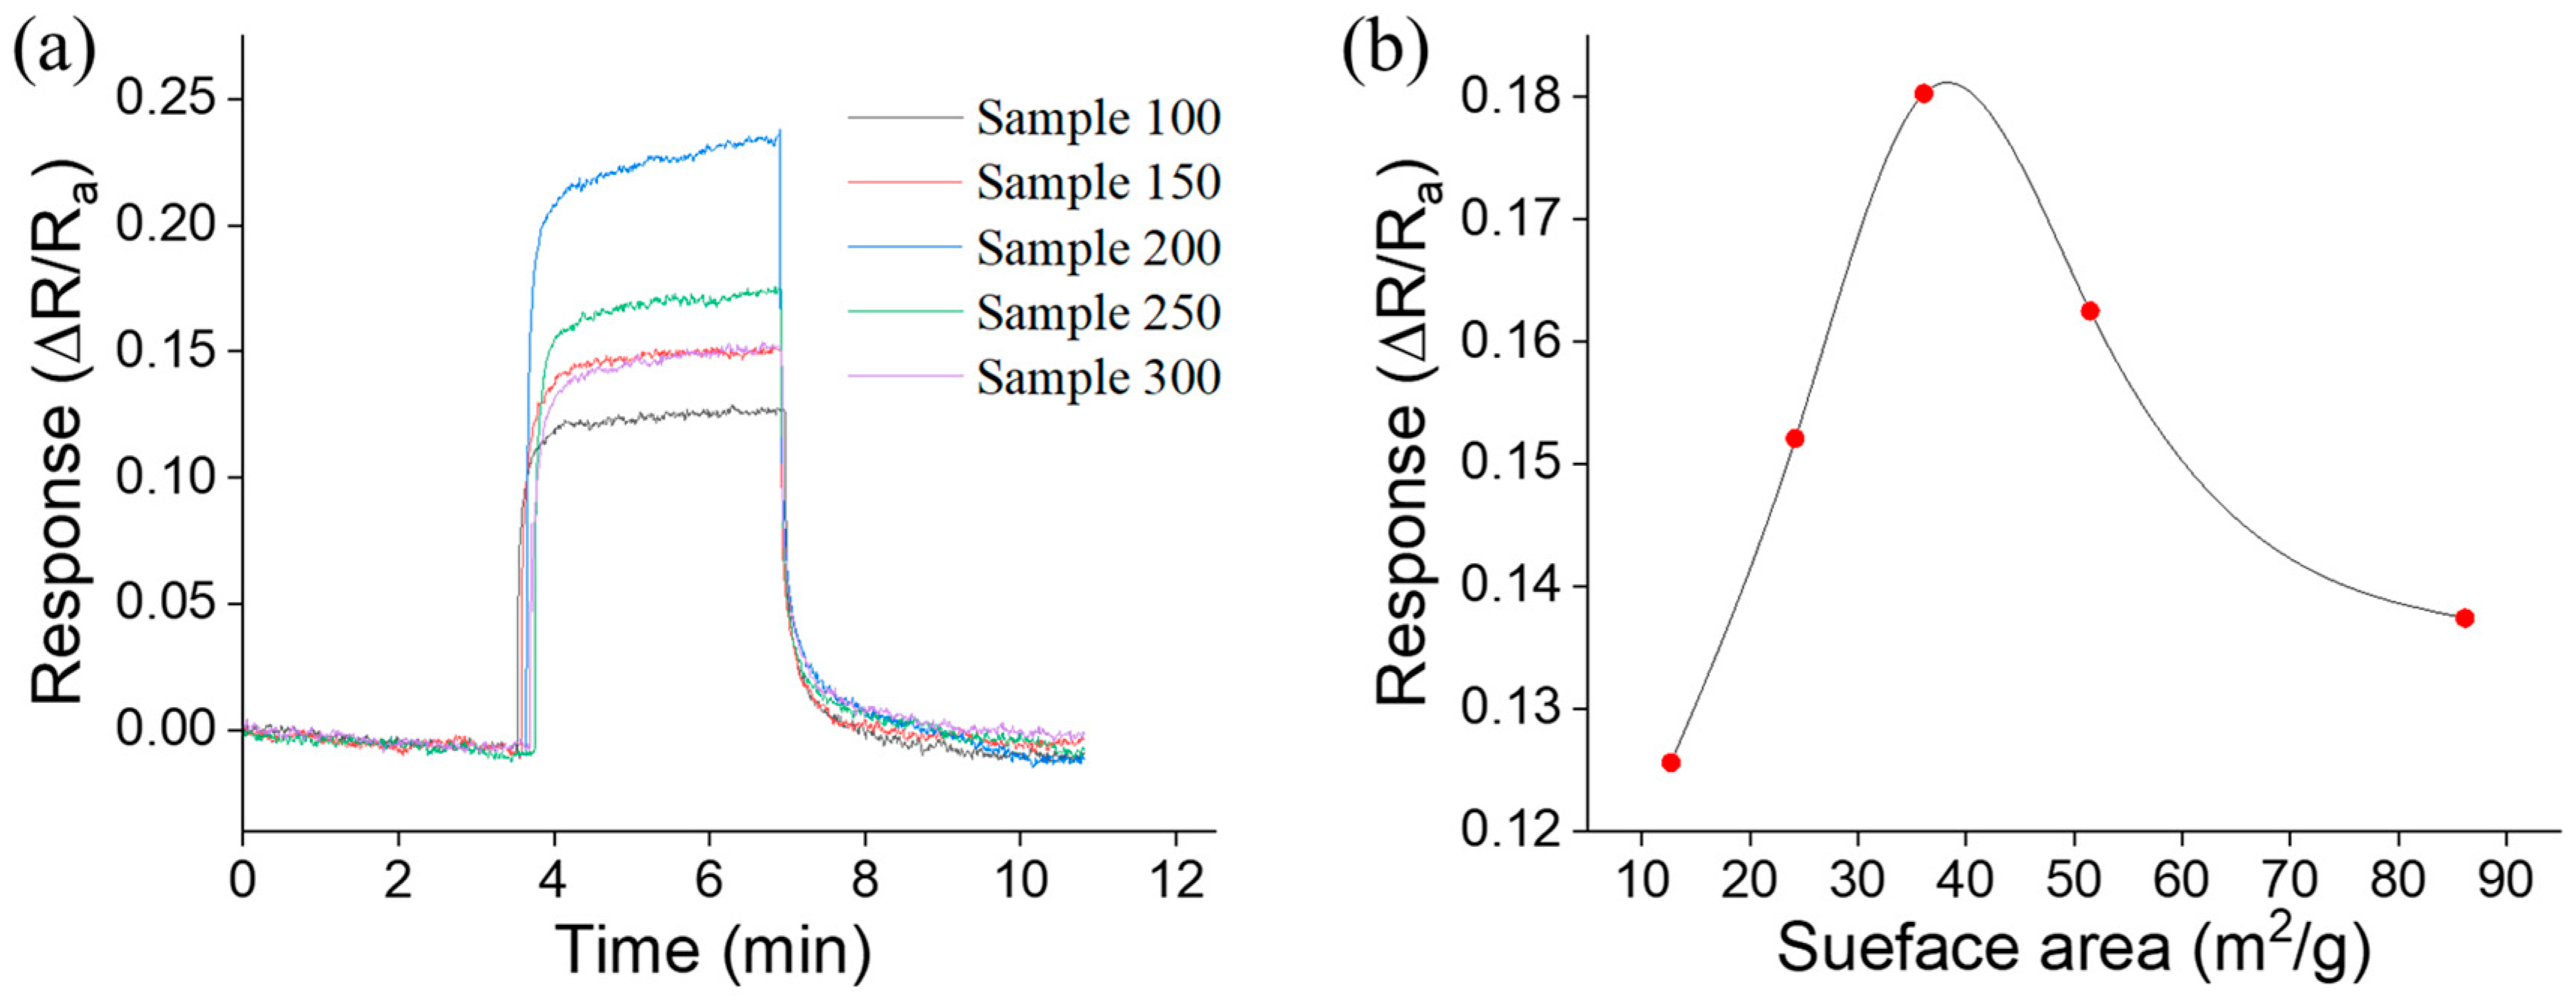
| Sensor No. | Calcination Temperature (°C) | Specific Surface Area (m2/g) | Sensor Response S |
|---|---|---|---|
| Sensor1 | 100 | 12.7 | 12.56% |
| Sensor 2 | 150 | 24.2 | 15.21% |
| Sensor 3 | 200 | 36.1 | 18.03% |
| Sensor 4 | 250 | 51.5 | 16.25% |
| Sensor 5 | 300 | 86.2 | 13.74% |
Disclaimer/Publisher’s Note: The statements, opinions and data contained in all publications are solely those of the individual author(s) and contributor(s) and not of MDPI and/or the editor(s). MDPI and/or the editor(s) disclaim responsibility for any injury to people or property resulting from any ideas, methods, instructions or products referred to in the content. |
© 2025 by the authors. Licensee MDPI, Basel, Switzerland. This article is an open access article distributed under the terms and conditions of the Creative Commons Attribution (CC BY) license (https://creativecommons.org/licenses/by/4.0/).
Share and Cite
Gao, X.; Chen, Y.; Xu, P.; Zheng, D.; Li, X. γ-Fe2O3-Based MEMS Gas Sensor for Propane Detection. Electronics 2025, 14, 1050. https://doi.org/10.3390/electronics14051050
Gao X, Chen Y, Xu P, Zheng D, Li X. γ-Fe2O3-Based MEMS Gas Sensor for Propane Detection. Electronics. 2025; 14(5):1050. https://doi.org/10.3390/electronics14051050
Chicago/Turabian StyleGao, Xiang, Ying Chen, Pengcheng Xu, Dan Zheng, and Xinxin Li. 2025. "γ-Fe2O3-Based MEMS Gas Sensor for Propane Detection" Electronics 14, no. 5: 1050. https://doi.org/10.3390/electronics14051050
APA StyleGao, X., Chen, Y., Xu, P., Zheng, D., & Li, X. (2025). γ-Fe2O3-Based MEMS Gas Sensor for Propane Detection. Electronics, 14(5), 1050. https://doi.org/10.3390/electronics14051050