
Comparing Physiological Synchrony and User Copresent Experience in Virtual Reality: A Quantitative–Qualitative Gap


 and
and 
Abstract
:1. Introduction
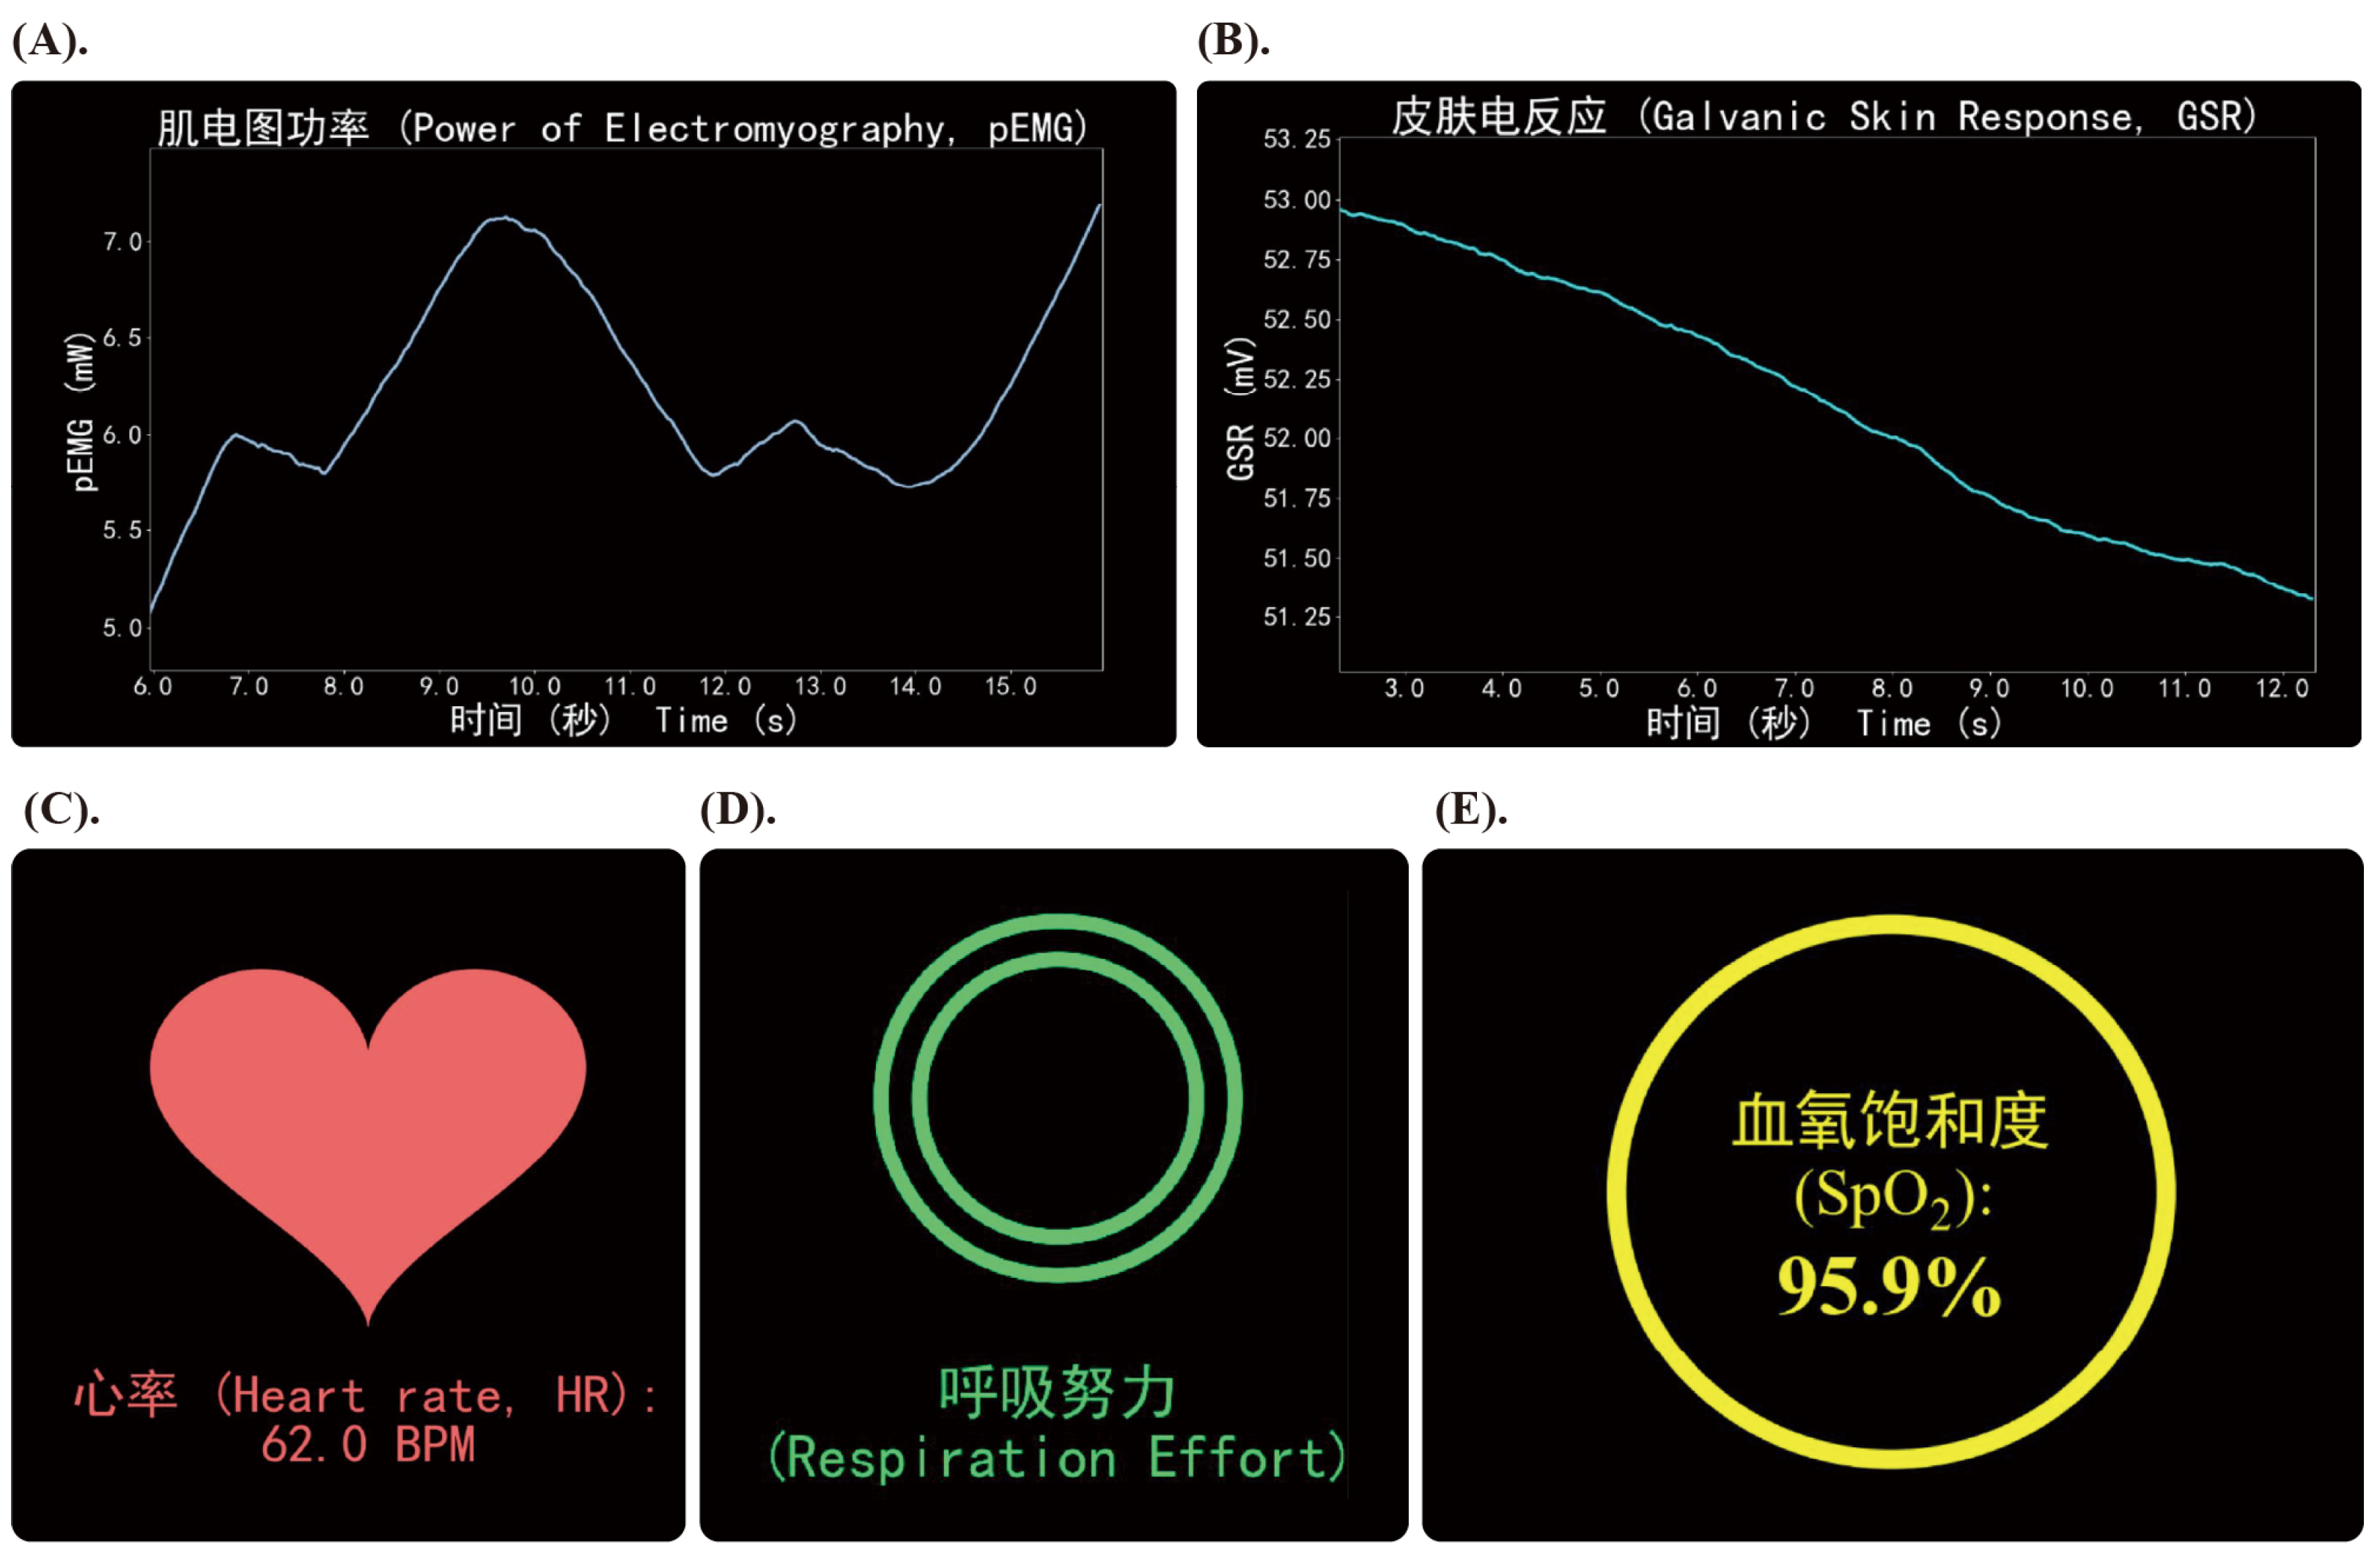
- We collected and compared five different biosensory cues (pEMG, GSR, HR, RE, SpO2) and their respective effects on users’ copresent experience in virtual environment, all based on real biodata.
- We combined both quantitative measurement of physiological synchrony and qualitative evaluation of user subjective feedback to form a more comprehensive understanding for utilizing biosensory information as social cues, resulting in five design implications.
2. Background
3. Methods
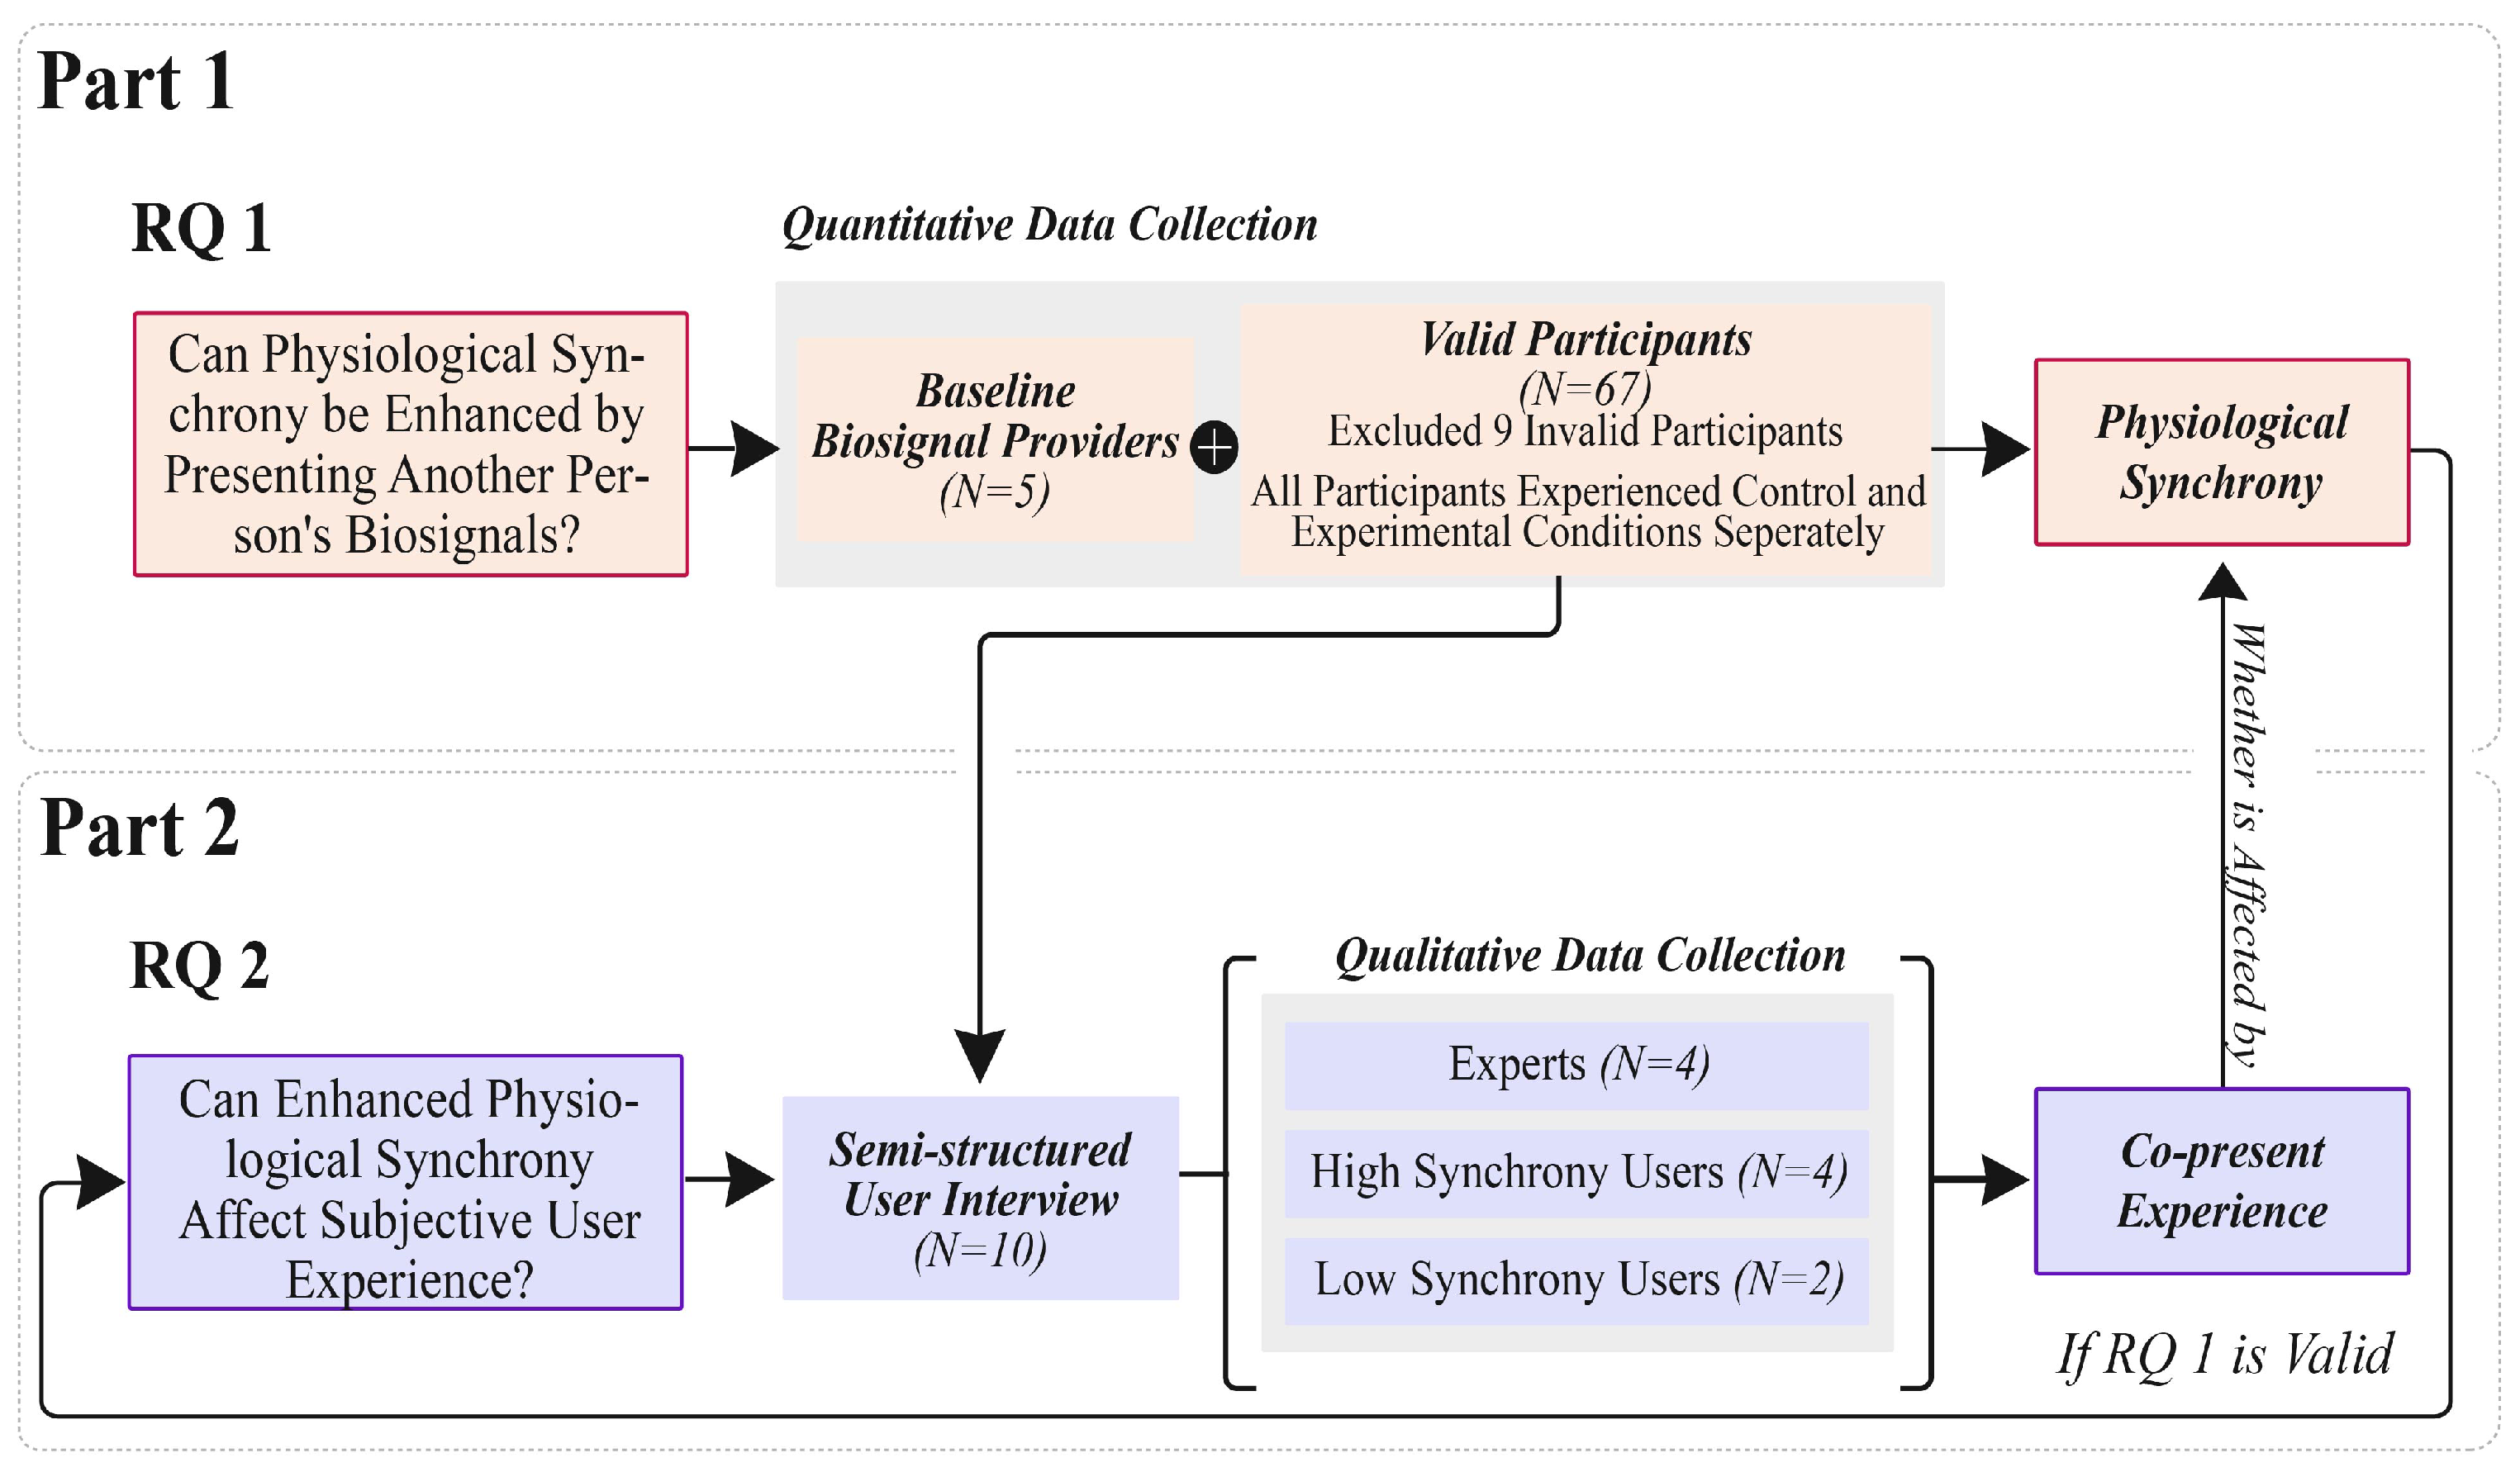
3.1. Overview
3.2. Participants
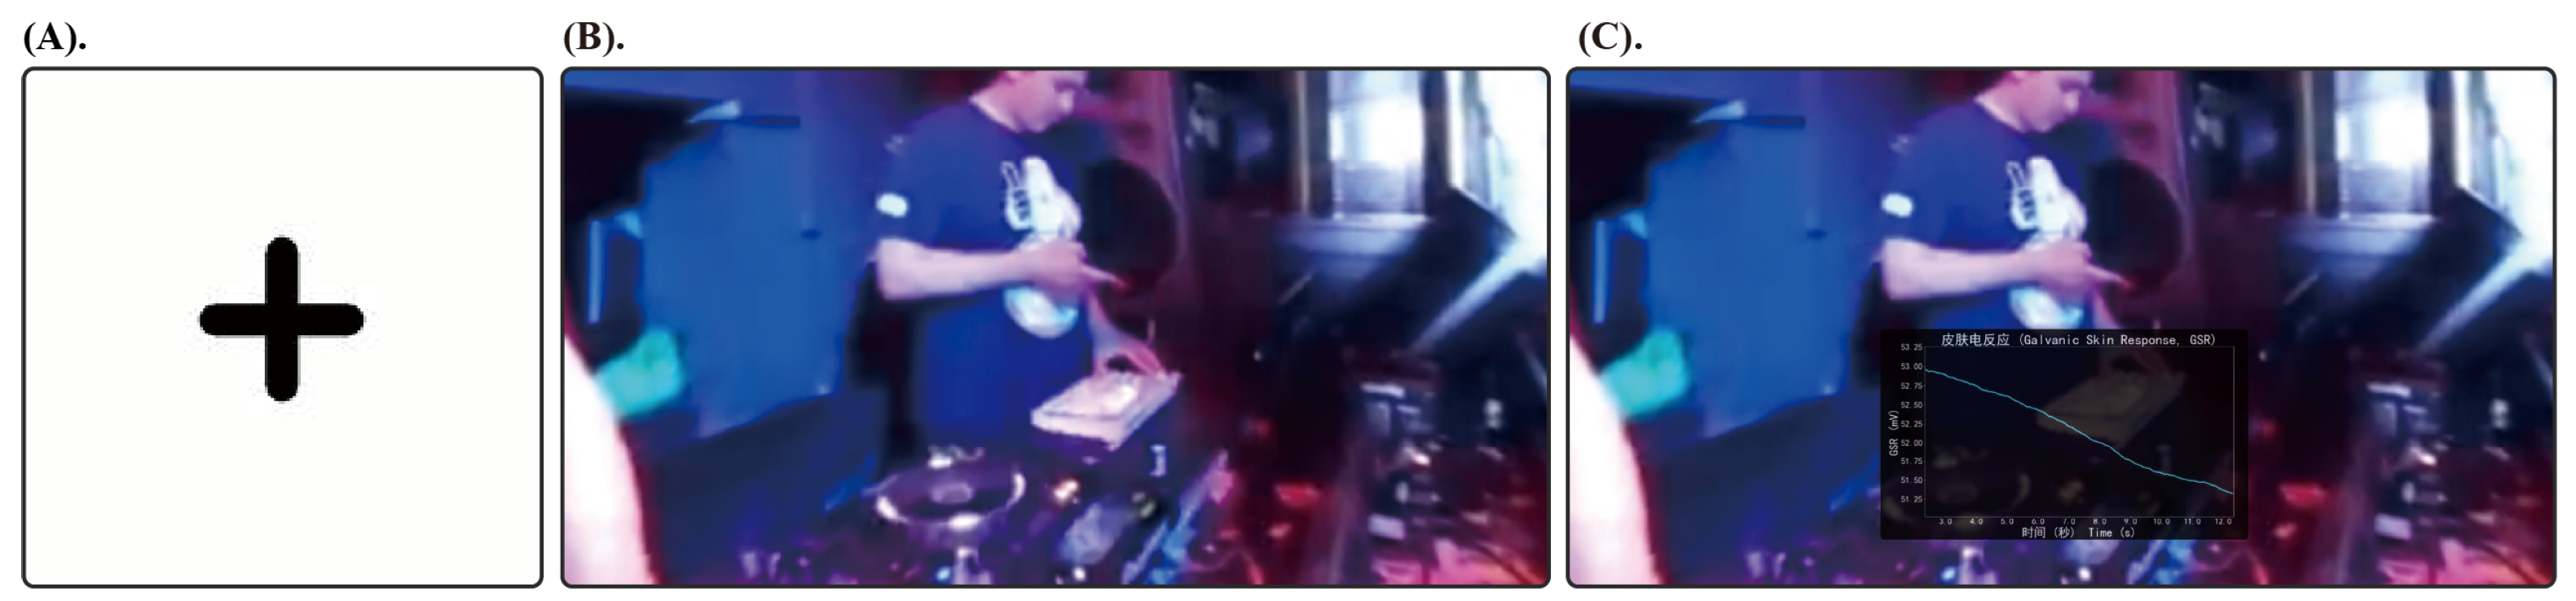
3.3. VR EDM Setting
3.4. Biosensory Data Collection and Analysis
3.5. Semi-Structured Interview
4. Results
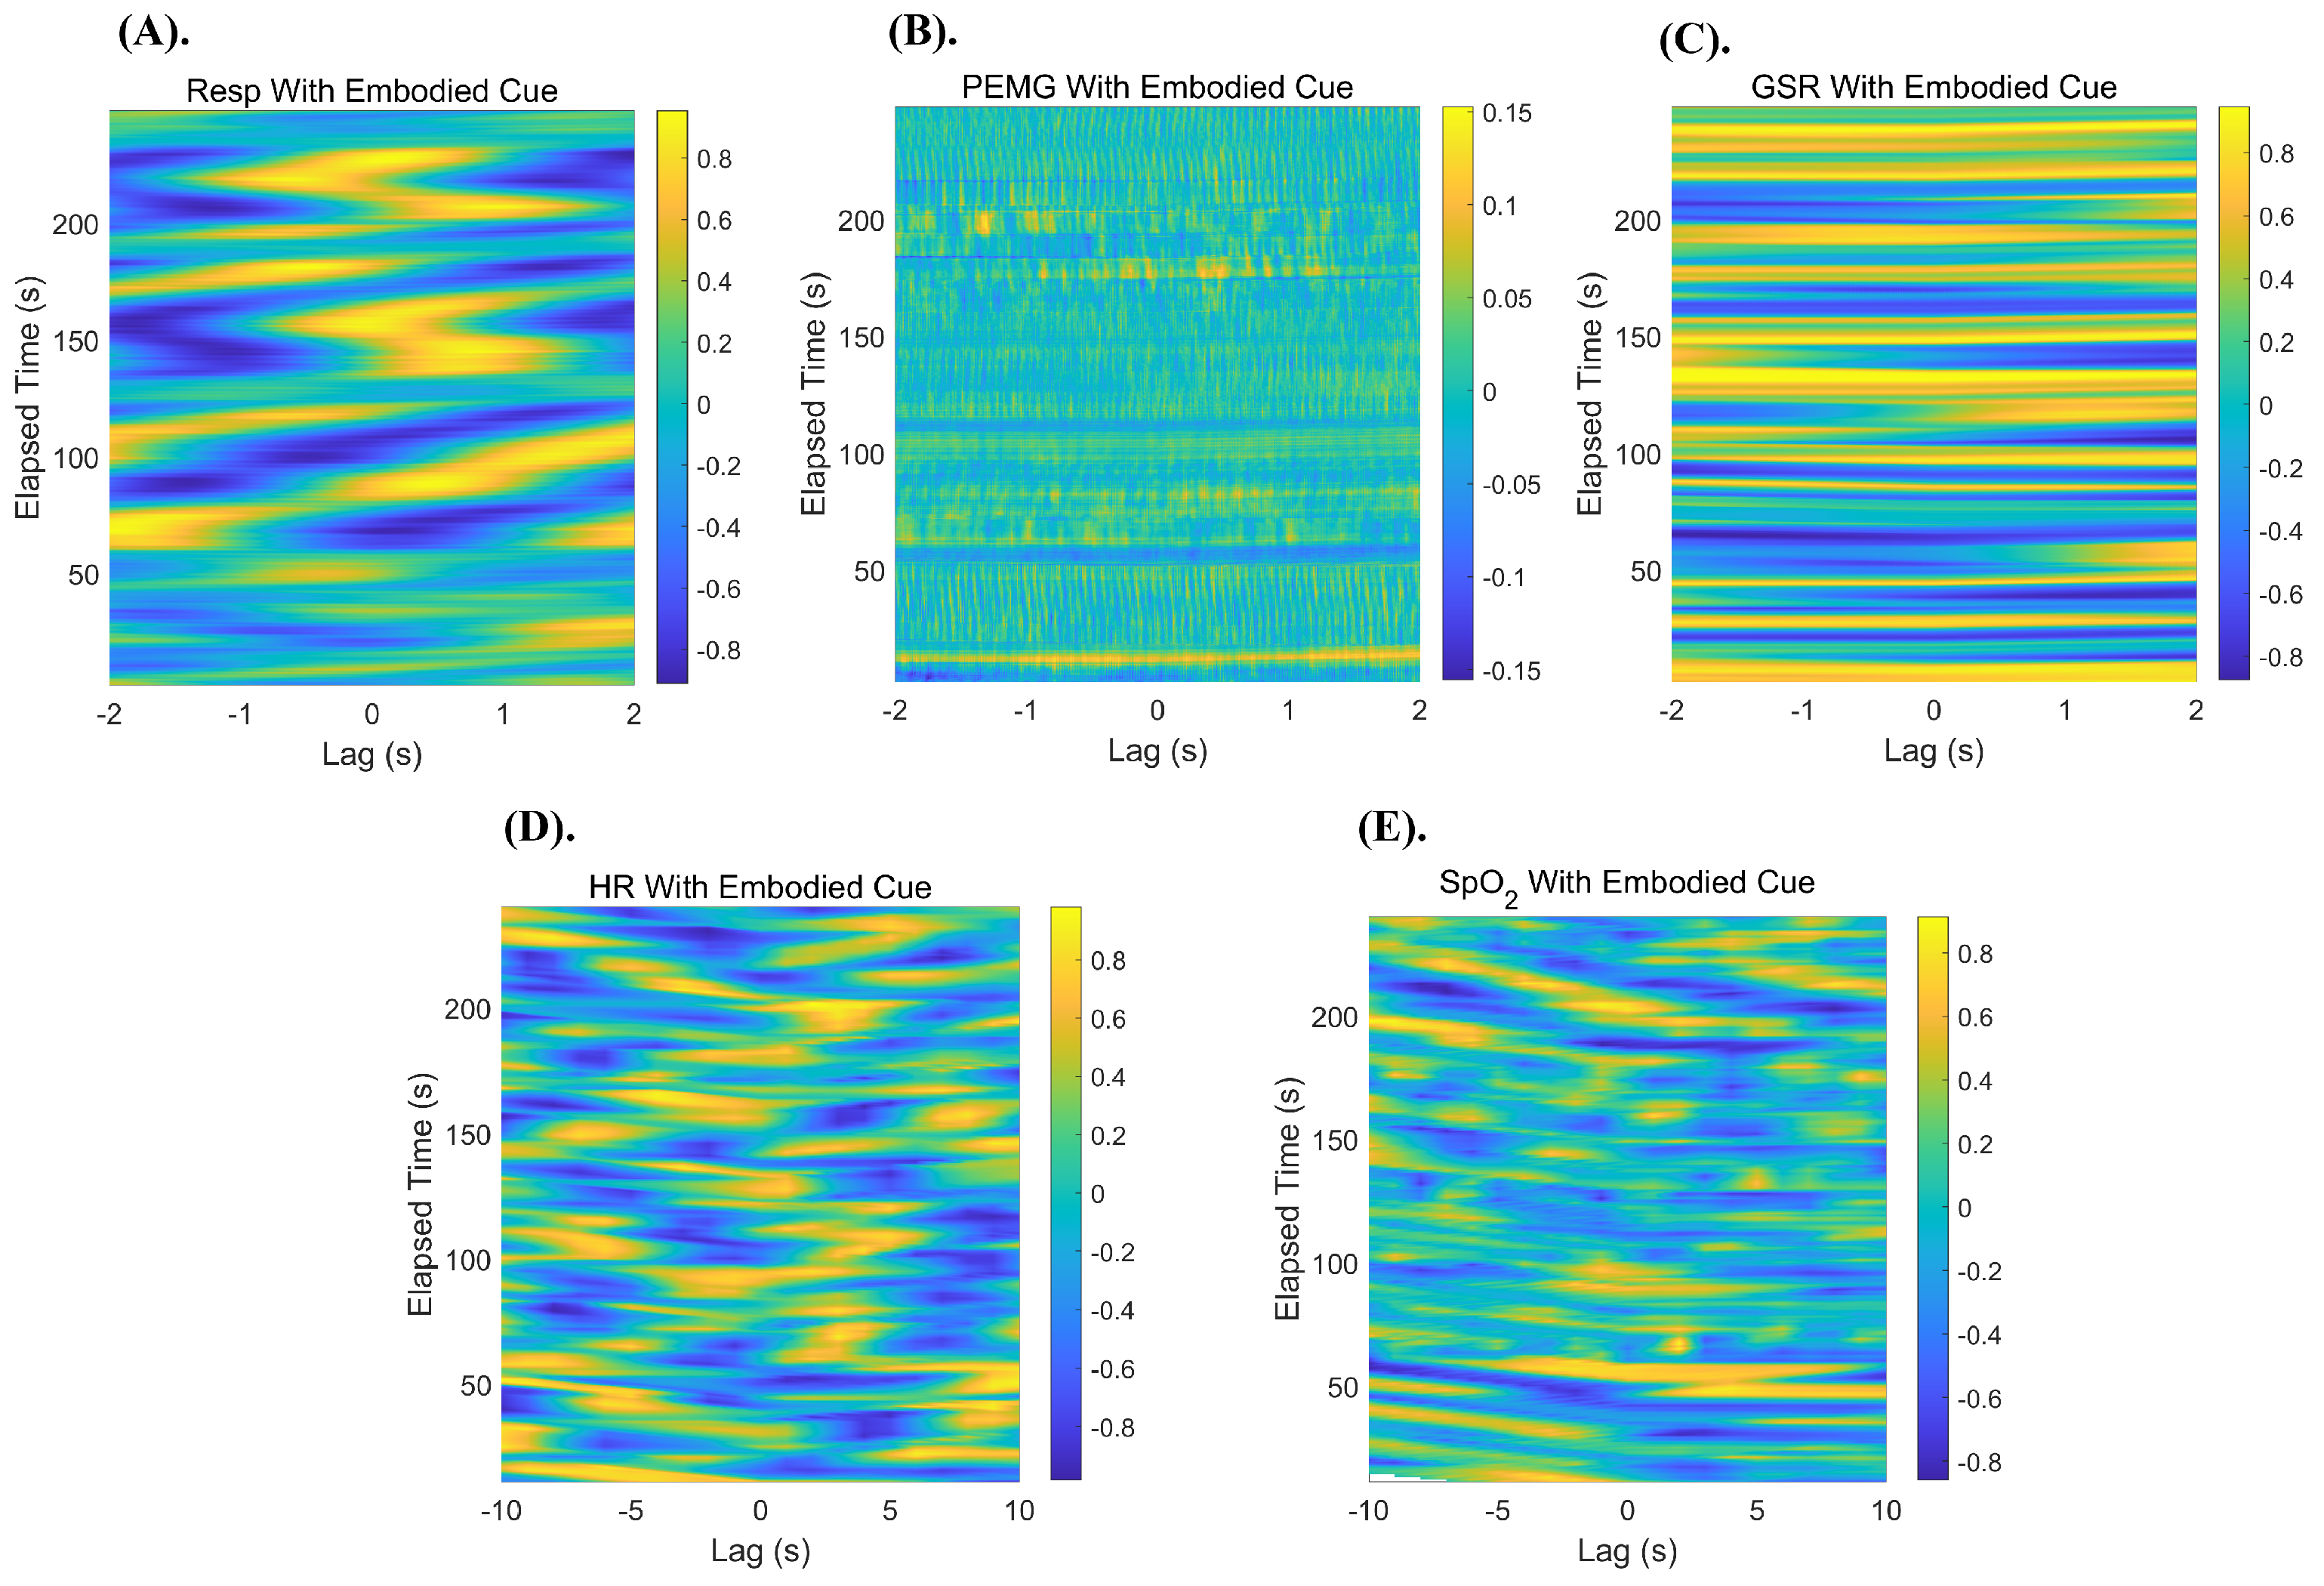
4.1. Quantitative Results
4.2. Qualitative Results
5. Discussion
5.1. Quantitative–Qualitative Response Gap
5.2. Multimodal, Hybrid Data Representations
5.3. Cognitive Empathy and Emotional Relatedness
5.4. Bidirectional Regulation Between Users and Biosignals
5.5. Individual Bias in Cognition and Media Use
6. Limitations and Future Work
7. Conclusions
Author Contributions
Funding
Institutional Review Board Statement
Informed Consent Statement
Data Availability Statement
Acknowledgments
Conflicts of Interest
References
- Wang, Y.; Dai, Y.; Chen, S.; Wang, L.; Hoorn, J.F. Multiplayer online battle arena (MOBA) games: Improving negative atmosphere with social robots and AI teammates. Systems 2023, 11, 425. [Google Scholar] [CrossRef]
- Wang, Y.; Gong, D.; Xiao, R.; Wu, X.; Zhang, H. A Systematic Review on Extended Reality-Mediated Multi-User Social Engagement. Systems 2024, 12, 396. [Google Scholar] [CrossRef]
- Breese, J.L.; Fox, M.A.; Vaidyanathan, G. Live Music Performances and the Internet of Things. Issues Inf. Syst. 2020, 21, 179–188. [Google Scholar] [CrossRef]
- Andrews, T.M. Concerts are canceled, so Coldplay, John Legend and Keith Urban are playing right in your living rooms. The Washington Post, 17 March 2020. [Google Scholar]
- Moreira, C.; Simões, F.P.; Lee, M.J.; Zorzal, E.R.; Lindeman, R.W.; Pereira, J.M.; Johnsen, K.; Jorge, J. Toward VR in VR: Assessing engagement and social interaction in a virtual conference. IEEE Access 2022, 11, 1906–1922. [Google Scholar] [CrossRef]
- Mystakidis, S. Metaverse. Encyclopedia 2022, 2, 486–497. [Google Scholar] [CrossRef]
- Shin, M.; Kim, S.J.; Biocca, F. The uncanny valley: No need for any further judgments when an avatar looks eerie. Comput. Hum. Behav. 2019, 94, 100–109. [Google Scholar] [CrossRef]
- Hepperle, D.; Purps, C.F.; Deuchler, J.; Wölfel, M. Aspects of visual avatar appearance: Self-representation, display type, and uncanny valley. Vis. Comput. 2022, 38, 1227–1244. [Google Scholar] [CrossRef] [PubMed]
- Curran, M.T.; Gordon, J.R.; Lin, L.; Sridhar, P.K.; Chuang, J. Understanding digitally-mediated empathy: An exploration of visual, narrative, and biosensory informational cues. In Proceedings of the 2019 CHI Conference on Human Factors in Computing Systems, New York, NY, USA, 4–9 May 2019; pp. 1–13. [Google Scholar] [CrossRef]
- Maloney, D.; Freeman, G.; Robb, A. A Virtual Space for All: Exploring Children’s Experience in Social Virtual Reality. In Proceedings of the CHI PLAY’20: The Annual Symposium on Computer-Human Interaction in Play, Virtual Event, 2–4 November 2020. [Google Scholar] [CrossRef]
- Hennig-Thurau, T.; Aliman, D.N.; Herting, A.M.; Cziehso, G.P.; Linder, M.; Kübler, R.V. Social interactions in the metaverse: Framework, initial evidence, and research roadmap. J. Acad. Mark. Sci. 2022, 50, 1295–1317. [Google Scholar] [CrossRef]
- Lee, S.; El Ali, A.; Wijntjes, M.; Cesar, P. Understanding and designing avatar biosignal visualizations for social virtual reality entertainment. In Proceedings of the 2022 CHI Conference on Human Factors in Computing Systems, New York, NY, USA, 29 April–5 May 2022; pp. 1–15. [Google Scholar] [CrossRef]
- Järvelä, S. Physiological Synchrony and Affective Protosocial Dynamics. Ph.D. Thesis, University of Helsinki, Helsinki, Finland, 2020. [Google Scholar] [CrossRef]
- Järvelä, S.; Cowley, B.; Salminen, M.; Jacucci, G.; Hamari, J.; Ravaja, N. Augmented virtual reality meditation: Shared dyadic biofeedback increases social presence via respiratory synchrony. ACM Trans. Soc. Comput. 2021, 4, 1–19. [Google Scholar] [CrossRef]
- Dar, S.; Bernardet, U. When Agents Become Partners: A Review of the Role the Implicit Plays in the Interaction with Artificial Social Agents. Multimodal Technol. Interact. 2020, 4, 81. [Google Scholar] [CrossRef]
- Salminen, M.; Järvelä, S.; Ruonala, A.; Harjunen, V.J.; Hamari, J.; Jacucci, G. Evoking Physiological Synchrony and Empathy Using Social VR with Biofeedback. IEEE Trans. Affect. Comput. 2019, 13, 746–755. [Google Scholar] [CrossRef]
- Behrens, F.; Snijdewint, J.; Moulder, R.; Prochazkova, E.; Sjak-Shie, E.; Boker, S.; Kret, M. Physiological synchrony is associated with cooperative success in real-life interactions. Sci. Rep. 2020, 10, 19609. [Google Scholar] [CrossRef] [PubMed]
- Algumaei, M.; Hettiarachchi, I.; Veerabhadrappa, R.; Bhatti, A. Physiological synchrony predict task performance and negative emotional state during a three-member collaborative task. Sensors 2023, 23, 2268. [Google Scholar] [CrossRef] [PubMed]
- Chanel, G.; Mühl, C. Connecting Brains and Bodies: Applying Physiological Computing to Support Social Interaction. Interact. Comput. 2015, 27, 534–550. [Google Scholar] [CrossRef]
- Robinson, R.B.; Rheeder, R.; Klarkowski, M.; Mandryk, R.L. “Chat Has No Chill”: A Novel Physiological Interaction for Engaging Live Streaming Audiences. In Proceedings of the 2022 CHI Conference on Human Factors in Computing Systems, New York, NY, USA, 29 April–5 May 2022; pp. 1–18. [Google Scholar] [CrossRef]
- Bulu, S.T. Place presence, social presence, co-presence, and satisfaction in virtual worlds. Comput. Educ. 2012, 58, 154–161. [Google Scholar] [CrossRef]
- Oh, H.J.; Bailenson, J.N.; Welch, G.F. A Systematic Review of Social Presence: Definition, Antecedents, and Implications. J. Comput.-Mediat. Commun. 2018, 23, 329–346. [Google Scholar] [CrossRef]
- Nowak, K. Defining and differentiating copresence, social presence and presence as transportation. In Proceedings of the Presence 2001 Conference, Philadelphia, PA, USA, 21–23 May 2001; Volume 2, pp. 686–710. [Google Scholar]
- Kreijns, K.; Xu, K.; Weidlich, J. Social Presence: Conceptualization and Measurement. Educ. Psychol. Rev. 2022, 34, 139–170. [Google Scholar] [CrossRef]
- Hétu, S.; Taschereau-Dumouchel, V.; Jackson, P.L. Stimulating the brain to study social interactions and empathy. Brain Stimul. 2012, 5, 95–102. [Google Scholar] [CrossRef]
- Felnhofer, A.; Kothgassner, O.D.; Hauk, N.; Beutl, L.; Hlavacs, H.; Kryspin-Exner, I. Physical and social presence in collaborative virtual environments: Exploring age and gender differences with respect to empathy. Comput. Hum. Behav. 2014, 31, 272–279. [Google Scholar] [CrossRef]
- Pimentel, D.; Kalyanaraman, S.; Lee, Y.H.; Halan, S. Voices of the unsung: The role of social presence and interactivity in building empathy in 360 video. New Media Soc. 2021, 23, 2230–2254. [Google Scholar] [CrossRef]
- Bailenson, J.N.; Blascovich, J.; Beall, A.C.; Loomis, J.M. Interpersonal Distance in Immersive Virtual Environments. Personal. Soc. Psychol. Bull. 2003, 29, 819–833. [Google Scholar] [CrossRef] [PubMed]
- James, T.W.; Potter, R.F.; Lee, S.; Kim, S.; Stevenson, R.A.; Lang, A. How Realistic Should Avatars Be? J. Media Psychol. 2015, 27, 109–117. [Google Scholar] [CrossRef]
- Roth, D.; Lugrin, J.L.; Galakhov, D.; Hofmann, A.; Bente, G.; Latoschik, M.E.; Fuhrmann, A. Avatar realism and social interaction quality in virtual reality. In Proceedings of the 2016 IEEE Virtual Reality (VR), Los Angeles, CA, USA, 19–23 March 2016; pp. 277–278. [Google Scholar]
- Steed, A.; Schroeder, R. Collaboration in immersive and non-immersive virtual environments. In Immersed in Media: Telepresence Theory, Measurement & Technology; Schroeder, R., Ed.; Springer: London, UK, 2015; pp. 263–282. [Google Scholar] [CrossRef]
- Appel, J.; von der Pütten, A.; Krämer, N.C.; Gratch, J. Does humanity matter? Analyzing the importance of social cues and perceived agency of a computer system for the emergence of social reactions during human-computer interaction. Adv. Hum.-Comput. Interact. 2012, 2012, 324694. [Google Scholar] [CrossRef]
- Morgan, C.T. Physiological Psychology; McGraw-Hill: New York, NY, USA, 1943. [Google Scholar]
- Bachrach, A.; Fontbonne, Y.; Joufflineau, C.; Ulloa, J.L. Audience entrainment during live contemporary dance performance: Physiological and cognitive measures. Front. Hum. Neurosci. 2015, 9, 179. [Google Scholar] [CrossRef]
- Bizzego, A.; Gabrieli, G.; Azhari, A.; Setoh, P.; Esposito, G. Computational methods for the assessment of empathic synchrony. In Progresses in Artificial Intelligence and Neural Systems; Springer: Singapore, 2020; pp. 555–564. [Google Scholar] [CrossRef]
- Mayo, O.; Lavidor, M.; Gordon, I. Interpersonal autonomic nervous system synchrony and its association to relationship and performance—A systematic review and meta-analysis. Physiol. Behav. 2021, 235, 113391. [Google Scholar] [CrossRef] [PubMed]
- Palumbo, R.V.; Marraccini, M.E.; Weyandt, L.L.; Wilder-Smith, O.; McGee, H.A.; Liu, S.; Goodwin, M.S. Interpersonal autonomic physiology: A systematic review of the literature. Personal. Soc. Psychol. Rev. 2017, 21, 99–141. [Google Scholar] [CrossRef]
- Kinreich, S.; Djalovski, A.; Kraus, L.; Louzoun, Y.; Feldman, R. Brain-to-brain synchrony during naturalistic social interactions. Sci. Rep. 2017, 7, 17060. [Google Scholar] [CrossRef]
- Tomashin, L.; Smith, J.; Brown, M. Physiological synchrony predicts group cohesion during collaborative tasks. J. Soc. Psychol. 2022, 35, 150–165. [Google Scholar]
- Markova, G.; Nguyen, T.; Hoehl, S. The role of synchrony in parent-infant bonding. Dev. Psychol. 2019, 55, 1075–1083. [Google Scholar] [CrossRef]
- Lumsden, J.; Miles, L.K.; Richardson, M.J. Prosocial orientation and interpersonal synchrony. J. Exp. Soc. Psychol. 2012, 48, 746–751. [Google Scholar] [CrossRef]
- Tschacher, W.; Rees, G.M.; Ramseyer, F. Synchrony during competitive and cooperative interactions. Front. Psychol. 2014, 5, 1323. [Google Scholar] [CrossRef]
- Järvelä, S.; Kätsyri, J.; Ravaja, N.; Chanel, G.; Henttonen, P. Intragroup emotions: Physiological linkage and social presence. Front. Psychol. 2016, 7, 105. [Google Scholar] [CrossRef] [PubMed]
- Järvelä, S.; Kivikangas, J.M.; Kätsyri, J.; Ravaja, N. Physiological linkage of dyadic gaming experience. Simul. Gaming 2013, 45, 24–40. [Google Scholar] [CrossRef]
- Moulder, R.G.; Boker, S.M. Windowed cross-correlation for the analysis of synchrony in time series data. J. Math. Psychol. 2018, 85, 89–99. [Google Scholar] [CrossRef]
- Delaherche, E.; Chetouani, M.; Mahdhaoui, A.; Saint-Georges, C.; Cohen, D. Interpersonal synchrony: A survey of evaluation methods across disciplines. IEEE Trans. Affect. Comput. 2012, 3, 349–365. [Google Scholar] [CrossRef]
- Jun, E.; McDuff, D.; Czerwinski, M. Circadian rhythms and physiological synchrony: Evidence of the impact on group creativity. Proc. ACM Hum.-Comput. Interact. 2019, 3, 1–18. [Google Scholar] [CrossRef]
- Raimondo, L.; Oliveira, L.A.F.; Heij, J.; Priovoulos, N.; Kundu, P.; Leoni, R.F.; van der Zwaag, W. Advances in resting state fMRI acquisitions for functional connectomics. NeuroImage 2021, 243, 118503. [Google Scholar] [CrossRef]
- Smitha, K.; Akhil Raja, K.; Arun, K.; Rajesh, P.; Thomas, B.; Kapilamoorthy, T.; Kesavadas, C. Resting state fMRI: A review on methods in resting state connectivity analysis and resting state networks. Neuroradiol. J. 2017, 30, 305–317. [Google Scholar] [CrossRef]
- Solberg, R.T.; Dibben, N. Peak experiences with electronic dance music: Subjective experiences, physiological responses, and musical characteristics of the break routine. Music Percept. Interdiscip. J. 2019, 36, 371–389. [Google Scholar] [CrossRef]
- Wikström, V.; Falcon, M.; Martikainen, S.; Pejoska, J.; Durall, E.; Bauters, M.; Saarikivi, K. Heart Rate Sharing at the Workplace. Multimodal Technol. Interact. 2021, 5, 60. [Google Scholar] [CrossRef]
- Oh, S.; Lee, J.-Y.; Kim, D.K. The Design of CNN Architectures for Optimal Six Basic Emotion Classification Using Multiple Physiological Signals. Sensors 2020, 20, 866. [Google Scholar] [CrossRef] [PubMed]
- Krumhansl, C.L. An exploratory study of musical emotions and psychophysiology. Can. J. Exp. Psychol. Can. Psychol. Exp. 1997, 51, 336. [Google Scholar] [CrossRef]
- Van Kerrebroeck, B.; Caruso, G.; Maes, P.J. A methodological framework for assessing social presence in music interactions in virtual reality. Front. Psychol. 2021, 12, 663725. [Google Scholar] [CrossRef]
- Curmi, F.; Ferrario, M.A.; Southern, J.; Whittle, J. HeartLink: Open broadcast of live biometric data to social networks. In Proceedings of the SIGCHI Conference on Human Factors in Computing Systems, Paris France, 27 April–2 May 2013; pp. 1749–1758. [Google Scholar]
- Merrill, N.; Cheshire, C. Trust your heart: Assessing cooperation and trust with biosignals in computer-mediated interactions. In Proceedings of the 2017 ACM Conference on Computer Supported Cooperative Work and Social Computing, Portland, OR, USA, 25 February–1 March 2017; pp. 2–12. [Google Scholar]
- Schnädelbach, H.; Rennick Egglestone, S.; Reeves, S.; Benford, S.; Walker, B.; Wright, M. Performing thrill: Designing telemetry systems and spectator interfaces for amusement rides. In Proceedings of the Sigchi Conference on Human Factors in Computing Systems, Florence, Italy, 5–10 April 2008; pp. 1167–1176. [Google Scholar]
- Tan, C.S.S.; Schöning, J.; Luyten, K.; Coninx, K. Investigating the effects of using biofeedback as visual stress indicator during video-mediated collaboration. In Proceedings of the SIGCHI Conference on Human Factors in Computing Systems, Toronto, ON, Canada, 26 April–1 May 2014; pp. 71–80. [Google Scholar]
- Slovák, P.; Janssen, J.; Fitzpatrick, G. Understanding heart rate sharing: Towards unpacking physiosocial space. In Proceedings of the SIGCHI Conference on Human Factors in Computing Systems, Austin, TX, USA, 5–10 May 2012; pp. 859–868. [Google Scholar]
- Walmink, W.; Wilde, D.; Mueller, F. Displaying heart rate data on a bicycle helmet to support social exertion experiences. In Proceedings of the 8th International Conference on Tangible, Embedded and Embodied Interaction, Munich, Germany, 16–19 February 2014; pp. 97–104. [Google Scholar]
- Lee, K.H.; Min, J.Y.; Byun, S. Electromyogram-based classification of hand and finger gestures using artificial neural networks. Sensors 2021, 22, 225. [Google Scholar] [CrossRef]
- Jaramillo-Yánez, A.; Benalcázar, M.E.; Mena-Maldonado, E. Real-time hand gesture recognition using surface electromyography and machine learning: A systematic literature review. Sensors 2020, 20, 2467. [Google Scholar] [CrossRef] [PubMed]
- Goshvarpour, A.; Abbasi, A.; Goshvarpour, A. An accurate emotion recognition system using ECG and GSR signals and matching pursuit method. Biomed. J. 2017, 40, 355–368. [Google Scholar] [CrossRef] [PubMed]
- Boker, S.M.; Xu, M. Windowed Cross-Correlation and Peak Picking for the Analysis of Variability in the Association Between Behavioral Time Series. Psychol. Methods 2002, 7, 338–355. [Google Scholar] [CrossRef]
- Braun, V.; Clarke, V. One size fits all? What counts as quality practice in (reflexive) thematic analysis? Qual. Res. Psychol. 2021, 18, 328–352. [Google Scholar] [CrossRef]
- Ylätalo, H. Empathy and EDA Synchrony in Virtual Reality Collaboration. Ph.D. Thesis, Helsinki University, Helsinki, Finland, 2022. [Google Scholar]
- Liu, F.; Kaufman, G.; Dabbish, L. The Effect of Expressive Biosignals on Empathy and Closeness for a Stigmatized Group Member. Proc. ACM Hum.-Comput. Interact. CSCW 2019, 3, 1–27. [Google Scholar] [CrossRef]
- Coan, J.A.; Sbarra, D.A. Social Baseline Theory: The Social Regulation of Risk and Effort. Curr. Opin. Psychol. 2015, 1, 87–91. [Google Scholar] [CrossRef]
- Hopstaken, J.F.; Van Der Linden, D.; Bakker, A.B.; Kompier, M.A.; Leung, Y.K. Shifts in attention during mental fatigue: Evidence from subjective, behavioral, physiological, and eye-tracking data. J. Exp. Psychol. Hum. Percept. Perform. 2016, 42, 878. [Google Scholar] [CrossRef]
- Souchet, A.D.; Philippe, S.; Lourdeaux, D.; Leroy, L. Measuring visual fatigue and cognitive load via eye tracking while learning with virtual reality head-mounted displays: A review. Int. J. Hum.- Interact. 2022, 38, 801–824. [Google Scholar] [CrossRef]
- Bækgaard, P.; Hansen, J.P.; Minakata, K.; MacKenzie, I.S. A fitts’ law study of pupil dilations in a head-mounted display. In Proceedings of the 11th ACM Symposium on Eye Tracking Research & Applications, New York, NY, USA, 25–28 June 2019; pp. 1–5. [Google Scholar] [CrossRef]
- Aardema, F.; O’Connor, K.; Côté, S.; Taillon, A. Virtual reality induces dissociation and lowers sense of presence in objective reality. Cyberpsychol. Behav. Soc. Netw. 2010, 13, 429–435. [Google Scholar] [CrossRef]
- Garvey, G. Dissociation: A natural state of mind? J. Conscious. Stud. 2010, 17, 139–155. [Google Scholar]
- Smith, A. Cognitive empathy and emotional empathy in human behavior and evolution. Psychol. Rec. 2006, 56, 3–21. [Google Scholar] [CrossRef]
- Jung, Y. Understanding the role of sense of presence and perceived autonomy in users’ continued use of social virtual worlds. J. Comput.-Mediat. Commun. 2011, 16, 492–510. [Google Scholar] [CrossRef]
- Bergström, J.; Knibbe, J.; Pohl, H.; Hornbæk, K. Sense of agency and user experience: Is there a link? ACM Trans. Comput.-Hum. Interact. TOCHI 2022, 29, 1–22. [Google Scholar] [CrossRef]
- Ryan, R.M.; Deci, E.L. Intrinsic and extrinsic motivations: Classic definitions and new directions. Contemp. Educ. Psychol. 2000, 25, 54–67. [Google Scholar] [CrossRef] [PubMed]
- Zeng, L. Designing the User Interface: Strategies for Effective Human-Computer Interaction by B. Shneiderman and C. Plaisant. Int. J. Hum.-Comput. Interact. 2009, 25, 707–708. [Google Scholar] [CrossRef]
- Tan, F.F.Y.; Ram, A.; Haigh, C.; Zhao, S. Mindful Moments: Exploring On-the-go Mindfulness Practice On Smart-glasses. In Proceedings of the 2023 ACM Designing Interactive Systems Conference, New York, NY, USA, 10–14 July 2023; pp. 476–492. [Google Scholar] [CrossRef]
- D’Errico, F.; Leone, G.; Schmid, M.; D’Anna, C. Prosocial virtual reality, empathy, and EEG measures: A pilot study aimed at monitoring emotional processes in intergroup helping behaviors. Appl. Sci. 2020, 10, 1196. [Google Scholar] [CrossRef]
- Parsons, T.D.; Gaggioli, A.; Riva, G. Extended reality for the clinical, affective, and social neurosciences. Brain Sci. 2020, 10, 922. [Google Scholar] [CrossRef] [PubMed]
- Arden, M.A.; Dye, L.; Walker, A. Menstrual synchrony: Awareness and subjective experiences. J. Reprod. Infant Psychol. 1999, 17, 255–265. [Google Scholar] [CrossRef]


Disclaimer/Publisher’s Note: The statements, opinions and data contained in all publications are solely those of the individual author(s) and contributor(s) and not of MDPI and/or the editor(s). MDPI and/or the editor(s) disclaim responsibility for any injury to people or property resulting from any ideas, methods, instructions or products referred to in the content. |
© 2025 by the authors. Licensee MDPI, Basel, Switzerland. This article is an open access article distributed under the terms and conditions of the Creative Commons Attribution (CC BY) license (https://creativecommons.org/licenses/by/4.0/).
Share and Cite
Gong, D.; Yan, H.; Wu, M.; Wang, Y.; Lei, Y.; Wang, X.; Xiao, R. Comparing Physiological Synchrony and User Copresent Experience in Virtual Reality: A Quantitative–Qualitative Gap. Electronics 2025, 14, 1129. https://doi.org/10.3390/electronics14061129
Gong D, Yan H, Wu M, Wang Y, Lei Y, Wang X, Xiao R. Comparing Physiological Synchrony and User Copresent Experience in Virtual Reality: A Quantitative–Qualitative Gap. Electronics. 2025; 14(6):1129. https://doi.org/10.3390/electronics14061129
Chicago/Turabian StyleGong, Daojun, Haoming Yan, Ming Wu, Yimin Wang, Yifu Lei, Xuewen Wang, and Ruowei Xiao. 2025. "Comparing Physiological Synchrony and User Copresent Experience in Virtual Reality: A Quantitative–Qualitative Gap" Electronics 14, no. 6: 1129. https://doi.org/10.3390/electronics14061129
APA StyleGong, D., Yan, H., Wu, M., Wang, Y., Lei, Y., Wang, X., & Xiao, R. (2025). Comparing Physiological Synchrony and User Copresent Experience in Virtual Reality: A Quantitative–Qualitative Gap. Electronics, 14(6), 1129. https://doi.org/10.3390/electronics14061129