Article

Trandroid: An Android Mobile Threat Detection System Using Transformer Neural Networks

Department of Computer Science and Information Technology, University of the District of Columbia, Washington, DC 20008, USA
*
Author to whom correspondence should be addressed.
Electronics 2025, 14(6), 1230; https://doi.org/10.3390/electronics14061230
Submission received: 8 February 2025 / Revised: 12 March 2025 / Accepted: 17 March 2025 / Published: 20 March 2025

Abstract

:
In recent years, Android malware have been evolving and becoming more sophisticated at an alarming rate, highlighting the need for robust and evolving detection schemes. Despite the popularity of artificial intelligence-based approaches, they still struggle to generalize for various reasons. For instance, due to the reliance on handcrafted features for the machine learning approaches and the dependence on static datasets for the case of deep learning. In this paper, we bridge this gap by proposing Trandroid, an approach to detect diverse and real-world attack patterns targeting Android using transformers. This approach represents a major extension of our previous research to tackle this problem by developing a transformer-based Android attack detection system using the TUANDROMD dataset. Our choice of TUANDROMD was motivated by its wide coverage of Android attacks, support for metadata, and usage of feature extraction that makes it a good choice to build a holistic threat detection for Android using advanced AI models. We achieved a high accuracy rate of 99.25% with our state-of-the-art transformer model compared to the other classifiers we developed for comparison purposes, including Recurrent Neural Networks (RNNs), the Gated Recurrent Units (GRUs), Convolutional Neural Networks (CNNs), Long-Term Short-Term Memory (LSTM), and the hybrid CNN-LSTM model. Our Trandroid model also outperforms other approaches in the literature, considering all the performance indicators we used. These findings indicate the effectiveness of transformers in dealing with the evolving nature of Android malware and their promising potential for real-world deployment in mobile platforms.

1. Introduction

Since their invention, mobile devices have revolutionized how people interact with technology, leading to their widespread global adoption. Since their user base is expanding at an exponential rate, mobile devices have become an indispensable part of our lives. According to a Statista estimate, there were about 6.6 billion smartphone mobile network subscribers globally in 2022, projected to reach 7.8 billion by 2028 [1]. Even so, when these gadgets communicate with third-party applications, a number of security and privacy problems surface, and different kinds of malware spread. These days, several domains, such as banking, social networking, business, education, and communication, widely use mobile apps. Large volumes of extremely sensitive data are generated and readily accessible as a result of this widespread use. This presents an opportunity for malicious applications that target mobile devices by launching several cyber attacks against them. One of the main reasons that rendering Android more vulnerable to different kinds of cyber attacks is its open source operating system and the ability to download third-party apps with relative ease [2], making the situation even more complex.
Since the Android operating system is now the most popular mobile operating system worldwide, there has been a steady increase in the quantity of malware targeting Android applications [3]. Malware frequently targets Android due to its openness and dominance in the operating system market. Attacks of this nature have the potential to seriously damage data, leading to national security risks, information theft, data leaks, file destruction, and terrorist activity [4]. As per the 2019 Nokia Threat Intelligence Report, malware attacks on Android smartphones are more common than those on other operating systems. The report has indicated that 47.15% of malware attacks targeted Android devices compared to Windows with an equivalent percentage of 36%, the Internet of Things (IoT) with 16%, and iOS with less than 1%, representing the lowest percentage [5].
While traditional defense mechanisms such as intrusion detection systems, firewalls, and antivirus software, have been developed, they fall short in adapting to the dynamic and ever-evolving nature of Android. For instance, in 2012, Google released Bouncer, a security application used to restrict the rights that different applications can ask for [3]. However, applications obtained from a different third-party source, continued to pose a risk of downloading malicious software. Third-party sources are not under the jurisdiction of the Android operating system.
As far as solutions based on machine learning and deep learning to detect and classify Android malware go [6], their ability to generalize across diverse and evolving threats is put into question. In fact, these approaches [7,8] generally tend to use handcraft features and static datasets that do not have the capability to deal with the dynamic nature of modern Android threats. Therefore, when faced with novel attack patterns or highly imbalanced datasets, their performance would be diminished. To bridge this gap, we propose Trandroid, a transformer-based model designed to enhance Android threat detection by leveraging the unique features of transformers. In fact, due to the use of multi-head attention, it has the capacity to not only capture the long-range dependencies but to also process them in parallel, unlike traditional models such as RNNs or CNNs. This would be of great advantage if it is used in the context of threat detection in Android, since malware behavior may vary in time and context. Trandroid is a major extension of our previous work [9] and was thus created with the goal of proving the superiority of transformer-based models for Android threat detection while proposing a unique model that adapts the architecture for a wide category of threats.
In a nutshell, Trandroid relies on transformers, more specifically, their multi-head attention mechanism, to detect Android mobile threats. However, we also developed five other deep learning classifiers, namely RNN, GRU, CNN, LSTM, and hybrid CNN-LSTM for comparison. What is more, due to ever-evolving nature of Android attacks, we choose to use the TUANDROMD dataset for the evaluation process, since it is a recent dataset comprising newer attacks. Our initial hypothesis was that the transformer model would be the best fit to achieve our goals was supported by an outstanding performance assessment showing promise of success.
The contributions of our Trandroid solution can be summarized as follows:
  • We developed cutting-edge transformer-based models specifically designed to tackle Android attacks, achieving superior performance on the TUANDROMD dataset. Our model outperformed commonly used classifiers in the literature, including CNNs, LSTMs, GRUs, and others, across all evaluation metrics.
  • We conducted an extensive comparison of six deep learning classifiers, demonstrating that our transformer-based model consistently outperformed all other methods in terms of detection accuracy and robustness.
  • We employed the TUANDROMD dataset, a more recent but smaller dataset compared to others in the field. Despite its small size, it captures a wide array of evolving threats targeting Android, making it particularly relevant for addressing the dynamic nature of Android malware.
The rest of the paper is organized as follows. Section 2 sheds light on the related work. Section 3 describes the different categories of attacks targeting Android operating systems. Section 4 describes the methodology we followed to design our solution. Section 5 presents and discusses the results we obtained during the conducted experiments. Section 6 discusses the limitations of our work and potential future research directions, while Section 7 concludes the paper and discusses our future work.

2. Related Work

To combat mobile threats, Huang et al. [10] proposed a fraud detection system. As part of their strategy, they developed two detection systems that could identify fraudulent calls and misleading online advertisements. With an accuracy rate of 85%, their scam call detection system achieved its highest accuracy with a Deep Neural Network model. They gathered 1500 unknown calling data from user feedback and 150,000 advertising URLs from the Internet, based on their back-end system and user base, in order to complete this mission. Their deceptive ad identification system performed best when it used the Inception-V3 model and recorded a 90% accuracy rate.
Sandeep [11] proposed an Android malware detection using a deep learning algorithm, which he described as a unique humanoid malware detection framework. For this purpose, he collected benign applications from the Google Play Store, and various other platforms, and malicious applications from VirusShare. Then, he built a deep learning algorithm based on specific parameters, such as the number of neurons and layers, activation function, and optimizers. During the experimental result, the proposed model successfully achieved an accuracy rate of 94.64%.
Mohammed et al. [12] proposed a mobile botnet detection system utilizing transfer learning. Their solution relies on image-based Android malware detection. The authors collected a Manifest dataset based on two Android application packages comprising the manifest from ISCX Android Botnet 2015 and downloaded DEX files. Using the MobileNetV2 model on the Manifest dataset and the ResNet101 model on the DEX images, they obtained an accuracy rate of 91% and 90%, respectively, in the six pre-trained CNN models including MobileNetV2, RestNet101, VGG16, VGG19, InceptionRestNetV2, and DenseNet121.
Fika et al. [13] proposed a single-view and multi-view learning algorithm system to fight Android malware. Their model relies on the LSTM model for processing system calls and a Multi-Layer Perceptron (MLP) model for processing permissions. In the single-view deep learning architecture, each feature was dealt with separately by the model. However, in multi-view deep learning, features are processed on a concatenated model using the concatenate function. Their best result came from the multi-view model that successfully achieved an accuracy rate of 82%.
Feng et al. [14] suggested using deep learning methods to create a performance-sensitive mobile malware identification system. As part of their strategy, they developed a technology they named MobiTive, which could identify mobile malware on both server and device sides. They collected their information from five distinct datasets (Drebin, Genome, VirusShare, Contagio, and Pwnzen). The dataset were relatively old though, with the newest one dating from 2014. They also performed threat classification using a variety of deep learning techniques, including CNNs, LSTMs, BiLSTMs, and others. Their Bi-GRU model produced the best results, with an accuracy of 96.78%.
Watkins et al. [15] developed a security risk identifier for corporate mobile devices known as Bring Your Own Device (BYOD). The authors claimed they were able to develop a detection system that can identify both known and unknown malware. They attempted to create the data themselves in seven different steps during their first experiment as follows: (1) tcpdump is used to capture network traffic; (2) a genuine or malicious Android application is loaded on the smartphone; (3) the Monkey testing tool is launched on the device emulating human interaction with the smartphone through the ADB shell; (4) the tcpdump program records network traffic while the ping tool reaches out to the smartphone 100 times at a pace of 10 ms; (5) the smartphone’s application, whether malicious or genuine, is removed; (6) the tcpdump session ends and is saved to a pcap file; (7) the response time is recorded and stored from the pcaps. These seven processes were repeated 122 times for malicious apps and 96 times for genuine apps. Using the generated data, deep learning models were then applied in the second experiment. With the Multi-Layer Perceptron (MLP) model, they were able to achieve an accuracy of 83.5%.
Sachith et al. [16] proposed a self-supervised approach, titled SHERLOCK, using a vision transformer model to tackle the issue of mobile malware detection. In fact, using the MalNet dataset, released in 2021, which is presumably the largest publicly available cybersecurity image database, they applied the Vision Transformer-Based (ViT-Base) architecture to encode and decode their input data. Their model contained 12 encoding layers and 4 decoding layers. With their proposed model, they recorded a high accuracy rate of 97% on their highly imbalanced dataset.
Saracino and Simoni [17] proposed an Android malware detection approach based on Bidirectional Encoder Representations from transformers (BERTs) and the graph representation of applications. Each application is represented by a graph depicting the interaction between its key components. Their approach learns the contextual dependencies between these components by leveraging the tokenization and embedding that BERTs provide. They achieved an accuracy of 97.62% based on a dataset extracted from Drebin.
Almakayeel [18] proposed a transformer-based approach focusing on detecting Android malware in the Internet of Vehicles (IoV). They leveraged Z-score normalization during pre-processing, binary gray wolf optimization for feature selection, a transformer model integrated with RNN and softmax for the malware classification and snake optimizer algorithm for hyper-parameter tuning. They conducted extensive experiments that led to a 99.26% accuracy.
Sun et al. [19] proposed a transformer model for detecting malicious traffic in Android communication. Their approach on extracting features from packet flows before feeding them into the model pipeline for classification. The series of experiments they conducted led to an accuracy of 95.54%.
Wasif et al. [20] proposed a hybrid model based on CNNs and ViTs to detect Android malware. Their approach converts network traffic to images that are further analyzed using both deep learning models. The CNN is used to learn local relationships while the ViT is used to learn the global ones. They conducted fine-tuning to determine the optimal image size for achieving the accuracy rate, which reached 99.61%.
Even though these studies achieve significant advancements in Android malware detection, they do have several shortcoming opening critical gaps, as show in Table 1. For instance, Ref. [10] focuses on specific fraud detection tasks with custom datasets, while Refs. [11,12] target individual threat types, such as botnets, using traditional deep learning approaches and limited feature sets. Other researchers, for example, in Refs. [13,14], lacked comprehensive metadata and generalization to evolving threats. Sachith et al. [16] presented an approach based on a vision transformer with the MalNet dataset, achieving high accuracy on image-based malware detection. However, this operates on a highly imbalanced dataset and is limited to image representations, neglecting broader feature diversity. Saracino and Simoni [17] proposed an approach for detecting Android malware by representing Android applications into a token structure. However, this is based on graph construction which may incur a computational overhead and may not generalize well to evolving malware. Almakayeel [18] proposed a transformer approach for IoV malware based on a dataset extracted from Drebin. However, its limited scope makes it less applicable to general Android security. Sun et al. [19] proposed a transformer model to detect malicious communication in Android network traffic using a custom dataset. However, their approach lacks input of valuable application metadata such as API calls and permissions. Wassif et al. [20] proposed a hybrid model leveraging CNNs for local feature extraction and the ViT for global pattern recognition. However, their reliance on image-based representation may lose important semantic relationships between key features.
In contrast, our proposed approach utilizes the Tuandromd dataset, which encompasses a wide array of Android malware families, diverse metadata, and real-world attack samples. Thanks to our innovative transformer-based architecture, our method leverages the self-attention mechanism to capture intricate relationships in the data, ensuring scalability and adaptability to emerging threats. This holistic and feature-diverse framework addresses the shortcomings of prior works, paving the way for a robust Android threat detection system.

3. Characterization of Android Malware

Any code that has the potential to endanger a user, their data, or a device is by definition a malware. There are several types of malware that target Android applications [21] as follows:

3.1. Backdoor

Backdoors enable unauthorized, and sometimes hazardous, remote-controlled actions to be carried out on a device. They enable the attacker to take over the system’s resources, explore the network, and install various malware programs.

3.2. Billing Fraud

This is a piece of code that fraudulently bills the user. There are three types of mobile billing frauds as follows:
  • SMS fraud: A malicious code that tries to hide its SMS activities by obscuring the disclosure agreements or SMS messages from the cellular operator informing the user of charges or confirming subscriptions, or sends premium SMS without the user’s knowledge.
  • Call fraud: A malicious code that charges customers by making unsolicited calls to premium lines.
  • Toll fraud: A malicious code that tricks users into subscribing to or purchasing content via their mobile phone bill.

3.3. Stalkerware

These are programs that, without sufficient notification or consent, gather and/or transfer sensitive or confidential user data from a device without providing a permanent alert. By tracking and transmitting private or sensitive user data, or by making it available to third parties, stalkerware prey on device users.

3.4. Denial of Service (DoS)

In the context of mobile phones, a DoS attacks entails several patterns of disruptive behavior targeting the availability aspect of a device’s resources. This includes, but is not limited to, blocking the user from accessing the camera, preventing any new application from being installed, and making applications unresponsive.

3.5. Hostile Downloaders

While it does not directly pose a risk to users, it can download other potentially harmful applications without the users’ knowledge or permission.

3.6. Phishing

A Phishing attack poses as a reliable source before asking for the user’s billing or login details; then, it transfers the information to an external third party. Applications that intercept user credentials as they are being transmitted fall under this category as well. Credit card numbers, online account credentials for social networks and gaming, and banking credentials are common phishing targets.

3.7. Elevated Privilege Abuse

By breaching the application sandbox, the acquisition of elevated privileges, and the modification or restriction of access to essential security-related features, these programs undermine the integrity of the system.

3.8. Ransomware

It mandates that the user pays a fee or carries out an action in order to relinquish control over a device or its contents, either as a whole or partially. Certain types of ransomware encrypt data on the device and require payment in order to unlock it.

3.9. Spyware

It is a malicious program that sends personal information off the device without permission or sufficient notification. The majority of spyware programs ask for permission to access the user’s contact list, pictures, or other non-owned files on the SD card.

3.10. Trojan

It is a malicious program that poses as benign, for example, as a game, and makes false statements about its intentions while acting maliciously. Trojans are typically employed in conjunction with other application categories that have the potential to be dangerous.

4. Proposed Methodology

Our proposed Trandroid approach relies on transformers to assess the likelihood of an Android application being malicious or not. We chose to utilize the TUANDROMD dataset in order to corroborate our findings. This choice is justified by the fact that the dataset is newer compared to the popular ones in use and considering that Android attacks keep evolving every day. First, we describe the methodology we used while creating our Trandroid approach. Then, we shed light on the technical details of our transformer classifier, in addition to the several other classifiers we developed for comparison purposes.

4.1. Trandroid Overview

An overview of our methodology is shown in Figure 1. After cleaning and pre-processing the dataset, we divided the dataset into training and testing, following a 70–30% split, before applying the transformer classifier along with the other developed deep learning classifiers. Our choice for a 70–30% split was to ensure a balanced trade-off between model training and evaluation robustness. A 30% test set would allow a more comprehensive evaluation while reducing over-fitting concerns. Finally, we collected a variety of performance indicators to assess the effectiveness of our Trandroid approach. In the ensuing subsections, we will walk through the many technical aspects of our process.

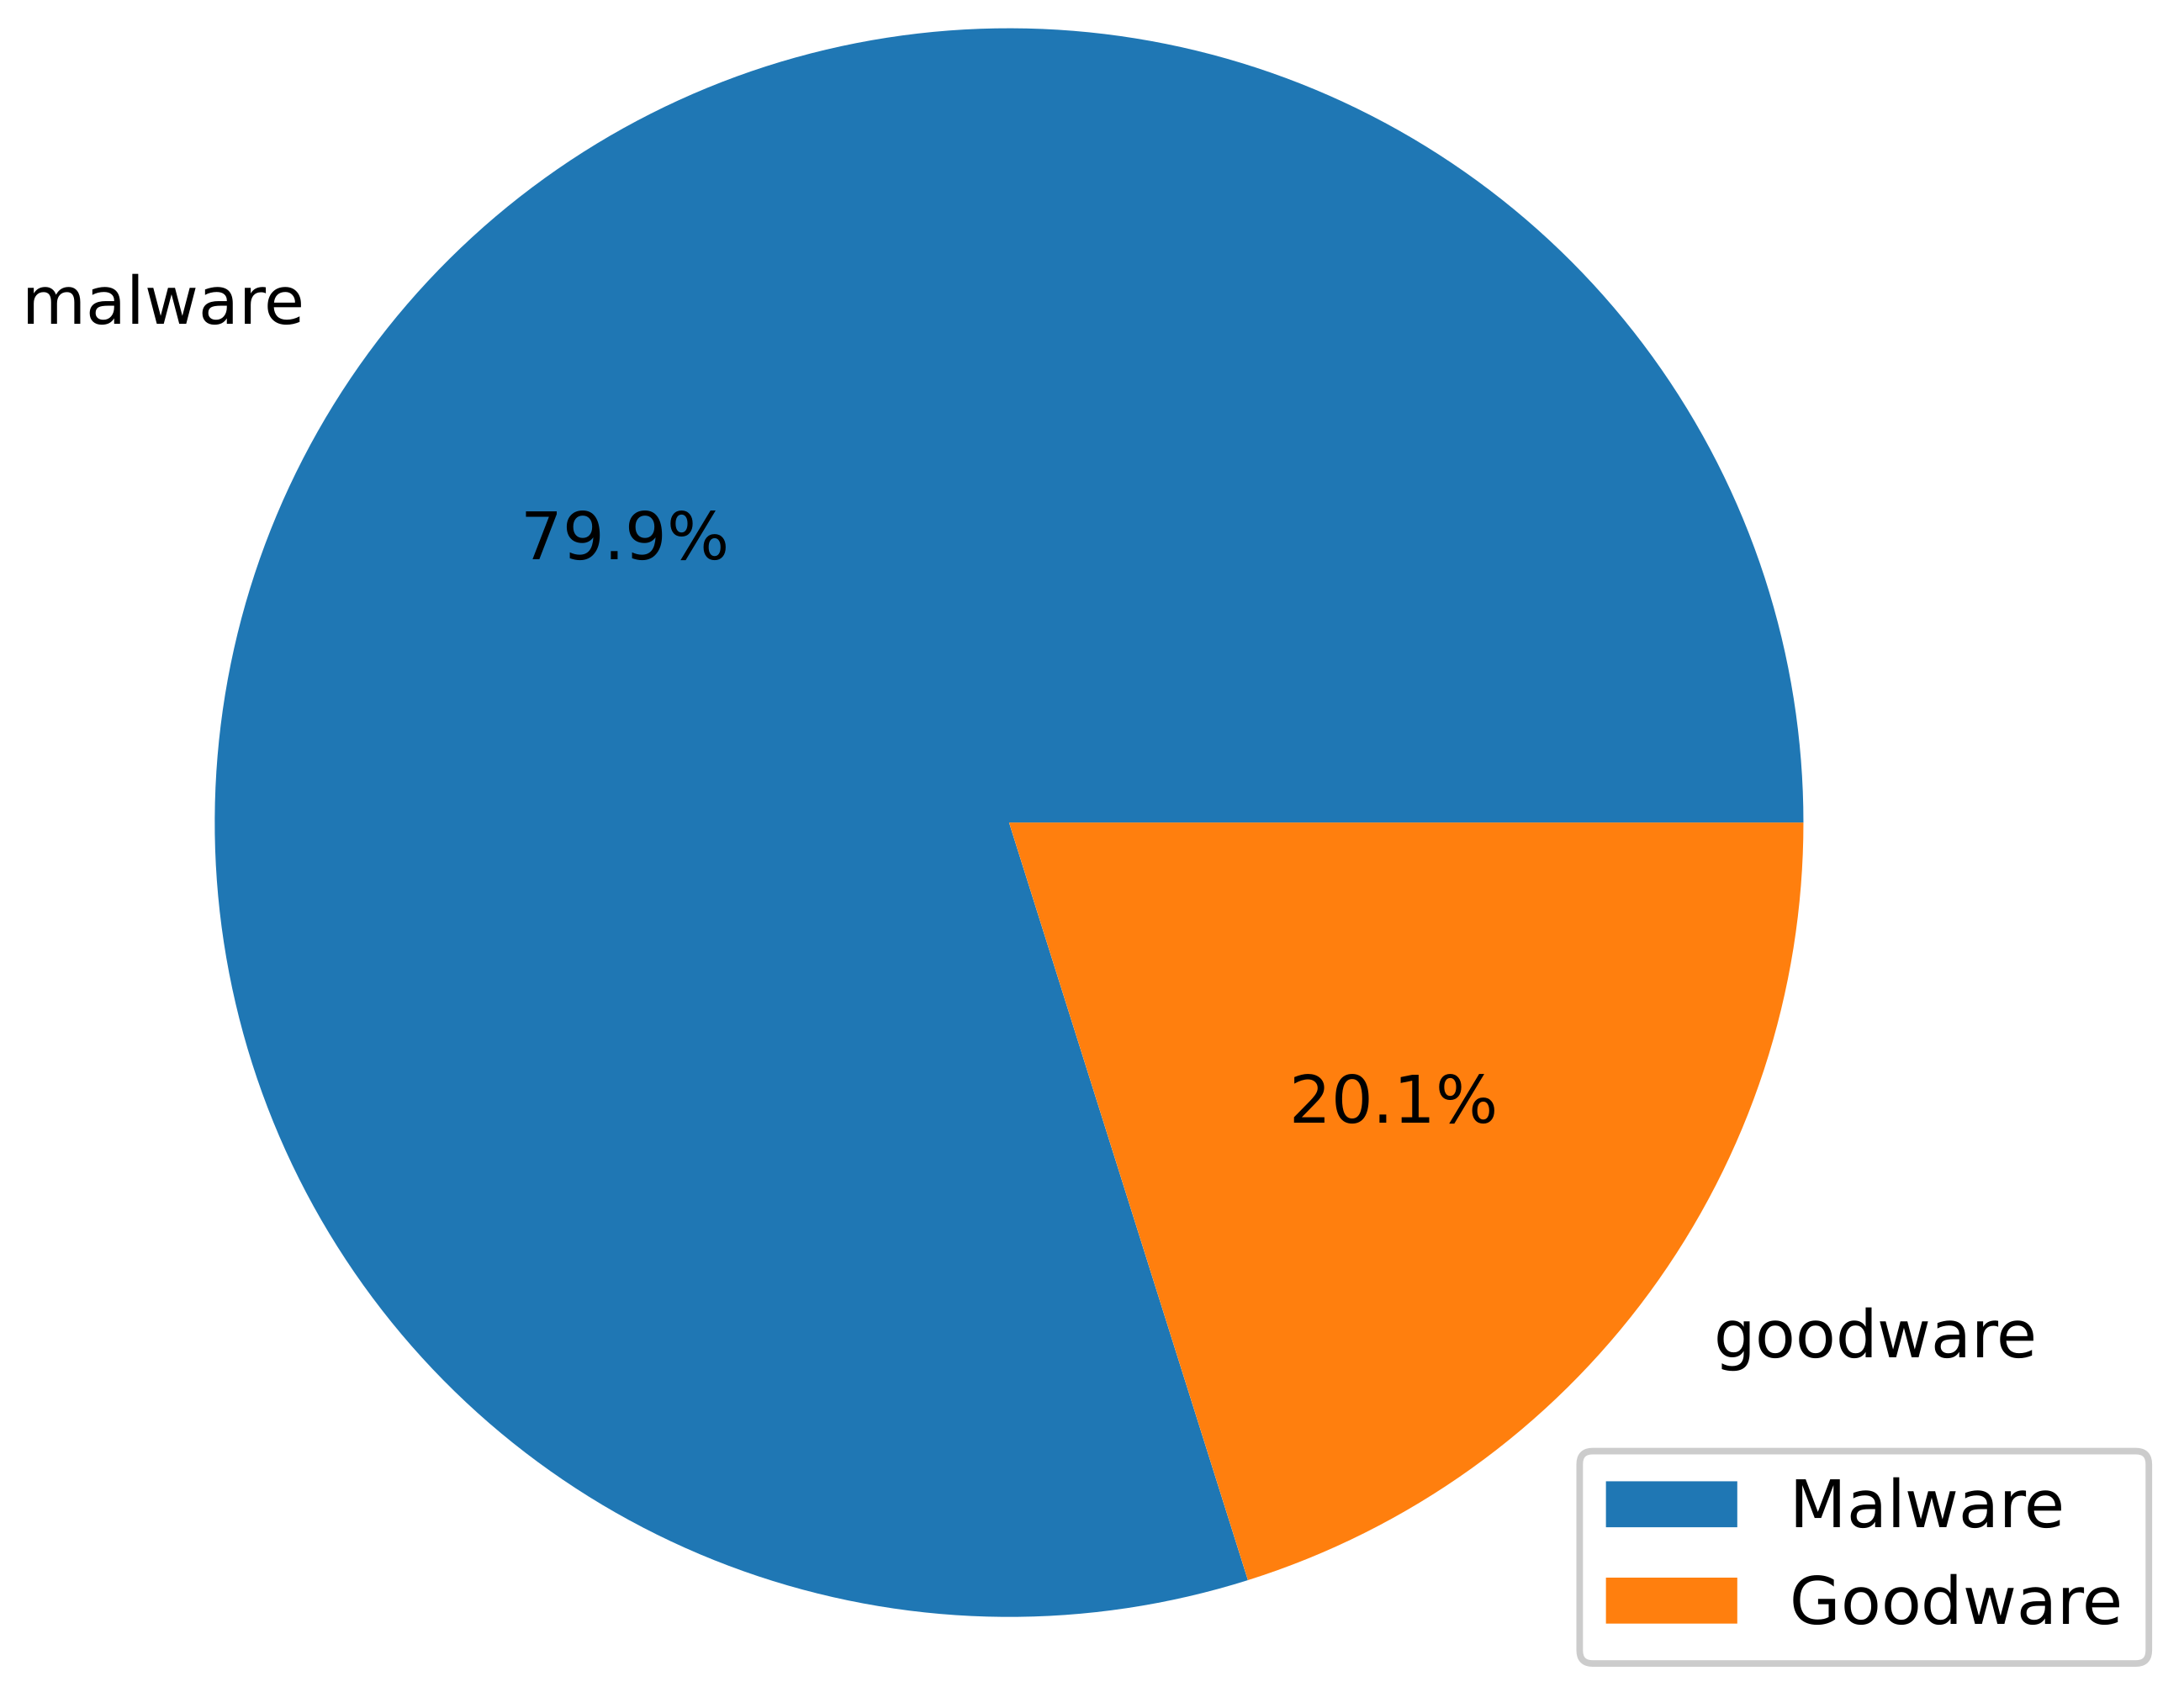
4.2. The TUANDROMD Dataset

The TUANDROMD dataset is an Android malware dataset that was developed by Borah et al. [22] in 2020, and it was inspired by their previous work on generating a Windows Malware Dataset to detect anomalies on Windows computers. The entire process of the TUANDROMD dataset creation framework is divided into three main phases as follows: data collection, data analysis, and feature extraction.
The authors used both benign applications and raw malware in order to create a featured dataset of Android malware. They gathered 24,553 raw malware binaries, for this purpose, from the work that was completed by their colleagues, Wei et al. [23]. Among the 71 malware families, these malware binaries were further divided into 135 variants that capture most of the Android malware described in Section 3. They also collected the top 1000 Android apps that were safe to use from Google Play. Finally, every Android application that has been gathered was kept on a database server for additional processing and examination. Table 2 maps some of the most popular malware taken from this dataset into the malware types identified in Section 3. The authors manually analyzed the gathered Android malware using a collection of tools, including Androgard, ApkInspector, ApkAnalyser, and Smali-CFGs, in contrast to PC-based malware analysis. They took into account every malware variation within each family for analysis. Every analysis assignment was completed in a solitary setting.
Our choice of Tuandromd over another dataset can be summarized as follows: First, the wide coverage of literally all possible android attacks makes it possible to develop a holistic Android threat detection model instead of focusing on specific attacks. Second, the dataset has a comprehensive and up-to-date representation of real-world Android threats, since it includes 71 malware families that were collected from various sources, capturing the evolving nature of Android threats. Third, the dataset supports a variety of metadata, and the use of feature extraction lays the foundations for developing advanced AI models.
In addition, when compared to other popular datasets, TUANDROMD stands out due to the following reasons. Drebin, for instance, is a quite large dataset with 5590 malicious applications from 179 malware families that were collected from 2010 to 2012, which makes it outdated and does not reflect the latest threat landscape. The same can be said about Genome, which comprises 1260 malware samples from 49 malware families collected before 2012. Contagio also fails to provide a wide variety of Android malware, thus lacking systematic categorization. Moreover, as highlighted in Taheri et al. [24], relying on outdated datasets—which have a limited scope and lack recent data, such as Drebin, Contagio, and Genome—may lead to the underlying models being exposed to adversarial threats. TUANDROMD addresses these concerns by providing a more recent and diverse dataset, thus enhancing the robustness and reliability of the model.

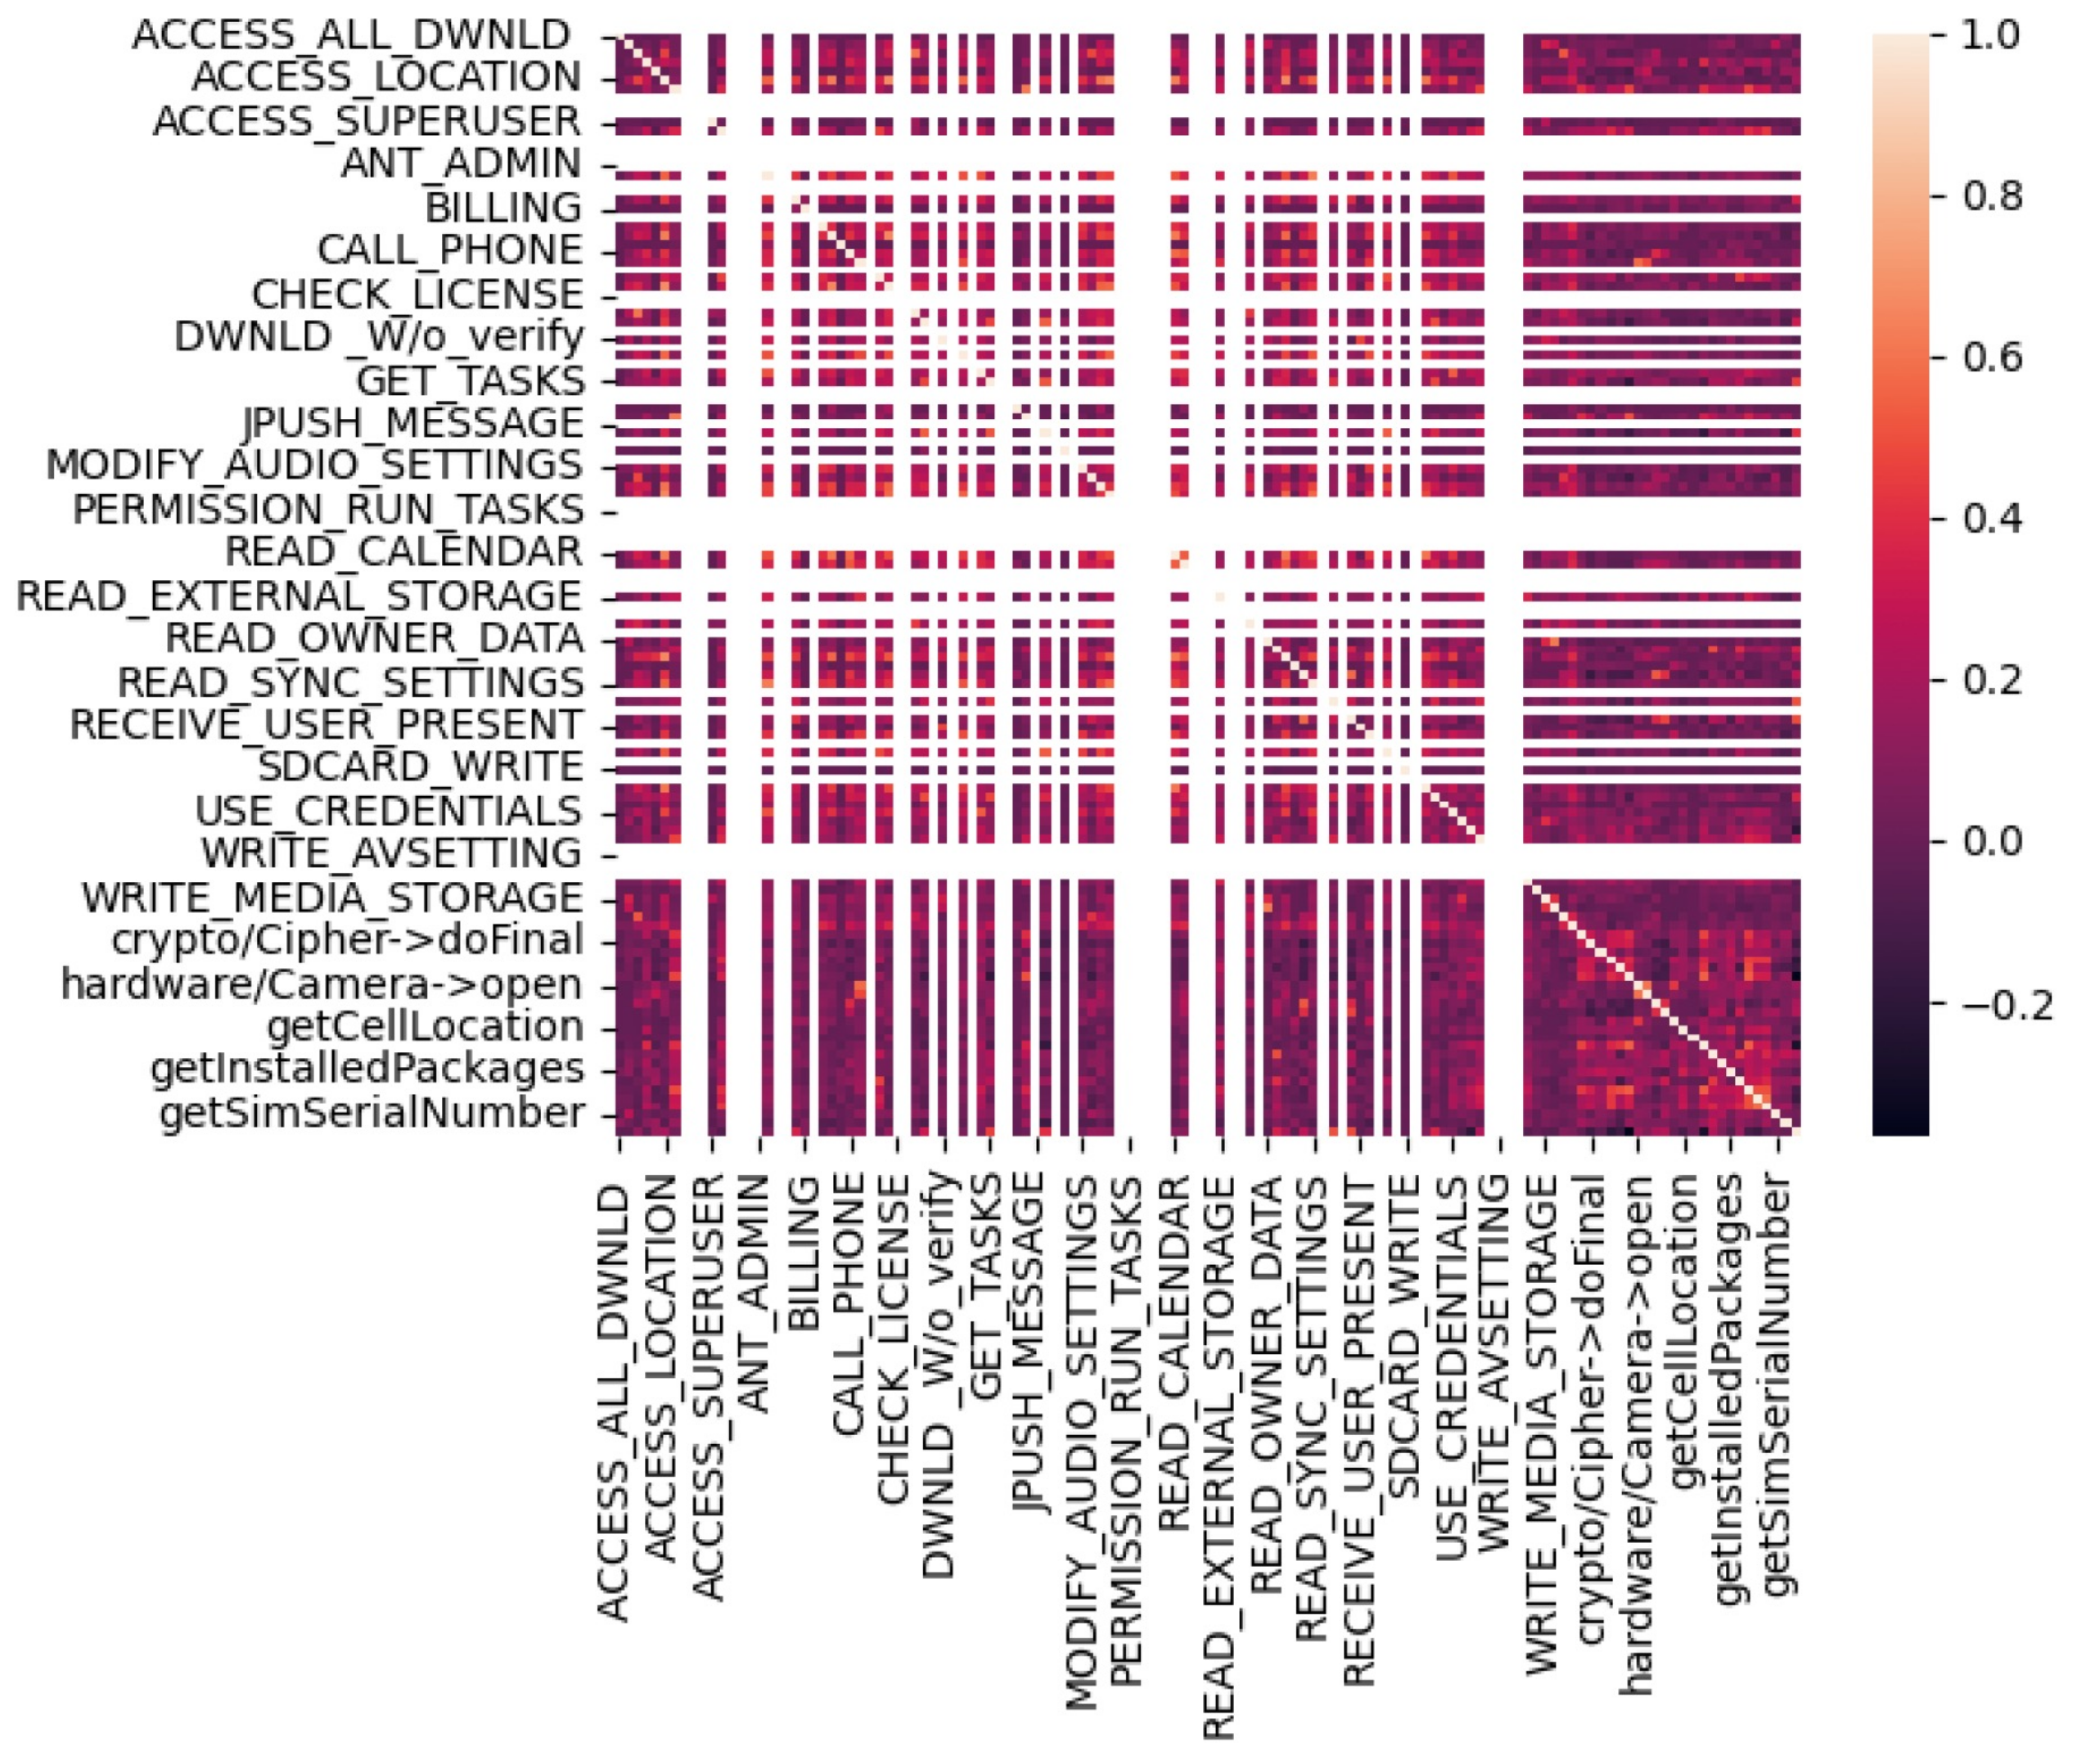
4.3. Feature Extraction

Permission-based and Application Programming Interface (API)-based features are the two types of features that were extracted from the analysis results. The authors extracted all install-time and run-time permissions needed for an Android application to function properly on the device in order to provide the permission-based functionality. When it came to features that rely on APIs, they extracted all the APIs that an application uses to complete every task for the users.
The resulting dataset contained 232 features, categorized as permission-based features and API-based features. A permission-based system is a defense mechanism built into Android devices for the safety of their users. Those permissions allow the end user to choose the level of accessibility an application can have over their personal data, a functionality that can be exploited by an attacker. The authors produced an analysis report of these permissions, generating a total of 178 features [22].
APIs are a core set of packages and classes generated by applications on operating systems to access data and interact with different parts of the device. The analysis report of these API calls allows the examination of the different applications’ behavior on the device, helping the authors categorize the applications as safe or malicious and generating a total of 54 API-based features. After pre-processing the raw data, a total of 8930 benign and malware applications have been reported. Figure 2 depicts the dispersion of the data between good-ware (benign) and malware.

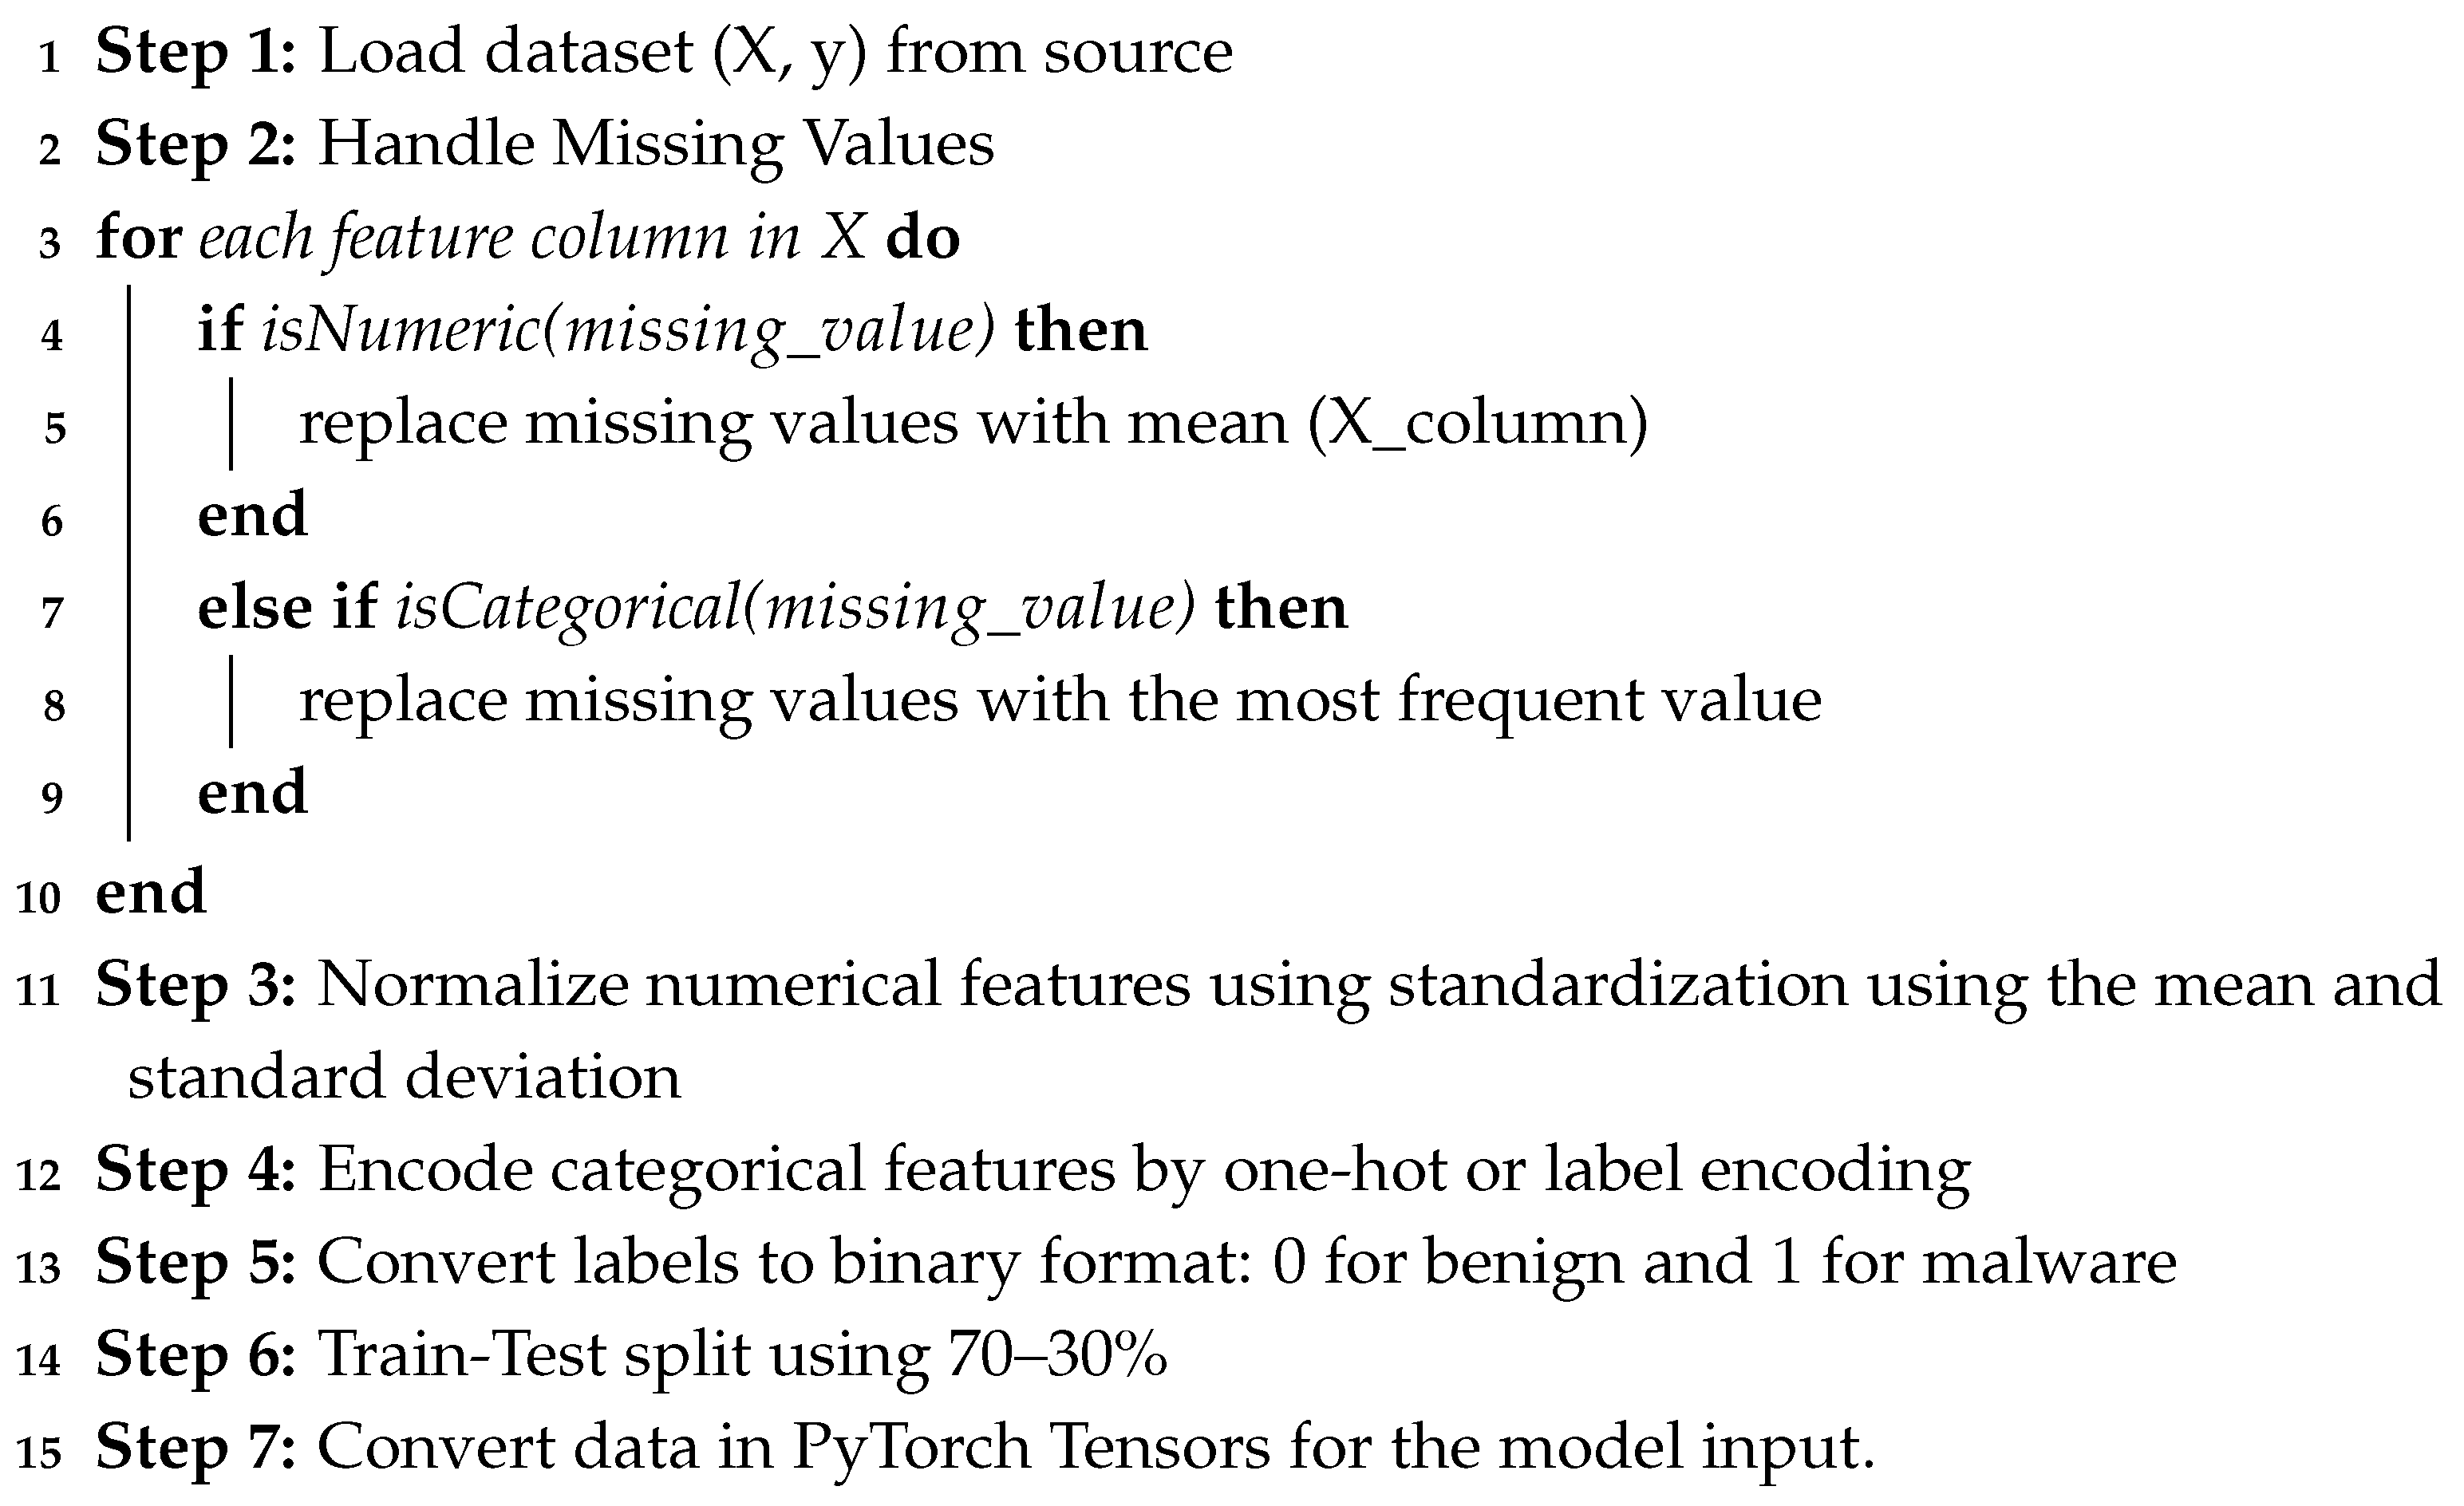
4.4. Dataset Pre-Processing

Using the created TUANDROMD dataset, we used the generated CSV file and carried out some data pre-processing operations, as outlined in Algorithm 1. After loading the dataset, with X being the feature vector and y being the binary label, we handled the missing values in each feature column by replacing the missing value by the mean of the X column if it is a numeric feature and the most frequent value if the feature is categorical. Then, we normalized the numeric features by standardizing, using the mean and standard deviation while encoding the categorical features and using one-hot or label encoding. Then, after defining the labels for benign and malicious app, we split the dataset for testing and training, and the last step was to convert the data in PyTorch 2.6 Tensors to be digested properly by the model input.
Algorithm 1: Dataset pre-processing steps
Electronics 14 01230 i001
In addition, we also had to take care of the high-correlated variables in the dataset. Correlation refers to the degree to which the variables change together or co-vary. A high correlation indicates the variables tend to move in tandem. A low correlation means the variables are not closely associated with their fluctuations. Therefore, we eliminated the variables that were highly correlated, since they might cause our prediction to be biased. Figure 3 shows the resulting correlation heatmap of the variables that are disparagingly correlated.

4.5. Deep Learning Classifiers

When employing Artificial Intelligence as a malware and intrusion detection system, deep learning algorithms have received a lot of attention lately. Their effectiveness and superior performance over basic machine learning algorithms are what made them so popular. With this in mind, we started with our initial hypothesis that the famous transformer model would be the best-suited model to detect mobile threats on Android devices. For comparison purposes, we also relied on several other deep learning algorithms such as Recurrent Neural Networks (RNNs), Gated Recurrent Units (GRUs), Convolutional Neural Networks (CNNs), long-term short-term memory (LSTM), and the hybrid CNN-LSTM model. The subsections that follow include more detailed explanations of these algorithms.

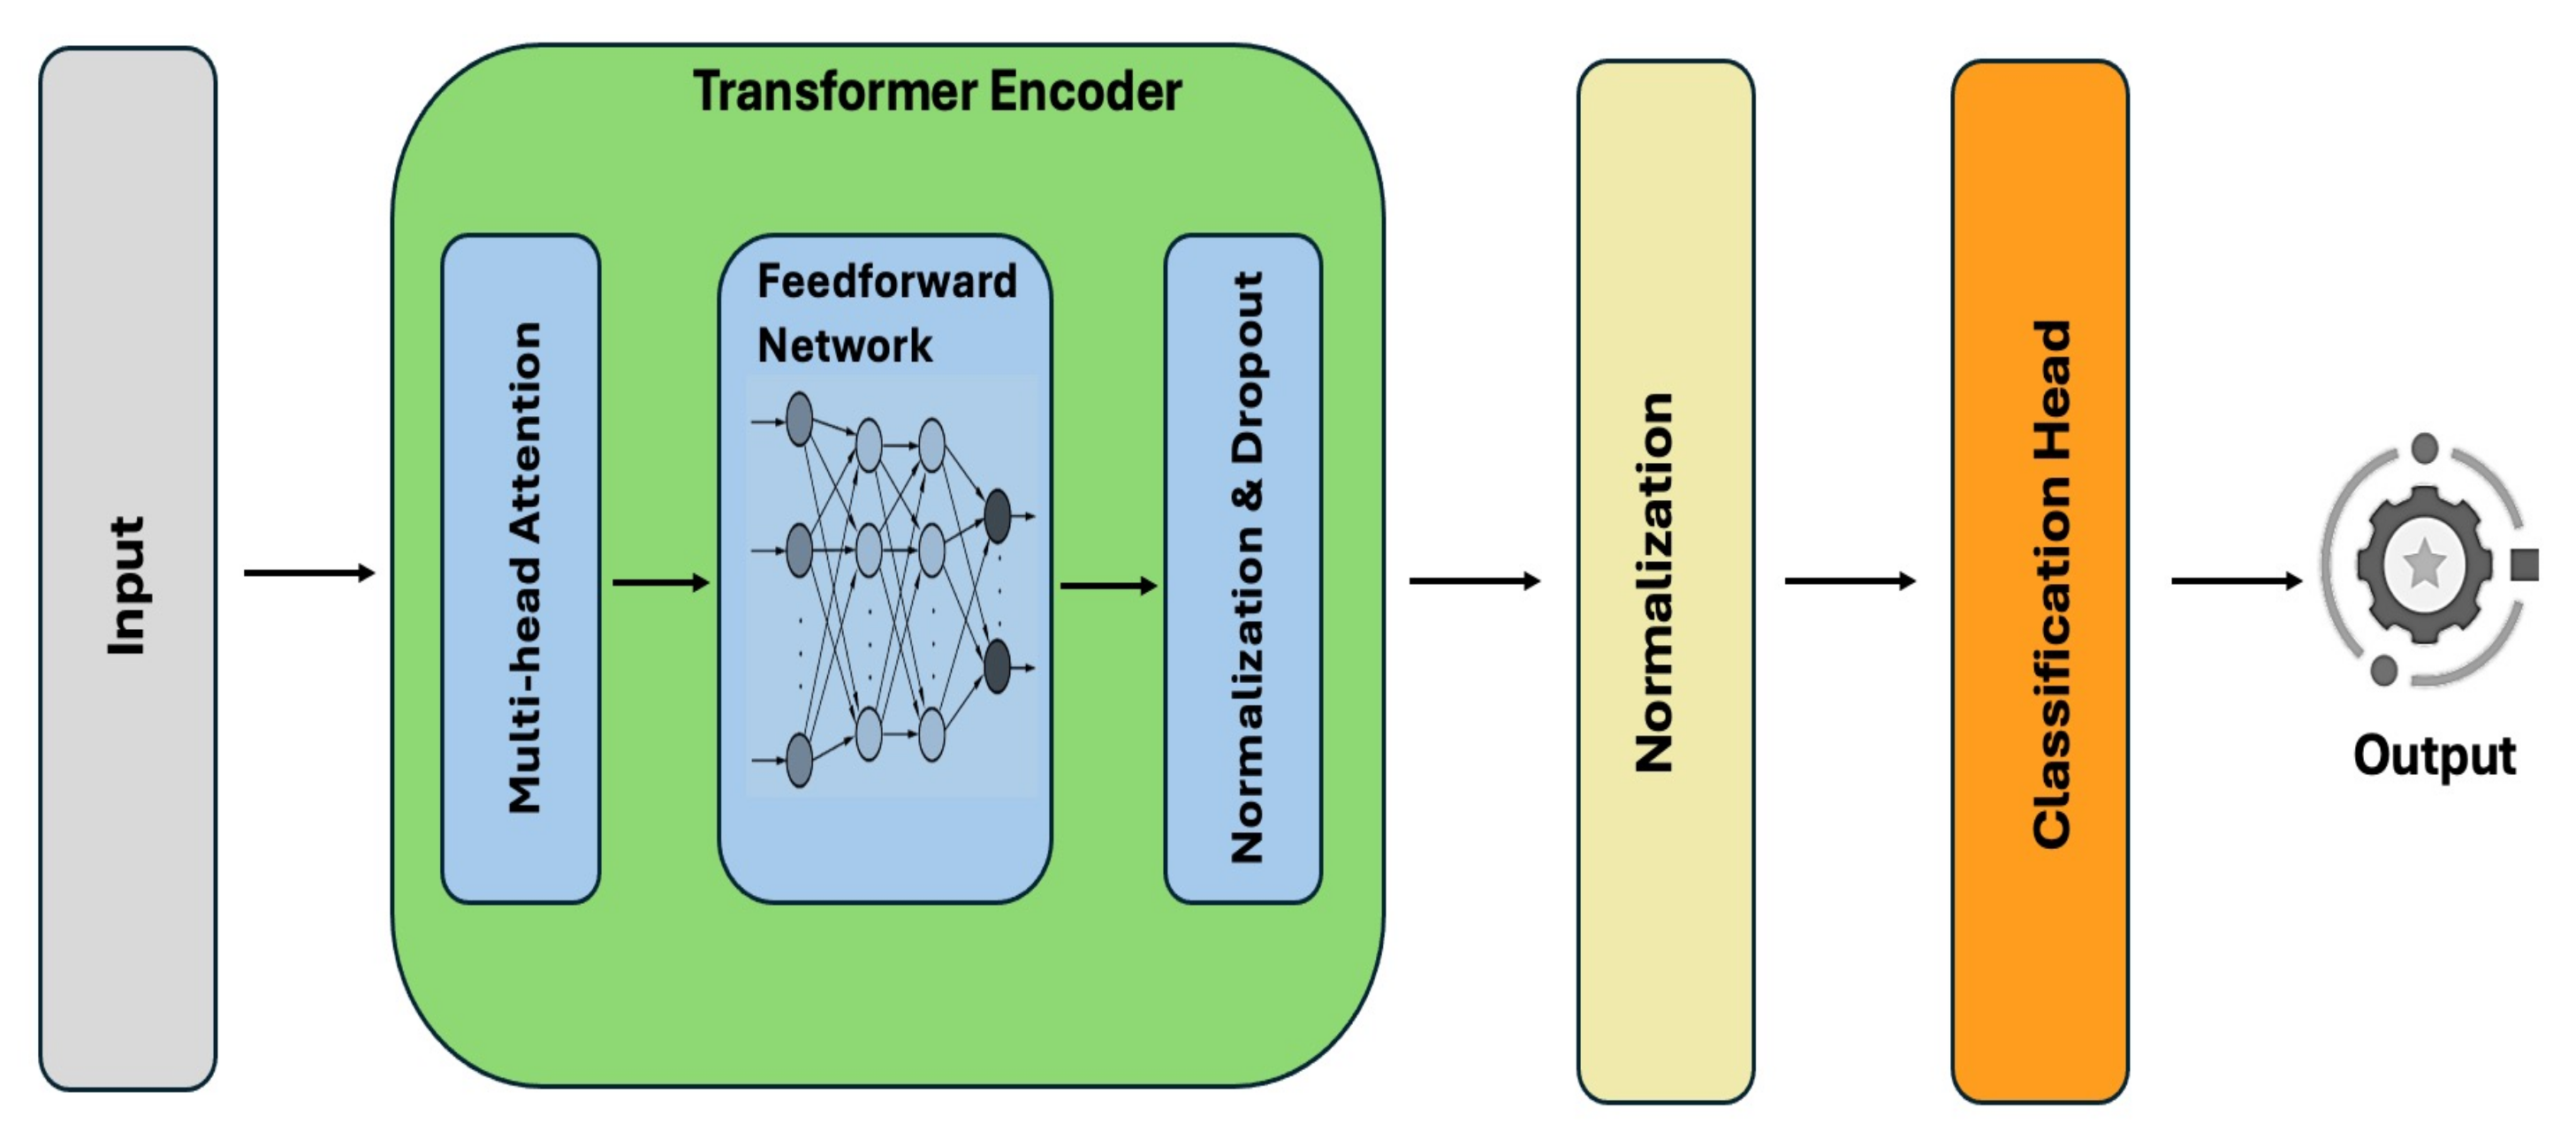
4.5.1. Transformer Classifier

Our choice to develop a transformer-based model for our Android malware detection system was due to the numerous advantages it has over other traditional deep learning classifiers. First, transformers can better deal with the vanishing gradient problem compared to other deep learning networks, allowing the model to be trained without losing information over long sequences. Second, the mechanism of attention heads not only allows weighing various parts of the input sequence differently, but it also enables the parallel processing of the input sequence, which makes it better fitted for use with hardware accelerators.
The architecture of our proposed transformer classifier is provided in Figure 4. The input layer obtained after the pre-processing phase projects the dataset features into a fixed size vector so that it can be adequate for the transformer encoder. The transformer encoder layer can be one or more, as needed, and its role consists of capturing the complex relationships between features. For our case, we chose one layer for the sake of not excessively increasing the model size, as this can incur some drawbacks with regard to performance. However, the encoder layer is, in turn, composed of several layer as follows. First, the multi-head attention mechanism provides the capability to capture the correlation between features in different spots of the sequence in parallel. Each self-attention layer is expressed by the following formula:
A t t e n t i o n ( Q , K , V ) = s o f t m a x ( Q D T / d k ) V
where Q, K, and V are the query, key, and value representations corresponding to each input feature using the learnable weight matrices, while D T and d k represent the transpose to the key matrix and the key dimension size, respectively.
The multi-head attention is obtained using the following formula:
M u l t i H e a d ( X ) = C o n c a t ( h e a d 1 , h e a d 2 h e a d h ) W 0
where h is the number of heads and W 0 is the learned output projection matrix.
The role of multi-head attention is crucial in Trandroid as it captures complex relationship between the extracted features, such as API calls, permissions, and intent actions. Unlike traditional deep learning models that struggle with unordered metadata and long-range dependencies, using multi-head attention enables Trandroid to dynamically weight each feature’s importance across multiple dimension. This is done by projecting each feature to the query, key, and dimension representation and determining the relationship between features by using the attention scores. Moreover, applying the attention-heads in parallel and dynamically adjusting the feature importance allows Trandroid to learn different threat indicators, simultaneously allowing it to generalize to novel malware patterns instead of relying on predefined ones. In addition, Trandroid leverages global feature representation without relying on sequential dependencies, thus allowing it to detect evolving Android threats.
Second, the feedforward network enhances input representation by applying a non-linear transformation, before the normalization and dropout layer stabilizes the encoded input to be ready for the next layer of our model. The feedforward equation is as follows:
F F N ( X ) = m a x ( 0 , X W 1 + b 1 ) W 2 + b 2
where W 1 and W 2 represent the projection matrices while b 1 and b 2 represent the biases.
After the transformer encoder, the normalization layer applied stabilizes the output and prevents the issues of gradient vanishing or exploding by applying the following formula:
H = L a y e r N o r m ( H + F F N ( H ) )
where H represents the hidden state matrix from the previous layer.
Finally, the classification head layer maps the refined features to class logits, before passing them through the loss function for classification, as shown in the following equation:
y ^ = s o f t m a x ( W c H + b c )
where W c and b c are classification parameters.
During the fine-tuning phase of our proposed approach, we experimented with several configurations of the transformer model, before reaching the optimal one that is summarized in Table 3. The configuration is cautiously chosen, completely based on tremendous manual hyper-parameter tuning. This method involved systematically adjusting the key parameters, which includes knowing the rate, batch length, variety of layers, and dropout quotes to become aware of the settings facilitating first-rate stability between version performance and computational efficiency on the TUANDROMD dataset. Manual tuning allowed us to leverage domain understanding and iterative experimentation to refine the configurations whilst tracking overall performance metrics together with accuracy, precision, recall, and the F1-score.
While computerized tuning strategies like grid search or Optuna may offer more exhaustive exploration, we found that manual tuning was sufficient for this, given the restrictions regarding time and resources. The configurations selected represent the balance between attaining sturdy results and maintaining interpretability and reproducibility. This cautious tuning manner furnished us with the optimal settings to illustrate the effectiveness of our primarily transformer-based method, simultaneously ensuring the truthful comparisons with the baseline methods. We plan, however, to focus on using Optuna in our future work. We added some further remarks to emphasize this.
The choice of having only one encoder block in our model was intentional, since this design choice was motivated by the ambition to balance complexity with accuracy. Adding more transformer layers may add complexity, with significant gain in accuracy, especially when taking the size and nature of the TUANDROMD dataset in question. In addition, by using one encoder block, we were able to over-perform other state-of the-art models, thus deeming the deeper network unnecessary. Furthermore, considering the smaller size of TUANDROMD compared to other datasets, adding more encoder blocks may increase the risk of over-fitting, thus justifying the use of this simpler architecture. We highlighted these arguments to justify our for this choice in this paper.

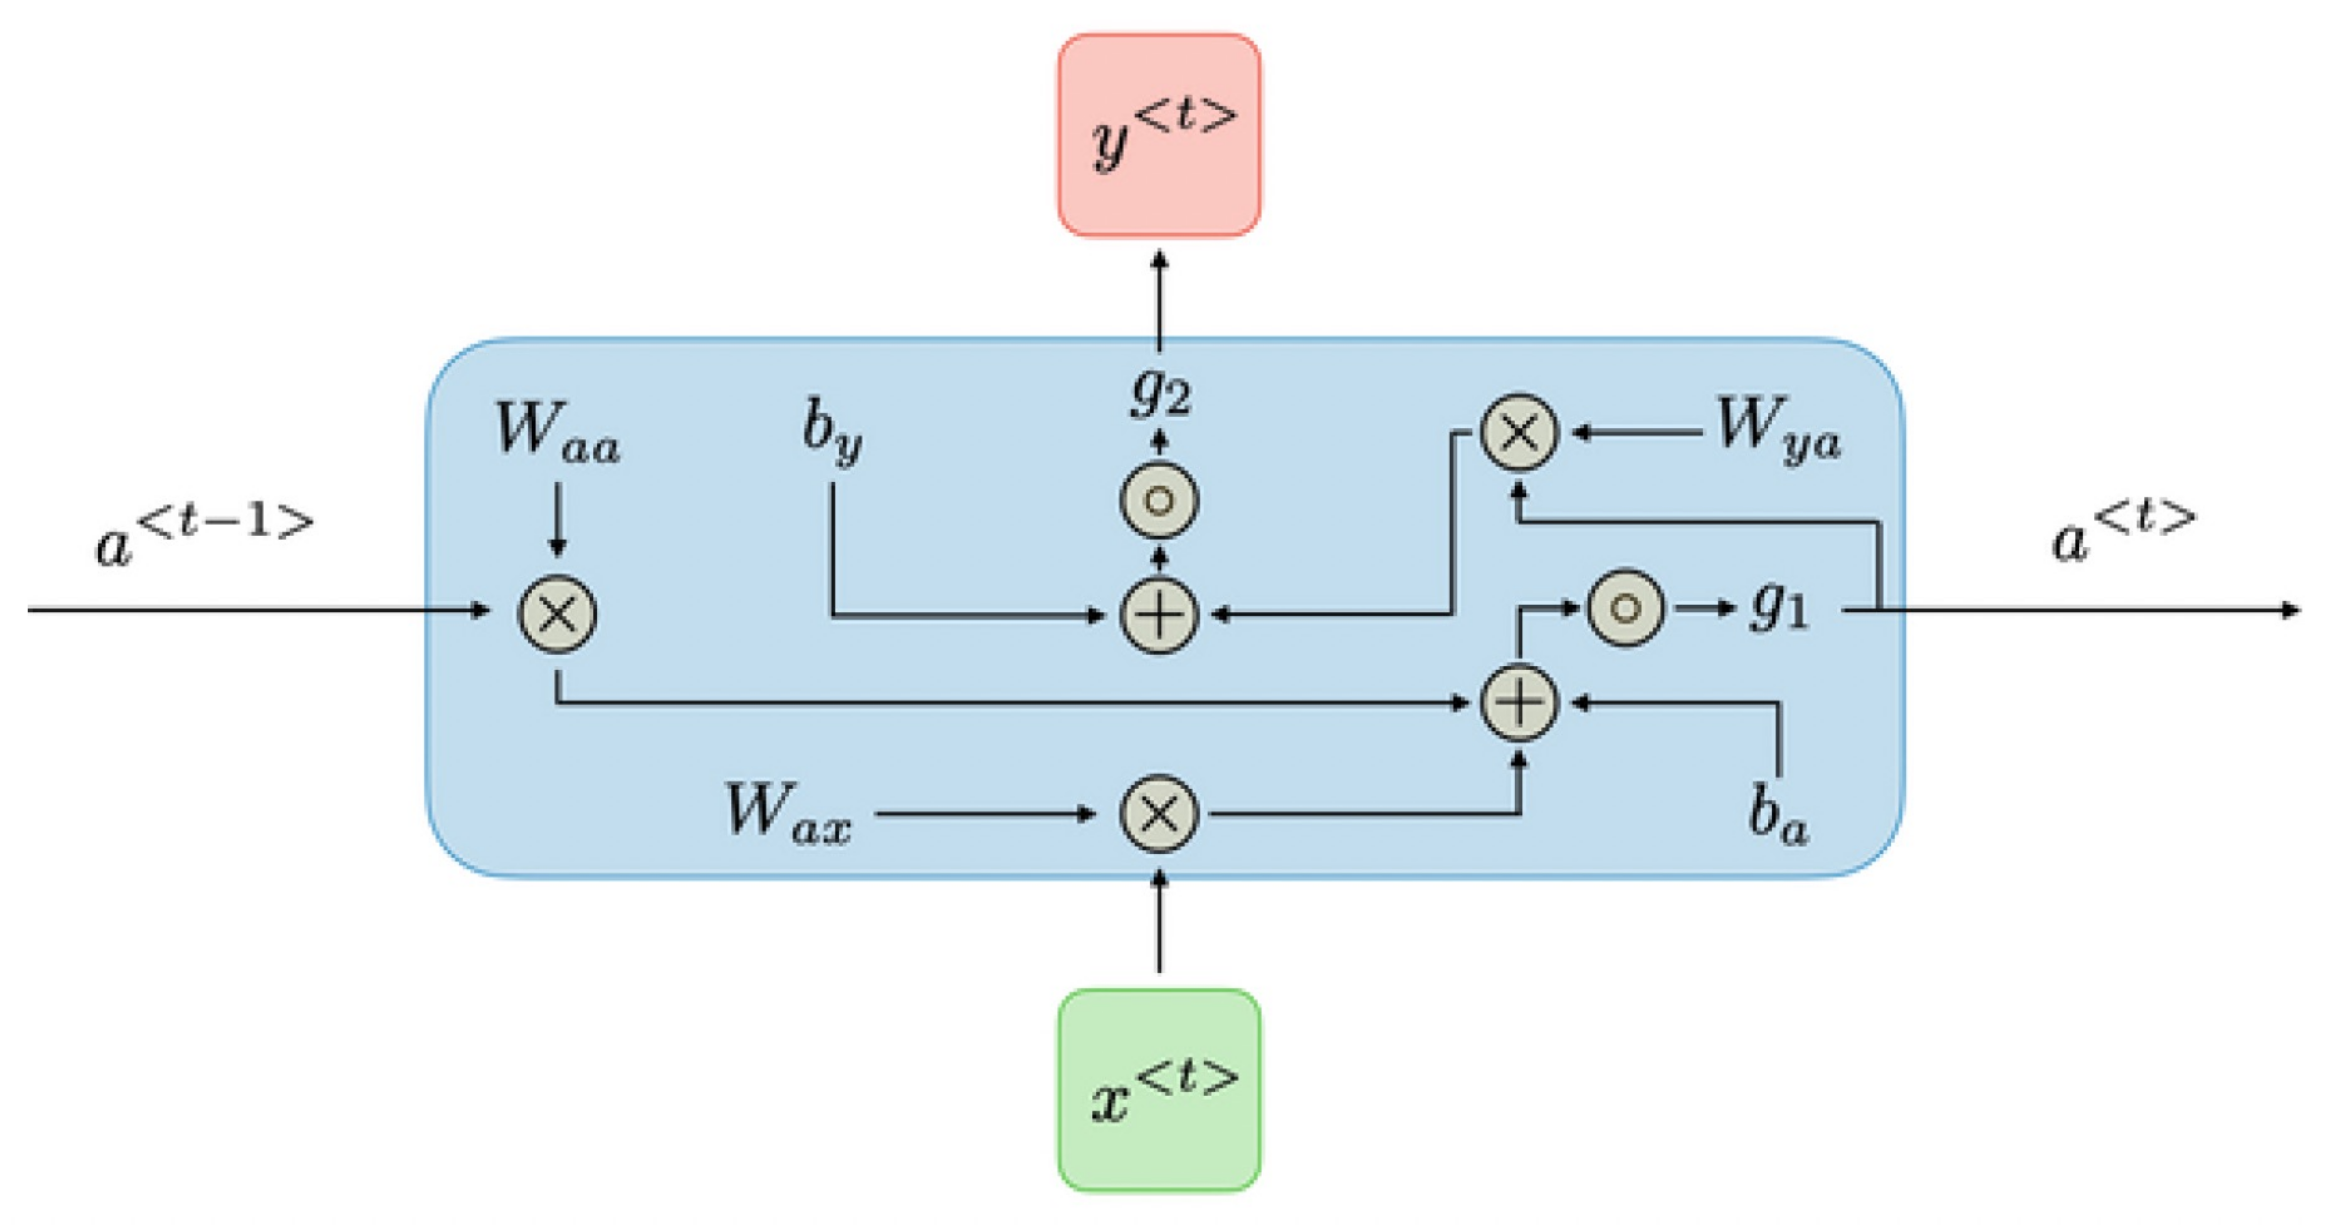
4.5.2. RNN Classifier

RNNs learn the data in a sequential manner, as shown in Figure 5, by storing the previous results in thier memory before processing the new sequence. Thus, during the entire process of using Recurrent Neural Networks, it is crucial for the model to remember the output of the prior time step. As a result, the neural network is able to discover the long-term dependencies of the training data. Equations (6) and (7) describe the sequential process for each time step in the following manner [25]:
S t = f W sx , x t + W ys , s t 1 + b s
Y t = g W ys , s t 1 + b y
where f and g are the encoder and decoder functions, respectively; W s x , x t represents the current inputs; W y s , s t 1 is the previous output at time step t; and b s represents the bias.

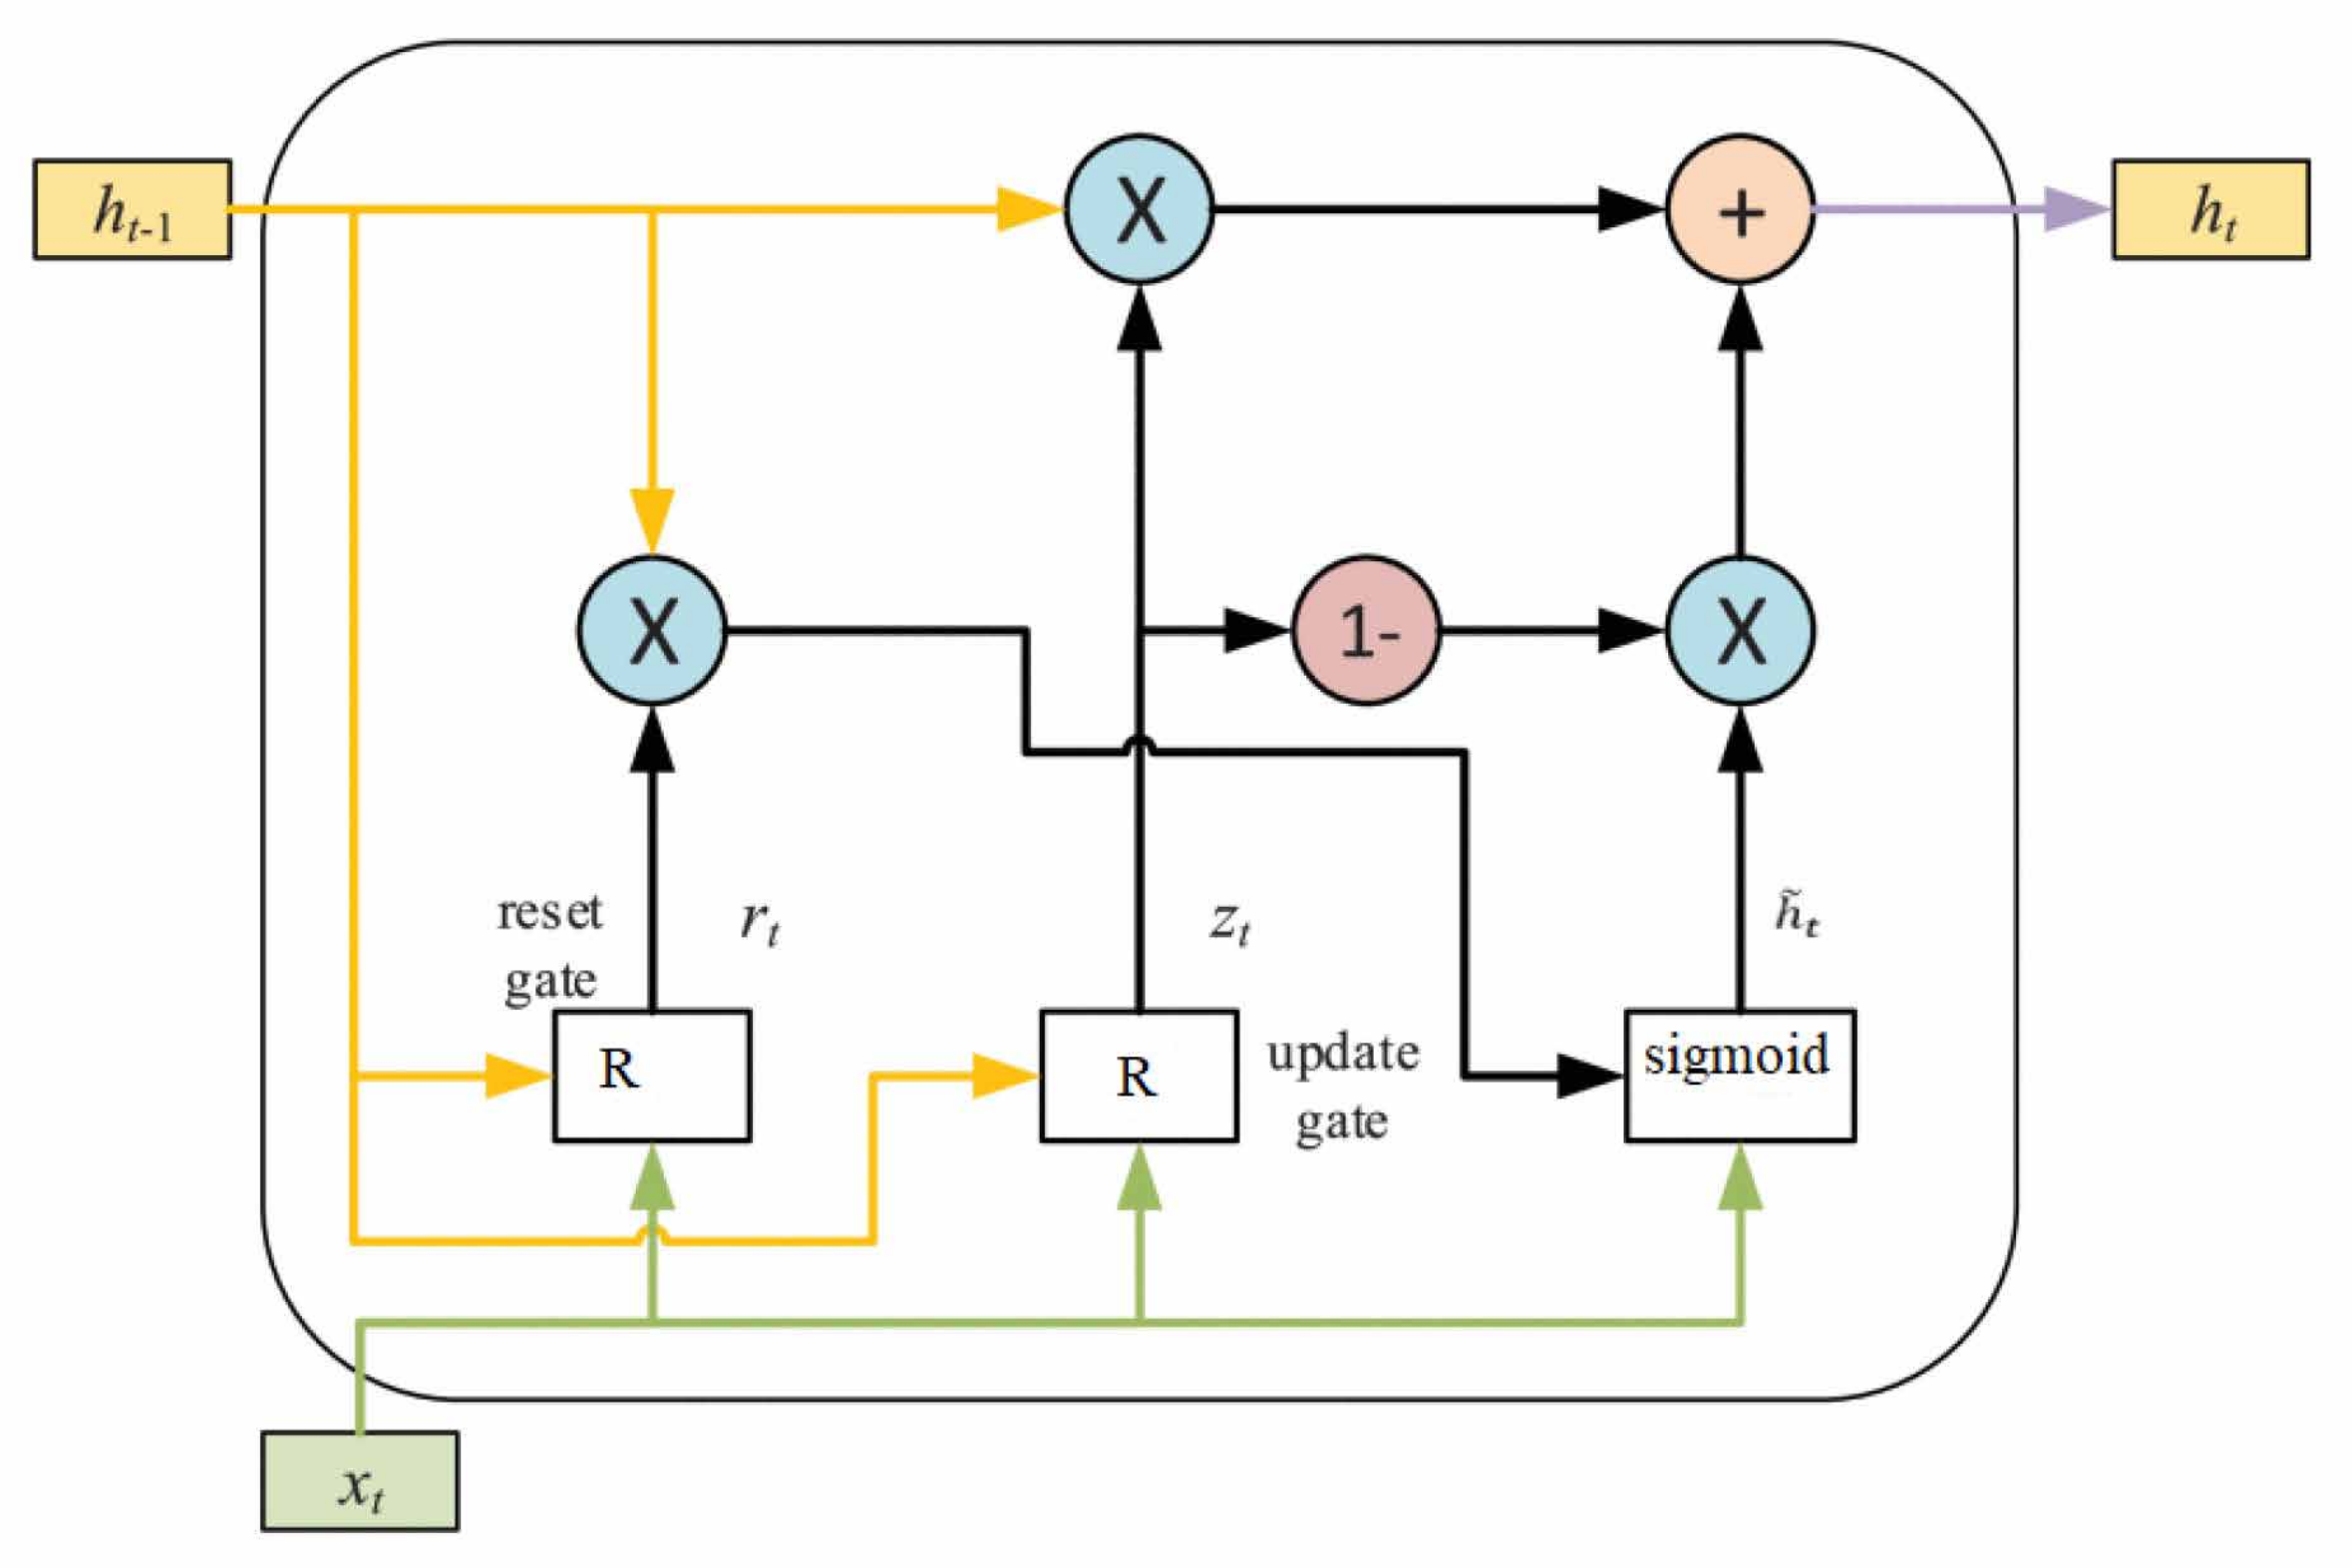
4.5.3. GRU Classifier

The GRU is a specialized RNN model that solves the gradient disappearance problem in native RNNs, and it is frequently used in classification [26]. The structure of the two gates, reset gate and update gate, can learn from the hidden state of the input and output of the previous GRU unit in an adaptive manner. The structure of the GRU cell is depicted in Figure 6 below.
At the time step t, the learning process is calculated as follows [26]:
h t = z t e h t 1 + ( 1 z t ) e h t ˜
z t = R ( W z x t + U z h t 1 + b z )
h ˜ t = σ ( W h x t + r t e ( U h h t 1 ) + b h )
r t = R ( W r x t + U r h t 1 + b r )
where x t is the input vector at the time step t; R is the Rectified Linear Unit (ReLU) activation function; W z , W h , and W r are the mapping matrices; U z , U h , and U r are the weight matrices; and b is the bias.
As seen in Figure 6, the input vector x t at time step t is the original input vector, and h t is the hidden state discovered from the GRU’s hidden state in the preceding step, t 1 . The output of the update gate is z t , and the output of the reset gate is r t . The information-transferring mechanism in the GRU unit is concurrently controlled by the input vector and the hidden state, since they represent distinct types of information. Due to this structure, the reset gate and the update gate carry out comparable computations, allowing for the maximum memorization of the GRU structure.

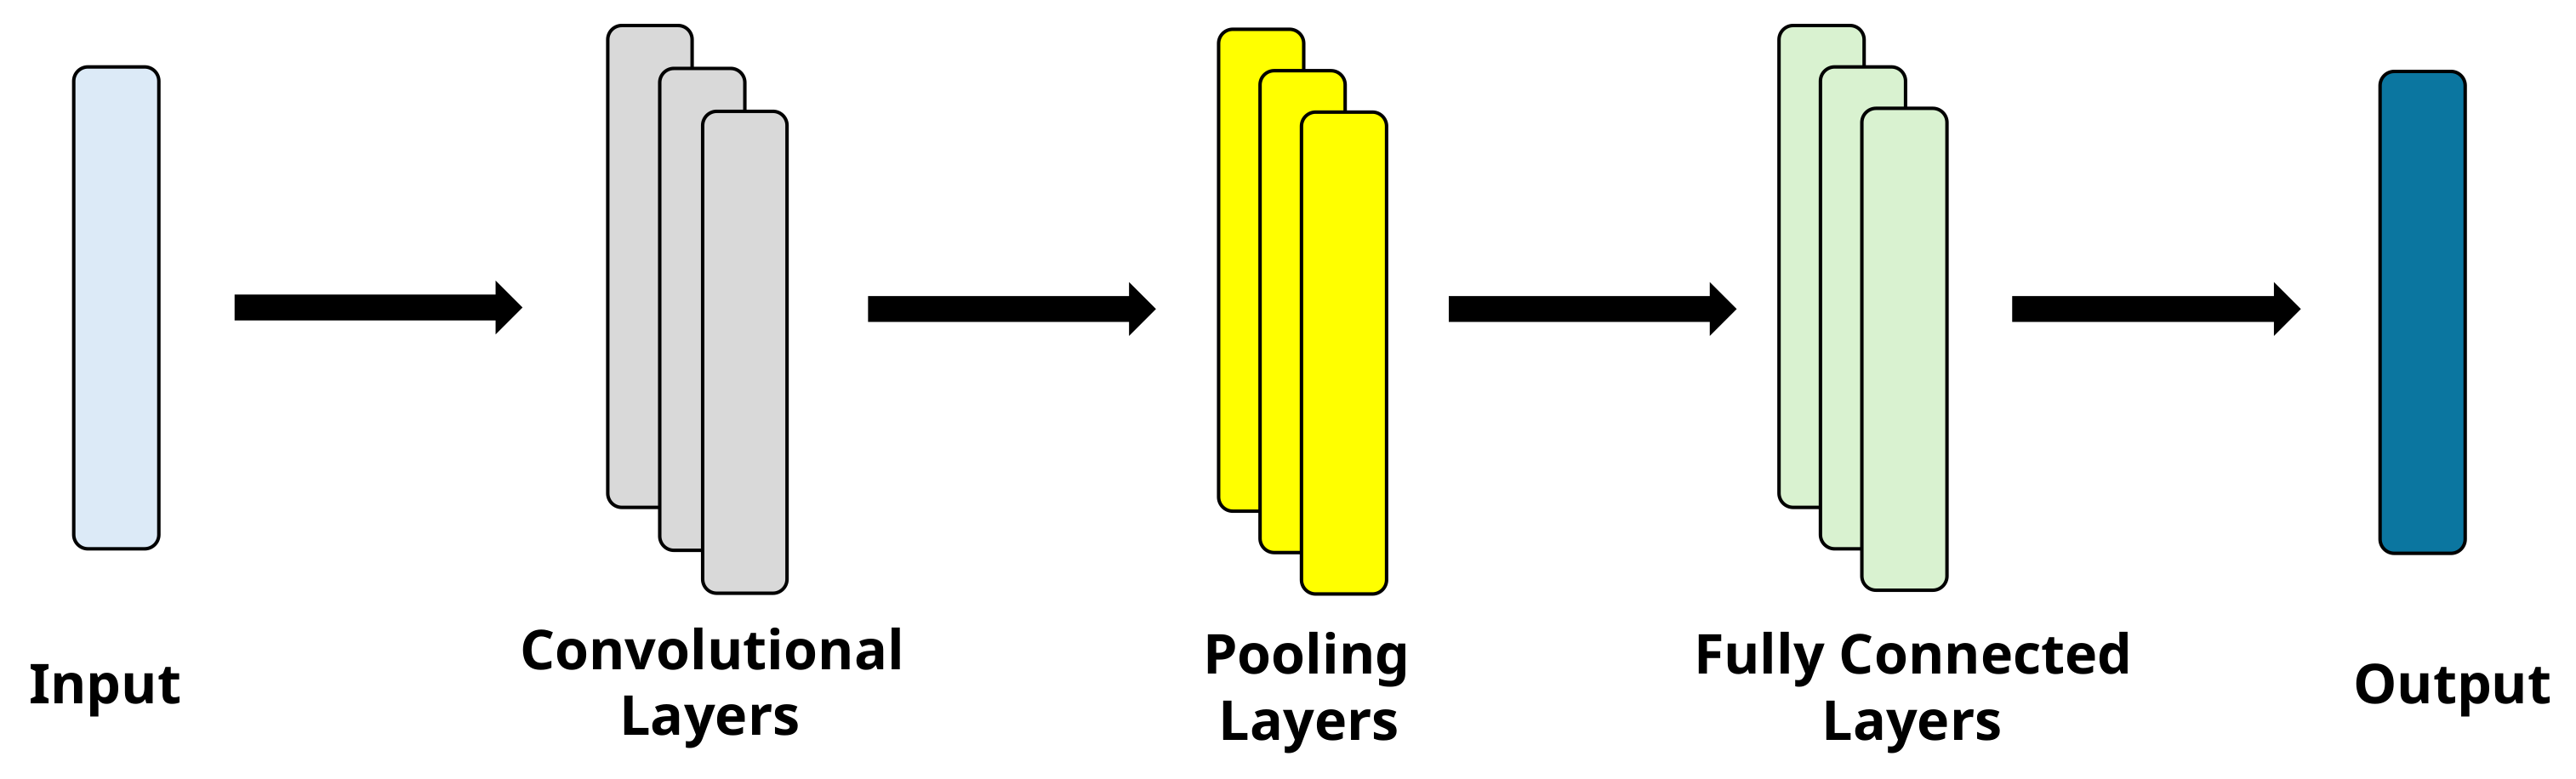
4.5.4. CNN Classifier

Sentiment analysis and binary classifications are two sentence-level classification scenarios where the CNN architecture has demonstrated impressive performance [27]. As portrayed in Figure 7, multiple filters with different window sizes can be employed in the convolution layer of a CNN architecture to provide various high-level features. The contextual semantic meanings of the input opcode sequences are thus encoded in the feature map that is produced. Following that, the pooling layer receives these features and reduces them.
Ultimately, Android malware detection is carried out as a binary classification task using fully connected layers. In the Android malware classification scenario, a softmax layer is needed to determine the probabilities of various malware families. In conclusion, the pooling layers lower the feature dimension while the fully connected layers serve as a classifier for Android malware detection, and the convolution layers learn the high-level features to classify apps.

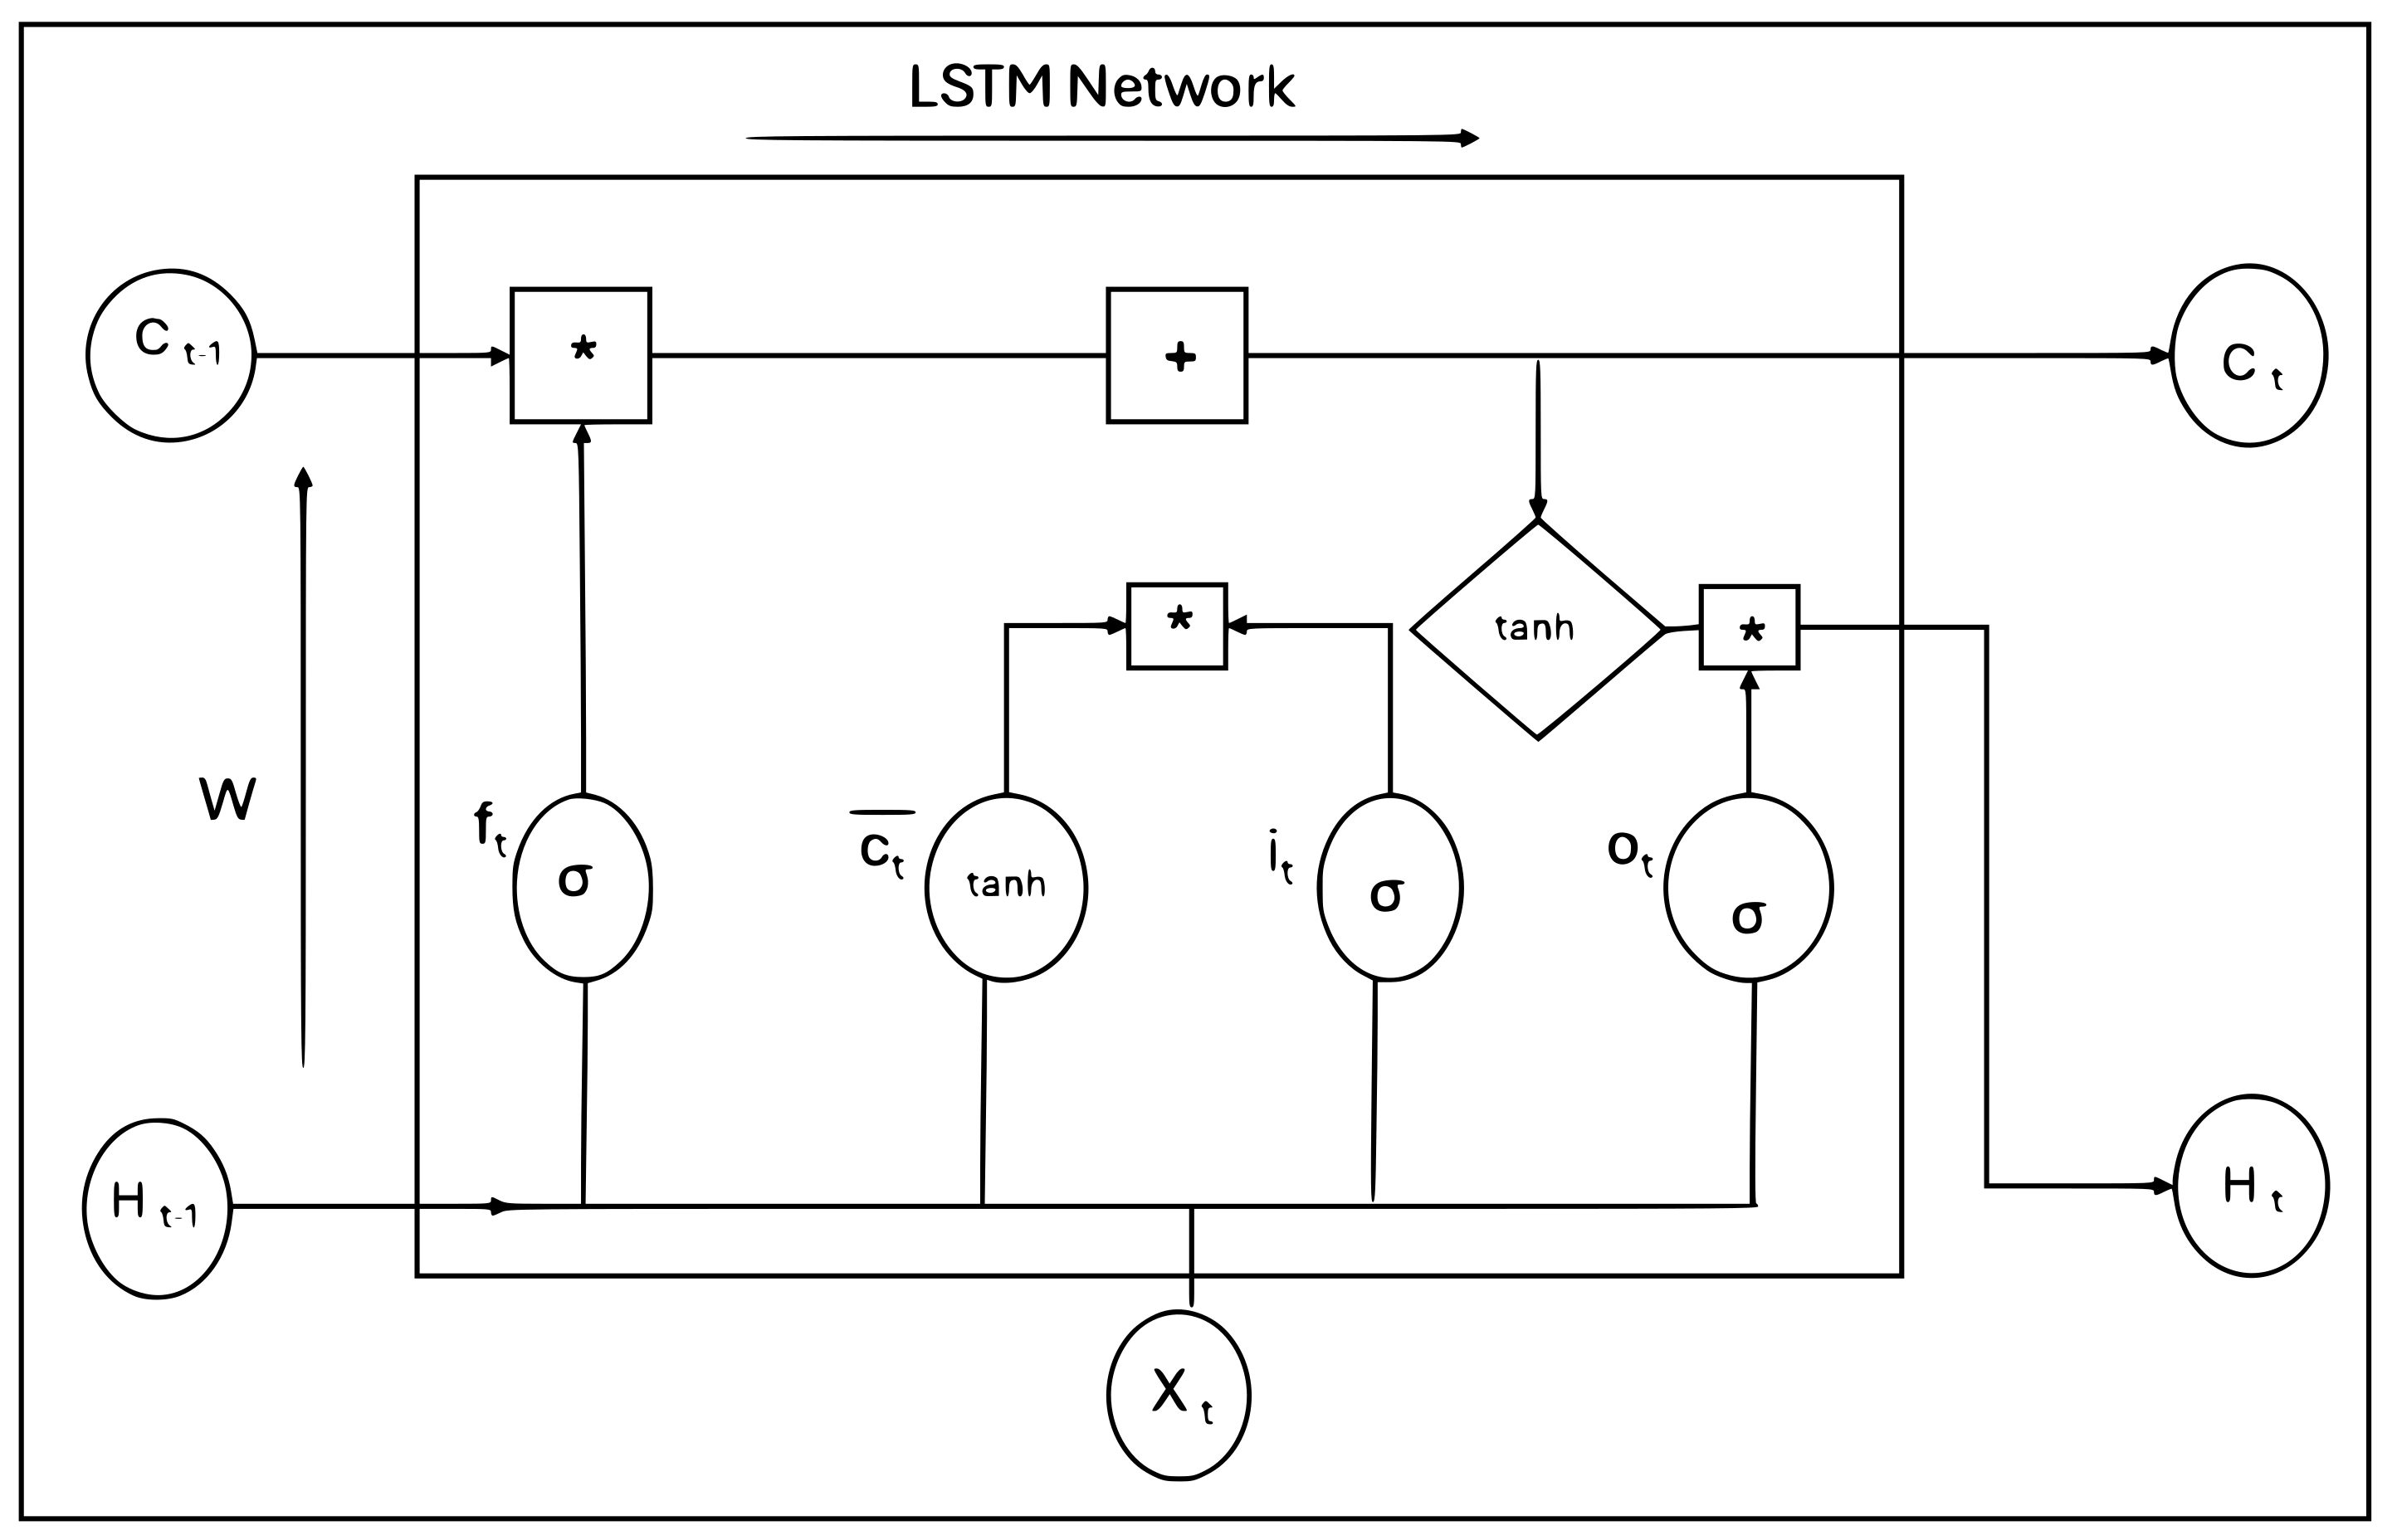
4.5.5. LSTM Classifier

The Long Short-Term Memory network (LSTM), as shown in Figure 8, is a modified version RNN and is very effective in learning long-term dependencies, particularly in sequence prediction problems. Applications where data must be kept in the memory for a brief period of time employ RNNs. This issue with short-term memory is resolved by LSTM. Information can be kept or extracted from the “cell state” of a LSTM model, which preserves its state across time. Depending on how important a given item is, LSTM networks can selectively remember or forget it. Three components are used to construct the outputs as follows: the input at the relevant time stamp, the preceding hidden state, and the previous cell state.
Memory blocks are used by the LSTM network in place of the RNN’s hidden layer units [28]. An LSTM network is made up of different memory blocks, called cells, that are placed sequentially. The subsequent cell receives both the concealed state and the cell state. The input, forget, and output gates are used to manipulate the memory blocks, which are in charge of storing information. The input gate performs the function of adding data to the cell state.
The LSTM network architecture includes input gate i, forget gate f, hidden state H, output gate o, candidate layer c, and memory state C. The inputs to the LSTM cell at time step t are X t 1 (the input vector), H t 1 (preceding cell output), and C t 1 (the preceding cell memory). Let W and U be the hidden and input state weight vectors, respectively. The values of the sigmoid function, forget gate, and input gate are calculated as follows [28]:
σ ( X ) = 1 / 1 + e x
f t = σ ( X t U f + h t 1 W f )
i t = σ ( X t U i + h t 1 W i )
The previous state of the memory cell is expressed as follows:
c ¯ t = t a n h ( X t U c + h t 1 W c )
The value of the output gate is expressed as follows:
o t = σ ( X t U o + h t 1 W o )
The state of the current memory cell is expressed as follows:
C t = f t C t 1 + i t c ¯ t
The value of the current cell output is expressed as follows:
H t = O t t a n h ( C t )
In our case, σ is the logistic sigmoid function, and the values of gating vectors f t , i t , and o t are in the range from 0 to 1. The t a n h is a hyperbolic tangent function, and ∗ is the point-wise multiplication operation.

4.5.6. Hybrid CNN-LSTM Classifier

The hybrid CNN-LSTM model, as shown in Figure 9, consists of a set of CNN and LSTM layers that extract complex characteristics from the dataset and store complex irregular trends.
The CNN layer is well known for its ability to extract local features from input layers and transform them into more complex ones [29]. The LSTM layer represents the bottom layer of the proposed model, which stores the time information about the most dominant characteristics of the intrusion detection system extracted by the upper CNN layer.
The CNN-LSTM final layer is formed by fully connected layers, used to detect intrusions over certain periods of time. The output of the LSTM unit is flattened into a feature vector h l = h 1 , h 2 , h l , where l represents the number of units in the LSTM unit, as shown in Equation (19).
d i l = j w j i l 1 ( σ ( h i l 1 ) + b i l 1 )
where σ is a nonlinear activation function, w is the weight of the i t h node for layer l 1 and the j t h node for layer l, and b i l 1 represents the bias [29].

5. Experimental Results

In this section, we describe the performance metrics we used in our experiments. Then, we discuss the obtained results from our transformer-based approach with those of other deep learning classifiers, which we have developed for comparison purposes, and also with results from related studies. We also discuss the limitations of our approach.
As part of our evaluation process, we chose to compare the performance of our model using several performance metrics, including the accuracy, sensitivity, precision, F1-score, and AUC_ROC, in addition to the false positive and false negative rates, in order to demonstrate the efficiency of our models.
The accuracy rate is the number of correct predictions divided by the total number of instances in the dataset, while the precision represents the ratio of the number of true positives to the total number of positives detected by the model. Their formulas are provided in Equation (20) and Equation (21), respectively.
Accuracy = T P + T N T P + F P + T N + F N
Precision = T P T P + F P
The F1-score is the result of the precision and recall between the predicted category and the actual category. Their formulas are provided in Equation (23) and Equation (22), respectively.
Recall = T P T P + F N
F 1 Score = 2 P r e c i s i o n R e c a l l P r e c i s i o n + R e c a l l
The area under the curve on the receiver operating characteristics, known as AUC-ROC, indicates how well the model predicts outcomes. It also shows the degree to which the model can differentiate between classes. Its formula is provided in Equation (24).
AUC - ROC = i = 1 n 1 1 2 TPR i + 1 + TPR i × FPR i + 1 FPR i
Finally, the False Positive Rate (FPR) and the False Negative Rate (FNR) indicate how many times the system classifies a normal activity as malicious and how many times it fails to flag a malicious activity, respectively. Their formulas are provided in Equations (25) and (26), respectively.
FPR = F P F P + T N
FNR = F N F N + T P

Results

As we can see in Table 4, our transformer model achieved the best performance, with an accuracy of 99.25%, validating our initial hypothesis. We were able to achieve this high performance by experimenting with different configurations as part of the fine-tuning phase until we reached the optimal one, as summarized in Table 3, using 50 epochs. Figure 10 shows the training versus testing accuracy of the transformer classifier. We chose to use the transformer model to prove its high efficiency over other deep learning models and its ability to deal with vanishing gradient problems compared to other deep learning networks, allowing the model to be trained without losing information over long sequences.
Furthermore, it can be observed that the loss plot of our transformer-based classifier, shown in Figure 11, is smooth during training and testing, showing stability with minimal and negligible bumps. This indicates that the learning rate is appropriately tuned and that the model is reducing the risk of over-fitting while having a good generalization to the unseen data. These are all indications of the potential success of our approach.
Our next best model is the GRU classifier using a Keras sequential model with three dense layers. The input layer had 64 neurons, while the second hidden layer had 32 neurons and used ReLU as its activation function. The final layer, which worked as an output layer, had one neuron and a Sigmoid activation function. We also added some dropout with a rate of 0.5, to deal with the over-fitting of the data. To compile the model, we set the number of epochs to 50, with a batch size of 32. After each epoch running for less than 3 s, we achieved an accuracy rate of 94.73%. Figure 12 illustrates the resulting performance of our model. We chose the GRU model due to its efficiency, simplicity, effectiveness in handling short-term dependencies, and suitability for sequential data.
The next best model is the RNN classifier, using a Keras sequential model with two dense hidden layers. The first hidden layer had 32 neurons and used ReLU as its activation function. Between both layers, we added a dropout with a rate of 0.5, to deal with the over-fitting of the data. The second layer, which worked as an output layer, had one neuron and a Sigmoid activation function. To compile the model, we set the number of epochs to 20 and, with a batch size of 32. We were able to achieve an accuracy rate of 92.48%. Figure 13 illustrates the resulting performance of our model during the training versus the testing phases. We selected RNN due to its ability to handle sequential data, automatically learn relevant features, capture contextual information, and model long-term dependencies.
The LSTM classifier scored a 93.98% accuracy. We opted for the Keras sequential model with two dense layers. The first layer acted as the input layer, and it had 64 neurons and tanh as activation function. The second layer, which was the same as the output layer, had one neuron and a Sigmoid activation function. The model was compiled using 50 epochs and a batch size of 32, with an overall time of 12.88 s. The accuracy plot of the classifier for the training and testing is displayed in Figure 14. We chose LSTM due to its ability to capture long-term dependencies, its robustness to noise, flexibility in handling sequences of varying lengths, and its capability for automatic feature learning.
We were able to record an accuracy rate of 93.93% with the CNN classifier. This accuracy was achieved using three dense layers and a 1-dimensional max-pooling size of 2. The first layer, which served as an input layer, had 32 layers, a kernel size of 3, and a ReLU activation function. The second hidden layer had 64 neurons associated with a dropout function at a rate of 0.5 to deal with the over-fitting. Furthermore, the final layer, acting as the output layer had one layer and a Sigmoid activation function. Figure 15 shows the accuracy plot of the model regarding training and testing. The CNN model has been used due to its ability to capture local patterns, hierarchical representations, translation invariance, and parameter sharing.
Finally, the hybrid CNN-LSTM model, as shown in Figure 16 did not perform as well, as we recorded an accuracy of 84.84%, shown in Figure 15. Due to its hybrid nature, both CNN and LSTM models needed a special setup, and while setting up LSTM, we set the output size to 70 and used a 1-dimensional max-pooling size of 2 for the CNN. For the overall model, we had a kernel size of 5, 64 filters, a pool size of 4, a ReLU activation function, and a batch size of 64, running over 50 epochs. With its ability to handle input sequences of variable lengths and to automatically learn representations of the input data, reducing the need for manual feature engineering, we thought this model would perform well, which was not the case.
In addition, it can be observed that the transformer classifier performed best with regard to the FPR and FNR, which were really negligible compared with the other models whose values were slightly better. However, the training time of the transformer model using Google Colab with a conventional CPU yielded a higher training time, total number of parameters, and model size compared with the other models.
While running the experiments to collects these metrics, several actions are carried out in each epoch. First, as part of the forward pass, the input data is passed through the transformer layers, where the multi-head attentions capture the long-term dependencies. Furthermore, the loss function is calculated and further optimized through our chosen optimizer, thus improving the performance with each epoch. In addition, the various chosen evaluation metrics are collected at each epoch to evaluate the model and ensure it generalizes well. Finally, hyper-parameters are adjusted, if needed, during the validation process, to enhance threat detection.
As shown in Table 5, it can also be observed that Trandroid performed better than other state-of-the-art models using different datasets, which constitutes another evidence supporting our initial hypothesis.
TUANDROMD’s metadata richness and feature diversity significantly enhance Trandroid’s accuracy compared to older datasets, like Drebin, by providing a more representative and comprehensive view of modern Android malware threats. Unlike Drebin, which primarily consists of older malware samples and lacks fine-grained behavioral data, TUANDROMD includes 71 distinct malware families, ensuring the coverage of recent attack patterns, evolving evasion techniques, and diverse threat categories. Additionally, TUANDROMD provides detailed metadata, such as API call sequences, intent actions, and permission requests, allowing Trandroid to capture deep contextual relationships between these features. This contrasts with Drebin, which mainly relies on static permissions and app metadata, limiting its ability to detect sophisticated malware that dynamically adapts to bypass security measures. By leveraging the structured and updated nature of TUANDROMD, Trandroid can better generalize to real-world threats, reducing false positives and improving classification accuracy for emerging malware variants.
It is worth noting that the success of Trandroid over other Sachith’s vision transformer approach is due to several reasons as follows:
  • Dataset: Sachith uses the MalNet dataset, which is an image dataset lacking granular Android metadata, unlike TUANDROMD, which is more recent and comprehensive, covering 71 malware families and real-world attack samples. As a result, Trandroid achieves better generalization, while the lack of capturing semantic relationships with MalNet may lead to false correlations.
  • Model architecture: ViT-based malware detection models excel in visual pattern recognition but are suboptimal for dealing with categorical malware features. In contrast, Trandroid applies transformer-based sequence modeling directly on feature vectors, improving interpretability and relevance for malware classification.
  • Computational needs: Sachith’s work has intensive GPU requirements to process tasks such as image tokenization and patch embedding. Meanwhile, Trandroid deals with tabular features, thus requiring less computational resources.

6. Discussion

Our proposed Trandroid approach balances model complexity with performance needs to optimize accuracy while ensuring the approach’s scalability and efficiency. First, we optimally used four attention heads in order to reduce the model’s complexity while ensuring high accuracy. Second, we minimized the number of transformer layers that handle structured Android data while reducing the memory consumption. Third, by embedding the features into a structured vector format, Trandroid eliminates the computational overhead of graph-based or image-based models.
Even though our research shows potential for success as a reliable mobile threat detection system, we acknowledged the following limitations:
  • TUANDROMD is a reasonably new dataset, and only a few experiments have been done on that, compared to famous datasets like Androzoo or Drebin, which are larger in size but much older. Therefore, it requires careful consideration of the potential selection and measurement biases, an awareness of the dataset’s limitations, and the responsible analysis and interpretation of our findings.
  • TUANDROMD’s size is relatively small size, and even if GPU accelerators were used, the benefits would not have mattered much. Thus, using a bigger dataset is needed, as it would enable a better generalization to unseen malware and offer a more comprehensive evaluation benchmark.
  • Better support for real-time detection is needed, but our approach must be revised in order to reduce the model size and decrease the training time. Using resource optimization techniques, such as pruning, quantization, and knowledge distillation, could help Trandroid in scaling within a real-world environment. In addition, the deployment of flexibility options, such as offloading resource intensive tasks to cloud environments and using lightweight transformer variants, could help achieving this goal. While TUANDROMD has a diverse Android malware representation, the imbalance in malware family distribution in the dataset may favor well-represented malware families while under-performing on rare or emerging threats.
Despite these limitations, this work demonstrates significant potential for application in real-world scenarios such as the following:
  • Our Trandroid approach could complement popular app marketplace malware detection systems, such as Google Play Protect, by providing an additional layer of security capable of dealing with newer and more sophisticated malware.
  • In corporate environments, Trandroid can assist companies adopting the Bring Your Own Device (BYOD) model in mobile application development, detecting malicious activities affecting employees devices.
  • The extremely low FPR and FNR constitute a very good sign that extending Trandroid with real-time detection would be of high value.
  • Our model has the potential to be used in cloud-based security services to allow cloud providers to scan apps for malware before their final distribution to end users.
  • Trandroid can assist in detecting network-based malware originating from compromised Android devices in corporate environments.

7. Conclusions

Despite the widespread use of Android in mobile application development, several malware variants pose severe risk factors that represent significant security challenges. Traditional defense mechanisms, such as anti-viruses, are facing an increasingly difficult task in keeping up with the volume, novelty, and variety of emerging mobile threats. On the other hand, deep learning-based approaches have shown promising signs but have been facing significant challenges due to their reliance on outdated datasets and handcrafted features, thus failing to properly represent evolving attack patterns. To address these limitations, we proposed Trandroid, a novel mobile threat detection system powered by transformers. We used the TUANDROMD dataset, which includes more recent malware threats, and we developed and compared several traditional deep learning classifiers, including RNN, GRU, CNN, LSTM, and hybrid CNN-LSTM, with our model. Our transformer-based model outperformed all baselines with a notable accuracy rate of 99.25% and an extremely low false positive and false negative rates. In addition, Trandroid surpassed a state-of-the-art image-based vision transformer for detecting Android threats, based on image-based data compared to labeled data, with a 97% accuracy. We also recorded higher precision, 99.26% vs. 86.7%, and higher recall, 99.25% vs. 89%. These findings validate our initial hypothesis and prove the effectiveness of transformers in detecting Android malware. In our future work, we plan to extend our approach to deal with larger datasets such as the Android Malware Genome Project (AMGP), MalNet, or Androzoo. We also plan to develop a real-time detection capability so that our approach can reach to its full potential for deployment in real-world scenarios.

Author Contributions

T.K.: Conceptualization, methodology, writing—review and editing, supervision, software; S.T.: writing—original draft preparation, software, validation. All authors have read and agreed to the published version of the manuscript.

Funding

This research was funded by the National Science Fondation, grant number 2406179.

Data Availability Statement

The original contributions presented in this study are included in the article. Further inquiries can be directed to the corresponding author.

Conflicts of Interest

The authors declare no conflicts of interest.

References

  1. Statista. “Smartphone Users Worldwide 2023 to 2028”. 2023. Available online: https://www.statista.com/statistics/330695/number-of-smartphone-users-worldwide/ (accessed on 11 November 2024).
  2. Mahmood, R.; Esfahani, N.; Kacem, T.; Mirzaei, N.; Malek, S.; Stavrou, A. A whitebox approach for automated security testing of Android applications on the cloud. In Proceedings of the 2012 7th International Workshop on Automation of Software Test (AST), Zurich, Switzerland, 2–3 June 2012; pp. 22–28. [Google Scholar]
  3. Arif, J.M.; Ab Razak, M.F.; Mat, S.R.T.; Awang, S.; Ismail, N.S.N.; Firdaus, A. Android mobile malware detection using fuzzy AHP. J. Inf. Secur. Appl. 2021, 61, 102929. [Google Scholar]
  4. Chen, M.; Zhou, Q.; Wang, K.; Zeng, Z. An android malware detection method using deep learning based on multi-features. In Proceedings of the 2022 IEEE International Conference on Artificial Intelligence and Computer Applications (ICAICA), Dalian, China, 24–26 June 2022; pp. 187–190. [Google Scholar]
  5. Nokia. Nokia Threat Intelligence Report—2019. Netw. Secur. 2021, 2018, 8. [Google Scholar] [CrossRef]
  6. Ibrahim, S.; Catal, C.; Kacem, T. The use of multi-task learning in cybersecurity applications: A systematic literature review. Neural Comput. Appl. 2024, 36, 22053–22079. [Google Scholar]
  7. Yan, P.; Yan, Z. A survey on dynamic mobile malware detection. Softw. Qual. J. 2018, 26, 891–919. [Google Scholar] [CrossRef]
  8. Liu, K.; Xu, S.; Xu, G.; Zhang, M.; Sun, D.; Liu, H. A review of android malware detection approaches based on machine learning. IEEE Access 2020, 8, 124579–124607. [Google Scholar] [CrossRef]
  9. Tossou, S.; Kacem, T. Mobile Threat Detection System: A Deep Learning Approach. In Proceedings of the 2023 13th International Conference on Information Science and Technology (ICIST), Cairo, Egypt, 8–14 December 2023; pp. 323–332. [Google Scholar]
  10. Hsien-De Huang, T.; Yu, C.M.; Kao, H.Y. Data-driven and deep learning methodology for deceptive advertising and phone scams detection. In Proceedings of the 2017 Conference on Technologies and Applications of ARTIFICIAL Intelligence (TAAI), Taipei, Taiwan, 1–3 December 2017; pp. 166–171. [Google Scholar]
  11. Sandeep, H.R. Static analysis of android malware detection using deep learning. In Proceedings of the 2019 International Conference on Intelligent Computing and Control Systems (ICCS), Madurai, India, 15–17 May 2019; pp. 841–845. [Google Scholar]
  12. Mohammed, A.S.; Seher, S.; Yerima, S.Y.; Bashar, A. A deep learning based approach to Android botnet detection using transfer learning. In Proceedings of the 2022 14th International Conference on Computational Intelligence and Communication Networks (CICN), Al-Khobar, Saudi Arabia, 4–6 December 2022; pp. 543–548. [Google Scholar]
  13. Rahmawati, F.D.; Hadiprakoso, R.B.; Yasa, R.N. Comparison of single-view and multi-view deep learning for Android malware detection. In Proceedings of the 2022 International Conference on Information Technology Research and Innovation (ICITRI), Jakarta, Indonesia, 10 November 2022; pp. 53–58. [Google Scholar]
  14. Feng, R.; Chen, S.; Xie, X.; Meng, G.; Lin, S.W.; Liu, Y. A performance-sensitive malware detection system using deep learning on mobile devices. IEEE Trans. Inf. Forensics Secur. 2020, 16, 1563–1578. [Google Scholar] [CrossRef]
  15. Watkins, L.; Yu, Y.; Li, S.; Robinson, W.H.; Rubin, A. Using Deep Learning to Identify Security Risks of Personal Mobile Devices in Enterprise Networks. In Proceedings of the 2020 11th IEEE Annual Ubiquitous Computing, Electronics & Mobile Communication Conference (UEMCON), New York, NY, USA, 28–31 October 2020; pp. 292–297. [Google Scholar]
  16. Seneviratne, S.; Shariffdeen, R.; Rasnayaka, S.; Kasthuriarachchi, N. Self-supervised vision transformers for malware detection. IEEE Access 2023, 10, 103121–103135. [Google Scholar]
  17. Saracino, A.; Simoni, M. Graph-based android malware detection and categorization through bert transformer. In Proceedings of the 18th International Conference on Availability, Reliability and Security, Benevento Italy, 29 August–1 September 2023; pp. 1–7. [Google Scholar]
  18. Almakayeel, N. Deep learning-based improved transformer model on android malware detection and classification in internet of vehicles. Sci. Rep. 2024, 14, 25175. [Google Scholar] [CrossRef] [PubMed]
  19. Sun, Y.; Peng, H.; Chen, Y.; Jiang, B.; Wang, S.; Qiu, Y.; Wang, H.; Li, X. A Transformer Based Malicious Traffic Detection Method in Android Mobile Networks. In Proceedings of the International Conference on Advanced Data Mining and Applications, Sydney, NSW, Australia, 3–5 December 2024; Springer Nature: Singapore, 2024; pp. 370–385. [Google Scholar]
  20. Wasif, M.S.; Miah, M.P.; Hossain, M.S.; Alenazi, M.J.; Atiquzzaman, M. CNN-ViT synergy: An efficient Android malware detection approach through deep learning. Comput. Electr. Eng. 2025, 123, 110039. [Google Scholar] [CrossRef]
  21. Google for Developers. Malware Categories. Available online: https://developers.google.com/android/play-protect/phacategories (accessed on 3 April 2023).
  22. Borah, P.; Bhattacharyya, D.K.; Kalita, J.K. Malware dataset generation and evaluation. In Proceedings of the 2020 IEEE 4th Conference on Information & Communication Technology (CICT), Chennai, India, 3–5 December 2020; pp. 1–6. [Google Scholar]
  23. Wei, F.; Li, Y.; Roy, S.; Ou, X.; Zhou, W. Deep ground truth analysis of current android malware. In Proceedings of the Detection of Intrusions and Malware, and Vulnerability Assessment: 14th International Conference, DIMVA 2017, Bonn, Germany, 6–7 July 2017; Proceedings 14. Springer International Publishing: Berlin/Heidelberg, Germany, 2017; pp. 252–276. [Google Scholar]
  24. Taheri, R.; Shojafar, M.; Arabikhan, F.; Gegov, A. Unveiling vulnerabilities in deep learning-based malware detection: Differential privacy driven adversarial attacks. Comput. Secur. 2024, 146, 104035. [Google Scholar]
  25. Nadeem, M.W.; Goh, H.G.; Aun, Y.; Ponnusamy, V. A recurrent neural network based method for low-rate DDoS attack detection in SDN. In Proceedings of the 2022 3rd International Conference on Artificial Intelligence and Data Sciences (AiDAS), IPOH, Malaysia, 7–8 September 2022; pp. 13–18. [Google Scholar]
  26. Zhou, H.; Yang, X.; Pan, H.; Guo, W. An android malware detection approach based on SIMGRU. IEEE Access 2020, 8, 148404–148410. [Google Scholar]
  27. Qiu, J.; Zhang, J.; Luo, W.; Pan, L.; Nepal, S.; Xiang, Y. A survey of android malware detection with deep neural models. ACM Comput. Surv. (CSUR) 2020, 53, 1–36. [Google Scholar] [CrossRef]
  28. Sasidharan, S.K.; Thomas, C. Memdroid-lstm based malware detection framework for android devices. In Proceedings of the 2021 IEEE Pune Section International Conference (PuneCon), Pune, India, 16–19 December 2021; pp. 1–6. [Google Scholar]
  29. Hamad, R.A.; Yang, L.; Woo, W.L.; Wei, B. Joint learning of temporal models to handle imbalanced data for human activity recognition. Appl. Sci. 2020, 10, 5293. [Google Scholar] [CrossRef]
Figure 1. Methodology overview.
Electronics 14 01230 g001
Figure 2. Representation of benign and malware apps.
Electronics 14 01230 g002
Figure 3. Feature correlation heatmap.
Electronics 14 01230 g003
Figure 4. Trandroid’s transformer classifier architecture.
Electronics 14 01230 g004
Figure 5. RNN architecture.
Electronics 14 01230 g005
Figure 6. GRU architecture.
Electronics 14 01230 g006
Figure 7. CNN architecture.
Electronics 14 01230 g007
Figure 8. LSTM architecture.
Electronics 14 01230 g008
Figure 9. CNN-LSTM architecture.
Electronics 14 01230 g009
Figure 10. Transformer model accuracy rate.
Electronics 14 01230 g010
Figure 11. Transformer model loss rate.
Electronics 14 01230 g011
Figure 12. GRU model accuracy rate.
Electronics 14 01230 g012
Figure 13. RNN model accuracy rate.
Electronics 14 01230 g013
Figure 14. LSTM model accuracy rate.
Electronics 14 01230 g014
Figure 15. CNN model accuracy rate.
Electronics 14 01230 g015
Figure 16. CNN-LSTM model accuracy rate.
Electronics 14 01230 g016
Table 1. Key differences of the proposed work with the related work.
AuthorsDatasetApproachGap
Huang et al. [10]Custom dataset based on data collected from user feedbackFraud detection using DNN and Inception-V3It focuses only on specific threats and lacks generalization since it is limited to a custom dataset.
Sandeep [11]Custom dataset from Google Play and VirusShareDeep learning model with custom hyper-parametersIt lacks generalization and the ability to scale to a variety of threats.
Mohammed et al. [12]Custom Dataset from ICSX Android Botnet and DEX filesTransfer learning using MobileNetv2 and ResNet101It focuses on botnets and uses only limited image-based features not metadata and diverse inputs.
Fika et al. [13]Custom datasetLSTM-MLPIt lacks diversity in the features and metadata since it is limited to permissions and system calls.
Feng et al. [14]Custom dataset collected from Drebin, Genome, VirusShare, Contagio, and PwnzenBi-GRUEven though it is diverse, it is very old, lacking holistic coverage.
Watkins et al. [15]Custom dataset based on experimental dataMLP for security risk identificationIt uses a limited set of experimental data and lacks a holistic threat analysis.
Sachith et al. [16]MalNetVision transformerThe dataset is highly imbalanced and the approach focuses mostly on image-based threat detection, making it less applicable to broader metadata or diverse features.
Saracino and Simoni [17]DrebinBERTThe graph representation of Android apps may introduce a computational overhead and may not generalize to evolving malware.
Almakayeel [18]DrebinTransformerIt focuses on IoV malware and is less applicable to general Android security.
Sun et al. [19]Mobile network trafficTransformerIt is limited to network data, missing important application features.
Wasif et al. [20]CICAndMal2017CNN-LSTMIt relies on image representations of features, potentially losing other semantic relationships.
Table 2. Attack type to malware family mapping.
Attack TypeMalware Family
AdwareAirpush, Gorpo, Kemoge, Kuguo, VikingHorde, Youmi
BackdoorAndroRAT, DroidKungFu
Billing FraudBoxer, RuMMS, SmsZombie
PhishingBankBot, Bankun, SlemBunk
SpywareAndroRAT, GoldDream, Leech, SpyBubble, Vmvol
RansomwareFakeAV, Fobus, Jisut, Koler, SimpleLocker, Svpeng
TrojanAples, FakeAngry, FakePlayer, FakeTimer, FakeUpdates, Ksapp, Kuguo, Opfake, Winge, Zitmo
Hostile DownloaderDowgin, UpdtKiller
Elevated Privilege AbuseDroidKungFu, GingerMaster, Lotoor, Obad, Triada, Ztorg
BotnetVikingHorde
Table 3. Configuration of the transformer classifier.
ParameterValue
Attention heads4
Key dimension128
Dense layer neurons64
Number of transformer encoder1
OptimizerAdam with 0.001 learning rate
Batch size32
Dropout0.1
Number of transformer encoder layers1
Loss functionCrossEntropyLoss
Table 4. Summary of classifiers results.
MetricCNN-LSTMCNNRNNGRULSTMTransformer
Accuracy84.84%93.93%92.48%94.73%93.98%99.25%
Sensitivity80.76%76.92%81.25%81.25%81.25%99.25%
Precision58.33%90.90%86.66%96.29%92.85%99.26%
F1-Score67.74%83.33%83.87%88.13%86.66%99.26%
AUC-ROC83.30%87.5%87.64%90.12%89.63%98.76%
FPR12%6.06%7.52%5.26%6.02%0.95%
FNR12%6.06%7.52%5.26%6.02%0.95%
Training Time (s)63.1523.019.8212.8210.43134.63
Number of Parameters10,421243,96965,093183,429174,653624,514
Model Size (KB)40.71953254.27716.52576.772439.5
Table 5. Trandroid accuracy vs. other approaches.
AuthorsDatasetModelAccuracy
Feng et al. [14]DrebinBi-GRU96.87%
Fika et al. [13]ChimeraMultiview82.00%
Huang et al. [10]Self-madeInception-v390.00%
Mohammed et al. [12]ISCX and DEXCNN91.00%
Sachith [16]MalNetVision transformer97.00%
Sandeep [11]Self-madeDeep learning94.64%
TrandroidTUANDROMDTransformer99.25%
Disclaimer/Publisher’s Note: The statements, opinions and data contained in all publications are solely those of the individual author(s) and contributor(s) and not of MDPI and/or the editor(s). MDPI and/or the editor(s) disclaim responsibility for any injury to people or property resulting from any ideas, methods, instructions or products referred to in the content.

