A Novel Two-Stage Superpixel CFAR Method Based on Truncated KDE Model for Target Detection in SAR Images

Abstract
1. Introduction
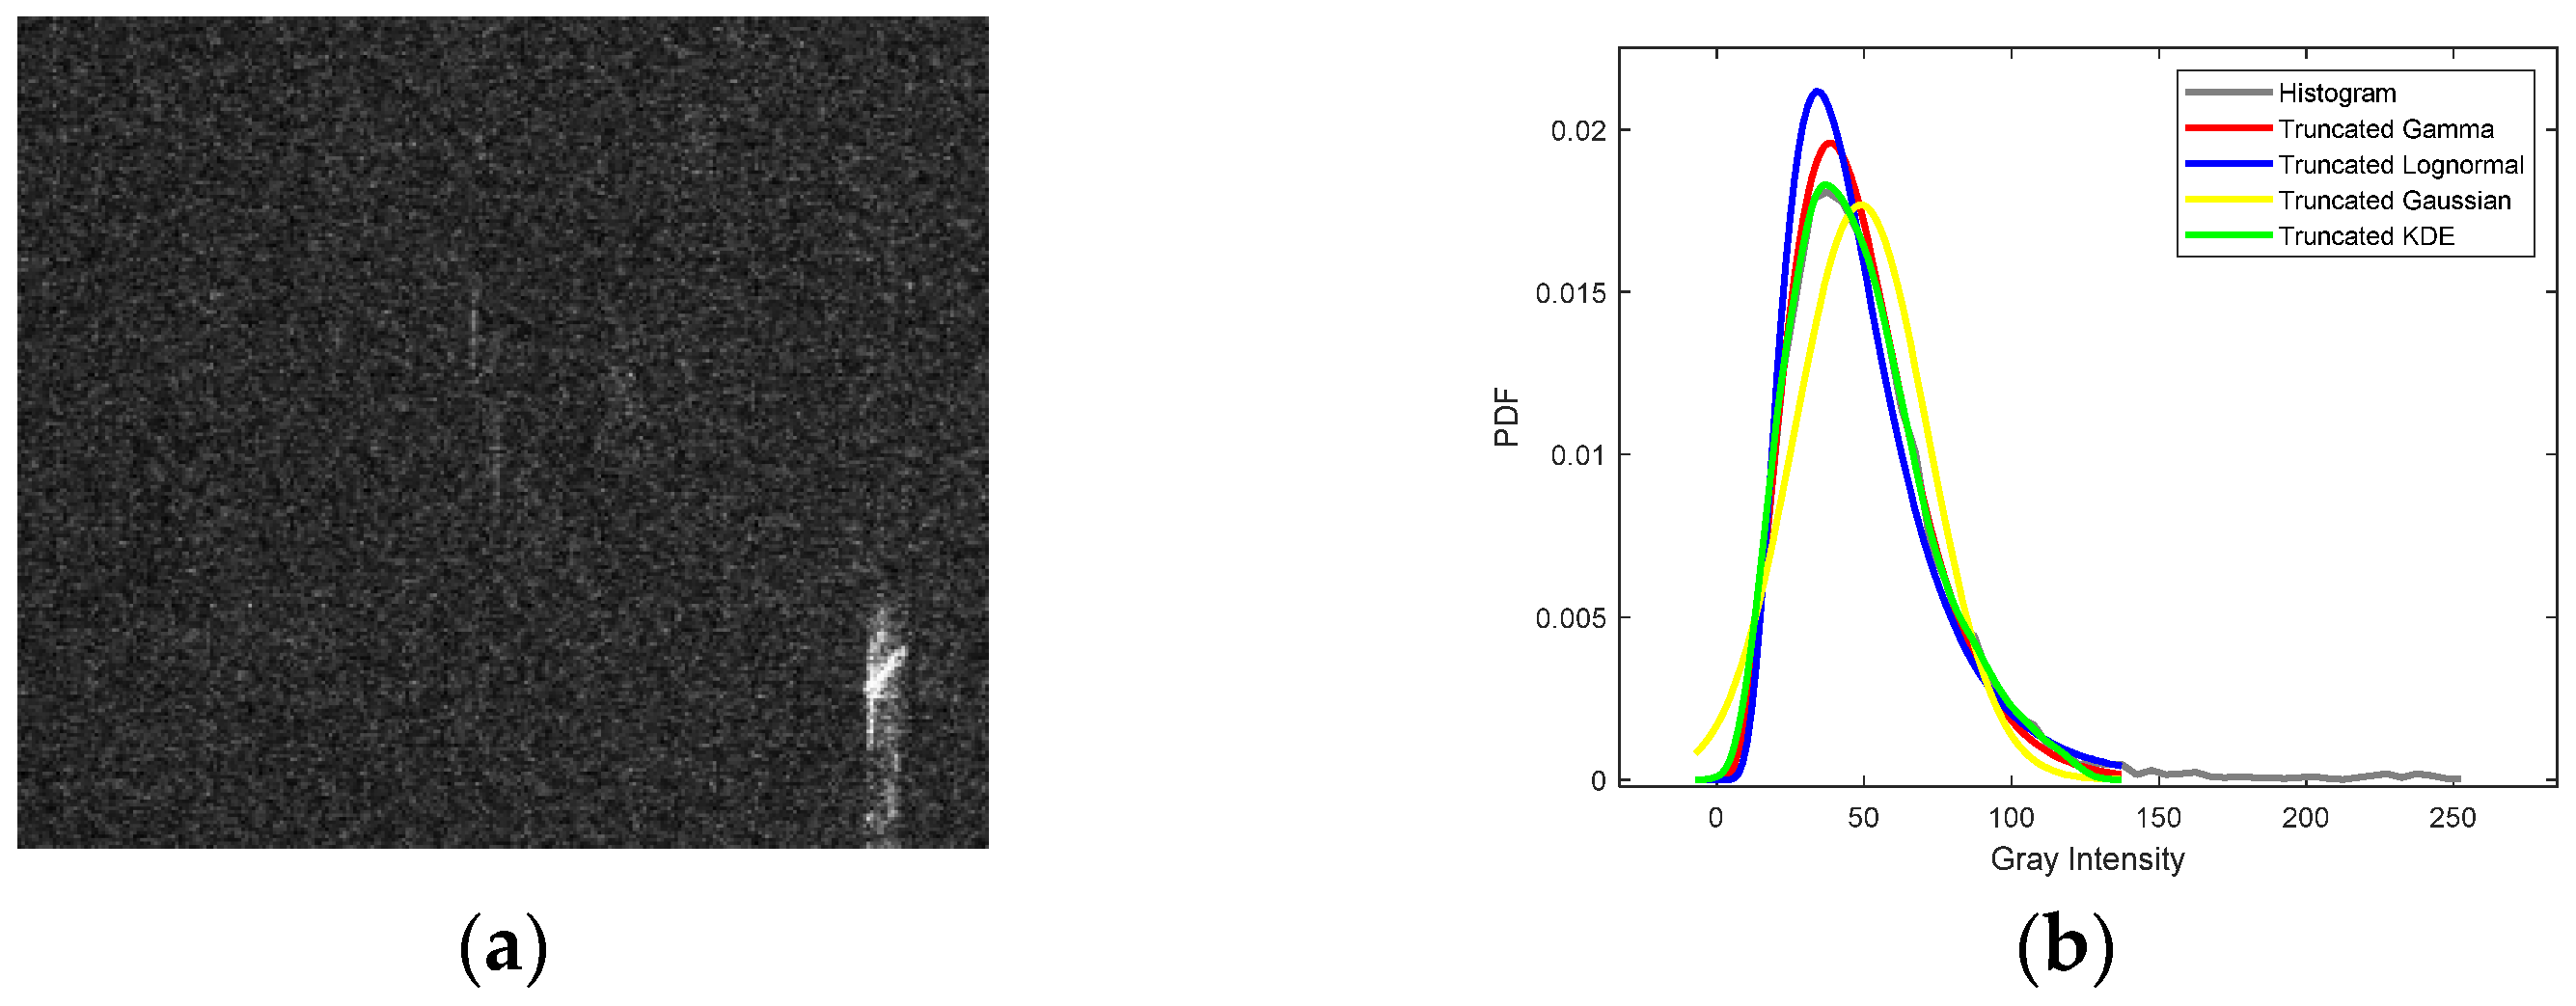
2. Truncated KDE Modeling
3. Superpixel CFAR Based on Truncated KDE Model
- (1)
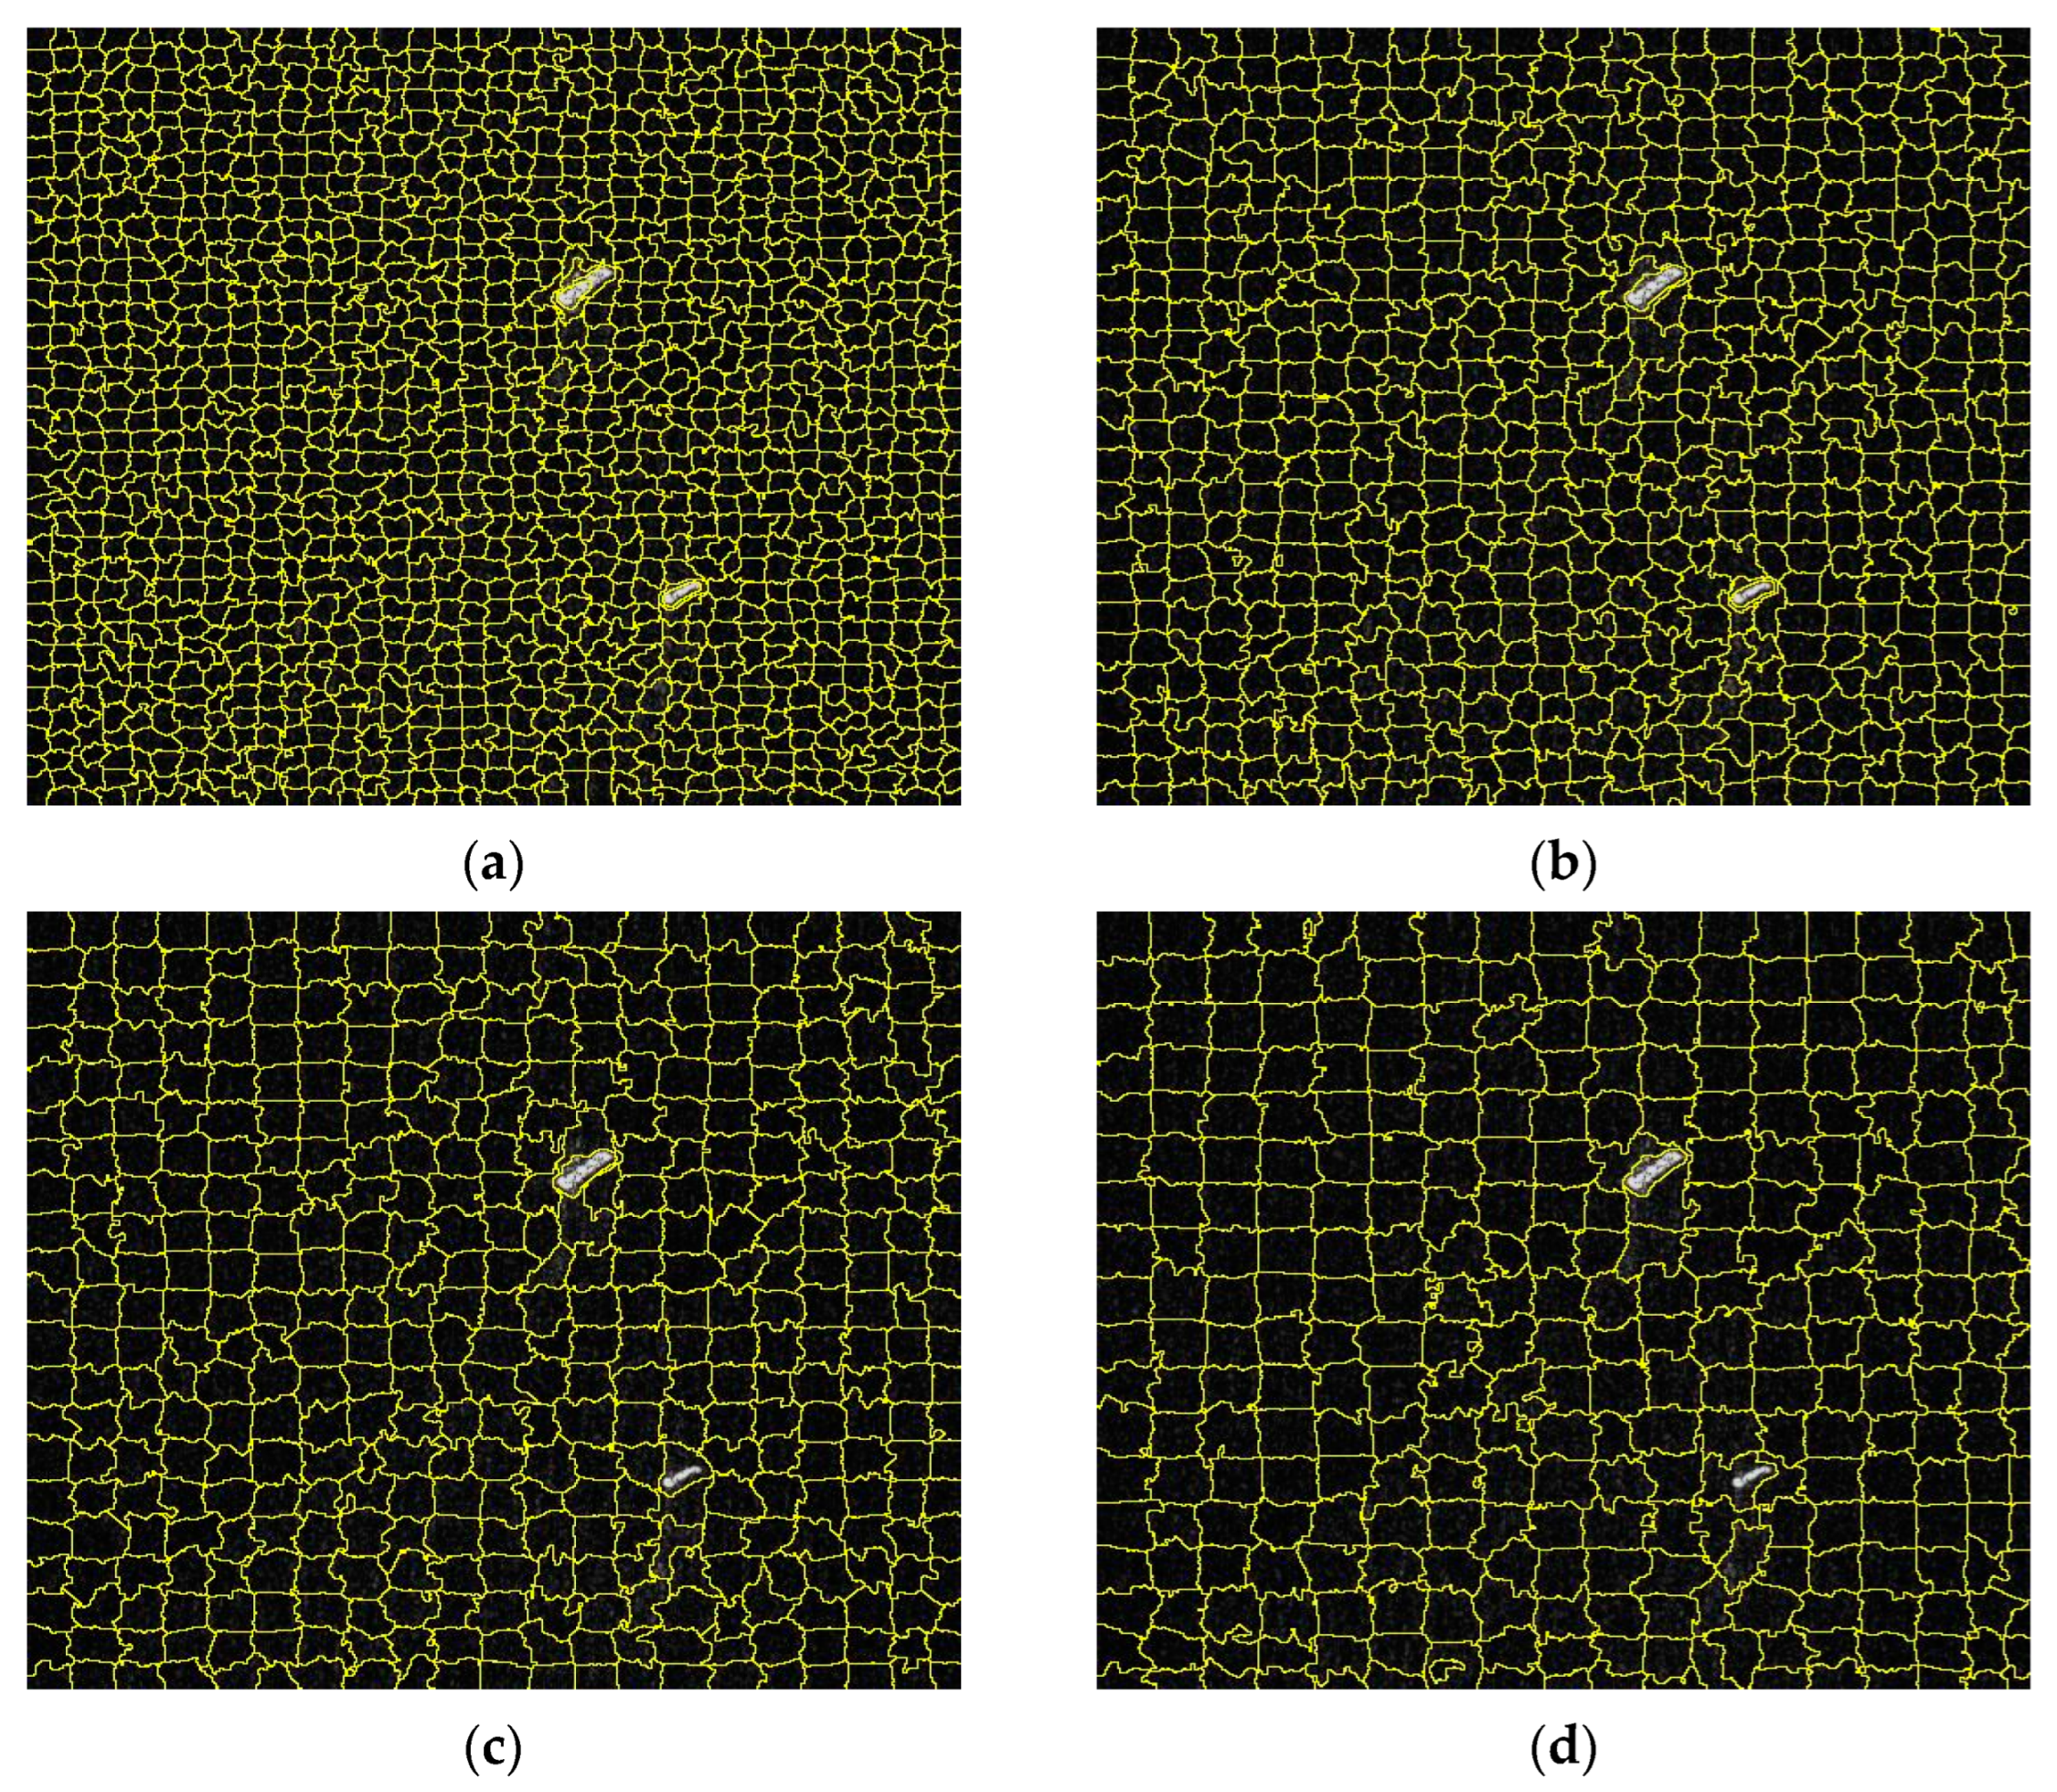
- SLIC segmentation;
- (2)
- Global CFAR detection;
- (3)
- Local CFAR detection.
3.1. Superpixel Segmentation
3.2. Global CFAR
3.3. Local CFAR
3.3.1. Local Contrast
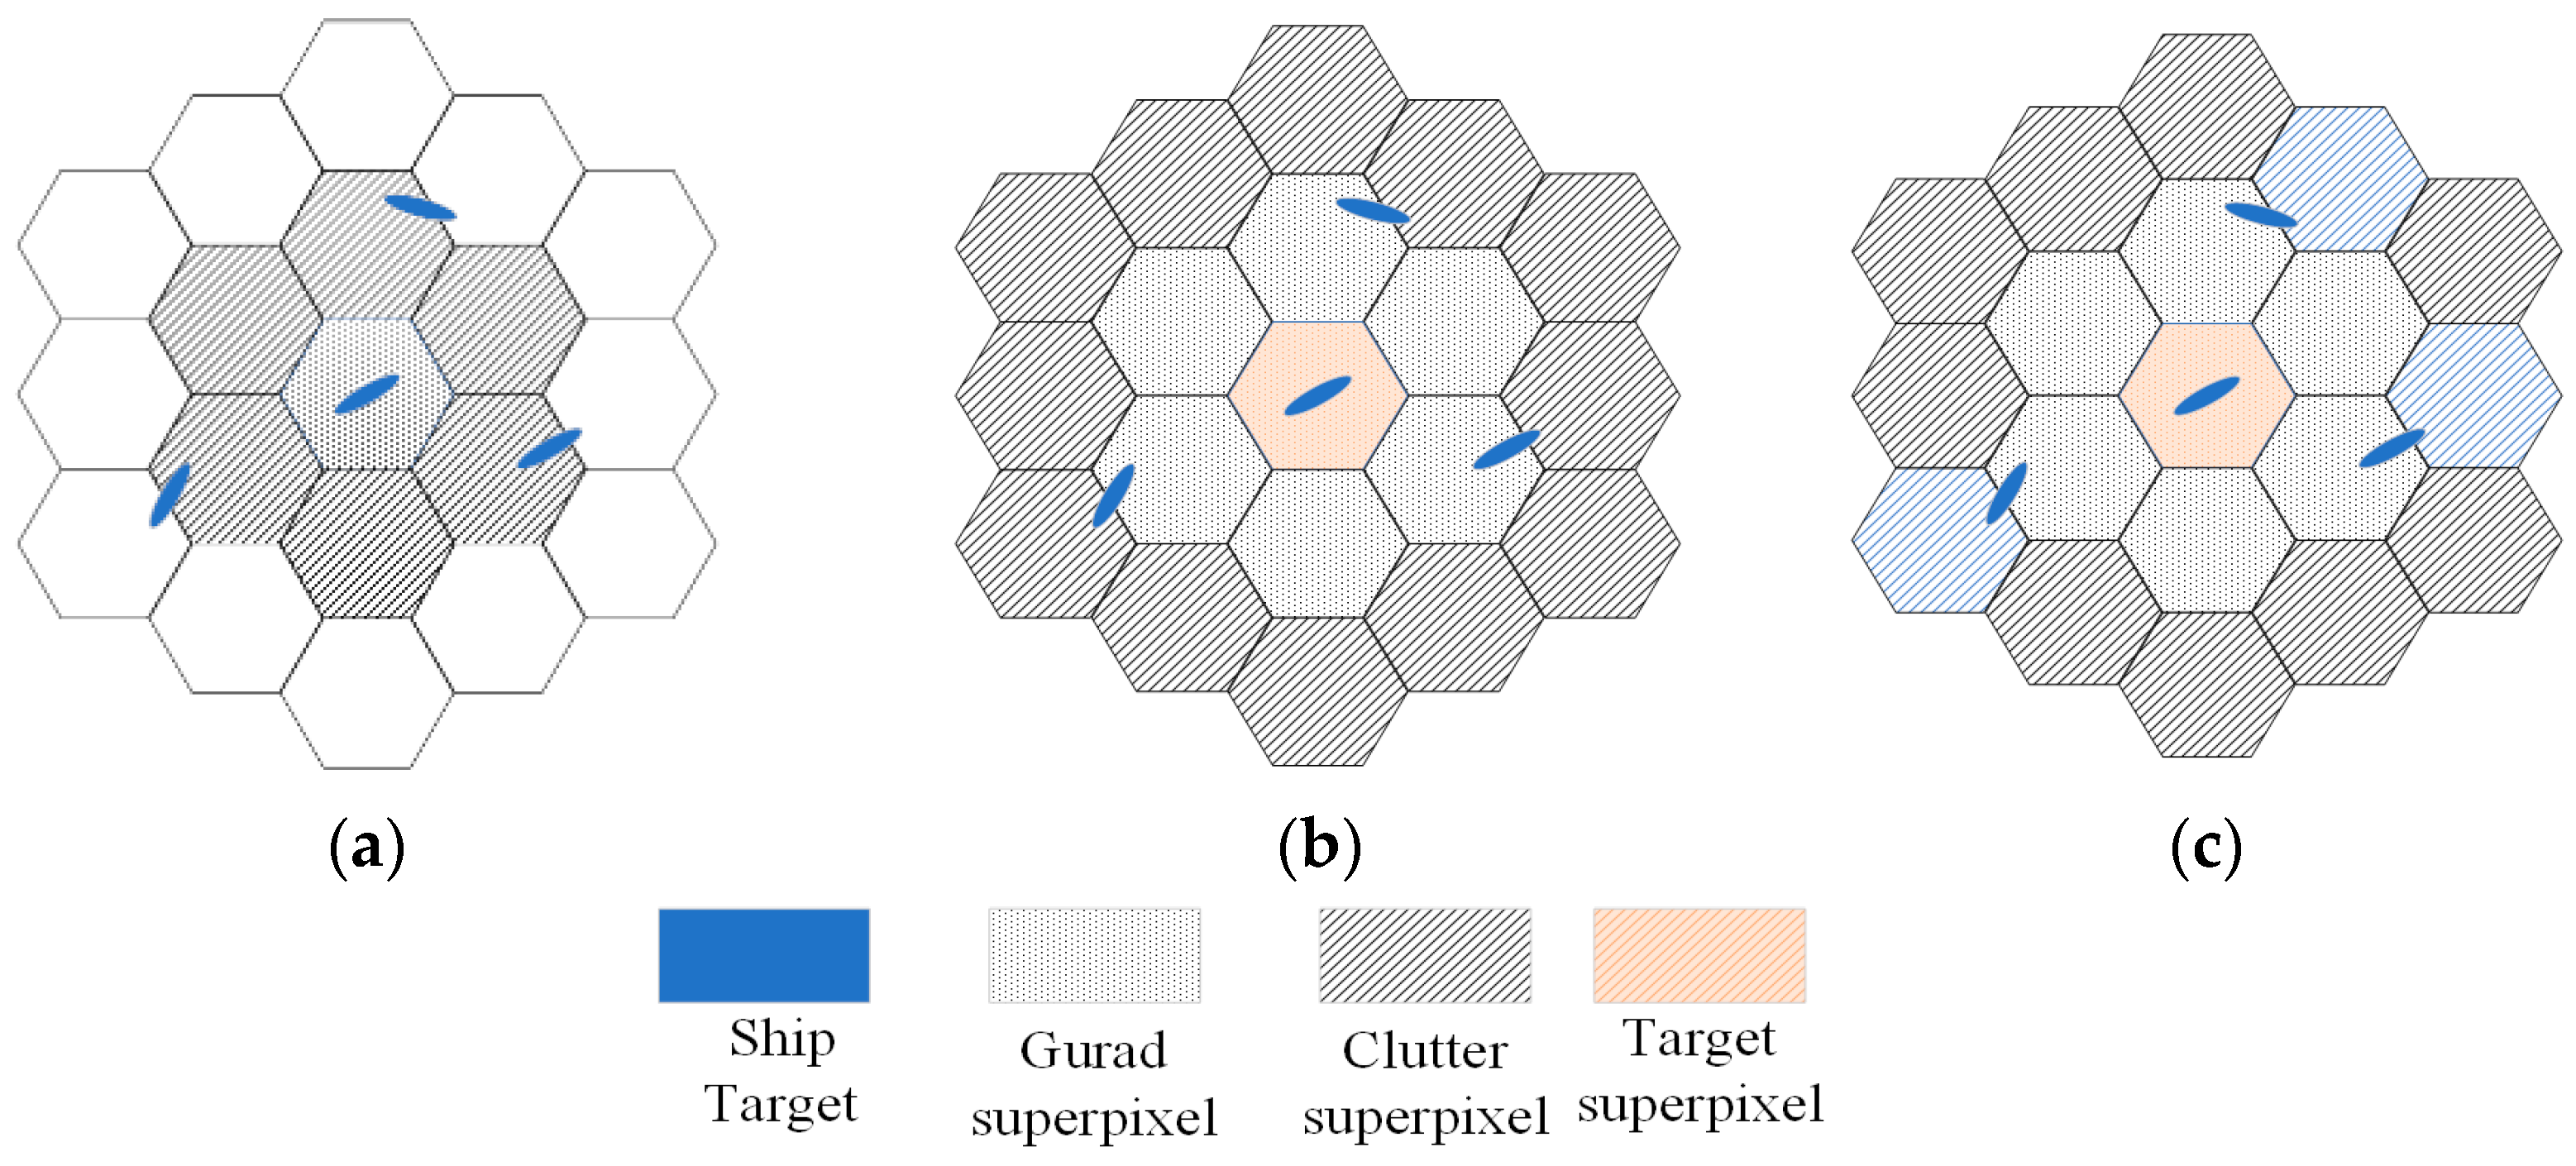
3.3.2. Superpixel-Based Detection
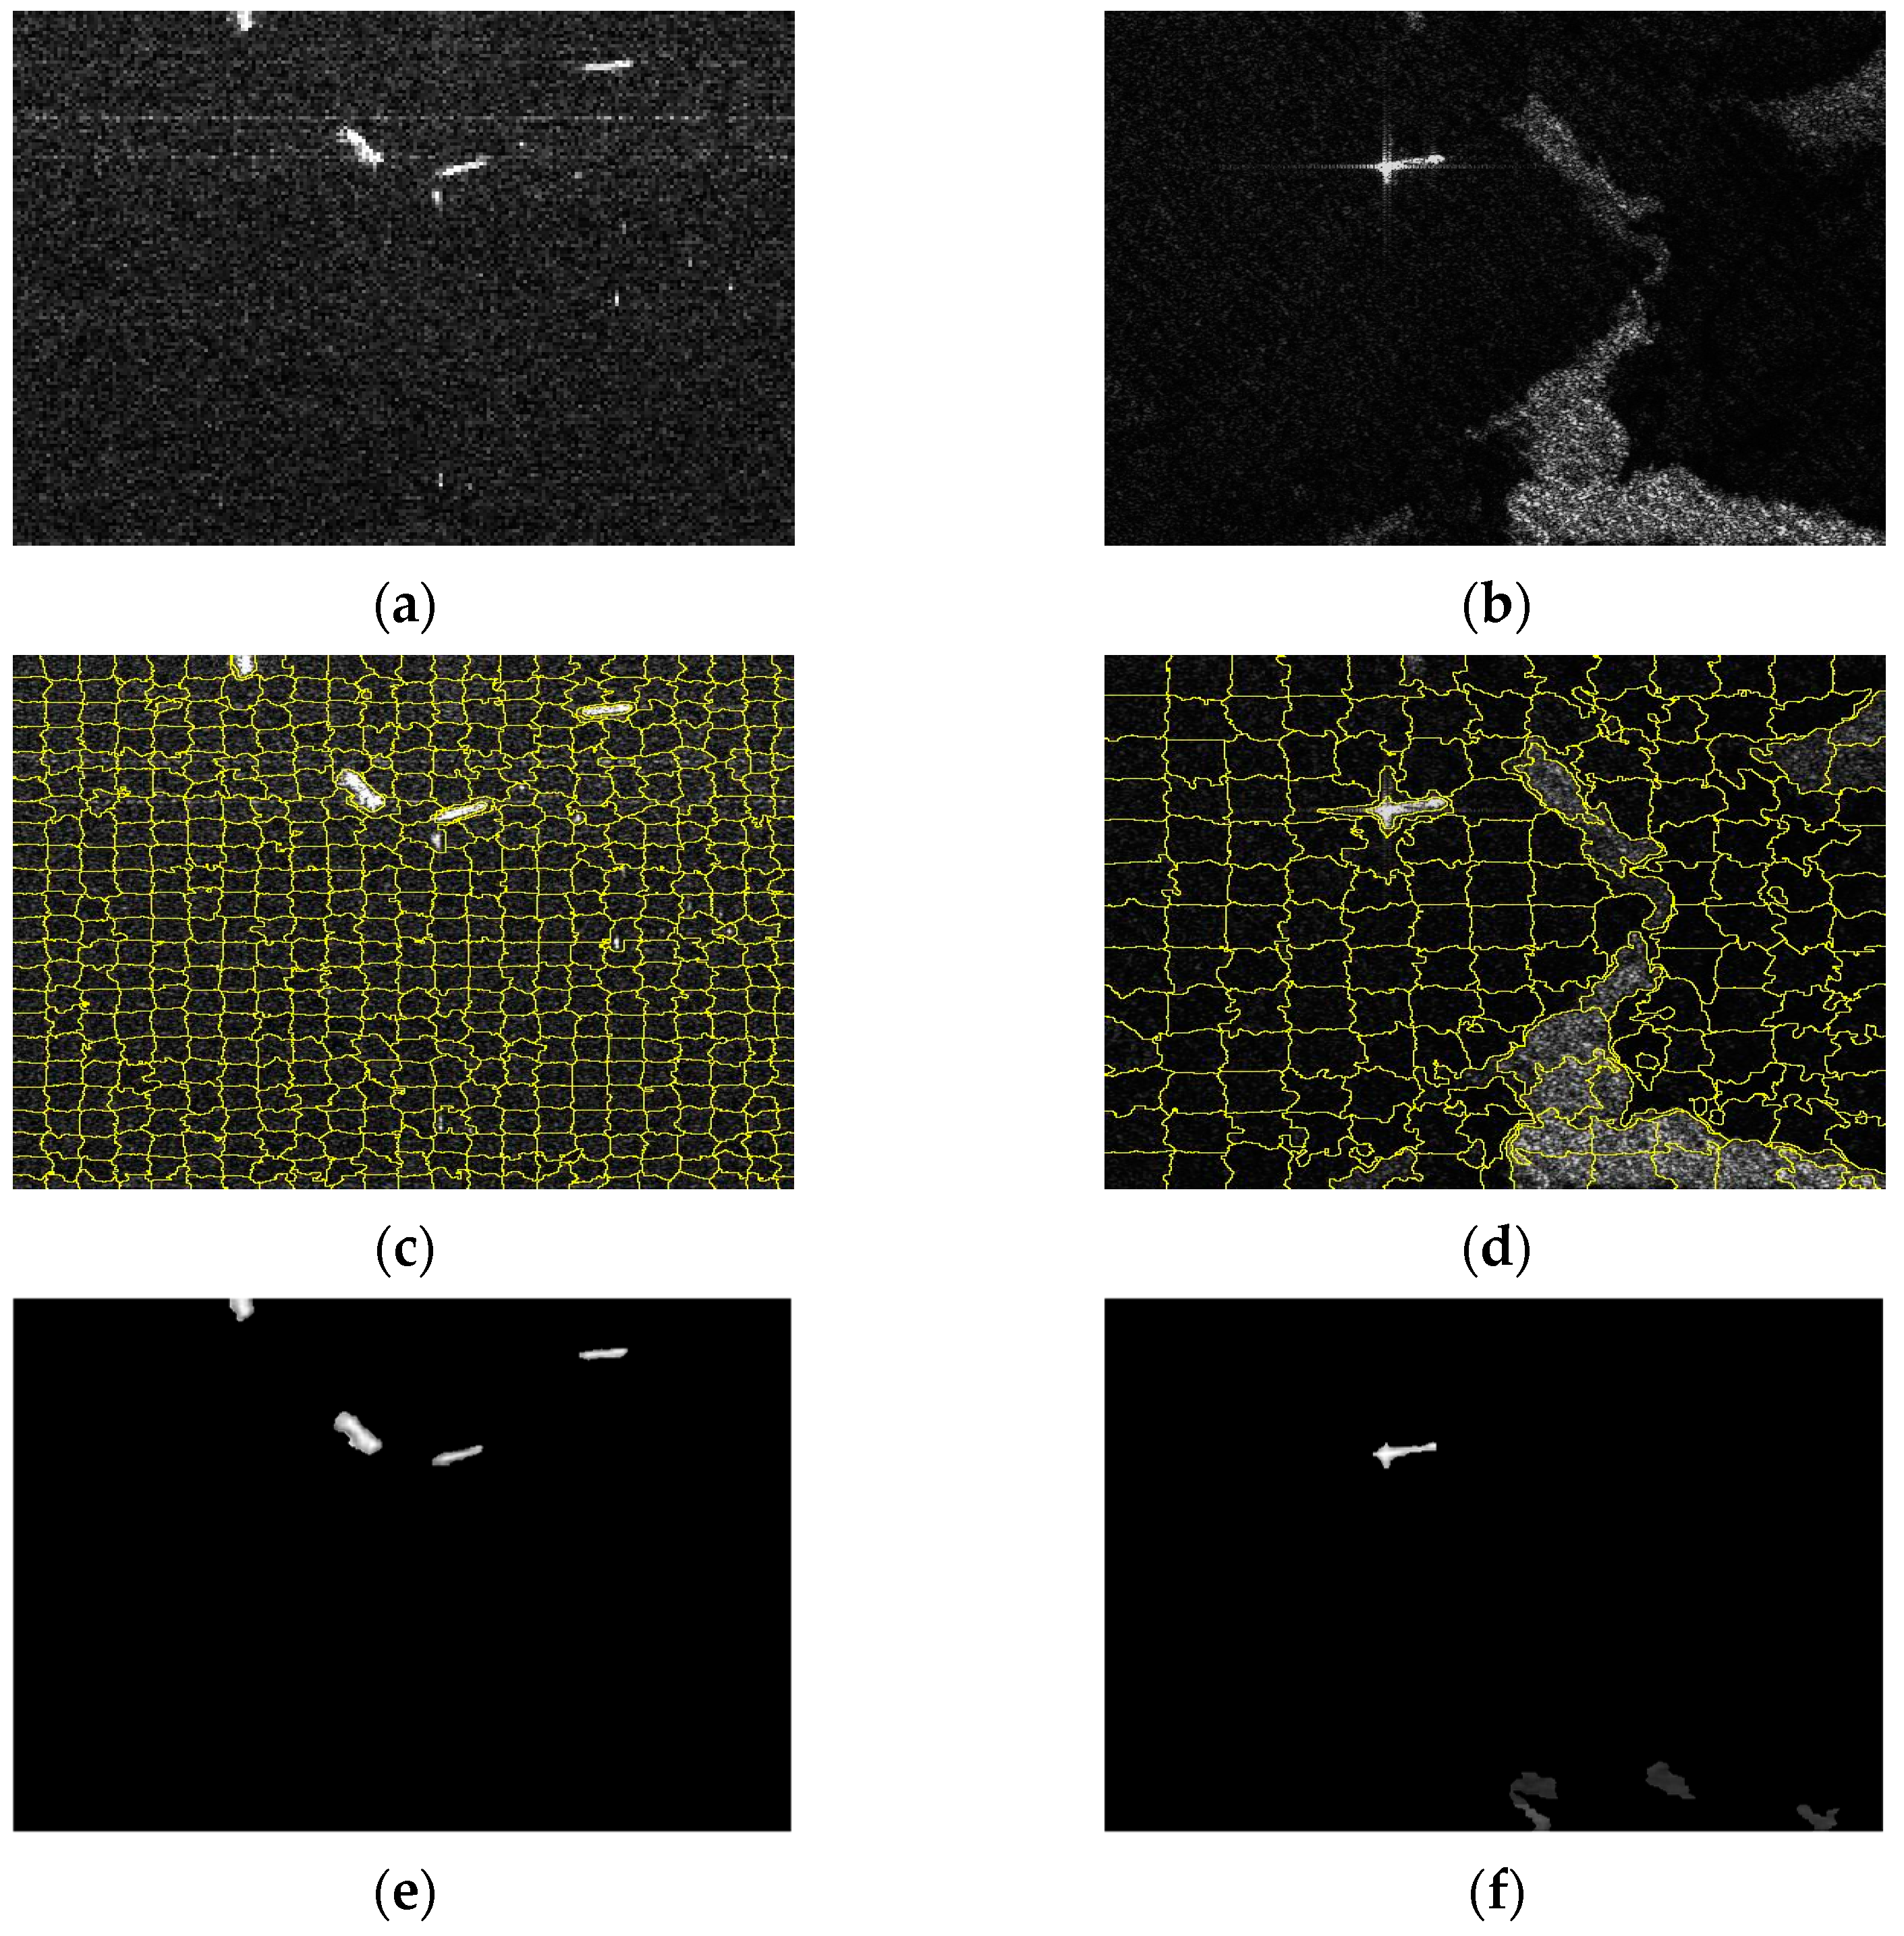
4. Results and Discussion
4.1. Experiment 1
4.2. Experiment 2
4.3. Experiment 3
4.4. Experiment 4
5. Conclusions
Author Contributions
Funding
Data Availability Statement
Conflicts of Interest
References
- Eldhuset, K. An automatic ship and ship wake detection system for spaceborne SAR images in coastal regions. IEEE Trans. Geosci. Remote Sens. 1996, 34, 1010–1019. [Google Scholar] [CrossRef]
- Tupin, F.; Maitre, H.; Mangin, J.-F.; Nicolas, J.-M.; Pechersky, E. Detection of linear features in SAR images: Application to road network extraction. IEEE Trans. Geosci. Remote Sens. 1998, 36, 434–453. [Google Scholar]
- Nagler, T.; Rott, H. Retrieval of wet snow by means of multitemporal SAR data. IEEE Trans. Geosci. Remote Sens. 2000, 38, 754–765. [Google Scholar]
- Mason, D.C.; Speck, R.; Devereux, B.; Schumann, G.J.P.; Neal, J.C.; Bates, P.D. Flood Detection in Urban Areas Using TerraSAR-X. IEEE Trans. Geosci. Remote Sens. 2010, 48, 882–894. [Google Scholar]
- Novak, L.M.; Owirka, G.J.; Brower, W.S.; Weaver, A.L. The Automatic Target Recognition System in SAIP. Linc. Lab. J. 1997, 10. [Google Scholar]
- Smith, M.; Varshney, P. VI-CFAR: A novel CFAR algorithm based on data variability. In Proceedings of the 1997 IEEE National Radar Conference, Syracuse, NY, USA, 13–15 May 1997. [Google Scholar]
- Hofele, F. An innovative CFAR algorithm. In Proceedings of the 2001 CIE International Conference on Radar Proceedings (Cat No.01TH8559), Beijing, China, 15–18 October 2001. [Google Scholar]
- Blake, S. OS-CFAR theory for multiple targets and nonuniform clutter. IEEE Trans. Aerosp. Electron. Syst. 1988, 24, 785–790. [Google Scholar] [CrossRef]
- Li, N.; Pan, X.; Yang, L.; Huang, Z.; Wu, Z.; Zheng, G. Adaptive CFAR Method for SAR Ship Detection Using Intensity and Texture Feature Fusion Attention Contrast Mechanism. Sensors 2022, 22, 8116. [Google Scholar] [CrossRef]
- Gao, G.; Liu, L.; Zhao, L.; Shi, G.; Kuang, G. An Adaptive and Fast CFAR Algorithm Based on Automatic Censoring for Target Detection in High-Resolution SAR Images. IEEE Trans. Geosci. Remote Sens. 2008, 47, 1685–1697. [Google Scholar]
- Cui, Y.; Zhou, G.; Yang, J.; Yamaguchi, Y. On the Iterative Censoring for Target Detection in SAR Images. IEEE Geosci. Remote Sens. Lett. 2011, 8, 641–645. [Google Scholar]
- An, W.; Xie, C.; Yuan, X. An Improved Iterative Censoring Scheme for CFAR Ship Detection With SAR Imagery. IEEE Trans. Geosci. Remote Sens. 2014, 52, 4585–4595. [Google Scholar]
- Tao, D.; Anfinsen, S.N.; Brekke, C. Robust CFAR Detector Based on Truncated Statistics in Multiple-Target Situations. IEEE Trans. Geosci. Remote Sens. 2016, 54, 117–134. [Google Scholar]
- Ai, J.; Yang, X.; Song, J.; Dong, Z.; Jia, L.; Zhou, F. An Adaptively Truncated Clutter-Statistics-Based Two-Parameter CFAR Detector in SAR Imagery. IEEE J. Ocean. Eng. 2017, 43, 267–279. [Google Scholar] [CrossRef]
- Li, T.; Liu, Z.; Xie, R.; Ran, L. An Improved Superpixel-Level CFAR Detection Method for Ship Targets in High-Resolution SAR Images. IEEE J. Sel. Top. Appl. Earth Obs. Remote Sens. 2017, 11, 184–194. [Google Scholar]
- Pappas, O.; Achim, A.; Bull, D. Superpixel-Level CFAR Detectors for Ship Detection in SAR Imagery. IEEE Geosci. Remote Sens. Lett. 2018, 15, 1397–1401. [Google Scholar]
- Li, T.; Peng, D.; Chen, Z.; Guo, B. Superpixel-Level CFAR Detector Based on Truncated Gamma Distribution for SAR Images. IEEE Geosci. Remote Sens. Lett. 2020, 18, 1421–1425. [Google Scholar] [CrossRef]
- Zhang, L.; Zhang, Z.; Lu, S.; Xiang, D.; Su, Y. Fast Superpixel-Based Non-Window CFAR Ship Detector for SAR Imagery. Remote Sens. 2022, 14, 2092. [Google Scholar] [CrossRef]
- Cui, Y.; Yang, J.; Yamaguchi, Y.; Singh, G.; Park, S.-E.; Kobayashi, H. On Semiparametric Clutter Estimation for Ship Detection in Synthetic Aperture Radar Images. IEEE Trans. Geosci. Remote Sens. 2012, 51, 3170–3180. [Google Scholar] [CrossRef]
- Wang, W.; Zhang, X.; Sun, W.; Huang, M. A Novel Method of Ship Detection under Cloud Interference for Optical Remote Sensing Images. Remote Sens. 2022, 14, 3731. [Google Scholar] [CrossRef]


| KL Distance | KL Distance | |
|---|---|---|
| Truncated Model | ||
| Truncated Gamma | 0.0239 | |
| Truncated Lognormal | 0.0447 | |
| Truncated Gaussian | 0.1611 | |
| Truncated KDE | 0.0024 | |
| Method | Algorithm | AUC Value |
|---|---|---|
| Method 1 | OS-CFAR | 0.7621 |
| Method 2 | SP-CFAR | 0.8123 |
| Method 3 | TS-SP-CFAR | 0.8674 |
| Method 4 | The proposed | 0.8918 |
| Method | Algorithm | ACC |
|---|---|---|
| Method 1 | OS-CFAR | 0.7867 |
| Method 2 | SP-CFAR | 0.8512 |
| Method 3 | TS-SP-CFAR | 0.8893 |
| Method 4 | The proposed | 0.9315 |
| Number of Superpixels (K) | |||||||
|---|---|---|---|---|---|---|---|
| S = 1000 | S = 1500 | S = 2000 | S = 2500 | ||||
| PD (%) | Pfa (%) | PD (%) | Pfa (%) | PD (%) | Pfa (%) | PD (%) | Pfa (%) |
| 87.31 | 0.34 | 91.24 | 0.35 | 92.72 | 0.32 | 92.32 | 0.36 |
Disclaimer/Publisher’s Note: The statements, opinions and data contained in all publications are solely those of the individual author(s) and contributor(s) and not of MDPI and/or the editor(s). MDPI and/or the editor(s) disclaim responsibility for any injury to people or property resulting from any ideas, methods, instructions or products referred to in the content. |
© 2025 by the authors. Licensee MDPI, Basel, Switzerland. This article is an open access article distributed under the terms and conditions of the Creative Commons Attribution (CC BY) license (https://creativecommons.org/licenses/by/4.0/).
Share and Cite
Li, S.; Wei, H.; Mao, Y.; Fan, J. A Novel Two-Stage Superpixel CFAR Method Based on Truncated KDE Model for Target Detection in SAR Images. Electronics 2025, 14, 1327. https://doi.org/10.3390/electronics14071327
Li S, Wei H, Mao Y, Fan J. A Novel Two-Stage Superpixel CFAR Method Based on Truncated KDE Model for Target Detection in SAR Images. Electronics. 2025; 14(7):1327. https://doi.org/10.3390/electronics14071327
Chicago/Turabian StyleLi, Si, Hangcheng Wei, Yunlong Mao, and Jiageng Fan. 2025. "A Novel Two-Stage Superpixel CFAR Method Based on Truncated KDE Model for Target Detection in SAR Images" Electronics 14, no. 7: 1327. https://doi.org/10.3390/electronics14071327
APA StyleLi, S., Wei, H., Mao, Y., & Fan, J. (2025). A Novel Two-Stage Superpixel CFAR Method Based on Truncated KDE Model for Target Detection in SAR Images. Electronics, 14(7), 1327. https://doi.org/10.3390/electronics14071327