Abstract
Small defects on the surface of copper strips have a significant impact on key properties such as electrical conductivity and corrosion resistance, and existing inspection techniques struggle to meet the demand in terms of accuracy and generalisability. Although there have been some studies on metal surface defect detection, there is a relative lack of research on highly reflective copper strips. In this paper, a lightweight and efficient copper strip defect detection algorithm, SC-AttentiveNet, is proposed, aiming to solve the problems of the large model size, slow speed, insufficient accuracy and poor generalisability of existing models. The algorithm is based on ConvNeXt V2, and combines the SCDown module and group normalisation to design the SCGNNet feature extraction network, which significantly reduces the computational overhead while maintaining excellent feature extraction capability. In addition, the algorithm introduces the SPPF-PSA module to enhance the multi-scale feature extraction capability, and constructs a new neck feature fusion network via the HD-CF Fusion Block module, which further enhances the feature diversity and fine granularity. The experimental results show that SC-AttentiveNet has a mAP of 90.11% and 64.14% on the KUST-DET and VOC datasets, respectively, with a parameter count of only 6.365 MB and a computational complexity of 14.442 GFLOPs. Tests on the NEU-DET dataset show that the algorithm has an excellent generalisation performance, with a mAP of 76.41% and a detection speed of 78 FPS, demonstrating a wide range of practical application potential.
1. Introduction
Copper strip products are important industrial materials with a wide range of applications in electronic components, electrical equipment, communication systems, construction materials, and many other fields. The quality of copper strips directly influences the performance, reliability, and service life of the end product [1]. However, copper strips can be susceptible to various factors during the production process, leading to surface or internal defects. As a key factor in the quality control of copper strip production, surface defects have a crucial impact on product performance.
The surface defects of copper strip products can be broadly classified into two categories: intrinsic and extrinsic. Intrinsic defects include black spots, oil spots, scratches, and pits, while extrinsic defects encompass any external factors that affect the surface of the copper strip, such as contamination, oxidation, and corrosion. These defects may impact the mechanical properties, conductivity and appearance of the copper strips, and also affect the quality of subsequent products. Therefore, timely and accurate detection of surface defects on copper strip is very important for ensuring product quality and reducing potential economic losses.
Currently, the detection of surface defects on copper strips primarily employs three methods: traditional visual inspection, non-contact detection, and image detection based on deep learning. Among these methods, traditional visual inspection suffers from limited operational efficiency, while non-contact detection techniques such as surface wave detection [2] and eddy current detection [3] face significant deployment challenges in copper strip production environments. The equipment tends to be cumbersome in structure and lacks portability, with detection outputs failing to visually characterize defect morphology.
With advancements in technology, non-destructive and contactless image-based detection methods have gradually become the focus of the industry [2]. These methods can quickly and accurately identify surface defects, compared to other non-contact detection methods, and they are easier to implement online detection. The introduction of deep learning has significantly enhanced the capabilities of image detection, with algorithms analyzing large amounts of labeled data to automatically extract features, ensuring high precision in defect identification. Compared to traditional methods, these advanced technologies demonstrate clear advantages in handling complex surface defects, better meeting the high standards of efficiency and quality required in modern industry [3].
Deep learning-based target defect detection algorithms are typically classified into two categories: two-stage detection algorithms and single-stage detection algorithms. Representative algorithms in the former category include R-CNN [4], Fast R-CNN [5], Faster R-CNN [6], and Mask R-CNN [7], among others. These algorithms are renowned for their precision in detecting defects, yet their processing speed is relatively sluggish. In contrast, single-stage detection algorithms, exemplified by the SSD [8] and YOLO [9,10,11] series, are distinguished by their rapid detection capabilities, rendering them more efficient alternatives.
According to the literature search results, current research on surface defect image detection of metal rolled products mainly focuses on steel plates, with relatively less research on surface defect image detection of copper strips. However, there are differences in image detection between steel material and copper material, mainly manifested in two aspects: (1) copper materials are more sensitive to light noise, and the difficulty of detection is also greater; (2) copper strips, as the substrate of products, have higher requirements for surface quality in subsequent products, thus requiring higher detection accuracy. There are the following urgent problems in image detection of surface defects on copper strip:
- (1)
- Surface defects have a more significant impact: compared to other metals, small defects on the surface of copper strips have a more significant negative impact on core properties such as electrical conductivity and corrosion resistance. These defects may not only lead to product failure, but also seriously reduce its overall performance and service life.
- (2)
- Research is relatively scarce: at present, there are fewer studies on surface defects of copper strips. Existing image detection techniques are mostly focused on steel materials and lack in-depth exploration of image detection of surface defects on copper strips.
- (3)
- Insufficient detection accuracy: Due to the complex optical characteristics of the surface of the copper strip, and the extremely high requirements for detection accuracy, the existing detection methods are difficult to ensure high accuracy while maintaining stability. This makes the accurate detection of copper strip defects challenging in practice.
We propose a lightweight image detection algorithm of surface defects on copper strips called SC-AttentiveNet, and the main research work is as follows:
- (1)
- Designing an efficient SCGNNet feature extraction network: based on ConvNeXt V2, by using the SCDown (Spatial-Channel decoupling Downsampling) module and group normalization, the SCGNNet feature extraction module is redesigned, which reduces the number of references and computational overheads while maintaining a high feature extraction capability, thus improving the inference speed and detection performance.
- (2)
- Introduction of SPPF and PSA modules: with reference to the SPPF structure and PSA attention mechanism in YOLOv10, it further enhances the ability to extract multi-scale features, effectively utilizes spatial information, and improves the robustness of the model to ensure that defects can still be accurately detected in complex environments.
- (3)
- Design of HD-CF feature fusion module: based on C2FCIB, Dysample up-sampling module and HAM attention mechanism, the HD-CF Fusion Block structure is proposed, which enhances the diversity and fine-grainedness of features by fusing them with the multi-scale features output from the backbone network, effectively reduces the loss of information, and improves the detection accuracy.
- (4)
- Experimental validation: Experiments on the KUST-DET, VOC07 + 12 and NEU-DET datasets validate the superiority of the SC-AttentiveNet algorithm. The experimental results show that the algorithm has certain advantages over existing mainstream methods in terms of inference speed, computational resources and detection accuracy, and has good robustness and generalization ability.
2. Related Work
2.1. Detection Methods of Surface Defects on Copper Strip
At present, there is relatively little research on the image detection of surface defects on copper strips. The following two studies are representative and have achieved certain results. Yang et al. [12] proposed the AMTR-YOLO copper surface defect detection algorithm based on YOLOv5, which introduces the feature extraction module CSPtrans that incorporates Transformer’s self-attention mechanism and constructs a new feature fusion network Amsf, and the improved algorithm achieves a mAP of 95.17% on the surface defects dataset of copper plate. Wang et al. [13] used YOLOv4 as the baseline model, and improved the algorithm using a big data-driven deep learning strategy, which aimed to solve the problem of difficult to quickly locate and identify the surface defects generated in the production process of copper metal plates and strips due to their diverse forms and random locations, and the mAP of the improved model was 1.91% higher than the baseline. These pieces of research, while improving detection accuracy, face several limitations, including low detection speed, large model parameters, poor generalization, and insufficient experimental depth. These challenges, related to computational efficiency, model complexity, and robustness, determine the practical application prospects of defect detection algorithms.
2.2. Deep Learning-Based Detection Methods of Metal Surface Defects
In the field of surface defect detection on metal material, in order to improve the performance of defect detection algorithms in terms of detection accuracy and real-time performance, researchers are constantly exploring new algorithms and improving the existing ones.
Zhao et al. [14] constructed TCM-YOLO algorithm based on YOLOv8, which proposes three-channel deformable convolution, combines two-way feature pyramid with dynamic serpentine convolution in feature fusion network, and adopts the MPDioU loss function, and the improved algorithm’s mAP is higher than that of baseline algorithm in the steel strip defect dataset of Northeastern University and the defect dataset of aluminium profiles of Tianchi—7.4% and 4.1%, respectively.
Leung et al. [15] proposed a lightweight steel defect detection algorithm (EHH-YOLOv8s) based on YOLOv8s, which adopts the EfficientViT network as the backbone network, redesigns the C2f module, and introduces the Haar wavelet downsampling module, which not only achieves a better balance of detection accuracy, speed and lightness, but also has a good generalization performance.
Zhang et al. [16] proposed a PCB surface defect detection algorithm based on the improved YOLOv4-tiny, which used an optimised clustering method for clustering the defective dataset, introduced a slicing operation in the downsampling part of the backbone network, and introduced a soft-pooling convolutional structure in the feature fusion network. The proposed algorithm detected the speed of the open-source PCB defective dataset at Peking University on the accuracy, etc., which were greatly improved.
Reference [17] proposes a Global Attention Module and Cascade Fusion Network (GC-Net) for the detection of defects on steel surfaces, which introduces a Global Attention Module and designs a cascade fusion network for multi-scale feature fusion, and uses data enhancement techniques of oversampling and small target enhancement during experiments, and the mAP of the proposed method outperforms the mAP of other state-of-the-art methods (NEU-DET: 77.1%, GC10-DET: 63.5%).
Reference [18] for the detection of scratch defects on metal surfaces, proposed the use of multiple high-frequency projected illumination imaging methods to generate high-contrast images of the surface of metal parts, which can eliminate the interference of highlights, while a new defect detection algorithm was constructed based on inverse migration learning.
Reference [19] proposes context-aware adaptive weighted attention network (CAWANet), which introduces context-aware adaptive weighted convolution (CAWAConv) and feature detail improvement module (FDI) in feature fusion network, and the proposed CAWANet performs well on three datasets of Magneto Tile, NEU-Seg, and MSD, with good detection accuracy and inference speed are well balanced.
Zhang et al. [20] proposed a novel YOLO-HorNet-MCBAM-CARAFE (YOLO-HMC) network based on an improved YOLOv5 framework to enhance the detection of tiny PCB defects, addressing challenges posed by complex backgrounds. The model features a HorNet backbone for improved feature extraction, an enhanced multiple convolutional block attention module (MCBAM) for better defect localization, and a content-aware reassembly of features (CARAFE) for effective contextual aggregation. Extensive experiments on public PCB defect datasets showed that the mAP reached 98.6%, demonstrating the model’s accuracy and applicability.
To better illustrate the performance comparison of the methods, we present the comparison in Table 1, which lists defect detection models for different metal materials (such as copper strips, steels, and PCBs) and compares key metrics including mAP@0.5, parameter size, computational complexity, and inference speed.

Table 1.
Method comparison.
2.3. CenterNet Detection Network
CenterNet [21] is a center-based target detection network designed for efficient and accurate object localization and recognition. Unlike traditional anchor-based target detection methods, which rely on predefined anchor boxes to predict the object’s location and size, CenterNet adopts an anchor-free approach. It directly predicts the center points of objects along with their corresponding sizes. This approach eliminates the need for anchor box design and matching, reducing the dependence on predefined priors and simplifying the detection process. As a result, it not only improves the detection performance but also enhances the flexibility and scalability of the detection model, especially in handling objects of varying scales and positions.
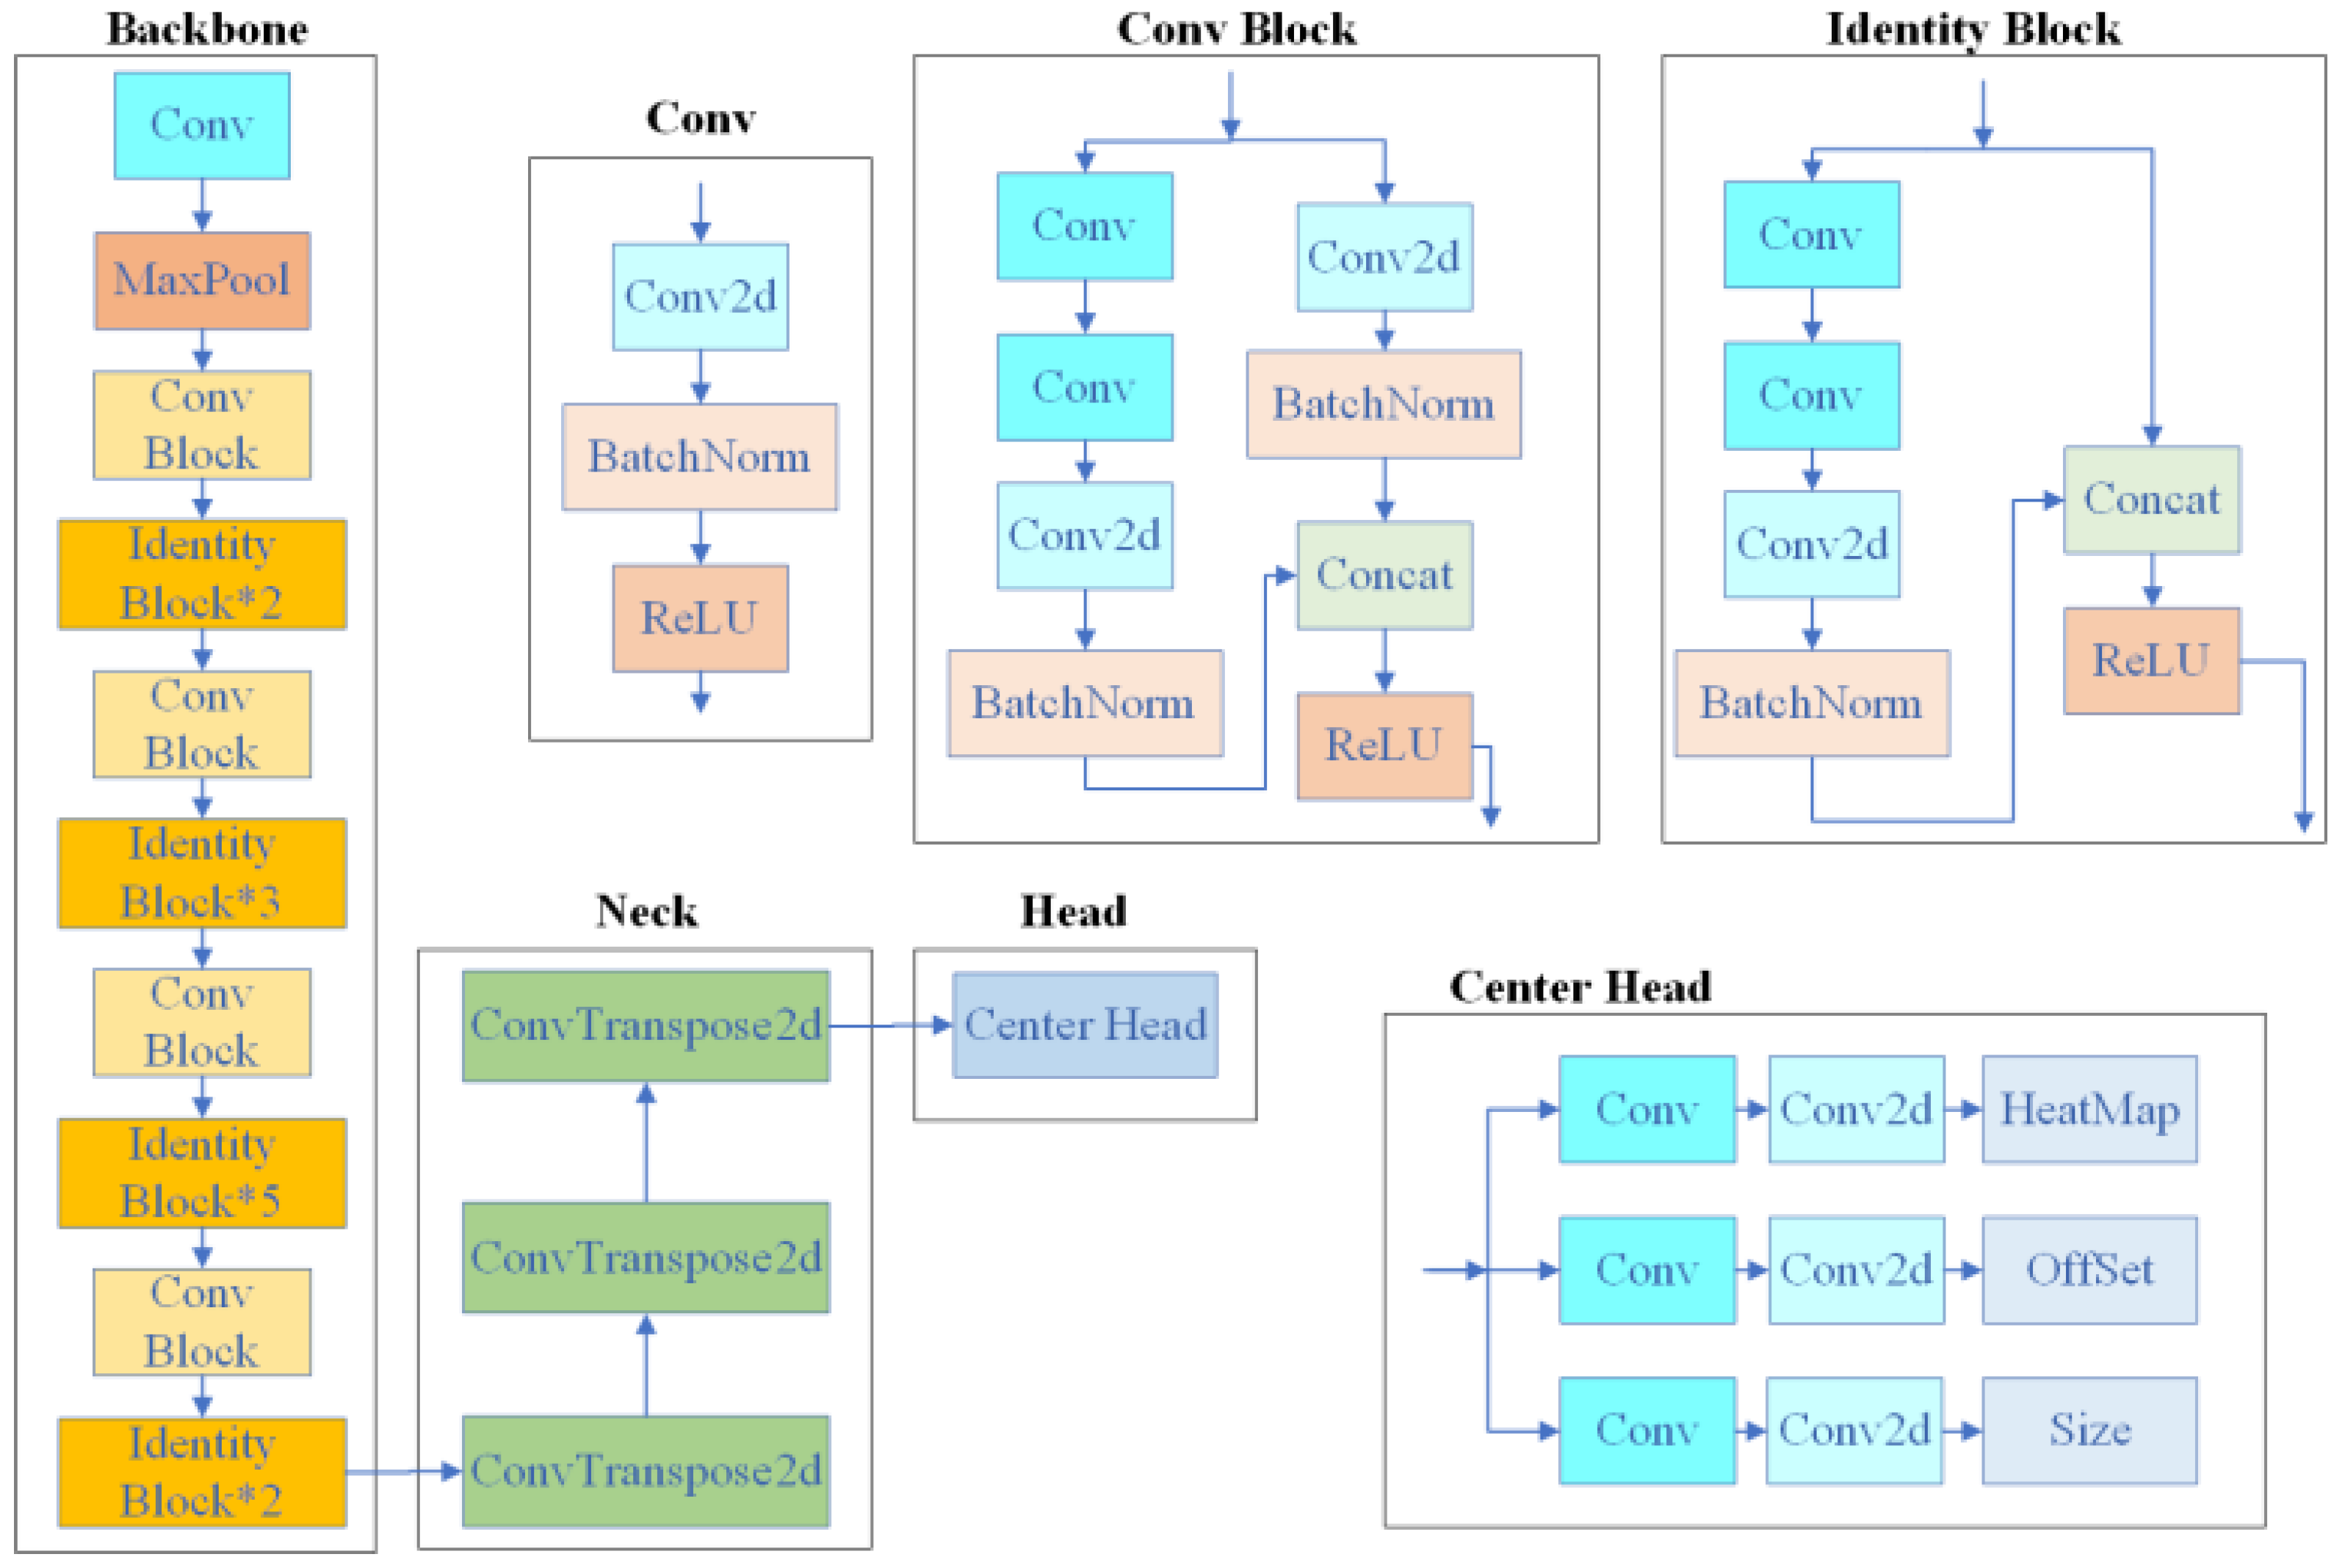
The network structure contains a backbone network, feature map generation, heat map prediction, and bounding box regression modules. The backbone network is usually chosen from the Hourglass Network [22], DLANet [23], or ResNet [24] for feature extraction, and the generated feature maps are used to predict the centroids and dimensions of the objects. The CenterNet network structure is shown in Figure 1, and the backbone network selected in this figure is ResNet50. CenterNet performs well in small target detection, captures object geometry information effectively, and supports a variety of tasks such as target detection, keypoint detection, and segmentation with good scalability.
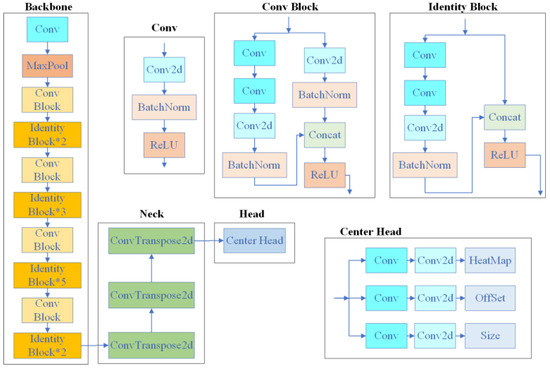
Figure 1.
CenterNet network structure diagram.
Although CenterNet performs well in surface defect detection and features a simple structure, its practical application is hindered by the large model size. Inspired by CenterNet’s anchorless frame detection approach and simplified structure, this paper proposes a lightweight SC-AttentiveNet model for copper strip defect detection.
3. Methodology
3.1. SC-AttentiveNet Network Overview
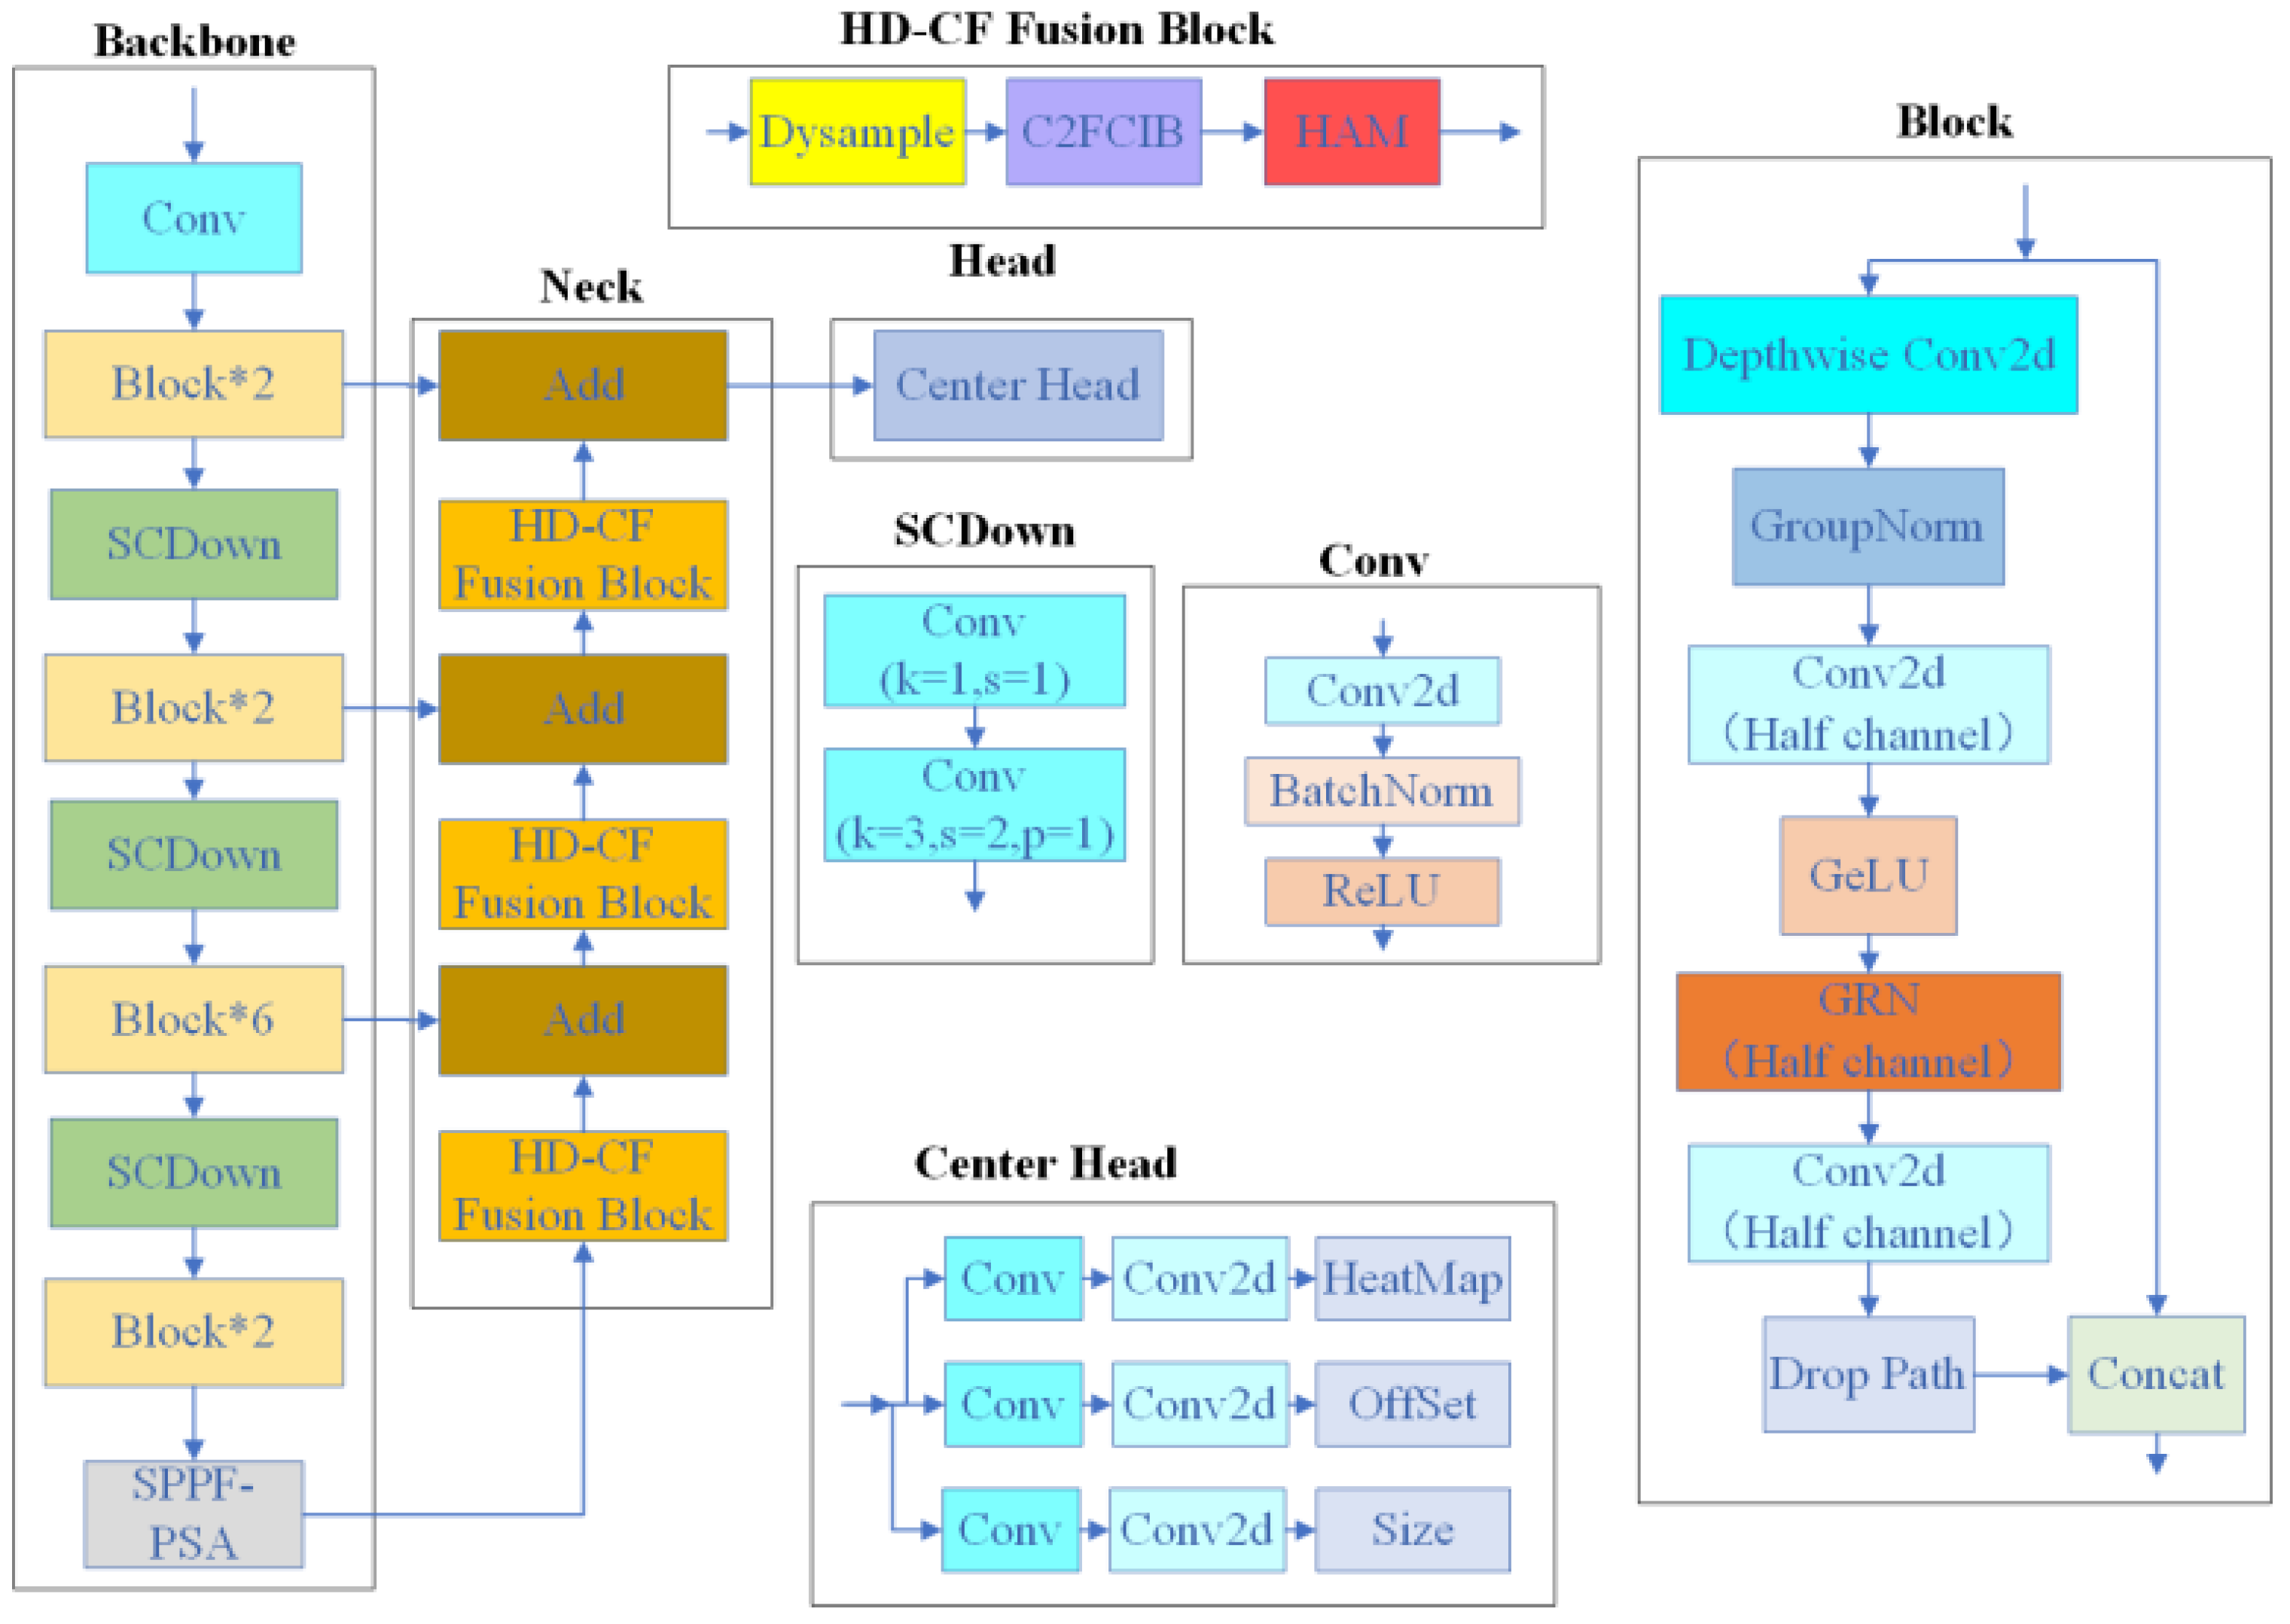
As shown in Figure 2, we propose SC-AttentiveNet, a novel network inspired by the CenterNet architecture. This design consists of a backbone for feature extraction, a neck for feature fusion, and a head for final recognition.

Figure 2.
SC-AttentiveNet network structure.
The detection head of this model draws on the anchorless frame detection idea of CenterNet, which gets rid of the dependence on the a priori frame of the traditional detection method, simplifies the detection process, and improves the ability to capture small surface defects on copper strips.
Firstly, the backbone network of the SC-AttentiveNet model is based on ConvNeXt V2 [25] redesigned SCGNNet feature extraction module, which aims to accelerate the inference speed while maintaining higher accuracy and effectively reduce the number of parameters and computational complexity of the model. By introducing a lightweight feature extraction module, we are able to achieve faster response time in the detection of surface defects on copper strips, which is crucial for real-time monitoring and fast decision-making in production lines, especially in resource-constrained industrial environments.
Secondly, the SPPF [26] structure and PSA module in the YOLOv10 [27] model are adopted in SC-AttentiveNet, which are introduced to enhance the feature extraction capability and spatial information utilization, and improve the robustness of the model. In the detection of surface defects on copper strip, the SPPF module is able to extract defect features at different scales more effectively by spatial pooling of the feature map, which makes the model perform more stably in the face of a variety of surface defects (e.g., scratches, pits, etc.). The PSA module, on the other hand, improves the model’s ability to discriminate defects by focusing on important features, which ensures that small defects on the surface of copper strips can be accurately recognized even under complex backgrounds.
Finally, in the feature fusion part, we designed the HD-CF Fusion Block module based on the C2FCIB module, the Dysample up-sampling module, and the HAM attention mechanism, and constructed the feature fusion network based on the module. This design significantly enhances the diversity and fine granularity of features in the defect detection of copper strip, which enables the model to reduce information loss while retaining critical information, thus improving the detection accuracy. Through multi-level feature fusion, the model is able to better capture the relationship between different features, which significantly enhances the defect detection of copper strip in complex scenarios, which is crucial for improving production efficiency and ensuring product quality.
SCGNNet, as the feature extraction network, focuses on the lightweight design of the overall model. It significantly enhances computational efficiency while maintaining high detection accuracy for the surface defects on copper strips. The SPPF structure and PSA module play complementary roles: the SPPF structure extracts multi-scale defect features through spatial pooling, improving robustness across various defect types, while the PSA module emphasizes critical spatial information to enhance defect recognition, particularly for small-scale defects in complex industrial backgrounds.
The HD-CF fusion module, built upon the C2FCIB module, the anomaly up-sampling module, and the HAM attention mechanism, unifies these extracted features through a multi-level fusion process. This integration minimizes information loss while maximizing feature diversity, ensuring that critical details of defects are preserved. Each component is specifically chosen based on its unique contribution to addressing the challenges of copper strip defect detection, such as handling subtle defect patterns, maintaining robustness in complex scenarios, and supporting real-time applications. This design ensures that the superior performance of the model is not merely the result of module stacking but stems from a deeply integrated and purpose-driven approach.
In brief, SC-AttentiveNet is a purpose-driven and deeply integrated network specifically designed for the unique challenges of surface defect detection on copper strip. The lightweight SCGNNet backbone, the complementary SPPF and PSA modules, and the HD-CF Fusion Block are not merely stacked components but are interconnected in a synergistic manner to address critical industrial requirements. Each module plays a distinct role in optimizing computational efficiency, enhancing feature extraction, and improving detection accuracy under complex scenarios. This integrated design ensures that SC-AttentiveNet achieves superior performance, balancing precision and real-time applicability in resource-constrained environments.
3.2. SCGNNet Feature Extraction Network
The ConvNeXt [28] network is a pure convolutional neural network proposed by the Facebook Artificial Intelligence Institute in 2022. The network is based on the ResNet structure, incorporates several advanced techniques from the Swin Transformer [29] network and Transformer architecture, and employs a variety of optimization strategies to comprehensively improve the training methodology, macroscopic design, and microscopic design. The key designs include: adopting deeply separable convolution to significantly improve the computational efficiency; introducing an inverse bottleneck layer structure to effectively prevent information loss; using layer normalization instead of batch normalization and reducing the number of normalization layers; and adopting GELU activation function instead of the traditional ReLU activation function. These innovations make ConvNeXt perform well in computer vision tasks. And ConvNeXt V2 has two main innovations based on ConvNeXt: firstly, a full convolutional mask autoencoder (FCMAE) framework is proposed; secondly, a global response normalization (GRN) layer is developed. These innovations have enabled ConvNeXt V2 to show significant performance improvements on different tasks. The ConvNeXt_P network structure and the main Block structures in it are shown in Figure 3.
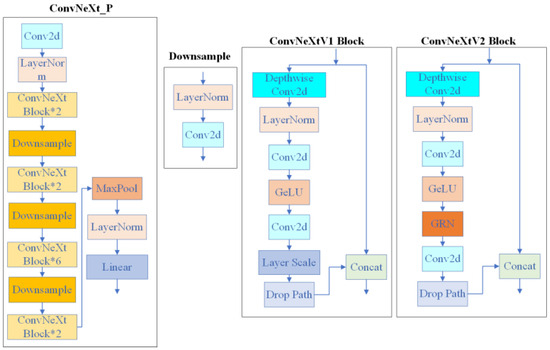
Figure 3.
ConvNeXt network structure diagram.
Due to the large number of parameters and high computational complexity of the ConvNeXt V2_P network, it is not an ideal backbone network choice for lightweight defect detection models that require efficiency and resource-friendliness. However, ConvNeXt V2_P offers significant advantages in terms of feature representation ability, model design flexibility, and adaptability to various task scenarios, making it a solid foundation for building an efficient feature extraction network. Therefore, in this paper, the feature extraction network SCGNNet (Spatial-Channel and Group Normalization Network) is designed based on the ConvNeXt V2_P network with the following improvements, and its structure is shown in Figure 4:
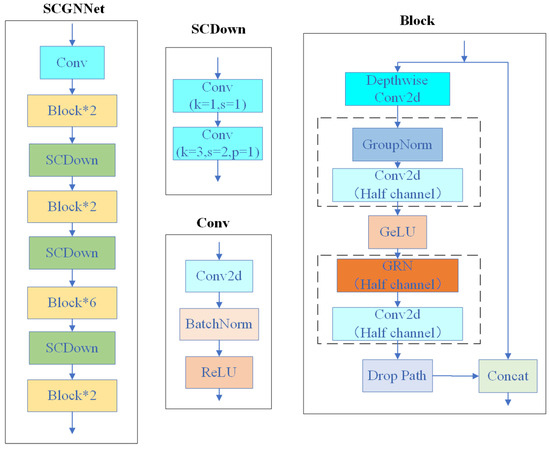
Figure 4.
SCGNNet feature extraction network structure diagram.
- (1)
- The SCDown module is used to replace the Downsample module in the original structure. Unlike the Downsample module which uses a convolution with a convolution kernel of 2 × 2 and a step size of 2, the SCDown module decouples the spatial and channel operations by improves the downsampling efficiency. Specifically, point-by-point convolution is used first to adjust the channel dimension, and then spatial downsampling is realized by deep convolution. Computational analysis: Assuming that the size of the feature map and the feature map after downsampling are H × W × C and H/2 × W/2 × 2C respectively, the number of parameters and computational complexity of the SCDown downsampling module and the Downsample module can be mathematically expressed as follows:In the above equations, P and F represent the number of parameters and computational complexity, respectively. When C > 3/2, the Downsample module has more parameters and computational overhead than SCDown module. It can be seen that the SCDown module not only retains the information effectively in the downsampling process, but also achieves a better balance between the number of parameters and computational complexity.
- (2)
- Replace the layer normalization in Block structure with group normalization. Due to the limitation of computational resources, small batch training is used in this experiment, and group normalization has better stability compared with layer normalization in this case. In addition, in deep networks, group normalization can effectively alleviate the problem of vanishing or exploding gradients and perform more effective normalization of features in different channels, thus improving the convergence speed of the model.
- (3)
- Halve the number of channels for the first and second ordinary convolutional layers and GRN operations in the Block structure. This method of reducing the expansion coefficients significantly reduces the number of parameters in the convolutional layers while maintaining a certain feature extraction capability. The design choice aims to balance model efficiency with performance. By halving the channels in the convolutional layers, the model becomes more lightweight without significantly compromising the ability to extract meaningful features. This is crucial for real-time defect detection applications.
3.3. SPPF-PSA Module
In this paper, we integrate the fast spatial pyramid pooling (SPPF) structure with the partial self-attention (PSA) module to leverage their complementary strengths and address the specific challenges of detecting surface defects on copper strips. These challenges include significant variability in defect size, shape, and appearance, along with the demand for accurate and efficient detection in high-resolution images.
The SPPF structure is embedded in the last layer of the convolutional neural network, designed to extract richer global and multi-scale feature information. It generates a series of fixed-length feature vectors by hierarchically partitioning the input feature maps and applying different sizes of pooling kernels (5 × 5, 9 × 9 and 13 × 13) for maximum pooling. These feature vectors contain spatial information at multiple scales, which greatly enhances the model’s ability to detect targets of different sizes and scales. In addition, the SPPF structure effectively addresses the challenge of scale variation by increasing the receptive field, reducing the network parameters, and enhancing the robustness of the model to the spatial invariance of the target. The SPPF structure is shown in Figure 5a.
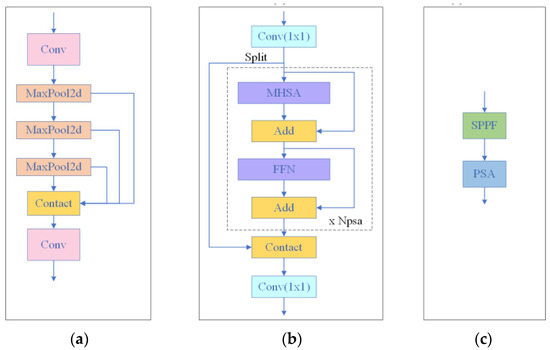
Figure 5.
SPPF-PSA network structure diagram. (a) SPPF structure; (b) PSA module; (c) SPPF-PSA module.
On the other hand, the introduced PSA [27] module solves the problem of high computational complexity and memory requirements by optimizing the computational efficiency of the Self-Attention mechanism. The features input to this module are convolved 1 × 1 and then divided equally into two parts on the channel, and only one of them is fed into multiple PSA blocks consisting of Multihead Self-Attention (MHSA) and Feedforward Network (FFN). This process ensures that the feature information is fully utilized, while the fusion of features is achieved through re-splicing and 1 × 1 convolution. In addition, the module sets the dimensions of queries and keys in MHSA to half of their values and replaces LayerNorm with BatchNorm for faster inference. Therefore, applying the PSA module to the model after the lowest resolution feature map can effectively reduce the computational complexity overhead. The structure of the PSA module is shown in Figure 5b.
By integrating the SPPF and PSA modules, our model achieves complementary benefits: the SPPF structure excels at extracting global and multi-scale features to detect defects of varying sizes, while the PSA module enhances feature representation and computational efficiency. This tailored combination is particularly effective for the unique characteristics of copper strip defect detection, enabling improved accuracy and robustness with minimal computational cost. The integrated SPPF-PSA structure is shown in Figure 5c.
3.4. HD-CF Fusion Block
The HD-CF Fusion Block is specifically designed to tackle the unique challenges of copper strip defect detection, including the need for effective multi-scale feature extraction, precise attention mechanisms, and artifact-free up-sampling in high-resolution images. By integrating the C2FCIB module, HAM hybrid attention mechanism, and Dysample up-sampling operator, the block provides a comprehensive solution that enhances the overall detection performance. These components work together to efficiently fuse multi-level feature information, resulting in detailed and accurate feature representations. This design also improves feature transfer across network layers while significantly reducing computational redundancy, making it well suited for real-time industrial applications.
Each component of the HD-CF Fusion Block contributes uniquely to its performance. The C2FCIB module employs a rank-guided optimization strategy to enhance multi-scale feature aggregation, ensuring a balanced trade-off between capacity and efficiency. The HAM hybrid attention mechanism refines features in both channel and spatial dimensions, enabling the network to focus more effectively on defect-critical regions and complex textures. Meanwhile, the Dysample operator addresses common up-sampling challenges, such as blurring and artifacts, by using a dynamic point-sampling approach that reconstructs high-quality feature maps without introducing additional computational overhead. Together, these innovations enable the HD-CF Fusion Block to achieve superior defect detection with improved precision and efficiency.
In the neck part of the SC-AttentiveNet network, feature maps from the HD-CF Fusion Block are fused with those from the backbone network using the Add operation for the following reasons:
- (1)
- Dimensional consistency: the Add operation maintains consistent feature map dimensions, ensuring smooth integration without the complexity of expanding feature map channels, as would occur with Concat.
- (2)
- Computational efficiency: the Add operation does not increase the number of channels, keeping the model lightweight and reducing computational load, which is crucial for real-time defect detection in resource-constrained environments.
- (3)
- Stability and performance: by preserving dimensional consistency, the Add operation ensures network stability, preventing instability during training and enabling more effective fusion of features.
This approach aligns with the goal of optimizing both performance and computational efficiency. Next, a detailed introduction of each module within the HD-CF Fusion Block will be provided.
3.4.1. C2fCIB Module
In the YOLOv8 network, the C2f module (CSP Bottleneck with 2 Convolutions) is one of the core components responsible for cross-stage feature aggregation. This module effectively reduces the computational effort while compressing the model and maintains or enhances the expressive power of the model through the aggregation of multi-scale information.
However, the researchers at YOLOv10 found that the C2f module is deficient in balancing capacity and efficiency through intrinsic rank analysis. To this end, they propose a rank-guided C2fCIB-based module that aims to reduce the complexity of the redundancy phase by optimizing the architecture. Firstly, they designed the compact inversion module (CIB), which combines low-cost deep convolution for spatial mixing and efficient point-by-point convolution for channel mixing. Subsequently, they propose a rank-guided module allocation strategy based on rank-guidance to improve the efficiency while maintaining the performance of the model. Specifically, for a given model, the basic modules of the previous stages are sorted by the intrinsic rank of each stage from low to high, and the CIB is used to replace the basic modules of the previous stages sequentially. If the performance is not degraded, the replacement continues to the next stage, otherwise the replacement stops. With this approach, adaptive compact module design is realized at different stages and model sizes, which improves efficiency without compromising performance. The C2fCIB module structure is shown in Figure 6.
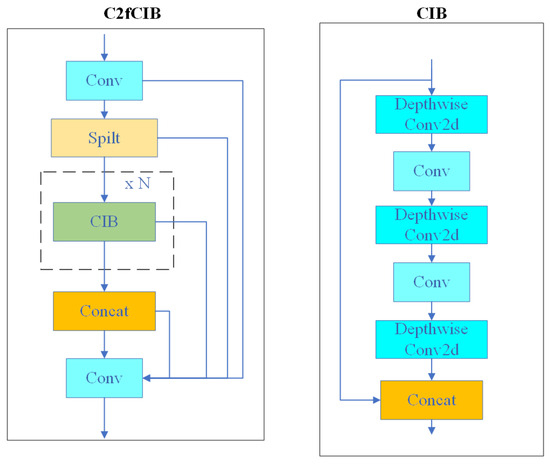
Figure 6.
C2fCIB module structure diagram.
3.4.2. Hybrid Attention Mechanism
The structure of the HAM [30] hybrid attention module is shown in Figure 7, which consists of two sub-modules in a sequential order: the CAM channel module and the SAM spatial module. The CAM module generates a one-dimensional attention map, while the SAM module generates a pair of two-dimensional attention maps. This module enables the input feature maps to be refined in channel and spatial dimensions, and it can be embedded into any prior convolutional neural network to enhance the feature representation capability.
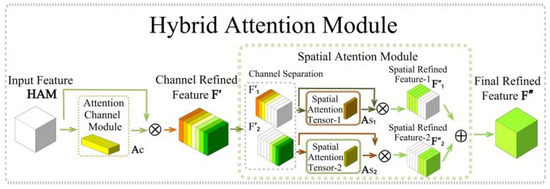
Figure 7.
Hybrid attention module structure.
Assuming an input feature map F with dimensions H × W × C, the first step of the HAM module is to generate a one-dimensional channel attention tensor AC, which is then multiplied with the input features to obtain the channel refinement feature F′. Next, the spatial attention submodule splits F′ into two groups F′1 and F′2 along the channel dimension, and computes the corresponding two-dimensional spatial attention tensor AS,1 and AS,2 for F′1 and F′2. Subsequently, these two attention tensors are multiplied by F′1 and F′2 to produce the spatial refinement features F″1 and F″2, respectively. Finally, these two features are summed up to obtain the final refinement feature F″. The above process can be expressed by the following mathematical formula:
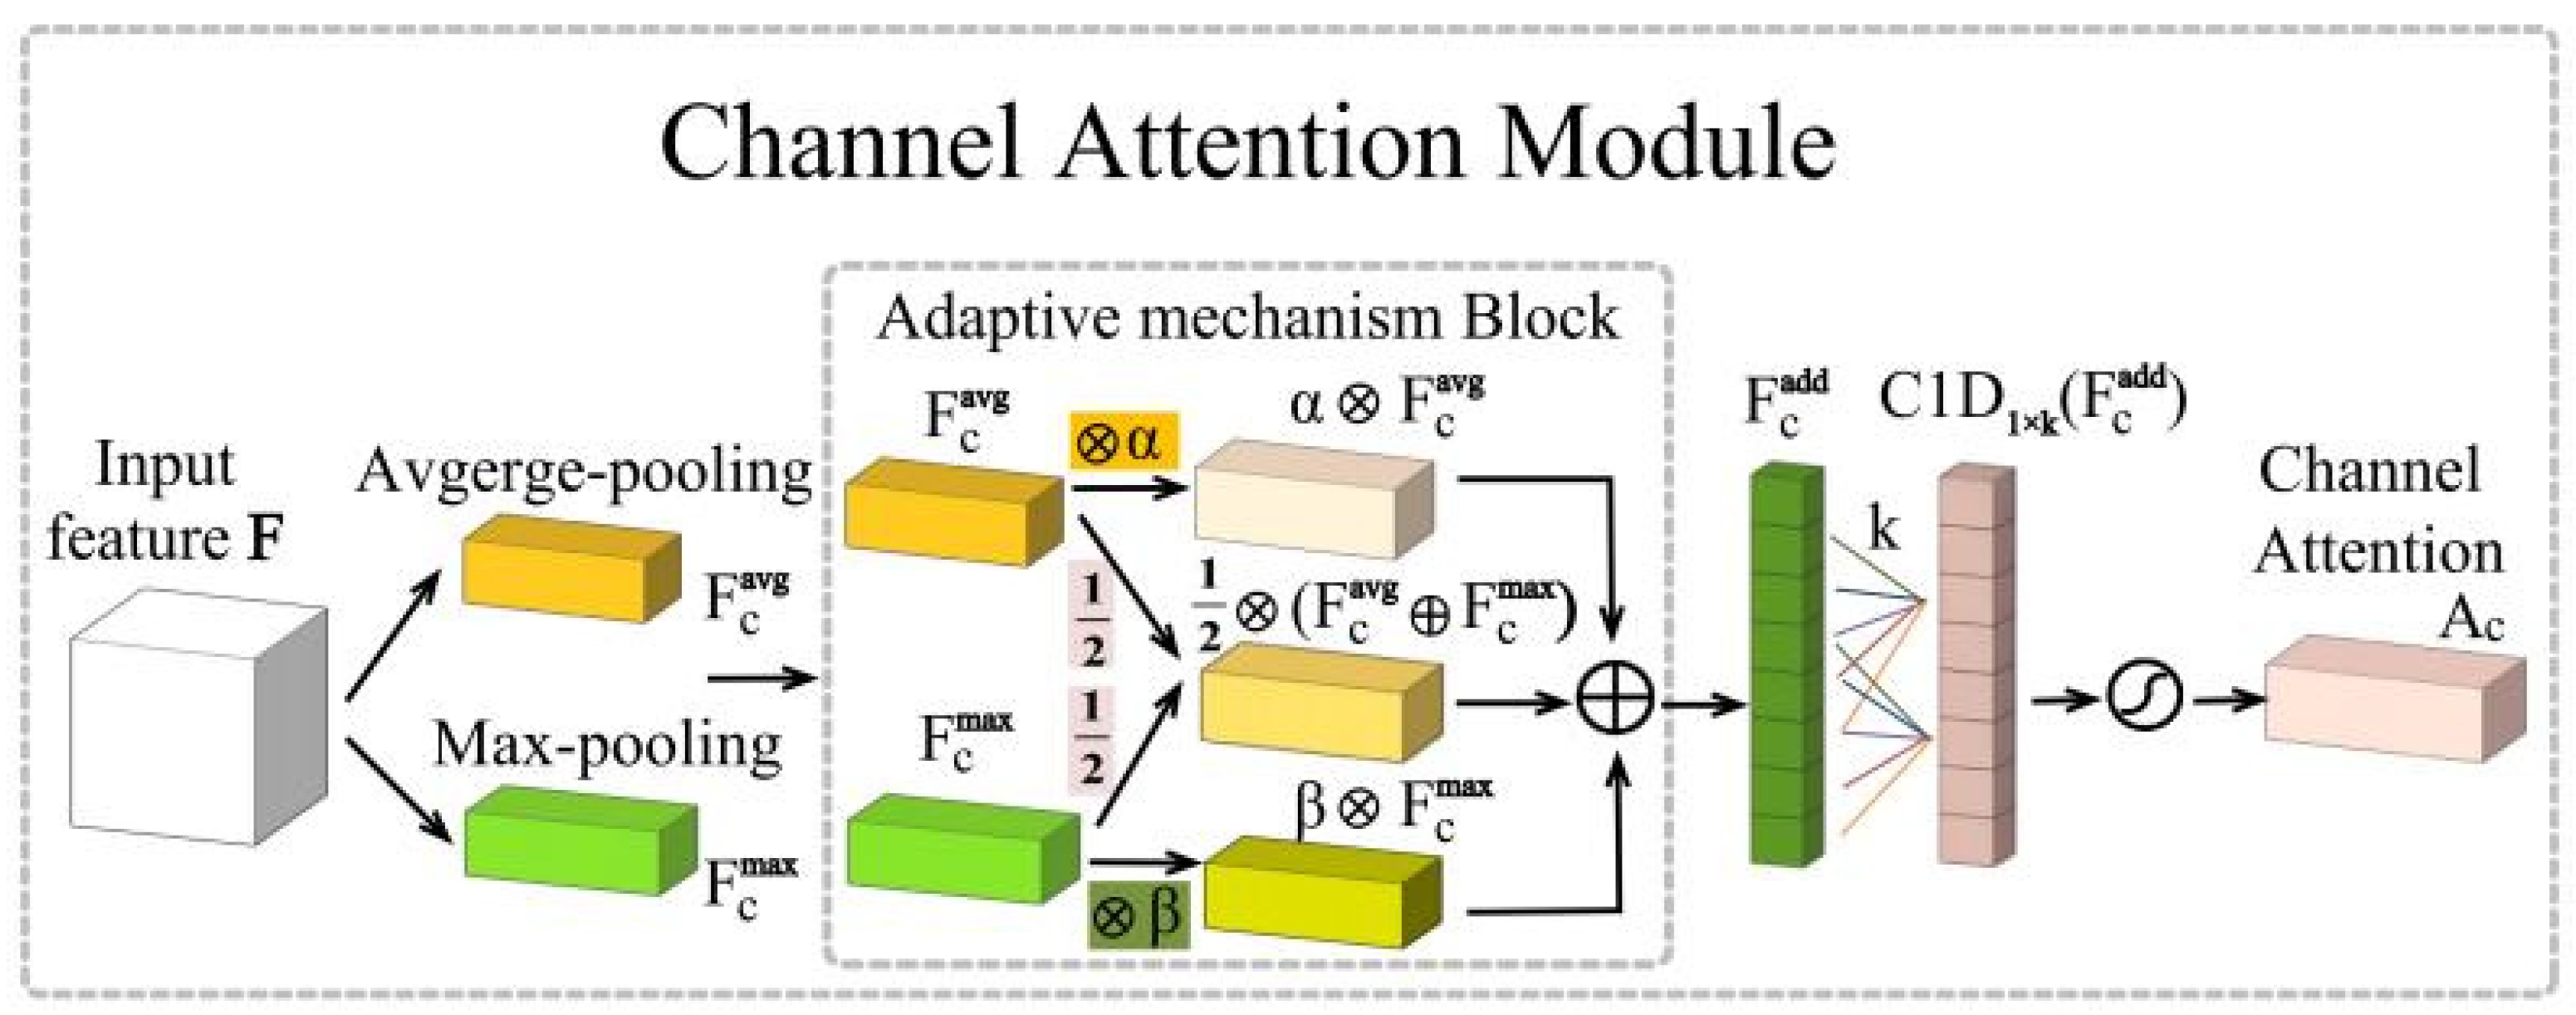
The structure of the CAM module is shown in Figure 8.
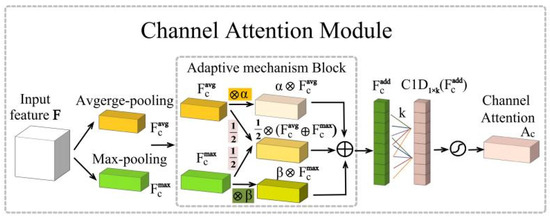
Figure 8.
CAM attention module.
First, the module aggregates the spatial dimension information through average pooling and maximum pooling operations to generate the average pooled feature FCavg and the maximum pooled feature FCmax, respectively. Subsequently, these two tensors are fed into the adaptive mechanism module to obtain the enriched feature FCadd, which is computed as in Equation (8). The adaptive mechanism module contains two trainable floating-point parameters, α and β, and their values are between 0 and 1. This module not only introduces an adaptive mechanism between the average pooling and maximum pooling features, but also effectively enriches the feature information in the image feature extraction process.
Designs that use a multilayer perceptron (MLP) to compute channel attention not only make the model more complex, but also suffer from a reduction in channel dimensionality. Therefore, the CAM module proposes to use a fast one-dimensional convolution to capture the interactions between channels, assuming that the size of this convolution kernel is k, and the value of k is adaptively determined by the number of channels C. The computational procedure is described by the following Equation (9):
where γ and b denote hyperparameters, and the closest odd number of the final calculation result is taken as the k value.
Finally, the feature map FCadd output by the adaptive mechanism module is activated after a series of convolutions using the Sigmoid function on the output feature tensor. In short, the computational process of the CAM module can be summarized in the following Equation (10):
where σ denotes the sigmoid function and C1D1×k denotes a one-dimensional convolution with kernel size k.
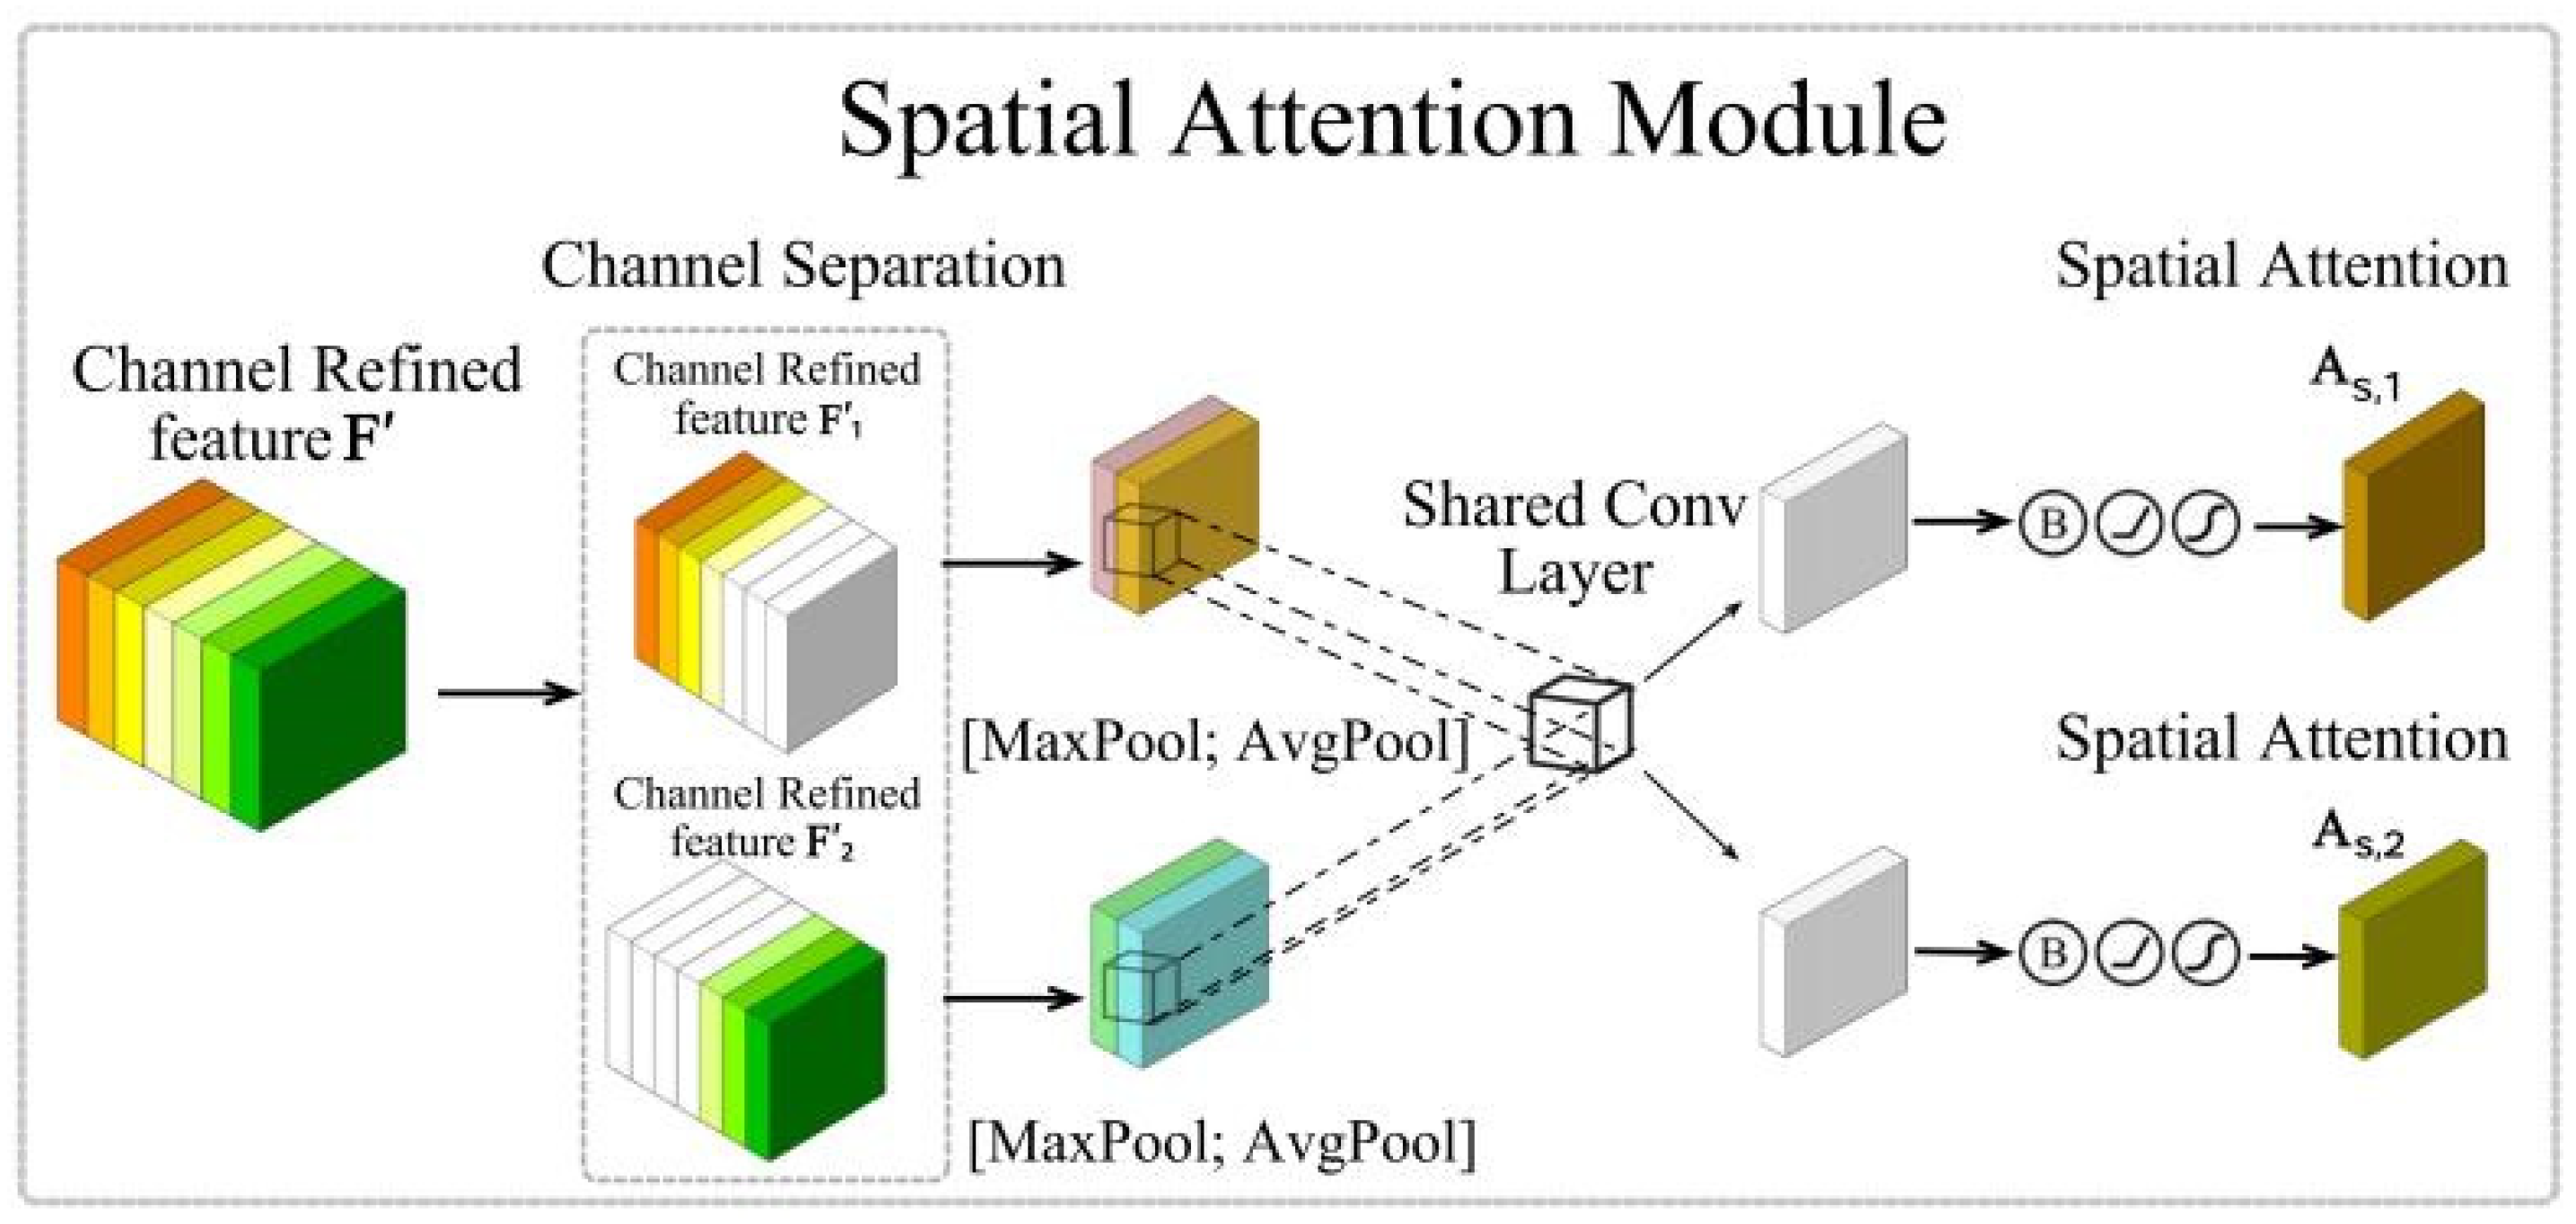
The structure of the SAM module is shown in Figure 9.

Figure 9.
SAM attention module.
The features refined by the CAM after AC refinement by the channel attention module are passed into the SAM module, which first performs channel separation operations to obtain the important channel group F′1 and the minor channel group F′2. Then, average pooling and maximum pooling operations are performed on both F′1 and F′2 to summarize the channel dimensionality information, and two pairs of 2D feature maps are generated, FS,1avg, FS,1max, and FS, 2avg, FS,2max. The FS,1avg, FS,1max, and FS,2avg, FS,2max are, respectively, subjected to join operation to generate a pair of feature descriptors. Subsequently, the concatenated feature descriptors are subjected to a convolution operation through a 7 × 7 shared convolutional layer to obtain a pair of 2D attention maps. Finally, spatial attention maps AS,1 and AS,2 are generated by batch normalization, the ReLU function, and the sigmoid function. The above process can be mathematically represented as:
where φ denotes a series of nonlinear operations and C2D7×7 denotes a shared convolution with kernel size 7 × 7.
3.4.3. Dysample Up-Sampling Operator
Upsampling is the process of enhancing the resolution or dimensionality of low-resolution images or data through specific methods designed to enhance image details and information, improve image quality, and enhance the performance of deep learning models. In this paper, we introduce the Dysample [31] module to optimize common problems in the up-sampling process. Unlike traditional kernel-based dynamic up-sampling methods, the Dysample module uses point sampling to reconstruct the up-sampling process by dynamically selecting sampling points directly on the feature map, instead of generating a dynamic convolutional kernel to reorganize the feature map. This approach significantly reduces the computational complexity and does not rely on high-resolution feature bootstrapping for feature reconstruction, which effectively reduces the loss of details, image blurring, and the appearance of artifacts and jaggedness effects, making the upsampled image more realistic, and thus improving the overall performance of the deep learning model. The pseudo-code of the Dysample upsampling operator is given in Algorithm A1.
The schematic diagram of the Dysample module is shown in Figure 10.
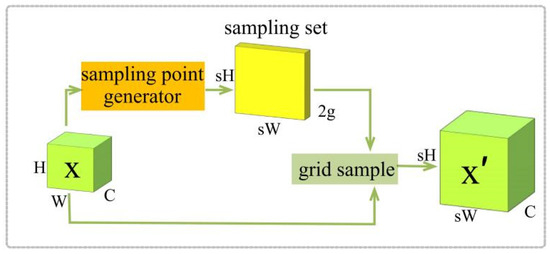
Figure 10.
Dysample module schematic.
4. Experiments and Results Analysis
4.1. Dataset
In this paper, we use the commonly used target detection dataset PASCAL VOC (VOC) and the copper strip defects dataset built by the Intelligent Measurement and Control Laboratory of Kunming University of Science and Technology (KUST-DET). The VOC dataset contains two datasets, VOC2007 and VOC2012, with a total of 21,504 images. It is selected to evaluate the generalization performance of the proposed model in handling complex image backgrounds and diverse object types. Although the VOC dataset is not specifically designed for surface defect detection, its complex and diverse image features provide a complementary perspective for assessing the robustness and adaptability of the proposed method, especially in scenarios with intricate textures and noise similar to those in real-world defect images.
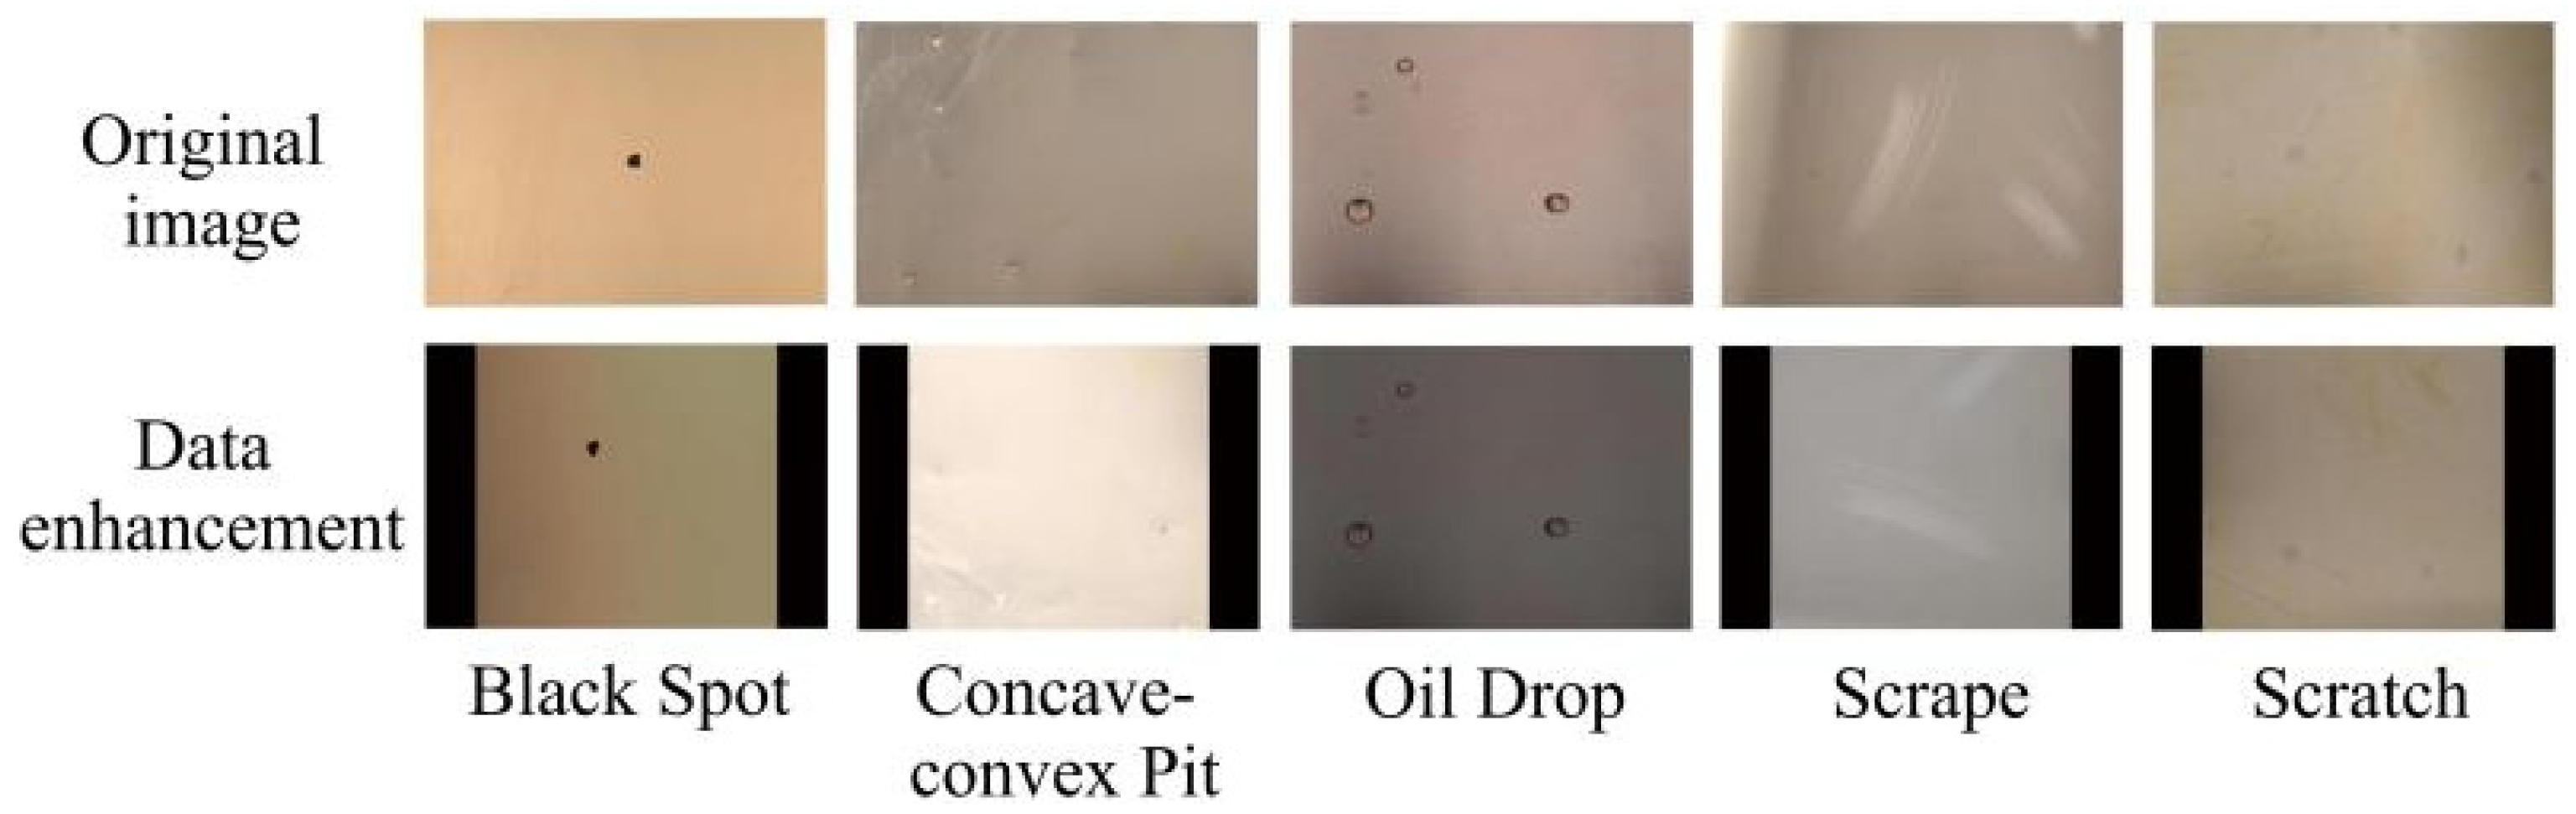
The KUST-DET dataset is a laboratory-customized dataset simulating defects in industrial copper strip production environments. It contains three copper strip alloys (white copper, brass, and purple copper) and covers five defect categories: Black Spot, Concave-convex Pit, Scrape, Scratch, and Oil Drop, comprising 2092 images in total. All images are annotated following the VOC dataset format standard using Labeme 4.5.13 with a resolution of 800 × 600 pixels. The maximum defect annotation size reaches 418 × 599 pixels, while the minimum annotation measures 2 × 10 pixels. As shown in Figure 11, the distribution of Concave-convex Pit and Scrape defects exhibits significantly fewer samples compared to other categories.
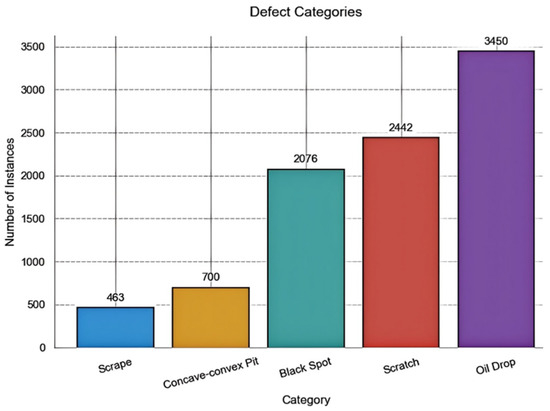
Figure 11.
Schematic representation of the number of defects in each of the KUST-DET datasets.
In order to solve the problem of uneven distribution of the number of defects in the KUST-DET dataset and to enhance the generalization performance and robustness of the model, various data enhancement techniques are used in this experiment, including adding noise, adjusting brightness, cutout, rotation, cropping, translation and mirroring, so as to achieve the balance of the number of defects in the five major categories. The dataset is enhanced with a total of 4142 images, which are distributed as shown in the Table 2.
Table 2.
Distribution of the enhanced dataset.
Figure 12 shows an example of the original and enhanced images.
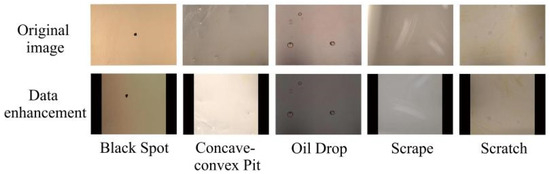
Figure 12.
Examples of images before and after enhancement of KUST-DET dataset.
The spatial location and size of defects in the enhanced KUST-DET dataset are visualized and counted. The results are shown in Figure 13. Figure 13a shows the spatial distribution of the defect label centers, where the x-axis and y-axis indicate the location of the center of the target box. Figure 13b shows the size distribution of the defective target frames, where darker and darker colors from the upper right to the lower left represent smaller and more numerous target frames. The analysis results show that the spatial distribution of defects in the dataset is not significantly biased. In addition, there are more small target defects in the dataset, presenting a higher density. This feature provides an effective test condition for the robustness of the algorithm in dealing with defects of different sizes, which is especially important in the performance validation of small target detection.
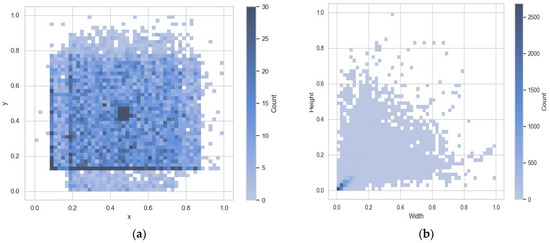
Figure 13.
Schematic distribution of the enhanced KUST-DET dataset. (a) Label center distribution; (b) Label size distribution.
4.2. Experimental Environment and Parameter Settings
The operating system for this experiment is Windows 11, the CPU is AMD Ryzen 9 7940H, and the GPU is Nvidia GeForce RTX 4060 Laptop with 6 GB of video memory. The installed parallel computing framework is Cuda12.1, the deep learning acceleration library is Cudnn8.9.7, and the deep learning framework is Pytorch2.1.0, and the programming language is Python3.11.0.
The input image size is set to 512 × 512. During training, the dataset is divided into training + validation and test sets in a 9:1 ratio, with the training set and validation set further split at a 9:1 ratio to ensure optimal data utilization and reliable model evaluation.
The optimizer used is Stochastic Gradient Descent (SGD) with momentum set to 0.937, weight decay of 0.0005, and an initial learning rate of 0.01. A cosine annealing algorithm is applied to adjust the learning rate during training.
Since the total number of gradient descent steps (or training steps) is crucial for ensuring sufficient model convergence, it is generally recommended that the total steps exceed a threshold of 50,000 when using SGD. This value is based on empirical observations that suggest having a sufficient number of gradient updates helps the optimizer effectively converge and avoids underfitting. To meet this requirement, the number of training epochs is adjusted according to the dataset size and batch size.
For the VOC dataset, which contains a larger number of images, 350 epochs are selected to ensure the total number of gradient descent steps exceeds 50,000. In contrast, the KUST-DET dataset, with fewer images, requires 300 epochs to reach a similar step count. By setting the training epochs in this manner, we ensure the optimizer has enough iterations to fine-tune the model’s parameters, leading to more reliable and effective training.
The training strategy combines freeze training and unfreeze training: in the first 50 epochs of freeze training, the batch size is 12, and the parameters of the backbone network are fixed at this stage, and only the other parameters are fine-tuned to help the network converge to the appropriate region faster and to reduce the risk of overfitting due to the large parameter space; in the subsequent unfreeze training, the batch size is adjusted to 6, and all the model parameters are participate in the training, this arrangement makes the model more flexible and improves the tuning space, thus further enhancing the model performance.
The best weights obtained from training on the VOC dataset were utilized as initialization weights for the KUST-DET and NEU-DET datasets. To optimize memory usage and enhance training efficiency, we set Automatic Mixed Precision (AMP) to “True”. This approach effectively balanced computational demands and accelerated the overall training process, ensuring that the model achieved high performance within a reasonable time frame. In summary, the training-related parameters for our model is shown in Table 3.
Table 3.
The training parameters for SC-AttentiveNet.
4.3. Evaluation Indicators
Four evaluation metrics that are widely used in the field of target detection are used in this study: mean average precision (mAP), number of parameters (Parameters), amount of computation (GFLOPs), and frame rate (FPS).
The mean average precision (mAP) is the result of the calculation of the average precision (AP) of all categories, which reflects the overall performance of the model, as shown in Equation (13). Average precision (AP) is obtained by evaluating the area enclosed by the curve of precision (P) and recall (R), the formula is shown in Equation (14). Recall (R) measures the proportion of correct predictions made by the model for real targets, and the formula is shown in equation (15), while Precision (P) indicates the proportion of correct predictions made by the model among all predicted objects, and the formula is shown in Equation (16). The number of parameters (Params) reflects the complexity and computational resource consumption of the model; the more parameters the larger the model size. GFLOPs are used to evaluate the computational speed of the neural network and denote the number of floating point operations per second. Frame rate (FPS) indicates the number of frames processed per second, the higher the value, the smoother the picture is, and vice versa may lead to lagging, and the calculation formula is shown in Equation (17).
the meaning of the parameters TP, FP, FN, r, Pi (r), m, Framenum, and ElapsedTime involved in the formula is detailed in Table 4.
Table 4.
Detailed explanation of the meaning of the parameters of the evaluation indicators.
4.4. Improvement of Module Experiments
4.4.1. CenterNet Network Experiment
Given that the SC-AttentiveNet algorithm proposed in this paper is inspired by the CenterNet network, we conducted several rounds of exploratory experiments on the CenterNet network on the KUST-DET dataset before constructing the algorithm. The following Table 5 shows some of the experimental results, which provide an important reference for the design of SC-AttentiveNet through these experiments.
Table 5.
CenterNet network experiments (partial).
Experiment A uses the CenterNet network and obtains a mAP of 88.80%; Experiment B replaces ResNet50, the backbone of CenterNet, with ConvNeXt v1_T, and despite the reduction in the number of parameters, the FPS decreases dramatically, and the mAP improves by only 0.84%; and Experiment C replaces the downsampled layers of the layer in ConvNeXt v1_T with layers of the normalization is replaced with batch normalization, and mAP decreases instead; Experiment D introduces YOLOv9’s SPPELAN structure after the last layer of the network’s feature map, and mAP is slightly improved, but the number of parameters is increased by nearly 2 MB; Experiment E replaces the convolutional layer and layer normalization of the first one of ConvNeXt v1_T’s network with the STEM structure of YOLOv8, and the result is that mAP decreases.
Through these experiments, we conclude that the first task to realize a more lightweight algorithm is to choose a backbone network that is lightweight and has a strong feature extraction capability. Both ResNet50 and ConvNeXt v1_T have overly complex and bulky network structures despite their strong feature extraction capabilities. Secondly, the up-sampling operation in CenterNet is realized by three inverse convolutional layers, which have a large number of parameters and are computationally complex, and a more flexible and efficient up-sampling method should be adopted. Based on these findings, I was able to construct a more powerful defect detection algorithm, SC-AttentiveNet.
4.4.2. Experiments on the Introduction of Attention Mechanisms to the SPPF Structure
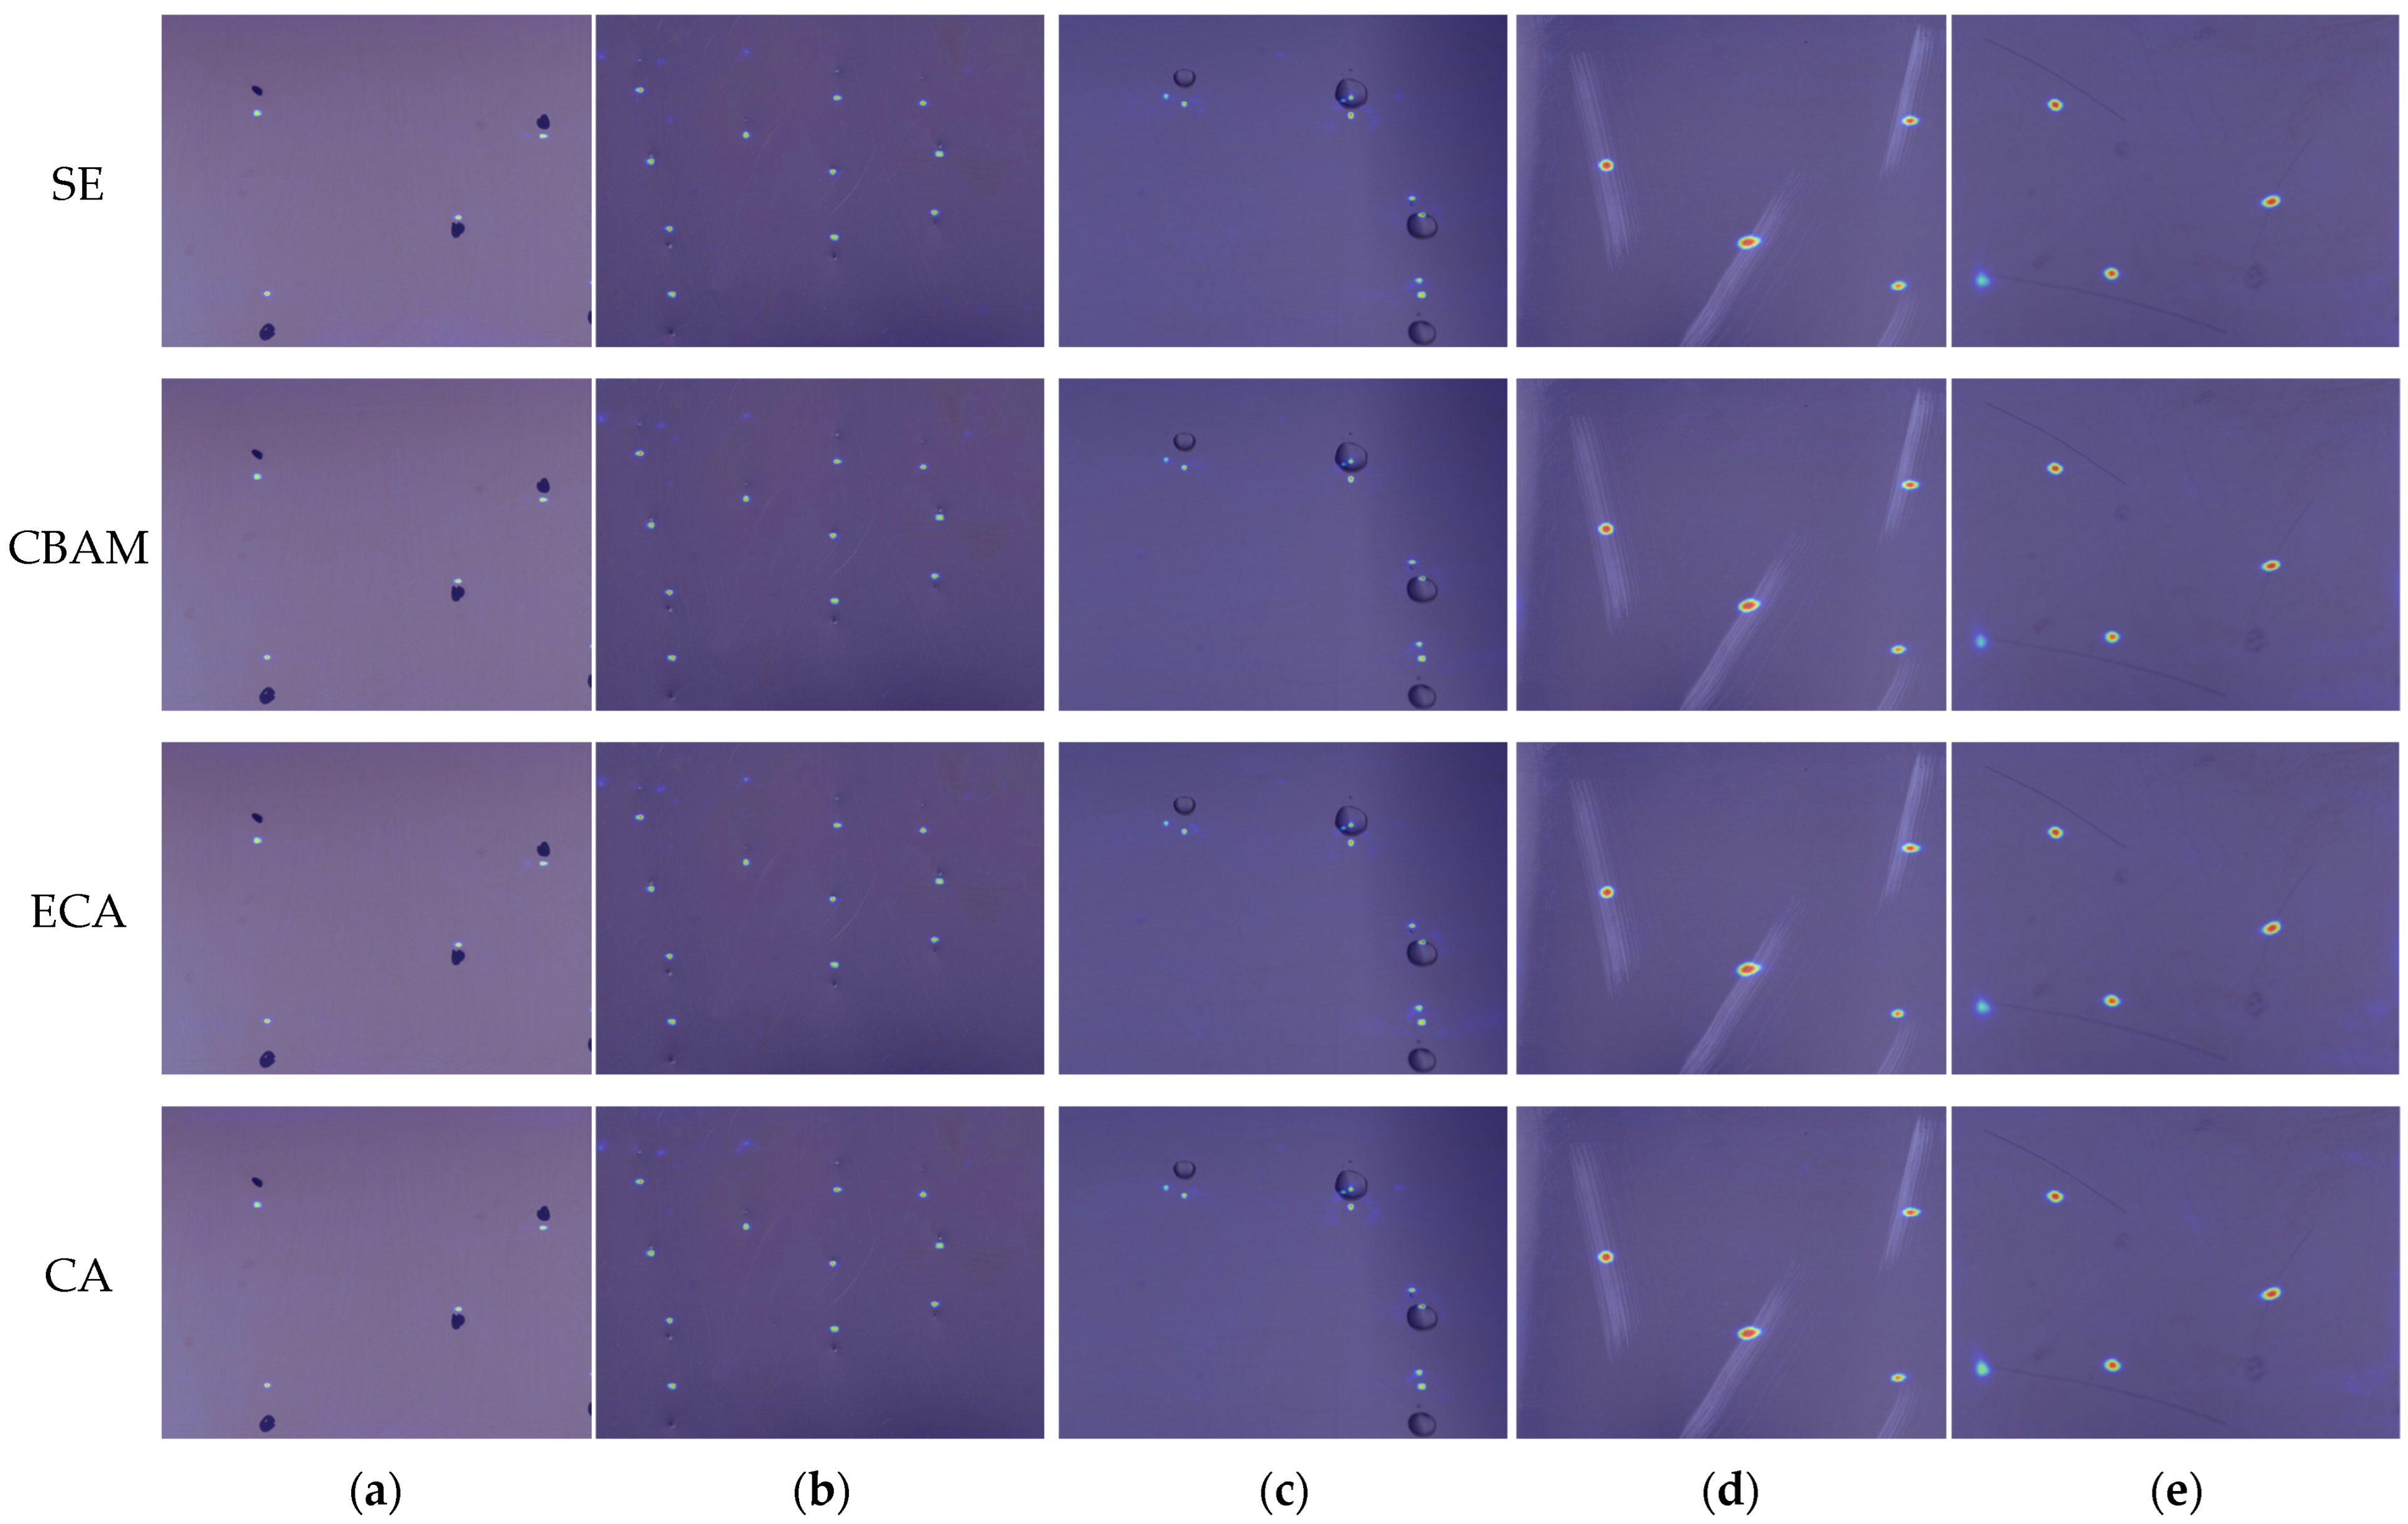
In order to verify the effectiveness of the PSA attention module introduced after the SPPF structure, this experiment compares the effect of the SPPF mechanism after combining it with the SE [32], CBAM [33], ECA [34], and CA [35] attention mechanisms on the KUST-DET dataset, where A, B, C, and D denote the sequential fusion of the SPPF structure with the above-mentioned attention models. The experimental results are shown in the Table 6 and Figure 14.
Table 6.
Attention mechanisms introduced into the SPPF structure experiment.
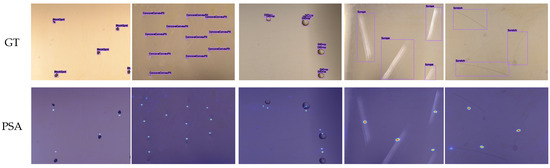

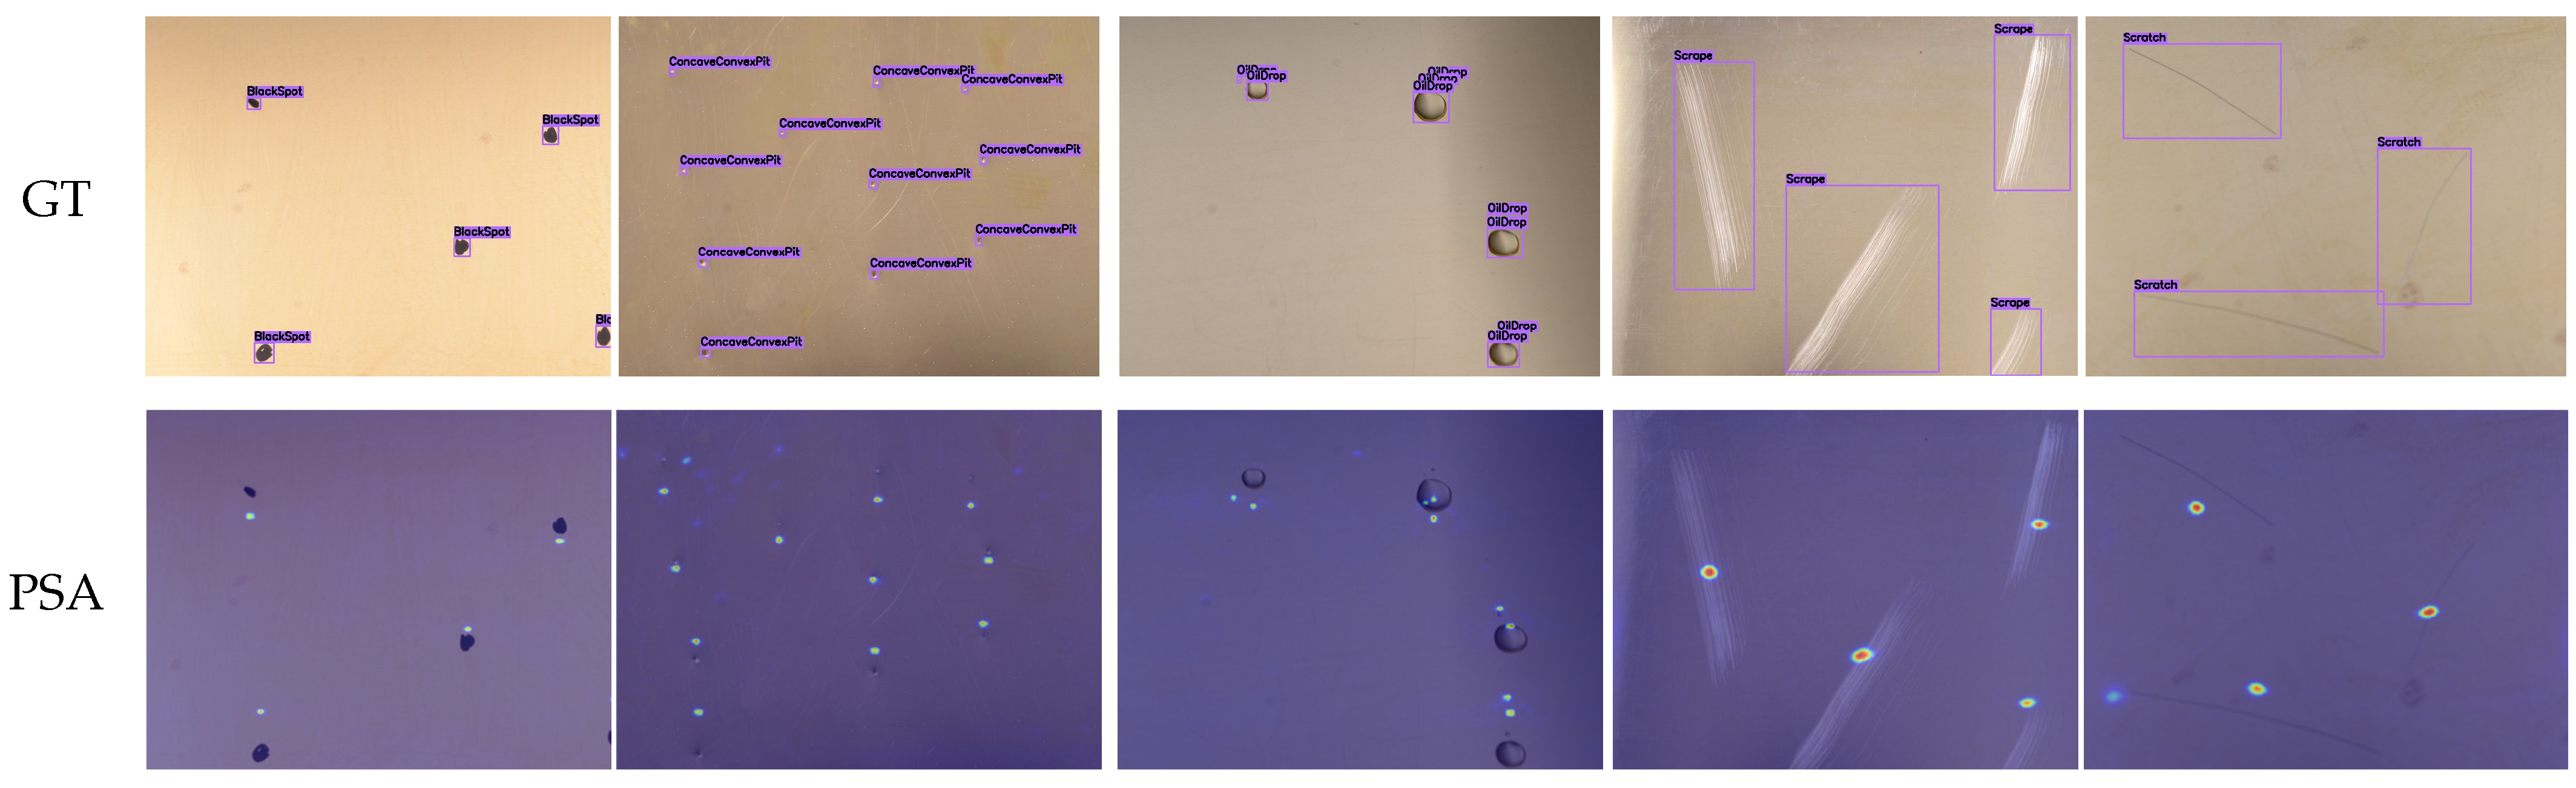
Figure 14.
Heatmap visualization results for different attention mechanisms on KUST-DET. (a) Black Spot; (b) Concave-convex Pit; (c) Oil Drop; (d) Scrape; (e) Scratch.
From the above experimental results, it can be seen that the mAP values of the models were improved after the combination of different attention mechanisms with the SPPF structure, and the scope of the regions of attention of various attentional mechanisms varied. Among them, the combination of the PSA attention module and the SPPF structure is particularly effective, which makes the region of attention of the model more precise and the detection accuracy reaches the optimal level. Compared with other attention mechanisms, the SPPF-PSA model performs optimally in terms of mAP, and the increase in the number of parameters and computational complexity is kept within a reasonable range. The PSA module effectively enhances the model’s ability to capture the target by adapting to pay attention to the key feature regions, and maintains a high inference efficiency while improving the accuracy.
In conclusion, the SPPF-PSA module used in this paper effectively balances the computational complexity and inference speed while improving the detection accuracy, demonstrating high comprehensive performance.
4.4.3. Up-Sampling Module Experiment
In order to verify the effectiveness of the Dysample up-sampling operator in HD-CF Fusion Block, this experiment was conducted to compare and analyze it on the KUST-DET dataset. We replace Dysample with nearest neighbor interpolation, CARAFE [36], inverse convolution [37], and PixelShuffle up-sampling operators, respectively, and the experimental setup corresponds to four groups, A, B, C, and D. The experimental settings are as follows. The experimental results of each group are summarized in the table to assess the impact of different up-sampling operators on the model performance.
As can be seen from the experimental results in Table 7, the introduction of the HD-CF Fusion Block module enables the algorithm to achieve a better balance in terms of mAP, number of parameters, GFLOPs, and FPS. Specifically, the SC-AttentiveNet algorithm with the introduction of the module achieves a mAP of 90.11%, which is significantly higher than that of the other comparison groups; at the same time, its number of parameters (6.365 MB) and computational complexity (14.442 GFLOPs) are at a low level, and its inference speed can be maintained at 80 FPS. This indicates that the Dysample up-sampling operator is not only capable of improve the detection accuracy of the model, but also has low computational overhead and high inference efficiency.
Table 7.
Up-sampling module experiment.
In contrast, the models replaced with other up-sampling operators performed well on some individual metrics, but failed to balance the performances. Group A showed a significant decrease in inference speed despite having the lowest number of covariates (6.337 MB) and computational complexity (14.390 GFLOPs). Group C achieved an inference speed of 81 FPS but was not able to achieve this speed due to a combination of the number of covariates (11.843 MB) and the computational complexity (14.390 GFLOPs). 40.153 GFLOPs) increased significantly, resulting in a decrease in the overall efficiency of the model. Group D had the lowest mAP of 88.40% despite having the smallest number of parameters (6.208 MB), suggesting that the simplified design of the sampling operator on the PixelShuffle negatively affects the detection performance. Group B’s performance similarly fails to achieve a significant advantage between accuracy and efficiency.
Therefore, the Dysample up-sampling operator has obvious advantages in the performance of synthesis accuracy, computational complexity and inference speed, which verifies its effectiveness in HD-CF Fusion Block.
4.5. Ablation Experiment
This paper conducts ablation studies on both the KUST-DET and VOC datasets, with 10 and 6 experimental groups respectively, to evaluate the effectiveness and generalization of each proposed improvement. The enhancements include: (1) the ConvNeXt V2 feature extraction network, (2) SCGNNet, (3) SPPF, SPPF-PSA and SPPCSPC-PSA [13] modules, and (4) a neck network based on the HD-CF Fusion Block. The experimental results are presented in Table 8.
Table 8.
Ablation experiment.
Through the ablation experiments, we compared the model’s performance on the KUST-DET dataset, which is specifically focused on industrial surface defect detection, and the VOC dataset, a general-purpose object detection dataset. The goal of this comparison was to assess the importance of specific modules and the overall method’s adaptability across different datasets with varying complexity.
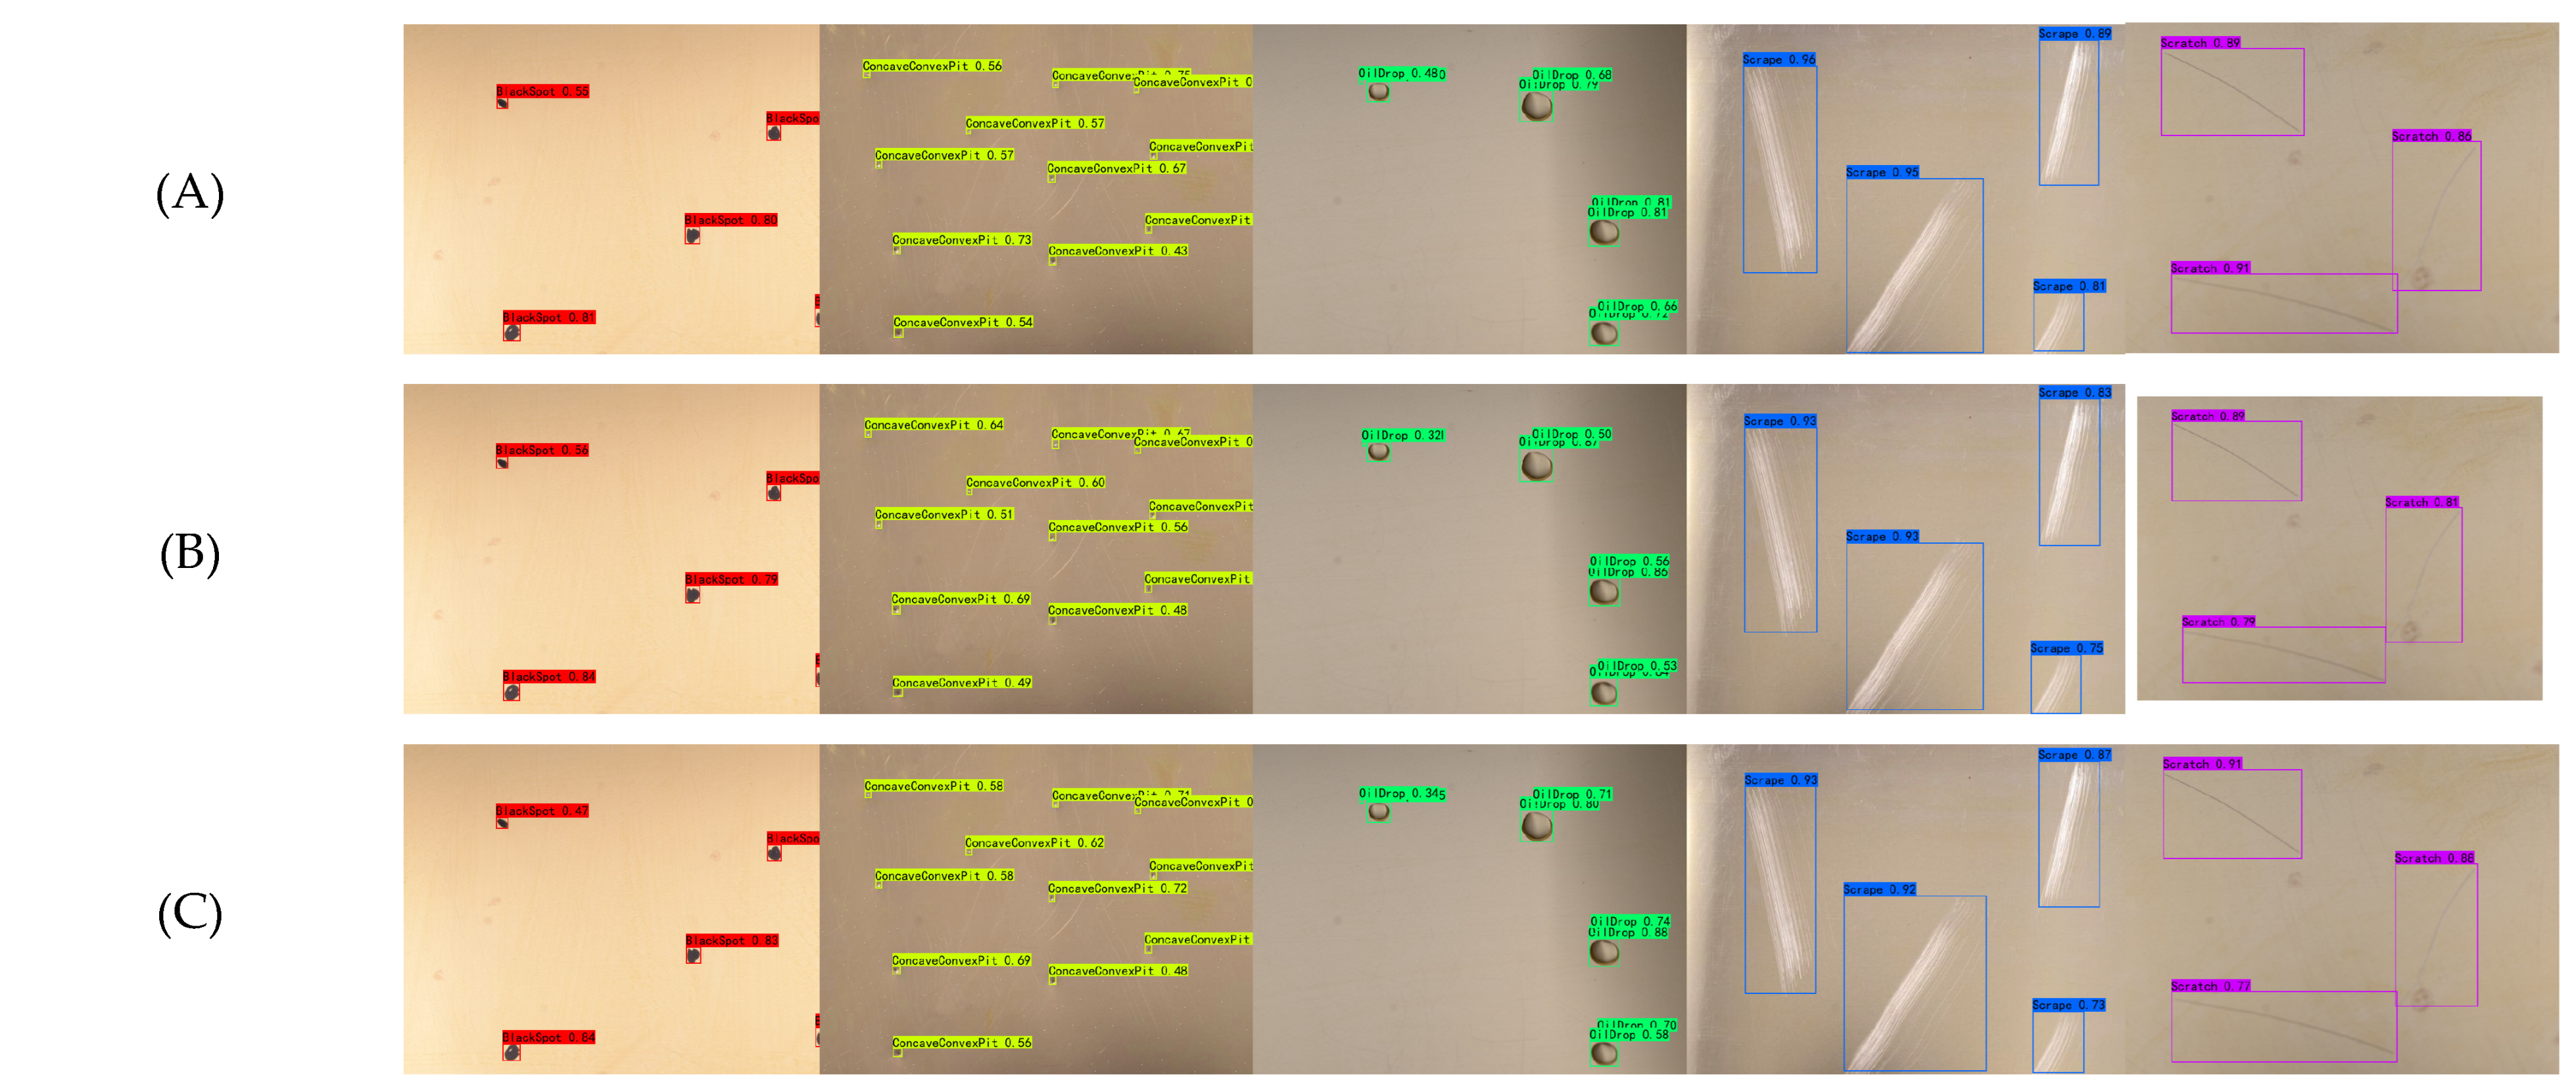
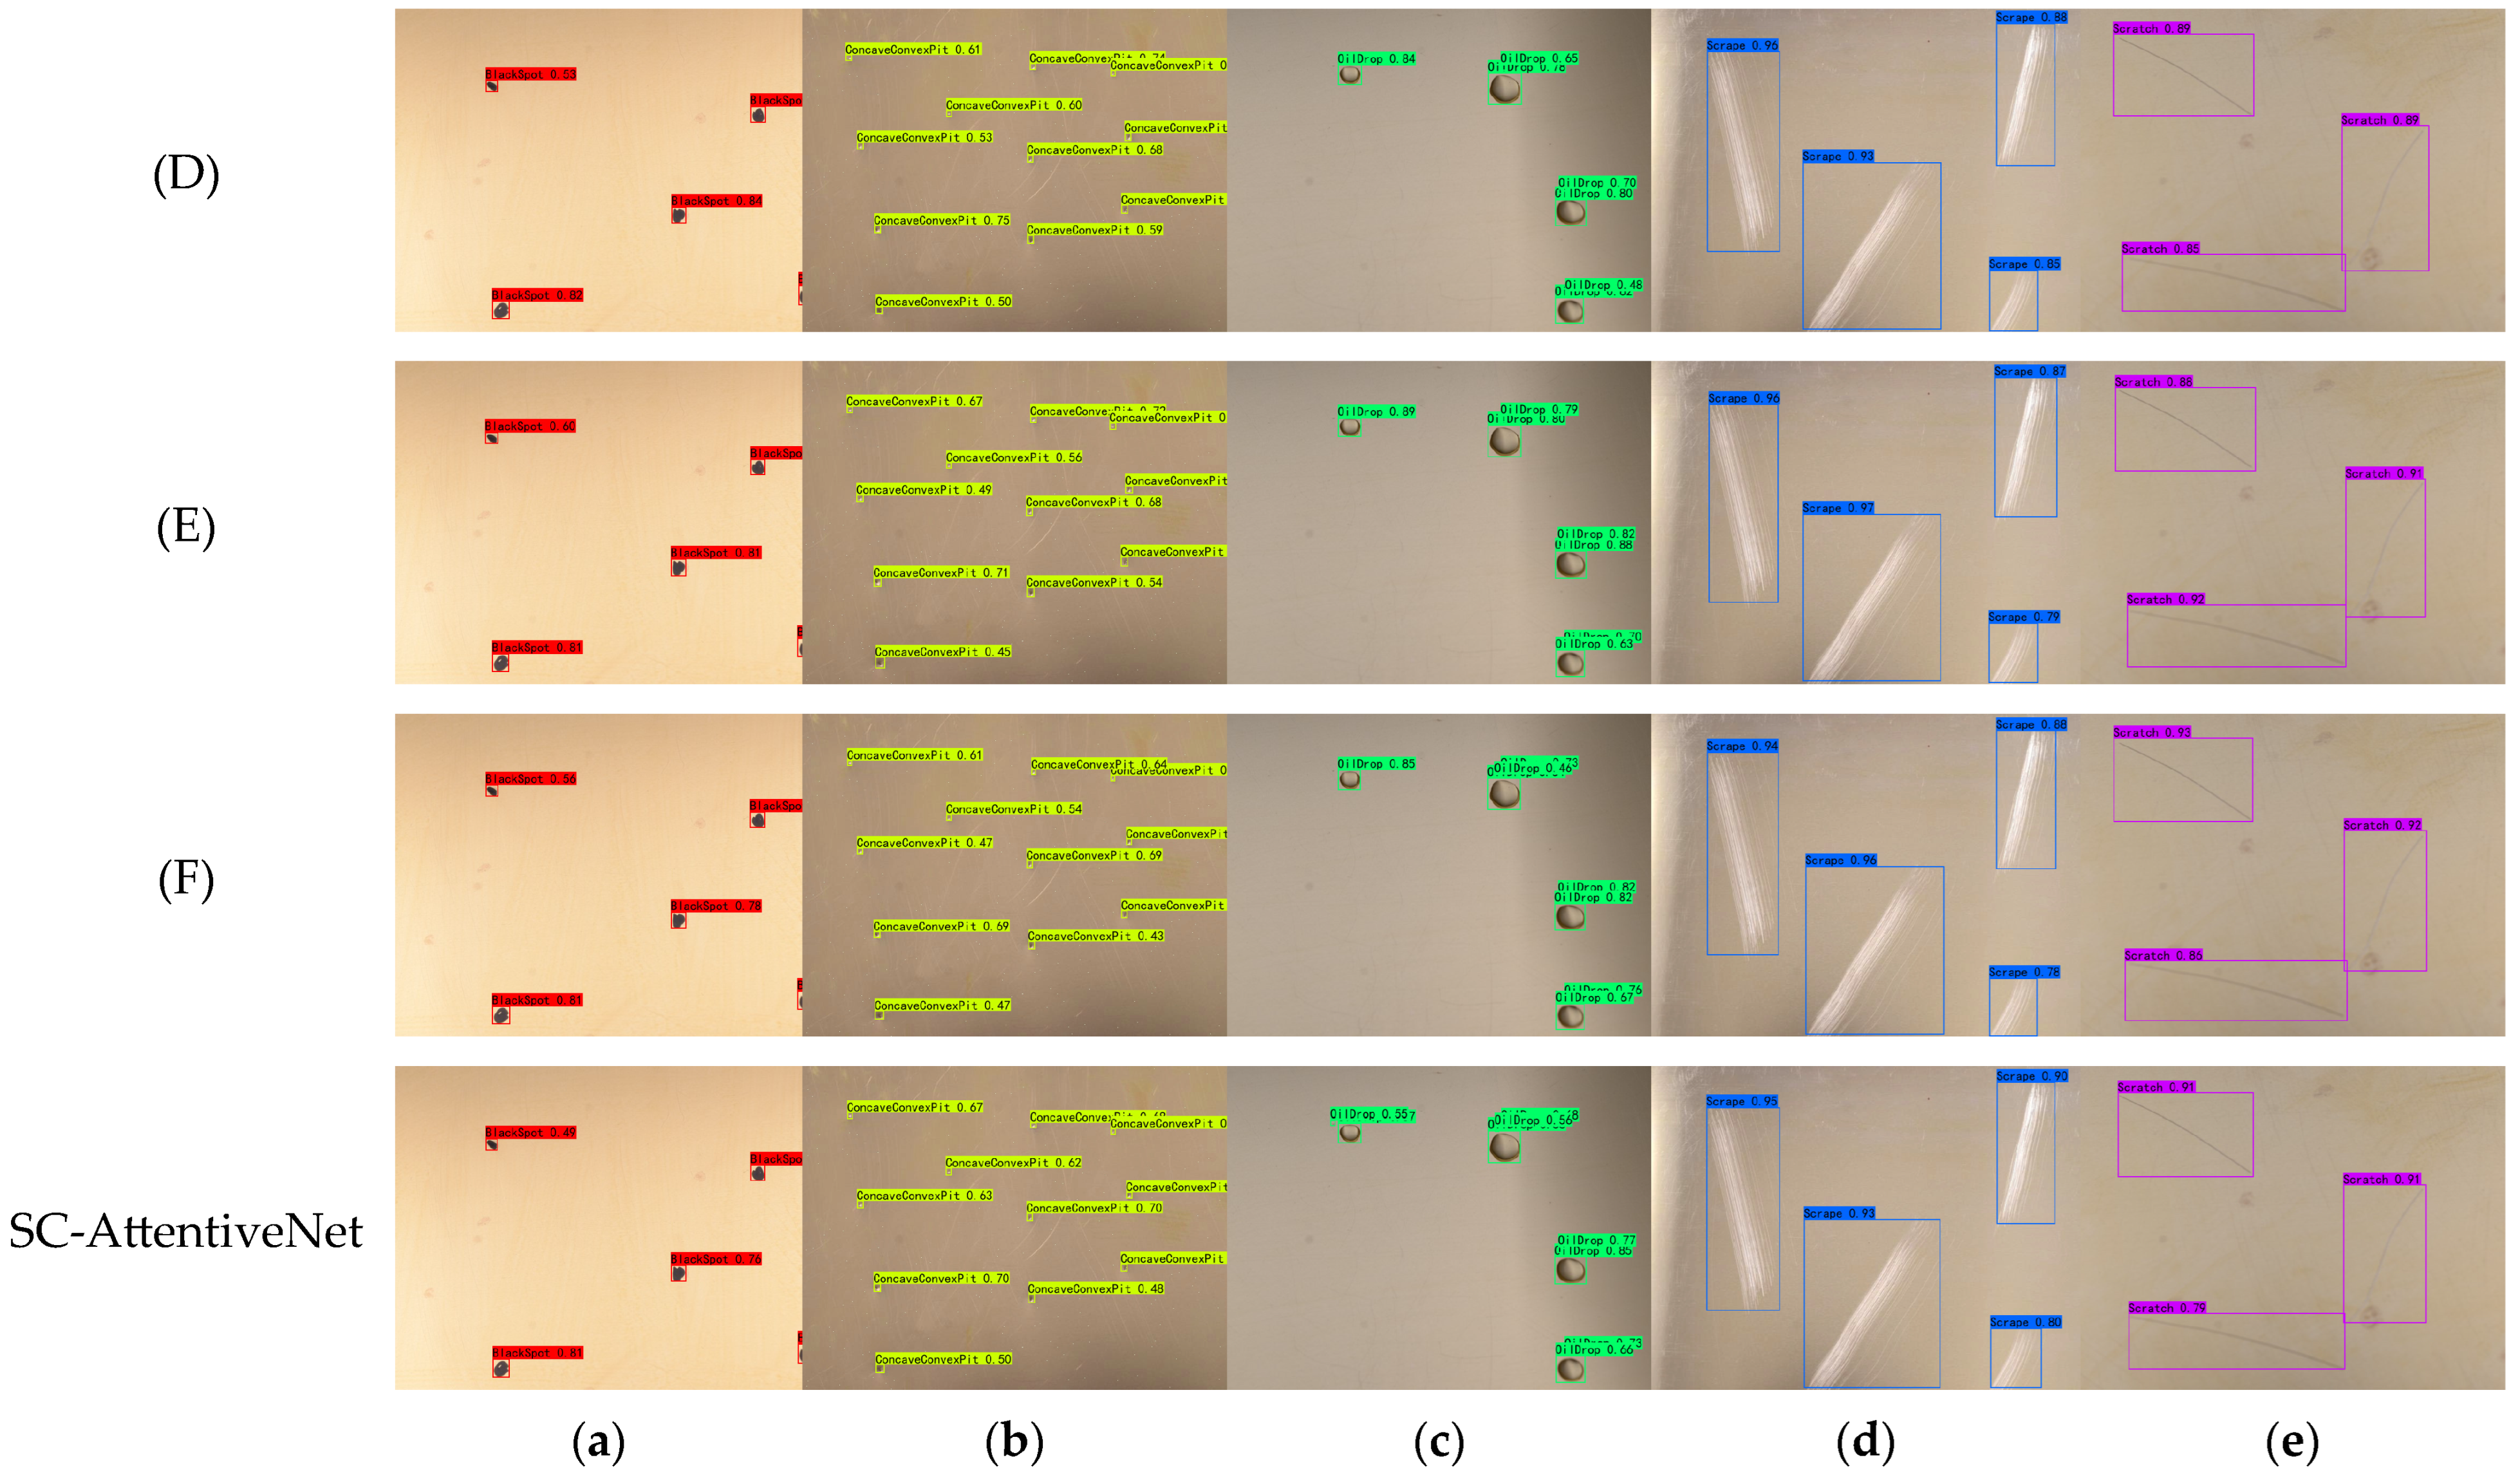
On the KUST-DET dataset, the CenterNet model with ConvNeXt V2 as the feature extraction network resulted in a significant reduction in the number of parameters and computational complexity by 65.1% and 56.1%, respectively, and the FPS was improved to 116, but the mAP decreased by 3.48%. With the introduction of the SCGNNet feature extraction network, the model further reduces the number of parameters and computational complexity while the mAP improves to 87.49% and the FPS rises to 143. When combining the SPPF-PSA module and the improved neck network, the model’s mAP further improves to 90.11%, which is 1.31% higher compared to the CenterNet model, while the amount of parameters decreases by 80.5%. However, integrating the SPPCSPC-PSA module with the neck network nearly doubled the parameters compared to the SPPF-PSA combination, increased computational complexity, and led to reductions in both FPS and mAP. The results of the ablation experiments on the KUST-DET dataset are shown in Figure 15, where SC-AttentiveNet performs optimally in terms of confidence in the prediction boxes and detection accuracy.
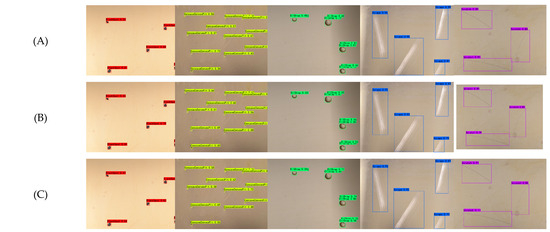
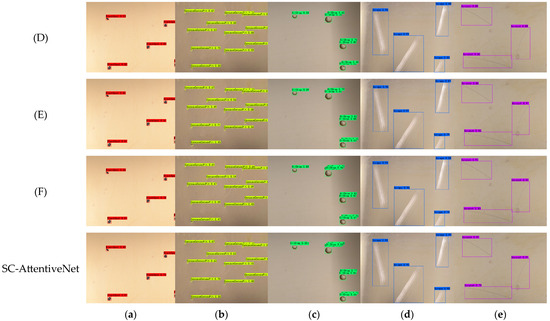
Figure 15.
Visualization results of ablation experiments on KUST-DET.(a) Black Spot; (b) Concave-convex Pit; (c) Oil Drop; (d) Scrape; (e) Scratch.
In contrast, the experiments on the VOC dataset demonstrated similar trends but in a more challenging setting. The model with the SCGNNet feature extraction network achieved a significant improvement in mAP, rising to 63.34%, and further improved to 64.14% with the inclusion of the SPPF-PSA module and the improved neck network. These results highlight that while the VOC dataset introduces greater image complexity, the proposed method remains robust and effective.
By comparing the performance across these two datasets, we observe that the specific improvements, such as SCGNNet and the SPPF-PSA module, play a critical role not only in optimizing the model for industrial defect detection but also in enhancing its generalization ability to handle diverse and complex visual data. This demonstrates the importance of these modules and the overall method’s applicability to both specialized industrial tasks and broader object detection challenges.
4.6. Comparison Experiment
4.6.1. Comparison with the Inspiration Algorithm (CenterNet)
SC-AttentiveNet, inspired by CenterNet, demonstrates notable improvements in defect detection across several categories. For defect types such as Black Spot, Concave-Convex Pit, Oil Drop, and Scrape, SC-AttentiveNet achieved higher detection precision, with the Oil Drop class showing an improvement of nearly 4%. Overall, the mAP increased by 1.31% compared to CenterNet, reflecting enhanced detection accuracy. Furthermore, SC-AttentiveNet significantly optimized model efficiency, reducing the parameter count by 26.3 MB and cutting computational complexity by almost 80%. Despite a slight reduction in precision for the Scratch defect category, SC-AttentiveNet maintained superior overall performance while addressing the challenges of lightweight model design and computational resource efficiency. The detailed experimental results are presented in Table 9.
Table 9.
Performance comparison of SC-AttentiveNet with CenterNet.
The results evaluated using pycocotools are shown in Table 10, where SC-AttentiveNet improves in all metrics compared to CenterNet. In terms of AP50:95 (average precision, IoU range from 0.5 to 0.95), SC-AttentiveNet improved its performance by 3.3% to 58.0%. SC-AttentiveNet also shows better performance for targets of different sizes, where AP50:95-Small improves from 35.9% to 37.9%, AP50:95-Medium improves from 63.5% to 67.3%, and AP50:95-Large improves from 76.3% to 81.8%. The experimental results show that SC-AttentiveNet has stronger capability in target detection at different scales.
Table 10.
The performance of the CenterNet algorithm and the SC-AttentiveNet algorithm was compared using the pycocotools.
4.6.2. Comparison with Other State-of-the-Art Algorithms
To comprehensively evaluate the performance of the SC-AttentiveNet algorithm, comparison experiments were conducted against several state-of-the-art models, including RT-DETR-l, CenterNet, SSD, YOLOv3, YOLOv4, YOLOv4-tiny, YOLOv5, YOLOv7, YOLOv7-tiny, YOLOvX, and YOLOv8. The evaluation metrics included mAP, parameter count, FPS, and computational complexity, with the experimental results summarized in Table 11.
Table 11.
Performance comparison of different network models on the enhanced KUST-DET dataset.
SC-AttentiveNet achieves the highest mAP (90.11%), surpassing all compared models. In terms of model size, its number of parameters (6.365 MB) is significantly smaller than RT-DETR-l, CenterNet, SSD, YOLOv3, YOLOv4, YOLOv5, YOLOv7, YOLOvX, and YOLOv8, and only slightly larger than YOLOv4-tiny and YOLOv7-tiny. Regarding computational complexity, SC-AttentiveNet has a lower GFLOPs (14.442) than most models except YOLOv4-tiny, YOLOv5, and YOLOv7-tiny, indicating its lightweight design.
In terms of inference speed, SC-AttentiveNet achieves 80 FPS, outperforming RT-DETR-l, SSD, YOLOv3, YOLOv4, and YOLOv7. Although it is not the fastest among all models, it still significantly exceeds the industrial real-time inspection requirement (FPS > 30). These results demonstrate that SC-AttentiveNet maintains an optimal balance between detection accuracy, speed, and model efficiency. This trade-off ensures its strong applicability in industrial defect detection and provides valuable insights for future research in this domain.
4.7. Verification of Generalizability
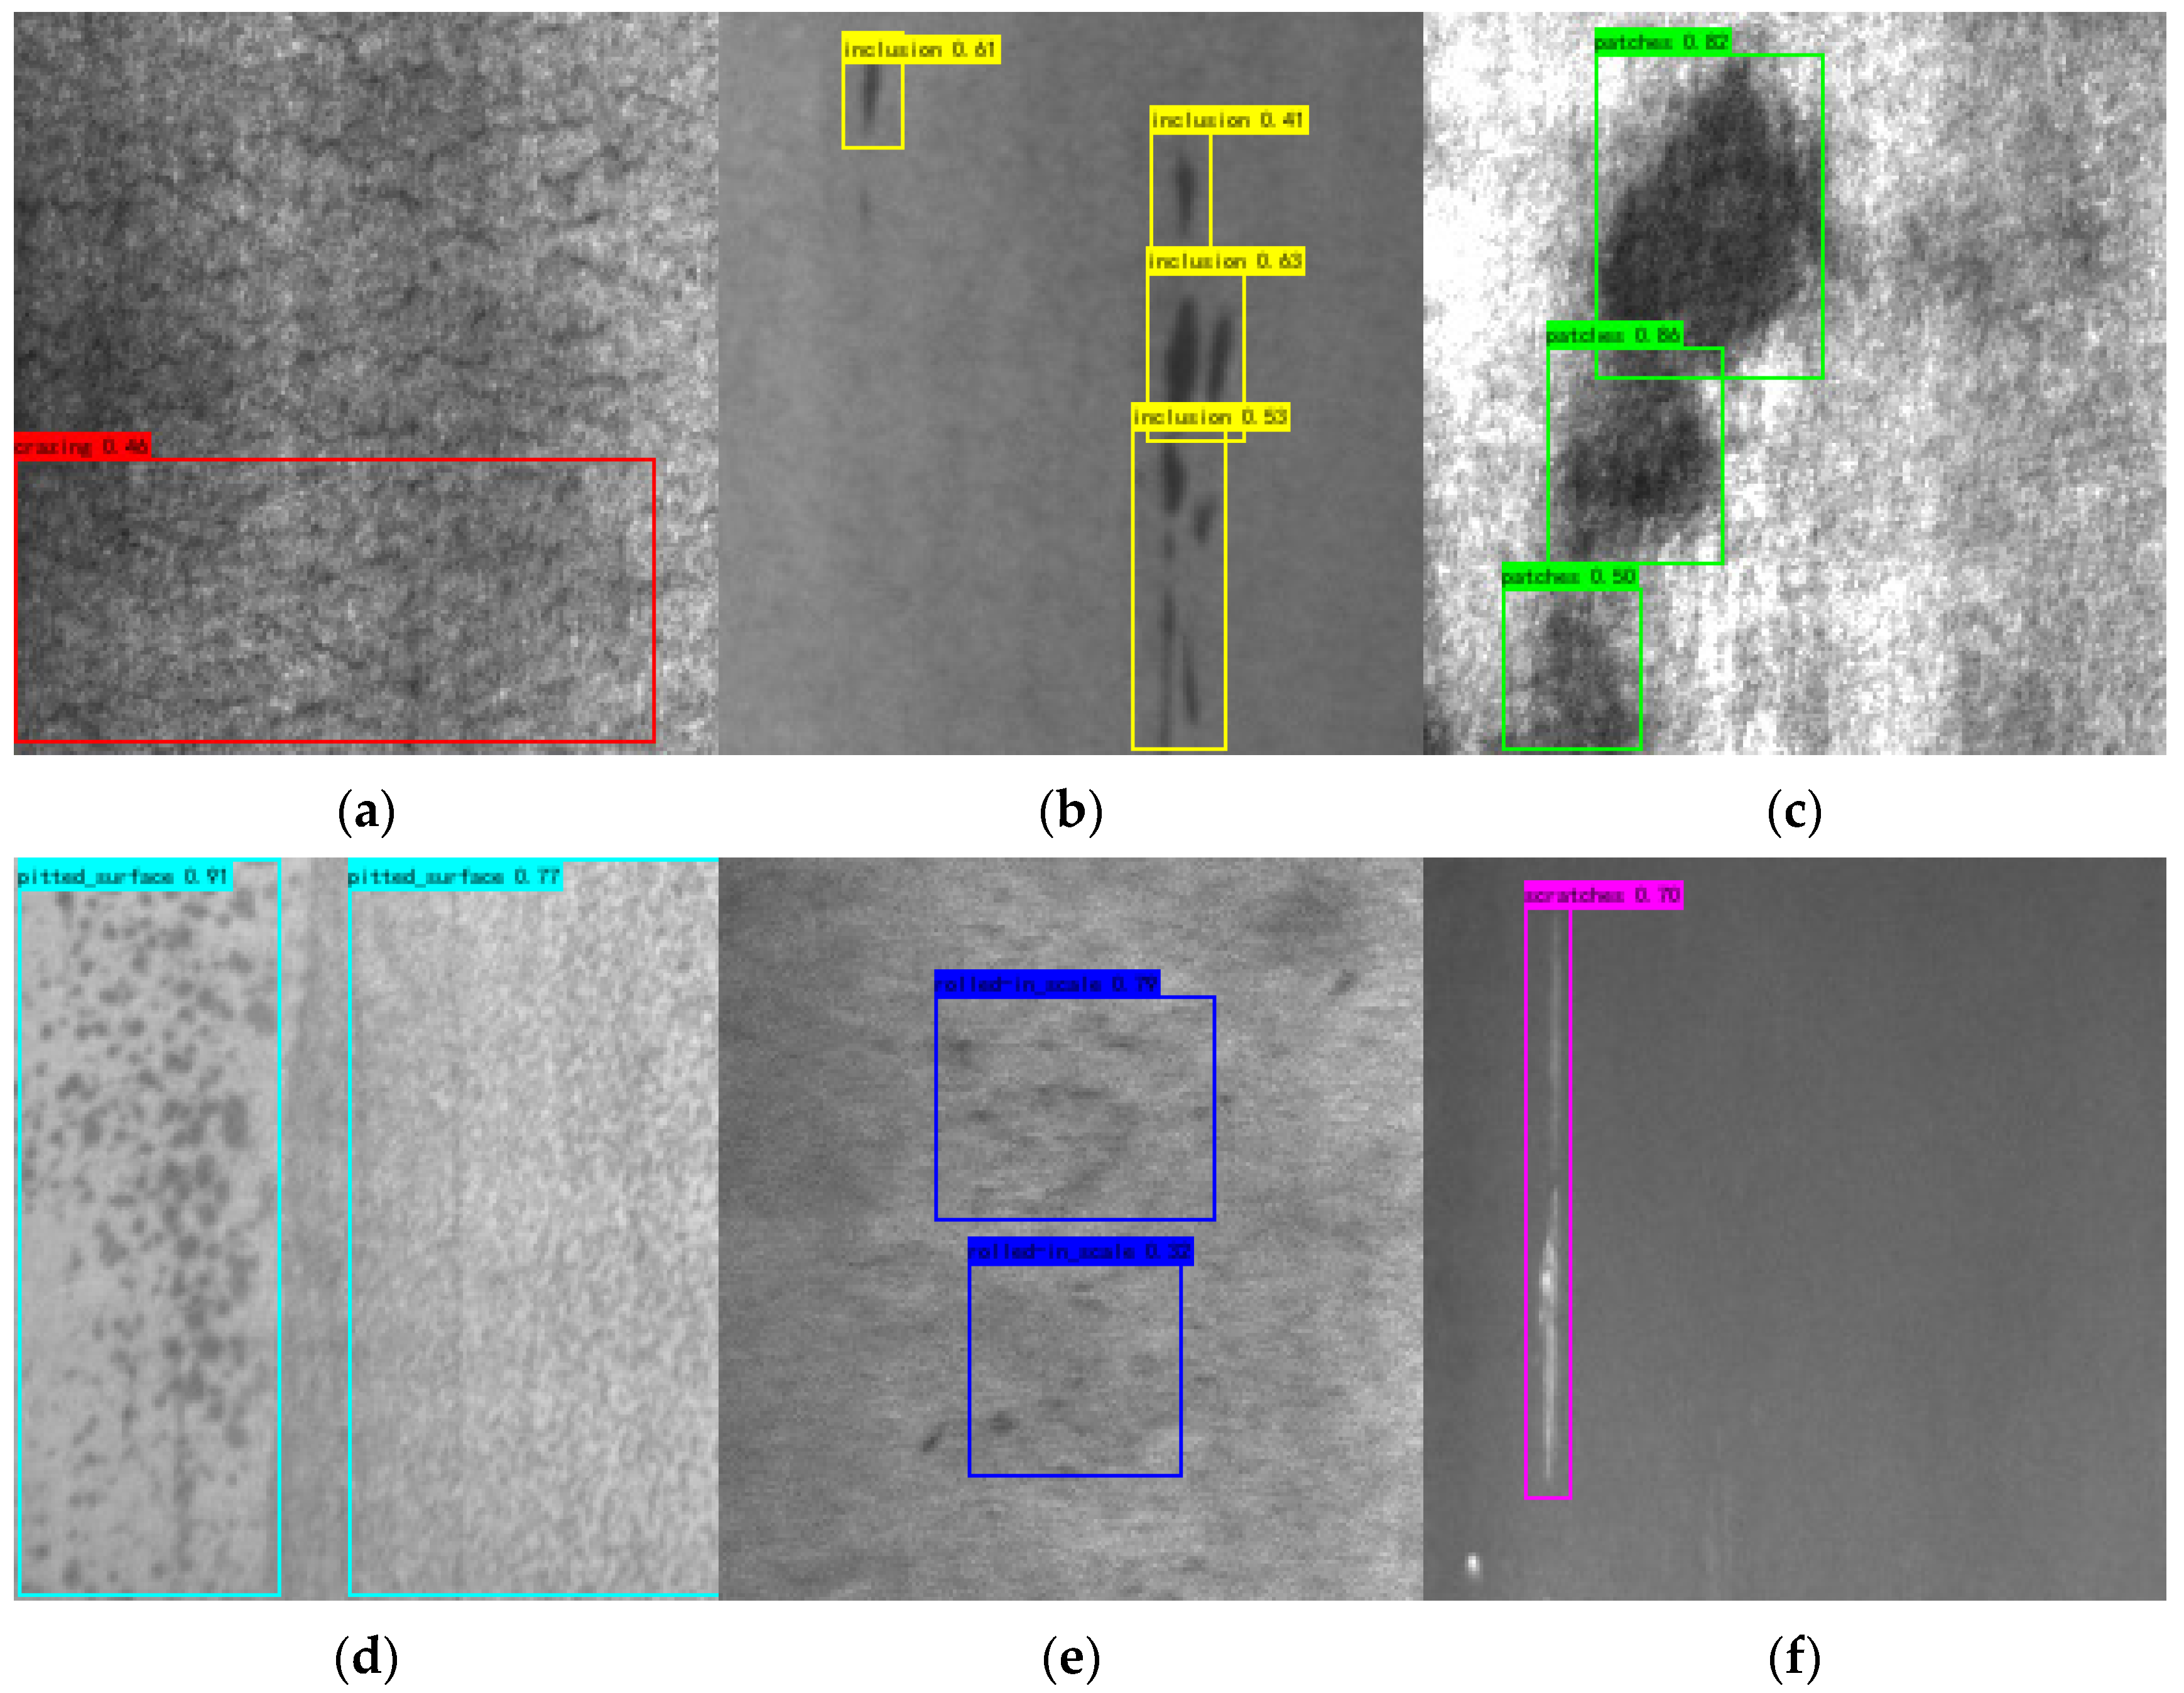
In this experiment, the NEU-DET steel defects dataset from Northeastern University is used to validate the generalization performance of the proposed SC-AttentiveNet algorithm. The NEU-DET dataset contains six typical steel surface defects: cracks (Cr), impurities (In), plaques (Pa), pitting surfaces (PS), oxidized skins (RS), and scratches (Sc), with a total of 1800 grayscale images. Example images of each type of defect are shown in Figure 16.

Figure 16.
NEU-DET dataset images of various types of defects. (a) Crazing; (b) Inclusion; (c) Patches; (d) Pitted_Surface; (e) Rolled-in_Scale; (f) Scratches.
We compare the SC-AttentiveNet algorithm with a variety of common defect detection methods and algorithms proposed in the References [38,39,40,41,42,43]. To ensure the rigor of the experiments, the dataset division, experimental parameter settings and evaluation metrics of the generalizability validation experiments are consistent with the settings of the KUST-DET dataset in Section 3.2 and Section 3.3. The experimental results are shown in Table 12.
Table 12.
Comparison of results of generalizability experiments.
As can be seen from the following table, SC-AttentiveNet achieves a mAP value of 76.41% on the NEU-DET steel defect dataset, which is superior to other algorithms and has a large advantage in parameter scale, and its detection speed can also meet the industrial requirements for real-time defect detection. The experimental results show that the SC-AttentiveNet algorithm also has strong generalization performance.
5. Conclusions
In this paper, we carry out a systematic study, and propose the SC-AttentiveNet algorithm to address several challenges in the field of surface defect detection on copper strips, such as the large model size, the slow detection speed, the low accuracy, and the poor generalizability. The core innovation of the algorithm lies in the design of a lightweight SCGNNet feature extraction module, which aims to effectively reduce the occupancy of computational resources while maintaining high-performance feature extraction capability. In addition, the algorithm introduces the SPPF-PSA multi-scale feature fusion module to enhance the integration ability of features at different scales, and constructs a neck feature fusion network through the HD-CF Fusion Block module, which are designed to significantly improve the model’s ability to capture and analyze subtle features in complex scenarios, thus decreasing the number of parameters and the computational complexity of the model, and improving the defective detection accuracy.
The experimental results fully validate the significant advantages of the SC-AttentiveNet algorithm in terms of detection accuracy, inference speed, and lightweight, making it particularly suitable for real-time detection tasks in complex environments. Experimental results on multiple datasets show that SC-AttentiveNet outperforms the existing mainstream methods in terms of inference speed, computational resource utilization efficiency, and detection accuracy, and exhibits good robustness and generalization ability. Specifically, the algorithm has an average accuracy (mAP) of 90.11%, 76.41%, and 64.14% on the KUST-DET, NEU-DET, and VOC datasets, with a parameter count of only 6.365 MB and a computational complexity of 14.442 GFLOPs, which shows its potential in practical applications.
Subsequent research will further focus on optimizing the model structure to enhance its adaptability and usefulness in a wider range of industrial scenarios. This will include the exploration of novel feature extraction methods, improved feature fusion strategies, the deployment under resource-constrained environments, and the extensive validation in different industrial applications to ensure that the SC-AttentiveNet algorithm is able to meet the growing demand for real-time defect detection and to drive further development in the field.
Author Contributions
Conceptualization, G.Z.; methodology, Z.L.; software, Z.L.; validation, Z.L.; formal analysis, Z.L., Q.Y. and L.Y.; investigation, G.Z., Q.Y. and L.Y.; resources, G.Z.; data curation, Z.L.; writing—original draft preparation, Z.L.; writing—review and editing, Z.L.; visualization, Z.L.; supervision, G.Z.; project administration, G.Z.; funding acquisition, G.Z., Q.Y. and L.Y. All authors have read and agreed to the published version of the manuscript.
Funding
This research was funded by the National Key R&D Project of Intelligent Process Control Technology for Aluminum/Copper Plate and Strip Based on Industrial Big Data (2017YFB0306400).
Data Availability Statement
The data that support the findings of this study are available from the Corresponding Author, [G.Z.], upon reasonable request.
Acknowledgments
The authors would like to express their gratitude for the valuable feedback and suggestions provided by all the anonymous reviewers and the editorial team.
Conflicts of Interest
Authors Qi Yang and Liqiong Yin were employed by the company Kunming Iron & Steel Holding Co., Ltd. The remaining authors declare that the research was conducted in the absence of any commercial or financial relationships that could be construed as a potential conflict of interest.
Appendix A
Pseudocode of the Dysample module (Algorithm A1).
| Algorithm A1 Dysample Module |
| Input: x (feature map) |
| Params: in_channels (number of input channels), scale (scaling factor), style (sampling style: ’lp’ or ’pl’), groups (number of channel groups), dyscope (Boolean flag for scope adjustment) |
| # Step 1: Initialization |
| 1. Determine output channels: |
| If style = ’pl’: out_channels = 2 * groups |
| Else: out_channels = 2 * groups * scale2 |
| 2. Initialize offset module: |
| offset = CONV2D(in_channels, out_channels, kernel_size = 1) |
| INITIALIZE(offset, mean = 0, std = 0.001) |
| 3. Initialize scope module (if dyscope is True): |
| scope = CONV2D(in_channels, out_channels, kernel_size = 1, bias = False) |
| INITIALIZE(scope, val = 0) |
| # Step 2: Sampling Function |
| 1. Normalize sampling coordinates: |
| coords = NORMALIZE_COORDS(offset) |
| 2. Perform grid sampling: |
| sampled_features = GRID_SAMPLE(x, coords, mode = ’bilinear’) |
| # Step 3: Forward Pass |
| 1. Adjust offset: |
| If style = ’pl’: offset = PIXEL_UNSHUFFLE(offset(PIXEL_SHUFFLE(x, scale)), scale) |
| Else: offset = offset(x) |
| 2. Apply scope adjustment (if dyscope is True): |
| offset = offset * scope(x).sigmoid() |
| 3. Add positional encoding: |
| offset = offset + init_pos |
| 4. Perform sampling: |
| output = SAMPLE(x, offset) |
| Output: sampled_features |
References
- Yin, J.; Liu, L.; Ji, H.; Zhang, L.; Li, C.; Yuan, Z. Sustain China’s Copper Resources with Domestic Mining, Trading, and Recycling. Resour. Conserv. Recycl. 2024, 202, 107396. [Google Scholar]
- Laganà, F.; Pullano, S.A.; Angiulli, G.; Versaci, M. Optimized Analytical–Numerical Procedure for Ultrasonic Sludge Treatment for Agricultural Use. Algorithms 2024, 17, 592. [Google Scholar] [CrossRef]
- Versaci, M.; Laganà, F.; Manin, L.; Angiulli, G. Soft Computing and Eddy Currents to Estimate and Classify Delaminations in Biomedical Device CFRP Plates. J. Electr. Eng. 2025, 76, 72–79. [Google Scholar]
- Shirmohammadi, S.; Ferrero, A. Camera as the Instrument: The Rising Trend of Vision Based Measurement. IEEE Instrum. Meas. Mag. 2014, 17, 41–47. [Google Scholar]
- Singh, S.A.; Desai, K.A. Automated Surface Defect Detection Framework Using Machine Vision and Convolutional Neural Networks. J. Intell. Manuf. 2023, 34, 1995–2011. [Google Scholar]
- Liang, F.; Zhou, Y.; Chen, X.; Liu, F.; Zhang, C.; Wu, X. Review of Target Detection Technology Based on Deep Learning. In Proceedings of the 5th International Conference on Control Engineering and Artificial Intelligence, Sanya, China, 14–16 January 2021; pp. 132–135. [Google Scholar]
- Girshick, R. Fast R-CNN. In Proceedings of the 2015 IEEE International Conference on Computer Vision, Santiago, Chile, 7–13 December 2015; pp. 1440–1448. [Google Scholar]
- Ren, S.; He, K.; Girshick, R.; Sun, J. Faster R-CNN: Towards Real-Time Object Detection with Region Proposal Networks. IEEE Trans. Pattern Anal. Mach. Intell. 2016, 39, 1137–1149. [Google Scholar]
- He, K.; Zhang, X.; Ren, S.; Sun, J. Mask R-CNN. In Proceedings of the IEEE International Conference on Computer Vision, Venice, Italy, 22–29 October 2017; pp. 2961–2969. [Google Scholar]
- Liu, W.; Anguelov, D.; Erhan, D.; Szegedy, C.; Reed, S.; Fu, C.Y.; Berg, A.C. SSD: Single Shot Multibox Detector. In Computer Vision–ECCV 2016, Proceedings of the 14th European Conference, Amsterdam, The Netherlands, 11–14 October 2016; Proceedings, Part I 14; Springer: Cham, Switzerland, 2016; pp. 21–37. [Google Scholar]
- Redmon, J.; Farhadi, A. YOLOV3: An Incremental Improvement. arXiv 2018, arXiv:1804.02767. [Google Scholar]
- Bochkovskiy, A.; Wang, C.Y.; Liao, H.Y.M. YOLOv4: Optimal Speed and Accuracy of Object Detection. arXiv 2020, arXiv:2004.10934. [Google Scholar]
- Bochkovskiy, A.; Wang, C.Y.; Liao, H.Y.M. YOLOv7: Trainable Bag-of-Freebies Sets New State-of-the-Art for Real-Time Object Detectors. In Proceedings of the 2023 IEEE/CVF Conference on Computer Vision and Pattern Recognition, Vancouver, BC, Canada, 18–22 June 2023; pp. 7464–7475. [Google Scholar]
- Yang, K.; Wang, J.; Zhang, G.; Chen, T. Copper Plate Surface Defect Detection Based on Vision Transformer and Multi-Scale Feature Fusion. Control Eng. 2024, 1–9. (In Chinese) [Google Scholar] [CrossRef]
- Wang, Z.; Zhang, G.; Yang, Q.; Yin, L. Research on Copper Strip Surface Defect Identification Based on YOLOv4. J. Optoelectron. Laser 2022, 33, 163–170. (In Chinese) [Google Scholar]
- Zhao, X.; Xie, L.; Mu, D.; Zhang, Y. Metal Surface Defect Detection Method Based on TCM-YOLO Network. Comput. Eng. 2024, 1–13. (In Chinese) [Google Scholar] [CrossRef]
- Liang, L.; Long, P.; Lu, B.; Ou, Y.; Zeng, L. EHH-YOLOv8s: A Lightweight Strip Steel Surface Defect Detection Algorithm. J. Beihang Univ. 2024, 1–15. (In Chinese) [Google Scholar] [CrossRef]
- Zhang, L.; Chen, T.; Yu, J.B.; Yang, K.J. Lightweight PCB Surface Defect Detection Algorithm. J. Beijing Univ. Posts Telecommun. 2024, 47, 38–44. (In Chinese) [Google Scholar]
- Liu, G.; Chu, M.; Gong, R.; Zheng, Z. Global Attention Module and Cascade Fusion Network for Steel Surface Defect Detection. Pattern Recognit. 2025, 158, 110979. [Google Scholar]
- He, Z.; Zhao, J.; Zhao, X. Scratch Defects Detection of Curved Metal Surface Based on Multiple High Frequency Projection and Inverse Transfer Learning. IEEE Trans. Instrum. Meas. 2024, 73, 5029012. [Google Scholar]
- Zhang, G.; Lu, Y.; Jiang, X.; Yan, F.; Xu, M. Context-Aware Adaptive Weighted Attention Network for Real-Time Surface Defect Segmentation. IEEE Trans. Instrum. Meas. 2024, 73, 5030013. [Google Scholar]
- Yuan, M.; Zhou, Y.; Ren, X.; Zhi, H.; Zhang, J.; Chen, H. YOLO-HMC: An Improved Method for PCB Surface Defect Detection. IEEE Trans. Instrum. Meas. 2024, 73, 2001611. [Google Scholar]
- Zhou, X.; Wang, D.; Krähenbühl, P. Objects as Points. arXiv 2019, arXiv:1904.07850. [Google Scholar]
- Xu, T.; Takano, W. Graph Stacked Hourglass Networks for 3D Human Pose Estimation. In Proceedings of the IEEE/CVF Conference on Computer Vision and Pattern Recognition, Nashville, TN, USA, 20–25 June 2021; pp. 16105–16114. [Google Scholar]
- Su, Y.; Liu, W.; Yuan, Z.; Cheng, M.; Zhang, Z.; Shen, X.; Wang, C. DLA-Net: Learning Dual Local Attention Features for Semantic Segmentation of Large-Scale Building Facade Point Clouds. Pattern Recogn. 2022, 123, 108372. [Google Scholar]
- He, K.; Zhang, X.; Ren, S.; Sun, J. Deep Residual Learning for Image Recognition. In Proceedings of the IEEE Conference on Computer Vision and Pattern Recognition, Las Vegas, NV, USA, 27–30 June 2016; pp. 770–778. [Google Scholar]
- Woo, S.; Debnath, S.; Hu, R.; Chen, X.; Liu, Z.; Kweon, I.S.; Xie, S. ConvNeXt v2: Co-Designing and Scaling ConvNets with Masked Autoencoders. In Proceedings of the IEEE/CVF Conference on Computer Vision and Pattern Recognition, Vancouver, BC, Canada, 18–22 June 2023; pp. 16133–16142. [Google Scholar]
- He, K.; Zhang, X.; Ren, S.; Sun, J. Spatial Pyramid Pooling in Deep Convolutional Networks for Visual Recognition. IEEE Trans. Pattern Anal. Mach. Intell. 2015, 37, 1904–1916. [Google Scholar]
- Wang, A.; Chen, H.; Liu, L.; Chen, K.; Lin, Z.; Han, J. YOLOv10: Real-Time End-to-End Object Detection. arXiv 2024, arXiv:2405.14458. [Google Scholar]
- Liu, Z.; Mao, H.; Wu, C.Y.; Feichtenhofer, C.; Darrell, T.; Xie, S. A ConvNet for the 2020s. In Proceedings of the IEEE/CVF Conference on Computer Vision and Pattern Recognition, New Orleans, LA, USA, 18–24 June 2022; pp. 11976–11986. [Google Scholar]
- Liu, Z.; Lin, Y.; Cao, Y.; Hu, H.; Wei, Y.; Zhang, Z.; Lin, S.; Guo, B. Swin Transformer: Hierarchical Vision Transformer Using Shifted Windows. In Proceedings of the IEEE/CVF International Conference on Computer Vision, Virtual, 11–17 October 2021; pp. 10012–10022. [Google Scholar]
- Li, G.; Fang, Q.; Zha, L.; Gao, X.; Zheng, N. HAM: Hybrid Attention Module in Deep Convolutional Neural Networks for Image Classification. Pattern Recogn. 2022, 129, 108785. [Google Scholar]
- Liu, W.; Lu, H.; Fu, H.; Cao, Z. Learning to Upsample by Learning to Sample. In Proceedings of the IEEE/CVF International Conference on Computer Vision, Paris, France, 4–6 October 2023; pp. 6027–6037. [Google Scholar]
- Hu, J.; Shen, L.; Sun, G. Squeeze-and-Excitation Networks. In Proceedings of the IEEE Conference on Computer Vision and Pattern Recognition, Salt Lake City, UT, USA, 18–22 June 2018; pp. 7132–7141. [Google Scholar]
- Woo, S.; Park, J.; Lee, J.Y.; Kweon, I.S. CBAM: Convolutional Block Attention Module. In Proceedings of the European Conference on Computer Vision (ECCV), Munich, Germany, 8–14 September 2018; pp. 3–19. [Google Scholar]
- Wang, Q.; Wu, B.; Zhu, P.; Li, P.; Zuo, W.; Hu, Q. ECA-Net: Efficient Channel Attention for Deep Convolutional Neural Networks. In Proceedings of the IEEE/CVF Conference on Computer Vision and Pattern Recognition, Virtual, 14–19 June 2020; pp. 11534–11542. [Google Scholar]
- Hou, Q.; Zhou, D.; Feng, J. Coordinate Attention for Efficient Mobile Network Design. In Proceedings of the IEEE/CVF Conference on Computer Vision and Pattern Recognition, Virtual, 19–25 June 2021; pp. 13713–13722. [Google Scholar]
- Wang, J.; Chen, K.; Xu, R.; Liu, Z.; Loy, C.C.; Lin, D. CARAFE: Content-Aware Reassembly of Features. In Proceedings of the IEEE/CVF International Conference on Computer Vision, Seoul, Republic of Korea, 27 October–2 November 2019; pp. 3007–3016. [Google Scholar]
- Dumoulin, V.; Visin, F. A Guide to Convolution Arithmetic for Deep Learning. arXiv 2016, arXiv:1603.07285. [Google Scholar]
- Cao, Y.; Wu, M.; Xu, L. Steel Surface Detection Based on Improved YOLOv5 Algorithm. J. Graph. 2023, 44, 335–345. (In Chinese) [Google Scholar]
- Zhao, L.; Zhen, G.; Chu, C.; Shan, Y. Detection Method of Steel Surface Defects Based on CBE-YOLOv5. Electron. Meas. Technol. 2023, 46, 73–80. (In Chinese) [Google Scholar]
- Guo, Z.; Wang, C.; Yang, G.; Huang, Z.; Li, G. Msft-YOLO: Improved YOLOv5 Based on Transformer for Detecting Defects of Steel Surface. Sensors 2022, 22, 3467. [Google Scholar] [CrossRef]
- Liu, G.; Ma, Q. Strip Steel Surface Defect Detecting Method Combined with a Multi-Layer Attention Mechanism Network. Meas. Sci. Technol. 2023, 34, 055403. [Google Scholar]


Disclaimer/Publisher’s Note: The statements, opinions and data contained in all publications are solely those of the individual author(s) and contributor(s) and not of MDPI and/or the editor(s). MDPI and/or the editor(s) disclaim responsibility for any injury to people or property resulting from any ideas, methods, instructions or products referred to in the content. |
© 2025 by the authors. Licensee MDPI, Basel, Switzerland. This article is an open access article distributed under the terms and conditions of the Creative Commons Attribution (CC BY) license (https://creativecommons.org/licenses/by/4.0/).