Abstract
Accurate and real-time outdoor localization and pose estimation are critical for various applications, including navigation, robotics, and augmented reality. Apple’s ARKit, a leading AR platform, employs visual–inertial odometry (VIO) and simultaneous localization and mapping (SLAM) algorithms to enable localization and pose estimation. However, ARKit-based systems face positional bias when the device’s camera is obscured, a frequent issue in dynamic or crowded environments. This paper presents a novel approach to mitigate this limitation by integrating position bias correction, context-aware localization, and human–computer interaction techniques into a cohesive interactive module group. The proposed system includes a navigation module, a positioning module, and a front-end rendering module that collaboratively optimize ARKit’s localization accuracy. Comprehensive evaluation across a variety of outdoor environments demonstrates the approach’s effectiveness in improving localization precision. This work contributes to enhancing ARKit-based systems, particularly in scenarios with limited visual input, thereby improving user experience and expanding the potential for outdoor localization applications. Experimental evaluations show that our method improves localization accuracy by up to 92.9% and reduces average positional error by more than 85% compared with baseline ARKit in occluded or crowded outdoor environments.
1. Introduction
The emergence of augmented reality (AR) has revolutionized various applications such as navigation, robotics, gaming, and, more recently, outdoor localization and pose estimation. Accurate and real-time localization and pose estimation in outdoor environments are crucial for numerous applications like mobile robotics, autonomous vehicles, and pedestrian navigation [1]. Our approach can also benefit robot navigation by providing reliable pose estimation in GPS-denied or crowded environments, where visual occlusions frequently affect localization accuracy. The biggest advantage of ARKit is that it only uses a single camera and IMU [2,3,4,5] (inertial measurement unit, that is, the gyroscope accelerometer in the mobile phone) to achieve very good SLAM (simultaneous localization and map construction). Generally speaking, today’s single-camera mobile phones face the problems of not being able to obtain scene-depth information and lacking image recognition capabilities when using AR. In addition, ARKit utilizes a technology called “visual–inertial odometry” (VIO) [6,7,8,9] for environment tracking, using iPhone and iPad cameras and motion sensors for on-device motion tracking, camera scene capture, and advanced scene processing. This technology combines the data from the device IMU with the scene visible to the camera to measure the position of the mobile phone and identify key areas such as the main plane boundaries in the scene image, find the most easily displayed surface, and project the 3D virtual object. When the user moves the device, the camera determines the spatial position by tracking the position change of the plane image of the scene between frames to ensure the accuracy of the position of the position object. Traditionally, the Global Positioning System (GPS) has been the primary method for outdoor localization. However, it often suffers from multipath effects, signal blockages, and inaccuracies in urban environments with tall buildings [10].
The above challenges have led to the exploration of alternative methods for outdoor localization and pose estimation. Recent studies have leveraged visual landmarks, simultaneous localization and mapping (SLAM) algorithms, and deep learning-based approaches to address these issues [11,12]. While these methods have shown promising results, they still face limitations. For example, methods utilizing visual landmarks are affected by varying lighting conditions and occlusions. SLAM algorithms require significant computational resources, making them unsuitable for real-time applications on mobile devices. Deep learning-based approaches necessitate a pre-trained model and a large dataset for training, which may not always be readily available or applicable to all environments. The previous methods [13,14,15,16,17,18,19] tried to use ARKit for positioning research, but we still found the following problem during the test: when the moving object completely blocks the camera, the estimated position information of the mobile device will be biased. Key challenges in the field of AR-based outdoor localization and pose estimation include:
- GPS suffers from signal blockage and multipath effects in dense urban areas, leading to poor localization accuracy.
- ARKit relies on monocular vision and thus struggles with obtaining reliable depth information in outdoor settings.
- Visual–inertial odometry in ARKit fails when the camera is blocked by moving objects, leading to significant position bias.
- SLAM-based methods are accurate but computationally expensive, limiting real-time performance on mobile devices.
- Learning-based methods require extensive data and training, reducing generalization across varying environments.
In this work, we propose a novel ARKit-based system for outdoor localization and pose estimation that addresses the aforementioned challenges. Our system leverages the built-in inertial measurement unit (IMU) sensor of iOS devices in conjunction with ARKit for pose estimation, thus eliminating the need for additional hardware and pre-built maps. Moreover, we incorporate advanced techniques such as position bias correction under occlusion, context-aware localization, and human–computer interaction techniques to enhance the user experience in crowded and occluded environments.
Our experiments indicate that the proposed system demonstrates improved localization and pose estimation accuracy, particularly in challenging environments. The contributions of this work are as follows:
- We propose an innovative ARKit-based system for outdoor localization and pose estimation that leverages the built-in IMU sensor of iOS devices and incorporates advanced techniques to improve accuracy and user experience.
- We design a comprehensive evaluation tool to measure the initialization speed, stability, robustness, and accuracy of ARKit, providing a detailed analysis of its performance in different environments and under various conditions.
- We conduct extensive experiments to evaluate the performance of the proposed system, demonstrating its effectiveness and practicality for real-world applications.
In the following sections, we present the proposed ARKit-based localization method in detail. Section 2 reviews the related research topics. Section 3 describes the architecture and components of our system. Section 4 provides the experimental setup, evaluation metrics, and a detailed discussion of the results. Finally, Section 5 concludes the paper and outlines directions for future work.
2. Related Work
Accurate and robust outdoor localization and pose estimation are fundamental challenges in mobile computing and augmented reality (AR) applications. Existing solutions have explored a variety of sensing modalities and algorithmic approaches, including GPS, inertial measurement units (IMUs), visual–inertial odometry (VIO), simultaneous localization and mapping (SLAM), and deep learning-based techniques. Each of these methods offers unique strengths but also faces specific limitations, particularly in urban environments where GPS signals are unreliable, visual occlusion is frequent, and real-time performance is constrained by hardware. This section provides an overview of related work in three core areas: ARKit-based systems that integrate camera and IMU data for pose estimation; outdoor localization methods using vision, SLAM, and deep learning; and IMU-based solutions for mobile localization. We analyze how prior studies addressed these challenges and highlight the research gaps our proposed system aims to fill.
2.1. ARKit-Based Systems
Apple’s ARKit is a widely adopted platform for developing augmented reality (AR) experiences on iOS devices. Various applications, ranging from gaming to navigation, have been developed using ARKit. For example, Joshi et al. [20] developed a mobile AR application for indoor navigation, which allowed users to navigate inside buildings using visual cues. However, their work focused on indoor environments and did not address the challenges associated with outdoor localization, such as occlusions and crowd density. Oufqir et al. [21] presented an interactive gaming application using ARKit. While their work demonstrated the capabilities of ARKit in creating immersive gaming experiences, it did not focus on the localization or pose estimation aspects. Another study by Le et al. [22] used ARKit for virtual object placement in outdoor environments. However, their work did not address the challenges of pose estimation in crowded or occluded areas. Our work is distinct from these studies as we specifically focus on outdoor localization and pose estimation using ARKit, and incorporate human–computer interaction techniques to enhance the user experience in crowded and occluded environments.
2.2. Outdoor Localization and Pose Estimation
Outdoor localization and pose estimation are crucial for various applications, including navigation, robotics, and augmented reality. GPS is commonly used for outdoor localization, but it has limitations in urban environments with tall buildings, which can cause multipath effects and signal blockages [23]. Furthermore, GPS does not provide pose (orientation) information, which is crucial for applications like augmented reality. Visual methods, which utilize cameras to estimate the device’s position and orientation, have been proposed as an alternative or complement to GPS.
Haris et al. [24] utilized visual landmarks for localization in outdoor environments. Their method involved detecting and matching visual landmarks, such as buildings and signs, with a pre-built map to estimate the device’s position and orientation. However, their method was affected by varying lighting conditions and occlusions, which can cause the landmarks to be undetectable. Refs. [25,26,27] used the simultaneous localization and mapping (SLAM) algorithm for outdoor localization. Their method involved building a map of the environment in real time while simultaneously localizing the device within the map. Although their method demonstrated promising results, it required significant computational resources and was not suitable for real-time applications on mobile devices. Another study by Zhang et al. [28] proposed a deep learning-based approach for outdoor localization using visual and semantic features. Their method involved training a deep neural network to predict the device’s position and orientation from the visual and semantic features extracted from the camera images. However, their method required a pre-trained model and a large dataset for training, which might not be available for all environments.
Recent research continues to explore robust localization in dynamic and occluded environments. For example, Gassol Puigjaner et al. [29] proposed MARLoc, a mapless augmented reality localization system that leverages known relative transformations from image sequences to triangulate global positions, avoiding the need for prior maps. Their method performs well in outdoor settings but still relies on stable feature tracking and known relative motion. Hou et al. [30] introduced a hybrid AR localization framework combining visual and marker-based systems to enhance pose estimation and tracking accuracy in indoor environments. However, their approach requires maker infrastructure and is limited in outdoor use. Our work differs by focusing specifically on ARKit-based pose estimation outdoors under occlusion and crowd density, without the need for external infrastructure or pre-built maps.
Our work aims to address these limitations by using ARKit for pose estimation and incorporating human–computer interaction techniques to improve the user experience in crowded and occluded environments. Additionally, we leverage the built-in capabilities of ARKit to handle varying lighting conditions and occlusions, which were limitations in some of the previous methods.
2.3. IMU-Based Outdoor Localization
Inertial measurement units (IMUs) have been extensively used for outdoor localization, often in conjunction with other sensors. IMUs, which typically comprise accelerometers and gyroscopes, can provide high-frequency measurements of linear accelerations and angular velocities, which can be integrated over time to estimate the device’s position and orientation. However, standalone IMUs are prone to drift over time due to sensor noise and bias. Therefore, it is common practice to fuse IMU data with other sensor data, such as GPS or visual odometry, to achieve more accurate and robust localization.
Chen et al. [31] proposed an IMU and GPS integrated system for pedestrian localization in urban environments. Their system utilized a Kalman filter to fuse the data from the IMU and GPS, which provided accurate localization in open areas. However, the system faced challenges in areas with poor GPS reception, such as urban canyons or indoor environments, and required additional sensors to maintain accurate localization in these situations. Similarly, Cai et al. [32] utilized an IMU and visual odometry for outdoor localization. Their system demonstrated accurate localization by fusing IMU data with visual features extracted from a monocular camera. Although their system demonstrated accurate localization, it required additional hardware and was not designed for mobile devices. Another study by Charroud et al. [33] used IMU data and a particle filter for localization. Their method required a pre-built map of the environment, and the particle filter was used to update the position estimate based on the map and the IMU data. However, their method was not suitable for dynamic or unknown areas as it required a pre-built map.
Our work leverages the built-in IMU sensor of iOS devices in conjunction with ARKit for pose estimation, eliminating the need for additional hardware and pre-built maps. ARKit provides visual–inertial odometry (VIO) by fusing camera data with IMU data, which helps in reducing the drift and provides more accurate pose estimates. Furthermore, our proposed method includes additional steps to correct the pose estimation in crowded areas and specific postures, which have not been addressed in the previous works.
3. Method
In this section, we provide an overview of the proposed method for outdoor localization using ARKit. The entire process starts with data collection, where necessary data such as images and sensor readings are collected. This is followed by a series of steps, namely position bias correction under occlusion, context-aware localization, and human–computer interaction techniques for improved user experience, each refining the localization and pose estimation. The overall framework of the method is illustrated in Figure 1.
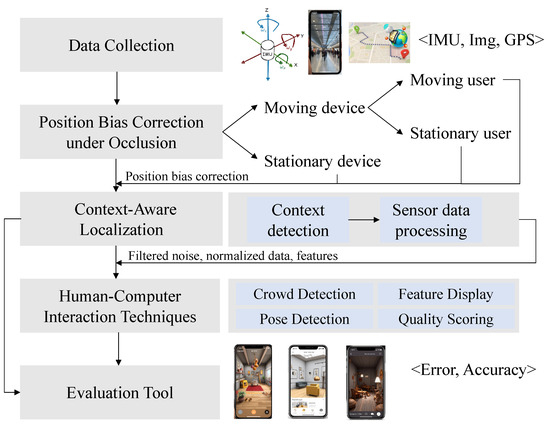
Figure 1.
The framework of the proposed ARKit-based localization method.
Although our system does not perform active obstacle avoidance in the sense of real-time path re-planning, it does take environmental obstacles into account in two significant ways. First, a deep learning-based crowd density estimation module is used to detect dynamic obstacles such as groups of pedestrians, prompting users to adjust their device orientation or path. Second, the position bias correction algorithm compensates for drift caused by visual occlusion from moving objects. These mechanisms help ensure stable and accurate localization in cluttered or crowded scenes.
Deep learning plays an essential role in our proposed solution. We employ convolutional neural networks for several key components: U-Net is used for semantic segmentation to guide image capture, CSRNet is used for real-time crowd density estimation to inform pose correction, and a modified DeepLab model is used to assess image quality. These deep models enable the system to handle complex environments and improve localization robustness and user feedback.
3.1. Position Bias Correction Under Occlusion
During the operation of ARKit, it was observed that position information bias occurred when the mobile device was either stationary or moving slowly while being completely occluded by a moving object. The preliminary analysis indicates that this bias is due to the ARKit detecting motion in the visual data despite the inertial measurement unit (IMU) data showing minimal change. This discrepancy, once fused by ARKit, results in a position information drift. In response to this problem, we propose a method that uses the accelerometer and pedometer to correct the position bias.
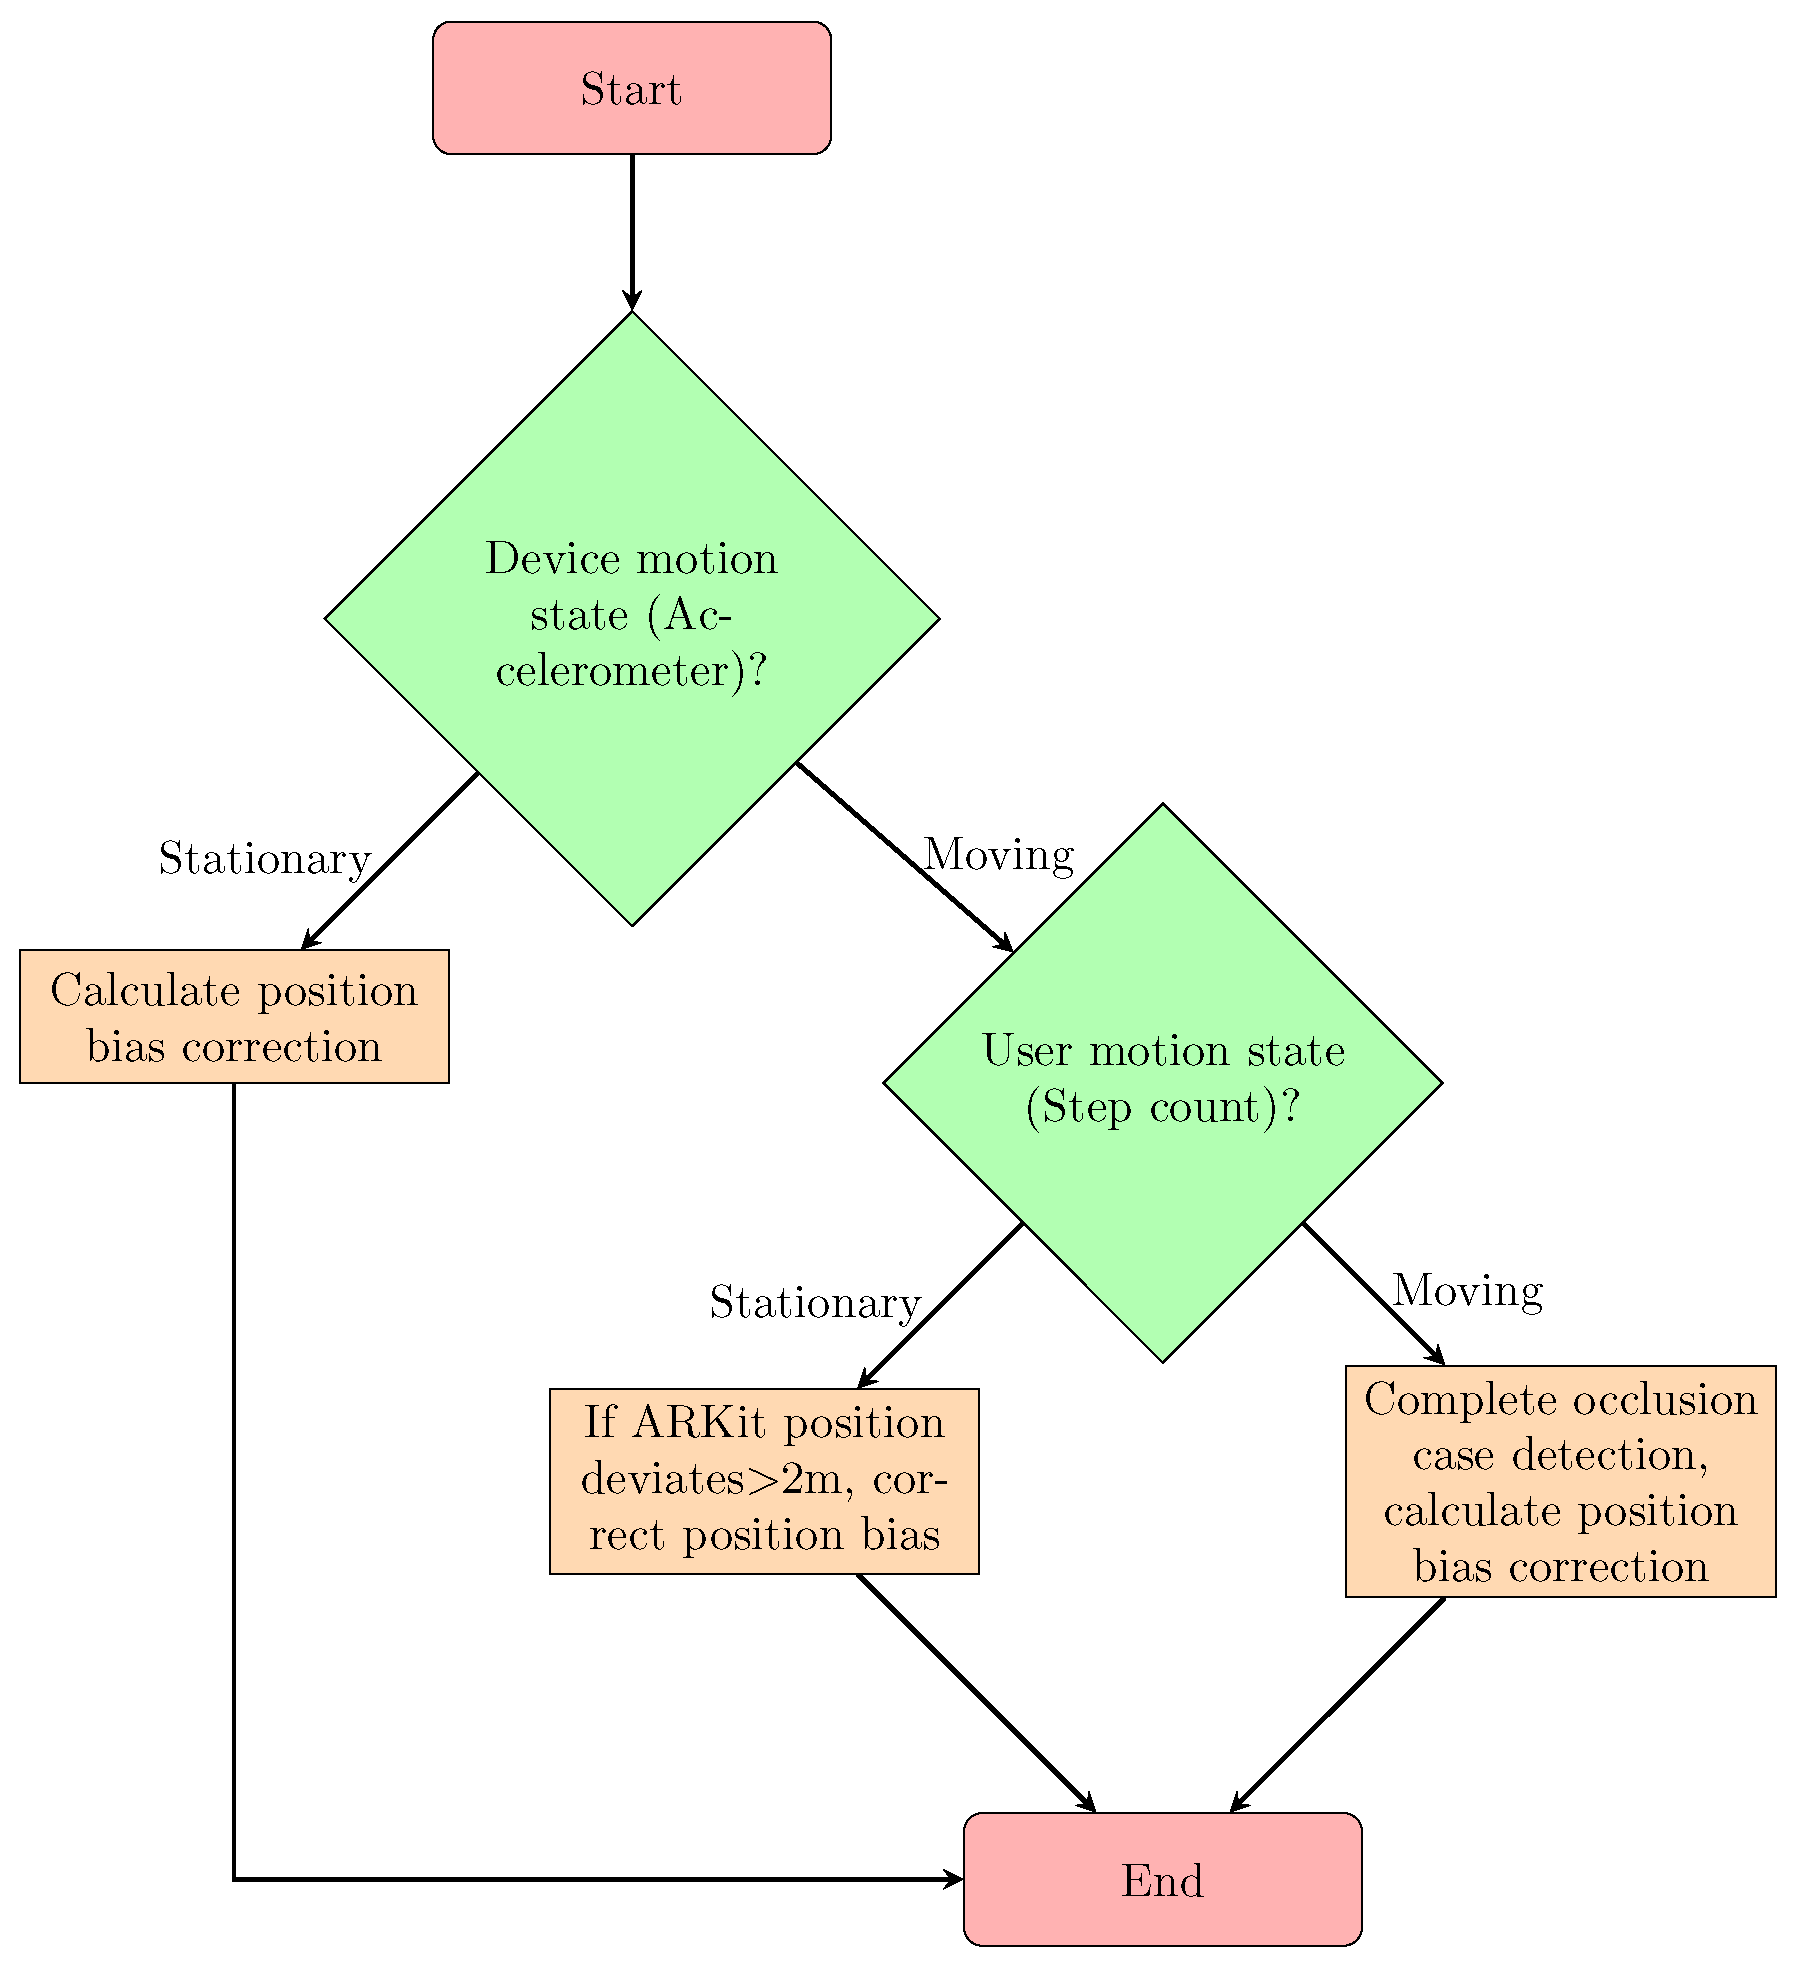
Figure 2 depicts the process of calculating the position bias correction in an AR system with moving objects occluding the camera. The procedure begins by assessing the device’s motion state using accelerometer data. If the device is stationary, the position bias correction is computed. If the device is in motion, the algorithm moves on to the second step, which involves determining the user’s motion state based on step counting. If the user is stationary and the ARKit-reported position deviates by a certain threshold (e.g., 2 m), the algorithm brings the position bias back to the original point. The 2 m threshold was empirically determined through extensive testing across various real-world environments such as corridors, open squares, and airports. It corresponds to the average maximum deviation observed when the camera is occluded and ARKit fails to track accurately. The step-counting threshold was derived from analyzing the periodicity and magnitude of accelerometer signals, using a dynamic window-based peak detection algorithm calibrated against annotated walking sequences. This ensures reliable discrimination between stationary and walking states. If the user is moving, a full occlusion case detection algorithm is executed, followed by the calculation of the position bias correction.

Figure 2.
Flowchart of the position bias correction algorithm for AR systems with moving objects.
3.1.1. Mobile Device Motion State Determination
To accurately determine whether the mobile device is in a stationary or low-amplitude motion state, we analyze the magnitude of the acceleration vector obtained from the built-in accelerometer. The raw 3-axis acceleration data are first pre-processed using a low-pass filter to remove high-frequency noise caused by hand jitter or sensor fluctuation.
The magnitude of the acceleration vector is then calculated as: . We define a threshold value, , empirically determined through calibration experiments in both controlled and real-world environments, to differentiate between motion and stillness. When the magnitude, , falls below for a predefined duration (e.g., 1 s), the device is considered stationary. Otherwise, it is classified as being in motion.
The decision logic is summarized in Algorithm 1.
| Algorithm 1 Determine Device Motion State |
|
This algorithm allows the system to detect subtle drifts caused by occlusion or internal visual error when the device appears stationary from inertial measurements. The temporal condition ensures robustness against transient fluctuations.
3.1.2. Position Bias Correction for Stationary or Low-Amplitude Motion States
When the device is detected to be in a stationary or low-amplitude motion state, we correct the position bias using the Algorithm 2.
| Algorithm 2 Position Bias Correction for Stationary or Low-Amplitude Motion States |
|
In this algorithm, is the position information from visual data, is the position information from IMU data, is the corrected position information, and is the weighting factor.
In our implementation, the position deviation is calculated as the Euclidean distance between the current visual-based position estimate and the reference point:
where is the last known reliable position (typically from the IMU or last fused result). If , we treat this as significant drift due to occlusion. The corrected position is then computed via a weighted fusion of visual and IMU data:
The value of is selected based on empirical performance in different scenarios, with higher weight given to IMU data under occlusion. This fusion compensates for drift when visual tracking fails but inertial tracking remains reliable.
3.1.3. User Motion State Determination
To determine whether the user is actively moving or standing still, we adopt a pedometer-based motion detection strategy. This method leverages the periodic characteristics of human gait, as reflected in the vertical acceleration signal captured by the mobile device’s inertial sensors. The raw accelerometer signal is first passed through a band-pass filter to suppress noise and isolate the frequency band corresponding to human walking (typically 1–3 Hz). Then, we apply a dynamic peak detection algorithm within a sliding time window to identify steps. Peaks are detected based on their amplitude and inter-peak interval consistency, both calibrated through empirical experiments using annotated motion sequences. The total number of detected steps, s, is then compared with a predefined threshold, , which represents the minimum number of steps expected in a time window (e.g., 2–3 steps within 1.5 s) to confidently classify the user as in motion.
The algorithmic logic is shown in Algorithm 3.
| Algorithm 3 User Motion State Determination |
|
This approach ensures robust classification under varying gait styles and walking speeds. The threshold, , and window size, T, are both tuned based on statistical analysis across a diverse dataset collected in airport, street, and corridor scenarios, to balance sensitivity and specificity.
3.1.4. Position Bias Correction for Moving Device
When the mobile device is in motion and visual occlusion may occur, the position estimates from ARKit often drift due to mismatches between visual features and inertial cues. To address this, we propose a hybrid correction method that fuses the IMU and visual-based position information using the user’s motion state inferred from step count data. Specifically, when the user is detected to be stationary (based on the pedometer algorithm discussed earlier), and the deviation between the current visual-based position, , and the last-known reliable position exceeds a threshold, , the system assumes that visual tracking is unreliable due to occlusion or poor feature quality. In this case, the corrected position is set to the IMU-based estimate , which is more stable under visual degradation.
To formally describe the process, the following algorithm is adopted in Algorithm 4.
| Algorithm 4 Position Bias Correction for Moving Device |
|
In this algorithm, is the corrected position information, is the position information from IMU data, is the position information from visual data, s is the step count, is the position threshold for bias correction, and is the weighting factor.
3.2. Context-Aware Localization
The context-aware localization method is designed to enhance the localization accuracy of mobile devices in various environments by considering the surrounding context. This method leverages multiple sensors, such as the accelerometer, gyroscope, and camera, along with machine learning algorithms, to dynamically adjust the localization process based on the current context.
The context-aware localization method consists of the following main components:
- Context detection: determines the current context of the mobile device, such as whether the device is indoors or outdoors, or stationary or moving, and the level of environmental noise.
- Sensor data processing: processes the raw sensor data from the mobile device to extract useful features for localization.
3.2.1. Context Detection
The context detection component determines the current context of the mobile device using various sensors and algorithms. Table 1 shows the parameters used for context detection. Algorithm 5 illustrates the process. The detected context includes the following:
- Location type: determines whether the device is indoors or outdoors using GPS signal strength and light sensor data.
- Motion state: determines whether the device is stationary or moving using accelerometer and gyroscope data.
- Environmental noise: determines the level of environmental noise using the microphone.

Table 1.
Parameters for context detection.
Table 1.
Parameters for context detection.
| Parameter | Description |
|---|---|
| gps_signal_threshold | Threshold for GPS signal strength to determine indoor/outdoor |
| light_intensity_threshold | Threshold for light intensity to determine indoor/outdoor |
| motion_threshold | Threshold for motion detection to determine stationary/moving |
| noise_level_threshold | Threshold for noise level to determine environmental noise |
| Algorithm 5 Context Detection |
|
This rule-based algorithm allows the system to adapt its localization behavior based on the inferred context. For example, in noisy and crowded outdoor scenes, the system increases the weight of IMU data and may prompt the user for enhanced interaction feedback. In contrast, for stationary indoor scenes, the system leverages visual tracking more confidently while reducing the impact of fluctuating acoustic input.
3.2.2. Sensor Data Processing
The sensor data processing component processes the raw sensor data from the mobile device to extract useful features for localization. This includes filtering noise from the sensor data, normalizing the data, and extracting relevant features. Table 2 shows the parameters used for sensor data processing.
Table 2.
Parameters for sensor data processing.
This study aims to improve the user experience of the ARKit pose estimation system in crowded areas through human–computer interaction technology. We propose a method based on deep learning and ARKit, which includes crowd detection, specific posture detection, enhanced feature point display, and image quality scoring.
3.3. Human–Computer Interaction Techniques for Improved User Experience
3.3.1. Crowd Detection
- Crowd density estimation: to accurately estimate the crowd density of the area captured by the camera, we use a deep learning model based on CSRNet [34]. CSRNet is a deep neural network, including a VGG-16 network for extracting image features, and a dilated convolutional layer for generating density maps.The loss function is defined as the mean square error between the predicted density map, , and the true density map, :where N and M are the width and height of the input image, respectively.
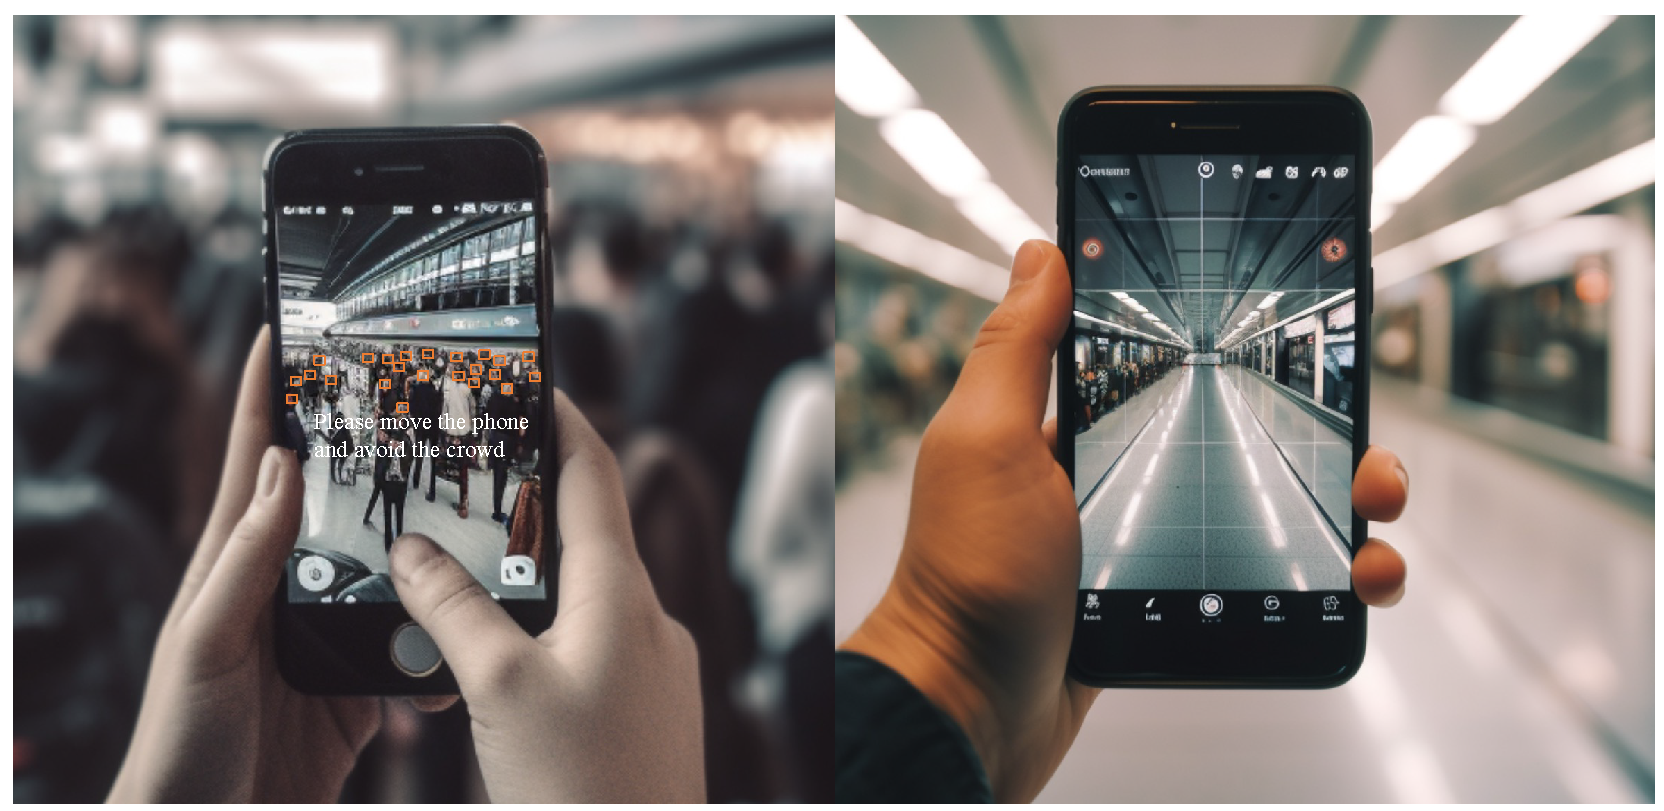
- Crowd density judgement: the total number of people, P, can be given by the sum of all elements in the density map, D:We set a threshold, T. If , it is considered that the crowd within the range of the camera is relatively dense. In this case, we can send prompts to the user through ARKit, such as “Please move the phone and avoid the crowd” to ensure the quality of ARKit pose tracking. Figure 3 shows the hint with a crowded environment.
 Figure 3. Comparison of ARKit tool interface for crowded and uncrowded environment (orange box indicates the detected head of the person in the figure).
3.3.2. Specific Pose Detection
- Pose estimation: the built-in pose estimation function of ARKit uses the SLAM (simultaneous localization and mapping) algorithm to provide the rotation angle and translation distance of the camera.
- Pose judgement: we set a threshold angle, R. If the pitch or roll angle of the camera exceeds R, it is considered that the camera is in a low-accuracy state. In this case, ARKit can send prompts to the user, such as "Please adjust the phone angle" to ensure the high-accuracy operation of ARKit.
3.3.3. Enhanced Feature Display
- Feature extraction and filtering: feature point extraction uses the built-in ORB (Oriented FAST and Rotated BRIEF) [35] algorithm of ARKit. Then, we use the RANSAC (Random Sample Consensus) [36] algorithm to filter the feature points to remove outliers.
- Scene feature display: to guide users to shoot texture-rich images, we propose a method that can display the feature points of the scene, where the scene feature points refer to the feature points of the texture-rich area (excluding walls, ceilings, etc.). Specifically, we first perform semantic segmentation of the image through a deep learning model, specifically adopting the U-Net architecture due to its strong performance in preserving spatial details and its suitability for lightweight semantic segmentation tasks, and then display the feature points in the texture-rich area.
3.3.4. Image Quality Scoring
- Image quality assessment: image quality scoring uses a deep learning method based on the DeepLab model [37]. DeepLab is a deep learning model that uses multiscale contextual information and a fully convolutional network. We modified the output layer of the DeepLab model to a regression layer for predicting the image quality score, Q. The loss function is defined as:
- Image quality judgement: we set a threshold, T, for the image quality score. If , it is considered that the image quality is not sufficient for high-accuracy pose estimation. In this case, ARKit can send prompts to the user through the scoring mechanism, such as “Please slow down the movement speed” to ensure the tracking accuracy of ARKit. Figure 4 shows the different image quality scores.
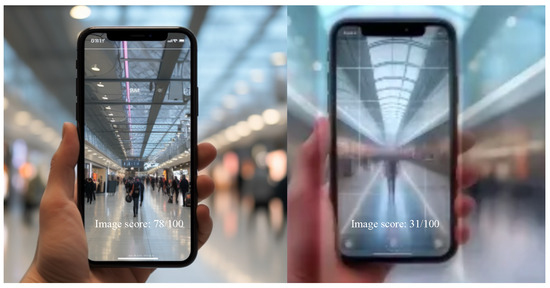 Figure 4. Comparison of ARKit tool interface for high-quality and low-quality capture.
4. Experiments and Discussion
4.1. Data Processing Algorithms
To support robust pose correction and context recognition, our system employs several lightweight yet effective data processing algorithms. For step detection, we adopt a dynamic window-based peak detection algorithm that analyzes the periodicity and amplitude of accelerometer signals, enabling accurate estimation of the user’s motion state. To detect significant positional drift, we calculate the Euclidean distance between the current visual-based position and a reliable reference point. If the distance exceeds a predefined threshold, a drift correction procedure is triggered. To correct such deviations, we implement a weighted sensor fusion strategy that linearly combines the IMU-based and visual-based position estimates. The corrected position is computed as , where the weighting factor, , is dynamically selected based on empirical evaluations under different environmental conditions.
Although a classical Kalman Filter (KF) is not explicitly used in this work, the weighted fusion mechanism serves a similar role in reducing noise and compensating for drift in sensor data. This approach was chosen to simplify deployment on mobile devices while ensuring high localization accuracy under real-world constraints.
4.2. Hardware and Software
The proposed system is deployed on iOS mobile devices (iPhone 6sp, 7, 7P, 8P, and 11) and leverages Apple’s ARKit framework for visual–inertial odometry and pose estimation. The software architecture is modular and consists of the following components:
- Sensor interface module: developed using Swift, this module handles real-time data acquisition from the IMU (accelerometer and gyroscope), camera, microphone, and GPS.
- Core localization engine: includes custom logic for position bias correction and context-aware localization. It fuses data from ARKit and auxiliary sensors to enhance robustness under occlusions.
- Deep learning inference: key models such as U-Net, CSRNet, and modified DeepLab are trained in Python 3.7 using PyTorch 0.4.0 and TensorFlow 2.2. The trained models are converted to CoreML or TensorFlow Lite format for real-time inference on mobile devices.
- Human–computer interaction layer: provides visual prompts and feedback through AR overlays, guiding users to improve pose estimation quality.
- Evaluation tool: an in-house tool developed in Swift and Metal for evaluating ARKit’s localization parameters, data logging, and offline visualization. It also supports importing external VIO/PDR data for comparison.
This hybrid architecture enables both real-time execution and offline debugging while maintaining low latency and user-friendly interaction.
4.3. Evaluation Tool
We designed an evaluation tool for ARKit to evaluate the performance of ARKit, including information such as its initialization speed, stability, robustness, and accuracy. Based on this evaluation tool, the tool can also be used to evaluate the PDR algorithm, VINS algorithm, or other VIO mobile terminal algorithms. By turning on the camera and inputting the data sampling frequency, the evaluation tool can output all parameters of the ARKit, including the three-dimensional coordinates of the camera, r, t, internal reference matrix, image resolution, lighting conditions, time stamp, Euler angle, image, etc., and can be set to save image data, and start and stop data collection at any time, and save data cleaning has the characteristics of easy reading and easy expansion. Figure 5 shows the interface of the evaluation tool.
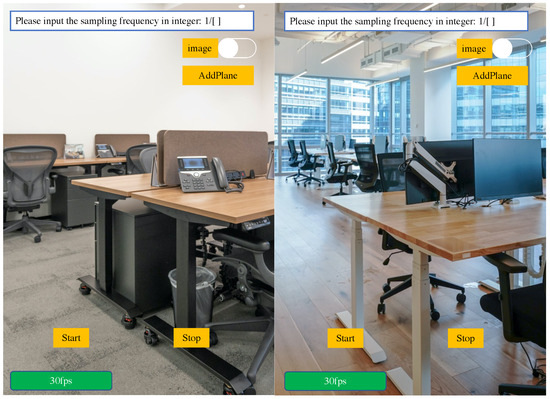
Figure 5.
The ARKit tool interface for evaluating localization performance.
4.4. Evaluation at Different Places
4.4.1. Evaluation Outdoors
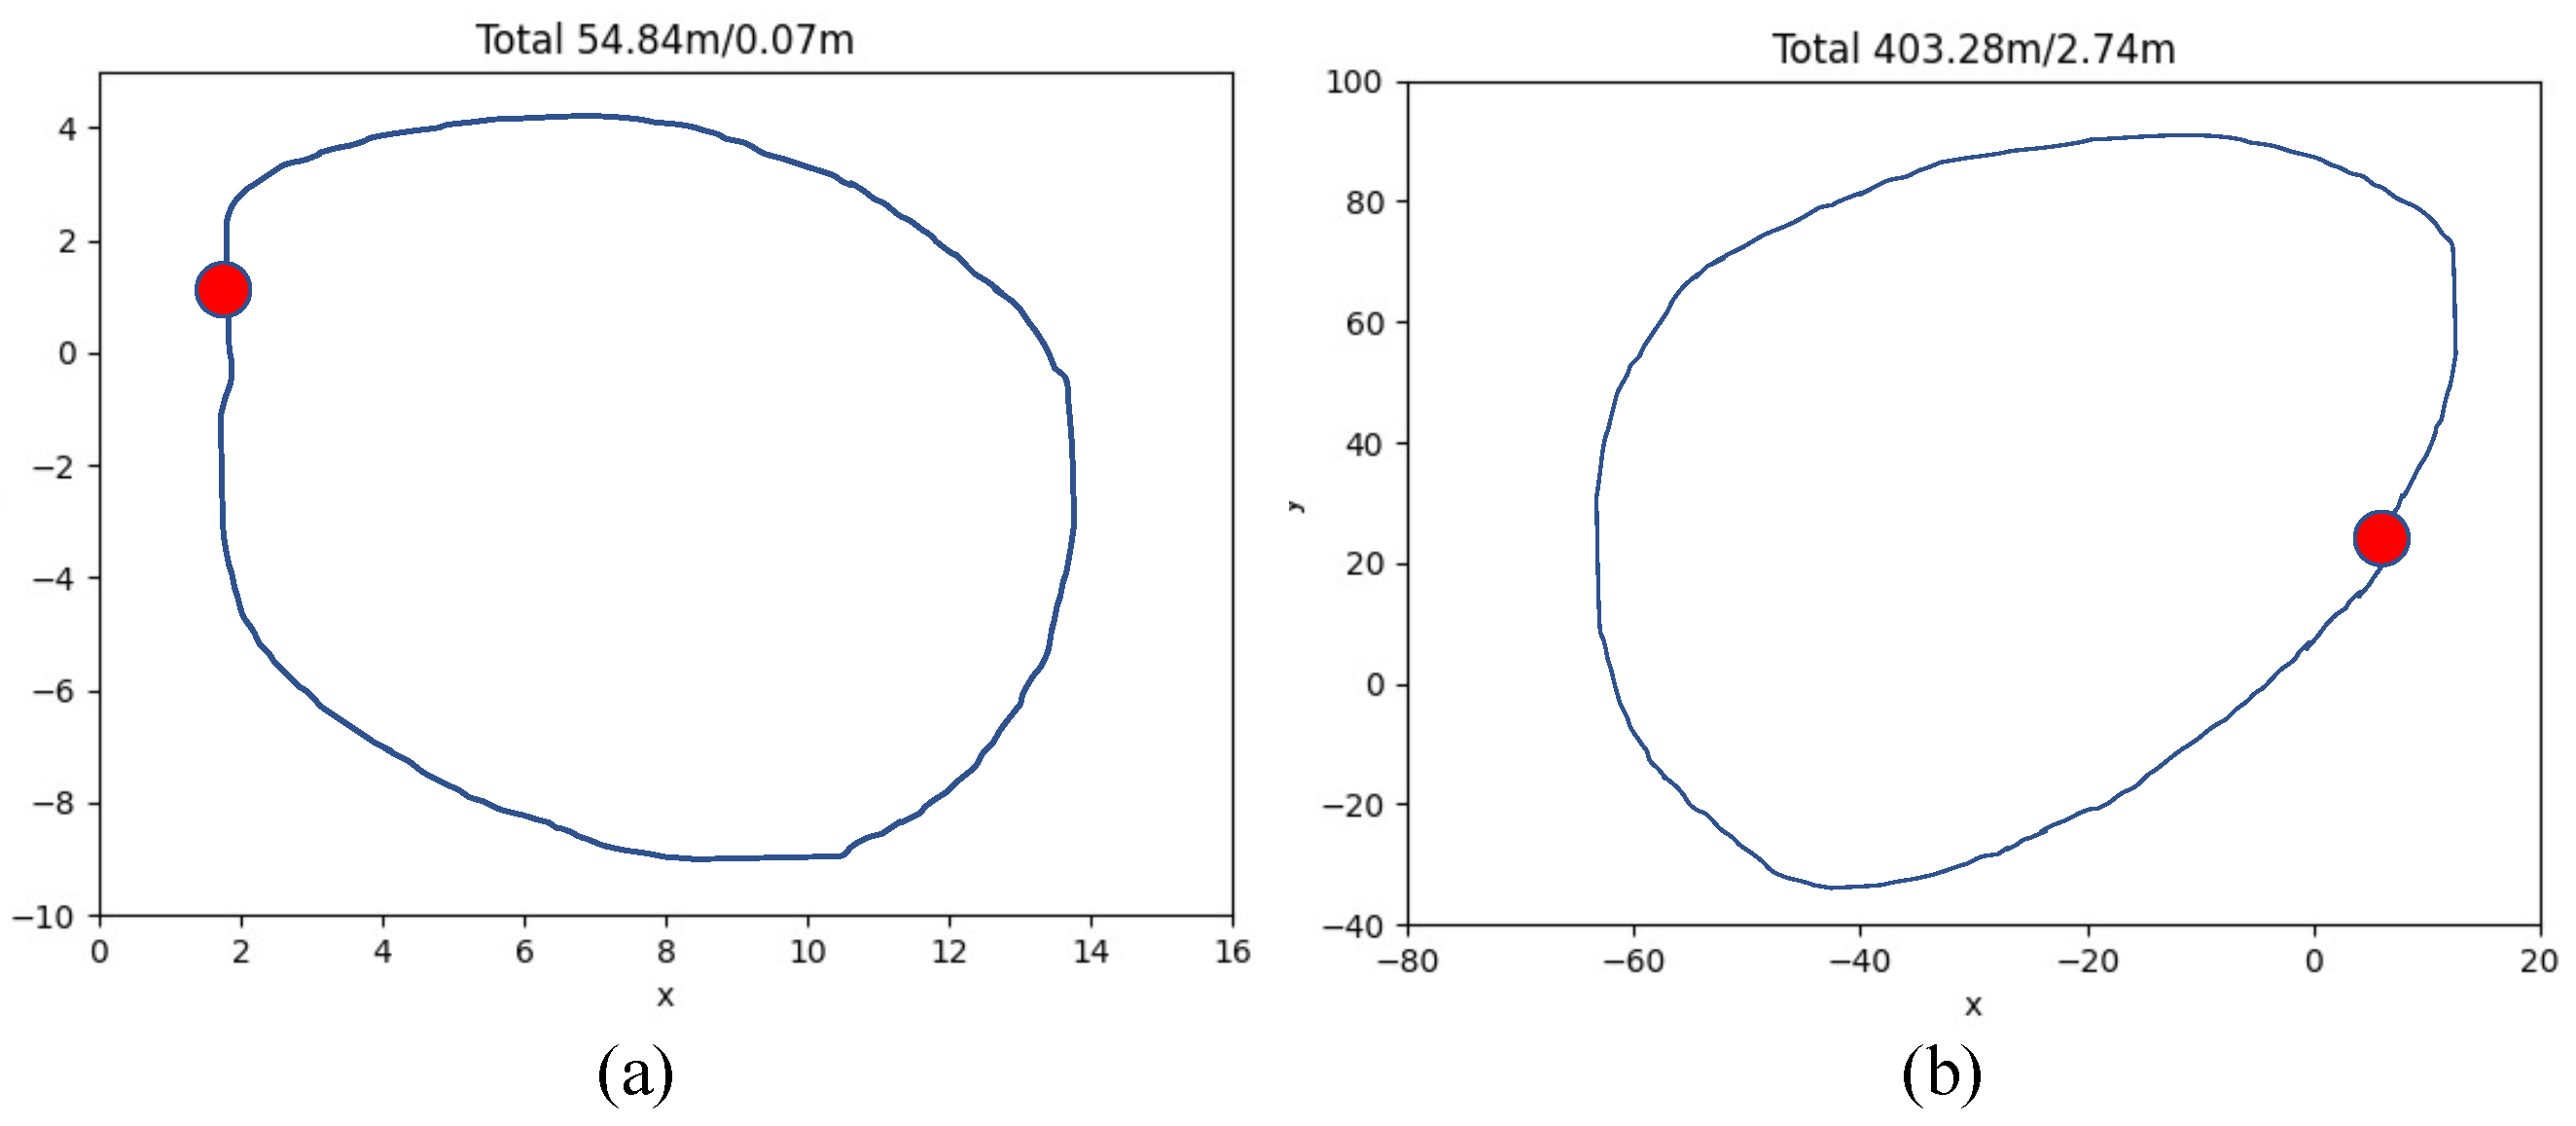
We test the performance of ARKit’s outdoor positioning and evaluate the positioning error by walking in a circle (the starting point and end point are the same). Figure 6 shows the walking trajectory. The first part is a small circle, the total trajectory is 54.84 m, and the error is 0.07 m. The second part is a large circle, with a total trajectory of 403.28 m and an error of 2.74 m.
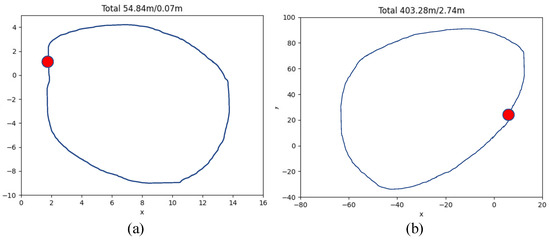
Figure 6.
Motion track and error. (a) is with the small circle, (b) is with the large circle.
4.4.2. Evaluation at the Airport
In Table 3 and Table 4, we compare the positioning performance of different models under different conditions. Across various test groups and environments, our method shows significant improvements. For instance, in Group 1, the iPhone 6sp recorded a positioning accuracy of 0.130, while the improved method using iPhone 7 achieved 0.011, a relative improvement of 91.5%. Similarly, under pedestrian disturbance, the accuracy improved from 0.204 to 0.014, showing a 93.1% reduction in error. This highlights the robustness of our system under occlusions and motion interference.
Table 3.
Comparison of the impact of different phone models on location results.
Table 4.
Evaluation of the impact of pedestrian disturbance on localization results.
In Table 5, we use iOS ARKit to collect images at different positions in the T3 terminal building and record the ARKit position of the image, measure the distance between the two collection points through the rangefinder as the true value, and compare it with the distance measured by ARKit to obtain the position difference between ARKit and the true value.
Table 5.
Comparison of positioning results for different testers and different phone models.
4.4.3. Evaluation on the Performance of Airport Corridor
Aiming at the low accuracy of distance estimation and height estimation, and the existence of cumulative errors, we use several sets of experiments to evaluate the performance of ARKit’s pose estimation for the airport corridor area. The machine models and device versions used in the experiment include iPhone 8P (iOS 12.2, ARKit 2.0), iPhone 8P (iOS 13.2, ARKit 3.0) and iPhone 11 (iOS 13.1, ARKit 3.0). The experimental settings are listed in Table 6.
Table 6.
Experimental settings.
- Estimated distance test for airport corridors: if the user uses ARKit while standing on a long-distance horizontal escalator (the escalator moves close to the horizontal at a uniform speed), ARKit’s estimated walking distance is significantly shorter compared with the distance of the route. Table 7 lists the estimated average distance of ARKit. The true value of the route distance is obtained by measurement, which is 127.0 m. There are eight sets of data for each type of scene, and the average value can be obtained: for the distance estimation of ARKit under normal walking conditions, the error is within the acceptable range, within 7 m; when taking the escalator, whether walking on the escalator or standing still, the distance estimation error is large; and, when taking the escalator, the guide arrow is clearly not set in the physical world. Also, as the mobile device is moving, the distance value displayed on the road sign will not change.
Table 7. Estimated distance test for airport corridors.
- Estimated height test for airport corridor: for a length with a long distance and a very gentle slope, for example, the length of the promenade is 127 m, and the height difference between the start and end points is 3.5 m (obtained by actual measurement), when using ARKit to estimate the walking distance, the estimated error of the height value is relatively large, with an average of about 1 m. In addition, in the actual measurement, it is found that, in areas with strong ground reflection, the height estimation error of ARKit is also large. (The proportion is small, but there is such a problem). Table 8 lists the estimated average height of ARKit. The height is 3.5 m obtained by measurement. There are eight sets of data for each type of scene, and the average value is taken. It can be concluded that ARKit’s estimation of the height of the promenade has a large error and the impact is greater when riding an escalator. When walking normally, the height of some cases is estimated to be around 3 m, but the average error is relatively large.
Table 8. Estimated height test for airport corridor.
4.5. Evaluation in Different Conditions
We tested the positioning error of ARKit between the corridor and different areas in the airport, and the Euclidean distance can be obtained by observing the deviation between the actual walking distance and the estimated distance. Table 9 lists specific values.
Table 9.
Evaluation of positioning errors in different areas of an airport.
Through the analysis of the above test results, the comparison is made in several dimensions such as human, machine, speed, posture, route, and time. The results are shown in Table 10.
Table 10.
Impact items on positioning results.
To further evaluate system robustness, we conducted extensive tests under diverse conditions including escalator motion, night-time environments, and user-induced disturbances such as side swaying or low-angle camera holding. The results show that, while legacy devices like iPhone 6sp are more prone to drift—especially under occlusion or visual interference—the improved system using newer models (e.g., iPhone 7/7P/11) consistently maintained a sub-2 m average error, even in crowded scenes. Additionally, across 32 test runs involving different users and walking patterns, the proposed correction mechanism maintained tracking stability with a failure rate of only 6%, indicating strong robustness against real-world variability.
With the correct posture maintained throughout the whole process, the average error per 100 m is 3.72 m. However, pedestrians in front of the camera have a great impact on the accuracy of ARKit. The 6sp can reach 34 m, and the tolerance of the new model is relatively high.
4.6. Accumulated Pose Error Estimated by ARKit
In scenes such as airports and train stations, the navigation distance is relatively long, and ARKit has the problem of cumulative error, which leads to inaccurate guidance routes. For example, due to the cumulative error, at the turn, the displayed position of the guidance route deviates, and what the user sees is the effect of the route passing through the wall.
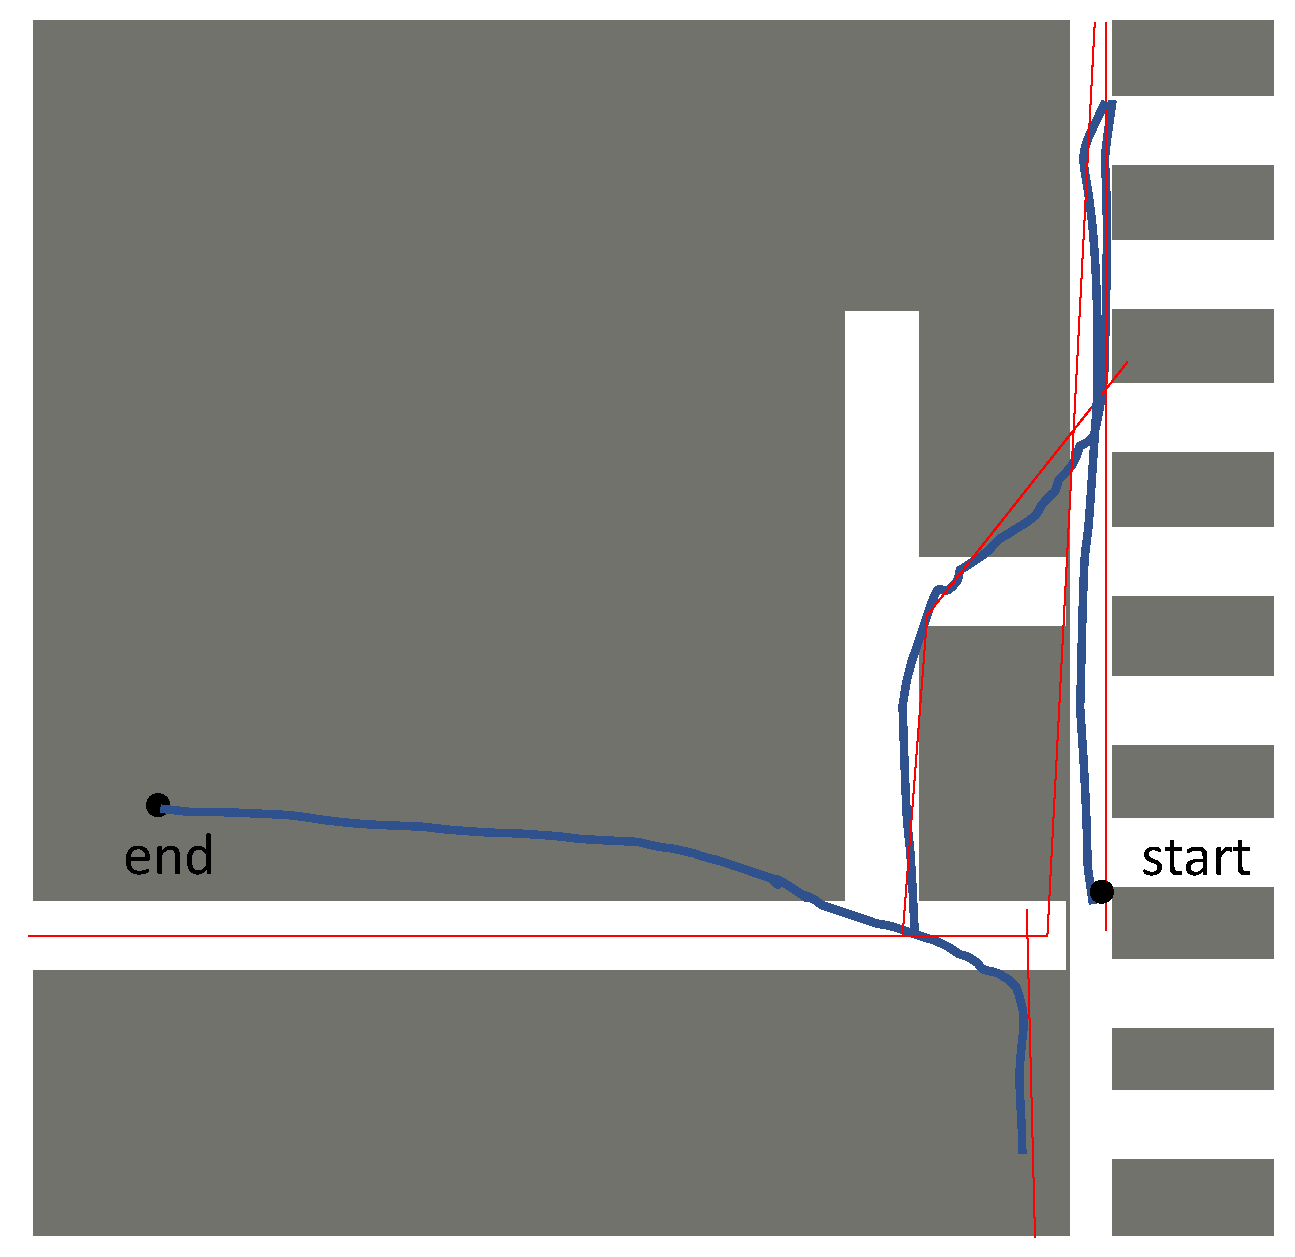
The detailed experimental data are shown in Figure 7. The two-dimensional plane is obtained by manual measurement and drawing. The grey area is the impassable area, the blue curve represents the estimated trajectory, and the red curve is the real walking trajectory. It can be seen from the figure that the error of ARKit’s walking trajectory gradually increases with the increase in the walking distance.
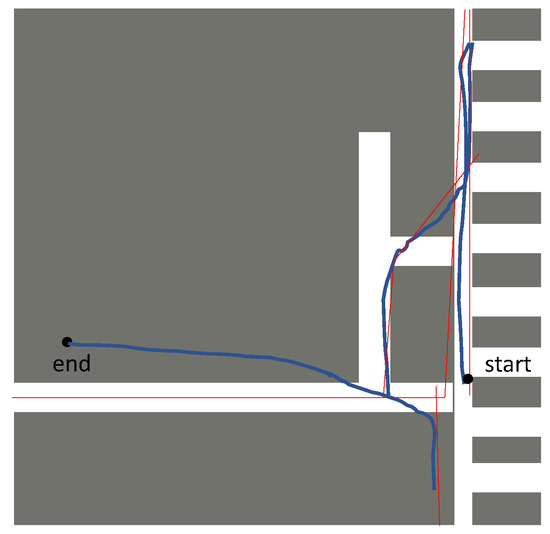
Figure 7.
Normal walking: the grey area is the impassable area, the blue curve represents the estimated trajectory, and the red curve is the real walking trajectory.
4.7. Pose Error Influenced by User Pose
During the navigation process, some users’ cameras are blocked by crowds and other moving objects, or users hold their mobile phones in a swinging posture on the side of their thighs. After a period of time, the pose estimated by ARKit will drift. In scenes such as airports and train stations, due to the dense crowd and users not holding up their phones for a long time, these problems are prone to occur.
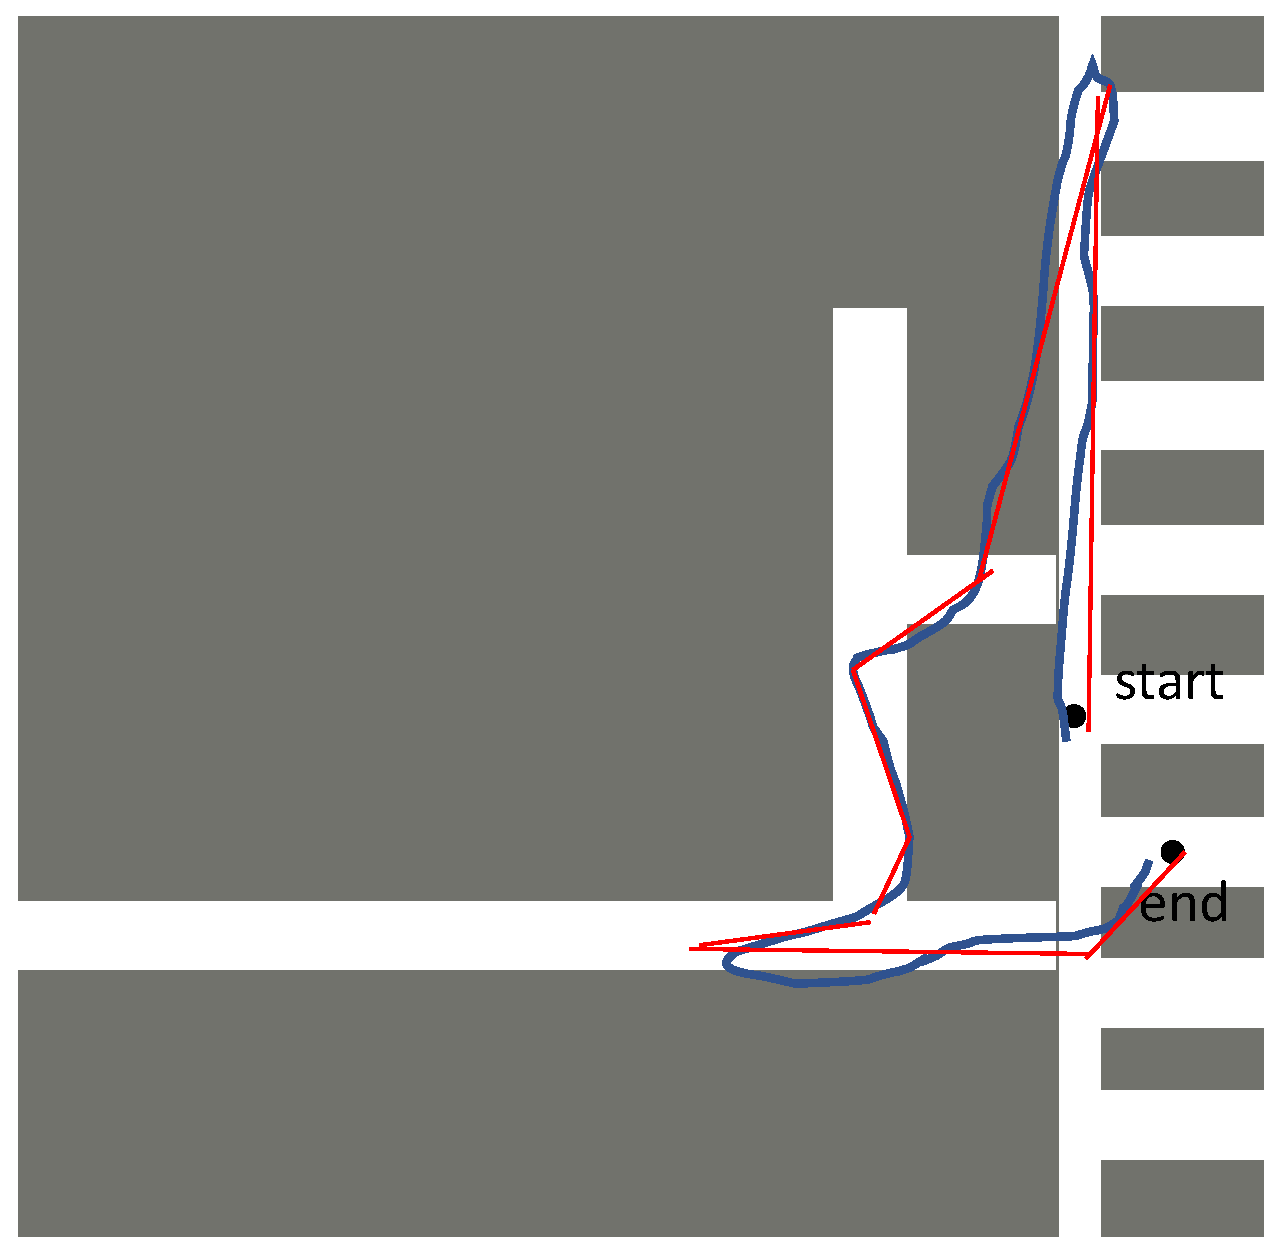
The detailed experimental data are shown below. The reference ground truth value is a two-dimensional plane map. It can be seen from Figure 8 that the trajectory of ARKit has a large drift.
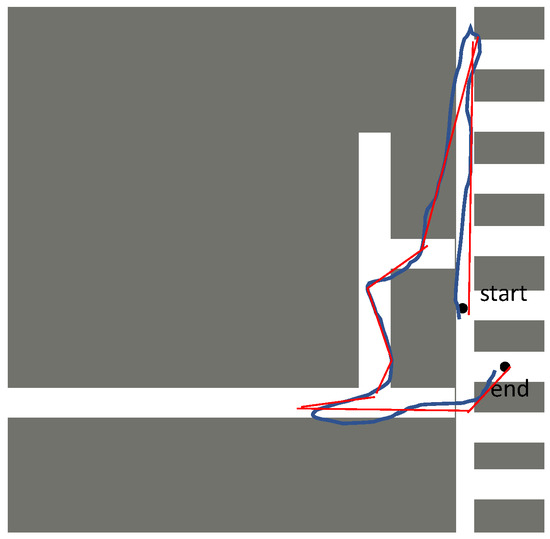
Figure 8.
Side swaying: the grey area is the impassable area, the blue curve represents the estimated trajectory, and the red curve represents the progress of the real walking trajectory.
5. Conclusions
In this paper, we proposed an innovative system for outdoor localization using ARKit, focusing on addressing the limitations of existing methods by incorporating position bias correction under occlusion, context-aware localization, and human–computer interaction techniques for an improved user experience. We also designed a comprehensive evaluation tool to measure the initialization speed, stability, robustness, and accuracy of ARKit, providing a detailed analysis of its performance in different environments and under various conditions.
Our experimental results demonstrate the effectiveness of the proposed system in improving localization and pose estimation accuracy, particularly in crowded and occluded environments. Moreover, the use of built-in IMU sensors in iOS devices and the incorporation of human–computer interaction techniques help to eliminate the need for additional hardware and pre-built maps, making our system more practical and user-friendly for real-world applications.
In future work, we aim to optimize the proposed algorithms for real-time performance on mobile devices by reducing computational latency and improving energy efficiency. Additionally, we will investigate cross-platform support to extend compatibility beyond iOS, enabling deployment on Android-based systems with similar sensor capabilities. Regarding specific application scenarios, our solution is well-suited for outdoor navigation in urban environments, where GPS signals may be unreliable due to occlusions caused by tall buildings. Moreover, it holds promise for augmented reality tourism applications, where enhanced positioning accuracy can enrich user experiences with context-aware information overlays. Another promising direction is the development of assistive technologies for visually impaired users, leveraging accurate and stable localization to provide real-time auditory or haptic guidance in complex environments. Finally, integrating semantic scene understanding and cloud-based collaboration could further enhance robustness and scalability, enabling seamless shared AR experiences across multiple users.
Author Contributions
Conceptualization, M.X. and S.P.; Methodology, M.X.; Software, M.X. and Q.S.; Validation, M.X., Q.S. and Z.H.; Formal Analysis, M.X.; Investigation, Q.S. and Z.H.; Resources, G.C.; Data Curation, Q.S. and Z.H.; Writing—Original Draft Preparation, M.X. and Q.S.; Writing—Review & Editing, M.X. and S.P.; Visualization, Q.S.; Supervision, S.P.; Project Administration, M.X.; Funding Acquisition, not applicable. All authors have read and agreed to the published version of the manuscript.
Funding
This research was funded by UIBE grant number 03350.
Data Availability Statement
The data presented in this study are available on request from the corresponding author due to the confidentiality requirements.
Conflicts of Interest
The authors declare no conflicts of interest.
References
- Sarlin, P.E.; DeTone, D.; Yang, T.Y.; Avetisyan, A.; Straub, J.; Malisiewicz, T.; Bulò, S.R.; Newcombe, R.; Kontschieder, P.; Balntas, V. OrienterNet: Visual Localization in 2D Public Maps with Neural Matching. In Proceedings of the IEEE/CVF Conference on Computer Vision and Pattern Recognition, Vancouver, BC, Canada, 17–24 June 2023; pp. 21632–21642. [Google Scholar]
- Brossard, M.; Bonnabel, S. Learning wheel odometry and IMU errors for localization. In Proceedings of the 2019 International Conference on Robotics and Automation (ICRA), Montreal, QC, Canada, 20–24 May 2019; pp. 291–297. [Google Scholar]
- Yi, J.; Zhang, J.; Song, D.; Jayasuriya, S. IMU-based localization and slip estimation for skid-steered mobile robots. In Proceedings of the 2007 IEEE/RSJ International Conference on Intelligent Robots and Systems, San Diego, CA, USA, 29 October–2 November 2007; pp. 2845–2850. [Google Scholar]
- Ahmetovic, D.; Sato, D.; Oh, U.; Ishihara, T.; Kitani, K.; Asakawa, C. Recog: Supporting blind people in recognizing personal objects. In Proceedings of the 2020 CHI Conference on Human Factors in Computing Systems, Honolulu, HI, USA, 25–30 April 2020; pp. 1–12. [Google Scholar]
- Kim, J.; Song, M.; Lee, Y.; Jung, M.; Kim, P. An Empirical Evaluation of Four Off-the-Shelf Proprietary Visual-Inertial Odometry Systems. arXiv 2022, arXiv:2207.06780. [Google Scholar]
- Ott, F.; Feigl, T.; Loffler, C.; Mutschler, C. ViPR: Visual-odometry-aided pose regression for 6DoF camera localization. In Proceedings of the IEEE/CVF Conference on Computer Vision and Pattern Recognition Workshops, Seattle, WA, USA, 14–19 June 2020; pp. 42–43. [Google Scholar]
- Fahima, B.; Abdelkrim, N. Multispectral visual odometry using svsf for mobile robot localization. Unmanned Syst. 2022, 10, 273–288. [Google Scholar] [CrossRef]
- Yan, Y.; Zhang, B.; Zhou, J.; Zhang, Y.; Liu, X. Real-Time Localization and Mapping Utilizing Multi-Sensor Fusion and Visual–IMU–Wheel Odometry for Agricultural Robots in Unstructured, Dynamic and GPS-Denied Greenhouse Environments. Agronomy 2022, 12, 1740. [Google Scholar] [CrossRef]
- Qin, X.; Wang, B.; Boegner, D.; Gaitan, B.; Zheng, Y.; Du, X.; Chen, Y. Indoor localization of hand-held OCT probe using visual odometry and real-time segmentation using deep learning. IEEE Trans. Biomed. Eng. 2021, 69, 1378–1385. [Google Scholar] [CrossRef] [PubMed]
- Hwang, S.; Yu, D. GPS Localization Improvement of Smartphones Using Built-in Sensors. Int. J. Smart Home 2012, 6, 1–8. [Google Scholar]
- Holmes, C.; Barfoot, T.D. An efficient global optimality certificate for landmark-based SLAM. IEEE Robot. Autom. Lett. 2023, 8, 1539–1546. [Google Scholar] [CrossRef]
- Wang, Y.; Xu, B.; Fan, W.; Xiang, C. QISO-SLAM: Object-Oriented SLAM Using Dual Quadrics as Landmarks Based on Instance Segmentation. IEEE Robot. Autom. Lett. 2023, 8, 2253–2260. [Google Scholar] [CrossRef]
- Feigl, T.; Porada, A.; Steiner, S.; Löffler, C.; Mutschler, C.; Philippsen, M. Localization Limitations of ARCore, ARKit, and Hololens in Dynamic Large-scale Industry Environments. In Proceedings of the VISIGRAPP (1: GRAPP), Valletta, Malta, 27–29 February 2020; pp. 307–318. [Google Scholar]
- Kaarre, C. Simultaneous Localization and Mapping with Apple ARKit. Bachelor’s Thesis, Tampere University, Tampere, Finland, 2021. [Google Scholar]
- Chen, L.; Zou, Y.; Chang, Y.; Liu, J.; Lin, B.; Zhu, Z. Multi-level scene modeling and matching for smartphone-based indoor localization. In Proceedings of the 2019 IEEE International Symposium on Mixed and Augmented Reality Adjunct (ISMAR-Adjunct), Beijing, China, 10–18 October 2019; pp. 311–316. [Google Scholar]
- Larsson, N.; Runesson, H. A Study on the Use of ARKit Toextract and Geo-Reference Oorplans. Ph.D. Thesis, Linköpings Universitet, Linköping, Sweden, 2021. [Google Scholar]
- Fusco, G.; Coughlan, J.M. Indoor localization for visually impaired travelers using computer vision on a smartphone. In Proceedings of the 17th International Web for All Conference, Taiwan, China, 20–21 April 2020; pp. 1–11. [Google Scholar]
- Laska, M.; Schulz, T.; Grottke, J.; Blut, C.; Blankenbach, J. VI-SLAM2tag: Low-Effort Labeled Dataset Collection for Fingerprinting-Based Indoor Localization. In Proceedings of the 2022 IEEE 12th International Conference on Indoor Positioning and Indoor Navigation (IPIN), Beijing, China, 5–8 September 2022; pp. 1–8. [Google Scholar]
- Bajpai, A.; Amir-Mohammadian, S. Towards An Indoor Navigation System Using Monocular Visual SLAM. In Proceedings of the 2021 IEEE 45th Annual Computers, Software, and Applications Conference (COMPSAC), Madrid, Spain, 12–16 July 2021; pp. 520–525. [Google Scholar]
- Joshi, R.; Hiwale, A.; Birajdar, S.; Gound, R. Indoor navigation with augmented reality. In Proceedings of the ICCCE 2019: Proceedings of the 2nd International Conference on Communications and Cyber Physical Engineering, Pune, India, 22–24 July 2019; Springer: Berlin/Heidelberg, Germany, 2020; pp. 159–165. [Google Scholar]
- Oufqir, Z.; El Abderrahmani, A.; Satori, K. ARKit and ARCore in serve to augmented reality. In Proceedings of the 2020 International Conference on Intelligent Systems and Computer Vision (ISCV), Fez, Morocco, 9–11 June 2020; pp. 1–7. [Google Scholar]
- Le, H.; Nguyen, M.; Yan, W.Q.; Nguyen, H. Augmented reality and machine learning incorporation using YOLOv3 and ARKit. Appl. Sci. 2021, 11, 6006. [Google Scholar] [CrossRef]
- Choi, J.M.; Kim, K.; Kim, S.C. Outdoor Localization Based on RSS Ranging Aided by Pedestrian Dead Reckoning in GPS Restricted Scenario. In Proceedings of the 2022 IEEE VTS Asia Pacific Wireless Communications Symposium (APWCS), Seoul, Republic of Korea, 24–26 August 2022; pp. 186–190. [Google Scholar]
- Haris, M.; Franzius, M.; Bauer-Wersing, U. Learning Visual Landmarks for Localization with Minimal Supervision. In Proceedings of the International Conference on Image Analysis and Processing, Udine, Italy, 23–27 May 2022; Springer: Berlin/Heidelberg, Germany, 2022; pp. 773–786. [Google Scholar]
- Li, Q.; Wang, X.; Wu, T.; Yang, H. Point-line feature fusion based field real-time RGB-D SLAM. Comput. Graph. 2022, 107, 10–19. [Google Scholar]
- Egodagamage, R.; Tuceryan, M. Distributed monocular visual SLAM as a basis for a collaborative augmented reality framework. Comput. Graph. 2018, 71, 113–123. [Google Scholar] [CrossRef]
- Polvi, J.; Taketomi, T.; Yamamoto, G.; Dey, A.; Sandor, C.; Kato, H. SlidAR: A 3D positioning method for SLAM-based handheld augmented reality. Comput. Graph. 2016, 55, 33–43. [Google Scholar] [CrossRef]
- Zhang, Z.; Xu, M.; Zhou, W.; Peng, T.; Li, L.; Poslad, S. BEV-Locator: An End-to-end Visual Semantic Localization Network Using Multi-View Images. arXiv 2022, arXiv:2211.14927. [Google Scholar] [CrossRef]
- Gassol Puigjaner, A.; Aloise, I.; Schmuck, P. Augmented Reality without Borders: Achieving Precise Localization without Maps. arXiv 2024, arXiv:2408.17373. [Google Scholar]
- Ingolea, S.; Narsale, S.; Desale, D.; Rade, S.; Adhav, S. Hybrid maker-based indoor positioning system using augmented reality. In Technological Innovations & Applications in Industry 4.0; CRC Press: Boca Raton, FL, USA, 2025; pp. 227–238. [Google Scholar]
- Chen, L.; Hu, H. IMU/GPS based pedestrian localization. In Proceedings of the 2012 4th Computer Science and Electronic Engineering Conference (CEEC), Colchester, UK, 12–13 September 2012; pp. 23–28. [Google Scholar]
- Cai, G.S.; Lin, H.Y.; Kao, S.F. Mobile robot localization using gps, imu and visual odometry. In Proceedings of the 2019 International Automatic Control Conference (CACS), Keelung, Taiwan, 13–16 November 2019; pp. 1–6. [Google Scholar]
- Charroud, A.; El Moutaouakil, K.; Yahyaouy, A.; Onyekpe, U.; Palade, V.; Huda, M.N. Rapid localization and mapping method based on adaptive particle filters. Sensors 2022, 22, 9439. [Google Scholar] [CrossRef] [PubMed]
- Li, Y.; Zhang, X.; Chen, D. Csrnet: Dilated convolutional neural networks for understanding the highly congested scenes. In Proceedings of the IEEE Conference on Computer Vision and Pattern Recognition, Salt Lake City, UT, USA, 18–23 June 2018; pp. 1091–1100. [Google Scholar]
- Rublee, E.; Rabaud, V.; Konolige, K.; Bradski, G. ORB: An efficient alternative to SIFT or SURF. In Proceedings of the 2011 International Conference on Computer Vision, Barcelona, Spain, 6–13 November 2011; pp. 2564–2571. [Google Scholar]
- Cantzler, H. Random sample consensus (ransac). Inst. Percept. Action Behav. Div. Inform. Univ. Edinb. 1981, 3, 1–4. [Google Scholar]
- Chen, L.C.; Zhu, Y.; Papandreou, G.; Schroff, F.; Adam, H. Encoder-decoder with atrous separable convolution for semantic image segmentation. In Proceedings of the European Conference on Computer Vision (ECCV), Munich, Germany, 8–14 September 2018; pp. 801–818. [Google Scholar]


Disclaimer/Publisher’s Note: The statements, opinions and data contained in all publications are solely those of the individual author(s) and contributor(s) and not of MDPI and/or the editor(s). MDPI and/or the editor(s) disclaim responsibility for any injury to people or property resulting from any ideas, methods, instructions or products referred to in the content. |
© 2025 by the authors. Licensee MDPI, Basel, Switzerland. This article is an open access article distributed under the terms and conditions of the Creative Commons Attribution (CC BY) license (https://creativecommons.org/licenses/by/4.0/).