Article

The Effect of Emotional Intelligence on the Accuracy of Facial Expression Recognition in the Valence–Arousal Space

1
Department of Emotion Engineering, Sangmyung University, Seoul 03016, Republic of Korea
2
Department of Human-Centered Artificial Intelligence, Sangmyung University, Seoul 03016, Republic of Korea
*
Author to whom correspondence should be addressed.
Electronics 2025, 14(8), 1525; https://doi.org/10.3390/electronics14081525
Submission received: 14 March 2025 / Revised: 7 April 2025 / Accepted: 8 April 2025 / Published: 9 April 2025
(This article belongs to the Special Issue AI for Human Collaboration)

Abstract

:
Facial expression recognition (FER) plays a pivotal role in affective computing and human–computer interaction by enabling machines to interpret human emotions. However, conventional FER models often overlook individual differences in emotional intelligence (EI), which may significantly influence how emotions are perceived and expressed. This study investigates the effect of EI on facial expression recognition accuracy within the valence–arousal space. Participants were divided into high and low EI groups based on a composite score derived from the Tromsø Social Intelligence Scale and performance-based emotion tasks. Five deep learning models (EfficientNetV2-L/S, MaxViT-B/T, and VGG16) were trained on the AffectNet dataset and evaluated using facial expression data collected from participants. Emotional states were predicted as continuous valence and arousal values, which were then mapped onto discrete emotion categories for interpretability. The results indicated that individuals with higher EI achieved significantly greater recognition accuracy, particularly for emotions requiring contextual understanding (e.g., anger, sadness, and happiness), while fear was better recognized by individuals with lower EI. These findings highlight the role of emotional intelligence in modulating FER performance and suggest that integrating EI-related features into valence–arousal-based models could enhance the adaptiveness of affective computing systems.

1. Introduction

Facial expression recognition (FER) refers to the computational process of automatically identifying human emotions through facial expressions captured from static images or dynamic video sequences. Facial expressions represent one of the most immediate and universally recognized modes of emotional communication. Consequently, FER has become a core component in applications including human–computer interaction (HCI), affective computing, healthcare, and education [1,2].
Recent advances in computer vision and deep learning have significantly enhanced FER performance by enabling models to learn expressive features directly from raw data, surpassing traditional handcrafted approaches [2]. However, most FER systems continue to rely on categorical models that classify expressions into discrete labels such as happiness, anger, or sadness [3,4]. While effective in controlled settings, these models struggle to represent the continuous, dynamic, and subjective nature of human emotions [5,6].
Emotion perception is inherently subjective and varies across individuals due to differences in cultural norms, emotion regulation tendencies, and personal appraisals [7,8,9]. In addition to these psychological mechanisms, Cabanac [10] proposes a hedonic-centered theory of emotion, defining emotions as mental experiences with high intensity and either a pleasant or unpleasant hedonic tone. From this perspective, emotion serves as a shared evaluative mechanism to compare motivations and guide behavior. This definition aligns with the dimensional view of affect and underscores the need for FER systems to move beyond fixed categories and instead adopt dimensional models that reflect emotional nuance.
In this context, researchers have increasingly turned to dimensional emotion models, particularly Russell’s circumplex model of affect [11], which represents emotions along two continuous dimensions: valence (degree of pleasure) and arousal (level of activation). Valence represents the degree of pleasure or displeasure, while arousal reflects the level of activation or energy. These models describe emotions along continuous dimensions, offering a more flexible and detailed approach. For example, Le et al. [12] proposed a model using Label Distribution Learning (LDL) that maps facial expressions onto the valence–arousal space, representing emotional states as probabilistic distributions over the valence–arousal space. Hwooi et al. [13] employed regression models to predict continuous valence–arousal values from facial expressions. Dimensional models allow for more nuanced emotional representation compared to rigid categorical labels and regression-based FER models allow for finer predictions of emotional states and better capture the subjectivity inherent in emotion perception [14].
In addition to dimensionality, individual differences must be considered for more ecologically valid FER systems. A key trait in this regard is emotional intelligence (EI)—commonly defined as the ability to perceive, understand, regulate, and effectively utilize emotions [15]. EI is closely linked to social intelligence (SI)—the capacity to understand and navigate inter-personal relationships effectively [16]. Emotional perception is inherently social because emotions are shaped and regulated within interpersonal contexts, influenced by cultural norms, social roles, and group identities [17,18]. For example, individuals tend to recognize emotions more accurately within their own cultural or in-group contexts [19,20], and higher EI individuals tend to recognize emotions more accurately, even in ambiguous contexts such as masked faces [21]. Salovey and Mayer [22] conceptualize EI as a subset of social intelligence, emphasizing the role of emotional awareness and regulation in guiding thought and behavior. According to Bar-On and Goleman, EI encompasses a range of non-cognitive capabilities, including emotion perception, stress regulation, and interpersonal adaptability, which are not only innate but also trainable [23].
Neuroscientific and psychological studies suggest that individuals with higher EI demonstrate enhanced emotion recognition performance. This is supported by stronger neural integration across socioemotional brain networks, including the amygdala, insula, and prefrontal cortex [24,25,26]. The vmPFC supports the somatic marker hypothesis, the anterior insula contributes to interoceptive and social emotion processing, and the amygdala is essential for recognizing subtle facial cues [27,28,29]. Recent findings further highlight the dynamic interactions among the vmPFC, ACC, and insular cortex in regulating emotion and social perception. Collectively, these regions support interoceptive awareness, social decision-making, and emotional regulation [30].
Despite the growing evidence of EI’s importance, few FER studies have empirically examined how EI modulates emotion recognition performance. Instead, most research focuses on improving FER through model architecture or dataset expansion, often overlooking how personal traits shape emotional perception [12]. This gap highlights the need for FER frameworks that account for individual differences, particularly through EI.
To address this, the present study investigates the relationship between emotional intelligence and facial expression recognition accuracy using a regression-based, dimensional FER framework grounded in Russell’s model. Participants were grouped into high-EI and low-EI cohorts based on their scores from the Tromsø Social Intelligence Scale (TSIS) [31] and a task of emotion recognition and expression. Although the TSIS was originally developed to assess social intelligence, specific questions may be used as a proxy for EI due to its conceptual overlap [32]. These questions measure individuals’ ability to identify and interpret emotional expressions in others, a core component of EI. This ability corresponds closely to the “Perceiving Emotions” component in Mayer and Salovey’s four-branch model and is conceptually related to the empathy and social awareness competencies described in Goleman’s emotional intelligence framework [23]. Crowne [32] emphasized the considerable conceptual overlap between SI and EI in terms of interpersonal sensitivity, decoding of nonverbal emotional cues, and emotional regulation.
To ensure consistency and generalizability in evaluating the effect of emotional intelligence, five widely used FER models—EfficientNetV2-L, EfficientNetV2-S [33], MaxViT-B, MaxViT-T [34], and VGG16 [35]—were trained under identical conditions using the AffectNet dataset [36]. Each model was tested on facial expression data from both low and high EI groups. A regression approach was adopted to estimate valence–arousal values and detect subtle differences in recognition performance between groups.
This study aims to provide empirical insight into how individual emotional traits, particularly EI, influence facial expression recognition. By incorporating personal variation into FER analysis, the research contributes to the development of more adaptive, context-aware affective computing systems.

2. Related Works

2.1. Categorical Emotion Recognition Models

A commonly adopted approach in facial expression recognition (FER) involves the use of categorical models that classify expressions into discrete emotional labels such as happiness, anger, and sadness. Distract your Attention Network (DAN) [3] enhances classification performance by employing spatial and semantic attention mechanisms to selectively focus on relevant facial regions. POSTER++ [4] integrates facial landmark information and temporal attention through a transformer-based architecture, achieving improved classification in dynamic contexts. PACVT [37] incorporates contextual visual features by using a vision transformer that jointly encodes facial expressions and scene context to disambiguate emotional meaning.
While these models achieve high classification accuracy, they are limited by their reliance on fixed emotional categories and struggle to account for the nuanced, continuous, and subjective nature of affect.

2.2. Dimensional Emotion Recognition Models

Recent research in facial expression recognition (FER) has shifted from traditional categorical approaches to dimensional emotion modeling, particularly using the valence–arousal framework. This shift allows for more nuanced and continuous representations of affective states. Several recent studies have proposed deep learning-based approaches aligned with this framework.
Le et al. proposed Label Distribution Learning for Valence–Arousal (LDL-VA) which represents emotional states as label distributions in the valence–arousal space rather than point estimates [12]. Their approach captures the inherent ambiguity and inter-rater variability in emotion annotation and showed robust performance on the AffectNet dataset, achieving higher CCC scores than baseline regression models.
FATAUVA-Net, introduced by Chang et al., employed a multi-task learning approach that combines facial action unit (AU) detection with valence–arousal prediction [38]. By integrating facial muscle activity, the model leverages both local facial features and global emotional context, enhancing prediction accuracy. This approach acknowledges that facial expressions are composed of fine-grained muscle movements and reflects that structure in its architecture.
Hwooi et al. proposed a regression-based approach that estimates valence and arousal by training individual models per discrete emotion class [13]. Their model combines CNN-based feature extraction (e.g., InceptionResNetV2, DenseNet201) with regression networks and maps discrete emotion labels to the continuous emotional space. Notably, it outperformed existing methods on AffectNet and showed strong generalization on the Aff-Wild2 dataset, particularly for valence prediction.
Finally, Circumplex Affect Guided Expression Inference (CAGE) offers an advanced framework for dimensional FER by embedding expressions directly into the valence–arousal space [39]. It integrates contextual embeddings and adversarial training to align the predicted affective space with Russell’s circumplex model. In comparative evaluations, CAGE achieved state-of-the-art performance on AffectNet’s continuous label subset, making it a strong baseline in dimensional affect inference.
Collectively, these models enhance dimensional emotion recognition by incorporating facial structure, temporal dynamics, and distributional learning. However, they generally overlook individual affective traits such as emotional intelligence (EI), which are known to modulate emotion perception. This study addresses this gap by applying a regression-based dimensional model to examine the influence of EI on recognition performance.

2.3. Multimodal Emotion Recognition Approaches

FER systems have also been extended to include multimodal input sources such as physiological signals and contextual information. Soleymani et al. [40] incorporate EEG, eye gaze, and pupillary responses to improve affect prediction during video watching, highlighting the value of combining neural and behavioral signals to account for emotion’s subjective nature. The ABAW Challenge [41] establishes a comprehensive benchmark that combines valence–arousal estimation, expression recognition, and action unit detection in a multi-task framework. These efforts emphasize the importance of analyzing emotions across multiple affective dimensions and modalities. One study [42] further integrates facial expression features with physiological signals—namely video-derived iPPG and heart rate variability (HRV)—using a 3D-SE-Xception network and MTTS-CAN.
While this approach achieved improved recognition performance compared to unimodal models, it suffered from synchronization challenges across modalities and performance degradation when multiple signals were combined.
While recent FER studies have advanced emotion recognition through dimensional modeling and multimodal integration, they largely overlook individual differences such as emotional intelligence (EI). Given EI’s documented role in emotion perception, its absence limits the adaptability of current models. This study addresses that gap by examining how EI influences dimensional FER accuracy, aiming to inform the development of more personalized and context-aware affective systems.

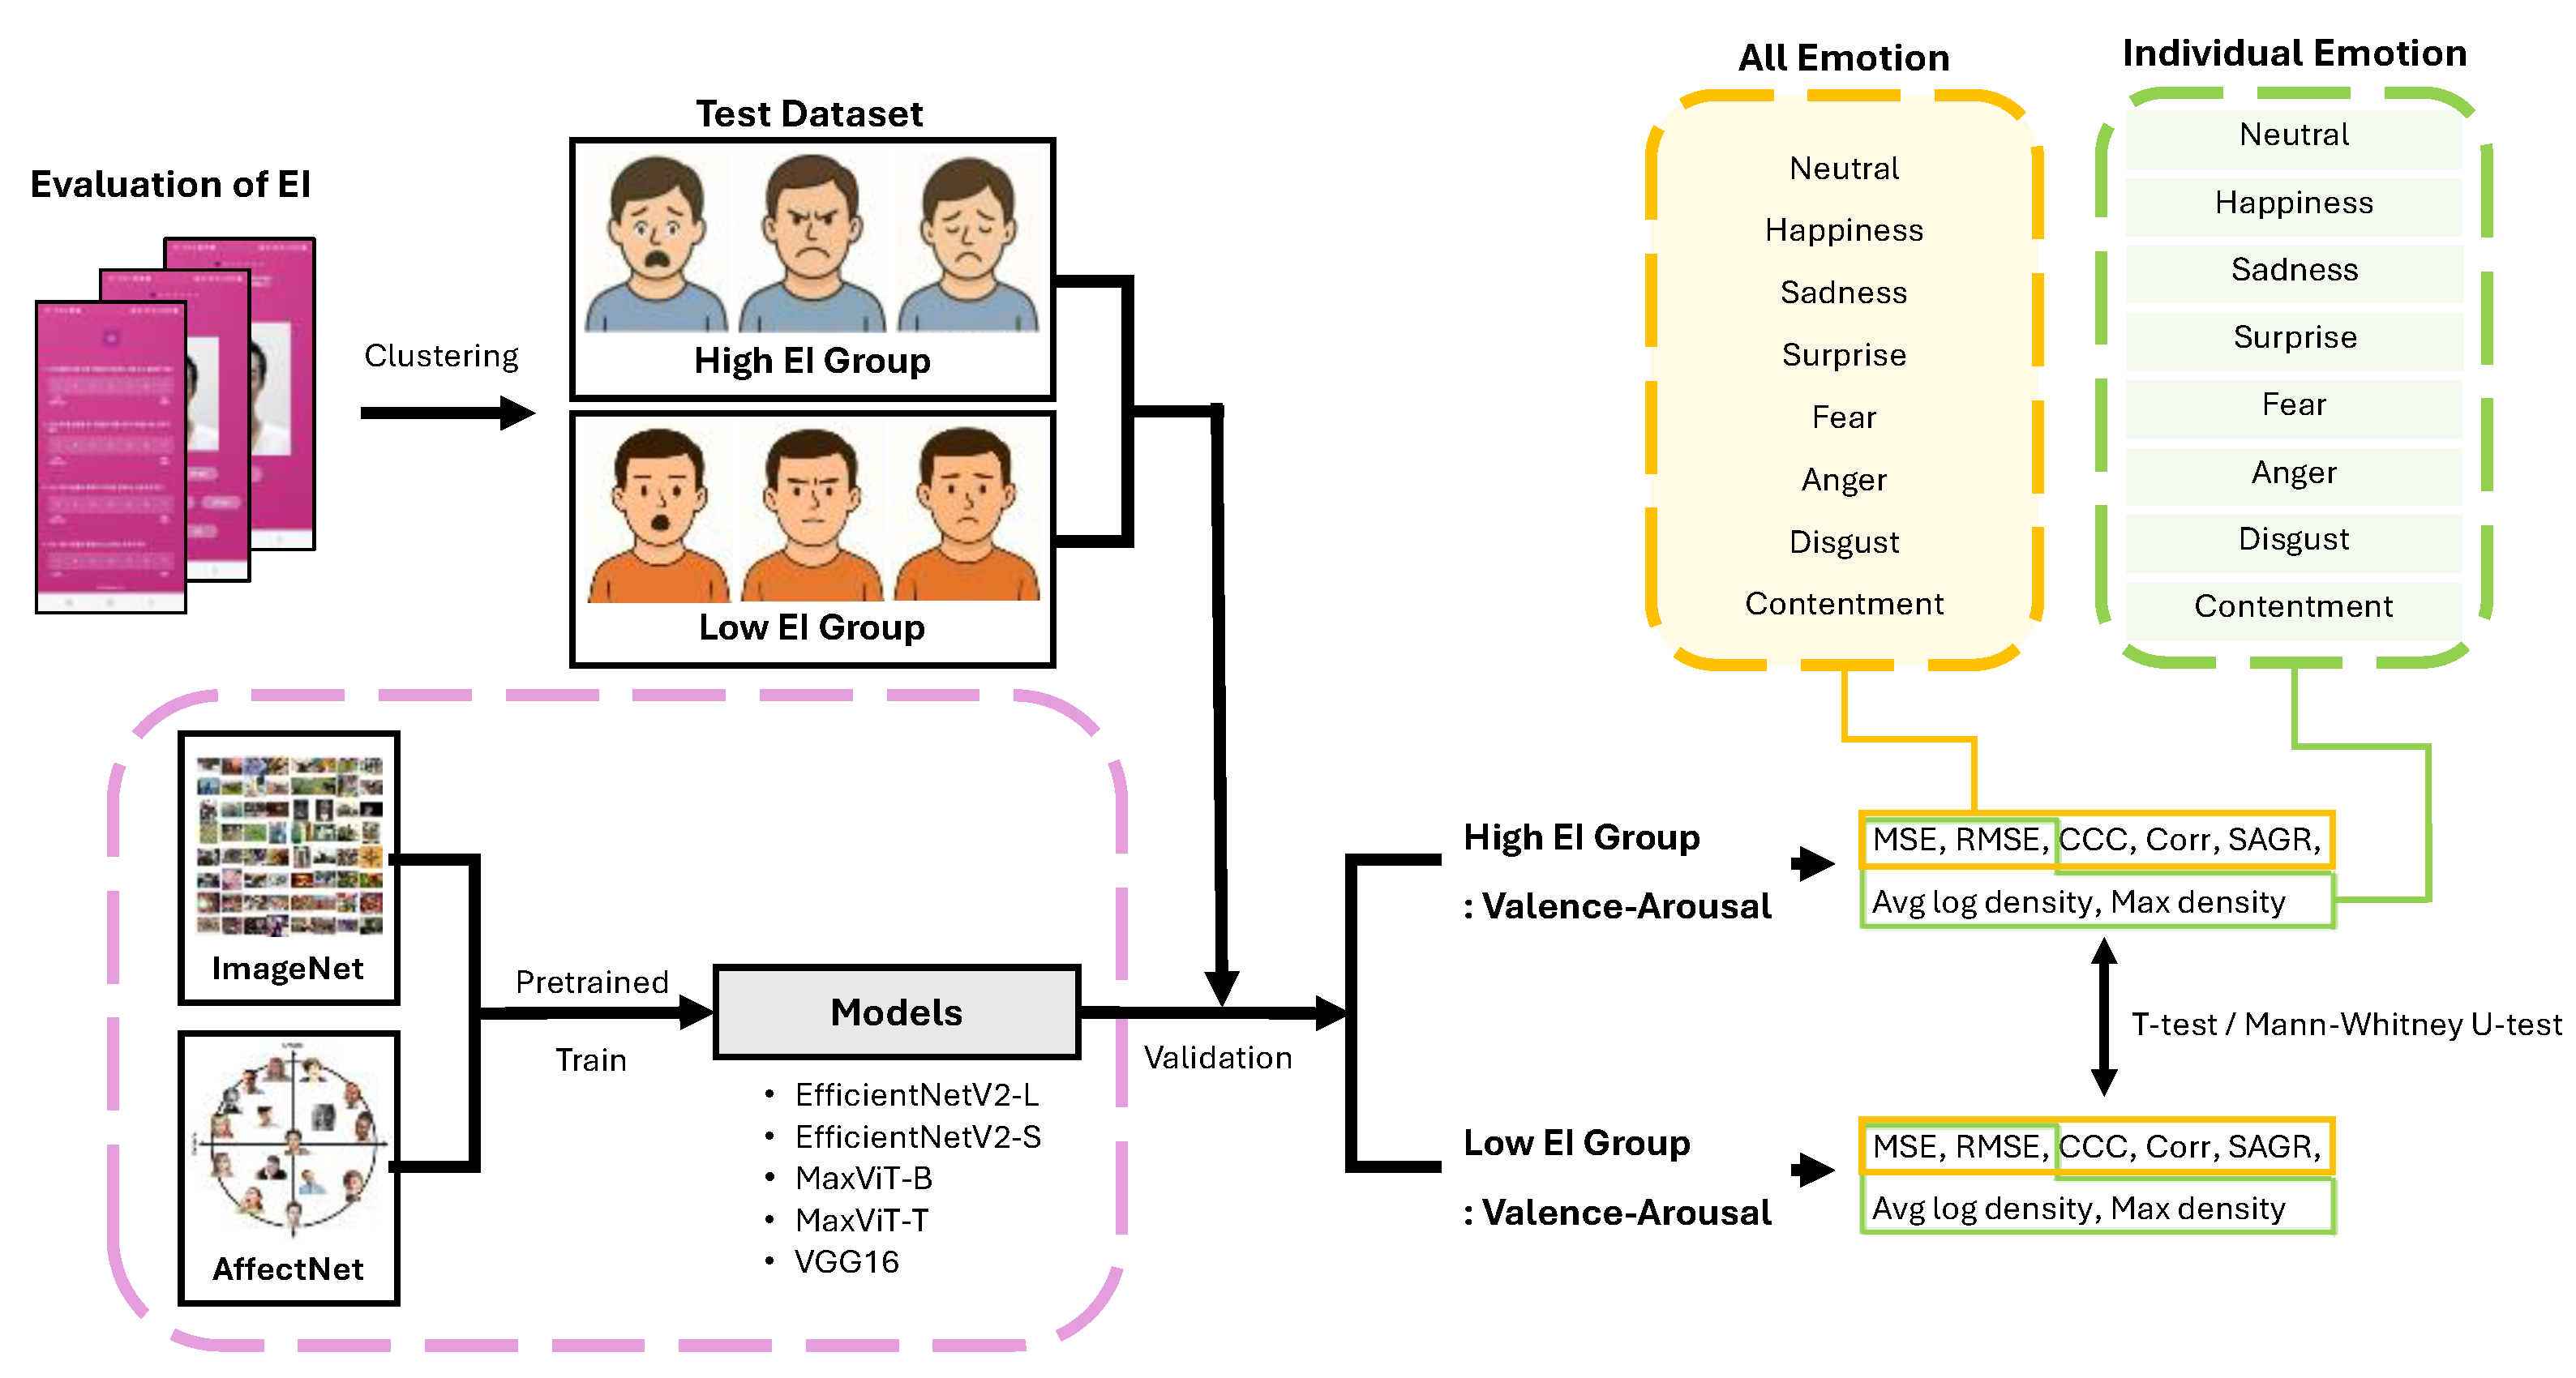
3. Materials and Methods
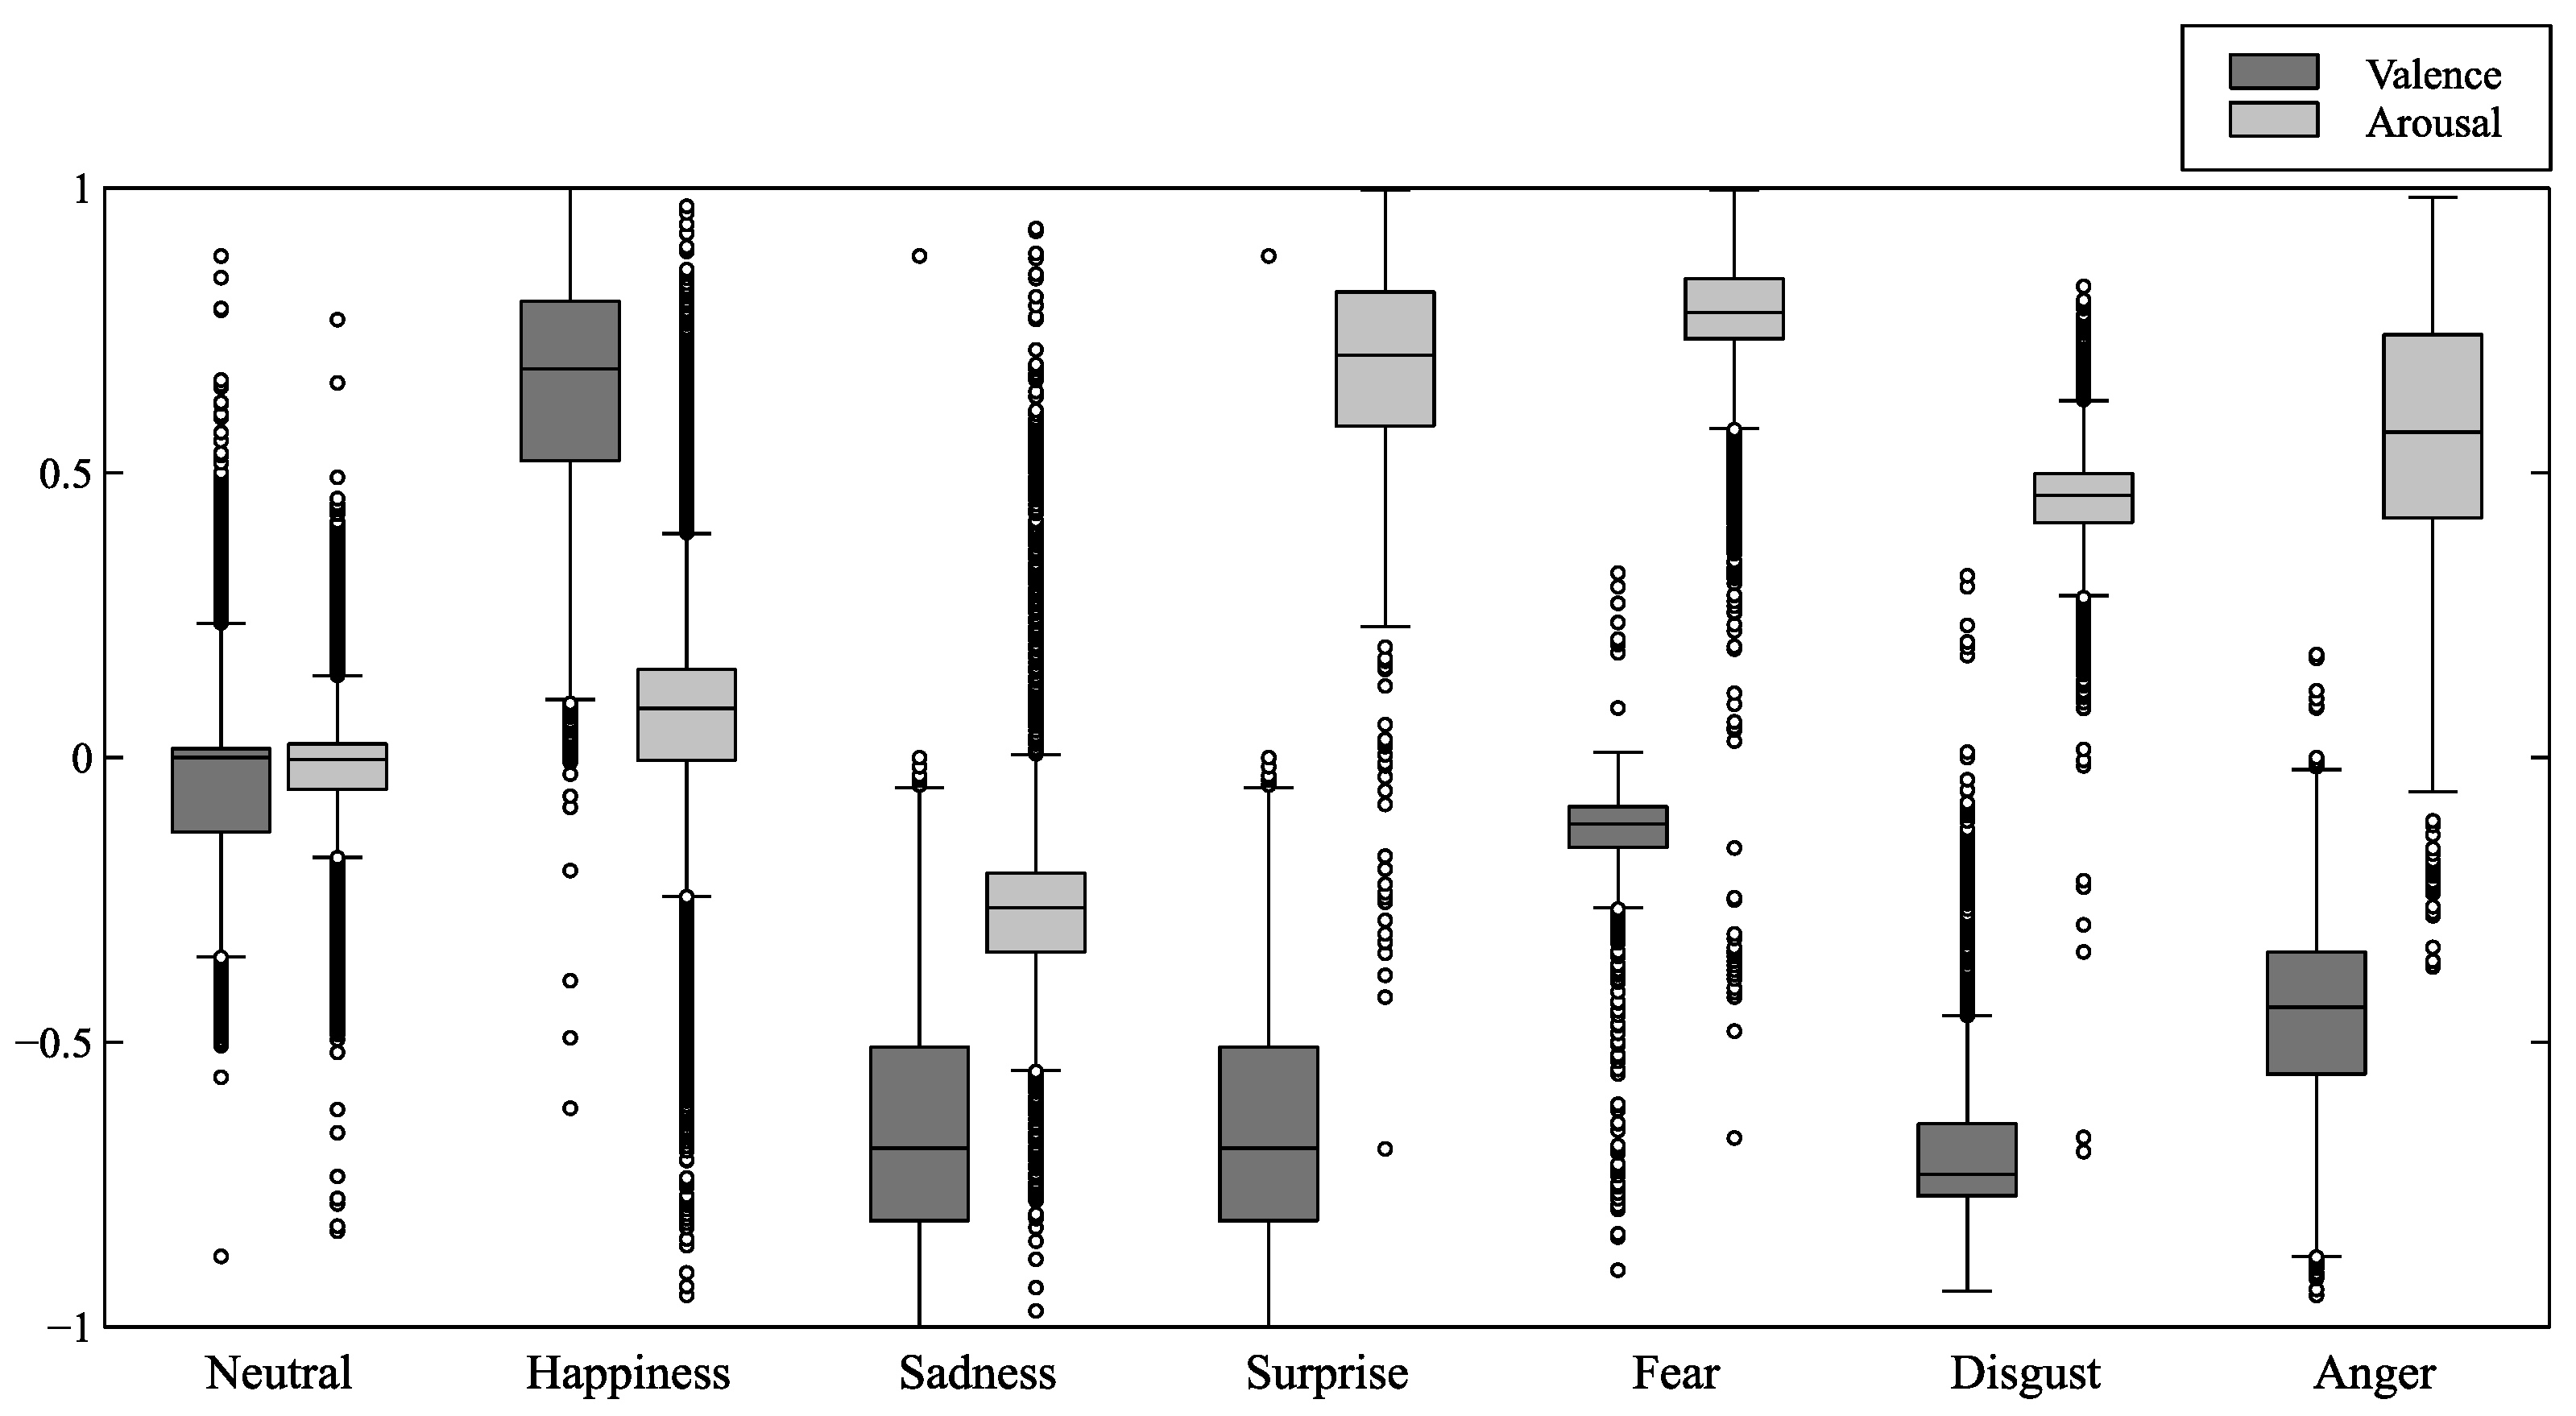
3.1. Dataset

AffectNet is one of the most comprehensive datasets for facial expression recognition (FER), containing over one million images collected from the web [36]. It includes both discrete emotion labels (e.g., happiness, sadness, and anger) and continuous valence–arousal annotations, making it a widely used benchmark for emotion analysis models. The dataset was designed to address the limitations of previous FER datasets, which often lacked diversity and contained a limited number of annotated expressions. AffectNet provides a large-scale, in-the-wild dataset that captures a wide variety of facial expressions across different ethnicities, lighting conditions, and head poses.
In the context of this study, AffectNet was chosen as the training dataset for deep learning models due to its high-quality annotations and comprehensive coverage of facial emotions. Specifically, a refined subset called AffectNet-8 was used, which includes only the samples with valid valence–arousal labels. The dataset was divided into training and validation sets to support model development and evaluation.
For model evaluation, the median valence and arousal values of each discrete emotion category were calculated from the training set and used as reference points for assessing prediction error (Figure 1). As contentment is not included in the AffectNet dataset, its reference coordinates were derived from prior literature, specifically based on Figs. 2 and 8 from the AffectNet study. These coordinates served as the ground truth for evaluating the model’s ability to estimate emotional states along the valence–arousal continuum.
In addition, Figure 2 presents representative facial images corresponding to each of the eight emotion categories used in this study, illustrating the main visual differences across classes.

3.2. Model Architecture

This study employed five widely used deep learning models to evaluate facial expression recognition (FER) performance in the valence–arousal space: EfficientNetV2-L, EfficientNetV2-S [33], MaxViT-B, MaxViT-T [34], and VGG16 [35].
EfficientNetV2 is a convolutional neural network (CNN) architecture that enhances training speed, accuracy, and efficiency by using a compound scaling method to jointly optimize the model’s depth, width, and resolution. It also integrates fused-MBConv blocks for faster convergence and better performance on small-scale features. The large variant (EfficientNetV2-L) offers high accuracy on large datasets such as AffectNet, while the small variant (EfficientNetV2-S) provides a lightweight, faster alternative with minimal compromise in accuracy. By comparing these two, the study examines whether EI-based performance differences are consistent across model sizes.
MaxViT is a hybrid vision transformer that combines convolutional blocks with multi-axis attention, enabling efficient modeling of both local and global feature dependencies. It introduces a block-wise structure that applies both grid-based and dilated attention to balance spatial precision and long-range context understanding. The base version (MaxViT-B) is designed for high-capacity learning, while MaxViT-T is a compact version aimed at faster inference with reduced resource requirements.
VGG16 is a classical CNN architecture composed of 13 convolutional layers and three fully connected layers, using uniform 3 × 3 kernels and a simple sequential design. Although it lacks the efficiency of more modern architectures, it remains a reliable benchmark due to its strong feature representation capabilities. In this study, VGG16 serves as a baseline for evaluating whether the effect of emotional intelligence on model performance is consistent across different network architectures.
All models were initialized with ImageNet [43] pre-trained weights and fine-tuned on the AffectNet dataset [36]. To ensure fair comparison, they were trained under identical conditions, including input size, optimizer, batch size, and loss function. Each model outputs two continuous values corresponding to valence and arousal for a given facial image.

3.3. Reference Framework

Circumplex Affect Guided Expression Inference (CAGE) is a facial expression recognition model that incorporates contextual and affective cues within Russell’s circumplex model of affect [39]. Rather than treating emotions as discrete classes, CAGE projects expressions into a continuous two-dimensional valence–arousal space. It enhances dimensional emotion recognition by integrating an adversarial loss framework and affective priors that preserve the semantic structure of emotional states.
This model achieved state-of-the-art performance on the AffectNet dataset in valence–arousal regression tasks, particularly for in-the-wild facial images. Its robust mapping between facial features and dimensional affective coordinates makes it a valuable reference for studies adopting continuous emotion modeling.
In this study, CAGE serves as a reference model for analyzing how valence–arousal-based inferences can be influenced by individual differences in EI. Given that EI affects how individuals interpret and express emotions, the incorporation of a model that aligns with the circumplex theory of affect allows for a deeper exploration of how EI modulates affect perception. CAGE’s framework also provides a structured way to assess whether EI levels contribute to systematic biases in facial emotion recognition.

3.4. Participants and EI Grouping

A total of 34 participants (age range: 20–52 years; mean age = 32.85, SD = 8.89) took part in the study. The sample comprised 14 males and 20 females. Participants were recruited through public advertisements and volunteered to participate in the study. Inclusion criteria required that participants had no known history or family history of facial muscular disorders, no issues with vocabulary comprehension, and corrected visual acuity of 0.6 or higher. There were no restrictions regarding participants’ age or educational background. All participants provided informed consent and received a nominal compensation upon completing the experiment.

3.5. Experimental Task and Procedure

The experiment was conducted remotely using the Social EQ mobile application developed by Emotionist, Inc. (Seoul, Republic of Korea) [44]. All tasks were completed by participants in their own living environments using personal smartphones. The procedure consisted of three sequential stages: emotional intelligence (EI) assessment, emotion recognition, and emotion expression.
Step 1: Emotional Intelligence Assessment
Participants first completed the Tromsø Social Intelligence Scale (TSIS), a self-report questionnaire designed to measure social and emotional sensitivity [31]. The questionnaire was administered through the mobile app and included items rated on a 7-point Likert scale (1: strongly disagree to 7: strongly agree). Example items include the following:
  • I am often surprised by the reactions of others to my behavior.
  • When I express my thoughts, people often respond with anger or irritation.
  • I sometimes realize that people are unpredictable.
  • I am often surprised by the behavior of others.
  • I inadvertently hurt someone’s feelings.
  • I sometimes find it hard to understand the choices others make.
Step 2: Emotion Recognition Task
Participants were presented with images depicting facial expressions on their smartphone screens and asked to select the corresponding emotion from a predefined list. The task consisted of seven items, with each item displayed for a maximum of 5 s. The emotion recognition (perception) score was calculated as the percentage of correct responses out of the total items.
Step 3: Emotion Expression Task
Participants were instructed to mimic facial expressions shown in example images as accurately as possible. Each trial lasted up to 10 s, during which participants prepared and held their expression. At the end of each trial, the smartphone’s front-facing camera automatically captured the participant’s face. These images were later preprocessed and used as the input for deep learning models to predict valence and arousal values. The emotion expression score was computed by comparing the predicted emotion label, inferred by the app’s built-in emotion recognition model, with the intended target emotion.
Each of the three components—TSIS, emotion recognition, and emotion expression—was rescaled to a 100-point scale, resulting in a maximum total EI score of 300. This composite score served as the basis for subsequent analysis of group differences in facial expression recognition performance. All responses and captured images were anonymized and securely stored for subsequent analysis. The overall flow of the three-stage experiment, including data collection and model-based emotion recognition, is illustrated in Figure 3.

3.6. Evaluation Metrics

To evaluate model performance in predicting continuous emotional states, this study utilized a set of regression-based evaluation metrics. Five evaluation metrics were used to quantify prediction accuracy and agreement between predicted and reference values: mean squared error (MSE), root mean squared error (RMSE), concordance correlation coefficient (CCC), Pearson correlation coefficient (Corr), and sign agreement metric (SAGR). In addition, kernel density estimation (KDE) was performed to analyze the distributional characteristics of the predicted values. From this, both mean log density and peak density were computed to assess the consistency and concentration of emotion predictions. Below are detailed explanations of each metric, along with their mathematical formulations. Mean squared error (MSE) quantifies the average squared difference between predicted and true values. A lower MSE indicates that the model’s predictions are closer to the actual values, making it a widely used loss function for regression tasks.
M S E = 1 N i = 1 N ( y i y ^ i ) 2
Root mean squared error (RMSE) is the square root of the MSE, making it more interpretable since it is in the same unit as the target variable. Lower RMSE values indicate better predictive performance.
R M S E = 1 N i = 1 N ( y i y ^ i ) 2
N is the number of samples and y i is the ground truth value. y ^ i is the predicted value.
Concordance correlation coefficient (CCC) evaluates how well the predicted values agree with the true values by considering both precision and accuracy. It is a robust metric that accounts for scale shifts and biases. A higher CCC value (closer to 1) indicates better agreement between predictions and actual values.
C C C = 2 ρ σ y σ y ^ σ y 2 + σ y ^ 2 + ( μ y μ y ^ ) 2
ρ is the Pearson correlation coefficient between predicted and true values. σ y and σ y ^ are the standard deviations of the true and predicted values, respectively. μ y and μ y ^ are the means of the true and predicted values.
Correlation coefficient (Corr) measures the strength and direction of the linear relationship between the predicted and true values. It ranges from −1 to +1, where values close to +1 indicate a strong positive relationship, whereas values near −1 indicate a strong negative relationship, and 0 indicates no correlation.
C o r r = ( y i μ y ) ( y ^ i μ y ^ ) ( y i μ y ) 2 ( y ^ i μ y ^ ) 2
Sign agreement ratio (SAGR) represents the proportion of instances where the predicted and actual values have the same sign. This metric is particularly useful in applications where correctly predicting the direction of change is more important than the magnitude. A higher SAGR value indicates better performance in predicting the correct direction of emotions.
S A G R = 1 N i = 1 N 1 ( s i g n ( y i ) = s i g n ( y ^ i ) )
1(⋅) is an indicator function that returns 1 if the specified condition is true and 0 otherwise. s i g n ( y i ) and s i g n ( y ^ i ) represent the signs of the actual and predicted values, respectively.
Mean distance measures the mean absolute distance between predicted and true values. It provides a direct interpretation of prediction deviation in the original scale of the data. A lower mean distance indicates better model performance.
M e a n   d i s t a n c e = 1 N i = 1 N y i y ^ i
Kernel density estimation (KDE) is a non-parametric way to estimate the probability density function of a random variable, based on observed data. It is often used to visualize or evaluate how predicted values are distributed in relation to true data distributions. Mean log density quantifies how concentrated the predicted values are within the estimated density function. A higher value indicates that the predictions are more tightly clustered in high-density areas, suggesting greater consistency and confidence in the predictions.
f ^ x = 1 N h i = 1 N K x x i h
K(⋅) is the kernel function (typically Gaussian). h is the bandwidth parameter and x i are the observed data points.
Peak density refers to the highest value of the estimated probability density function of the predicted values. It represents the peak of the distribution and provides a measure of how sharply the predictions are concentrated around a particular value. A higher peak density indicates that the predicted values are strongly clustered around a central mode. f ^ ( x ) is the kernel density estimation function.
m a x f ^ ( x )
All metrics were calculated separately for valence and arousal, and performance was averaged across all test samples. These metrics were also used to compare model performance across emotional intelligence (EI) groups to examine whether EI levels influence the accuracy of emotion recognition in continuous affective space.

4. Analysis

This chapter outlines the analytical procedures undertaken to evaluate model performance and assess the influence of emotional intelligence (EI) on facial expression recognition. The analysis was conducted from three perspectives: (1) evaluation of deep learning-based emotion recognition models, (2) statistical grouping based on EI scores, and (3) performance comparison across EI groups.

4.1. Deep Learning-Based Emotion Recognition

The first analysis focused on evaluating the performance of five deep learning models—EfficientNetV2-L, EfficientNetV2-S, MaxViT-B, MaxViT-T, and VGG16—on facial emotion recognition. All models were trained using the AffectNet dataset, and inference was performed on facial expression images collected from 34 participants.
Valence and arousal were predicted independently, following a regression-based approach. For each dimension, five evaluation metrics were computed: mean squared error (MSE), root mean squared error (RMSE), concordance correlation coefficient (CCC), Pearson correlation coefficient (Corr), and sign agreement metric (SAGR). Model performance was assessed both at the individual level and through metrics averaged across all models. These results were also compared with the performance reported in previous studies using the same dataset, to contextualize the effectiveness of the selected models.

4.2. EI Grouping and Statistical Analysis

To investigate the role of emotional intelligence in facial emotion recognition, EI scores were computed for each participant based on three components: the Tromsø Social Intelligence Scale (TSIS), an emotion recognition task, and an emotion expression task. Each component was standardized to a 100-point scale, and the total score was calculated out of 300.
Subsequently, all EI-related scores were standardized and subjected to reliability analysis using Cronbach’s alpha. Dimensionality reduction was performed through principal component analysis (PCA), and participants were grouped into two clusters using k-means clustering (k = 2). An independent sample t-test was conducted to confirm significant differences between the resulting EI groups.

4.3. EI-Based Comparison of Emotion Prediction

To evaluate whether EI levels influenced model performance, the predicted valence and arousal values for each participant were compared against reference values for each target emotion. These reference values were defined as the median valence and arousal coordinates of each emotion category calculated from the training set. For the emotion category contentment, which is not included in the AffectNet dataset, external coordinates from previous literature were used [36].
Group-level comparisons were conducted between high-EI and low-EI participants. Among the performance metrics, MSE and RMSE were statistically compared between groups using independent sample t-tests or Mann–Whitney U-tests, depending on normality. SAGR, being a categorical agreement metric, was analyzed using a chi-square test. CCC and Corr were not subjected to inferential tests, as they represent correlation-based measures; instead, they were compared descriptively through mean value comparisons across groups.
Two approaches were used for aggregating prediction errors: (1) computing the mean error across all emotion categories and (2) analyzing error metrics separately for each emotion category. To further examine distributional consistency in model outputs, kernel density estimation (KDE) was performed. From the KDE curves, mean log density and peak density were computed for each participant to assess the concentration and dispersion of the predicted emotional states.

5. Results

5.1. Deep Learning Recognition Results

Table 1 summarizes the performance metrics of continuous emotion regression models trained on the AffectNet-8 dataset. In the original AffectNet study [36], AlexNet was used to validate the dataset, and its performance was measured using the continuous emotion labels from AffectNet-8. The CAGE study [39] trained EfficientNetV2-S and MaxViT-T on the same dataset and reported their respective performance results. In our study, five different deep learning models, as described in Section 2.3, were also trained using AffectNet-8’s continuous emotion labels, and the mean performance across these models is reported in the table. To improve readability, only the key metrics are included, with model and dataset descriptions provided in the main text.
When evaluated using the same performance metrics as those employed in the AffectNet study, the results of this study demonstrate comparable or slightly superior performance. Additionally, when compared to the results of the two models presented in CAGE, the performance of this study remains largely consistent. However, in the arousal domain, the CCC performance metric is approximately 0.3 lower than that reported in CAGE, whereas it exhibits an improvement of about 0.15 compared to the results from AffectNet.

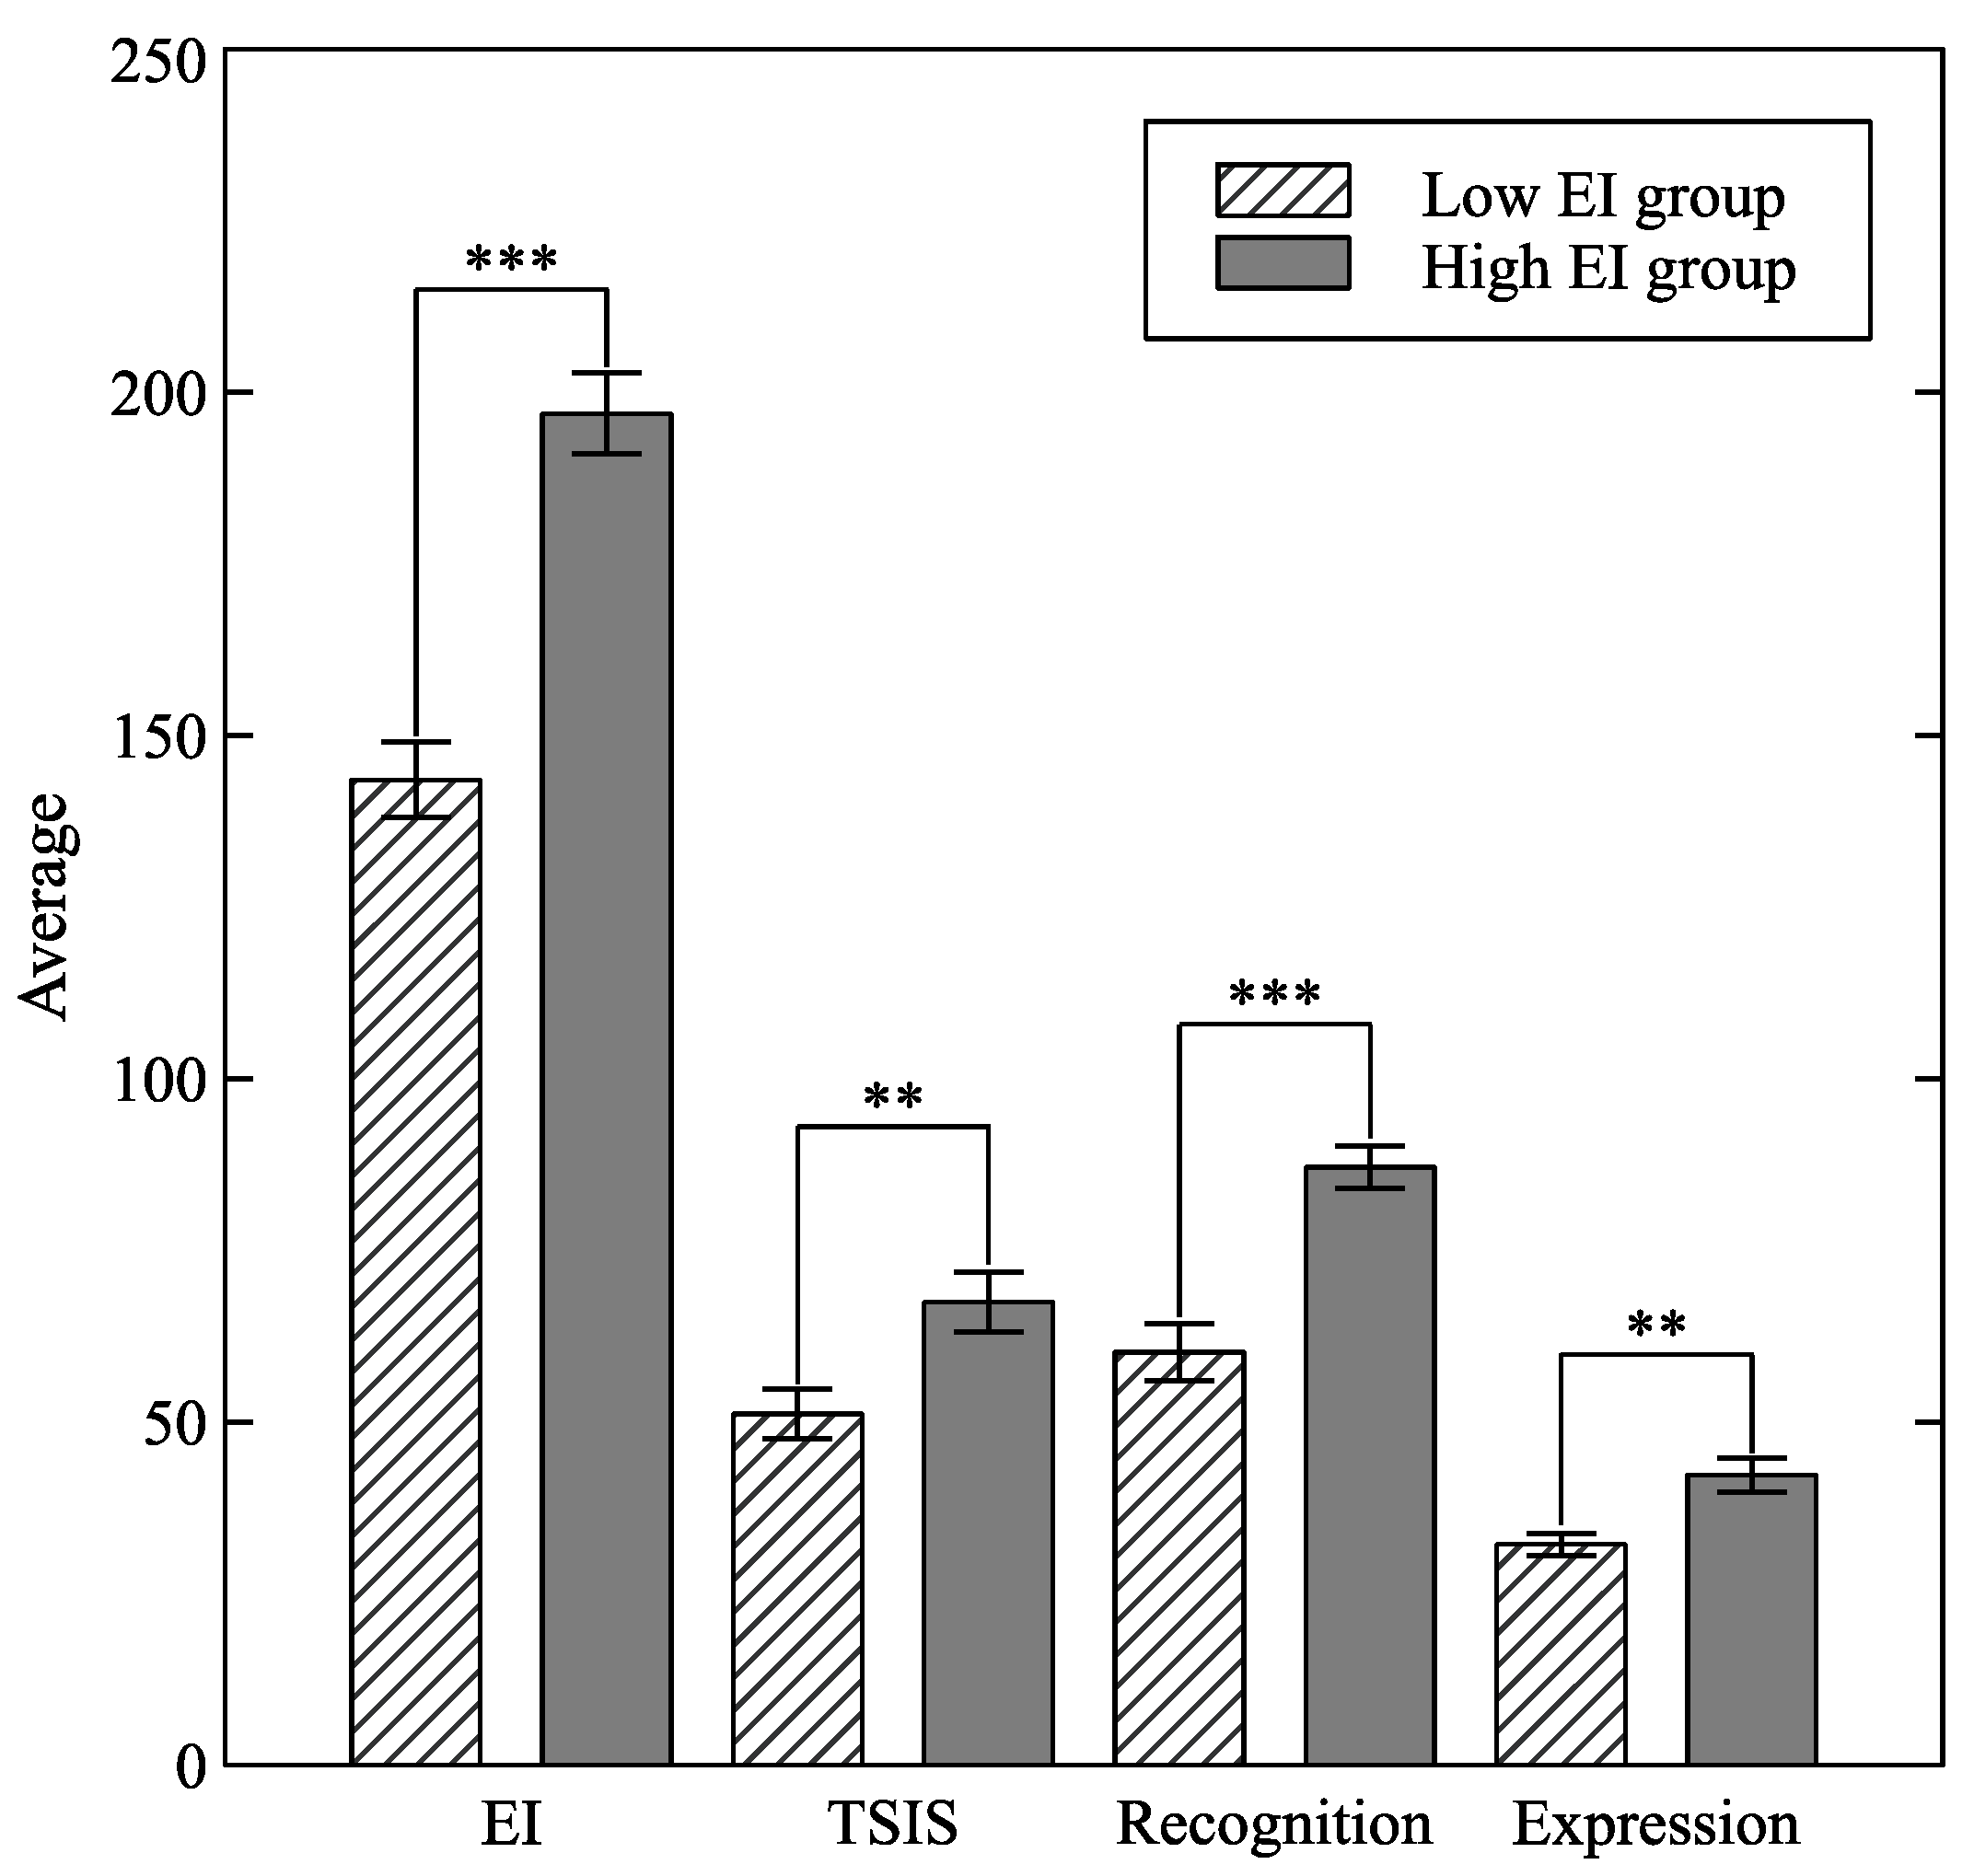
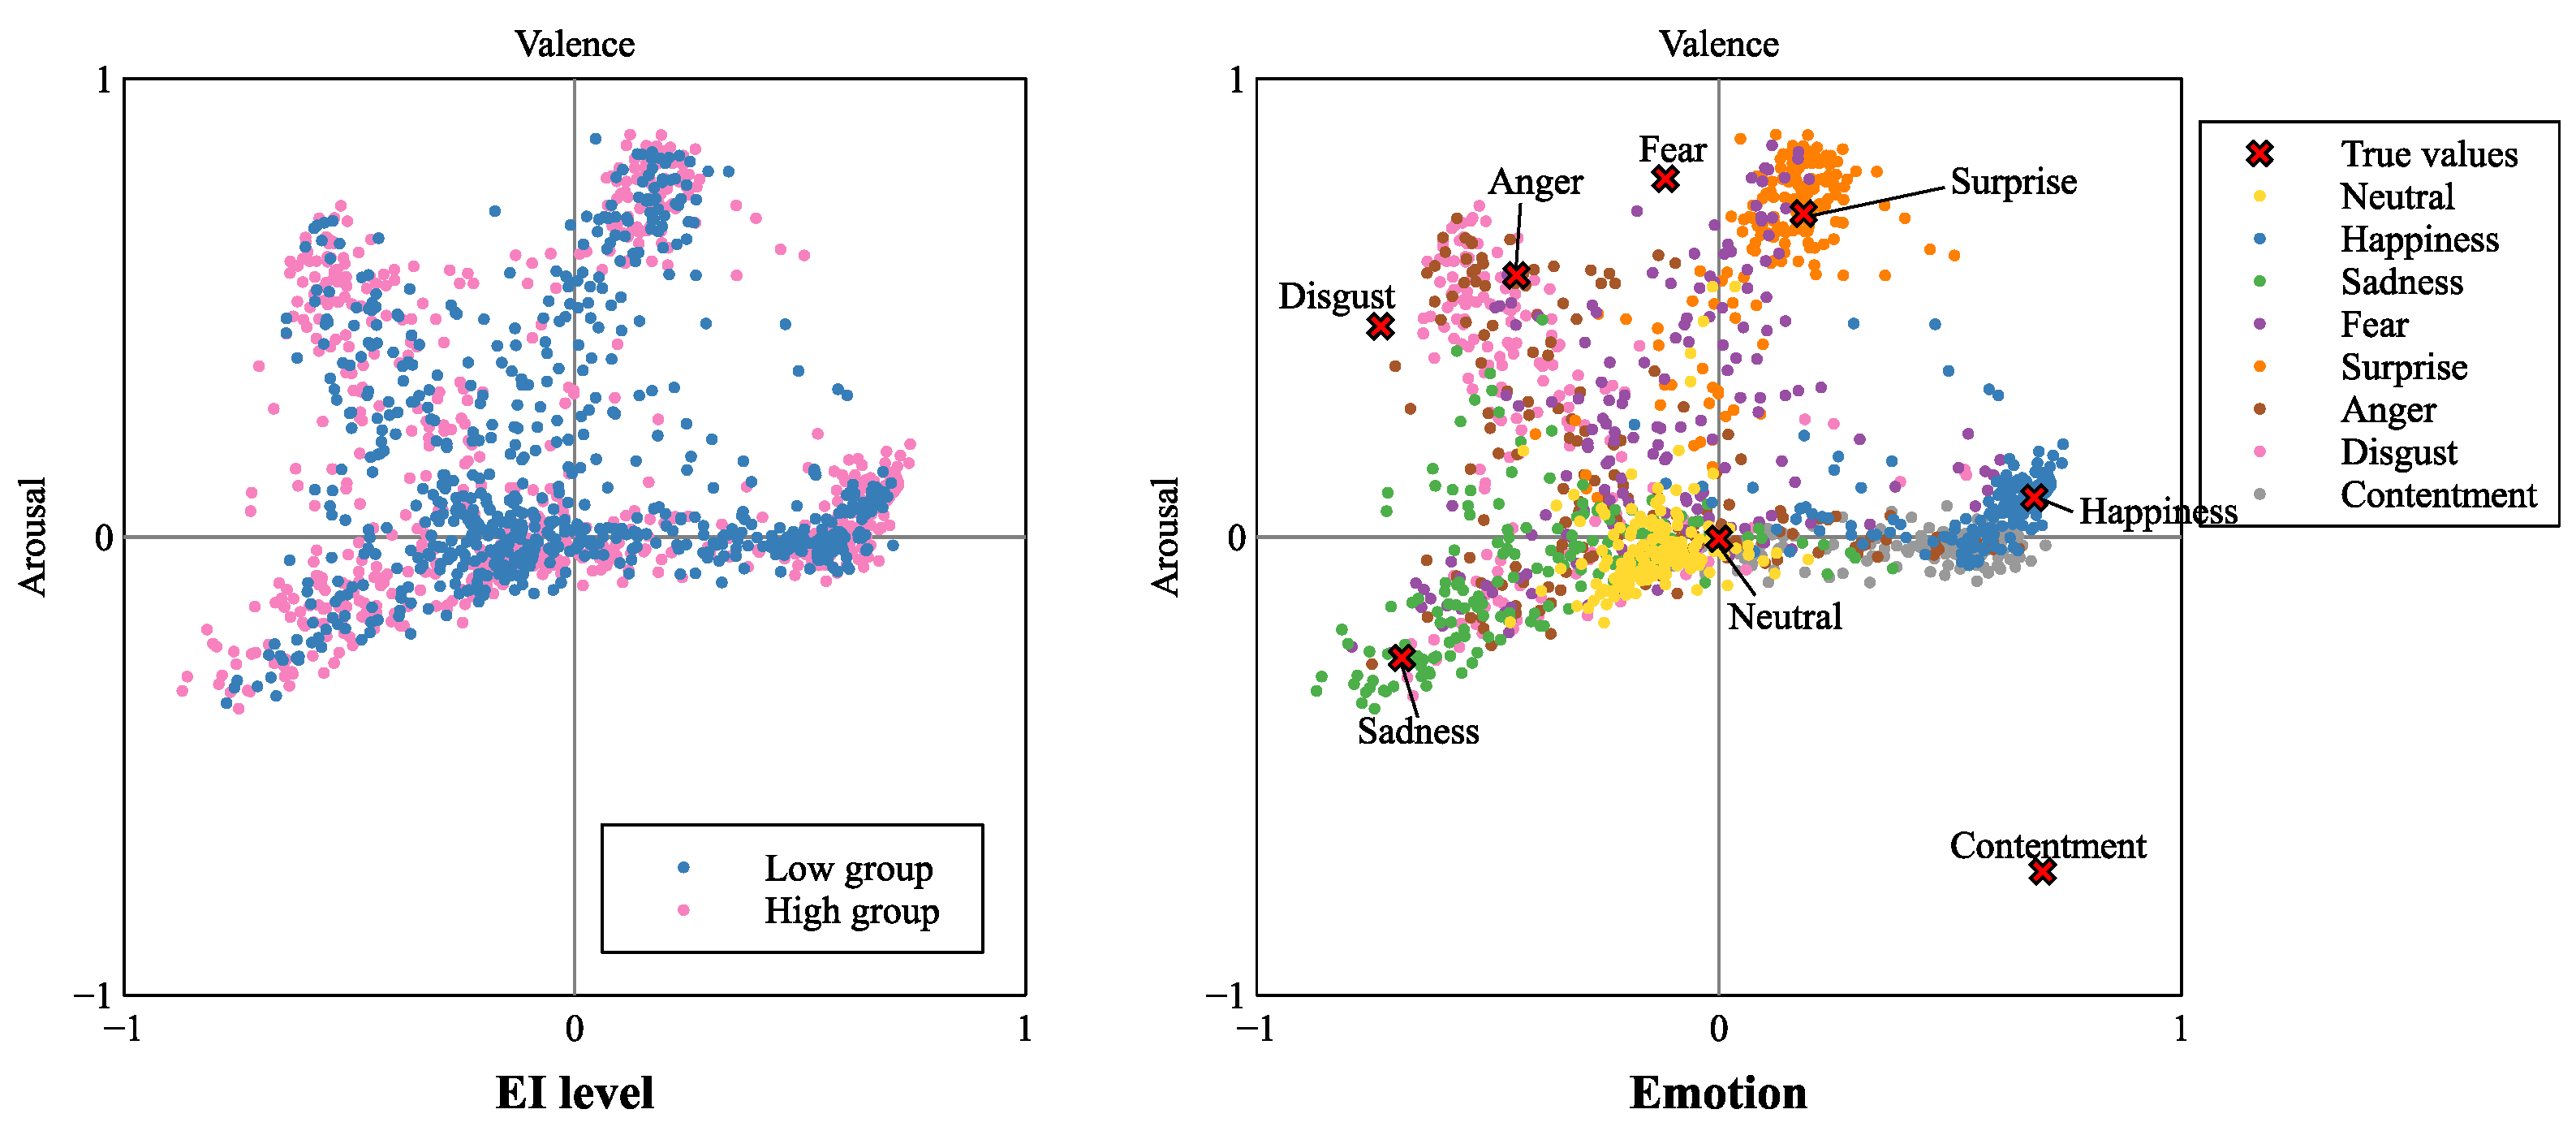
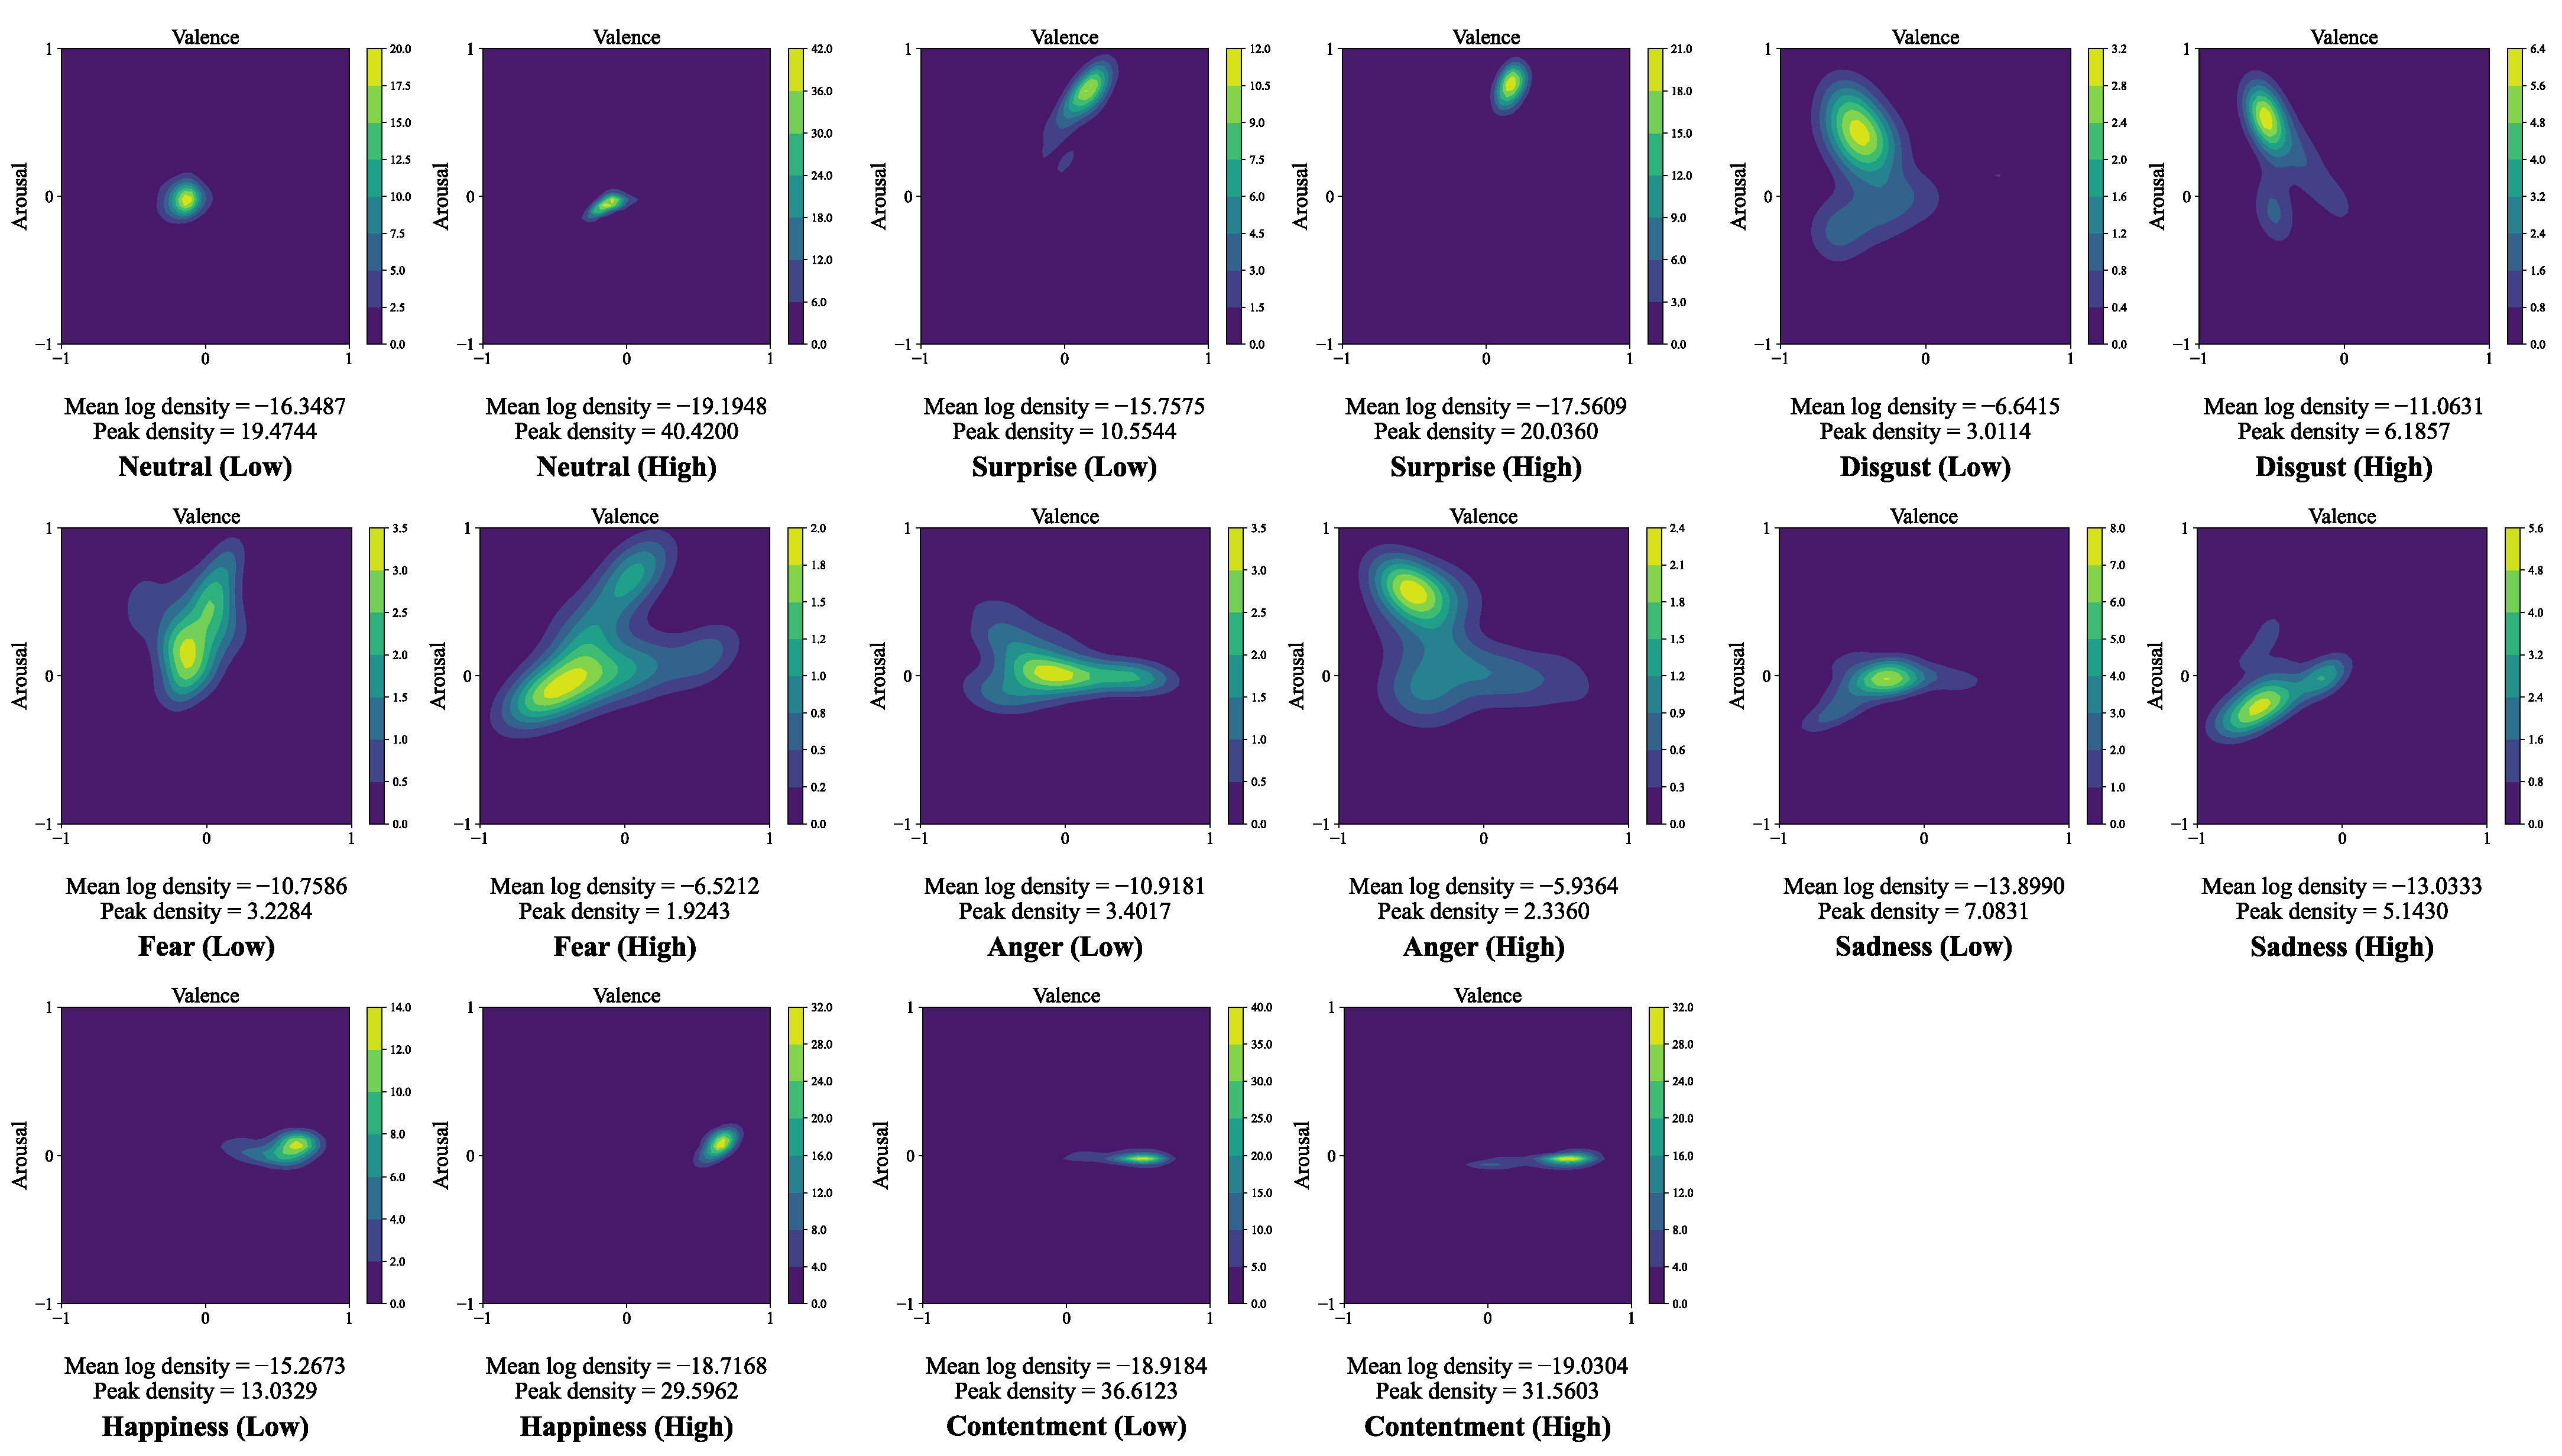
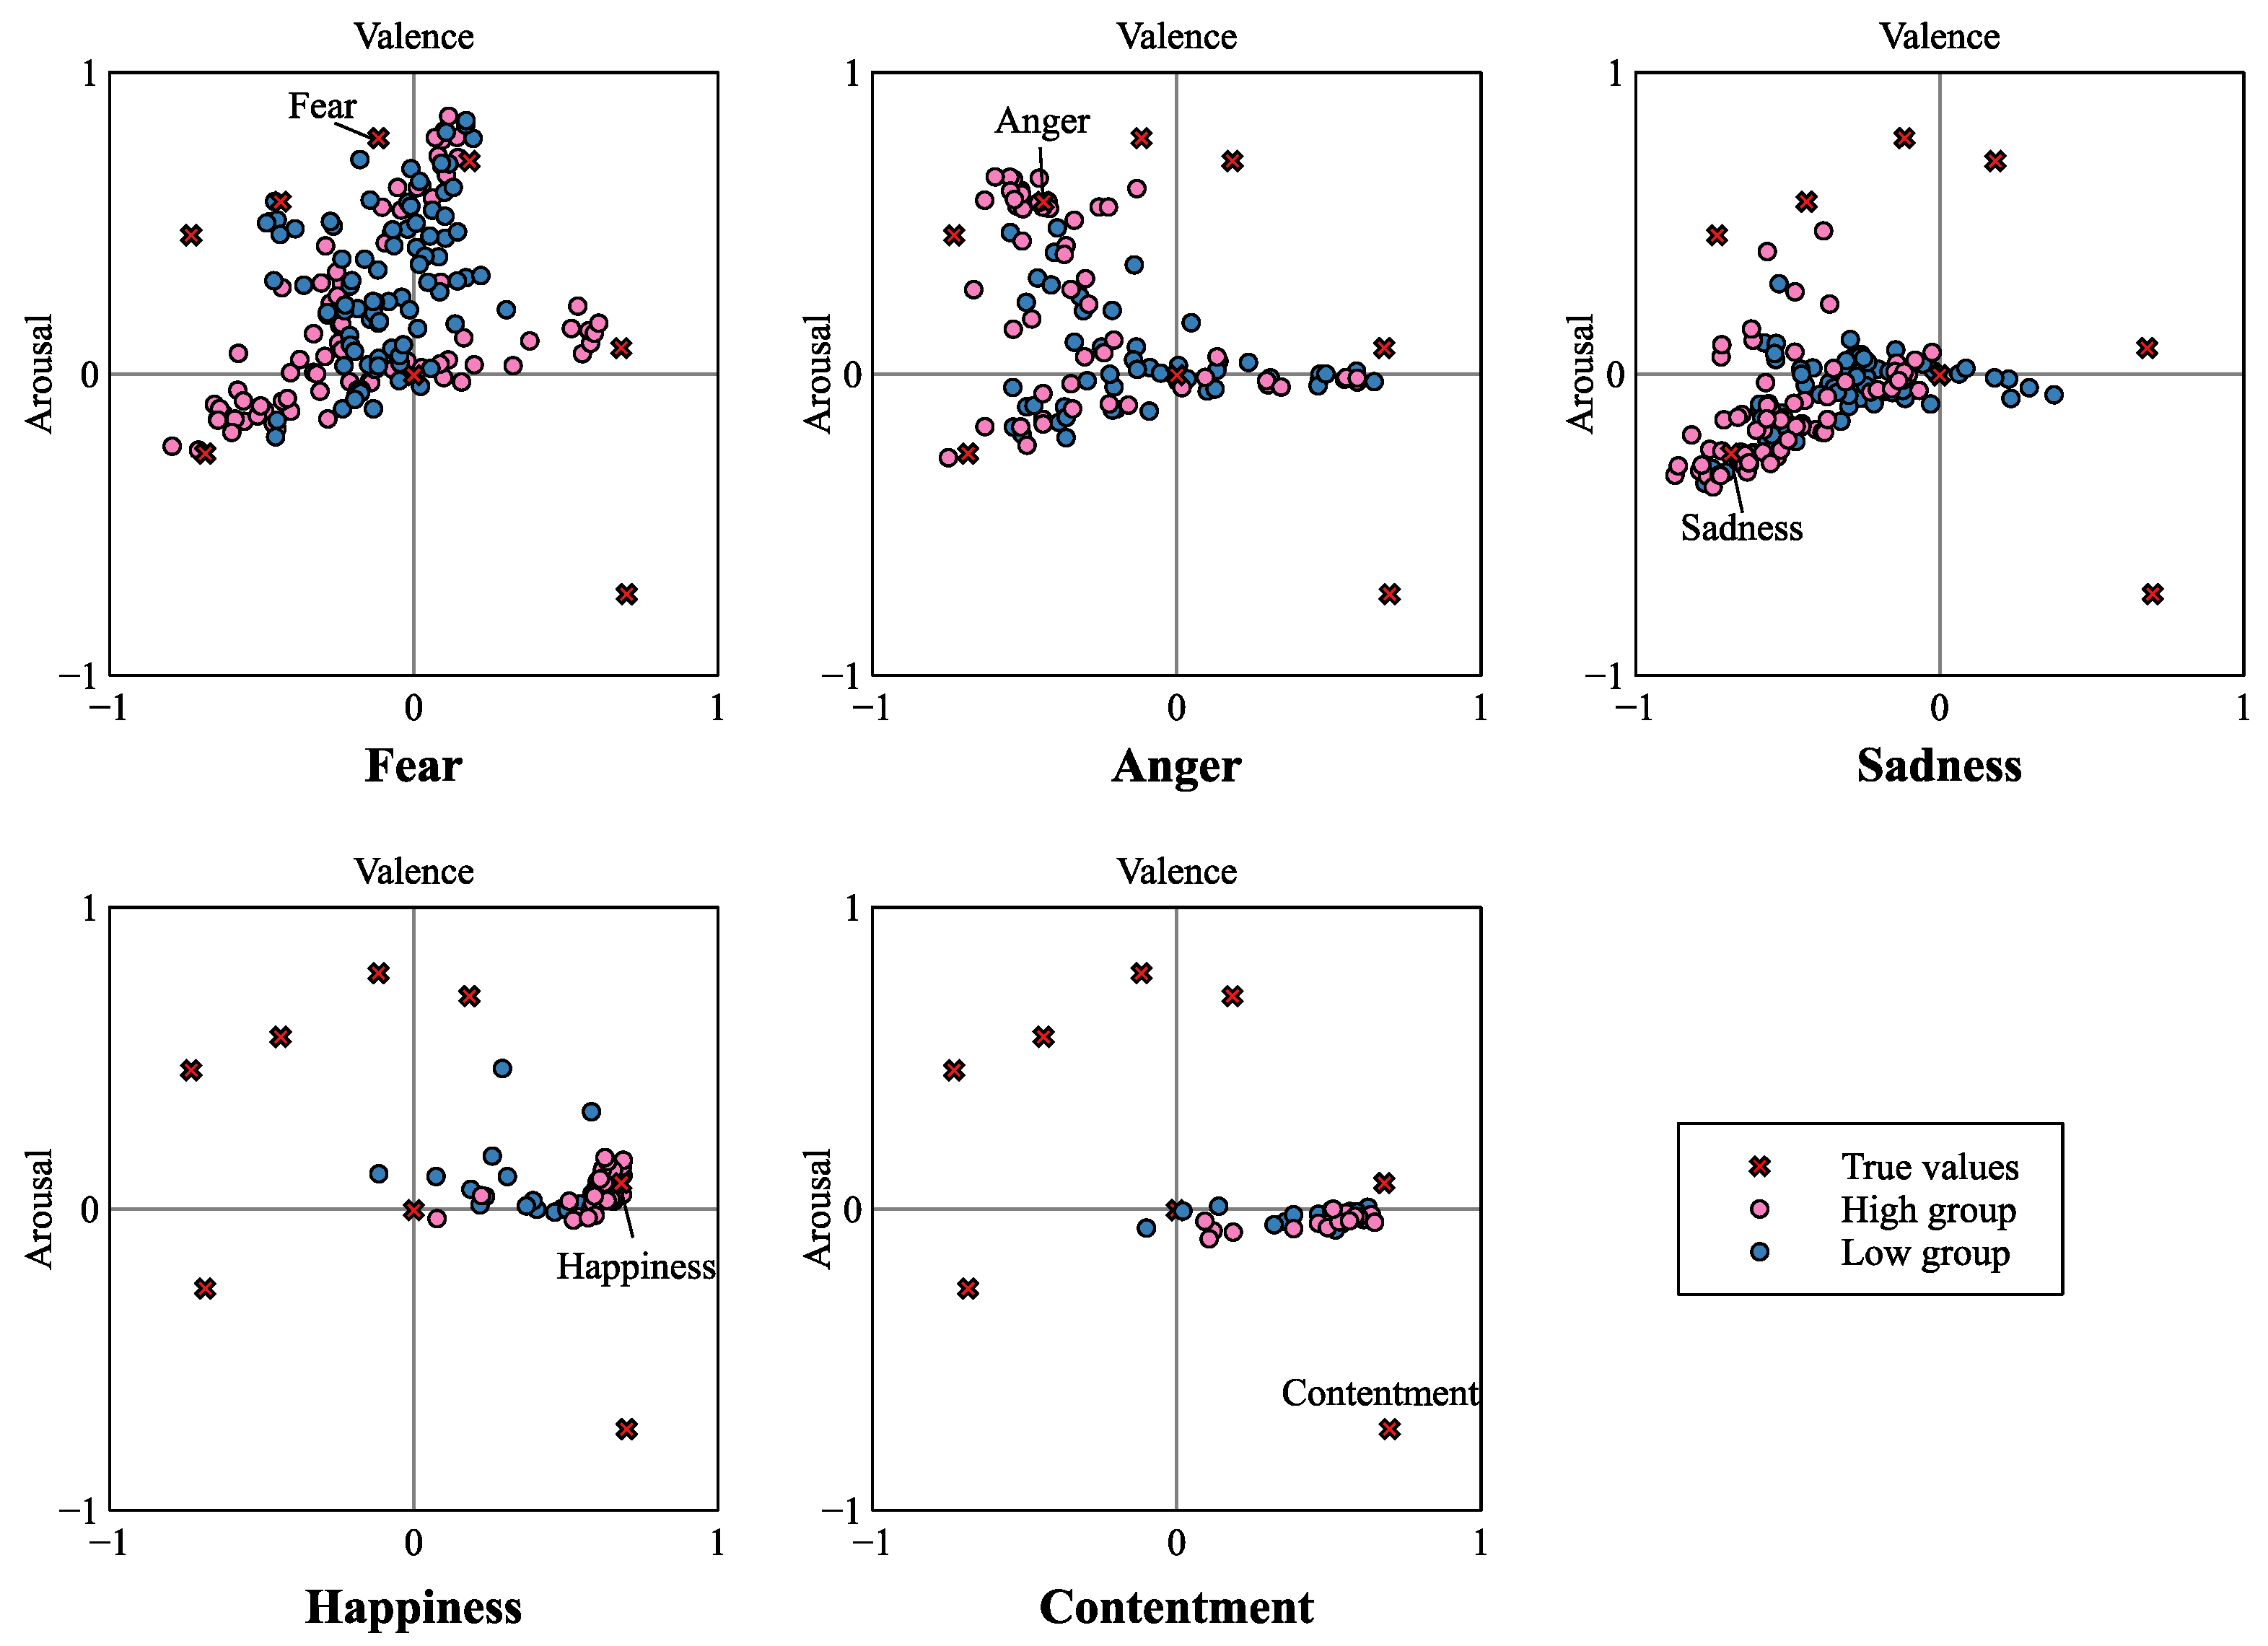
5.2. Group Classification Based on Emotional Intelligence Scores and Determination of Emotion-Specific True Values

In this study, four EI-related items were used as factors for statistical analysis. The reliability analysis yielded a Cronbach’s alpha of 0.776 (N = 34), indicating acceptable internal consistency. Principal component analysis (PCA) was conducted on the four emotional intelligence-related variables (EI, TSIS, recognition, and expression), and two components were extracted, explaining 86.171% of the total variance. Based on the elbow method, the number of clusters for k-means clustering was set to k = 2, as the inflection point was observed at this value. The clustering algorithm classified all 34 participants into two groups of equal size (N = 17 each) without manual adjustment. One cluster exhibited higher standardized scores across all four variables and was labeled the high EI group, while the other showed lower scores and was labeled the low EI group.
The results of the independent sample tests on the raw emotional intelligence scores for each group are presented in Figure 4. Among the four factors, the emotion recognition score did not satisfy the normality assumption, and the Mann–Whitney U-test was conducted, revealing that the high EI group scored significantly higher (U = 34, z = −3.918, p = 0.000, r = 0.95). For the remaining three factors, normality was met, and t-tests were performed. The results showed that the high EI group had significantly higher scores than the low EI group for EI score (t(32) = 6.603, p = 0.000, d = 1.17), TSIS score (t(32) = 2.855, p = 0.008, d = 0.505), and emotion expression score (t(32) = 3.445, p = 0.002, d = 0.609).

5.3. Performance Comparison of Facial Recognition Models Based on Emotional Intelligence Levels

The predicted emotion coordinates from the test dataset, obtained using five deep learning models, are presented in Figure 5. As described in Section 3, the mean performance metrics for the high EI group and low EI group were computed, and statistical analyses were conducted on the MSE, RMSE, and SAGR metrics. Additionally, when analyzing by emotion category, the mean distance between actual and predicted values, as well as the density distribution, was calculated to comprehensively assess recognition accuracy for each emotion. This approach allowed for a thorough analysis of differences in prediction accuracy and distribution characteristics of facial recognition models based on emotional intelligence levels.

5.3.1. Analysis Results for All Emotions

Table 2 presents the mean performance metrics and independent test results by emotional intelligence (EI) level for each model. The five deep learning models used in this analysis—EfficientNetV2-L, EfficientNetV2-S, MaxViT-B, MaxViT-T, and VGG16—were trained using the same dataset, AffectNet-8 with continuous emotion labels. In the table, model names are abbreviated for simplicity as L (EfficientNetV2-L), S (EfficientNetV2-S), B (MaxViT-B), T (MaxViT-T), and V (VGG16).
Based on the prediction values from these models, performance metrics were calculated separately for the low and high EI groups. Since the normality assumption was not met for the MSE and RMSE metrics, the Mann–Whitney U-test was applied, while SAGR was analyzed using a chi-square test. The table presents the mean performance metrics computed across both the valence and arousal dimensions.
The key message from Table 2 is that across all five models, participants with higher EI consistently exhibited better prediction performance than those with lower EI. Specifically, the mean MSE and RMSE values were lower in the high EI group, whereas CCC, Corr, and SAGR values were higher. Statistically significant group differences in MSE and RMSE were observed in all models except for the MaxViT-T model. Although the SAGR metric did not reach significance, the high EI group exhibited a mean increase of 8.63%. Additionally, CCC and Corr were, on mean, 13.40% and 7.01% higher, respectively, in the high EI group.
When broken down by emotion dimension, the valence results show significant differences between EI groups in all models except EfficientNetV2-S, with the high EI group outperforming the low EI group across most metrics. For example, the mean CCC and Corr values were 15.81% and 9.81% higher, respectively, in the high EI group. While the SAGR difference was not statistically significant, it still showed an 8.92% improvement.
In contrast, the arousal results did not reveal statistically significant differences for any model. Nonetheless, performance still favored the high EI group, which achieved 1.27% lower MSE, 9.06% lower RMSE, 8.29% higher SAGR, 10.60% higher CCC, and 2.55% higher Corr on mean.

5.3.2. Analysis Results for Individual Emotions

The performance comparison for individual emotions was primarily conducted using MSE and RMSE metrics, as these allowed for statistical testing, while SAGR was excluded due to the absence of statistically significant results in the chi-square analysis.
Figure 6 presents scatter plots of predicted valence–arousal coordinates for each emotion, visualized by five different models. Each emotion is distinguished by color, and brightness is adjusted according to EI level, providing a visual comparison of prediction patterns between the low and high EI groups. The mean distances between the predicted coordinates and the true values, along with the results of independent t-tests comparing the two EI groups, are summarized in Table 3.
Figure 7 displays the kernel density estimation (KDE) plot of the predicted valence–arousal distributions for each emotion, with separated subplots for the two EI groups. Each plot includes two distribution-based metrics: mean log density, representing the overall spread of predicted values (with more negative values indicating broader dispersion), and peak density, representing the maximum local concentration of predictions (with higher values corresponding to higher density in a specific region).
For neutral, the mean distance was 0.191 ± 0.115 for the low EI group and 0.148 ± 0.072 for the high EI group. In surprise, the respective values were 0.208 ± 0.200 and 0.124 ± 0.103. For disgust, 0.498 ± 0.281 and 0.397 ± 0.225. In these three emotions, the mean log density was higher in the low EI group, while the peak density was greater in the high EI group.
For fear, the low EI group had a mean distance of 0.524 ± 0.208, while the high EI group recorded 0.714 ± 0.288. In anger, the values were 0.671 ± 0.260 (low) and 0.457 ± 0.337 (high), and for sadness, 0.463 ± 0.235 (low) and 0.317 ± 0.218 (high). In these three cases, the mean log density was higher in the high EI group, whereas the peak density was higher in the low EI group.
For happiness, the mean distance was 0.215 ± 0.202 for the low EI group and 0.104 ± 0.120 for the high EI group. The mean log density was higher in the low group, whereas the peak density was higher in the high group. In contentment, the mean distance was similar between groups: −0.783 ± 0.092 (low) and 0.776 ± 0.102 (high). The mean log density values were −19.892 (low) and −19.900 (high), and the peak density was slightly higher in the low EI group.
Independent t-tests comparing the mean distances between the two EI groups indicated statistically significant differences for neutral, surprise, disgust, anger, sadness, and happiness, with the high EI group showing lower mean distances from the true values. Conversely, for fear, the low EI group demonstrated lower distances, while contentment showed no statistically significant differences between groups.
Figure 6 presents scatter plots illustrating individual distributions of predicted valence–arousal coordinates, enabling visual comparisons of prediction patterns between the EI groups. Figure 7 emphasizes the density distributions of these predicted coordinates, highlighting the degree of prediction concentration or dispersion. In contrast, Figure 8 specifically visualizes emotions (fear, anger, sadness, happiness, and contentment) that exhibited statistically significant group differences in prediction accuracy as detailed in Table 4. Table 4 summarizes statistical analyses of prediction errors (MSE and RMSE) across emotions, models, and EI groups. Generally, the high EI group demonstrated lower errors across most emotions. However, fear consistently showed lower errors in the low EI group across all models.
Significant group differences were observed in the mean performance metrics (MSE and RMSE) across valence and arousal dimensions for the emotions fear, sadness, anger, and happiness. Notably, all five models showed significantly lower prediction errors for fear in the low EI group. In contrast, for sadness and anger, the high EI group generally demonstrated better performance, with several models showing statistically significant differences. For happiness, significant results favoring the high EI group in specific models (VGG16 and MaxViT-B).
Dimension-specific analyses indicated statistically significant differences for fear, anger, sadness, happiness, and contentment. In the valence dimension, significant differences emerged for fear, sadness, and happiness, with the low EI group performing better for fear and the high EI group performing better for sadness and happiness. In the arousal dimension, significant differences were observed for fear, sadness, anger, and contentment, with the high EI group performing better in all emotions except fear.
Overall, when averaging the performance metrics across the valence and arousal dimensions, significant differences were observed for fear, sadness, anger, and happiness. In the separate dimension-specific analyses, fear, sadness, and happiness showed significant differences in the valence dimension, while fear, sadness, anger, and contentment exhibited significant differences in the arousal dimension. Notably, fear consistently demonstrated significantly lower errors in the low EI group across all models, whereas anger, sadness, and happiness predominantly showed lower errors in the high EI group.
Figure 8 visualizes the predicted valence–arousal coordinates for emotions with statistically significant differences in Table 4, distinguishing predictions by EI levels. Correspondingly, Table 3 presents the true coordinates, the mean distances between the predicted and true coordinates for both EI groups, and the results of independent t-tests.
Specifically, for fear, the low EI group had a mean distance of 0.524 ± 0.208, significantly smaller than the high EI group’s mean distance of 0.712 ± 0.288. Conversely, for anger, the high EI group exhibited a smaller mean distance (0.455 ± 0.350) compared to the low EI group (0.685 ± 0.264). Similarly in sadness, the high EI group had a lower mean distance (0.304 ± 0.213) relative to the low EI group (0.460 ± 0.235). For these three emotions, Figure 7 indicates that the high EI group had higher mean log densities, whereas the low EI group exhibited greater peak densities. For happiness, the high EI group showed a notably smaller mean distance (0.106 ± 0.119) compared to the low EI group (0.220 ± 0.195). Here, the mean log density was higher in the low EI group, while peak density was greater in the high EI group (refer to Figure 7). In contentment, the distances between groups were similar, with 0.779 ± 0.102 for the low EI group and 0.754 ± 0.070 for the high EI group. KDE metrics were nearly identical between groups, though peak density was slightly higher in the high EI group.
Independent t-tests analyzing the differences in mean distance revealed that for fear, the low EI group had significantly smaller prediction errors. In contrast, for anger, sadness, and happiness, the high EI group made predictions that were significantly closer to the true values. Meanwhile, contentment did not show a statistically significant difference between the two groups in terms of prediction distance.

6. Discussion

In this study, emotional intelligence (EI) was measured using TSIS questionnaire items along with emotion recognition and expression tasks. Participants were grouped based on their EI levels, and differences in emotion recognition accuracy between these groups were analyzed.

6.1. Overall Emotion Recognition

When aggregating prediction results across all emotions, the high EI group demonstrated superior performance compared to the low EI group in terms of the mean valence and arousal metrics, valence-specific performance, and arousal-specific performance (Table 2). This trend was consistently observed across all five models and five performance metrics, supporting the hypothesis that individuals with higher emotional intelligence exhibit greater accuracy in recognizing emotions from facial expressions. However, while MSE and RMSE values exhibited statistically significant differences in most models for valence and the combined valence–arousal metrics, no statistically significant differences were found in arousal-specific performance across any models. These results appear to stem from the inherent characteristics of emotion data.
As illustrated in Figure 5, the distribution of emotion recognition results indicates that data dispersion differs between valence and arousal dimensions. Specifically, while the valence distribution is broadly spread across both groups, the arousal dimension exhibits a more skewed pattern. This may be attributed to the limited representation of the ‘non-aroused’ domain in facial expression datasets collected based on Paul Ekman’s six basic emotions [45,46,47]. Although this study attempted to address this limitation by incorporating the contentment label, the emotion was frequently misclassified as happiness. This outcome may reflect definitional inconsistencies in how contentment is represented across datasets, particularly between AffectNet and the present study. The conceptual ambiguity and data imbalance surrounding contentment likely contributed to limited model performance in this region. A more detailed discussion of these challenges is provided in Section 6.4.
Analysis of the prediction results by emotion category, as shown in Figure 6, indicates that differences in distribution between the high and low EI group were more pronounced in the valence dimension. In most emotions, the peak density point of the high EI group tended to be positioned at more extreme valence values compared to the low EI group. This suggests that perceptions of positive and negative valence may be influenced by individual subjective judgments, and that the interpretation of contextual situations in which emotions are elicited can affect both emotion recognition and expression in the valence dimension [5,8,9,45].
Notably, the high EI group demonstrated a greater ability to accurately interpret the context in which emotions arise, which likely enabled them to assess and express emotions with greater clarity [32,48,49].

6.2. Neutral, Surprise, Disgust

For neutral, surprise, and disgust, no statistically significant differences in prediction errors were observed across all models between EI levels. This suggests that these emotions are less influenced by EI and are generally recognized with similar accuracy across individuals. These emotions are typically elicited by immediate, stimulus-driven responses and are characterized by distinct facial expressions. Because of their visual clarity, they can be accurately decoded without requiring extensive contextual interpretation, thereby reducing the influence of EI on recognition performance.
Neutral faces are usually interpreted as emotionally blank; however, this appearance, while seemingly devoid of emotion, can be perceived as emotionally meaningful depending on the surrounding context. Prior studies have shown that even neutral expressions may carry emotional significance, particularly when presented in emotionally ambiguous or socially charged situations [50,51].
Surprise is associated with clearly identifiable facial features, such as widened eyes and raised eyebrows [52]. According to cognitive evolutionary theory, it arises from a discrepancy between expected and actual events, and this schema-discrepant nature leads to immediate attentional shifts and brief processing delays [53,54]. These reactions are largely automatic, enabling consistent recognition across individuals regardless of EI levels. This likely explains why both groups in this study exhibited tightly clustered prediction distributions around the true values.
In contrast, disgust showed broader prediction distribution patterns across both groups. Although generally evoked by strong aversive stimuli, it is also shaped by individual differences in sensitivity and contextual interpretation [55]. This reflects the subjective nature of disgust elicitors—what one person finds repulsive may not elicit the same emotional response in another. While statistical tests did not reveal significant group-level differences, the high EI group demonstrated smaller mean distances from the true values and higher peak density, suggesting more focused and accurate predictions. Neuroimaging studies have shown that the experience of disgust engages distributed brain systems, particularly the insula and anterior cingulate cortex, which support both visceral reactions and moral evaluations [30,55]. This neural complexity may enable individuals with higher EI, who are better at integrating contextual cues, to interpret disgust expressions more precisely—even in the absence of statistically significant group differences.
In sum, although neutral, surprise, and disgust are not strongly modulated by EI in terms of statistical recognition accuracy, subtle trends in prediction distributions suggest that higher EI may still contribute to more nuanced perception and expression of these emotions. This supports the broader conclusion that emotional intelligence enhances emotion recognition, particularly under conditions of ambiguity or subjectivity.

6.3. Fear, Anger, Sadness

Emotions such as fear, anger, and sadness share high arousal and negative valence characteristics but differ in how they are experienced and interpreted. Their recognition often depends on context and social understanding rather than facial features alone. EI is central to the recognition of these complex emotional states.
Statistical analysis revealed that the high EI group had lower prediction errors and smaller distances from true values across at least four models for all three emotions. They also showed higher log density and more dispersed prediction patterns, suggesting greater sensitivity to contextual cues, supporting previous findings that high EI enhances social–emotional judgment [56,57,58].
For anger, recognition accuracy was significantly higher in the high EI group. Anger typically arises in response to perceived social violations or moral injustice. Peléšková et al. (2024) describe anger as a goal-directed response to social threats or frustrations, requiring cognitive appraisal of intent and fairness [59]. Stemmler et al. (2001) further showed that physiological responses to anger differ based on situational attributions like control and blame. High EI individuals, better at integrating these social and moral cues, are thus more accurate in interpreting anger as a context-dependent emotional signal rather than a mere expression of hostility [60].
Sadness, often tied to loss or empathic concern, is typically expressed more subtly, requiring emotional attunement and perspective-taking for accurate recognition. Ridley et al. (2025) found that individuals with higher empathy—which closely aligns with EI—are more responsive to displays of sadness, even attributing greater trust to sad individuals [61]. Qadeer et al. (2025) identified key empathy-related brain areas—such as the anterior insula and anterior cingulate cortex—as active during sadness perception, suggesting that high EI individuals engage these neural systems to interpret sadness more precisely [62].
Fear showed a contrasting trend. Prediction accuracy was higher in the low EI group, whose results were tightly clustered along the arousal axis. The high EI group’s predictions were more varied across both valence and arousal, indicating a broader interpretation range. This reflects fear’s dual nature—as both an automatic survival response and a socially modulated emotion. LeDoux’s dual-route model explains this with a fast amygdala-based pathway and a slower, cognitive prefrontal route [63]. Pessoa’s network model supports this further [26], proposing that high EI individuals recruit distributed neural networks for more nuanced evaluation of emotional meaning.
In sum, anger and sadness are more accurately recognized by individuals with high EI, due to their strengths in empathy, contextual reasoning, and emotion regulation. Fear, while also complex, may be more readily recognized by low EI individuals through rapid, arousal-based processing. These findings illustrate how EI shapes the way individuals perceive and respond to negative emotions, depending on the cognitive and neural demands of each affective state.

6.4. Happiness, Contentment

Happiness and contentment are emotions classified under high valence levels, and both showed statistically significant differences in mean error between actual and predicted values in only a few models. However, the statistical analysis of mean distance revealed different patterns. For happiness, the high EI group had a significantly smaller mean distance than the low EI group. In contrast, for contentment, no statistically significant group difference was observed, and their mean log and peak densities were also similar.
Happiness is characterized by distinct facial muscle movements, such as upward-curving lips and slight drooping of the eyebrows and outer corners of the eyes. As the only positive emotion among Ekman’s six basic emotions [47,52,64], its clear visual features make it easily recognizable and expressible. Consequently, deep learning models predicted happiness with high accuracy across EI levels.
However, happiness is not solely determined by visible features like smiling. Contextual cues and eye muscle involvement often differentiate genuine from fake smiles [65,66]. This suggests that accurate recognition of happiness still involves social and emotional interpretation. In our results, although models generally performed well for happiness, the high EI group showed more tightly clustered predictions and smaller mean distances, indicating enhanced recognition and expression. This supports the idea that higher EI contributes to more accurate emotional interpretation, particularly for positive emotions in social contexts [65,66].
In contrast, for contentment, only the arousal dimension showed a statistically significant difference, and this was limited to the EfficientNetV2-S model. As illustrated in Figure 8, contentment was distributed within a narrow arousal range, making the statistical results sensitive to minor variations [67]. Given this constrained distribution, it is difficult to draw definitive conclusions regarding EI-related differences in recognition performance.
This limitation may be partly due to the underrepresentation of contentment in the training dataset, as well as inconsistencies in how the emotion is defined across different sources. While AffectNet conceptualizes contentment as a low-arousal state characterized by relaxed facial features such as closed eyes and a neutral mouth [36], other studies describe it as a calm yet positive emotional state located in a region of high valence and moderate relaxed [6,13,46]. Russell’s circumplex model further illustrates variability in the positioning of low-arousal positive emotions like contentment, often overlapping with relaxation or happiness [11].
Previous research has also emphasized that emotion concepts such as contentment are embedded in folk psychological frameworks and are subject to variation across individuals, languages, and cultures [6,19]. These definitional inconsistencies complicate the operationalization of contentment in facial expression datasets and hinder the ability of models to distinguish it from similar emotions like happiness.
Overall, the conceptual ambiguity surrounding contentment may have contributed both to its frequent misclassification and to the lack of statistically significant group-level differences based on emotional intelligence. These findings support the view that contentment, unlike basic emotions, is a more nuanced and culturally shaped emotional state that presents challenges for standardized recognition and computational modeling.
Therefore, it is difficult to draw definitive conclusions regarding the impact of EI on the accuracy of contentment recognition. Among positive valence emotions, happiness appears to be the emotion that exhibits a significant relationship between EI level and emotion recognition accuracy.

7. Conclusions

This study examined how emotional intelligence (EI) influences facial expression recognition (FER), using a composite EI score derived from the Tromsø Social Intelligence Scale and two performance-based tasks. Participants with higher EI demonstrated greater accuracy in recognizing expressions, particularly those requiring contextual understanding such as anger, sadness, and happiness. Interestingly, participants with lower EI performed better in recognizing fear. This may reflect the automatic nature of fear processing, which is closely tied to rapid amygdala responses. Higher-EI individuals may regulate or suppress fear-related cues, whereas lower-EI individuals may exhibit more immediate emotional reactions, leading to greater sensitivity to fear expressions. Fear, anger, and sadness were especially sensitive to EI differences, with happiness serving as a useful supplementary marker. These findings suggest that EI affects not only the outcome of emotion recognition but also the underlying processing strategies. From an application perspective, training emotion recognition models with greater emphasis on these key emotions—especially from individuals with high EI—could improve robustness, particularly when data are limited. The contentment was often misclassified as happiness, likely due to its absence in the AffectNet dataset and the subtle facial distinction between the two. This misclassification underscores the limitations of current FER systems in handling nuanced emotions and highlights the need for a broader emotional taxonomy.
Despite its contributions, this study has several limitations. First, the use of a mobile application-based experimental design allowed for naturalistic data collection but limited experimental control. Environmental variables such as lighting and pose variation may have introduced noise into the facial data. Second, the sample consisted of only 34 Korean adults, limiting the generalizability of the results and potentially introducing cultural bias. Additionally, the estimation of contentment’s emotional coordinates based on external sources may have influenced the model’s interpretability for this emotion. Third, EI was measured using a composite score derived from selected TSIS items and task performance, which may not fully capture the multidimensional structure of EI as defined in the standardized framework. Future research should incorporate standardized EI instruments, multimodal affective data, and more controlled experimental conditions to reduce environmental noise during data collection. Expanding the study population to include diverse racial and cultural groups will also be crucial for validating the consistency and generalizability of the findings. Moreover, utilizing diverse datasets and refining emotion labels—particularly to better capture non-aroused emotional states such as contentment—will contribute to the development of more robust and context-aware FER systems.

Author Contributions

Conceptualization, A.C. and M.W.; methodology, A.C.; software, H.L.; validation, Y.K. and A.C.; investigation, Y.K.; data curation, Y.K. and H.L.; writing—original draft preparation, A.C.; writing—review and editing, M.W.; visualization, Y.K.; supervision, M.W.; project administration, A.C. All authors have read and agreed to the published version of the manuscript.

Funding

This work was supported by an Electronics and Telecommunications Research Institute (ETRI) grant funded by the Korean government [25ZB1100, Core Technology Research for Self-Improving Integrated Artificial Intelligence System].

Data Availability Statement

The datasets presented in this article are not available because we jointly own the data with our partner organization, ETRI.

Conflicts of Interest

The authors declare no conflicts of interest. The funders had no role in the design of the study; in the collection, analyses, or interpretation of data; in the writing of the manuscript; or in the decision to publish the results.

References

  1. Sajjad, M.; Ullah, F.U.M.; Ullah, M.; Christodoulou, G.; Cheikh, F.A.; Hijji, M.; Muhammad, K.; Rodrigues, J.J.P.C. A comprehensive survey on deep facial expression recognition: Challenges, applications, and future guidelines. Alex. Eng. J. 2023, 68, 817–840. [Google Scholar] [CrossRef]
  2. Kopalidis, T.; Solachidis, V.; Vretos, N.; Daras, P. Advances in facial expression recognition: A survey of methods, benchmarks, models, and datasets. Information 2024, 15, 135. [Google Scholar] [CrossRef]
  3. Wen, Z.; Lin, W.; Wang, T.; Xu, G. Distract Your Attention: Multi-Head Cross Attention Network for Facial Expression Recognition. Biomimetics 2023, 8, 199. [Google Scholar] [CrossRef] [PubMed]
  4. Mao, J.; Xu, R.; Yin, X.; Chang, Y.; Nie, B.; Huang, A.; Wang, Y. POSTER++: A Simpler and Stronger Facial Expression Recognition Network. Pattern Recognit. 2025, 157, 110951. [Google Scholar] [CrossRef]
  5. Barrett, L.F. Are emotions natural kinds? Perspect. Psychol. Sci. 2006, 1, 28–58. [Google Scholar] [CrossRef]
  6. Scherer, K.R. What are emotions? And how can they be measured? Soc. Sci. Inf. 2005, 44, 695–729. [Google Scholar] [CrossRef]
  7. Frijda, N.H.; Kuipers, P.; ter Schure, E. Relations among emotion, appraisal, and emotional action readiness. J. Pers. Soc. Psychol. 1989, 57, 212–228. [Google Scholar] [CrossRef]
  8. Shuman, V.; Sander, D.; Scherer, K.R. Levels of valence: The nature of pleasure and displeasure in emotion. Front. Psychol. 2013, 4, 261. [Google Scholar] [CrossRef]
  9. Barrett, L.F. Valence is a basic building block of emotional life. J. Res. Pers. 2006, 40, 35–55. [Google Scholar] [CrossRef]
  10. Cabanac, M. What is emotion? Behav. Process. 2002, 60, 69–83. [Google Scholar] [CrossRef]
  11. Russell, J.A. A circumplex model of affect. J. Pers. Soc. Psychol. 1980, 39, 1161–1178. [Google Scholar] [CrossRef]
  12. Le, N.; Nguyen, K.; Tran, Q.; Tjiputra, E.; Le, B.; Nguyen, A. Uncertainty-Aware Label Distribution Learning for Facial Expression Recognition. In Proceedings of the IEEE Winter Conference on Applications of Computer Vision (WACV), Waikoloa, HI, USA, 2–7 January 2023; pp. 1–10. [Google Scholar]
  13. Hwooi, S.K.W.; Othmani, A.; Sabri, A.Q.M. Deep learning-based approach for continuous affect prediction from facial expression images in valence-arousal space. IEEE Access 2022, 10, 96053–96066. [Google Scholar] [CrossRef]
  14. Bobicev, V.; Sokolova, M. Inter-Annotator Agreement in Sentiment Analysis: Machine Learning Perspective. In Proceedings of the Recent Advances in Natural Language Processing (RANLP), Varna, Bulgaria, 4–6 September 2017; pp. 97–102. [Google Scholar]
  15. Stoewen, D.L. The vital connection between emotional intelligence and well-being—Part 1: Understanding emotional intelligence and why it matters. Can. Vet. J. 2024, 65, 182–183. [Google Scholar] [PubMed]
  16. Kihlstrom, J.F.; Cantor, N. Social intelligence. In Handbook of Intelligence, 2nd ed.; Sternberg, R.J., Ed.; Cambridge University Press: Cambridge, UK, 2000; pp. 359–379. [Google Scholar]
  17. Parkinson, B. Emotions are social. Br. J. Psychol. 1996, 87, 663–683. [Google Scholar] [CrossRef]
  18. van Kleef, G.A.; Cheshin, A.; Fischer, A.H.; Schneider, I.K. Editorial: The social nature of emotions. Front. Psychol. 2016, 7, 896. [Google Scholar] [CrossRef]
  19. DeBusk, B.C.; Austin, E.J. Emotional intelligence and social perception. Pers. Individ. Dif. 2011, 51, 877–882. [Google Scholar] [CrossRef]
  20. Elfenbein, H.A.; Foo, M.D.; Boldry, J.G.; Tan, H.H. Emotional intelligence and the recognition of emotion from facial expressions. In Emotional Intelligence in Everyday Life, 2nd ed.; Ciarrochi, J., Forgas, J.P., Mayer, J.D., Eds.; Psychology Press: New York, NY, USA, 2006; pp. 111–122. [Google Scholar]
  21. Swain, R.H.; O’Hare, A.J.; Brandley, K.; Gardner, A.T. Individual differences in social intelligence and perception of emotion expression of masked and unmasked faces. Cogn. Res. Princ. Implic. 2022, 7, 54. [Google Scholar] [CrossRef]
  22. Salovey, P.; Mayer, J.D. Emotional intelligence. Imagin. Cogn. Pers. 1990, 9, 185–211. [Google Scholar] [CrossRef]
  23. Punia, N.; Dutta, J.; Sharma, Y. Emotional Intelligence: A Theoretical Framework. Int. J. Sci. Eng. Res. 2015, 6, 967–975. [Google Scholar]
  24. Adolphs, R. Recognizing emotion from facial expressions: Psychological and neurological mechanisms. Behav. Cogn. Neurosci. Rev. 2002, 1, 21–62. [Google Scholar] [CrossRef]
  25. Kober, H.; Barrett, L.F.; Joseph, J.; Bliss-Moreau, E.; Lindquist, K.; Wager, T.D. Functional grouping and cortical–subcortical interactions in emotion: A meta-analysis of neuroimaging studies. NeuroImage 2008, 42, 998–1031. [Google Scholar] [CrossRef] [PubMed]
  26. Pessoa, L. A network model of the emotional brain. Trends Cogn. Sci. 2017, 21, 357–371. [Google Scholar] [CrossRef] [PubMed]
  27. Bar-On, R.; Tranel, D.; Denburg, N.L.; Bechara, A. Exploring the neurological substrate of emotional and social intelligence. Brain 2003, 126, 1790–1800. [Google Scholar] [CrossRef]
  28. Lamm, C.; Singer, T. The role of anterior insular cortex in social emotions. Brain Struct. Funct. 2010, 214, 579–591. [Google Scholar] [CrossRef]
  29. Adolphs, R.; Baron-Cohen, S.; Tranel, D. Impaired recognition of social emotions following amygdala damage. J. Cogn. Neurosci. 2002, 14, 1264–1274. [Google Scholar] [CrossRef]
  30. Pundlik, A.; Verma, S.; Dhingra, K. Neural Pathways Involved in Emotional Regulation and Emotional Intelligence. J. Knowl. Learn. Sci. Technol. 2024, 3, 165–172. [Google Scholar] [CrossRef]
  31. Silvera, D.; Martinussen, M.; Dahl, T.I. The Tromsø Social Intelligence Scale, a self-report measure of social intelligence. Scand. J. Psychol. 2001, 42, 313–319. [Google Scholar] [CrossRef]
  32. Crowne, K.A. The relationships among social intelligence, emotional intelligence and cultural intelligence. Organ. Manag. J. 2009, 6, 148–163. [Google Scholar] [CrossRef]
  33. Tan, M.; Le, Q. EfficientNetV2: Smaller models and faster training. In Proceedings of the International Conference on Machine Learning (ICML), Virtual Event, 18–24 July 2021; pp. 10096–10106. [Google Scholar]
  34. Tu, Z.; Talebi, H.; Zhang, H.; Yang, F.; Milanfar, P.; Bovik, A.; Li, Y. MaxViT: Multi-axis vision transformer. In Proceedings of the European Conference on Computer Vision (ECCV), Tel Aviv, Israel, 23–27 October 2022; pp. 459–479. [Google Scholar]
  35. Simonyan, K.; Zisserman, A. Very deep convolutional networks for large-scale image recognition. arXiv 2014, arXiv:1409.1556. [Google Scholar]
  36. Mollahosseini, A.; Hasani, B.; Mahoor, M.H. AffectNet: A database for facial expression, valence, and arousal computing in the wild. IEEE Trans. Affect. Comput. 2017, 10, 18–31. [Google Scholar] [CrossRef]
  37. Liu, C.; Hirota, K.; Dai, Y. Patch attention convolutional vision transformer for facial expression recognition with occlusion. Inf. Sci. 2022, 619, 781–794. [Google Scholar] [CrossRef]
  38. Chang, W.-Y.; Hsu, S.-H.; Chien, J.-H. FATAUVA-Net: An integrated deep learning framework for facial attribute recognition, action unit detection, and valence-arousal estimation. In Proceedings of the 2020 IEEE International Conference on Image Processing (ICIP), Abu Dhabi, United Arab Emirates, 25–28 October 2020. [Google Scholar]
  39. Wagner, N.; Mätzler, F.; Vossberg, S.R.; Schneider, H.; Pavlitska, S.; Zöllner, J.M. CAGE: Circumplex affect guided expression inference. In Proceedings of the IEEE/CVF Conference on Computer Vision and Pattern Recognition (CVPR), Seattle, WA, USA, 17–21 June 2024; pp. 4683–4692. [Google Scholar]
  40. Soleymani, M.; Pantic, M.; Pun, T. Multimodal emotion recognition in response to videos. IEEE Trans. Affect. Comput. 2011, 3, 211–223. [Google Scholar] [CrossRef]
  41. Kollias, D.; Tzirakis, P.; Baird, A.; Cowen, A.; Zafeiriou, S. ABAW: Valence-arousal estimation, expression recognition, action unit detection & emotional reaction intensity estimation challenges. In Proceedings of the IEEE/CVF Conference on Computer Vision and Pattern Recognition (CVPR), Vancouver, BC, Canada, 18–22 June 2023; pp. 5889–5898. [Google Scholar]
  42. Ouzar, Y.; Bousefsaf, F.; Djeldjli, D.; Maaoui, C. Video-based multimodal spontaneous emotion recognition using facial expressions and physiological signals. In Proceedings of the IEEE/CVF Conference on Computer Vision and Pattern Recognition (CVPR), New Orleans, LA, USA, 19–24 June 2022; pp. 2460–2469. [Google Scholar]
  43. Deng, J.; Dong, W.; Socher, R.; Li, L.J.; Li, K.; Fei-Fei, L. ImageNet: A large-scale hierarchical image database. In Proceedings of the IEEE Conference on Computer Vision and Pattern Recognition (CVPR), Miami, FL, USA, 20–25 June 2009; pp. 248–255. [Google Scholar]
  44. Social EQ. Available online: https://play.google.com/store/apps/details?id=com.esrc.socialeq.android&hl=ko (accessed on 13 March 2025).
  45. Russell, J.A. Reading Emotions from and into Faces: Resurrecting a Dimensional-Contextual Perspective; Cambridge University Press: Cambridge, UK, 1997. [Google Scholar]
  46. Russell, J.A.; Barrett, L.F. Core affect, prototypical emotional episodes, and other things called emotion: Dissecting the elephant. J. Pers. Soc. Psychol. 1999, 76, 805–819. [Google Scholar] [CrossRef] [PubMed]
  47. Ortony, A. Are all “basic emotions” emotions? A problem for the (basic) emotions construct. Perspect. Psychol. Sci. 2022, 17, 41–61. [Google Scholar] [CrossRef]
  48. Elfenbein, H.A.; Marsh, A.A.; Ambady, N. Emotional intelligence and the recognition of emotion from facial expressions. In The Social Psychology of Emotional and Behavioral Problems: Interfaces of Social and Clinical Psychology; Snyder, C.R., Ed.; Guilford Press: New York, NY, USA, 2005; pp. 53–73. [Google Scholar]
  49. Mayer, J.D.; Caruso, D.R.; Sitarenios, G.; Escobar, M.R. How many emotional intelligence abilities are there? An examination of four measures of emotional intelligence. Pers. Individ. Dif. 2024, 219, 112468. [Google Scholar] [CrossRef]
  50. Carrera-Levillain, P.; Fernandez-Dols, J.M. Neutral faces in context: Their emotional meaning and their function. J. Nonverbal Behav. 1994, 18, 281–299. [Google Scholar] [CrossRef]
  51. Said, C.P.; Sebe, N.; Todorov, A. Structural resemblance to emotional expressions predicts evaluation of emotionally neutral faces. Emotion 2009, 9, 260–265. [Google Scholar] [CrossRef]
  52. Ekman, P.; Friesen, W.V. Facial Action Coding System; Environmental Psychology & Nonverbal Behavior: Palo Alto, CA, USA, 1978. [Google Scholar]
  53. Meyer, W.U.; Niepel, M.; Rudolph, U.; Schützwohl, A. An experimental analysis of surprise. Cogn. Emot. 1991, 5, 295–311. [Google Scholar] [CrossRef]
  54. Reisenzein, R.; Horstmann, G.; Schützwohl, A. The cognitive-evolutionary model of surprise: A review of the evidence. Top. Cogn. Sci. 2019, 11, 50–74. [Google Scholar] [CrossRef]
  55. Moretti, L.; Di Pellegrino, G. Disgust selectively modulates reciprocal fairness in economic interactions. Emotion 2010, 10, 169–173. [Google Scholar] [CrossRef]
  56. da Silva, T.M.H.R.; Hammett, R.; Low, G. Emotional Intelligence in Business: Enhancing Leadership, Collaboration, and Performance. In Building Business Knowledge for Complex Modern Business Environments; IGI Global: Hershey, PA, USA, 2025; pp. 149–178. [Google Scholar]
  57. Marinova, S.; Anand, S.; Park, H. Other-oriented emotional intelligence, OCBs, and job performance: A relational perspective. J. Soc. Psychol. 2025, 165, 270–289. [Google Scholar] [CrossRef] [PubMed]
  58. Watanabe, W.C.; Shafiq, M.; Nawaz, M.J.; Saleem, I.; Nazeer, S. The impact of emotional intelligence on project success: Mediating role of team cohesiveness and moderating role of organizational culture. Int. J. Eng. Bus. Manag. 2024, 16, 18479790241232508. [Google Scholar] [CrossRef]
  59. Peléšková, Š.; Polák, J.; Janovcová, M.; Chomik, A.; Sedláčková, K.; Frynta, D.; Landová, E. Human emotional evaluation of ancestral and modern threats: Fear, disgust, and anger. Front. Psychol. 2024, 14, 1321053. [Google Scholar] [CrossRef] [PubMed]
  60. Stemmler, G.; Heldmann, M.; Pauls, C.A.; Scherer, T. Constraints for emotion specificity in fear and anger: The context counts. Psychophysiology 2001, 38, 275–291. [Google Scholar] [CrossRef]
  61. Ridley, C.A.; Maass, J.K.; Randell, J.A. Empathy unveiled: Exploring the mediating role of empathy in the sad eyewitness effect. J. Sci. Psychol. 2025, 20, 7–20. [Google Scholar]
  62. Qadeer, A.; Amin, A.; Aziz, A.; Aurangzaib, S.; Muzaffar, S.; Batool, R.; Rahman, A.U. Neuroscience of empathy: Bridging neurophysiology and organizational well-being. Dialogue Soc. Sci. Rev. 2025, 3, 55–68. [Google Scholar]
  63. LeDoux, J. The emotional brain, fear, and the amygdala. Cell. Mol. Neurobiol. 2003, 23, 727–738. [Google Scholar] [CrossRef]
  64. Ekman, P. An argument for basic emotions. Cogn. Emot. 1992, 6, 169–200. [Google Scholar] [CrossRef]
  65. Ekman, P.; Davidson, R.J.; Friesen, W.V. The Duchenne smile: Emotional expression and brain physiology: II. J. Pers. Soc. Psychol. 1990, 58, 342–353. [Google Scholar] [CrossRef]
  66. Maringer, M.; Krumhuber, E.G.; Fischer, A.H.; Niedenthal, P.M. Beyond smile dynamics: Mimicry and beliefs in judgments of smiles. Emotion 2011, 11, 181–187. [Google Scholar] [CrossRef]
  67. Kim, T.K. T test as a parametric statistic. Korean J. Anesthesiol. 2015, 68, 540–546. [Google Scholar] [CrossRef]
Figure 1. Box plots showing the valence and arousal distributions for each emotion category in the AffectNet-8 training dataset.
Electronics 14 01525 g001
Figure 2. Representative facial images for the eight emotion categories analyzed in this study.
Electronics 14 01525 g002
Figure 3. Overview of the experimental procedure and model-based emotion recognition pipeline.
Electronics 14 01525 g003
Figure 4. Emotional Intelligence Scores by EI Level. The differences in mean scores for each factor are presented with error bars representing standard errors. Statistical significance levels are indicated as (** p < 0.010, *** p < 0.001).
Electronics 14 01525 g004
Figure 5. Distribution of Prediction Results for the Test Dataset. The EI level graph illustrates the distribution of predictions across emotional intelligence groups, while the Emotion graph presents the results categorized by emotion labels.
Electronics 14 01525 g005
Figure 6. Scatter Plots of Predicted Valence–Arousal Coordinates by Emotion and EI Level.
Electronics 14 01525 g006
Figure 7. KDE-Based Plot of Predicted Valence–Arousal Distributions by Emotion and EI Level.
Electronics 14 01525 g007
Figure 8. Predicted Results by Emotional Intelligence Group for Emotions with Statistically Significant Differences in Mean Error.
Electronics 14 01525 g008
Table 1. Comparison of Performance Metrics Between AffectNet, CAGE, and This Study’s Emotion Recognition Results.
WorkAffectNetCAGEThis Work
LevelValenceArousalTotal 1Total 1ValenceArousal
MAE--0.2390.235--
MSE--0.1030.1020.0970.171
RMSE0.370.410.3210.3200.2250.299
CCC0.600.340.7820.7840.7800.495
Corr0.660.54--0.8070.565
SAGR0.740.65--0.7590.781
1 “Total” represents the mean performance metric across valence and arousal.
Table 2. Mean Performance Metrics and Independent Test Results by EI Level for Each Model.
Model 1GroupMSERMSECCCCorrSAGR
MeanSDUzp 2rMeanSDUzp 2r
Valence + ArousalLLow0.1330.14810,6382.1430.0320.180.2680.18810,7042.2450.0250.190.6620.72075.7
High0.1150.1560.2290.2070.7370.76080.1
SLow0.1440.15810,5181.9580.0500.170.2810.19210,5221.9640.0500.170.6340.68974.6
High0.1270.1700.2460.2140.7200.73780.9
BLow0.1440.14910,7632.3360.0200.200.2900.18710,7752.3540.0190.200.6150.69373.5
High0.1210.1550.2430.2080.7090.74680.5
TLow0.1420.15810,3161.6460.1000.140.2830.19510,3271.6630.0960.140.6310.69574.6
High0.1240.1550.2480.2060.7120.74080.9
VLow0.1480.15810,6432.1510.0320.180.2880.19710,5630.2100.0430.180.6160.68070.6
High0.1260.1620.2470.2100.7020.73778.3
ValenceLLow0.1020.19810,7512.3170.0210.200.2320.22110,7512.3170.0210.200.7590.80474.3
High0.0680.1450.1790.1890.8620.86980.1
SLow0.1090.21410,2961.6160.1060.140.2410.22610,2961.6160.1060.140.7460.78173.5
High0.0760.1420.1990.1910.8490.85080.1
BLow0.1210.21410,8182.4200.0160.210.2630.22910,8182.4200.0160.210.7030.75571.3
High0.0830.1530.2060.2020.8210.83678.7
TLow0.1200.22410,5281.9730.0480.170.2560.23410,5281.9730.0480.170.7080.75673.5
High0.0850.1680.2080.2060.8170.83177.9
VLow0.1210.21610,6292.1290.0330.180.2600.23210,6292.1290.0330.180.7100.75070.6
High0.0820.1560.2080.1980.8260.83678.7
ArousalLLow0.1630.20710,2141.4890.1360.130.3040.26710,2141.4890.1360.130.5030.57777.2
High0.1630.2340.2780.2940.5350.57780.1
SLow0.1790.21910,1271.3550.1750.120.3200.32010,1271.3550.1750.120.4590.53475.7
High0.1770.2610.2940.2940.5150.55181.6
BLow0.1790.21999911.1450.2520.100.3160.25999911.1450.2520.100.4570.57075.7
High0.1770.2610.2790.2870.5180.58682.4
TLow0.1640.20398390.9110.3620.080.3090.26398390.9110.3620.080.4850.56875.7
High0.1620.2230.2870.2830.5320.57983.8
VLow0.1740.21299471.0780.2810.090.3160.27499471.0780.2810.090.4470.54070.6
High0.1690.2430.2850.2980.4980.56677.9
1 Models are abbreviated as follows: L = EfficientNetV2-L, S = EfficientNetV2-S, B = MaxViT-B, T = MaxViT-T, V = VGG16. 2 Bold indicates statistically significant differences (p < 0.05).
Table 3. Mean Distance Between Predicted Coordinates and True Values for Each Emotion by Emotional Intelligence Level and Results of Independent Tests.
Title EmotionGroupMeanSDtdfpCohen’s d
Entire modelNeutralLow0.1910.1152.9001680.0040.45
High0.1480.072
SurpriseLow0.2080.2003.4231680.0010.53
High0.1240.103
DisgustLow0.4980.2812.5891680.0110.40
High0.3970.225
FearLow0.5240.208−4.8501680.0000.75
High0.7140.288
AngerLow0.6710.2604.6031680.0000.71
High0.4570.337
SadnessLow0.4630.2354.1531680.0000.64
High0.3170.218
HappinessLow0.2150.2024.3031680.0000.66
High0.1040.120
ContentmentLow0.7830.0920.4721680.6380.07
High0.7760.102
Valid modelFearLow0.5240.208−4.8501680.0000.75
High0.7120.288
AngerLow0.6850.2643.7181000.0000.74
High0.4550.350
SadnessLow0.4600.2354.0021340.0000.69
High0.3040.213
HappinessLow0.2200.1952.885660.0050.71
High0.1060.119
ContentmentLow0.7790.1020.867320.3920.31
High0.7540.070
Bold indicates statistically significant differences (p < 0.05).
Table 4. Summary of statistical comparisons of prediction errors between high and low EI groups across models and emotion categories.
Model 1Group 2Valence + ArousalValenceArousal
MSERMSEMSERMSEMSERMSE
LLowFear *
t(32) = 2.289,
p = 0.029,
d = 0.78
Fear *
t(32) = 2.334,
p = 0.026,
d = 0.80
HighAnger *
U = 204,
z = 2.049,
p = 0.041,
r = 0.50
Anger *
U = 215,
z = 2.428,
p = 0.014,
r = 0.59
Sadness *
t(32) = −2.107,
p = 0.043,
d = 0.73
Anger *
U = 202,
z = 1.981,
p = 0.049,
r = 0.48
Anger *
U = 202,
z = 1.981,
p = 0.049,
r = 0.48
SLowFear *
t(24.202) = 2.759,
p = 0.011,
d = 0.95
Fear **
t(24.202) = 2.848,
p = 0.009,
d = 0.97
Fear **
U = 66,
z = −2.704,
p = 0.006,
r = 0.66
Fear **
t(24.011) = 3.098,
p = 0.005,
d = 1.06
Fear *
t(32) = 2.097,
p = 0.044,
d = 0.72
HighSadness *
U = 121,
z = 2.325,
p = 0.020,
r = 0.56
Sadness *
t(32) = −2.464,
p = 0.019,
d = 0.85
Sadness *
U = 205,
z = 2.084,
p = 0.038,
r = 0.51
Sadness *
U = 205,
z = 2.084,
p = 0.038,
r = 0.51
Sadness *
U = 206,
z = 2.118,
p = 0.034,
r = 0.51
Sadness *
U = 206,
z = 2.118,
p = 0.034,
r = 0.51
Anger *
U = 204,
z = 2.049,
p = 0.041,
r = 0.50
Contentment *
t(32) = −2.207,
p = 0.035,
d = 0.75
Contentment *
t(32) = −2.195,
p = 0.036,
d = 0.78
BLowFear *
t(24.502) = 2.447,
p = 0.022,
d = 0.84
Fear *
t(21.880) = 2.366,
p = 0.027,
d = 0.81
Fear *
U = 86,
z = −2.015,
p = 0.045,
r = 0.49
Fear *
U = 86,
z = −2.015,
p = 0.045,
r = 0.49
HighSadness *
U = 206,
z = 2.118,
p = 0.034,
r = 0.51
Sadness *
t(32) = −2.499,
p = 0.018,
d = 0.85
Sadness *
U = 211,
z = 2.290,
p = 0.022,
r = 0.56
Sadness *
U = 211,
z = 2.290,
p = 0.022,
r = 0.56
Happiness *
U = 213,
z = 2.359,
p = 0.018,
r = 0.57
Happiness *
U = 213,
z = 2.359,
p = 0.018,
r = 0.57
TLowFear *
t(32) = 2.188,
p = 0.036,
d = 0.75
Fear *
t(24.776) = 2.160,
p = 0.041,
d = 0.74
Fear *
U = 77,
z = −2.325,
p = 0.020,
r = 0.564
Fear *
U = 77,
z = −2.325,
p = 0.020,
r = 0.564
High
VLowFear *
U = 82,
z = −2.153,
p = 0.031,
r = 0.52
Fear **
t(32) = 2.767,
p = 0.009,
d = 0.95
Fear *
U = 83,
z = −2.118,
p = 0.034,
r = 0.51
Fear *
t(32) = 2.412,
p = 0.022,
d = 0.83
HighHappiness *
U = 202,
z = 1.981,
p = 0.049,
r = 0.48
Sadness *
U = 204,
z = 2.049,
p = 0.041,
r = 0.50
Happiness *
U = 218,
z = 2.532,
p = 0.011,
r = 0.61
Happiness *
U = 218,
z = 2.532,
p = 0.011,
r = 0.61
Sadness *
U = 217,
z = 2.497,
p = 0.012,
r = 0.43
Sadness *
t(32) = −2.678,
p = 0.012,
d = 0.92
Anger *
t(32) = −2.161,
p = 0.038,
d = 0.74
1 Models are abbreviated as follows: L = EfficientNetV2-L, S = EfficientNetV2-S, B = MaxViT-B, T = MaxViT-T, V = VGG16. 2 The “Group” column indicates which group had lower prediction errors for each emotion. Asterisks denote significance levels (* p  < 0.05; ** p  <  0.01).
Disclaimer/Publisher’s Note: The statements, opinions and data contained in all publications are solely those of the individual author(s) and contributor(s) and not of MDPI and/or the editor(s). MDPI and/or the editor(s) disclaim responsibility for any injury to people or property resulting from any ideas, methods, instructions or products referred to in the content.

