Article

Adaptive Double-Diode Modeling for Comparative Analysis of Healthy and Microcracked PV Modules

1
Faculty of Mechanical Engineering, Computing and Electrical Engineering, University of Mostar, Matice Hrvatske b.b., 88 000 Mostar, Bosnia and Herzegovina
2
Faculty of Electrical Engineering, Mechanical Engineering and Naval Architecture, University of Split, R. Boškovića 32, 21 000 Split, Croatia
*
Author to whom correspondence should be addressed.
Electronics 2025, 14(8), 1559; https://doi.org/10.3390/electronics14081559
Submission received: 17 March 2025 / Revised: 8 April 2025 / Accepted: 9 April 2025 / Published: 11 April 2025

Abstract

:
Photovoltaic (PV) systems are pivotal to renewable energy generation, yet their efficiency and reliability are often compromised by operational faults and environmental variability. Accurate modeling of PV module behavior under diverse conditions is critical for forecasting energy yields and diagnosing performance anomalies. However, detecting subtle defects such as microcracks in operational modules remains challenging due to minimal observable differences between healthy and compromised systems. This study introduces an adaptive strategy to model the electrical characteristics of PV modules under dynamic operating conditions. Central to this approach is the extraction of key parameters, notably series resistance and shunt resistance, which act as diagnostic indicators of module health. Leveraging the seven-parameter double-diode model (DDM), we analyzed both functional and faulty modules to isolate deviations in their electrical signatures. By correlating these parameter shifts with specific defects, the proposed framework enables rapid, non-invasive health assessments of PV installations. This research aimed to establish a robust system for proactive maintenance, optimizing energy output and prolonging module lifespan. Such advancements hold significant potential for enhancing the sustainability and cost-effectiveness of solar energy systems, driving progress toward global renewable energy goals.

1. Introduction

Over the previous decade, the installation and usage of photovoltaic systems had exploded, and this trend is expected to continue in the coming years. Photovoltaic energy will surely become a key technology for renewable energy generation; however, its performance is significantly impacted by several factors, particularly microcracks and faults in solar cells. Microcracks in photovoltaic cells in modules can develop during manufacturing, transportation, or installation processes, negatively impacting the electrical behavior of the affected cells and the overall PV modules. Once microcracks in PV cells occur, the cell becomes an electrically isolated region and cannot contribute to current generation in PV modules. The flow path of the current through the cell’s metallization grid is disrupted, and electrons encounter higher resistance as they navigate around the cracks, reducing the fill factor (FF) and power output. Microcracks in PV cells can also create unwanted conductive paths for the current, which can substantially lower the value of shunt resistance in PV modules and enable leakage currents. Despite their potential to cause substantial degradation in PV modules, their presence is often solely identified by specialized detection methods. By the time the effect of reduced power output gets noticed, significant damage may have already occurred within the PV module. Accurate modeling of PV modules is essential for predicting their energy output, optimizing system designs, and diagnosing faults. There are two commonly used methods for fault diagnosis in PV modules: electroluminescence imaging (EL) and current-voltage (I-V) curve extraction. EL imaging is a standard method in manufacturing processes that provides visual evidence of PV cell level damage. EL imaging does not provide electrical performance metrics and is limited to special testing conditions such as dark environments. On the other hand, the I-V curve extraction procedure is more flexible since it can identify electrical faults, quantify loss of power output due to defects, and be applied to real operating conditions in the field. The double-diode model (DDM) is used as a modeling procedure to represent the electrical behavior of PV modules through I-V curve fitting. The DDM includes two diodes to represent charge carrier recombination and additional recombination losses in PV modules. Parameters such as series resistance ( R s ), shunt resistance ( R s h   ), diode ideality factors ( A 1   , A 2   ), and reverse saturation currents ( I r s 1   , I r s 2   ) can be related to the physical properties of the solar cell. However, there has been limited research directly comparing double-diode model parameters of healthy PV modules to those with microcracks. Furthermore, the impact of microcracks on these parameters’ dependence on irradiance and temperature is not well understood. Experimental validation is needed to confirm the accuracy of the double-diode model in representing the electrical behavior of faulty PV modules. To fill this gap, this research work presents a novel iterative algorithm for extracting DDM parameters from I-V curve measurements. The results will provide insights into the electrical signatures of microcracks in PV modules and demonstrate the efficacy of double-diode models in representing faulty PV behavior. This knowledge can aid in the diagnosing microcracks and optimizing PV system performance.
The major contributions of this paper are as follows:
  • The development of an iterative algorithm to extract DDM parameters for PV modules;
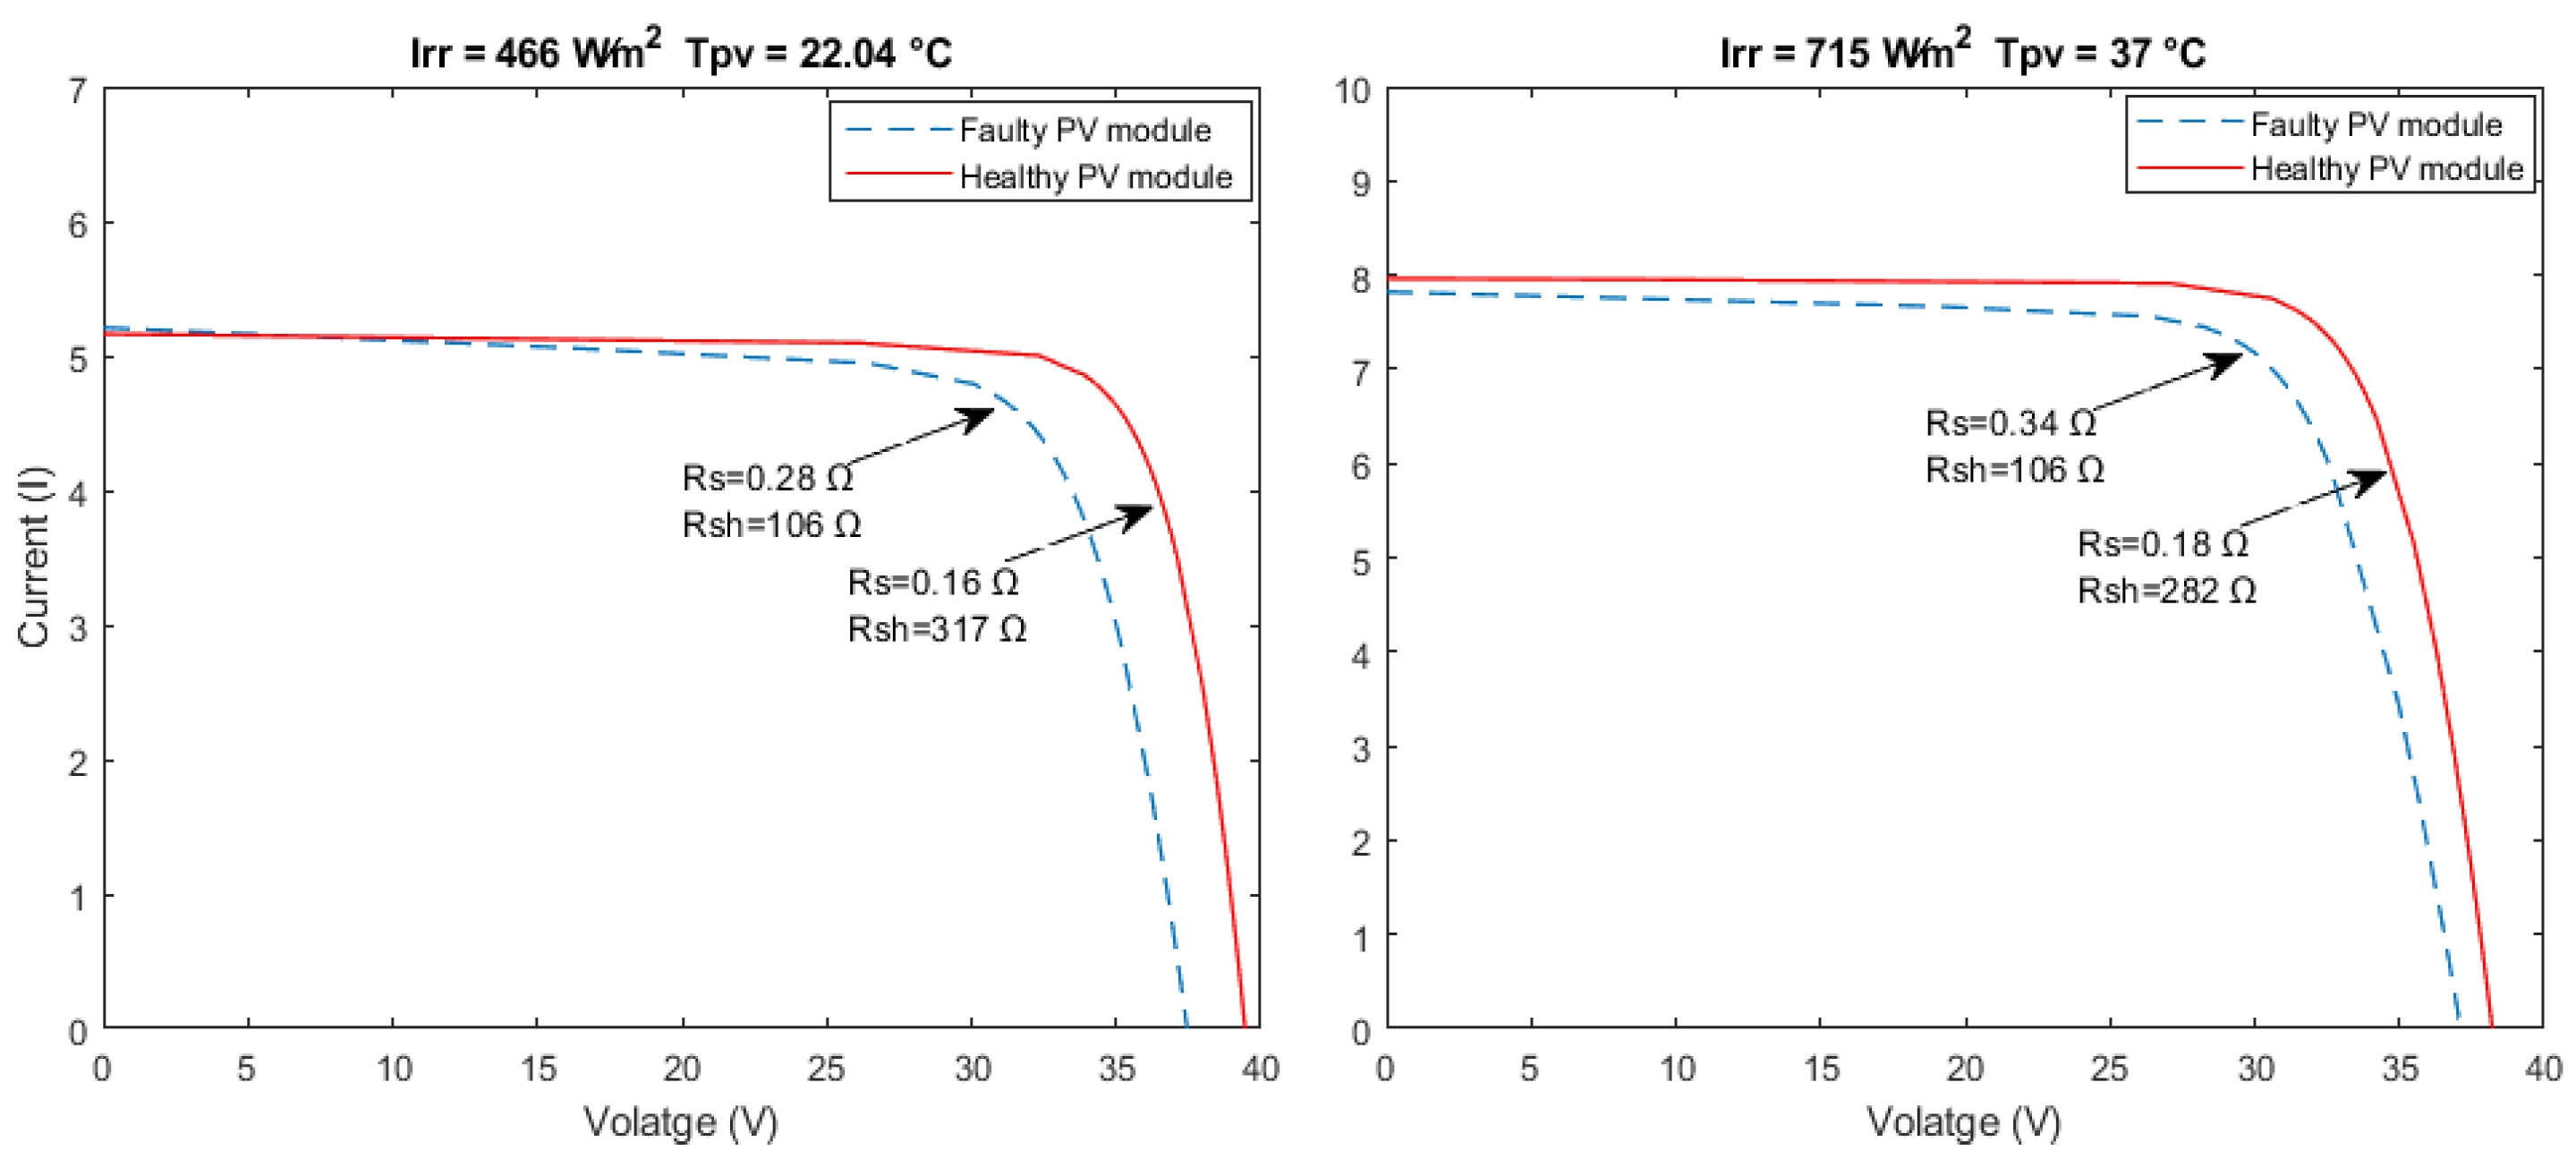
  • Comparing optimal parameter values for healthy and faulty PV modules;
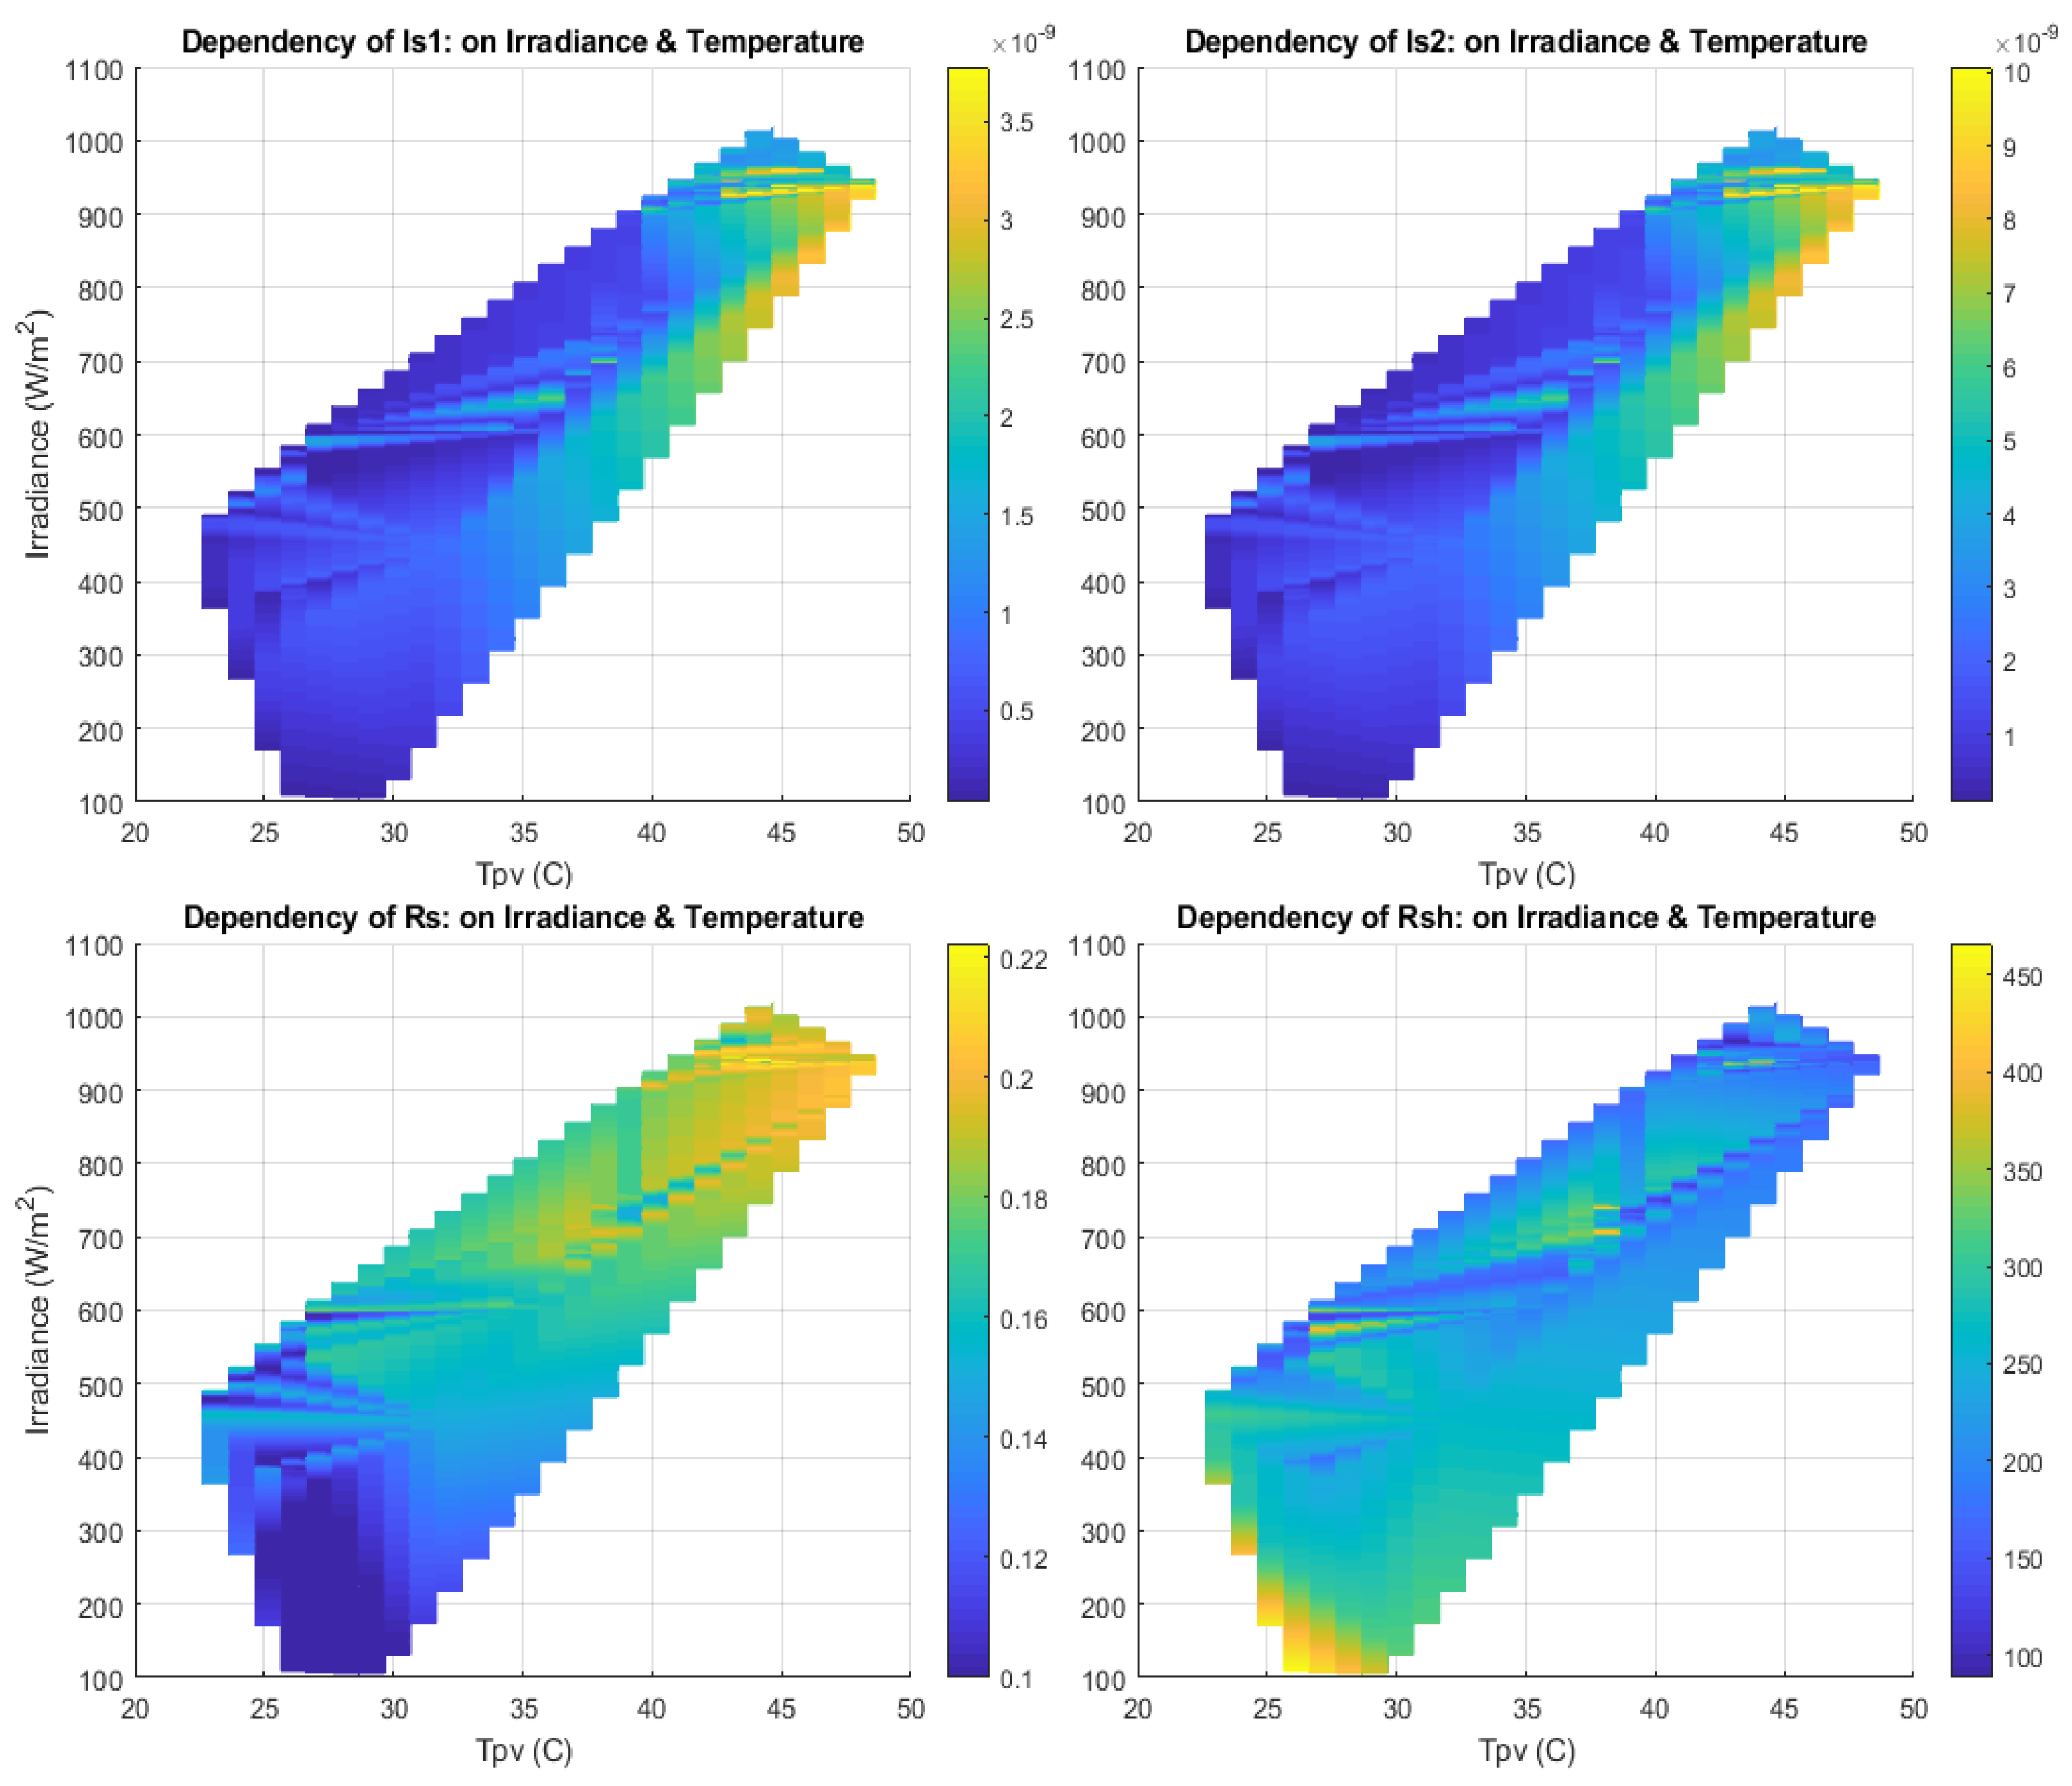
  • An analysis of how microcracks affect the dependence of model parameters on temperature and irradiance.

Literature Review

There has been extensive research on the topic of modeling PV modules using the double-diode model. A major drawback in the approach to model PV modules is the complex calculations required to obtain accurate values of all seven unknown parameters of the lumped circuit double-diode model. Many of these approaches introduce assumptions to further simplify the model to four or five parameters for identification. The most common assumption used across various literature was the initialization of diode ideality factors ( A 1 and A 2 ) to some fixed values. Authors in [1,2,3,4] used an approximation where A 1 = 1 and A 2 = 2, while authors [5,6,7] defined the values at A 1 = 1 and A 2 ≥ 1.2 with the assumption that the upper limit value for the diode ideality factor representing the recombination effect could not be higher than 2. Nonetheless, these assumptions proved invalid for some authors [8,9,10] who used differential evolution algorithms to evaluate their double-diode model parameters or those [11] who used the assumption that both R s = 0 and R s h = ∞. Other authors [12] made simplifications to the double-diode model of PV modules by initializing diode ideality factors to values obtained from another conducted research [9]. There have been several hybrid approaches where authors have combined analytical and numerical or optimization methods to obtain DDM parameters [13,14,15]. In [13], the authors combined an improved particle swarm optimization algorithm with analytical methods to obtain seven parameters. The improved particle swarm algorithm optimized values of three unknown parameters, and another four parameters were solved analytically. This method showed a high degree of precision and robustness [13]. The authors of [14] used a chaotic optimization approach to find six unknown DDM parameters using only the assumption that I r s 1   = I r s 2   . The results were compared against analytically improved SDM models and showed a higher level of accuracy and matching with a different set of I-V curve measurements [14]. Studies such as [15] also compared different known analytical and numerical methods for SDM and DDM identification, indicating that numerical methods tend to have a higher degree of accuracy compared to analytical methods. This study also found that the impact of temperature variations minimally impacted characteristic points on the I-V curve. Additionally, tested methods exhibited greater differences from the measured data in conditions of irradiances lower than 400 W m 2 , especially in the vicinity of V O C [15]. In recent years, several authors have based their research only on optimization algorithms without additional assumptions, such as [16], where enhanced differential evolution optimization techniques were applied to several PV cells and PV module models. This study showed promising results for applying enhanced differential evolution optimization techniques in terms of convergence speed and parameter accuracy compared to several other hybrid metaheuristic techniques [16]. Aside from accurately modeling the electrical behavior of properly working or healthy PV modules, underlining the impact of defects or cracks that can potentially alter the electrical characteristics of PV modules is crucial. In [17], the authors analyzed the I-V curves of three different PV modules with different numbers of cell microcracks registered using electroluminescence. The study shows that [17] although some PV modules had more severely damaged PV cells, their output power was similar to PV modules with a lesser number of damaged PV cells. The authors of [18] investigated the thermal impact of two types of cracks using an electrothermal model of the PV module. They determined that power loss is not only impacted by the type of crack but also by the bias of cracked cells and the number of cracked cells. Another study [19] investigated the impact of PV cell microcracks registered with electroluminescence technology on DDM electrical parameters. It showed that a larger number of microcracks induced higher values of reverse saturation currents and series resistance in PV modules. This paper presents an adaptation of the double DDM strategy applied in [12] by introducing a procedure to optimize the values of diode ideality factors in the domain of their theoretically possible values. This new modeling strategy was then applied to represent the electrical behavior of one faulty PV module with the presence of microcracks and one healthy PV module. This strategy was further validated through experimental measurements conducted under a wide range of operating conditions on both modules, as well as through correlations between different DDM electrical parameters, depending on irradiance and cell temperature. As discussed in the following chapters, this adapted strategy can be useful in representing the behavior of PV modules, not only under conditions of high irradiance values but also under low irradiance and moderate temperature values.

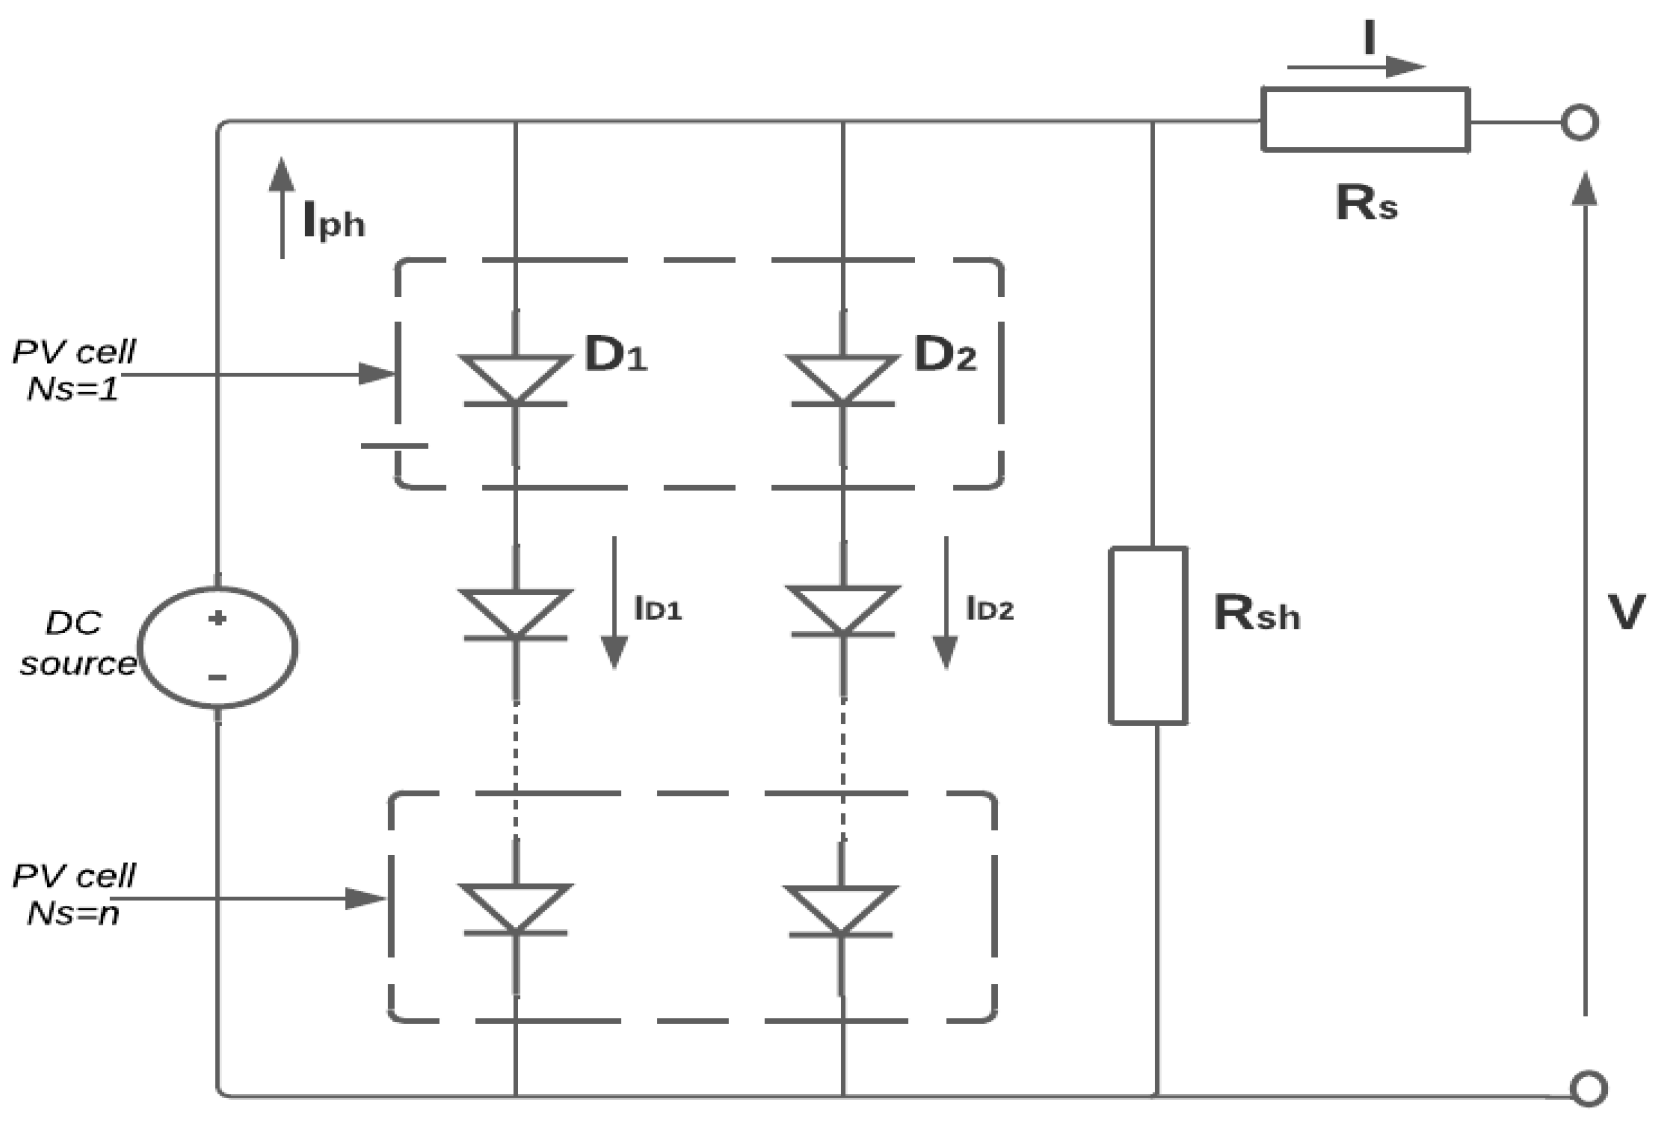
2. Materials and Methods

A lumped circuit DDM of a PV module is graphically represented in Figure 1, as derived from [20]. We determined 7 electrical parameters to represent photogenerated current I p h   , reverse saturation currents I r s 1 and I r s 2   of diodes D1 and D2, diode ideality factors A 1 and A 2 of diodes D1 and D2, respectively, series resistance R s , and shunt resistance R s h .
The mathematical equation that can be derived from the lumped DDM of a PV module is as follows:
I = I p h I D 1 I D 1 V + I · R s R s h
I = I p h I r s 1 e x p V + I · R s A 1   · V t h · N s 1 I r s 2 e x p V + I · R s A 2   · V t h · N s 1 V + I · R s R s h
where, apart from the mentioned 7 electrical parameters for the DDM, we have thermal voltage V t h , which is determined by the operating PV cell temperature T, according to the following equation:
V t h = k · T q
The term k in the Equation (3) represents the Boltzmann constant and q represents the electron charge. To complete the DDM Equation (2) one also has to consider the number of serially connected cells N s in one PV module.

3. Simplifications of Double-Diode Model

Given Equation (2), which defines the current–voltage relationship of DDM of a PV module and based on the behavior nature of PV module’s I-V curve, we can clearly rewrite the above-mentioned equation for three characteristic points:
  • Short circuit point ( 0 ,   I s c )
I s c = I p h I r s 1 e x p I s c · R s A 1   · V t h · N s 1 I r s 2 e x p I s c · R s A 2   · V t h · N s 1 I s c · R s R s h
  • Maximum power point (   V M P ,   I M P )
I M P = I p h I r s 1 e x p V M P + I M P · R s A 1   · V t h · N s 1 I r s 2 e x p V M P + I M P · R s A 2   · V t h · N s 1 V M P + I M P · R s R s h
  • Open circuit voltage ( V o c , 0 )
0 = I p h I r s 1 e x p V O C A 1   · V t h · N s 1 I r s 2 e x p V O C A 2   · V t h · N s 1 V O C R s h
The open circuit voltage Equation (6) can be rewritten in the following manner:
I p h = I r s 1 · 1 e x p V O C A 1   · V t h · N s + I r s 2 · 1 e x p V O C A 2   · V t h · N s V O C R s h
From importing it into Equations (4) and (5), we obtain:
I s c = I r s 1 e x p V O C A 1   · V t h · N s e x p I s c · R s A 1   · V t h · N s + I r s 2 e x p V O C A 2   · V t h · N s e x p I s c · R s A 2   · V t h · N s + V O C I s c · R s R s h
I M P = I r s 1 e x p V O C A 1   · V t h · N s e x p V M P + I M P · R s A 1   · V t h · N s + I r s 2 e x p V O C A 2   · V t h · N s e x p V M P + I M P · R s A 2   · V t h · N s + V O C V M P I M P · R s R s h
Equations (8) and (9) can be further rewritten by arranging I s c and I M P :
I s c 1 + R s R s h = I r s 1 e x p V O C A 1 · V t h · N s e x p I s c · R s A 1 · V t h · N s + I r s 2 e x p V O C A 2 · V t h · N s e x p I s c · R s A 2 · V t h · N s + V O C R s h
I M P 1 + R s R s h = I r s 1 e x p V O C A 1 · V t h · N s e x p V M P + I M P · R s A 1 · V t h · N s + I r s 2 e x p V O C A 2 · V t h · N s e x p V M P + I M P · R s A 2 · V t h · N s + V O C V M P R s h
We can simplify these equations since the value of series resistance R s is reported to be negligible compared to the shunt resistance R s h . Furthermore, according to [1,21,22], e x p I s c · R s A n   · V t h · N s 0 , which can be deleted from Equation (10). The value of reverse saturation current I r s 2 from diode 2 can be written depending on reverse saturation current I r s 1 from diode 1 according to [23]:
I r s 2 = T 2 5 3.77 · I r s 1
Based on the above simplifications, Equations (10) and (11) can be rewritten as
I s c = I r s 1 · e x p V O C A 1 · V t h · N s + I r s 1 · T 2 5 3.77 · e x p V O C A 2 · V t h · N s + V O C R s h
I M P = I r s 1 · e x p V O C A 1 · V t h · N s e x p V M P + I M P · R s A 1 · V t h · N s + I r s 1 · T 2 5 3.77 · e x p V O C A 2 · V t h · N s e x p V M P + I M P · R s A 2 · V t h · N s + V O C V M P R s h
By rearranging Equations (13) and (14) around the shunt resistance R s h , we can obtain the equation for reverse saturation current I r s 1 , which will be depend on series resistance R s and diode ideality factors A 1 and A 2   .
I r s 1 = V O C · I s c I M P V M P · I s c V O C · e x p V M P + I M P · R s A 1 · V t h · N s + T 2 5 3.77 · e x p V M P + I M P · R s A 2 · V t h · N s V M P · e x p V O C A 1 · V t h · N s + T 2 5 3.77 · e x p V O C A 2 · V t h · N s
Equation (15) can now be imported into Equation (6) for the open circuit point ( V o c ,   0 ) to calculate the photocurrent I p h :
I p h = V O C · I M P + I r s 1 · V O C · e x p V M P + I M P · R s A 1 · V t h · N s + T 2 5 3.77 · e x p V M P + I M P · R s A 2 · V t h · N s V O C V M P V O C · I M P + I r s 1 · V M P · e x p V O C A 1 · V t h · N s T 2 5 3.77 · e x p V O C A 2 · V t h · N s V O C V M P
The equation for calculating shunt resistance R s h can be derived from the maximum power point of Equation (5):
R s h = V M P + I M P · R s I p h I M P I r s 1 · e x p V M P + I M P · R s A 1   · V t h · N s 1 I r s 2 · e x p V M P + I M P · R s A 2   · V t h · N s 1
We can conclude from Equations (15)–(17) that the only unknown parameters are series resistance R s and diode ideality factors A 1   and A 2   .

4. Iterative Algorithm for the Extraction of DDM Parameters

The proposed computation method used to extract DDM parameters starts with reading the measured I-V curves of the PV module and initializing the values of irradiance and PV cell temperature. Once these values are initialized, it is crucial to extract the values of short circuit current I s c , maximum power point current I M P , open circuit voltage V o c and maximum power point voltage V M P from the I-V curve measurements. Two matrices are then created, which consist of theoretically realistic values for the diode ideality factor parameters A 1   and A 2   :
A 1   =   1 · · · 1.5
A 2 = 1.5 · · · 2.5
The algorithm then creates a grid of all possible combinations of diode ideality factor values based on their values, which results in one m × 2 matrix:
A 1 m , A 2 m = A 1 , 1 A 2 , 1 A 1 , 1 A 2 , 2 A 1 , 1 A 2 , 3 · · · · · · A 1 , n A 2 , n
The value of series resistance R s is then initialized to 0.1 Ω and this value, along with the values of first combination pair A 1 , 1 and A 2 , 1 , is used to calculate reverse saturation currents, shunt resistance, and photocurrent according to Equations (15), (16), and (20). In this calculation procedure, the nominal value of series resistance R s , n o m is calculated based on [12].
R s , n o m = V M P I M P 1 I r s 1 A 1 · V t h · N s e x p V M P + I M P · R s A 1 · V t h · N s + I r s 2 A 2 · V t h · N s e x p V M P + I M P · R s A 2 · V t h · N s + 1 R s h
After calculating these parameters, the algorithm checks for the difference between the initialized value of series resistance R s and the nominal value of series resistance R s , n o m . If the difference between these two values is greater than the tolerance condition defined at 0.0001, the value of R s is incremented by 0.01 Ω. The process is again computed until the tolerance condition is satisfied. If the while loop of the computational algorithm breaks, the values of shunt resistance R s h , series resistance R s , reverse saturation currents I r s 1 , 2 , photocurrent I p h and diode ideality factors ( A 1 , 1 , A 2 , 1 ) are written to the output matrix m × 7. The algorithm starts again and calculates the remaining rows in the output matrix for each possible pair of diode ideality factors combination in (20). Once the output matrix m × 7 is completed, the algorithm can use the parameter values of each row in the matrix to calculate and simulate the I-V curve for each combination of parameters. These simulated I-V curve values are then compared with experimental measurements, and the mean square error is calculated. The solution from the output matrix with the lowest mean square error compared to the measured I-V curve is accepted as optimal, and its values are extracted from the identification procedure.
An outline of the proposed iterative search approach combined with mean squared error minimization is provided with pseudocode in Algorithm 1.
Algorithm 1. Extraction of DDM Parameters from I-V Curve Data
1: Start
2: Import I-V curve measurement data
3: Initialize irradiance and temperature
4: Extract Isc, Imp, Vmp, and Voc from measurement data
5: Create matrix A[m][2] with possible values of A1, A2 within predefined limits
6: Rs ← 0.1
7: while True do
8:     Compute Irs1,Rsh,Iph,Rs,nom
9:     if |RsRs,nom| < 10−4 then
10:   Break
11:   else
12:      RsRs + 0.01
13:   end if 14: end while
15: Create output matrix m × 7 for parameter combinations
16: for each combination in output matrix do
17:    Compute Mean Squared Error (MSE)
18: end for
19: Select combination with lowest MSE as the best solution
20: Output final values of Irs1, Irs2, Rsh, Rs, Iph, A1, A2
21: End

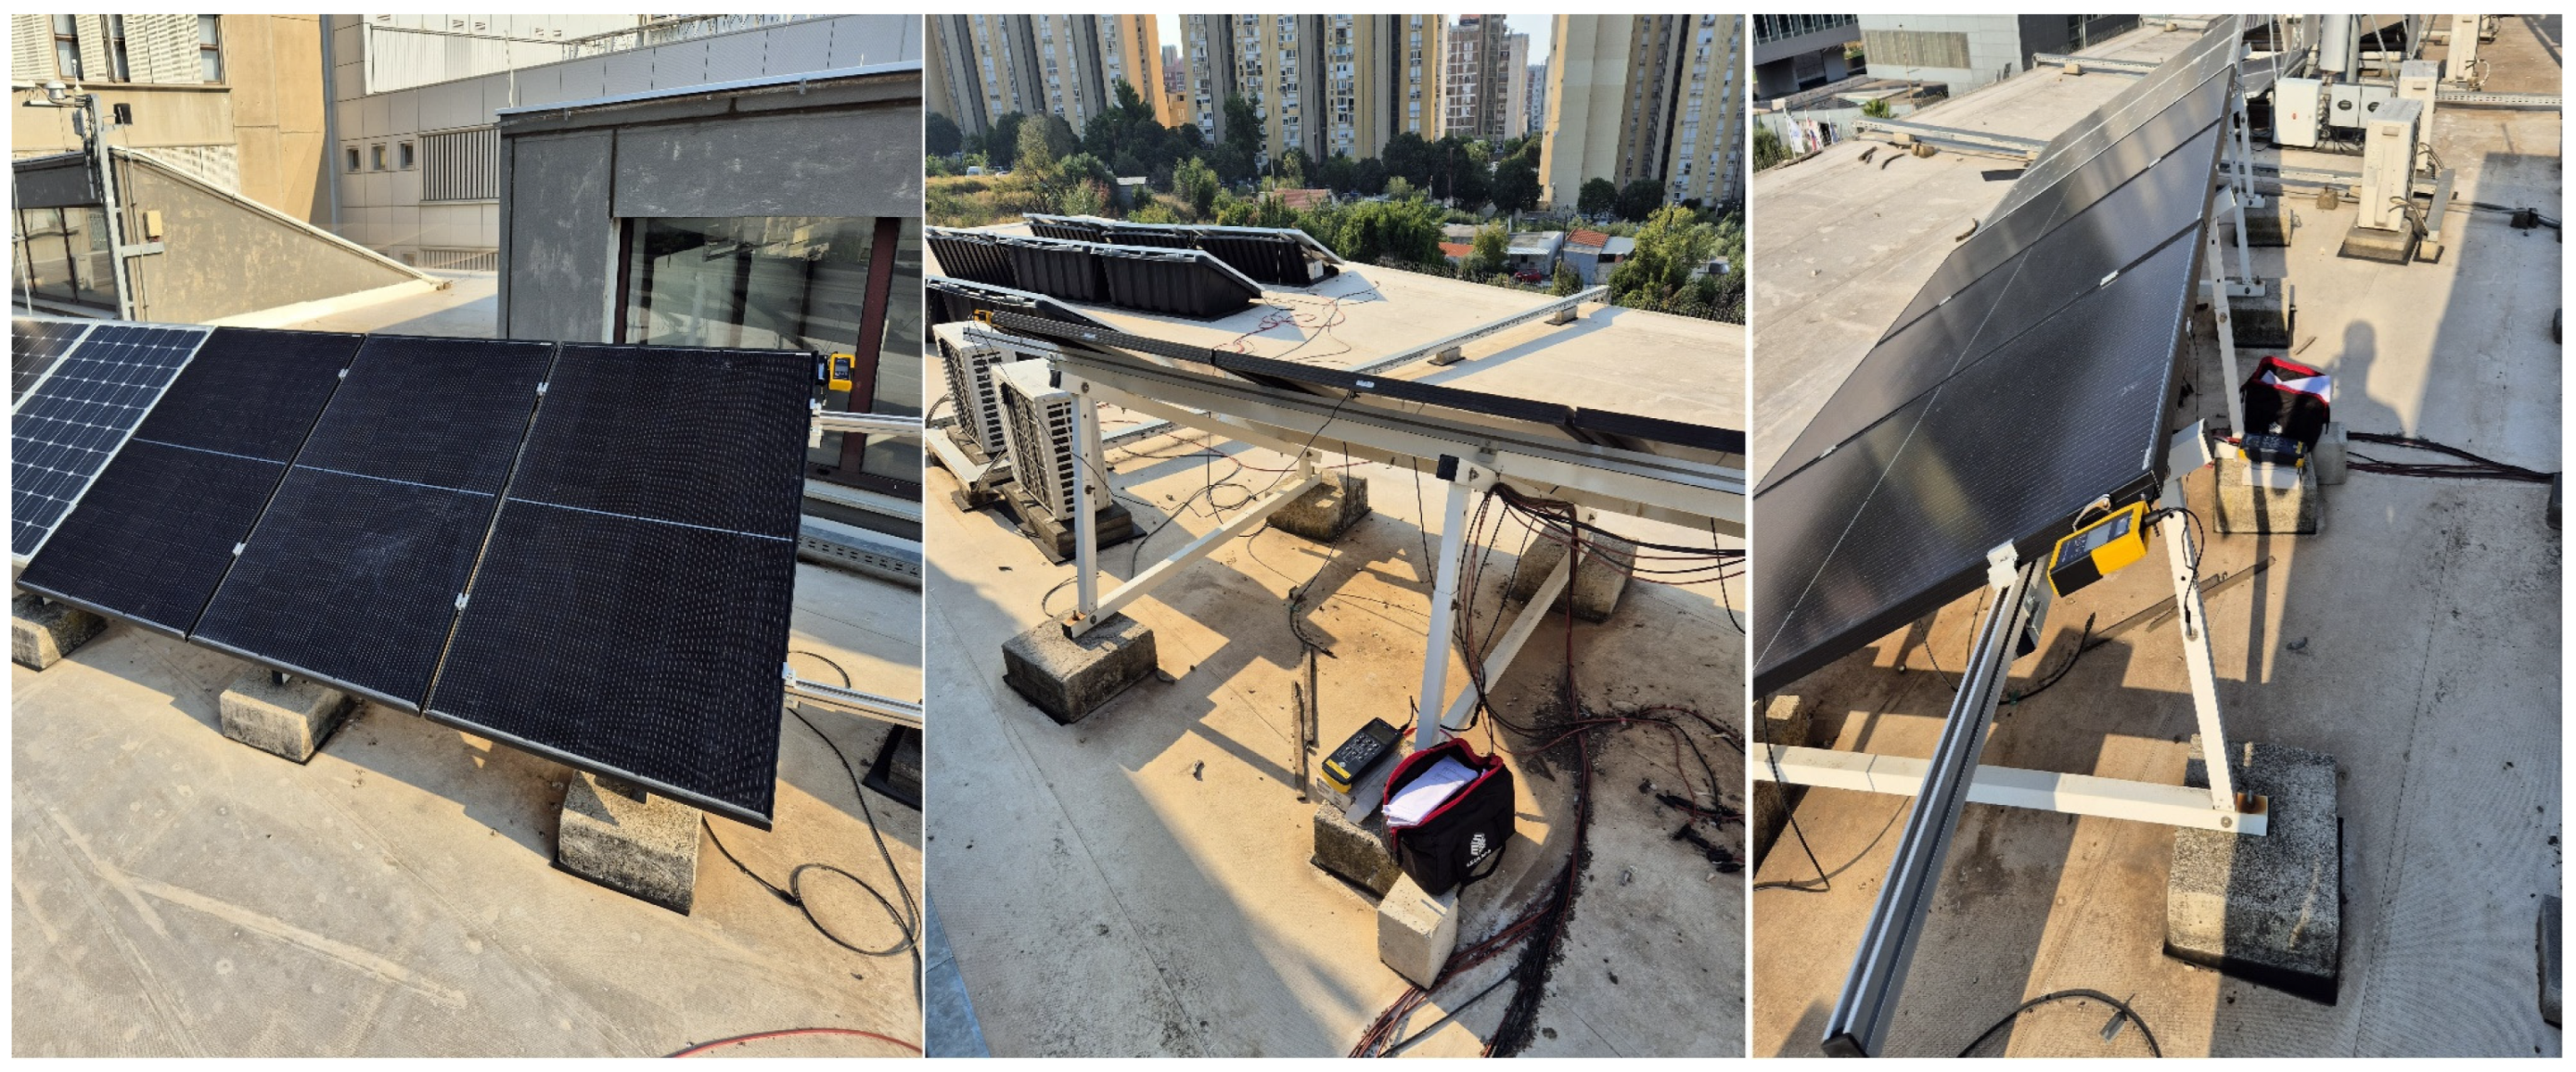
5. Experimental Setup and Simulation Results

The experimental setup for the measurement of I-V curves was carried out on two separate monocrystalline silicon half-cut cell PV modules (model SV 120 E HC9B) [24] obtained directly from the Solvis d.o.o factory (Varaždin, Croatia). The main difference between the two PV modules was the presence of microcracks in one PV module. These microcracks can be seen in EL imaging obtained from the factory laboratory (Figure 2). The datasheet values of the tested PV modules are shown in Table 1, and the setup of the experimental measurements is shown in Figure 3. The main difference between the two PV modules was the presence of microcracks in one PV module. These microcracks can be seen in EL imaging obtained from the factory laboratory (Figure 2). Tests were conducted using the Seaward PV200 Solar Tracker with PV cell temperatures ranging between 22 °C and 49 °C and irradiance values between 104 W m 2 and 1000 W m 2 . A total of 220 I-V curve measurements were examined for both PV modules.

Validation of the Proposed Extraction Procedure

The validation procedure for identifying seven DDM parameters of the PV module is shown in Figure 4, where the measured values of the I-V curves (blue dots) have been compared to the simulated values of the I-V curve (red line). The left side of Figure 4 shows a comparison for a healthy PV module, and the right side shows a comparison for a faulty PV module.
This approach for the extraction of DDM electrical parameters showed minor variability in diode ideality factor parameters A 1 and A 2 . For the healthy PV module, the algorithm showed an average value of diode ideality factors across all measurements, with A 1   = 1.04 and A 2 = 2.41. For the faulty PV module, the average values were a bit higher at A 1   = 1.055 A 1 = 2.49.
As for the values of reverse saturation currents, series and shunt resistance, and their dependence on variable operating conditions (irradiance and PV cell temperature) for both the faulty and properly working PV modules, these are shown in Figure 5 and Figure 6.
As seen in Figure 5, the values I r s 1 and I r s 2 tend to increase with the rise in temperature and irradiance. This increase is more evident in the reverse saturation current I r s 2 of diode 2. R s values ranged between 0.1 Ω and 0.21 Ω, and the increase in the value of these parameters directly correlates with the increase in module temperature. R s h values ranged between 100 Ω and 425 Ω. We concluded that the increase in irradiance and temperature caused the decrease in shunt resistance values.
In Figure 6, we can observe similar patterns of increase in reverse saturation currents I r s 1 and I r s 2 due to the increase in module temperature. Upon comparing the ranges of I r s 1 and I r s 2 for both modules, it can be concluded that faulty PV modules have higher values of reverse saturation currents than properly working modules. The R s h values for the faulty model ranged between 50 Ω and 160 Ω, and this range is comparably shifted lower than that of the properly working module. However, the pattern of R s for the faulty PV module could not be distinguished.
As seen in Figure 6, the series resistance values ranged between 0.25 Ω and 0.37 Ω, which is comparably higher than the range of the properly working module. The series resistance values for particular measurements were 100–150% higher in the faulty PV module, which can also be observed in Figure 7.
Since the pattern of series resistance changes with temperature and irradiance could not be easily detected for both healthy and faulty PV modules, we can normalize the value of series resistance, making it relative to the V o c and I s c of the particular measurement. This measure of quality can provide us with information on how much series resistance impacts the PV module’s performance relative to its ideal output. Changes in normalized series resistance over time can be a good indicator of PV module degradation. The normalized series resistance is calculated first through the calculus of the PV module’s characteristic resistance [25]:
R c h = V o c I s c
R s , n o r m = R s R c h
The comparison of the normalized values of series resistance R s , n o r m for faulty and healthy PV modules can be seen in Figure 8. The healthy PV module has a lower R s , n o r m range [0.0032–0.0634] than the faulty PV module [0.0206–0.094]. A comparison of the obtained parameter ranges using the proposed approach for both PV modules is shown in Table 2.

6. Conclusions

A new approach to double-diode modeling of a PV module is proposed with an emphasis on extracting series resistance and shunt resistance values as a measure of PV module health. This approach was applied to capture the electrical behavior of two PV modules, with one having significant internal damage in terms of cell microcracks. Both modules were tested unilaterally under various operating conditions by sweeping the I-V curves and applying the presented modeling approach. The series resistance, shunt resistance, and normalized series resistance of both PV modules were extracted with considerably higher ranges of series resistance ([0.25 Ω–0.37 Ω] > [0.1 Ω–0.21 Ω]) and normalized series resistance ([0.0206–0.094] > [0.0032–0.0634]) and considerably lower ranges of shunt resistance ([50 Ω–160 Ω] < [100 Ω–425 Ω]) for faulty PV modules. The results confirm that degraded modules exhibited elevated Rs, reduced Rsh, and increased diode saturation currents, establishing these parameters as reliable performance indicators. A proposed iterative algorithm provides a reliable representation of PV module behavior, especially under real operating conditions. This approach contributes to improved fault diagnosis, as well as to predictive maintenance and overall PV system optimization. Based on the presented work, the proposed method could be useful in determining potential defects and faults in PV modules or PV arrays by isolating the most important quality parameters, such as series resistance and shunt resistance. As a result, the standard maintenance procedures for components such as PV modules or PV arrays can be improved and optimized, ensuring a longer lifespan of the PV system as a whole. Future work will focus on improving the optimization technique by applying it to a wider range of operating conditions and inspecting a larger number of PV modules with different types of faults.

Author Contributions

Conceptualization, P.M. and I.M.; methodology, P.M. and I.M.; software, P.M. and A.K.S.; validation, P.M.; formal analysis, I.M. and I.B.; investigation, P.M.; resources, P.M., I.M. and I.B.; data curation, P.M. and A.K.S.; writing—original draft preparation, P.M.; writing—review and editing, I.M., A.K.S. and I.B.; visualization, P.M.; supervision, I.M.; project administration, I.M. and I.B.; funding acquisition, I.M. and A.K.S. All authors have read and agreed to the published version of the manuscript.

Funding

This research received no external funding.

Data Availability Statement

Data from PV measurements are not available online.

Conflicts of Interest

The authors declare no conflicts of interest.

References

  1. Hejri, M.; Mokhtari, H.; Azizian, M.R.; Ghandhari, M.; Söder, L. On the Parameter Extraction of a Five-Parameter Double-Diode Model of Photovoltaic Cells and Modules. IEEE J. Photovolt. 2014, 4, 915–923. [Google Scholar] [CrossRef]
  2. Masmoudi, F.; Ben Salem, F.; Derbel, N. Single and double diode models for conventional mono-crystalline solar cell with extraction of internal parameters. In Proceedings of the 13th International Multi-Conference on Systems, Signals & Devices (SSD), Leipzig, Germany, 21–24 March 2016; pp. 720–728. [Google Scholar]
  3. Sallem, S.; Marrekchi, A.; Kammoun, S. Multi-PV technologies method for parameters estimation of two-diode model. Eur. Phys. J. Plus 2016, 131, 418. [Google Scholar] [CrossRef]
  4. Yaqoob, S.J.; Saleh, A.L.; Motahhir, S. Comparative study with practical validation of photovoltaic monocrystalline module for single and double diode models. Sci. Rep. 2021, 11, 19153. [Google Scholar]
  5. Prakash, S.B.; Singh, G.; Singh, S. Modelling and Performance Analysis of Simplified Two-Diode Model of Photovoltaic Cells. Front. Phys. 2021, 9, 236. [Google Scholar] [CrossRef]
  6. Ishaque, K.; Salam, Z.; Taheri, H. Simple, fast and accurate two-diode model for photovoltaic modules. Sol. Energy Mater. Sol. Cells 2011, 95, 586–594. [Google Scholar] [CrossRef]
  7. Mahmoud, M.E.E.; Diab, A.A.Z.; Kotin, D.A. Simulation and Experimental Validation of Two-Diode Model of Photovoltaic (PV) Modules. In Proceedings of the XIV International Scientific-Technical Conference on Actual Problems of Electronics Instrument Engineering (APEIE), Novosibirsk, Russia, 2–6 October 2018; pp. 244–251. [Google Scholar]
  8. Chin, V.J.; Salam, Z.; Ishaque, K. An accurate two diode model computation for CIS thin film PV module using the hybrid approach. In Proceedings of the 4th International Conference on Electric Power and Energy Conversion Systems (EPECS), Sharjah, United Arab Emirates, 24–26 November 2015; pp. 1–6. [Google Scholar]
  9. Chin, V.J.; Salam, Z.; Ishaque, K. An accurate modelling of the two-diode model of PV module using a hybrid solution based on differential evolution. Energy Convers. Manag. 2016, 124, 42–50. [Google Scholar] [CrossRef]
  10. Yuan, S.; Ji, Y.; Chen, Y.; Liu, X.; Zhang, W. An Improved Differential Evolution for Parameter Identification of Photovoltaic Models. Sustainability 2023, 15, 13916. [Google Scholar] [CrossRef]
  11. Babu, B.C.; Gurjar, S. A Novel Simplified Two-Diode Model of Photovoltaic (PV) Module. IEEE J. Photovolt. 2014, 4, 1156–1161. [Google Scholar] [CrossRef]
  12. Yahya-Khotbehsara, A.; Shahhoseini, A. A fast modeling of the double-diode model for PV modules using combined analytical and numerical approach. Sol. Energy 2018, 162, 403–409. [Google Scholar] [CrossRef]
  13. Zhang, G.; Wang, H.; Lu, T.; Wang, C.; Huang, Y. Hybrid approach for parameter identification of the two-diode model of photovoltaic modules. COMPEL-Int. J. Comput. Math. Electr. Electron. Eng. 2023, 42, 1531–1553. [Google Scholar] [CrossRef]
  14. Prabu, R.T.; Parasuraman, S.; Sahoo, S.; Amirthalakshmi, T.M.; Ramesh, S.; Shifani, S.A.; Jayadhas, S.A.; Reddy, M.I.; Al Obaid, S.; Alfarraj, S.; et al. The Numerical Algorithms and Optimization Approach Used in Extracting the Parameters of the Single-Diode and Double-Diode Photovoltaic (PV) Models. Int. J. Photoenergy 2022, 2022, 5473266. [Google Scholar] [CrossRef]
  15. Saadaoui, D.; Elyaqouti, M.; Assalaou, K.; Hmamou, D.B.; Lidaighbi, S.; Arjdal, E.H.; Choulli, I.; Elhammoudy, A. Parameters Extraction of Single Diode and Double Diode Models Using Analytical and Numerical Approach: A Comparative Study. Int. J. Model. Simul. 2023, 45, 569–598. [Google Scholar] [CrossRef]
  16. Parida, S.M.; Pattanaik, V.; Panda, S.; Rout, P.K.; Sahu, B.K.; Bajaj, M.; Blazek, V.; Prokop, L. Optimal parameter identification of photovoltaic systems based on enhanced differential evolution optimization technique. Sci. Rep. 2025, 15, 2124. [Google Scholar] [CrossRef] [PubMed]
  17. Crozier, J.L.; Dyk, E.V.; Vorster, F. Identification and Characterization of Performance Limiting Defects and Cell Mismatch in Photovoltaic Modules. J. Energy South. Afr. 2015, 26, 19–26. [Google Scholar] [CrossRef]
  18. Niyaz, H.M.; Meena, R.; Gupta, R. Impact of Cracks on Crystalline Silicon Photovolatic Modules Temperature Distribution. Sol. Energy 2021, 225, 148–161. [Google Scholar] [CrossRef]
  19. van Mölken, J.I.; Yusufoğlu, U.A.; Safiei, A.; Windgassen, H.; Khandelwal, R.; Pletzer, T.M.; Kurz, H. Impact of Micro-Cracks on Degradation of Solar Cell Performance Based on Two-Diode Model Parameters. Energy Procedia 2012, 27, 167–172. [Google Scholar] [CrossRef]
  20. Marić, P.; Marasović, I.; Bevanda, I.; Betti, T. Extraction of PV module electrical parameters based on the single diode and double diode model of a PV cell. In Proceedings of the 7th International Conference on Smart and Sustainable Technologies (SpliTech), Split/Bol, Croatia, 5–8 July 2022; pp. 1–5. [Google Scholar] [CrossRef]
  21. Chan, D.S.H.; Phang, J.C.H. Analytical methods for the extraction of solar-cell single- and double-diode model parameters from I-V characteristics. IEEE Trans. Electron. Devices 1987, 34, 286–293. [Google Scholar] [CrossRef]
  22. Chan, D.S.H.; Phang, J.C.H.; Phillips, J.R. Accurate Analytical Method for the Extraction of Solar Cell Model Parameters. Electron. Lett. 1984, 20, 406–408. [Google Scholar]
  23. Gupta, S.; Tiwari, H.; Fozdar, M.; Chandna, V. Development of a Two Diode Model for Photovoltaic Modules Suitable for Use in Simulation Studies. In Proceedings of the 2012 Asia-Pacific Power and Energy Engineering Conference, Shanghai, China, 27–29 March 2012; pp. 1–4. [Google Scholar]
  24. Solvis, d.o.o. SV120 E HC9B Monocrystalline Module Datasheet. Available online: https://solvis.hr/proizvodi/monokristalni-moduli/sv120-e-hc9b/ (accessed on 25 February 2025).
  25. Green, M.A. Accuracy of analytical expressions for solar cell fill factors. Sol. Cells 1982, 7, 337–340. [Google Scholar] [CrossRef]
Figure 1. Lumped circuit double-diode model of a PV module.
Electronics 14 01559 g001
Figure 2. EL imaging of the faulty PV module with microcracks.
Electronics 14 01559 g002
Figure 3. Experimental setup used for the I-V curve measurement.
Electronics 14 01559 g003
Figure 4. Comparison between experimental measurements and simulation for healthy (left side) and faulty (right side) PV modules.
Electronics 14 01559 g004
Figure 5. Dependence of reverse saturation currents, series resistance, and shunt resistance on variable module temperatures and irradiance for the healthy PV module.
Electronics 14 01559 g005
Figure 6. Dependence of the reverse saturation currents, series resistance, and shunt resistance on variable module temperature and irradiance for the faulty PV module.
Electronics 14 01559 g006
Figure 7. Comparative examples of simulated and measured I-V curve for healthy and faulty PV modules.
Electronics 14 01559 g007
Figure 8. Normalized series resistance R s , n o r m dependence on irradiance and temperature for healthy (left) and faulty (right) PV modules.
Electronics 14 01559 g008
Table 1. Datasheet values of the tested PV module.
Model NameSV 120 E HC9B
Peak power360 W
Short   circuit   current   I s c 11.22 A
Open   circuit   voltage   V o c 40.50 V
Maximum   power   current   I M P 10.52 A
Maximum   power   voltage   V M P 34.23 V
Number of PV cells120 (60 in series)
Table 2. Comparison of the obtained parameter ranges for healthy and faulty PV modules.
ParameterHealthy PV Module
Range
Faulty PV Module
Range
I r s 1 [ n A ] 0.1–3.5 0.5–7
I r s 2 [ n A ] 0.1–9 0.02–0.19
R s [ ] 0.1–0.210.25–0.37
R s h [ ] 100–42550–160
R s , n o r m 0.0032–0.06340.0206–0.094
Disclaimer/Publisher’s Note: The statements, opinions and data contained in all publications are solely those of the individual author(s) and contributor(s) and not of MDPI and/or the editor(s). MDPI and/or the editor(s) disclaim responsibility for any injury to people or property resulting from any ideas, methods, instructions or products referred to in the content.

