Abstract
Frozen gait (FG) is an increasingly prevalent concern in individuals with Parkinson’s disease (PD) that limits mobility and increases the risk of falls. Traditional FG detection and monitoring methods using clinical observations and wearable sensors face limitations, such as inflexibility, lack of portability, inaccessibility to individuals, and the inability to provide continuous monitoring in real-life environments. To address these challenges, this experimental study presents the development of a software-defined radio (SDR)-based radio frequency (RF) sensing platform for continuous FG monitoring. Data were collected through multiple experiments involving various physical activities, including FG episodes. The acquired data were processed using advanced signal-processing (ASP) techniques to extract relevant wireless channel state information (WCSI) patterns. The physical activities were classified using machine learning and deep learning models developed on the dataset prepared from the SDR-based RF sensing system. The results demonstrated that the deep learning models outperformed the machine learning models. The bidirectional gated recurrent unit (BiGRU) achieved the highest accuracy of 99.7%. This indicates that the developed system has the potential for accurate, real-time monitoring of FG and other PD symptoms. The proposed RF sensing platform using SDR technology and artificial intelligence (AI) offers an intelligent and continuous monitoring solution, addressing the limitations of traditional methods. This system provides portable, continuous detection of FG events, potentially improving patient care, safety, and early intervention.
1. Introduction
In 1987, James Parkinson researched Shaking Palsy (SP) to understand disorders such as tremors, bradykinesia, rigidity, and gait disturbances, termed neurological disorders [1]. SP is an ancient term used for Parkinson’s disease (PD). Today, PD is considered a neurodegenerative disease that mostly affects mobility and is explained by the growing deterioration of certain brain nerve cells, mainly in the substantia nigra. These cells produce a neurotransmitter, dopamine, which is important for coordinating smooth and regulated muscular actions. About 8.4 million patients with PD around the world are older adults [2]. PD is a growing and long-term condition with symptoms that worsen over time and ranks as the most prevalent neurodegenerative disorder associated with aging, characterized by different motor symptoms. Gait disturbances in PD patients are marked by shortened stride length, slower step speed, high variability in step synchronization, poor leg coordination, and asymmetrical movement [3].
FG is a walking problem that is often seen in individuals with PD and affects 70% of patients [4,5]. It manifests as a reduction in the length of each step taken or an inability to walk smoothly [6]. It describes an abrupt, fleeting, and involuntary occurrence in which an individual momentarily becomes incapable of initiating or maintaining ambulation. People may have trouble moving forward during these episodes and feel as if their feet are stuck to the ground. In PD patients, FG can have a significant negative influence on mobility and increase the risk of falls. Sudden and unpredictable FG episodes can cause falls and fall-related injuries that can have serious health consequences [7]. About 26% of patients with advanced stages of PD are also susceptible to FG episodes [8]. FG is a significant contributing factor that may cause patients to use a wheelchair, reduce activities, or even become confined to their homes [9].
Conventional FG episode detection techniques primarily rely on wearable sensors, such as accelerometers and gyroscopes, or on video-based monitoring to analyze the movement patterns of patients. However, these conventional techniques have several limitations. Wearable sensors can cause discomfort for patients and require continuous monitoring. In addition, improper sensor placement can affect the accuracy of the data, and sensors sometimes generate large amounts of data that are difficult to process effectively, leading to information overload [10]. In contrast, video-based analysis also has limitations. It is sensitive to environmental conditions such as lighting and background clutter and cannot be used for real-time monitoring in domestic environments. It can be affected by occlusion, where body parts become obscured due to limb movement or poor camera placement [11]. Additionally, these methods can struggle to accurately distinguish FG episodes from normal gait variations, leading to false positives and negatives in detection [12].
With the advancement of technology, researchers have explored alternative solutions using wearable sensor technology to enhance the accuracy of FG detection while improving patient comfort and mobility in daily life [13]. In recent research work, researchers have tried to tackle the FG problem using different technologies like wireless fidelity (Wi-Fi) and radar imaging to monitor and detect FG episodes. These techniques constitute a novel approach that combines radar and Wi-Fi-based sensing to detect FG in patients with PD. For example, one study accurately detected FG episodes and classified daily activities using an improved autoencoder, a unique deep neural network [14]. Leaky wave cables (LWCs) are used to detect FG, and this approach suggests a novel, non-invasive technique that uses radio waves and LWCs. The system uses machine learning to differentiate between normal walking and FG episodes by analyzing the variations in radio signals caused by the movement of a person. This makes the system a promising replacement for conventional sensor-based methods, with the potential for remote monitoring and improved accuracy in multi-patient settings [15]. This novel technology replaces a wearable monitoring system for FG detection that employs radio spies to track FG episodes in Parkinson’s patients and eliminates the need for cumbersome sensors. A machine learning-based detector is integrated to accurately identify FG events by analyzing changes in radio waves caused by movement. This contactless approach improves mobility monitoring, enabling better patient care and facilitating remote monitoring [16]. The FG episodes commonly observed in PD and similar conditions are challenging to track over time. Most existing monitoring methods rely on invasive or uncomfortable wearable sensors, which can disrupt day-to-day life and restrict natural movement [17].
In recent years, software-defined radio (SDR) technology has demonstrated its ability to detect subtle variations in RF signals to reveal detailed information about human body movements [18,19]. These data are crucial for understanding the progression of neurological disorders and developing targeted interventions by analyzing the variations in signal reflection caused by physiological activities. However, current approaches fall short in their ability to capture sudden, unpredictable changes in movement, particularly in individuals with neurological disorders like PD. SDR technology using RF signals not only identifies abnormalities in human locomotion but also analyzes signal variations to provide deeper insights into health abnormalities [20]. Furthermore, SDR-based systems are deployable, cost-effective, and scalable, thereby reducing the workload of healthcare practitioners. In addition, SDR-based sensing can dynamically adjust detection parameters, which improves sensitivity and specificity in real-world scenarios. SDR technology allows real-time signal adaptation, multi-frequency operation, and precise environmental sensing, making it suitable for various applications [21]. FG is a common and debilitating symptom that often goes undetected by conventional monitoring methods, leading to an increased risk of falls and injuries. The unpredictability and severity of FG episodes present a significant challenge, as they occur suddenly and can result in serious health consequences due to fall-related injuries. Existing gait-monitoring technologies are inadequate for the real-time detection and prevention of FG episodes, as they often restrict the mobility, continuous monitoring, flexibility, portability, and safety of affected individuals. By addressing these gaps, our study introduces a novel and practical approach to FG monitoring, advancing the state-of-the-art in real-time, non-invasive gait assessment technology. The novelty of this research lies in the development of a real-time, non-contact, non-invasive FG monitoring system using cost-effective SDR technology, which outperforms conventional RF-based gait monitoring methods. Unlike existing approaches that rely on wearable sensors, WiFi, radar, or predefined motion patterns, our system leverages SDR’s portability and flexibility to detect subtle gait anomalies, enabling the instant detection of sudden motion interruptions. Incorporating ASP and AI techniques ensures superior accuracy and robustness in dynamic environments, providing a practical solution for reducing the risk of falls and improving mobility in individuals with gait disorders. The main contributions of this research are as follows:
- The design and implementation of an intelligent gait monitoring system that utilizes RF sensing and SDR technology to detect and provide real-time monitoring of FG episodes.
- Multiple experiments are conducted by analyzing five distinct gait activities related to FG, including walking, start-stop movements, and turning datasets, to evaluate the performance of the proposed system.
- ASP is deployed to analyze WCSI by extracting relevant gait factors and accurately recognizing FG patterns using AI techniques.
- The classification performance of trained machine and deep learning models is evaluated for the comprehensive assessment of a framework to benchmark model effectiveness and reliability.
This paper starts with an introduction, followed by a literature review in Section 2. Section 3 presents the system design for the monitoring of FG episodes. Section 4 presents the methodology, providing an in-depth discussion of dataset collection, data pre-processing, and training of AI models for classification purposes. The obtained results are presented in Section 5. Finally, Section 6 concludes this paper with its findings and future recommendations.
2. Related Works
The conventional method for detecting FG episodes relies on subjective scale ratings. Although widely used, this method fails to provide quantitative insights. Gait analysis conducted in laboratories requires specialized hospital and research facility settings and advanced instruments to record the detailed gait kinematics of patients. This technique is regarded as the gold standard for gait analysis. However, the infrequent and unpredictable nature of FG occurrences poses challenges for this approach, making it impractical due to its high cost, time-consuming nature, and limited feasibility for routine monitoring and FG treatment [22]. The detection of FG commonly uses two types of sensing methodologies: contact-based and non-contact-based sensing. In contact-based sensing, there is direct contact with the human body to measure specific physiological or movement-related parameters for FG detection. In contrast, non-contact-based sensing monitors FG without physical interaction using technologies such as radar, cameras, and Wi-Fi-based sensing [23]. The notable distinction between these sensing methodologies lies in their comfort, flexibility, and data acquisition techniques, with non-contact methods offering enhanced user convenience because there are no wearable devices. Recent advances, such as the integration of radar and Wi-Fi technologies, have shown promising potential in improving the accuracy, precision, and reliability of FG detection [24].
2.1. Contact-Based Monitoring of FG
Contact-based FG sensing technologies use wearable sensors to collect data directly from the body. Widely used sensors are inertial measurement units (IMUs), force-sensitive resistors (FSRs), and electromyography (EMG) sensors. These sensors are placed on the wrist, ankle, or thigh, or are embedded in footwear to continuously monitor body movement, gait dynamics, and joint alignment [25]. IMUs use accelerometers and gyroscopes to detect linear and angular motions in three dimensions [26]. These sensors are mostly placed on the lower limbs, such as the ankle, thigh, or shank, to collect gait patterns for FG detection [27]. IMUs have high sensitivity levels of up to 95% and have some limitations, including sensor drift over time, necessitating frequent recalibration, and patient-specific heterogeneity in gait patterns that limits detection accuracy [28,29]. FSRs are embedded in shoe insoles to measure ground reaction forces and pressure distribution while walking to detect variations in footfall patterns, such as asymmetry or altered step timing, which are precursors of FG episodes [30]. The drawback of FSRs is their reliance on consistent placement and environmental factors, i.e., changes in walking surfaces can influence the reliability and validity of measurements [31,32].
EMG sensors record electrical activity in muscles and provide information on neuromuscular coordination during gait cycles. When placed on the lower limbs, these sensors can help analyze the behavior of muscles during pre-FG and FG events. Despite a reasonable degree of precision, they are sensitive to noise from extrinsic factors, such as electrode displacement or perspiration, and require expert interpretation [33,34]. Another approach, the multi-sensor system, combines IMUs, FSRs, and EMG sensors to integrate data from multiple sensor modalities to enhance detection accuracy. These systems achieve sensitivity and specificity levels of 96% and 98%, respectively. However, they often require extensive calibration tailored to patients, resulting in higher costs and greater complexity [35]. Wearable sensors and AI algorithms have been used to detect and predict FG episodes in PD patients, emphasizing the importance of sensor placement and highlighting challenges such as variations in individual walking patterns [36]. Another approach utilized the motion signals of patients obtained from IMUs and FSRs and segmented the gait cycles to detect FG in real time [37]. Another approach employed an IMU on each shank, utilizing the fast fourier transform (FFT) and wavelet analysis with the decision tree ensemble classifier, achieving 85.2% sensitivity and 86.2% specificity in FG classification [38]. Also, deep learning using a convolutional neural network (CNN)- and long short-term memory (LSTM)-based ML architecture has been used to predict FG episodes based on data collected from IMUs in real time, achieving 98.5% sensitivity and 97.9% specificity [39].
2.2. Non-Contact-Based Monitoring of FG
Non-contact-based FG sensing systems eliminate the need for physical interaction with the patient and are based mainly on camera motion capture, radar sensing, and Wi-Fi. camera-based FG detection systems rely on video or infrared imaging to monitor body movements and identify gait anomalies [40,41]. Recent advancements have incorporated deep learning techniques, such as CNNs, to analyze joint movements and classify FG episodes. In [42], a camera-based motion capture system was used to detect FG with a detection accuracy of 82%, with sensitivity and specificity of more than 80%. However, these systems are very sensitive to environmental factors, such as lighting conditions and occlusions, which affect their reliability. Radar-based systems were used to capture micro-Doppler signatures generated by body movements, enabling precise detection of gait anomalies [43,44,45]. The system achieved an accuracy of 98% in FG detection using radar integration with CNNs. In indoor environments, radar-based systems work very well since there is minimal external interference. However, due to their high precision, radar systems are expensive and also require a clear line of sight; hence, they are not applicable in cluttered or dynamic settings [46].
Wi-Fi-based detection relies on distortions caused by human movement in the channel state information (CSI). Wi-Fi systems are prone to environmental noise and variations in signal strength, which affect their performance in real-world scenarios [47]. In [48], an ensemble learning method was employed to analyze walking activities and predict gait events. It uses a median filter for image enhancement and LSTM to identify anomalies for the effective classification of walking patterns of various users for FG detection. The hybrid of Wi-Fi and radar technologies has been shown to improve detection accuracy significantly. In [49], Wi-Fi sensing and radar technologies were combined to classify and detect FG episodes in PD patients, achieving 98% accuracy. The Wi-Fi signals were processed using the continuous wavelet transform (CWT) for the production of scalograms. The radar micro-Doppler signatures were analyzed using the short-time fourier transform (STFT), and these features were then integrated using autoencoders and CNNs for classification. In [50], radar imaging and Wi-Fi were utilized for the continuous monitoring of activities of daily living (ADLs) and the classification of FG episodes. The approach involved generating multi-resolution scalograms from a micro-Doppler signature and CSI from radar signals. These images were used in neural networks, particularly autoencoders, to classify FG episodes and ADLs through data fusion.
Compared to the above-mentioned methods, the proposed system extracts fine-grained information from RF signals using SDR technology, enabling real-time detection of sudden and unpredictable gait interruptions associated with FG. Unlike contact-based methods, which rely on wearable sensors and are often intrusive and less comfortable for patients, or non-contact systems, such as radar and Wi-Fi, which are susceptible to environmental noise and signal variations, SDR-based RF sensing is a non-contact, non-invasive technology used to monitor various human activities that provides high accuracy and reliability [51,52]. Moreover, SDR-based RF sensing also offers high spectral efficiency and dynamic reconfiguration, allowing real-time adjustment of frequency bands and modulation schemes to optimize signal processing for gait detection. Additionally, SDR’s capability to analyze detailed RF variations allows for more accurate detection of FG [53]. Our proposed system attempts to bridge all the aforementioned gaps, including discomfort, false positives, and an inability to detect abrupt gait anomalies, using an SDR-based RF sensing platform with ASP techniques and AI models to enable better mobility, reduce falls through the early detection of FG, and enhance QoL, thereby setting a new benchmark in intelligent gait monitoring.
3. System Design
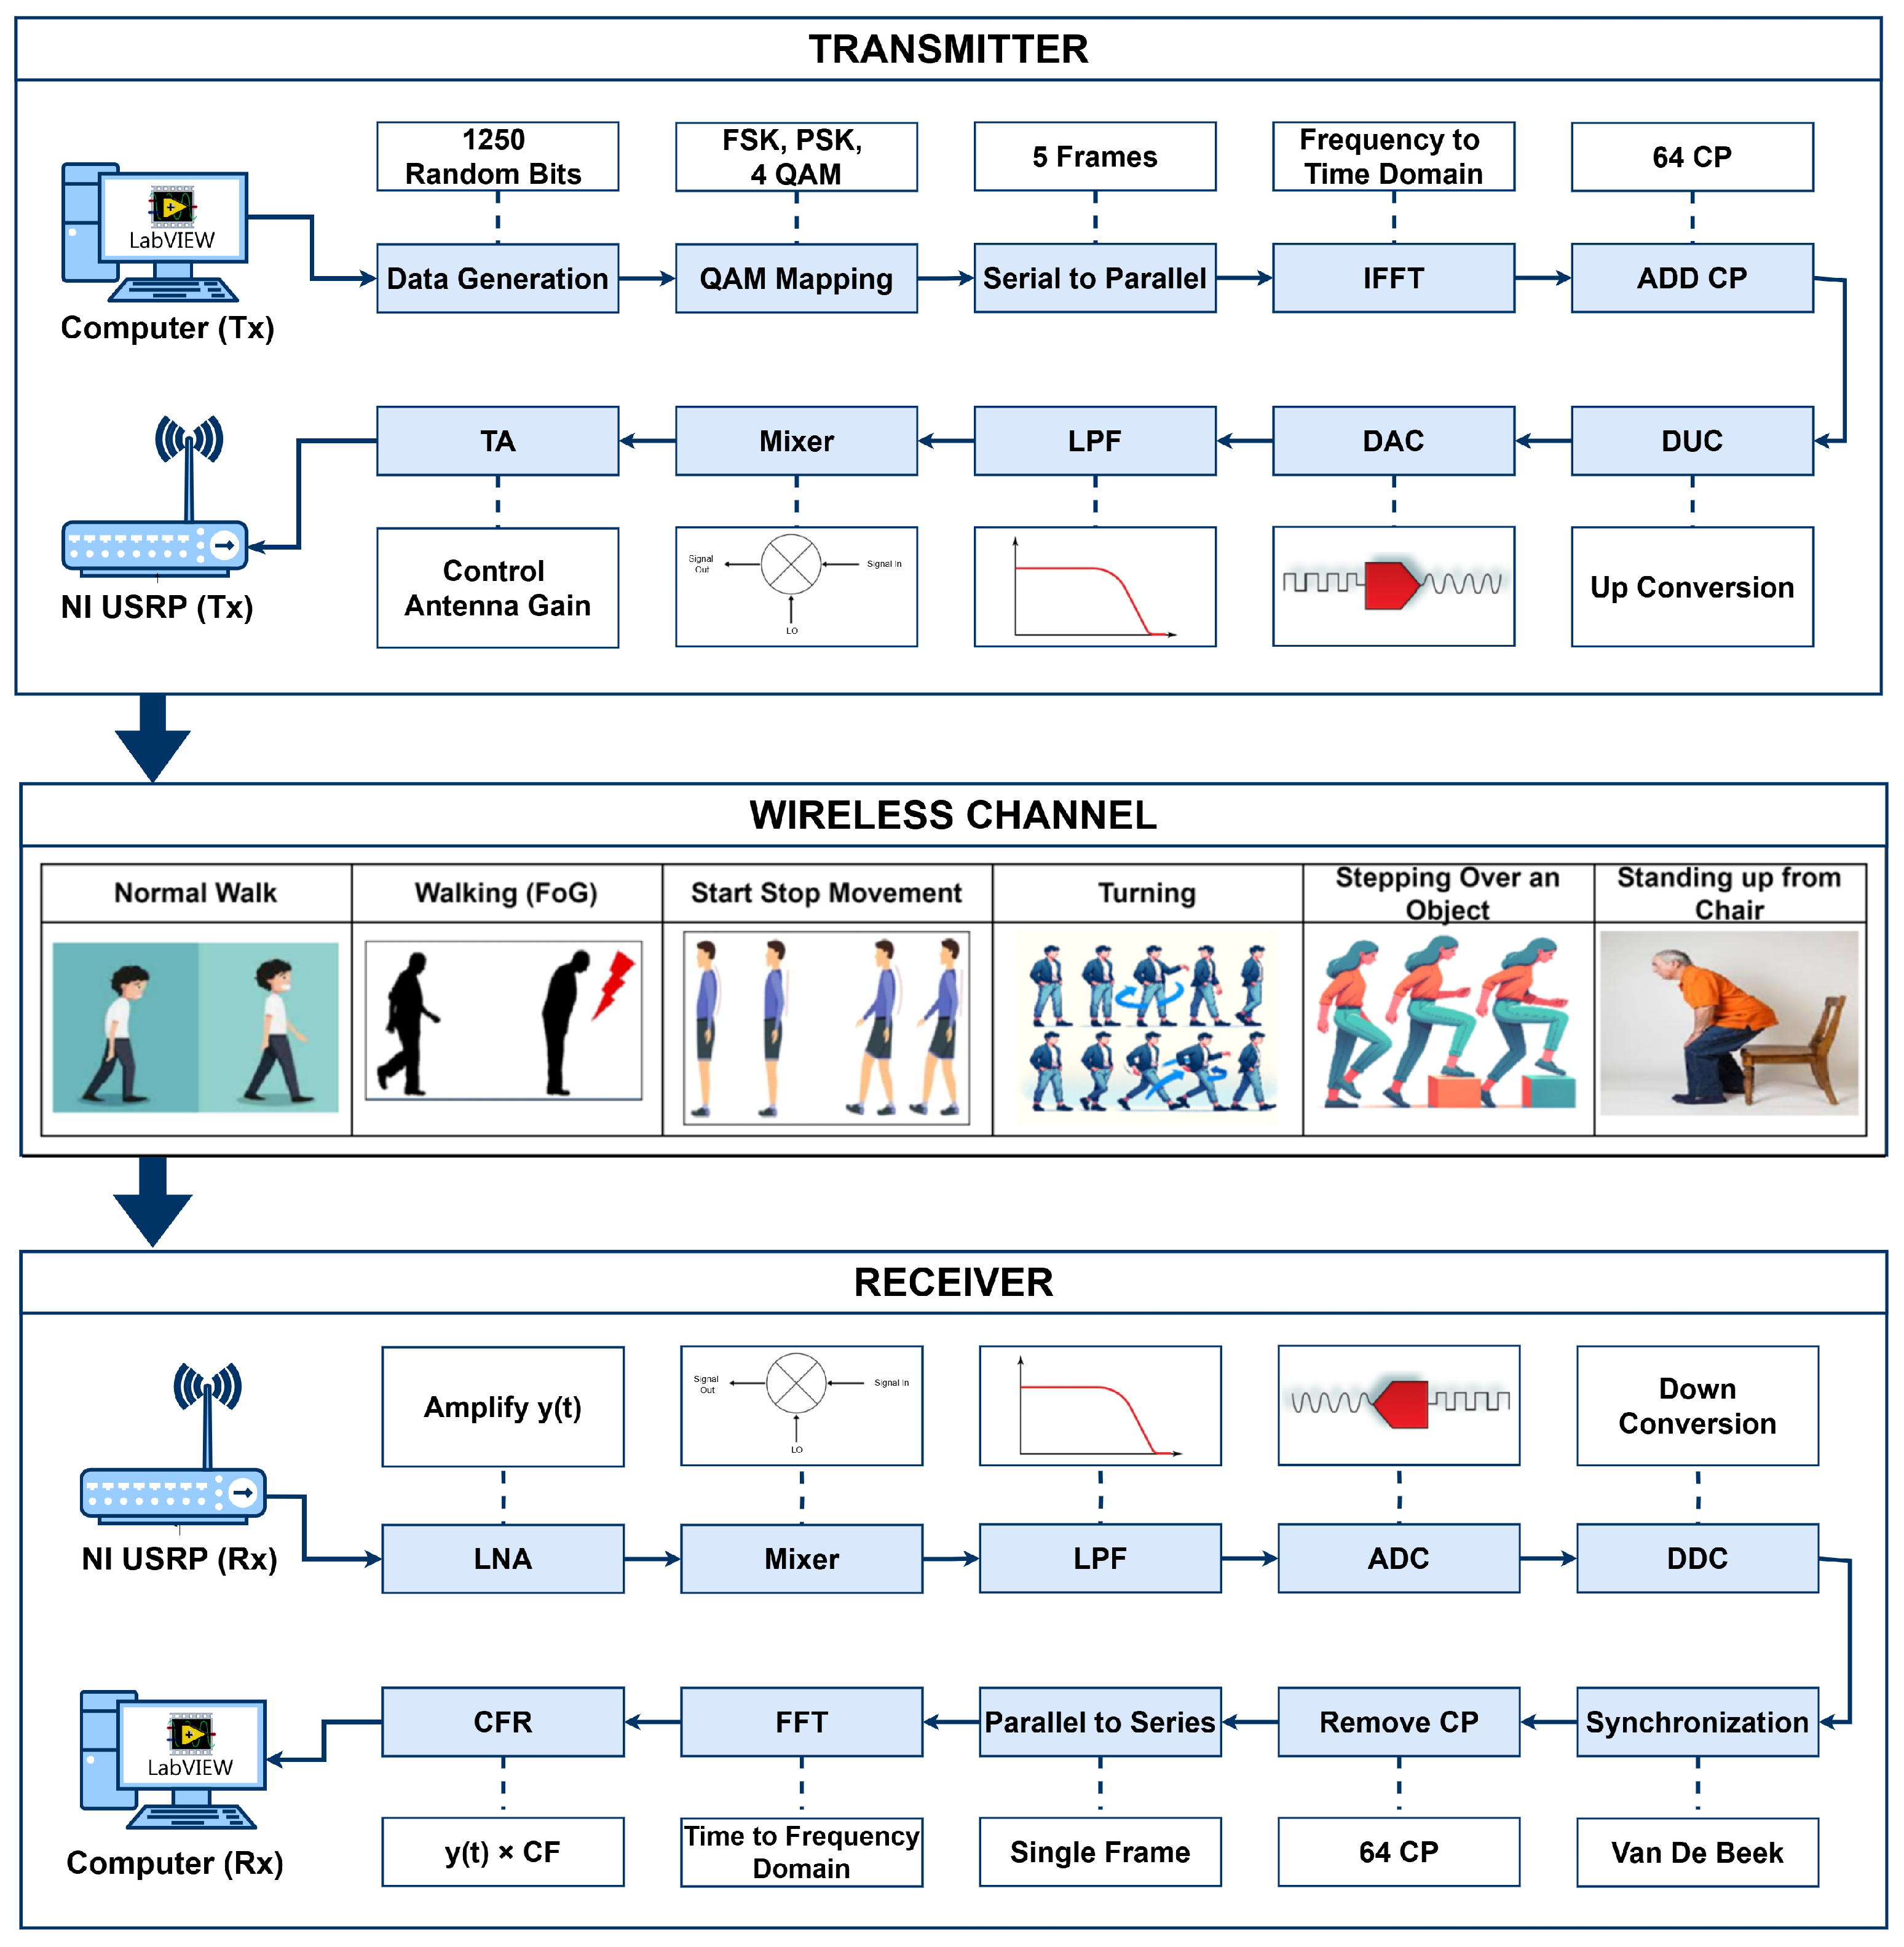
The system utilizes SDR technology with universal software radio peripheral (USRP) model 2922 devices, directional transmitter and receiver antennas, and Personal Computers (PCs), as depicted in Figure 1. The software-defined functionality of the SDR technology is implemented using LabVIEW software version 2023 Q3 on the transmitter and receiver PCs.
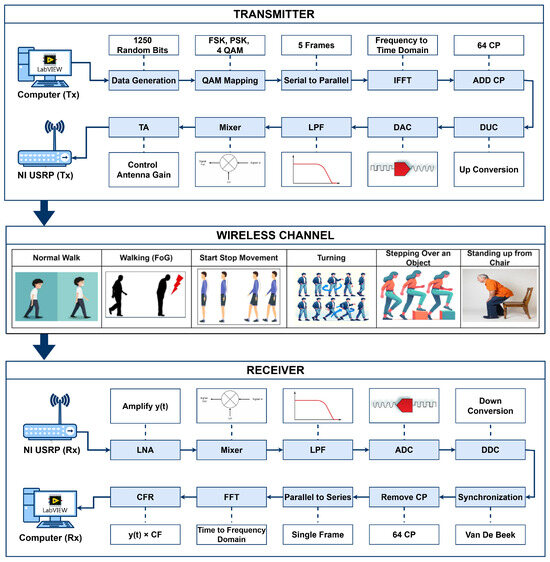
Figure 1.
System design of SDRF sensing for monitoring of FG.
On the transmitter side, the signal is transmitted using the software-defined functionality of the transmitter PC. Initially, random data bits are generated as an input signal. This signal is modulated using quadrature amplitude modulation (QAM), as described in Equation (1). By using QAM, the bits are converted into symbols, forming a complex signal representation.
where consists of complex data modulated using QAM, and and denote the in-phase and quadrature components, respectively. The symbols are then partitioned into five parallel streams, each containing symbols. Using a 256-point inverse fast fourier transform (IFFT), the complex data signal is converted to a time-domain signal using Equation (2):
After conversion into the time domain, the cyclic prefix (CP) is added as the last one-fourth sample at the start of each frame to avoid inter-symbol interference (ISI) [19]. The USRP transmitter device performs several key functions, including digital up conversion (DUC), which interpolates the signal received from the transmitter PC via a USB cable to 400 samples/second. The digital signal is converted into an analog signal using a digital-to-analog converter (DAC). The signal is then filtered using a 20 MHz low-pass filter (LPF), and the carrier frequency is set to the desired level using a mixer. Before the signal is transferred through the wireless channel via the Tx port and transmit antenna, transmit amplification (TA) is used to adjust the gain of the signal to between 0 and 30 dB.
The transmitted signal, which passes through the wireless channel and is received at the Rx side, undergoes amplitude and phase changes that can be characterized in terms of the channel-frequency response (CFR). Different types of FG activities are performed at the wireless channel to extract the time-series data of the CFR. The time-series CFR is used to analyze the WCSI for FG activities at the receiver. The receiver USRP collects the incoming signal through the wireless channel from the directional antenna. The received signal is then amplified using low-noise amplification (LNA), which enhances signal strength while mitigating noise.
Then, the mixer is used to multiply the signal with the carrier frequency, and the signal is then converted back to a digital signal using an analog-to-digital converter (ADC). The receiver PC decimates the signal for software processing using a digital down converter (DDC). The acquired signal contains the carrier frequency offset (CFO) due to discrepancies between the transmitter and receiver oscillators, leading to sub-carrier orthogonality issues and inter-carrier interference (ICI). To address this, the receiver estimates and compensates for the CFO. This is achieved either in the time domain by adjusting the oscillator carrier frequency directly or in the frequency domain using the FFT. The CFO calculation involves multiplying each sample n by , where is the normalized CFO and N is the total number of sub-carriers. The received signal can be modeled as shown in Equation (3):
where represents the channel response, represents the additive noise, and represents the timing offset. The Van De Beek algorithm is employed at the receiver end to mitigate frequency and timing offsets. Equation (4) is used to convert the data from the time domain to the frequency domain:
where is a complex CFR value. To extract the magnitude and phase responses, Equations (5) and (6) are used, respectively:
where and denote the real and imaginary parts of the CFR, respectively.
The amplitude and phase responses of multi-carrier frames are given by Equations (7) and (8), respectively:
The total number of sub-carriers is denoted by k, while F represents the total number of OFDM frames.
In this study, the amplitude response of multi-carrier OFDM frames was used to extract the time-series WCSI for detecting FG.
4. Methodology
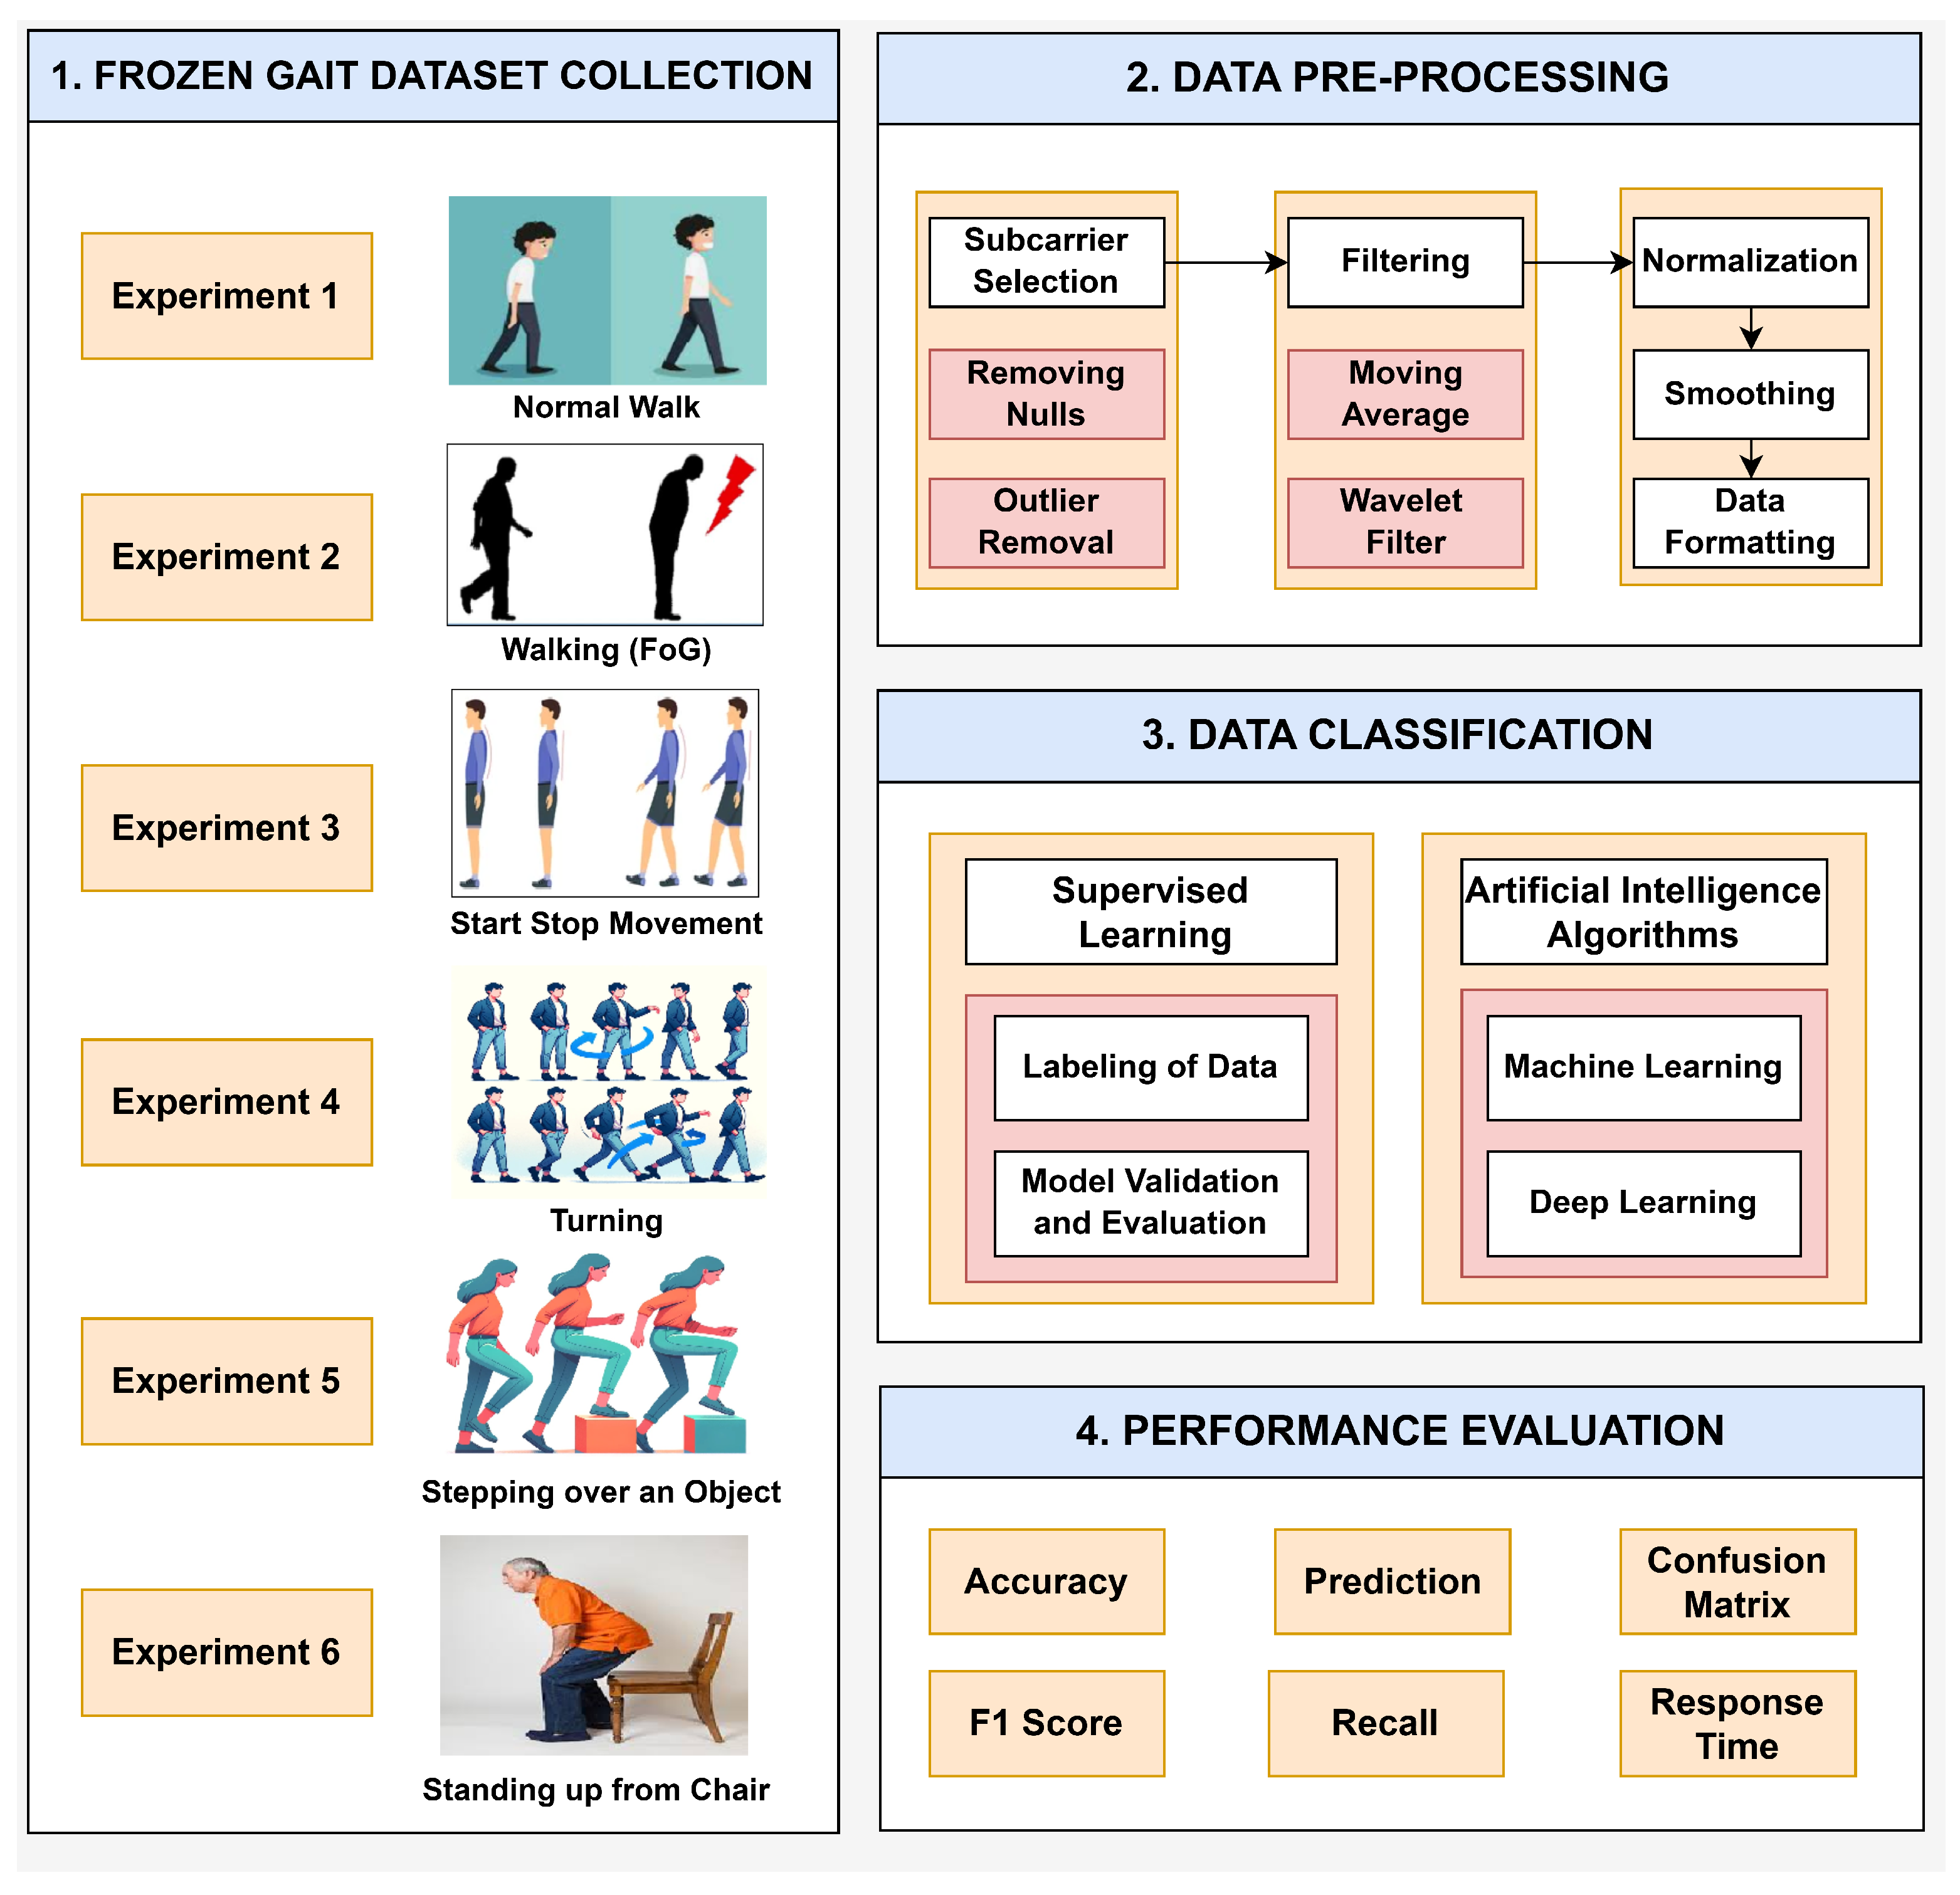
The real-time implementation of the intelligent FG detection system is presented in Figure 2. The identification of PD symptoms, such as FG, through the analysis of gait patterns using RF sensing and SDR technology involves several intricate phases: dataset collection, data pre-processing, data classification, and performance evaluation.
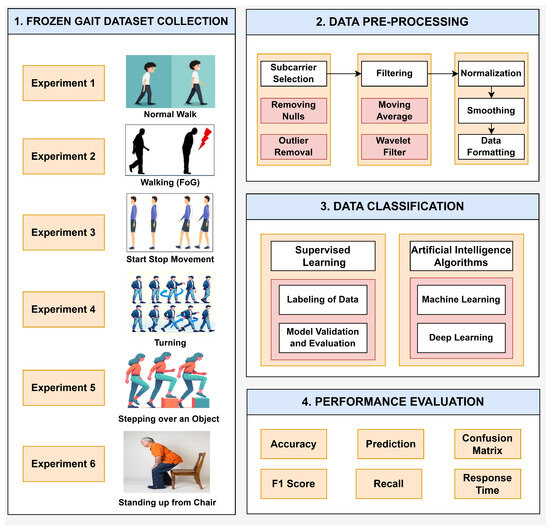
Figure 2.
Block diagram of the methodology of the SDRF sensing platform for FG monitoring.
4.1. Data Collection
Data were collected through SDR technology using the RF sensing experimental setup, as depicted in Figure 3. In this platform, the transmitter side comprises a transmitter (Tx) PC that generates the required digital signals, a Tx USRP that translates these digital signals into RF, and a Tx antenna that transmits the RF signal. On the receiver side, an Rx antenna receives the RF signal, an Rx USRP transforms the RF signal back to digital form, and an Rx PC extracts the WCSI and analyzes the received WCSI data. Data communication and control between the Tx and Rx units were facilitated via Ethernet. An object was placed between the Tx and Rx sides to investigate the impact of human interference on the signals. The adjusted data collection information and parameters are given in Table 1 for the identification of FG activities. This experimental framework addresses real-time environmental challenges. The significant variations in the WSCI are helpful for analysis. Each individual performed the FG activities, and the variations in the RF signal were analyzed to detect different FG patterns.
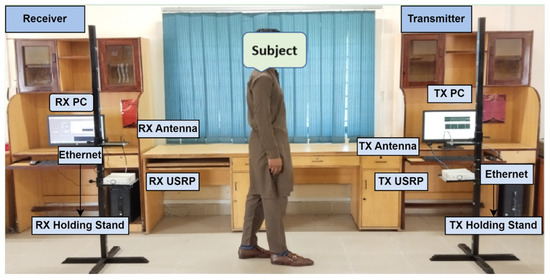
Figure 3.
SDR-based RF sensing experimental setup for monitoring of frozen gait.

Table 1.
Dataset collection information and adjusted system parameters for FG monitoring.
This study collected data from six different gait activities: (1) normal walking, (2) walking (FG), (3) start-stop movement, (4) turning, (5) stepping over an object, and (6) standing up from a chair. The six FG activities were derived from analysis in [54] and correspond to clinical conditions that depict the occurrence of FG episodes in PD patients. These six categories are characterized as follows: normal walking is the reference and is a smooth, unbroken gait with no FG symptoms; walking (FG) indicates intermittent freezing during walking, suggesting transient motor blockages; a start-stop movement indicates difficulty in starting and stopping movement, which can be associated with bradykinesia; turning indicates difficulty in spatial orientation and balance, with an increased risk of falls; stepping over an object represents impairments in obstacle negotiation, suggesting an impaired adaptive gait; and standing up from a chair depicts transitional movements that may be influenced by postural instability.
The experiments enrolled 10 healthy adult participants, both male and female, with different demographics, as given in Table 2. Each participant performed all six gait activities for 15 s per trial, and each activity was repeated 10 times. The idea was to record a broad spectrum of movement patterns to facilitate the detection of anomalies, especially FG events, thus improving the generalization of the proposed approach. Before data collection, each participant was provided with a proper orientation through a video demonstration. It is worth mentioning that the data acquisition platform was free from any risks to human health. All experimental procedures were carried out after getting both verbal and written consent from participants. The Ethics Review Committee of COMSATS University Islamabad, Attock Campus, allowed the collection of the data for the research.
Table 2.
Participant attributes.
4.2. Data Pre-Processing
It is crucial to clean raw data from SDR-based RF sensing systems. The sub-carrier selection was used to filter out the most important signals from the given RF spectrum [55]. This process avoids the use of less relevant sub-carriers, thus improving the efficiency of the data analysis process. It aimed to exclude all the signals that may not have been so relevant to the extraction of relevant information about the gait pattern. Dealing with null values focused on the absence of data points, replacing them with some estimate derived from the other data points. The outlier removal process involved the use of statistical techniques to remove data points that were considered out of order [56]. A moving average filter was used to remove unwanted noise, such as short-term oscillations, which was averaged to provide insight into long-term trends. Wavelet filtering improved the quality of the signal by analyzing it across different frequency bands to reduce noise [57]. In particular, a soft heuristic SURE thresholding technique was employed with the scaled noise option turned on for detail coefficients from a level-4 decomposition with a sym5 wavelet function. A moving average filter with a window size of 1024 was also used to smooth high-frequency, unrelated noise from gait activities. After filtering, normalization was performed to place data points on a common scale by converting them into a format where they would have a zero mean and variance of one. Finally, data formatting was performed to prepare the cleaned data for a form suitable for analysis purposes. All gait activities were performed for 15 s per experiment. The system captured 250 samples per second and a total of 3750 samples per activity. These 3750 samples were utilized for data pre-processing and for training both the machine learning and deep learning models.
4.3. Classification
The classification module in gait analysis is extremely crucial in this context since it categorizes different patterns and disorders from pre-processed data. This research used supervised learning because it entails training models on datasets tagged with labels. These datasets contained details on various forms of gait or movement profiles/activities of FG. The dataset was properly labeled to train the classification models, which is a very sensitive process. The annotation process involved labeling each row of data as belonging to one of these gait activity categories. The labeling needed to be precise so that the model could learn the correct movement patterns for each gait class. After training the classification models, it was necessary to assess their performance to determine whether they could efficiently classify gait patterns. The train-test split was used for validation. A cross-validation train-test split gives a better idea of how well the model would perform on new data that has not previously been used for training. The machine learning and deep learning models were employed to monitor the six FG activities. The four ML algorithms—ensemble, random forest, k-nearest neighbor (KNN), and support vector machine (SVM)—were trained to monitor and detect FG episodes in real time. The four DL algorithms—gated recurrent unit (GRU), bidirectional GRU (Bi-GRU), recurrent neural network (RNN), and long short-term memory (LSTM)—were also trained to enhance accuracy in FG monitoring. We tuned the hyperparameters of the deep learning models mentioned in Table 3 to enhance their performance. These hyperparameters were set following previous studies in which the SDR-based RF sensing system framework was presented for the internet of medical things (IoMT) [58].
Table 3.
Deep learning models: hyperparameter tuning.
4.4. Performance Evaluation
A classification analysis was carried out to evaluate the performance of the AI models in effectively detecting gait patterns and disorders from the prepared dataset from the RF sensing system. This evaluation utilized various performance metrics. Accuracy is a basic measure that determines the number of correctly classified instances relative to the total instances. It is computed as the sum of true positives and true negatives divided by the number of instances. In this case, the assessment of the predictive model entailed determining the models’ performance in predicting gait patterns and then comparing the results to the actual labels. This comparison made it possible to assess the predictive nature of the models. A confusion matrix gives an overview of how a classifier performs by analyzing the true positives, false positives, true negatives, and false negatives. This facilitates the understanding of a model’s performance on a dataset and its accuracy in classifying instances. The model’s precision and recall scores are then combined to obtain the F1 score. The F1 score provides a single, comprehensive indicator of the model’s performance and is computed using the harmonic mean of precision and recall. Recall, also known as sensitivity, measures the capacity of a model to correctly identify positive instances. These metrics are important for determining how well a model performs in real time or when data are processed in large quantities. By applying these performance evaluation metrics, one can determine the suitability and effectiveness of classification models in identifying gait patterns and abnormalities.
5. Results and Discussion
The results are discussed in terms of the experimental outcomes and classification results to analyze the model’s performance. The experimental results focused on RF sensing detection of FG patterns and provided valuable insights. The classification results included the analysis of machine and deep learning models’ performance based on different metrics, i.e., accuracy, precision, recall, and F1 score.
5.1. Experimental Results
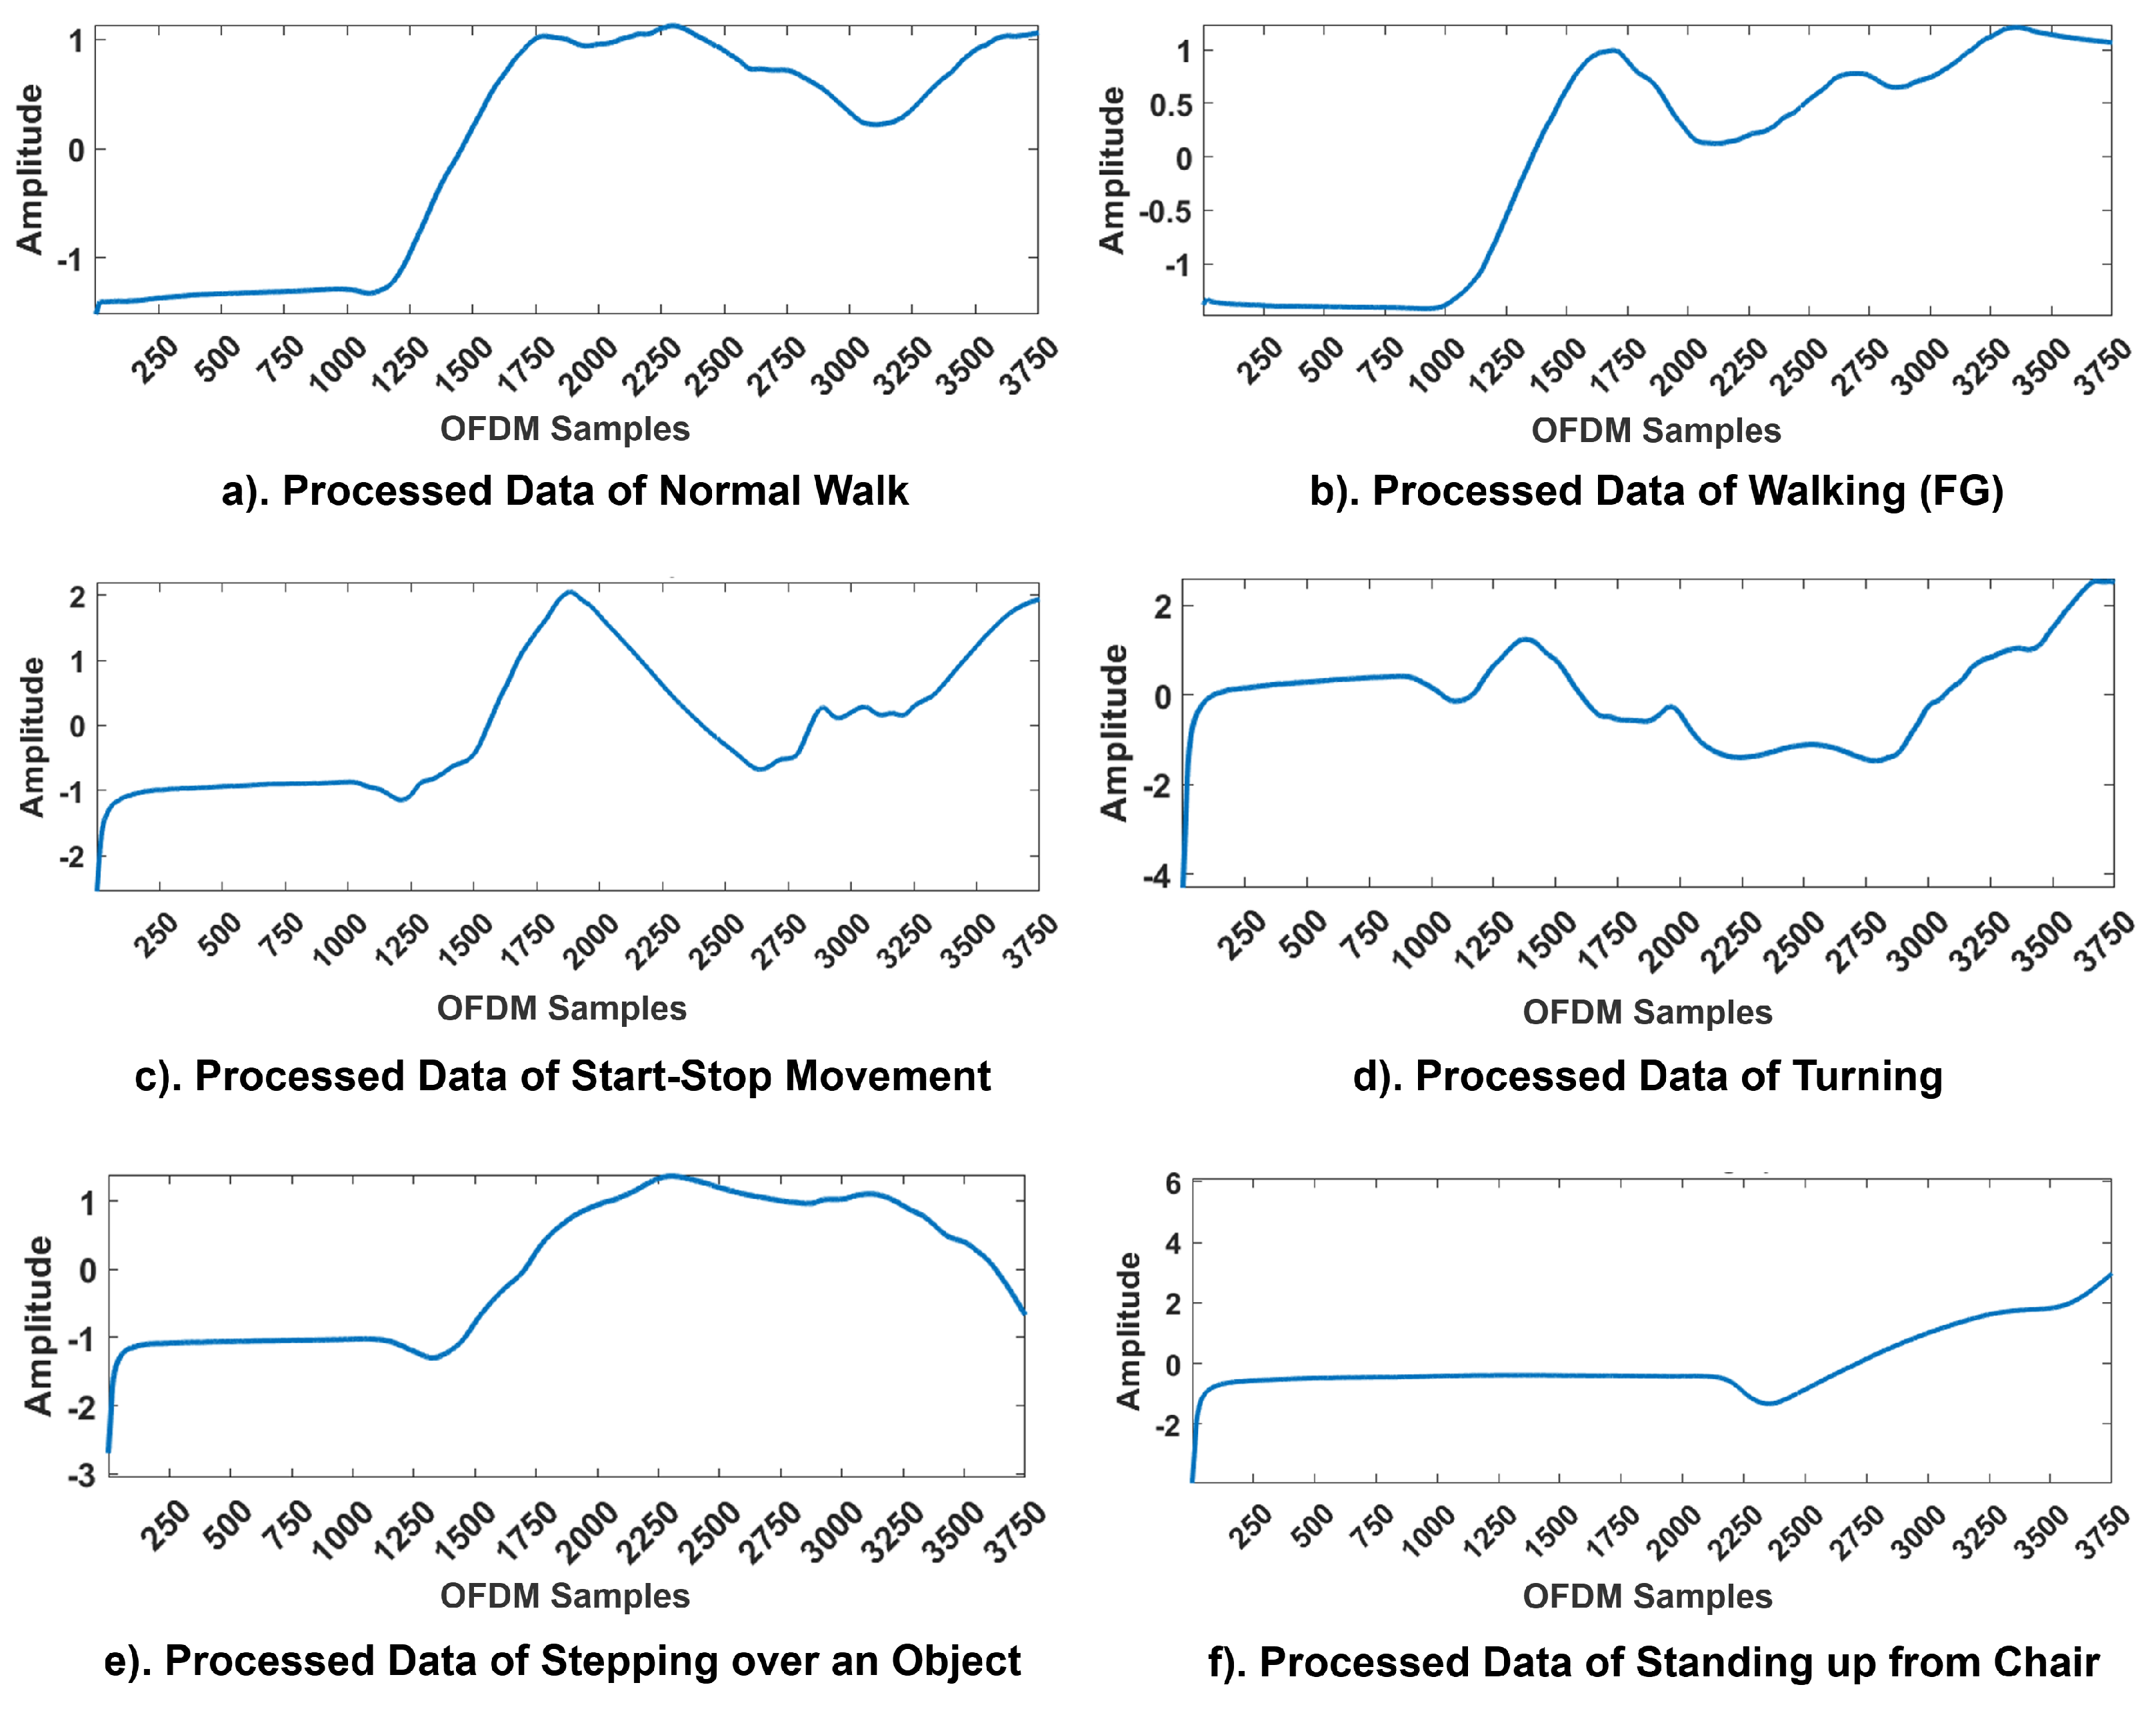
The WCSI of all six activities—normal walking, walking (FG), start-stop movement, turning, stepping over an object, and standing up from a chair—is presented in Figure 4. The findings showed that variations in body movements significantly influenced the amplitude response for each activity. All the experiments were performed along a pre-defined linear path of 5 m, except for turning, as it required a change in direction at the midpoint. During the 15 s, the first 4 s were allocated for relaxing and standing still. For Activity 1, the participants walked normally. For Activity 2, the participants experienced an episode of FG during their walk. The participants started walking after 4 s; at 8 s, they experienced FG, and at 13 s, the participants returned to their original positions. For Activity 3, from 4 to 8 s, the participants walked normally; from 8 to 10 s, the participants experienced FG, and at 11 s, the participants returned to their normal positions. Again, the participants experienced FG from 13 to 15 s and then resumed their original static walking positions. For Activity 4, the participants walked normally along the instructed path and turned at 8 s, experiencing FG, and remained in this position for the next 11 s. Finally, over the next 3 s, the participants returned to their original positions. For Activity 5, 4 s was the settling time; at 8 s, the participants experienced FG and could not step over, remaining in this position until 11 s and then finally returning to their original positions. For Activity 6, the participants tried to stand up from the chair; at 8 s, they became stuck or remained in the same position for the next 5 s and then returned to their original static standing positions.
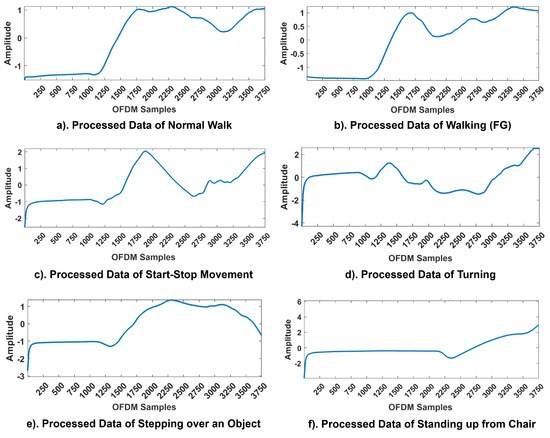
Figure 4.
CFR Patterns of activities in FG monitoring. The x-axis corresponds to the OFDM samples and the y-axis to the amplitude responses of the WCSI.
All patterns were affected by channel noise in real-time environments. However, the pre-processing techniques applied at the receiver end effectively retained critical information about sudden gait anomalies. The variations in the WCSI for each activity can be seen clearly in Figure 4. For each activity, a unique pattern was obtained for the WCSI, which was used for further processing and classification. The findings of the experiments showed that the proposed framework successfully navigated real-world challenges and identified significant trends in the WCSI corresponding to the FG patterns. The WCSI amplitude fluctuations associated with each activity provided a non-contact and non-invasive basis for detecting gait disturbances to prevent falls and improve QoL. The real-time analysis confirmed that the RF sensing system is capable of detecting gait disturbances, thereby validating its practical applicability in addressing these challenges.
5.2. Classification Results
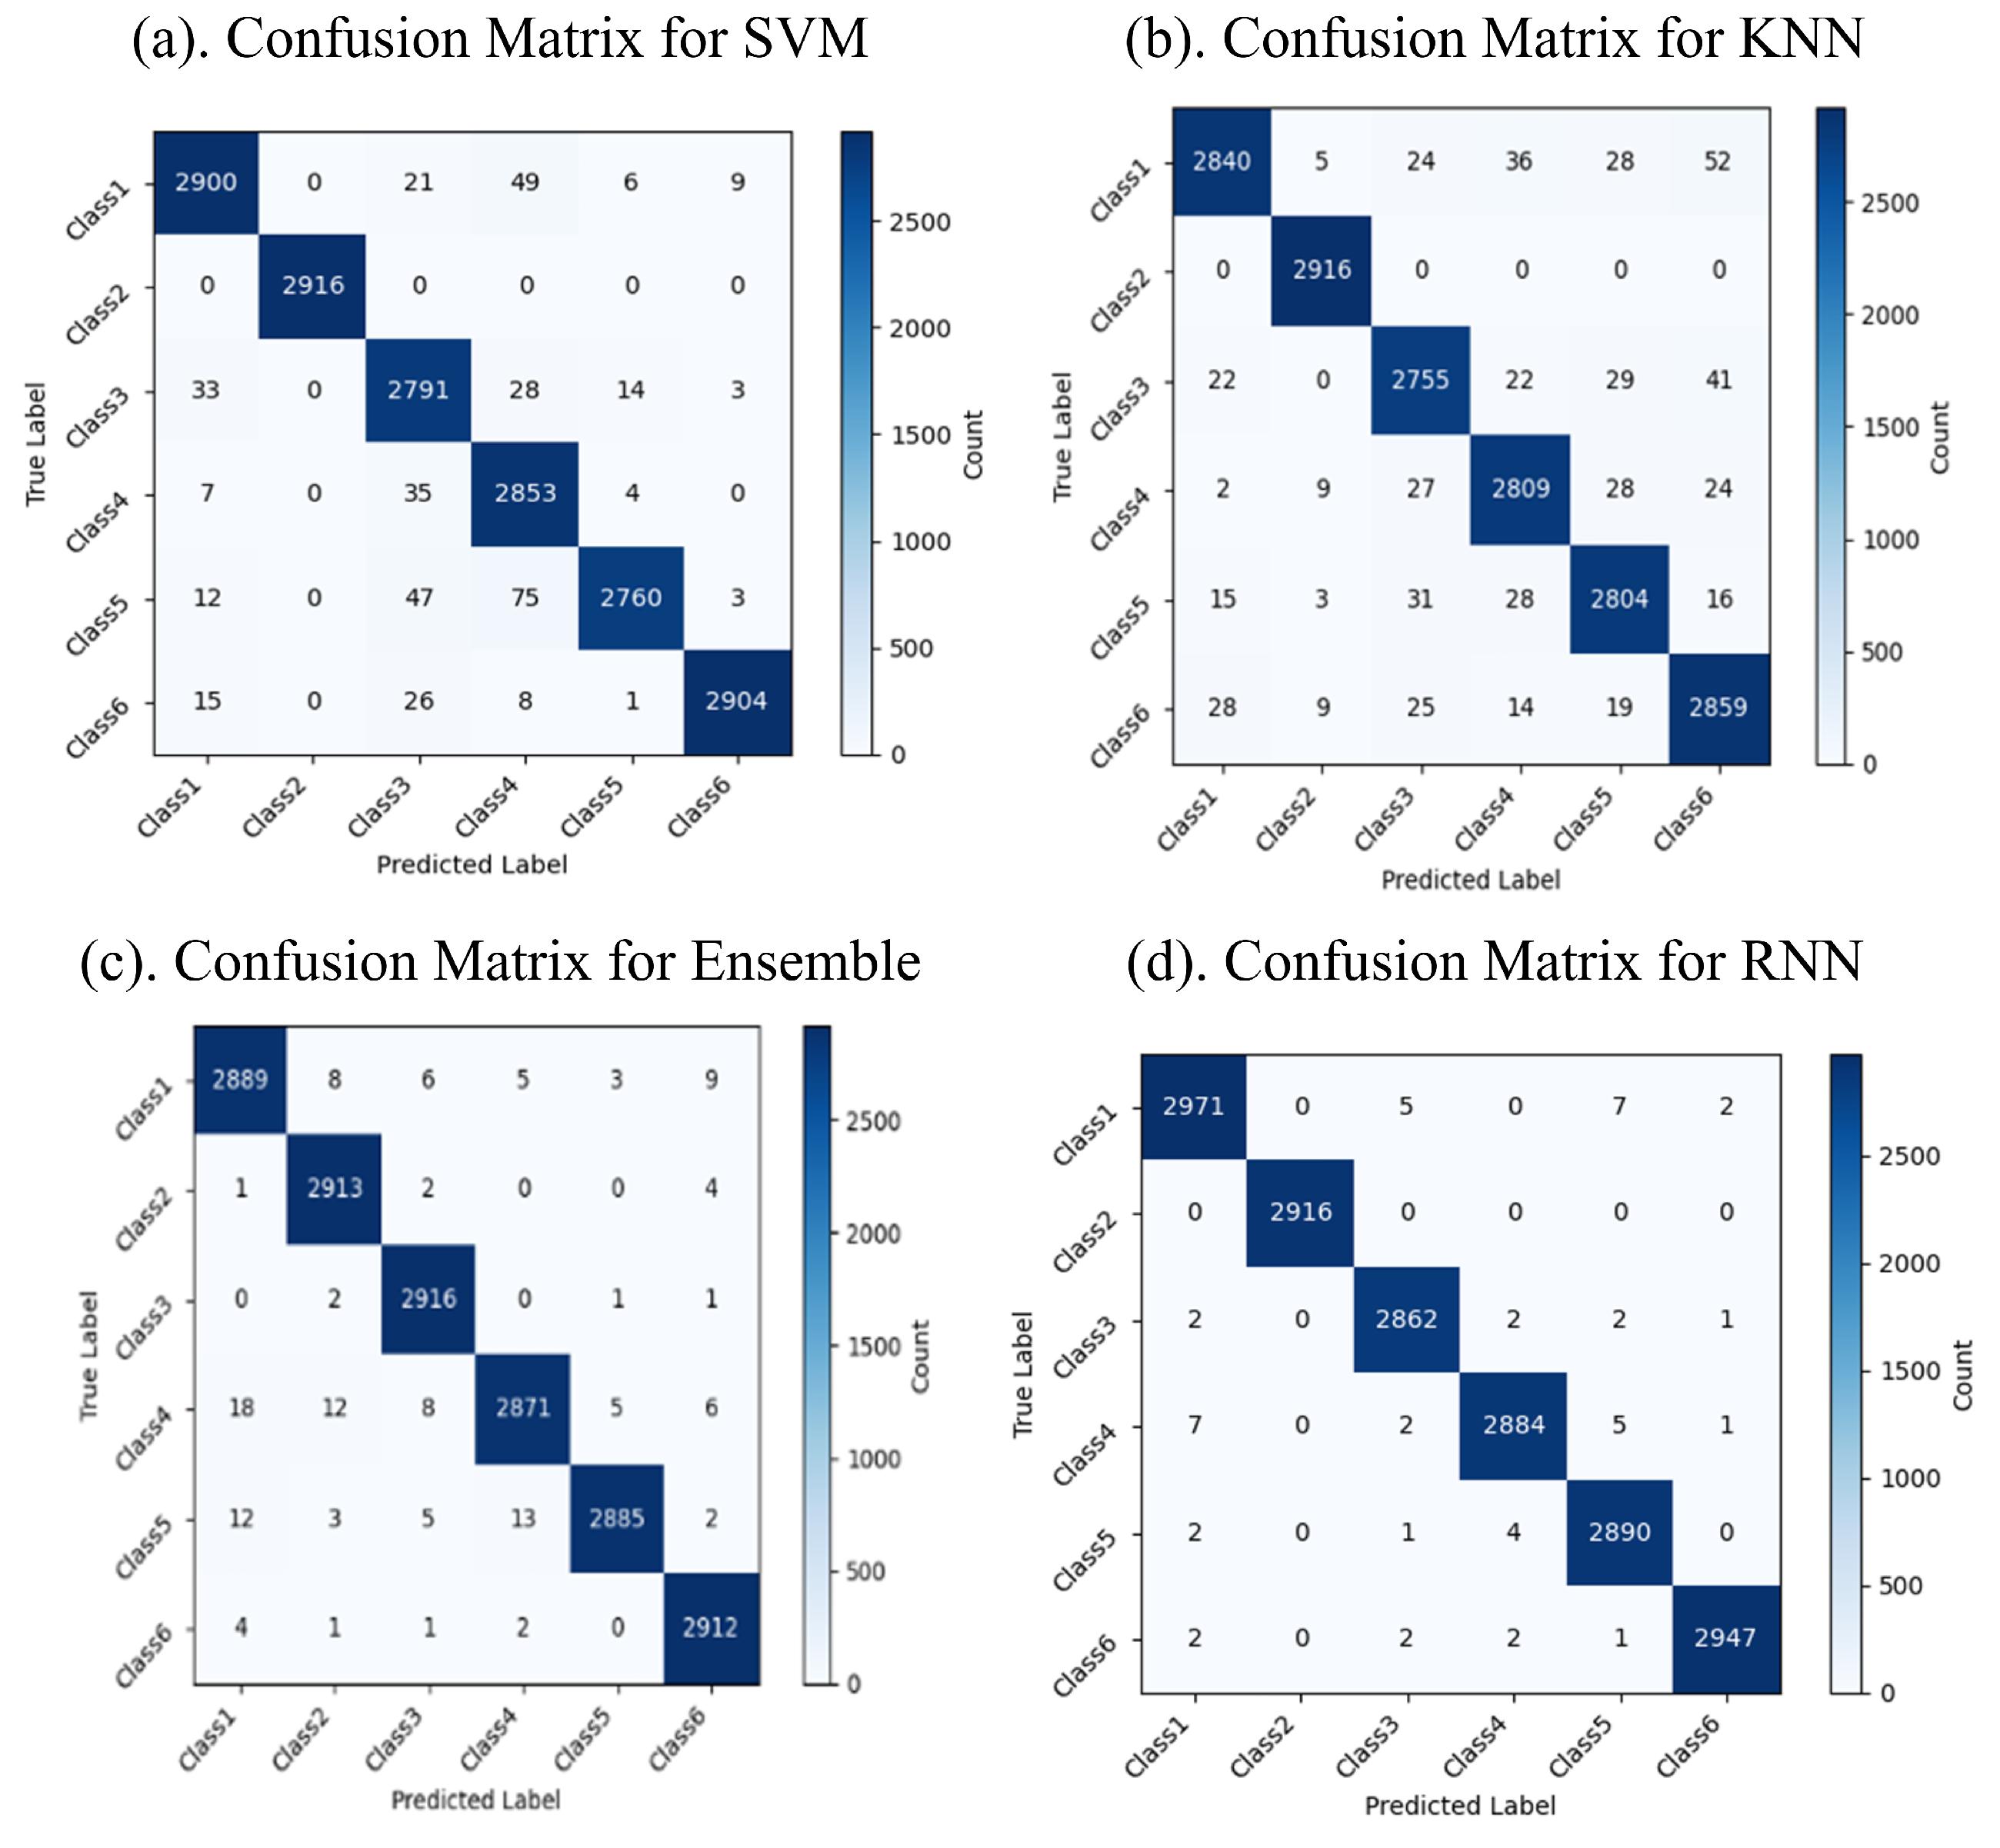
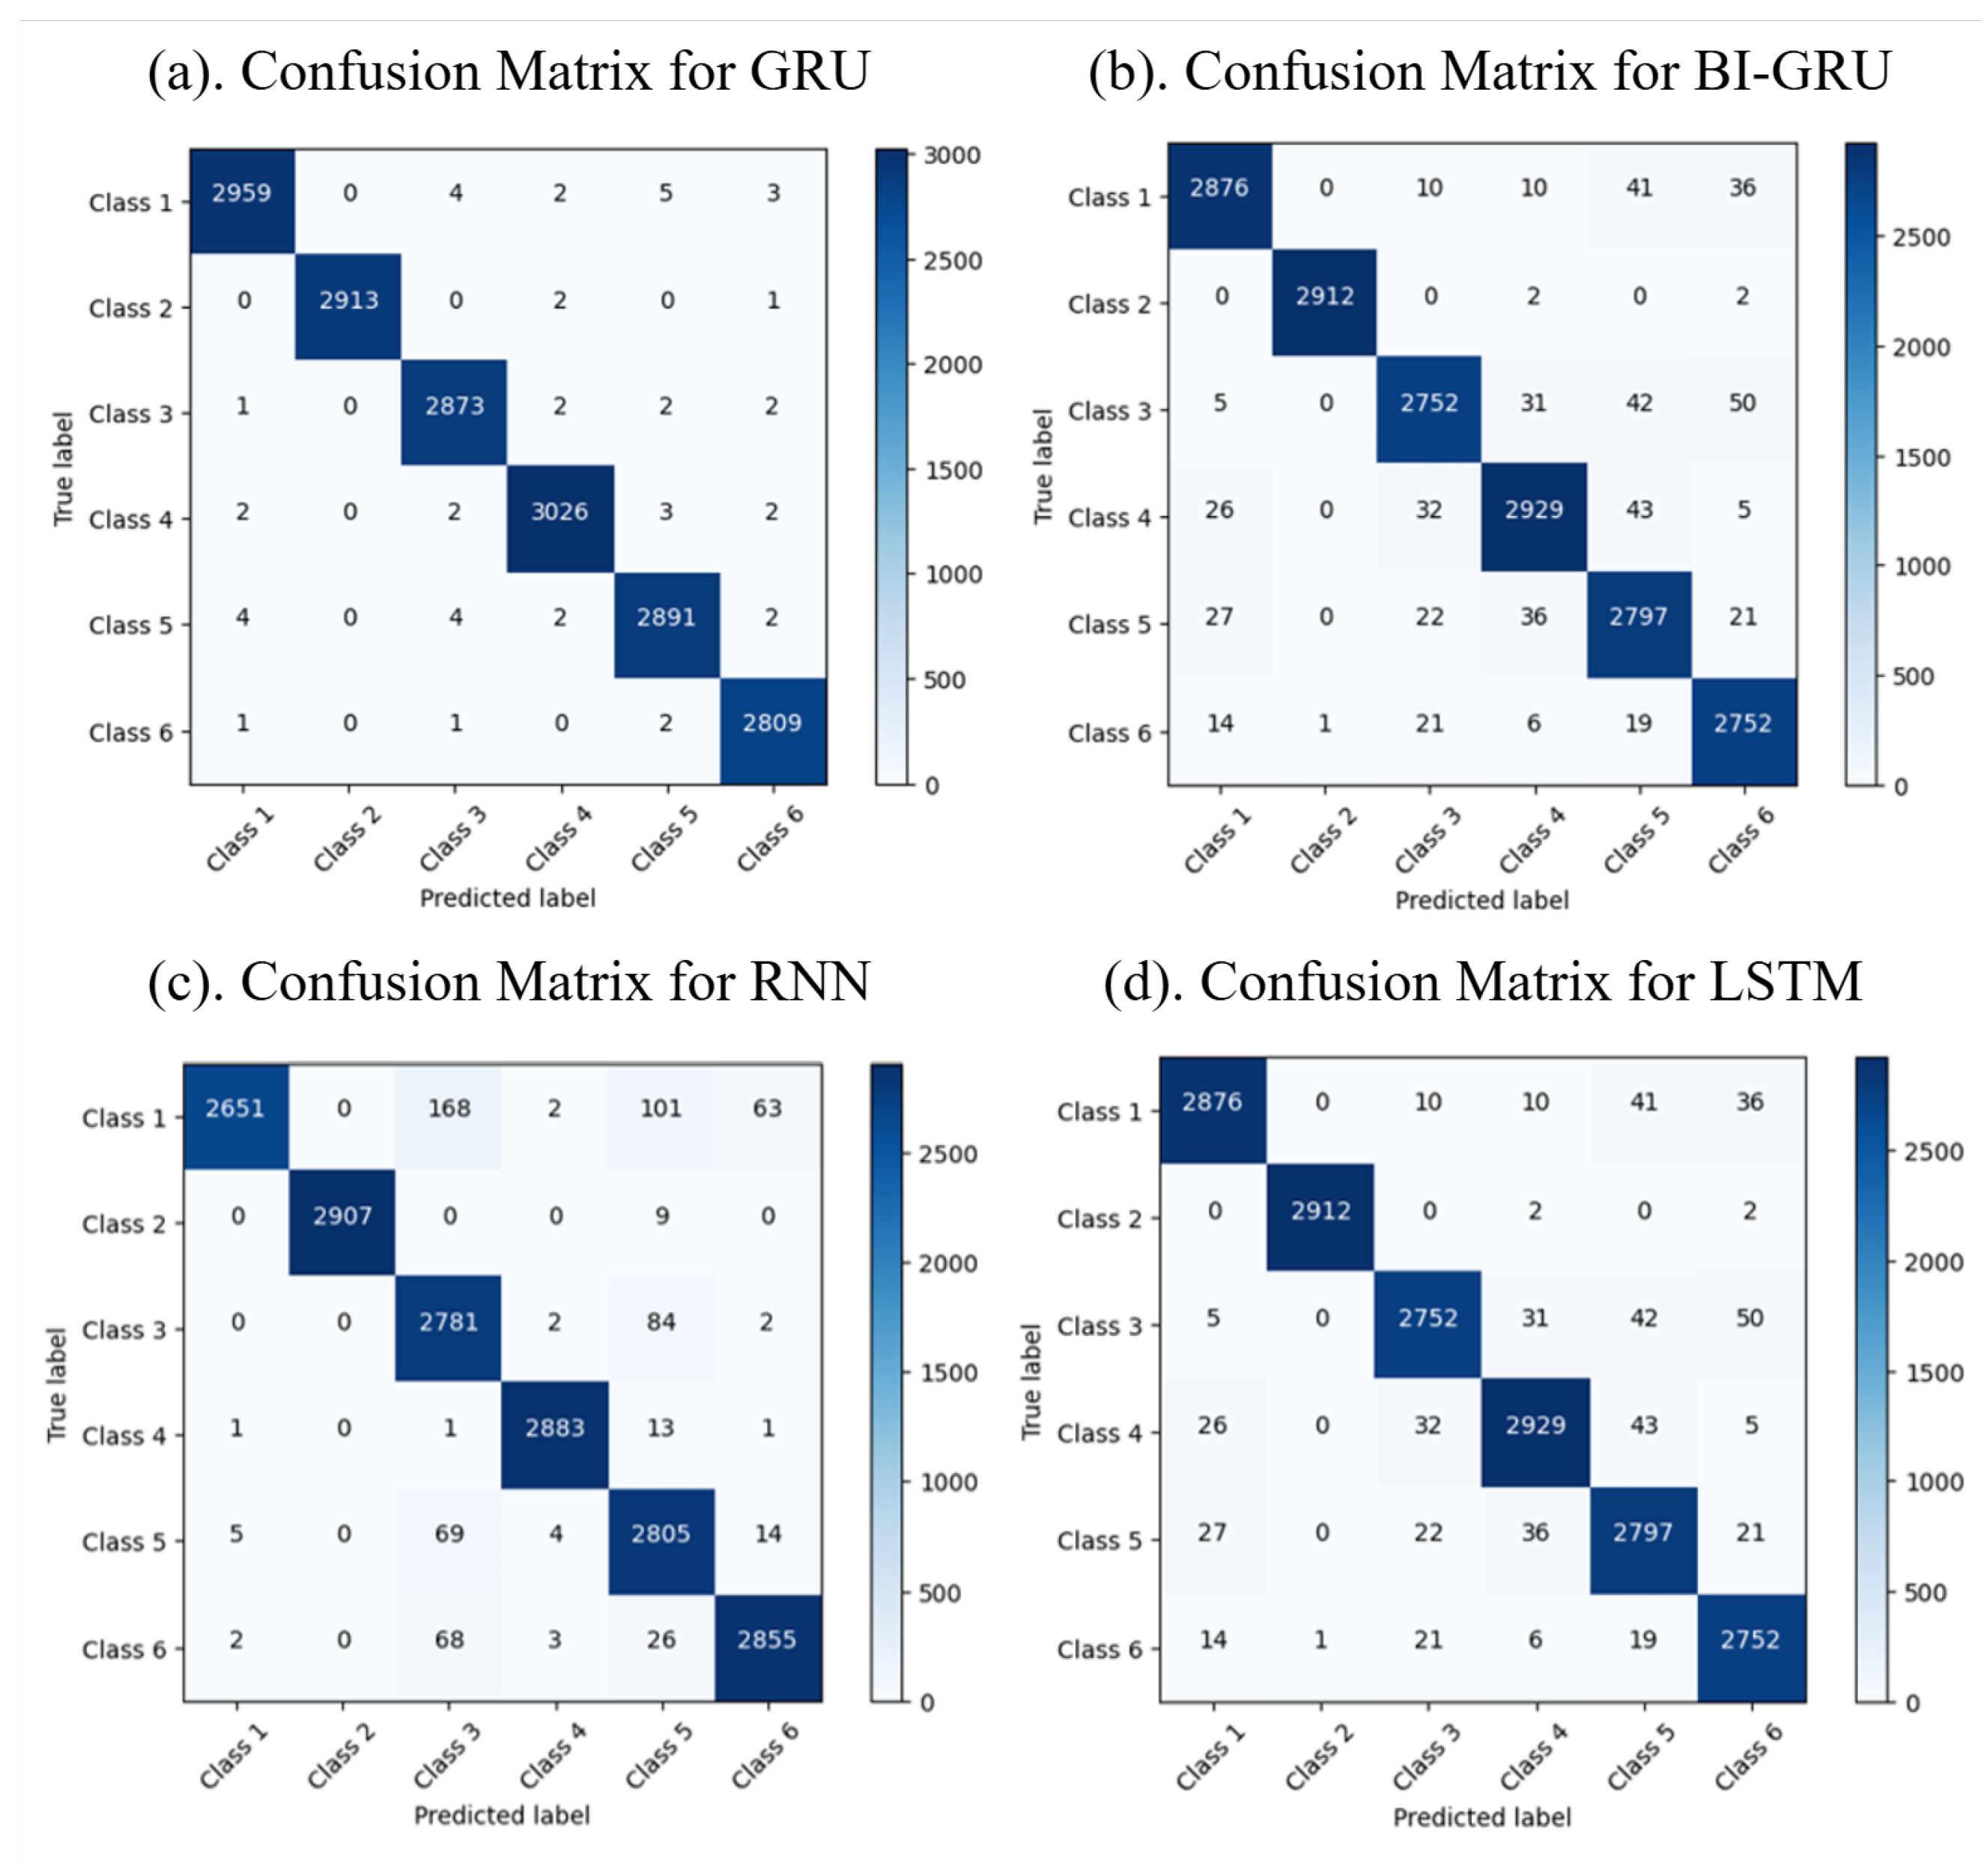
The classification results reveal the performance of the machine and deep learning models in categorizing six distinct classes of FG patterns. The confusion matrices display the predicted versus actual classes, with the diagonal values indicating the correct predictions and the off-diagonal values highlighting the misclassifications. The confusion matrices for the machine and deep learning models are shown in Figure 5 and Figure 6, respectively. Among the machine learning models, RF achieved the highest accuracy of 99.4%, followed by the Ensemble model with 99.3% and KNN with 98.4%, while SVM had a slightly lower accuracy of 86.2%. Among the deep learning models, GRU outperformed the others, achieving an accuracy of 99.7%, while Bi-GRU, RNN, and LSTM demonstrated high classification accuracy and robustness. The results indicate that RF and Bi-GRU are the most effective models for achieving optimal accuracy and minimal misclassifications, making them better options for the classification of FG.

Figure 5.
Confusion matrices for machine learning models.
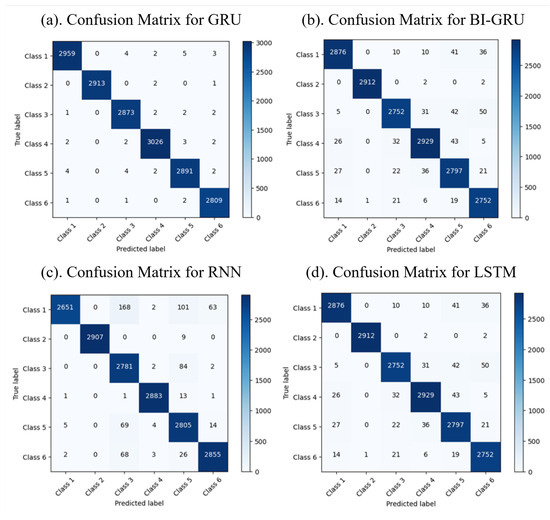
Figure 6.
Confusion matrices for deep learning models.
5.3. Performance Analysis
The performance evaluation of ML and DL models highlighted significant differences based on the dataset’s size and complexity. Table 4 demonstrates that RF achieved the highest accuracy (99.4%) among the ML models, closely followed by the Ensemble method (99.3%). Both models also achieved better precision and recall values, making them reliable classifiers for smaller datasets. In contrast, as presented in Table 5, the DL algorithms surpassed their ML counterparts when handling large datasets. GRU achieved the best precision, recall, and F1 score of 1.0, demonstrating exceptional performance. Bi-GRU also performed well with an accuracy of 99.1% and a high F1 score of 0.991. Other DL models like LSTM and RNN maintained strong results, whereas Bi-LSTM demonstrated lower metrics, likely due to dataset-specific challenges. These results demonstrate the superior capability of DL models in efficiently processing large datasets and achieving higher accuracy and reliability compared to ML models.
Table 4.
Performance metrics of various ML algorithms.
Table 5.
Performance metrics of various DL algorithms.
6. Conclusions
The proposed system is a viable solution for real-time monitoring of PD symptoms, specifically FG episodes. In this research, we combined AI techniques with SDR-based RF sensing technology to design a novel, contactless, and non-invasive approach for gait monitoring and analysis. This innovative approach utilizes SDR-based RF sensing technology to capture even the slightest shifts in RF signals during their interaction with the human body in motion. These signals are filtered to extract meaningful gait information. This method reduces the use of wearable sensors typically worn by patients, thereby enhancing comfort. Due to the high sensitivity of our system in detecting gait patterns, it can alert patients and caregivers when FG episodes occur. This novel solution has the potential to improve the lives of PD patients via effective, unobtrusive monitoring systems for FG detection.
This research focused on a single-person setting and collected data on only a small number of actions. Such limitations make it clear that further work needs to be carried out to improve the system’s versatility and reliability. Future work will include extending this study to multiple scenarios, comparing and validating it across different PD severity levels, and incorporating a broader range of daily activities to capture more detailed gait patterns. Comprehensive and varied gait data are required from the RF sensing system to improve the accuracy and reliability of the AI models. Testing in real-life patient homes or clinical settings will further enhance the practical utility of the application and confirm its suitability for everyday use. Expanding the application of our monitoring techniques to other medical conditions would increase the system’s significance in healthcare. The user-friendly interfaces designed for patients in clinical applications will enable easy incorporation into healthcare facilities.
Author Contributions
Conceptualization, M.B.K.; methodology, M.B.K., H.B. and R.H.; software, R.H., H.B. and M.R.; validation, M.B.K., R.H. and M.R.; formal analysis, M.B.K. and H.B.; investigation, M.B.K., M.R. and S.A.K.T.; resources, M.B.K. and M.R.; data curation, R.H.; writing—original draft preparation, M.B.K., H.B. and M.R.; writing—review and editing, S.A.K.T., D.H. and V.A.T.; visualization, M.R.; supervision, M.B.K. and S.A.K.T.; project administration, M.B.K., D.H. and V.A.T.; funding acquisition, D.H. and V.A.T. All authors have read and agreed to the published version of the manuscript.
Funding
This research received no external funding.
Data Availability Statement
The data supporting the findings of this study are available from the corresponding author upon reasonable request.
Conflicts of Interest
The authors declare no conflicts of interest.
References
- Bennett, D.A.; Beckett, L.A.; Murray, A.M.; Shannon, K.M.; Goetz, C.G.; Pilgrim, D.M.; Evans, D.A. Prevalence of parkinsonian signs and associated mortality in a community population of older people. N. Engl. J. Med. 1996, 334, 71–76. [Google Scholar] [CrossRef] [PubMed]
- Mughal, H.; Javed, A.R.; Rizwan, M.; Almadhor, A.S.; Kryvinska, N. Parkinson’s disease management via wearable sensors: A systematic review. IEEE Access 2022, 10, 35219–35237. [Google Scholar] [CrossRef]
- Demrozi, F.; Bacchin, R.; Tamburin, S.; Cristani, M.; Pravadelli, G. Toward a wearable system for predicting freezing of gait in people affected by Parkinson’s disease. IEEE J. Biomed. Health Inform. 2019, 24, 2444–2451. [Google Scholar] [CrossRef] [PubMed]
- Macht, M.; Kaussner, Y.; Möller, J.C.; Stiasny-Kolster, K.; Eggert, K.M.; Krüger, H.P.; Ellgring, H. Predictors of freezing in Parkinson’s disease: A survey of 6620 patients. Mov. Disord. 2007, 22, 953–956. [Google Scholar] [CrossRef]
- Lopez, I.C.; Ruiz, P.J.; Del Pozo, S.V.; Bernardos, V.S. Motor complications in Parkinson’s disease: A 10 year follow-up study. Mov. Disord. 2010, 25, 2735–2739. [Google Scholar] [CrossRef]
- Liu, T.; Ye, X.; Sun, B. Combining convolutional neural network and support vector machine for gait-based gender recognition. In Proceedings of the 2018 Chinese Automation Congress (CAC), Xi’an, China, 30 November–2 December 2018; pp. 3477–3481. [Google Scholar]
- Schaafsma, J.D.; Balash, Y.; Gurevich, T.; Bartels, A.L.; Hausdorff, J.M.; Giladi, N. Characterization of freezing of gait subtypes and the response of each to levodopa in Parkinson’s disease. Eur. J. Neurol. 2003, 10, 391–398. [Google Scholar] [CrossRef]
- Giladi, N.; McDermott, M.P.; Fahn, S.; Przedborski, S.; Jankovic, J.; Stern, M.; Parkinson Study Group. Freezing of gait in PD: Prospective assessment in the DATATOP cohort. Neurology 2001, 56, 1712–1721. [Google Scholar] [CrossRef]
- Latt, M.D.; Lord, S.R.; Morris, J.G.; Fung, V.S. Clinical and physiological assessments for elucidating falls risk in Parkinson’s disease. Mov. Disord. Off. J. Mov. Disord. Soc. 2009, 24, 1280–1289. [Google Scholar] [CrossRef]
- Okuma, Y. Freezing of gait and falls in Parkinson’s disease. J. Park. Dis. 2014, 4, 255–260. [Google Scholar] [CrossRef]
- Bachlin, M.; Plotnik, M.; Roggen, D.; Maidan, I.; Hausdorff, J.M.; Giladi, N.; Troster, G. Wearable assistant for Parkinson’s disease patients with the freezing of gait symptom. IEEE Trans. Inf. Technol. Biomed. 2009, 14, 436–446. [Google Scholar] [CrossRef]
- Kwon, Y.; Park, S.H.; Kim, J.W.; Ho, Y.; Jeon, H.M.; Bang, M.J.; Jung, G.-I.; Lee, S.-M.; Eom, G.-M.; Koh, S.-B.; et al. A practical method for the detection of freezing of gait in patients with Parkinson’s disease. Clin. Interv. Aging 2014, 9, 1709–1719. [Google Scholar] [PubMed]
- Tahafchi, P.; Judy, J.W. Freezing-of-gait detection using wearable-sensor technology and neural-network classifier. In Proceedings of the 2019 IEEE Sensors, Montreal, QC, Canada, 27–30 October 2019; pp. 1–4. [Google Scholar]
- Shah, S.A.; Tahir, A.; Ahmad, J.; Zahid, A.; Pervaiz, H.; Shah, S.Y.; Abbasi, Q.H. Sensor fusion for identification of freezing of gait episodes using Wi-Fi and radar imaging. IEEE Sens. J. 2020, 20, 14410–14422. [Google Scholar] [CrossRef]
- Yang, X.; Shah, S.A.; Ren, A.; Zhao, N.; Zhang, Z.; Fan, D.; Ur-Rehman, M. Freezing of gait detection considering leaky wave cable. IEEE Trans. Antennas Propag. 2018, 67, 554–561. [Google Scholar] [CrossRef]
- Li, B.; Sun, Y.; Yang, X.; Yao, Z.; Zhou, X.; Ma, Z.; Wang, P. Research on wearable monitoring system for freezing of gait in Parkinson’s disease. In Proceedings of the 2021 IEEE 5th Information Technology, Networking, Electronic and Automation Control Conference (ITNEC), Xi’an, China, 15–17 October 2021; Volume 5, pp. 920–924. [Google Scholar]
- Hutabarat, Y.; Owaki, D.; Hayashibe, M. Recent advances in quantitative gait analysis using wearable sensors: A review. IEEE Sens. J. 2021, 21, 26470–26487. [Google Scholar] [CrossRef]
- Saeed, U.; Shah, S.A.; Khan, M.Z.; Alotaibi, A.A.; Althobaiti, T.; Ramzan, N.; Abbasi, Q.H. Software-defined radio-based contactless localization for diverse human activity recognition. IEEE Sens. J. 2023, 23, 12041–12048. [Google Scholar] [CrossRef]
- Khan, M.B.; AbuAli, N.; Hayajneh, M.; Ullah, F.; Rehman, M.U.; Chong, K.T. Software defined radio frequency sensing framework for intelligent monitoring of sleep apnea syndrome. Methods 2023, 218, 14–24. [Google Scholar] [CrossRef]
- Khan, M.B.; Yang, X.; Ren, A.; Al-Hababi, M.A.M.; Zhao, N.; Guan, L.; Shah, S.A. Design of software defined radios based platform for activity recognition. IEEE Access 2019, 7, 31083–31088. [Google Scholar] [CrossRef]
- Liu, J.; Liu, H.; Chen, Y.; Wang, Y.; Wang, C. Wireless sensing for human activity: A survey. IEEE Commun. Surv. Tutor. 2019, 22, 1629–1645. [Google Scholar] [CrossRef]
- Bansal, S.K.; Basumatary, B.; Bansal, R.; Sahani, A.K. Techniques for the detection and management of freezing of gait in Parkinson’s disease—A systematic review and future perspectives. MethodsX 2023, 10, 102106. [Google Scholar] [CrossRef]
- Diep, C.; O’Day, J.; Kehnemouyi, Y.; Burnett, G.; Bronte-Stewart, H. Gait parameters measured from wearable sensors reliably detect freezing of gait in a stepping in place task. Sensors 2021, 21, 2661. [Google Scholar] [CrossRef]
- Hu, K.; Wang, Z.; Martens, K.E.; Lewis, S. Vision-based freezing of gait detection with anatomic patch based representation. In Computer Vision–ACCV 2018: 14th Asian Conference on Computer Vision, Perth, Australia, 2–6 December 2018, Revised Selected Papers, Part I; Springer International Publishing: Berlin/Heidelberg, Germany, 2019; Volume 14, pp. 564–576. [Google Scholar]
- Zhang, W.; Sun, H.; Huang, D.; Zhang, Z.; Li, J.; Wu, C.; Chan, P. Detection and prediction of freezing of gait with wearable sensors in Parkinson’s disease. Neurol. Sci. 2024, 45, 431–453. [Google Scholar] [CrossRef] [PubMed]
- Pardoel, S.; Shalin, G.; Nantel, J.; Lemaire, E.D.; Kofman, J. Early detection of freezing of gait during walking using inertial measurement unit and plantar pressure distribution data. Sensors 2021, 21, 2246. [Google Scholar] [CrossRef] [PubMed]
- Shi, B.; Tay, A.; Au, W.L.; Tan, D.M.; Chia, N.S.; Yen, S.C. Detection of freezing of gait using convolutional neural networks and data from lower limb motion sensors. IEEE Trans. Biomed. Eng. 2022, 69, 2256–2267. [Google Scholar] [CrossRef] [PubMed]
- Bikias, T.; Iakovakis, D.; Hadjidimitriou, S.; Charisis, V.; Hadjileontiadis, L.J. DeepFoG: An IMU-based detection of freezing of gait episodes in Parkinson’s disease patients via deep learning. Front. Robot. AI 2021, 8, 537384. [Google Scholar] [CrossRef]
- O’Day, J.; Lee, M.; Seagers, K.; Hoffman, S.; Jih-Schiff, A.; Kidziński, Ł.; Bronte-Stewart, H. Assessing inertial measurement unit locations for freezing of gait detection and patient preference. J. NeuroEng. Rehabil. 2022, 19, 20. [Google Scholar] [CrossRef]
- Patil, K.S.; George, S.M.; Naik, K.G.; Chethana, P.; Kamath, N.V. Freeze of Gait and Fall Detection in Parkinson’s Patients. In Proceedings of the 2022 4th International Conference on Circuits, Control, Communication and Computing (I4C), Bangalore, India, 21–23 December 2022; pp. 245–249. [Google Scholar]
- Asodu, A.T.; Dabbu, S.; Riaz, H.; Kona, D.R.; Shireen, T. Footwear-Based GAIT Analysis: A New Frontier in Parkinson’s Disease Research. In Proceedings of the 2024 15th International Conference on Computing Communication and Networking Technologies (ICCCNT), Kamand, India, 24–28 June 2024; pp. 1–6. [Google Scholar]
- Singh, R.E.; Iqbal, K.; White, G.; Holtz, J.K. A review of EMG techniques for detection of gait disorders. In Artificial Intelligence-Applications in Medicine and Biology; John Wiley & Sons Ltd.: Hoboken, NJ, USA, 2019; pp. 19–40. [Google Scholar]
- Moore, A.; Li, J.; Contag, C.H.; Currano, L.J.; Pyles, C.O.; Hinkle, D.A.; Patil, V.S. Wearable surface electromyography system to predict freeze of gait in Parkinson’s disease patients. Sensors 2024, 24, 7853. [Google Scholar] [CrossRef]
- Zhang, Y.; Yan, W.; Yao, Y.; Ahmed, J.B.; Tan, Y.; Gu, D. Prediction of freezing of gait in patients with Parkinson’s disease by identifying impaired gait patterns. IEEE Trans. Neural Syst. Rehabil. Eng. 2020, 28, 591–600. [Google Scholar] [CrossRef]
- Ren, K.; Chen, Z.; Ling, Y.; Zhao, J. Recognition of freezing of gait in Parkinson’s disease based on combined wearable sensors. BMC Neurol. 2022, 22, 229. [Google Scholar] [CrossRef]
- Patel, S.; Lorincz, K.; Hughes, R.; Huggins, N.; Growdon, J.; Standaert, D.; Akay, M.; Dy, J.; Welsh, M.; Bonato, P. Monitoring motor fluctuations in patients with Parkinson’s disease using wearable sensors. IEEE Trans. Inf. Technol. Biomed. 2009, 13, 864–873. [Google Scholar] [CrossRef]
- Anbalagan, E.; Anbhazhagan, S.M. Deep learning model using ensemble-based approach for walking activity recognition and gait event prediction with grey level co-occurrence matrix. Expert Syst. Appl. 2023, 227, 120337. [Google Scholar] [CrossRef]
- Tahafchi, P.; Molina, R.; Roper, J.A.; Sowalsky, K.; Hass, C.J.; Gunduz, A.; Judy, J.W. Freezing-of-Gait detection using temporal, spatial, and physiological features with a support-vector-machine classifier. In Proceedings of the 2017 39th Annual International Conference of the IEEE Engineering in Medicine and Biology Society (EMBC), Jeju, Republic of Korea, 11–15 July 2017; pp. 2867–2870. [Google Scholar]
- Mostafa, T.A.; Soltaninejad, S.; McIsaac, T.L.; Cheng, I. A comparative study of time frequency representation techniques for freeze of gait detection and prediction. Sensors 2021, 21, 6446. [Google Scholar] [CrossRef] [PubMed]
- Kondo, Y.; Bando, K.; Suzuki, I.; Miyazaki, Y.; Nishida, D.; Hara, T.; Kadone, H.; Suzuki, K. Video-based Detection of Freezing of Gait in Daily Clinical Practice in Patients with Parkinsonism. IEEE Trans. Neural Syst. Rehabil. Eng. 2024, 32, 2250–2260. [Google Scholar] [CrossRef] [PubMed]
- Filtjens, B.; Nieuwboer, A.; D’cruz, N.; Spildooren, J.; Slaets, P.; Vanrumste, B. A data-driven approach for detecting gait events during turning in people with Parkinson’s disease and freezing of gait. Gait Posture 2020, 80, 130–136. [Google Scholar] [CrossRef] [PubMed]
- Li, W.; Chen, X.; Zhang, J.; Lu, J.; Zhang, C.; Bai, H.; Zou, H. Recognition of freezing of gait in Parkinson’s disease based on machine vision. Front. Aging Neurosci. 2022, 14, 921081. [Google Scholar] [CrossRef]
- Abedi, H.; Ansariyan, A.; Morita, P.P.; Wong, A.; Boger, J.; Shaker, G. AI-powered noncontact in-home gait monitoring and activity recognition system based on mm-wave FMCW radar and cloud computing. IEEE Internet Things J. 2023, 10, 9465–9481. [Google Scholar] [CrossRef]
- Abdu, F.J.; Zhang, Y.; Deng, Z. Activity classification based on feature fusion of FMCW radar human motion micro-Doppler signatures. IEEE Sens. J. 2022, 22, 8648–8662. [Google Scholar] [CrossRef]
- Hu, K.; Wang, Z.; Martens, K.A.E.; Hagenbuchner, M.; Bennamoun, M.; Tsoi, A.C.; Lewis, S.J. Graph fusion network-based multimodal learning for freezing of gait detection. IEEE Trans. Neural Netw. Learn. Syst. 2021, 34, 1588–1600. [Google Scholar] [CrossRef]
- Martelli, D.; Rahman, M.M.; Gurbuz, S.Z. Validation of a micro-doppler radar for measuring gait modifications during multidirectional visual perturbations. Gait Posture 2024, 113, 504–511. [Google Scholar] [CrossRef]
- Habib, Z.; Mughal, M.A.; Khan, M.A.; Shabaz, M. WiFOG: Integrating deep learning and hybrid feature selection for accurate freezing of gait detection. Alex. Eng. J. 2024, 86, 481–493. [Google Scholar] [CrossRef]
- Niazmand, K.; Tonn, K.; Zhao, Y.; Fietzek, U.M.; Schroeteler, F.; Ziegler, K.; Lueth, T.C. Freezing of gait detection in Parkinson’s disease using accelerometer based smart clothes. In Proceedings of the 2011 IEEE Biomedical Circuits and Systems Conference (BioCAS), San Diego, CA, USA, 10–12 November 2011; pp. 201–204. [Google Scholar]
- Pardoel, S.; Kofman, J.; Nantel, J.; Lemaire, E.D. Wearable-sensor-based detection and prediction of freezing of gait in Parkinson’s disease: A review. Sensors 2019, 19, 5141. [Google Scholar] [CrossRef]
- Klavestad, S.; Assres, G.; Fagernes, S.; Grønli, T.M. Monitoring activities of daily living using UWB radar technology: A contactless approach. IoT 2020, 1, 320–336. [Google Scholar] [CrossRef]
- Rehman, M.; Shah, R.A.; Khan, M.B.; Ali, N.A.A.; Alotaibi, A.A.; Althobaiti, T.; Abbasi, Q.H. Contactless small-scale movement monitoring system using software defined radio for early diagnosis of COVID-19. IEEE Sens. J. 2021, 21, 17180–17188. [Google Scholar] [CrossRef] [PubMed]
- Bilén, S.G.; Wyglinski, A.M.; Anderson, C.R.; Cooklev, T.; Dietrich, C.; Farhang-Boroujeny, B.; Reed, J.H. Software-defined radio: A new paradigm for integrated curriculum delivery. IEEE Commun. Mag. 2014, 52, 184–193. [Google Scholar] [CrossRef]
- AbuAli, N.; Khan, M.B.; Hayajneh, M.; Rehman, M. Exploiting wireless communication using software-defined radio frequency sensing for e-health applications. IEEE Commun. Stand. Mag. 2023, 7, 42–48. [Google Scholar] [CrossRef]
- Yang, P.K.; Filtjens, B.; Ginis, P.; Goris, M.; Nieuwboer, A.; Gilat, M.; Vanrumste, B. Automatic detection and assessment of freezing of gait manifestations. IEEE Trans. Neural Syst. Rehabil. Eng. 2024, 32, 2699–2708. [Google Scholar] [CrossRef]
- Rehman, M.; Shah, R.A.; Khan, M.B.; AbuAli, N.A.; Shah, S.A.; Yang, X.; Alomainy, A.; Imran, M.A.; Abbasi, Q.H. RF sensing-based breathing patterns detection leveraging USRP devices. Sensors 2021, 21, 3855. [Google Scholar] [CrossRef]
- Daud, A.; Khan, M.B.; Khattak, A.B.; Tanoli, S.A.K.; Mustafa, A.; Rehman, M.; López, O.L. Next-Generation Security: Detecting Suspicious Liquids Through Software Defined Radio Frequency Sensing and Machine Learning. IEEE Sens. J. 2024, 24, 7140–7152. [Google Scholar] [CrossRef]
- Rehman, M.; Shah, R.A.; Ali, N.A.A.; Khan, M.B.; Shah, S.A.; Alomainy, A.; Abbasi, Q.H. Enhancing system performance through objective feature scoring of multiple persons’ breathing using non-contact RF approach. Sensors 2023, 23, 1251. [Google Scholar] [CrossRef]
- AbuAli, N.; Khan, M.B.; Ullah, F.; Hayajneh, M.; Ullah, H.; Mumtaz, S. Software defined radio frequency sensing framework for Internet of Medical Things. Inf. Fusion 2024, 103, 102106. [Google Scholar] [CrossRef]

Disclaimer/Publisher’s Note: The statements, opinions and data contained in all publications are solely those of the individual author(s) and contributor(s) and not of MDPI and/or the editor(s). MDPI and/or the editor(s) disclaim responsibility for any injury to people or property resulting from any ideas, methods, instructions or products referred to in the content. |
© 2025 by the authors. Licensee MDPI, Basel, Switzerland. This article is an open access article distributed under the terms and conditions of the Creative Commons Attribution (CC BY) license (https://creativecommons.org/licenses/by/4.0/).