Abstract
The increasing number of power electronic devices in power networks causes a significant increase in supraharmonics in these networks. Supraharmonics are spectral components in the 2–150 bandwidth that cause high-frequency signal distortions that can disturb the operation of other supplied loads, including in the field of communication or control. In the case of an increase in the occurrence of supraharmonics, it is necessary to identify the source of the disturbance, taking into account, among others, the indication of its supply point. This article presents the results of observations of supraharmonics in modern power networks. Based on results of long-term research carried out in controlled laboratory conditions and under a real power network in industrial conditions, significant diagnostic problems in the identification of supraharmonic sources related to the influence of typical loads in a low-voltage network are indicated. For the presented cases, the propagation of selected spectral components in a low-voltage network with a branched radial topology is presented. The influence of typical loads in low-voltage networks on the diagnosis of supraharmonics in modern power systems is presented. The possibilities of amplification or supression of supraharmonics by loads that are not their source are demonstrated, depending on their supply point in the power network.
1. Introduction
Power quality is a set of parameters that define the quality of the supply voltage [1,2,3]. The presented definition of power quality is adopted on the basis of the standard EN 50160 [1]. Low power quality affects the operation of devices supplied from the power grid in different ways [4,5,6,7,8]. In modern power networks, one of the most common sources of power quality disturbances [9] are electronic power loads [10,11,12,13,14,15,16,17], which change their operating states according to a specific algorithm. In such a situation, spectral components in high-frequency bandwidths occur, causing voltage distortion. The indicated high-frequency spectral components are called supraharmonics [18]. Currently, it is assumed that supraharmonic components have a frequency in the bandwidth 2–150 and do not have to be related to the power frequency such as harmonics [18]. Diagnosis of supraharmonics is a difficult task. The difficulty is already encountered at the level of assessing the occurrence of this disturbance. Currently, in practice, the conventional discrete Fourier transform (DFT) algorithm is used to evaluate supraharmonics, implemented according to the procedure described in the standards (e.g., the IEC Standard 61000–4–30 [19] or the IEC Standard 61000–4–7 [20]). However, due to the values of supraharmonic components in typical power networks, their frequency range and non-stationary nature related to the random interaction of disturbance sources, this procedure is exposed to many disturbing factors (such as the phenomenon of “spectrum leakage” [21]), affecting the assessment of voltage distortion caused by supraharmonics. There are various new approaches to assessing the severity of supraharmonics in the scientific literature [22,23,24,25,26,27,28,29], but they usually require significant computational capabilities, which results in the need for changes in the signal chains of currently used measuring and recording devices, which should usually be preceded by changes at the normative level (e.g., appropriate IEEE [30] or IEC standards [20]). Another diagnostic problem is the correct determination of the severity level of supraharmonics [31], which can result in a significant deterioration of the operation of other loads in the power grid [32]. Currently, the occurrence of supraharmonics can, for example, disturb PLC communication or the control process [33]. Determining the appropriate level of supraharmonic severity requires continuous monitoring [34] of supraharmonics in power networks and an assessment of their severity depending on the properties and topology of the power supply circuit [35,36]. Another important diagnostic problem related to supraharmonics is the effective identification of supraharmonic sources [37,38,39,40], including the indication of their supply point [35]. This process requires, among others, research in the field of evaluation of supraharmonic propagation in power networks [41,42,43]. By analyzing the scientific literature in the field of supraharmonic diagnostics, considering the presented problems, it can be indicated that there is no approach that solves all the indicated problems. Existing solutions often adopt idealized values that do not occur in modern power networks [35,44,45,46,47]. Therefore, this article continues supraharmonic research in the field of monitoring the occurrence of this disturbance in power networks and assessing its propagation in terms of the identification of the sources of disturbance. This paper presents results of supraharmonic observations in modern power grids. The research focused on the assessment from the point of view of the current technical condition, so all measurements were performed using instruments currently used to record supraharmonics. Significant diagnostic problems in terms of the identification of the source of supraharmonics related to the influence of typical loads in the low-voltage (LV) network are indicated. For the presented cases, the propagation of selected spectral components in an LV power network with branching radial topology is presented. After identifying supraharmonic sources, actions are taken to minimize the interference they emit, such as installing active filters that reduce the level of supraharmonics [48], or modifying the topology of the interference source by, for example, using random modulation [49,50,51]. It is worth noting that all activities in the scope of minimizing the effects of supraharmonics, in most cases, require a separate approach than in the case of minimizing the effects of harmonics. For example, in the scope of active filters, the idea of their operation for supraharmonics and harmonics is the same, but their implementation is completely different (both from the software and hardware side) [48].
In summary, this article considers the issue of supraharmonic diagnostics in the power network. Diagnostics are understood for the purposes of this article as activities aimed at identifying the power supply point of a source emitting supraharmonics based on a series of measurements performed simultaneously. An example problem of supraharmonic diagnostics is presented in a real power network, where selected supraharmonics associated with the impact of power electronics cooperating with photovoltaic panels were amplified by other loads, leading to an erroneous indication of the power supply point of the real source of disturbances. Based on these observations, a thesis was put forward on the potential interaction of sources emitting supraharmonics with other common loads that do not generate these components, but as a result of interaction, leading to the amplification or suppression of the occurring supraharmonics. The verification of the thesis is confirmed by a series of experimental tests performed under controlled laboratory conditions using a constructed model of a 3-phase line of an LV network with a branching radial topology. The experimental studies consider the occurrence of one or two sources of disturbances with simultaneous power supply or lack of power supply to other loads in the power grid. The studies conducted have shown that the mutual interaction of different loads in the power network leads to changes in the propagation of supraharmonics, probably due to the change in the resultant impedance seen from the point of view of the power grid. It is also worth noting that the analysis of supraharmonic propagation itself, which was performed for the purposes of this work, is an unexplored problem due to the lack of universal knowledge. Understanding the problem of supraharmonic propagation involves the analysis of selected circuits; therefore, the article attempts to investigate the propagation in the adopted configuration. Previous observations of laboratory systems and real LV power grids indicate difficulties in the theoretical analysis of supraharmonic propagation. The basic problem is the analytical description of the interactions between different loads. For example, analyses adequate for harmonics are ineffective with respect to supraharmonics. Therefore, experimental studies are the basic source of knowledge about supraharmonic propagation in LV power grids.
2. Description of the Research Subject
The research in this article focuses on monitoring current supraharmonic trends in modern power grids (continuation of research [36]) and on the assessment of the propagation of supraharmonics, considering the issue of identifying sources of disturbances. Taking into account the scope of research, the appropriate instrumentation was used for supraharmonic acquisition, that is, the class A power quality analyzer (PQA) PQ BOX 300, which performs measurements in accordance with current requirements specified in the IEC Standard 61000–4–30 [19]. During research, supraharmonics were recorded with the smallest possible measurement interval , equal to 1, in order to accurately assess the phenomenon itself by minimizing the averaging process using the data aggregation algorithm [19]. The research using the indicated equipment was divided into three stages:
- Stage I
- Research in a controlled environment using a symmetric 3-phase low-voltage (LV) power grid model with a branching radial topology. The nominal values of resistances and inductances, connected in series to constitute subsequent sections in the power grid model, are presented in Table 1. The criteria for selecting the parameters specified in Table 1 was to recreate an example power grid with parameters corresponding to an example of a real LV network with overhead lines (parameters selected as for the configuration in the real power system in Poland). The research at this stage concerns the analysis of propagation in the selected phase of the 3-phase system and at assessing the propagation of supraharmonic components in the LV radial network.
 Table 1. List of nominal parameters of individual sections of the power grid model.
 - Stage II
- Research carried out in the same environment as in Stage I. The research at this stage also concerns the analysis of propagation in the selected phase of the 3-phase system. The research aimed to assess the impact of typical loads in an LV power grid on the propagation of supraharmonics in the LV radial network.
- Stage III
- Industrial research carried out in a real 3-phase LV power grid.
It is also worth noting that the indicated PQA meter used is a 3-phase instrument, while the measurements themselves for research purposes in Stages I and II were carried out in a single-phase circuit in such a way that the phase voltage channels of the meter were used for simultaneous voltage measurements at different points of the single-phase circuit. Simultaneous measurements were made possible by the use of a patch panel, which allowed for cross-connecting. Research in Stage I allows for the assessment of supraharmonic propagation. Research in Stage II allows us to explain, to a certain limited extent, the diagnostic problems observed in research in Stage III.
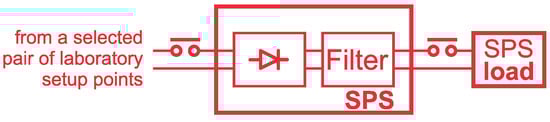
In the research in Stage I, the propagation of supraharmonics caused by fluorescent emergency lighting (FEL) and a fully loaded 1.8 uninterruptible power supply (UPS) is assessed. In Stage II of the research, the impact of selected loads typical for LV networks on the propagation of selected supraharmonic components in the radial network is analyzed. In the research, the assessment of supraharmonic propagation is carried out with an unchanging supply point of the main source of supraharmonics (FEL and/or UPS) and with a changing supply point for individual selected loads. The selected loads are as follows:
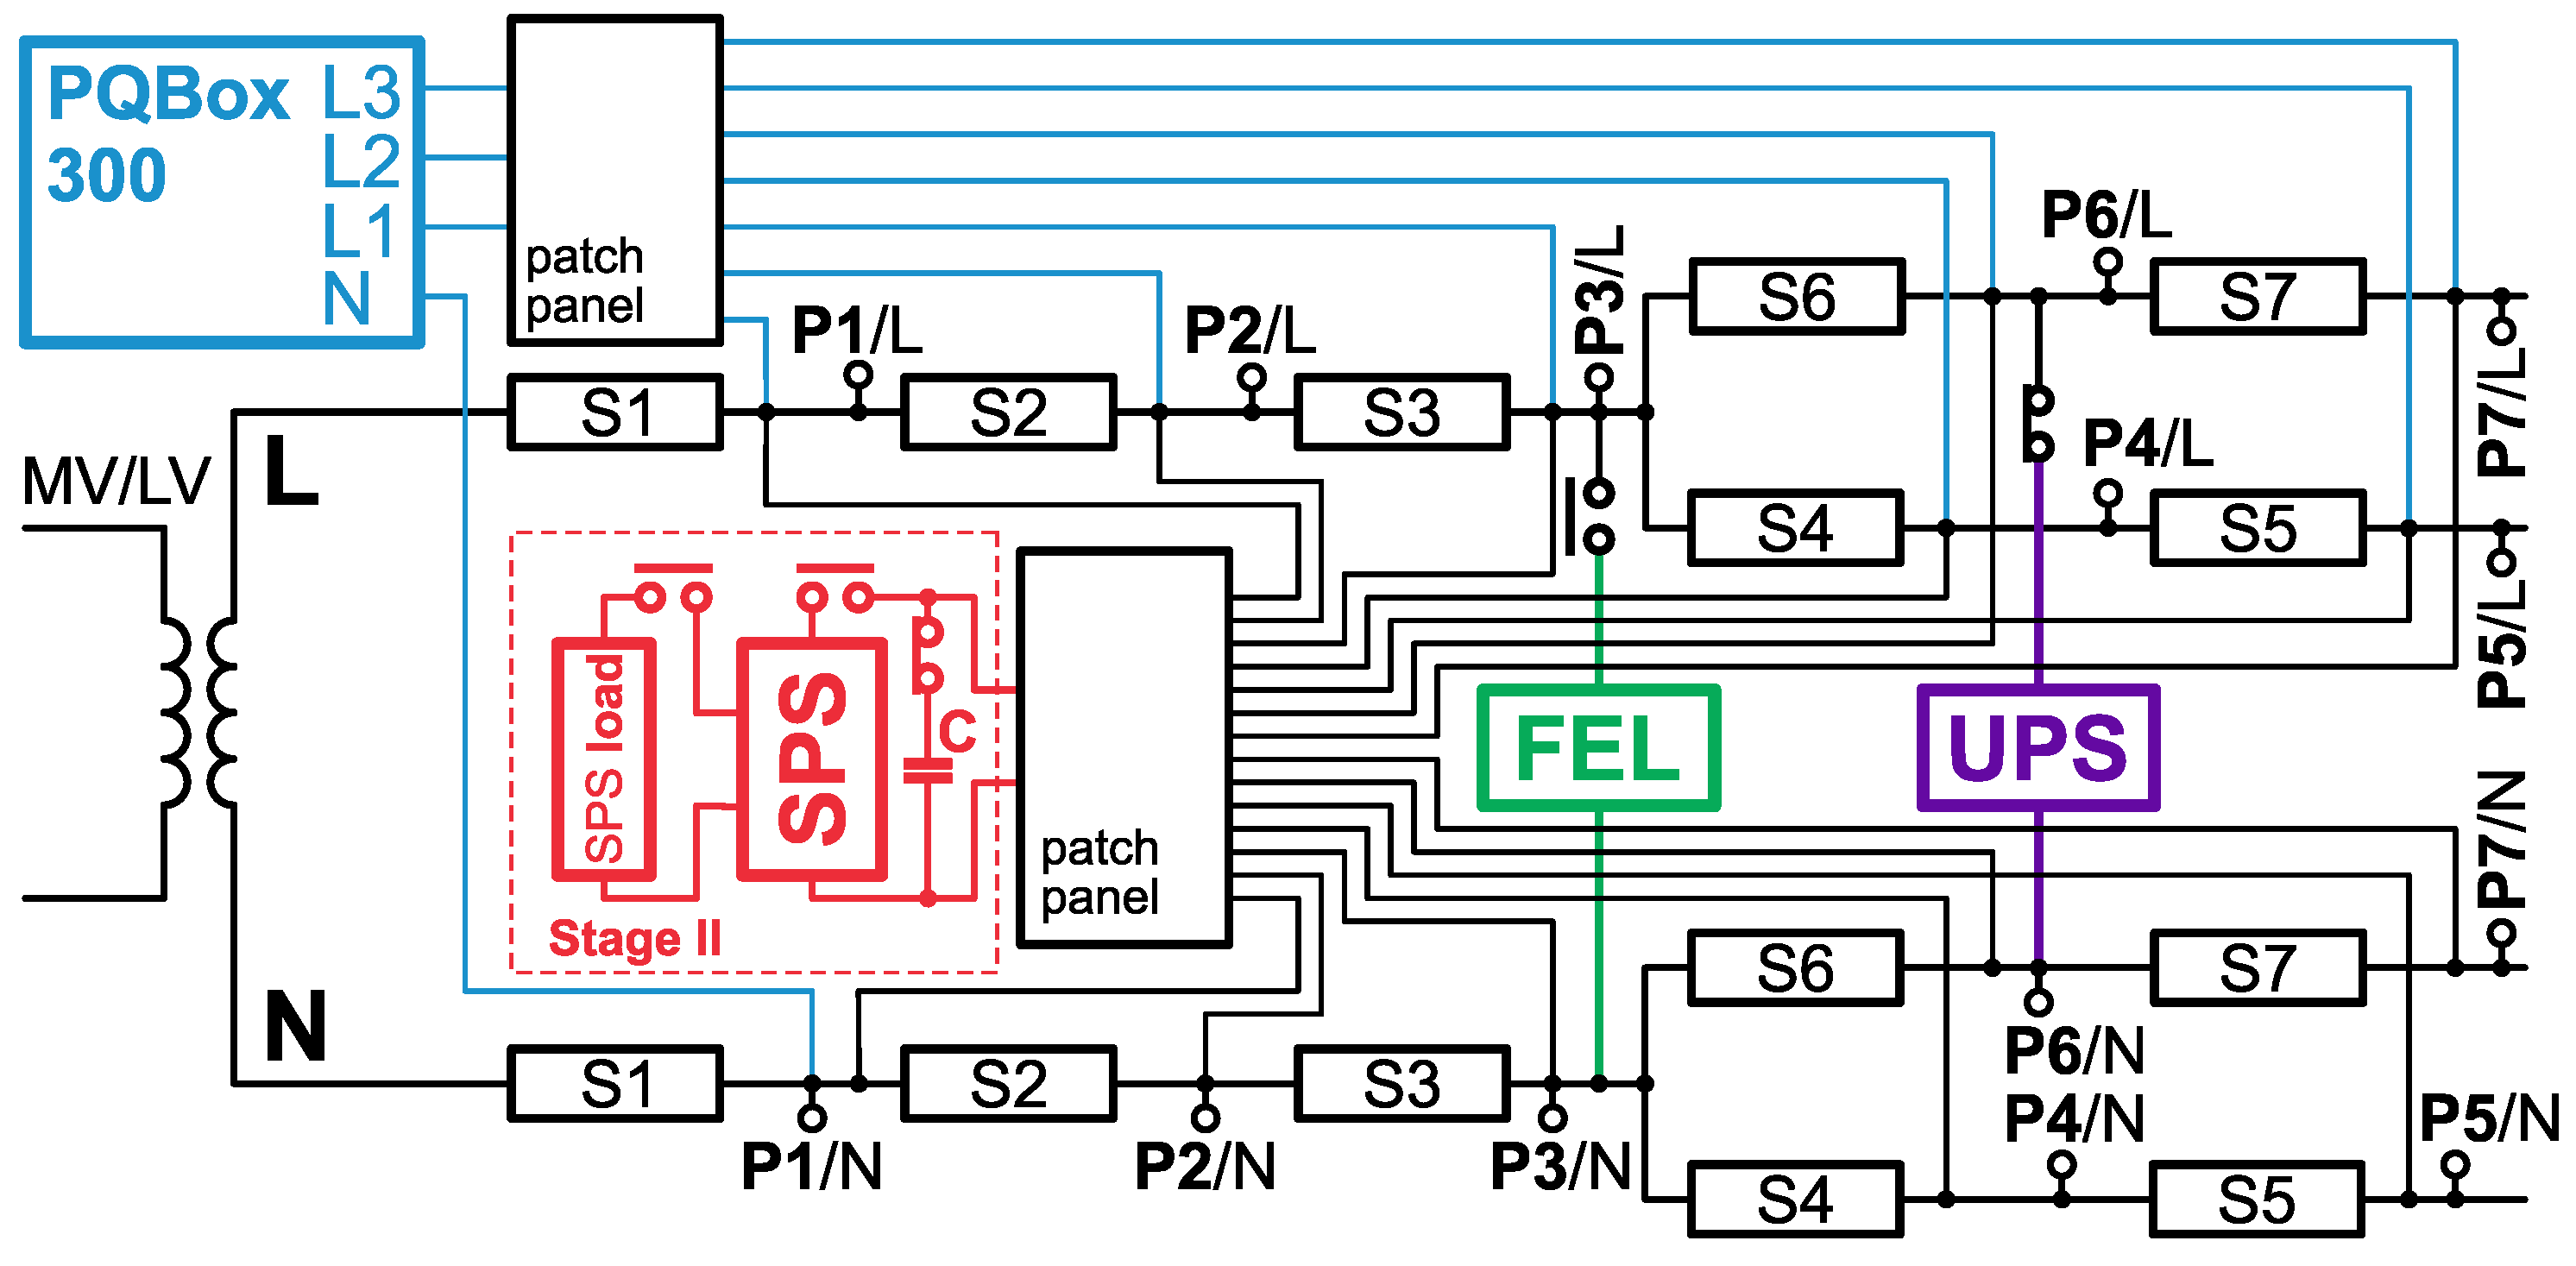
The diagram of the laboratory setup for research in Stage I and Stage II is shown in Figure 2, where the elements of the laboratory setup that were additionally used for the purposes of Stage II are marked in red.
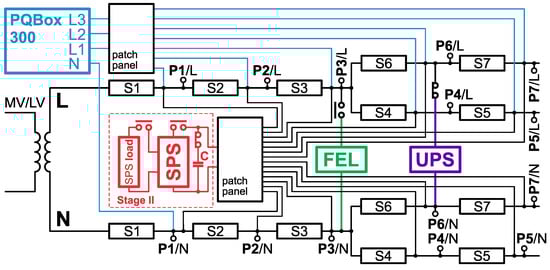
Figure 2.
Diagram of the laboratory setup for Stage I and Stage II of the research, where the elements of the laboratory setup that were additionally used for the purposes of Stage II are marked in red, and where the patch panel is a system that allows for cross-connections for the purposes of simultaneous measurements from selected network points.
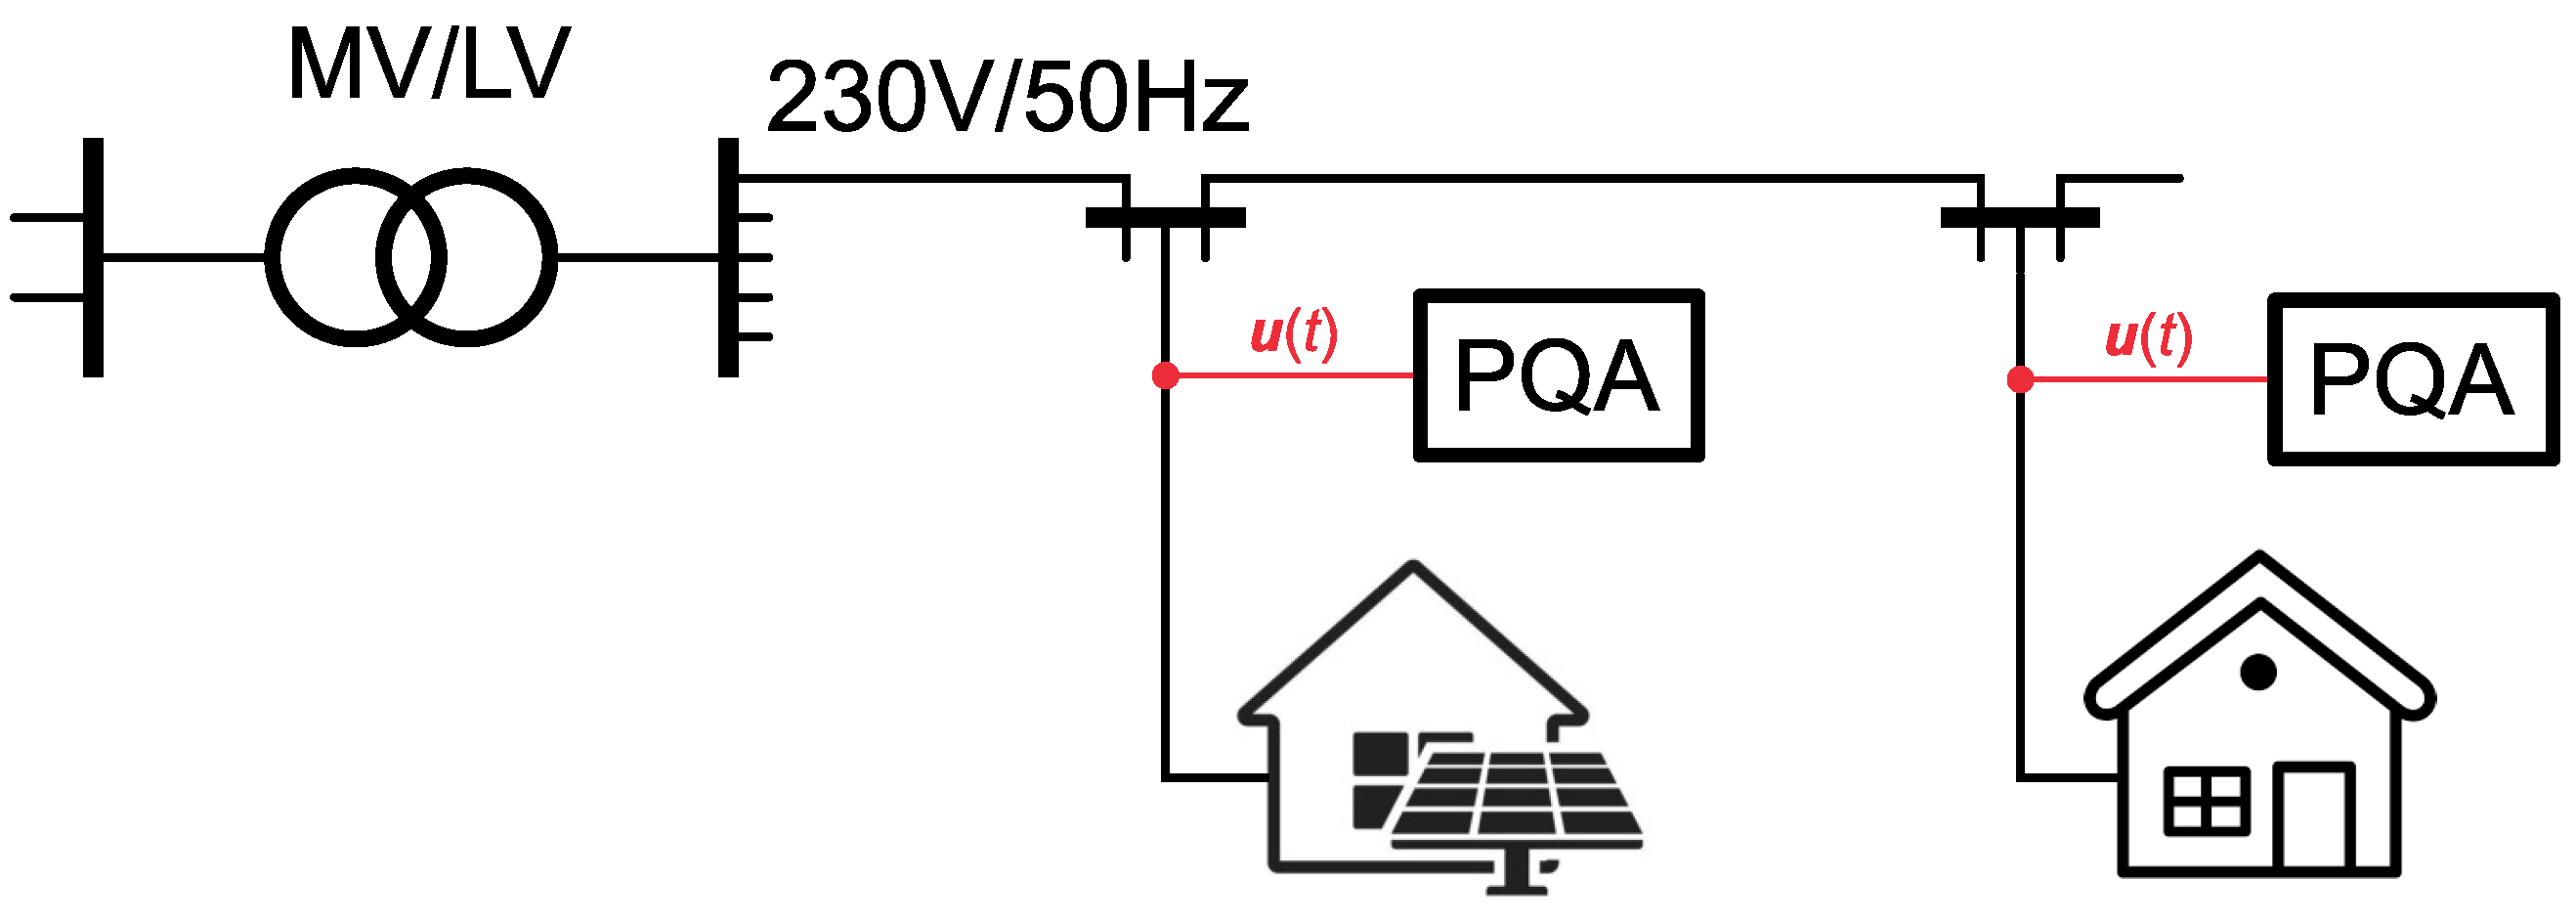
In Stage III, measurements were carried out simultaneously in two LV network connections. A household with photovoltaic panels is supplied from the connection closer to the medium-voltage to low-voltage (MV/LV) transformer station. Therefore, at this point in the network, it is assumed that supraharmonics can arise in relation to the converters cooperating with photovoltaic panels. The activity of these converters should coincide with the period of sunlight. From the connection further to the MV/LV transformer station, a typical household is supplied, in which no higher power loads potentially causing supraharmonics were supplied during the measurements. The diagram of the laboratory setup for industrial research in Stage III is shown in Figure 3. This network consisted of short cable lines. The exact values of the lengths and cross-sections of these cables are not known, and therefore, the impedance value of the supply line (no information on the parameters of the supply line). Unfortunately, no additional information on this indicated network is known.
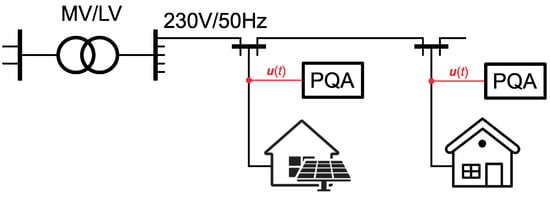
Figure 3.
Diagram of laboratory setup for Stage III of research.
3. Research Results and Discussion
The results of supraharmonic measurements are presented in a graphical form. Due to the specificity of supraharmonic measurement results, three-dimensional graphs are often used for their general analysis. One such graph is a spectrogram tool to perform spectral analysis. The horizontal axis (X axis) informs about the time of recording the measurement result, the vertical axis (Y axis) about the frequency, and the color/gray level (Z axis) about the supraharmonic value (a light color point corresponds to the lowest value, a dark color point corresponds to the highest value). Another graphical form of presentation is time-domain characteristics. To ensure readability, selected supraharmonics are presented on time-domain characteristics with the possibility of comparing data from individual points of the power grid. The selection is made most often during spectrogram analysis. The last form of graphical presentation of supraharmonics used is the comparison of values of supraharmonic with a specific frequency between individual points of the power grid.
3.1. Stage I—Assessment of Supraharmonic Propagation in the Radial Low-Voltage Network
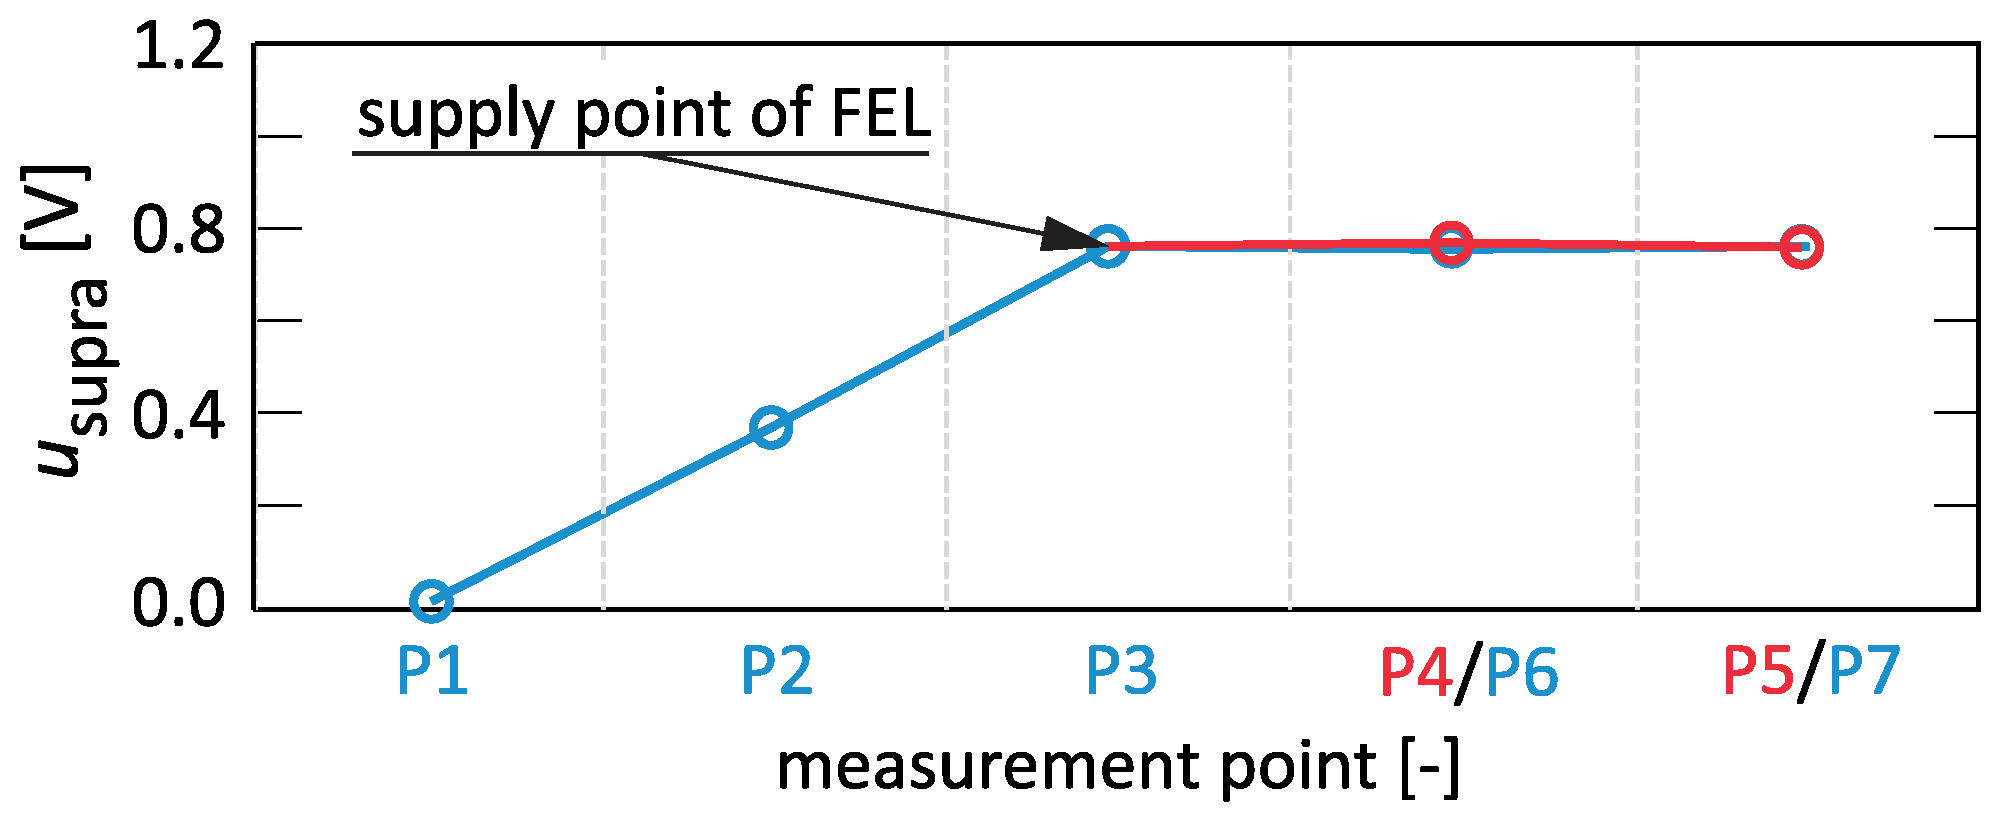
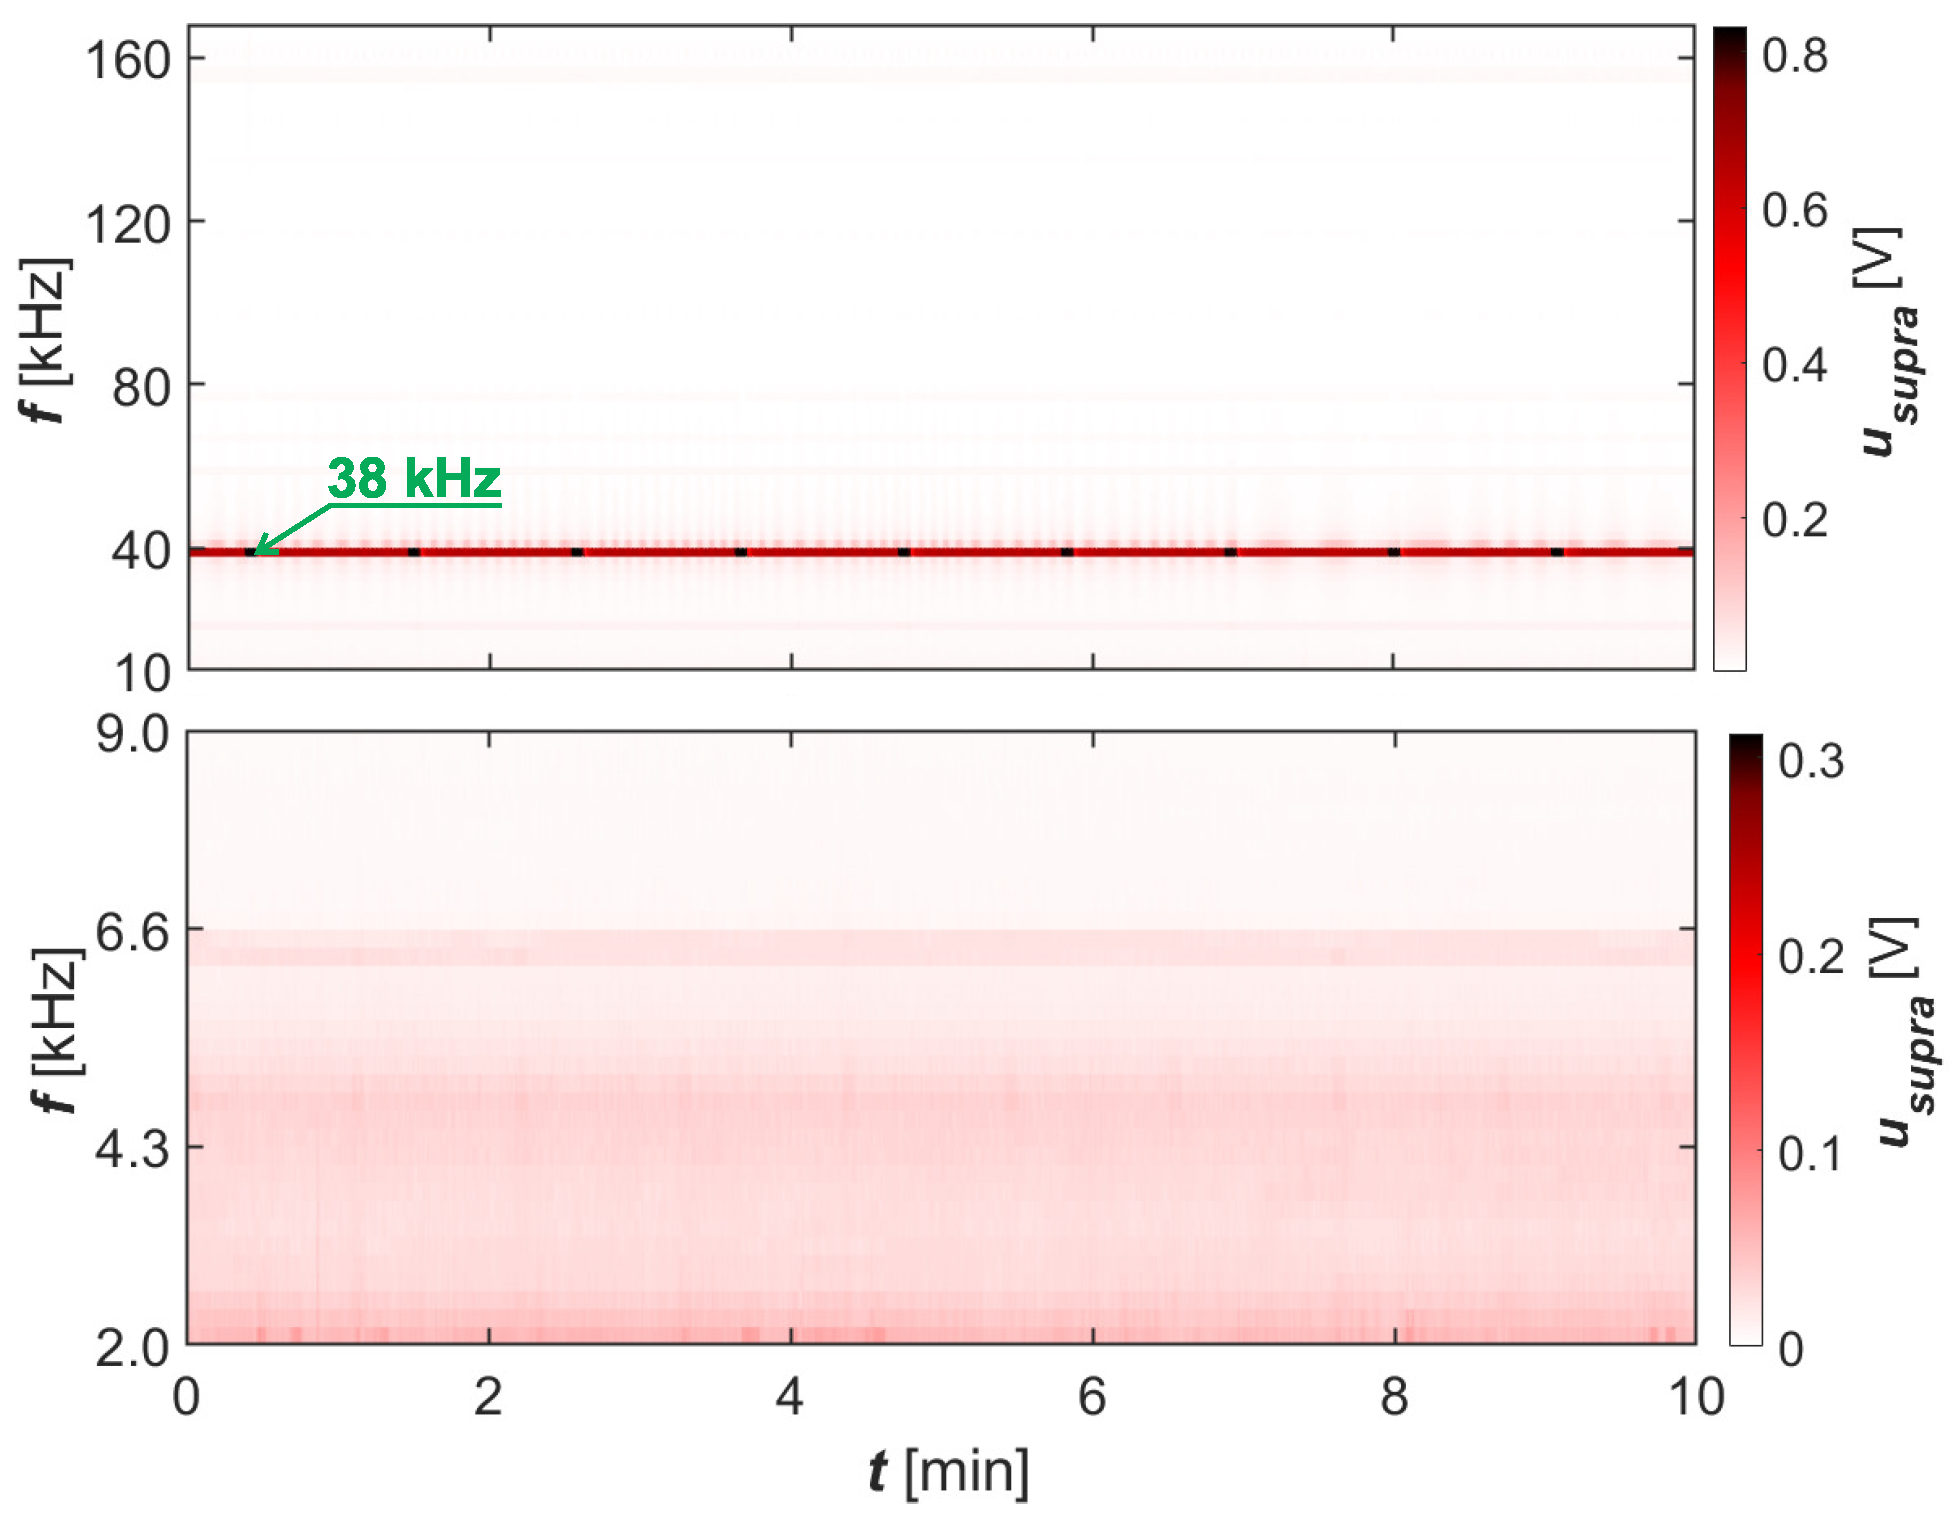
Figure 4 shows the spectrogram in the bandwidths 2–9 and 10–170 for the phase voltages recorded at measurement point P3, i.e., the supply point of the supraharmonic source in the form of FEL. In this case, there is one dominant source of supraharmonics in the power grid. Figure 5 shows the propagation of the average value of one of the dominant supraharmonics for individual points of the network. Analyzing the results obtained, it can be noticed that the dominant value in terms of the average value occurs at the supply point of the source of disturbance. It can be seen that the supraharmonic values increase from the lower busbars of the medium-voltage to low-voltage (MV/LV) transformer to the supply point of the disturbance source, and then their values remain almost at the same level.
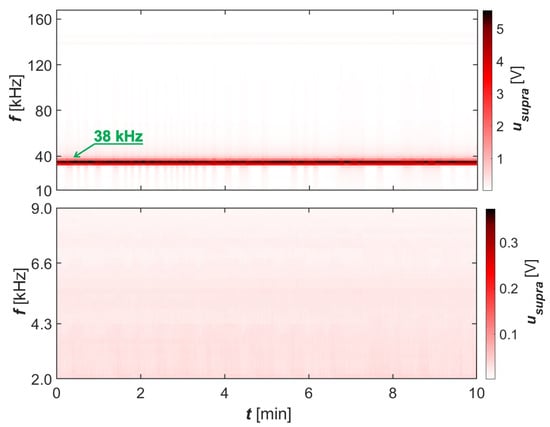
Figure 4.
Spectrograms of supraharmonics of phase voltages in the bandwidths 2–9 and 10–170 at measurement point P3—supraharmonics generated by FEL.
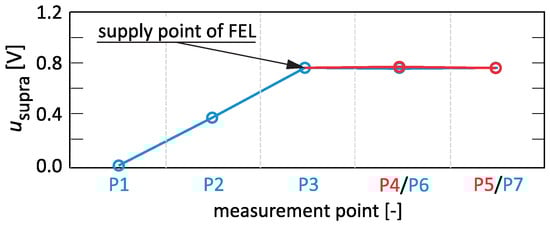
Figure 5.
Propagation of the supraharmonic component with a frequency of 38 at individual network points—supraharmonics generated by FEL.
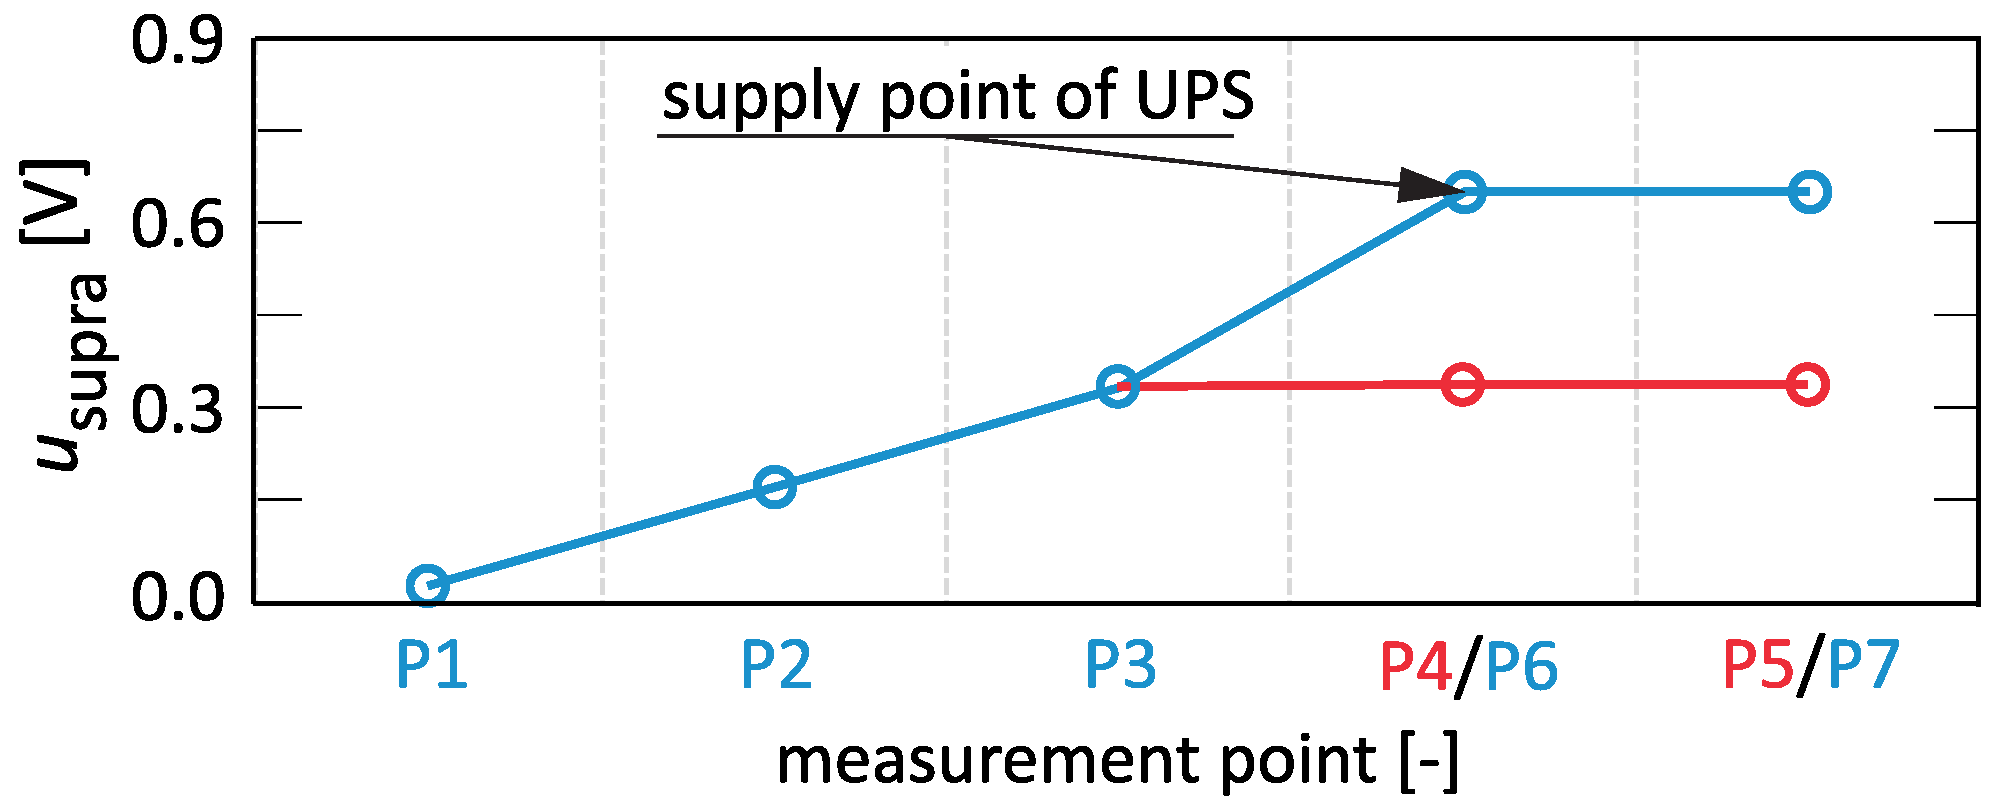
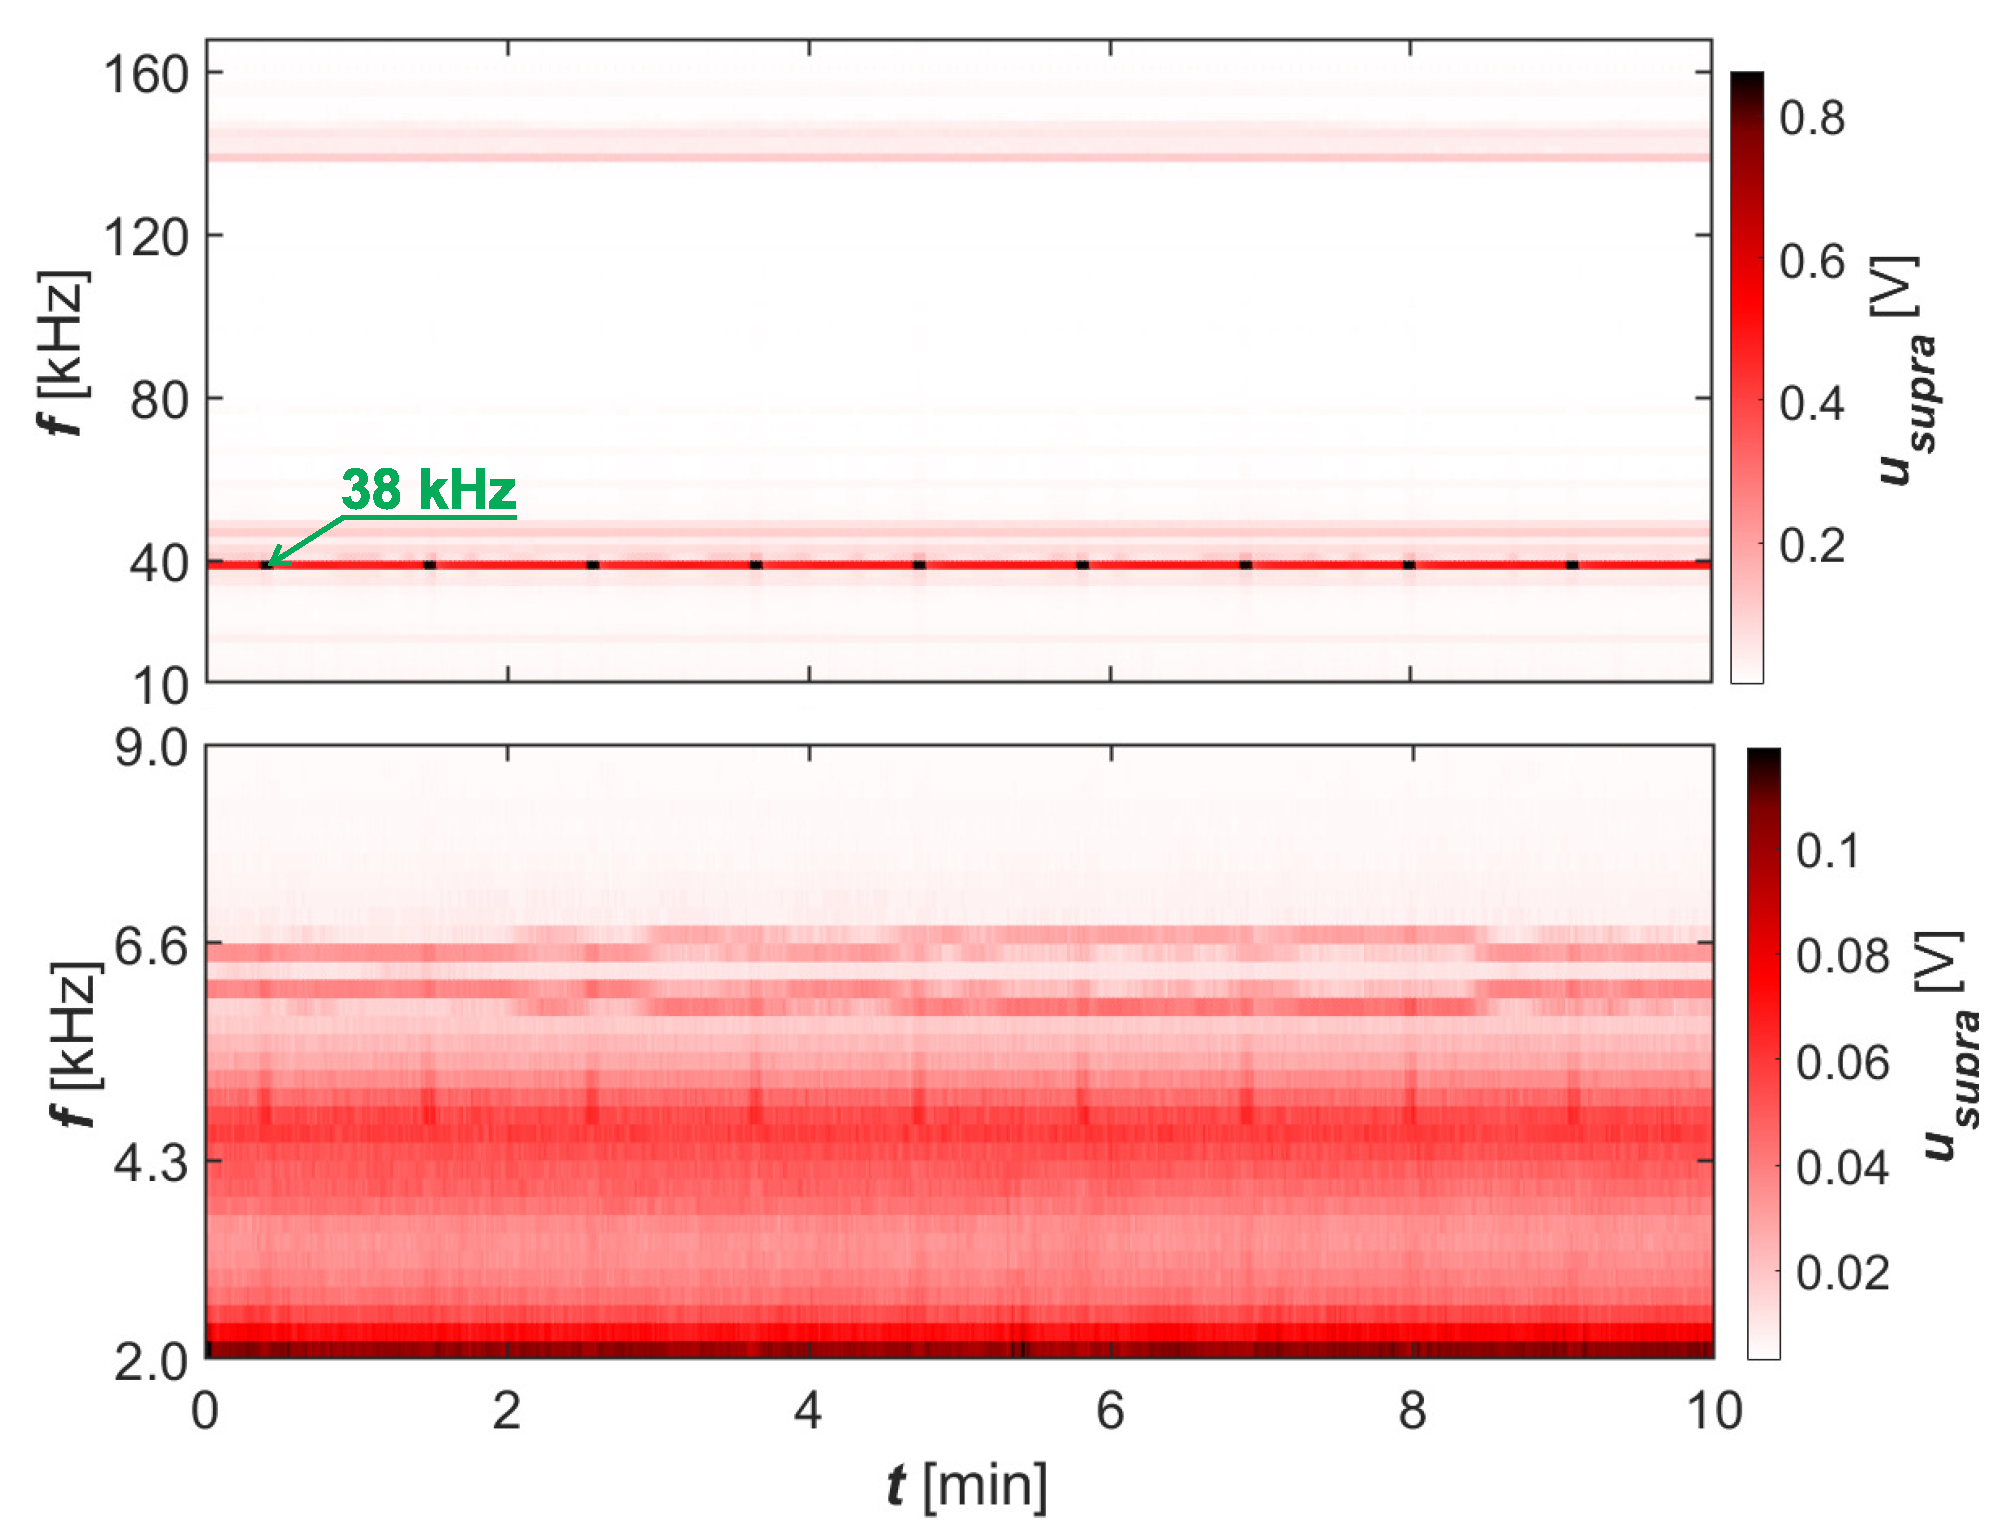
Figure 6 shows the spectrogram in the bandwidths 2–9 and 10–170 for phase voltages recorded at the measurement point P6, i.e., the supply point of the supraharmonic source in the form of UPS. In this case, there is also one dominant source of supraharmonics in the power grid but is supplied from different supply points. Figure 7 shows the propagation of the average value of one of the dominant supraharmonics for individual points of the network. Analyzing the obtained results, it can be observed that the dominant value in terms of the average value occurs at the supply point of the source of disturbance. It can be seen that the values of supraharmonics increase from the lower busbars of the MV/LV transformer to the supply point of the disturbance source, and then their values remain almost at the same level.

Figure 6.
Spectrograms of supraharmonics of phase voltages in the bandwidths 2–9 and 10–170 at measurement point P6—supraharmonics generated by UPS.
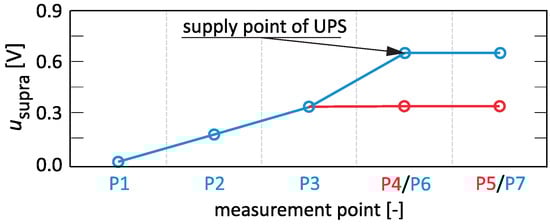
Figure 7.
Propagation of the supraharmonic component with a frequency of 38 at individual network points—supraharmonics generated by UPS.
Figure 8 shows the spectrogram in the bandwidths 2–9 and 10–170 for the phase voltages recorded at the measurement point P6, that is, the UPS supply point. In this case, there are two dominant sources of supraharmonics: FEL supplied from network point P3, and UPS supplied from network point P6.
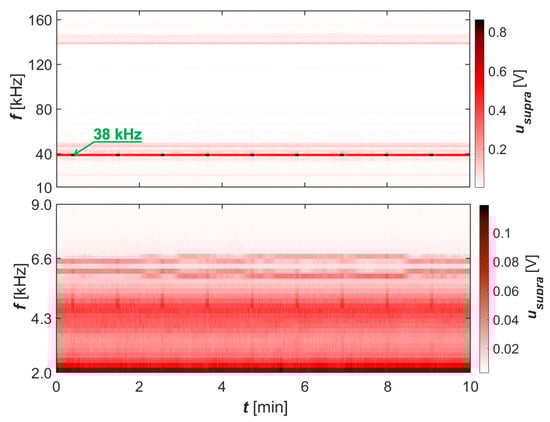
Figure 8.
Spectrograms of supraharmonics of phase voltages in the bandwidths 2–9 and 10–170 at measurement point P6—supraharmonics generated by FEL and UPS.
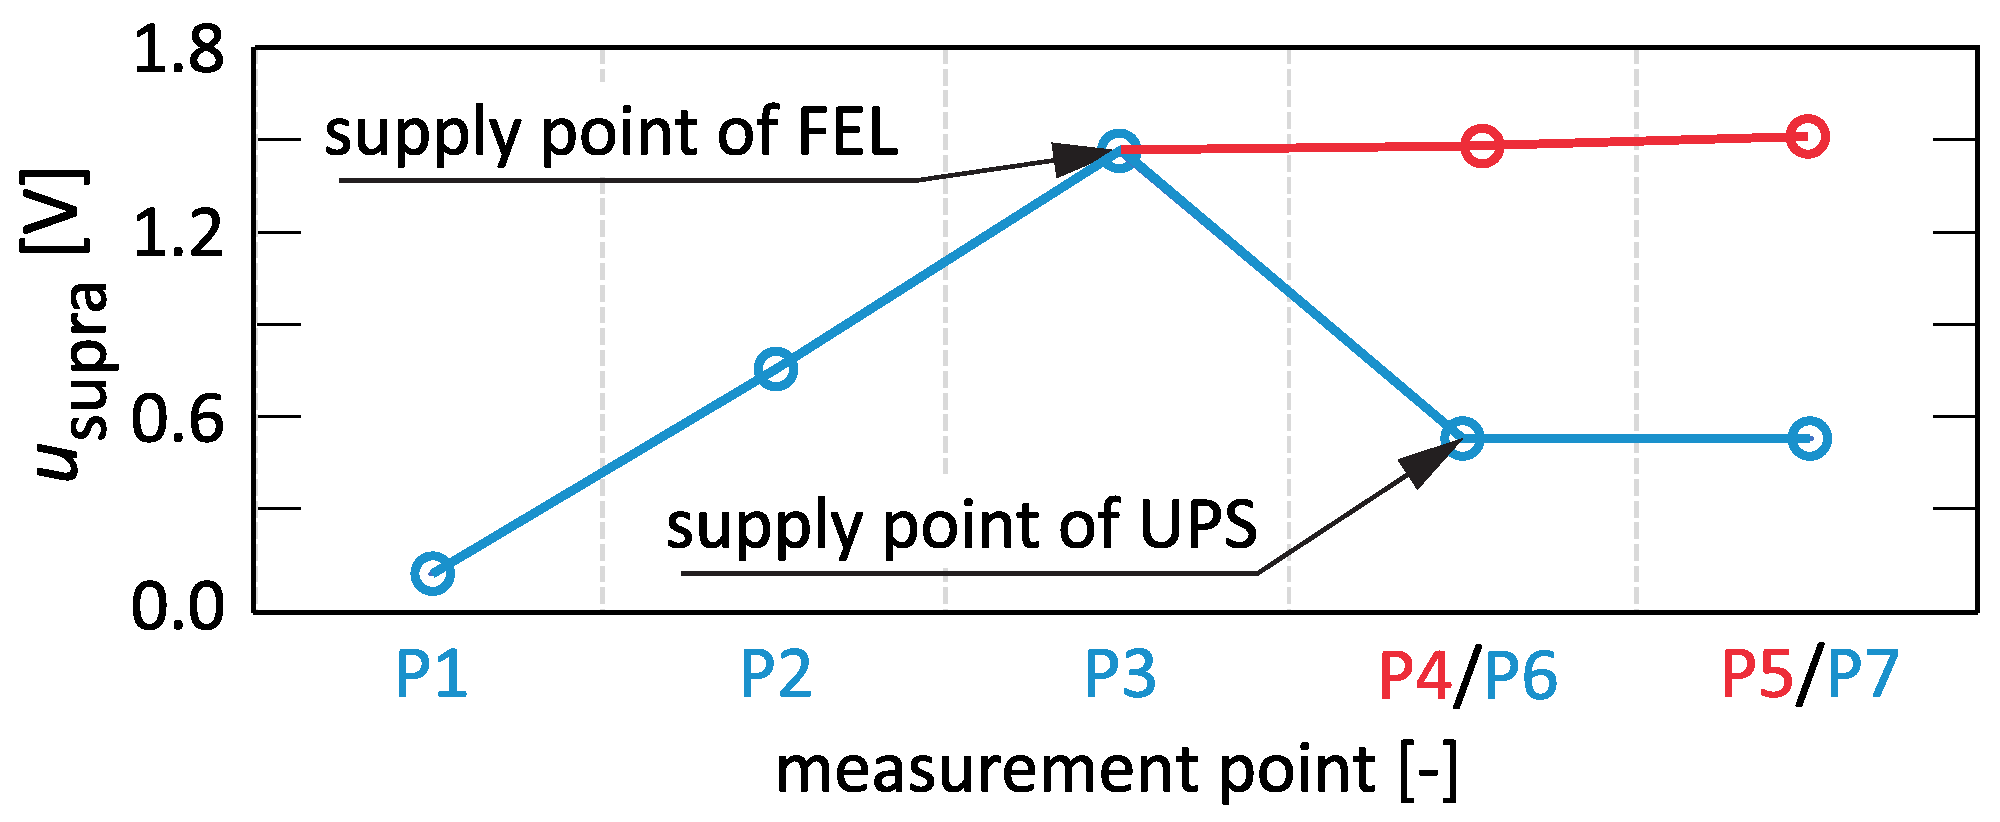
The bandwidth of the dominant FEL supraharmonics coincides with the bandwidth of the dominant UPS supraharmonics. Figure 9 shows the propagation of the average value of one of the dominant FEL supraharmonics for individual points of the network. In the case of supraharmonics generated by FEL, their propagation in the branch P1–P5 is analogous to the previous case. The propagation of supraharmonics in the branch P1–P7 changes due to the influence of the UPS supplied from the network point P6. The supraharmonics associated with the UPS influence the supraharmonics associated with the FEL, causing them to be attenuated. In turn, for the network points in this branch further away from P6, the supraharmonic values are maintained at the same level. The indicated cases show that the supply point of supraharmonic sources can be identified with the network point where the values are unilaterally fixed or their change is negligible compared to the increase with the preceding network point.
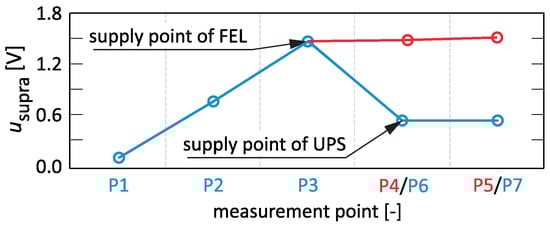
Figure 9.
Propagation of the supraharmonic component with a frequency of 38 at individual network points—supraharmonics generated by FEL and UPS.
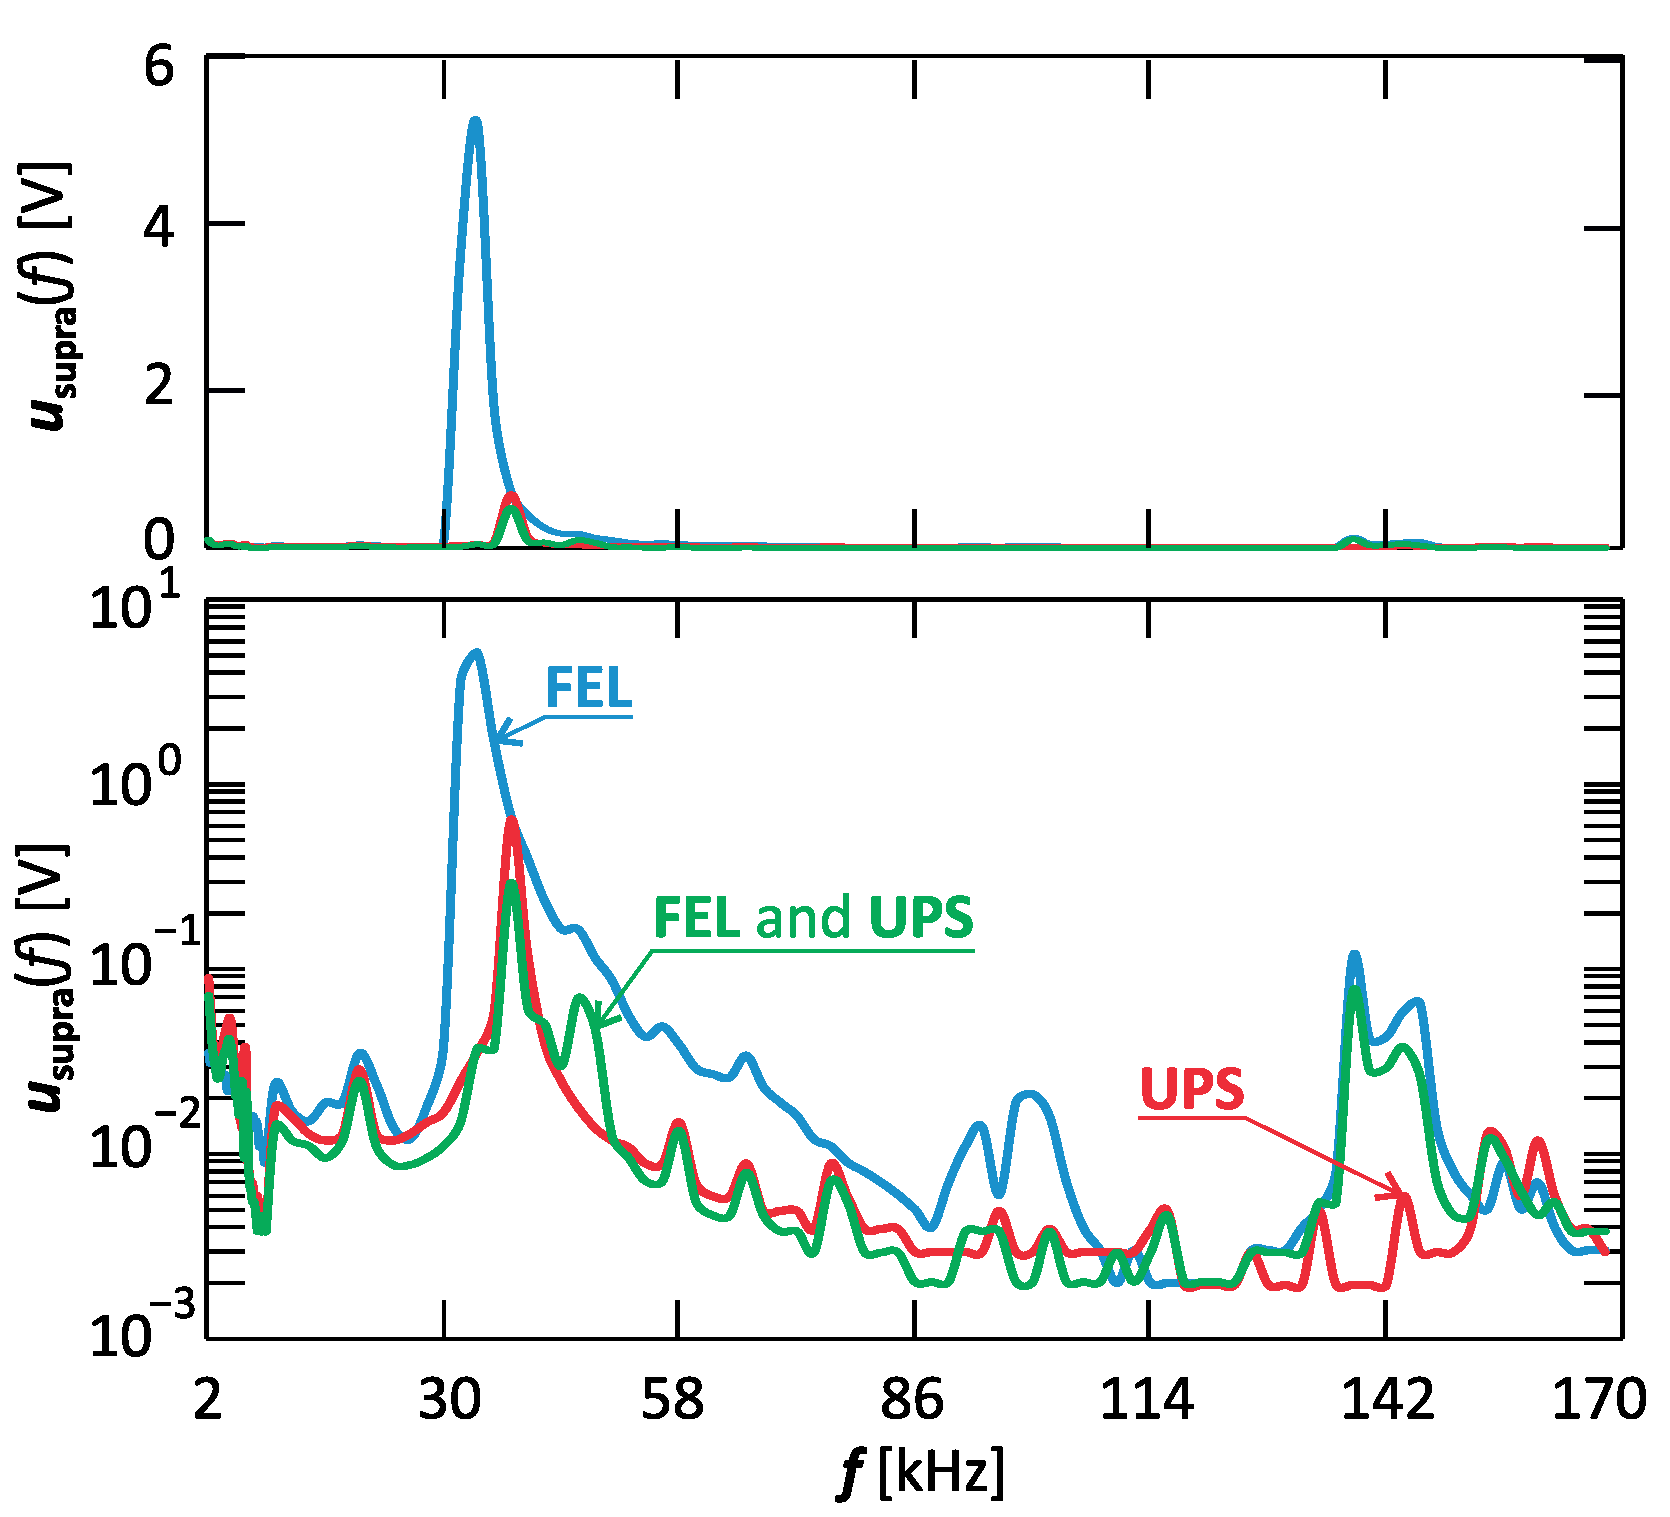
Figure 10 shows the amplitude–frequency characteristic for the selected time moment at the measurement point P6, when there is a supraharmonic source in the power grid where only FEL is supplied from the network point P3, only UPS is supplied from the network point P6, or both FEL is supplied from the network point P3 and UPS is supplied from the network point P6. In the presented characteristics, one can notice the overlap of the dominant components of the spectrum and it can be noticed that in the case of a common interaction of FEL, UPS, and the impedance of supply line, there is a significant attenuation of the dominant component of the supraharmonics. Due to the non-stationary operation of the analyzed loads, which is also influenced by the actual supply voltage state in the power grid (the degree of supply voltage disturbance depends on the currently operating disturbing loads in the power grid), there is an interaction between them and the power grid, i.e., the impedance of the supply line. From the point of view of the power system, the impedance changes at individual points of the power grid (the resultant impedance is a combination of the impedance of supply line and the impedance of a specific load at its current working condition), which affects the propagation of supraharmonics. Changing the resultant impedance of a power system can lead to local resonances that amplify or suppress specific supraharmonics.
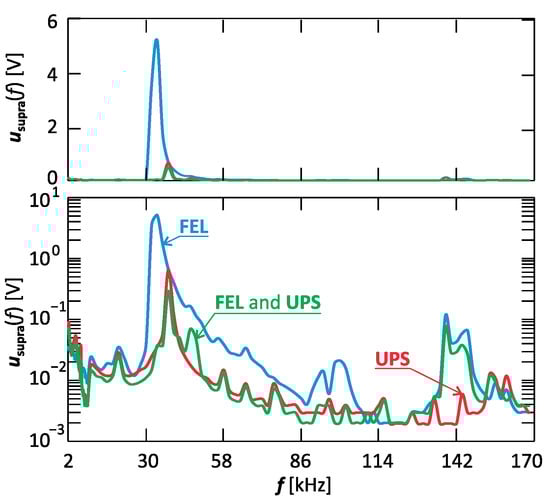
Figure 10.
Amplitude–frequency characteristic for the selected time moment at the measurement point P6, when there is a supraharmonics source in the power grid as only FEL, only UPS, or both FEL and UPS—linear scale at the top, logarithmic scale at the bottom.
3.2. Stage II—Assessment of Supraharmonic Propagation in the Radial Low-Voltage Network with Additional Loads
In this section, an attempt is made to verify whether other common loads in the low-voltage (LV) network influence the identification of supraharmonic sources in this network. An example of the impact of connecting a capacitor at point P7 on the propagation of supraharmonics caused by the FEL supplied from network point P3 and the UPS supplied from network point P6 is shown in Figure 11. Analyzing the propagation of the example supraharmonic component with a frequency of 38, it can be seen that it is not possible to correctly indicate a supply point of the particular disturbance sources. Connecting capacitor C resulted in significant amplification of individual supraharmonics in the power grid, which is the result of the differential relationship of the capacitor current to its supply voltage. However, it is also worth noting that each real element also has other parasitic parameters (e.g., in the case of a capacitor, it is parasitic inductance), which can result in a different nature of the interaction of elements in the power system (due to the possibility of resonance phenomena, individual supraharmonics can be amplified or attenuated). In order to better present the indicated situation, the propagation of supraharmonics was assessed in the next part of this section at three measurement points depending on the change in the supply point of the additional selected load in the power grid.
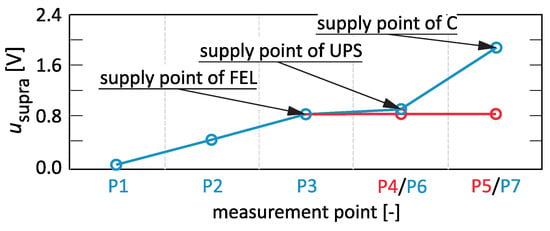
Figure 11.
Propagation of the supraharmonic component with a frequency of 38 at individual network points—supraharmonics generated by FEL and UPS, capacitor C connected to network point P7.
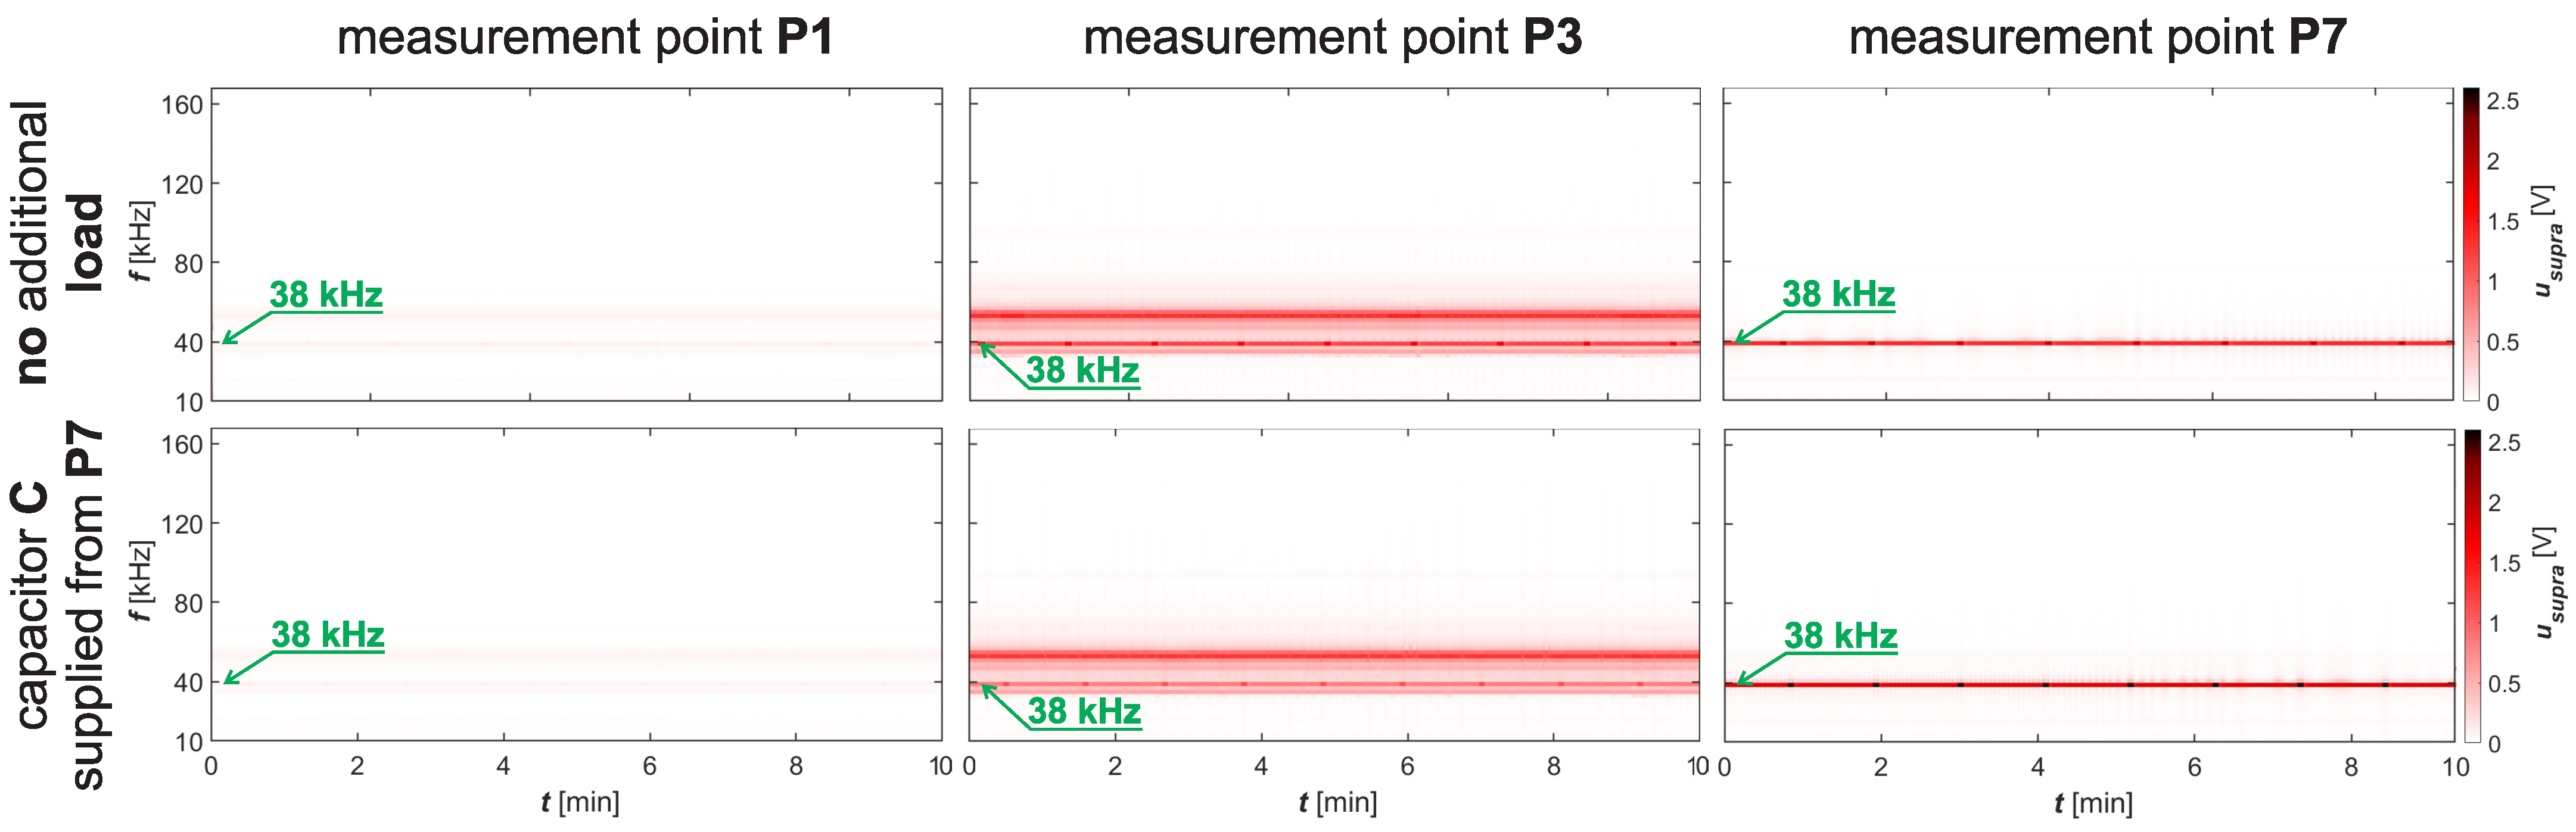
Figure 12 shows a comparison of spectrograms in the bandwidth 10–170 for phase voltages recorded at measurement points P1, P3, and P7 for individual additional loads connected at network point P6 and in the state without additional loads. In this case, there were two sources of supraharmonics: FEL supplied from network point P3 and UPS supplied from network point P6. The presentation of spectrograms in the bandwidth 2–9 is omitted because significantly lower values were recorded in this bandwidth than in the bandwidth 10–170, which can be seen in Figure 8.
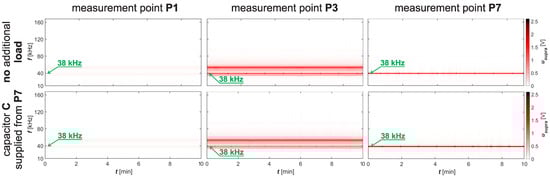
Figure 12.
Spectrograms of supraharmonics of phase voltages in the bandwidth 10–170 at measurement points P1, P3, and P7—supraharmonics generated by FEL supplied from network point P3, and UPS supplied from network point P6; capacitor C connected or not connected to network point P7.
Analyzing the results presented in Figure 12, it can be seen that without an additional connected capacitor, the highest supraharmonic amplitudes (mapped by the degree of red/black saturation) occur at the FEL supply point (source of supraharmonics). In such a case, at further points of the network, supraharmonics are maintained at the level occurring at the point of supply of the disturbance source. When a capacitor is connected to the network point P7, a decrease or increase in individual supraharmonics is observed. Spectrograms significantly support the diagnostic process because they allow the user to select dominant supraharmonics relatively easily. However, from the point of view of propagation assessment, it is much more advantageous to analyze selected components on time characteristics or resultant statistics (e.g., the average value) for these components.
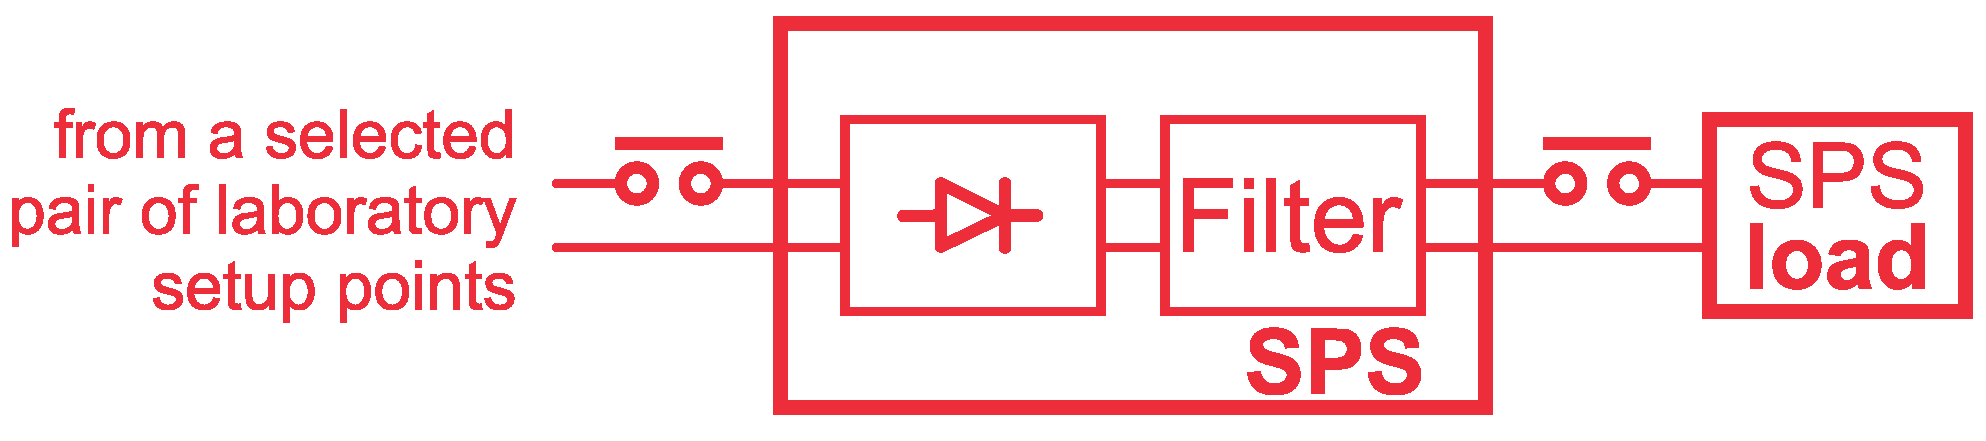
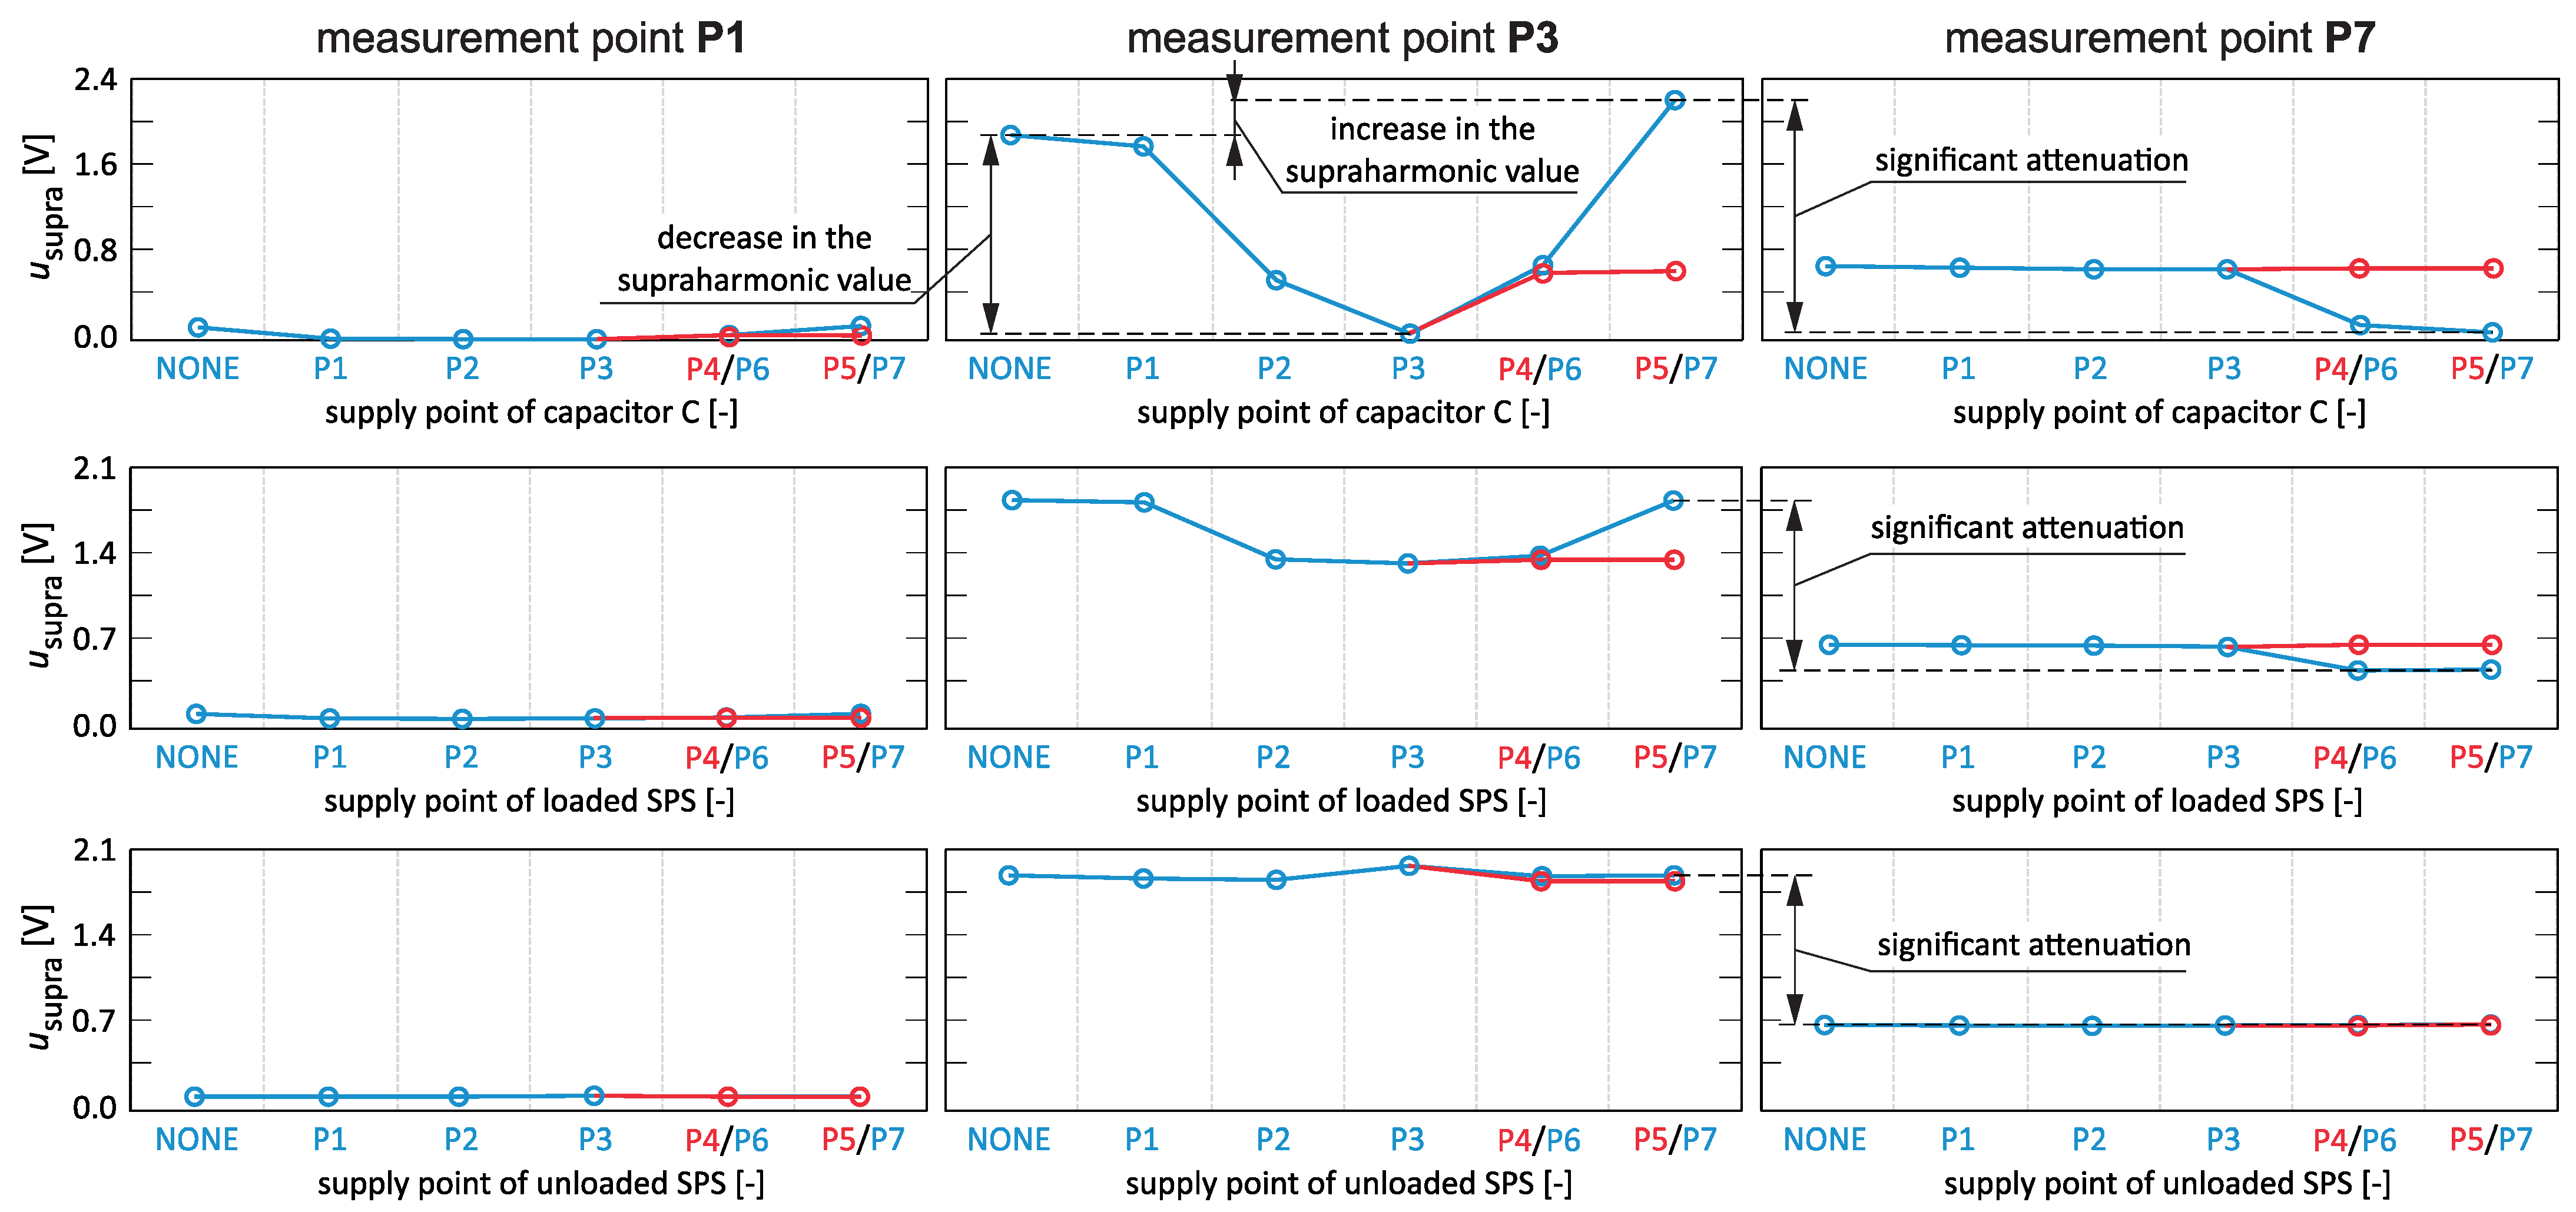
Figure 13 shows the propagation of the average value of one of the dominant supraharmonics generated by the FEL supplied from the network point P3 and the UPS supplied from the network point P6 at individual points in the network, considering the connection of various types of loads commonly used in the LV network. By analyzing the results obtained, several important problems can be identified from the point of view of diagnosing supraharmonics in the power grid. Various loads supplied from the same power circuit as the supraharmonic source can cause the values of specific supraharmonics to increase or decrease in power networks. It is worth noting that selected loads can change the tendency in the propagation of supraharmonics in the power grid, e.g., by the attenuation of the values of individual supraharmonics (as in the case shown in Figure 13). From a diagnostic point of view, such situations can cause an incorrect indication of the supply point of the source of disturbance. A step change caused by the attenuation of supraharmonic propagation by some load (e.g., capacitor C or SPS) can cause an excessive indication of the number of supraharmonic sources in the power grid (e.g., capacitor C should not be identified as a source of supraharmonics).
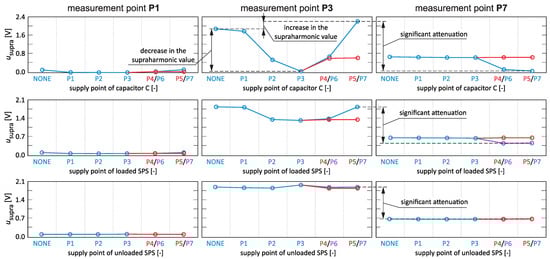
Figure 13.
Propagation of the average value of selected supraharmonics caused by FEL supplied from network point P3 and UPS supplied from network point P6 at individual network points, considering the connection of selected types of loads in the power grid (capacitor C, loaded and unloaded SPS, “NONE” means no load connection).
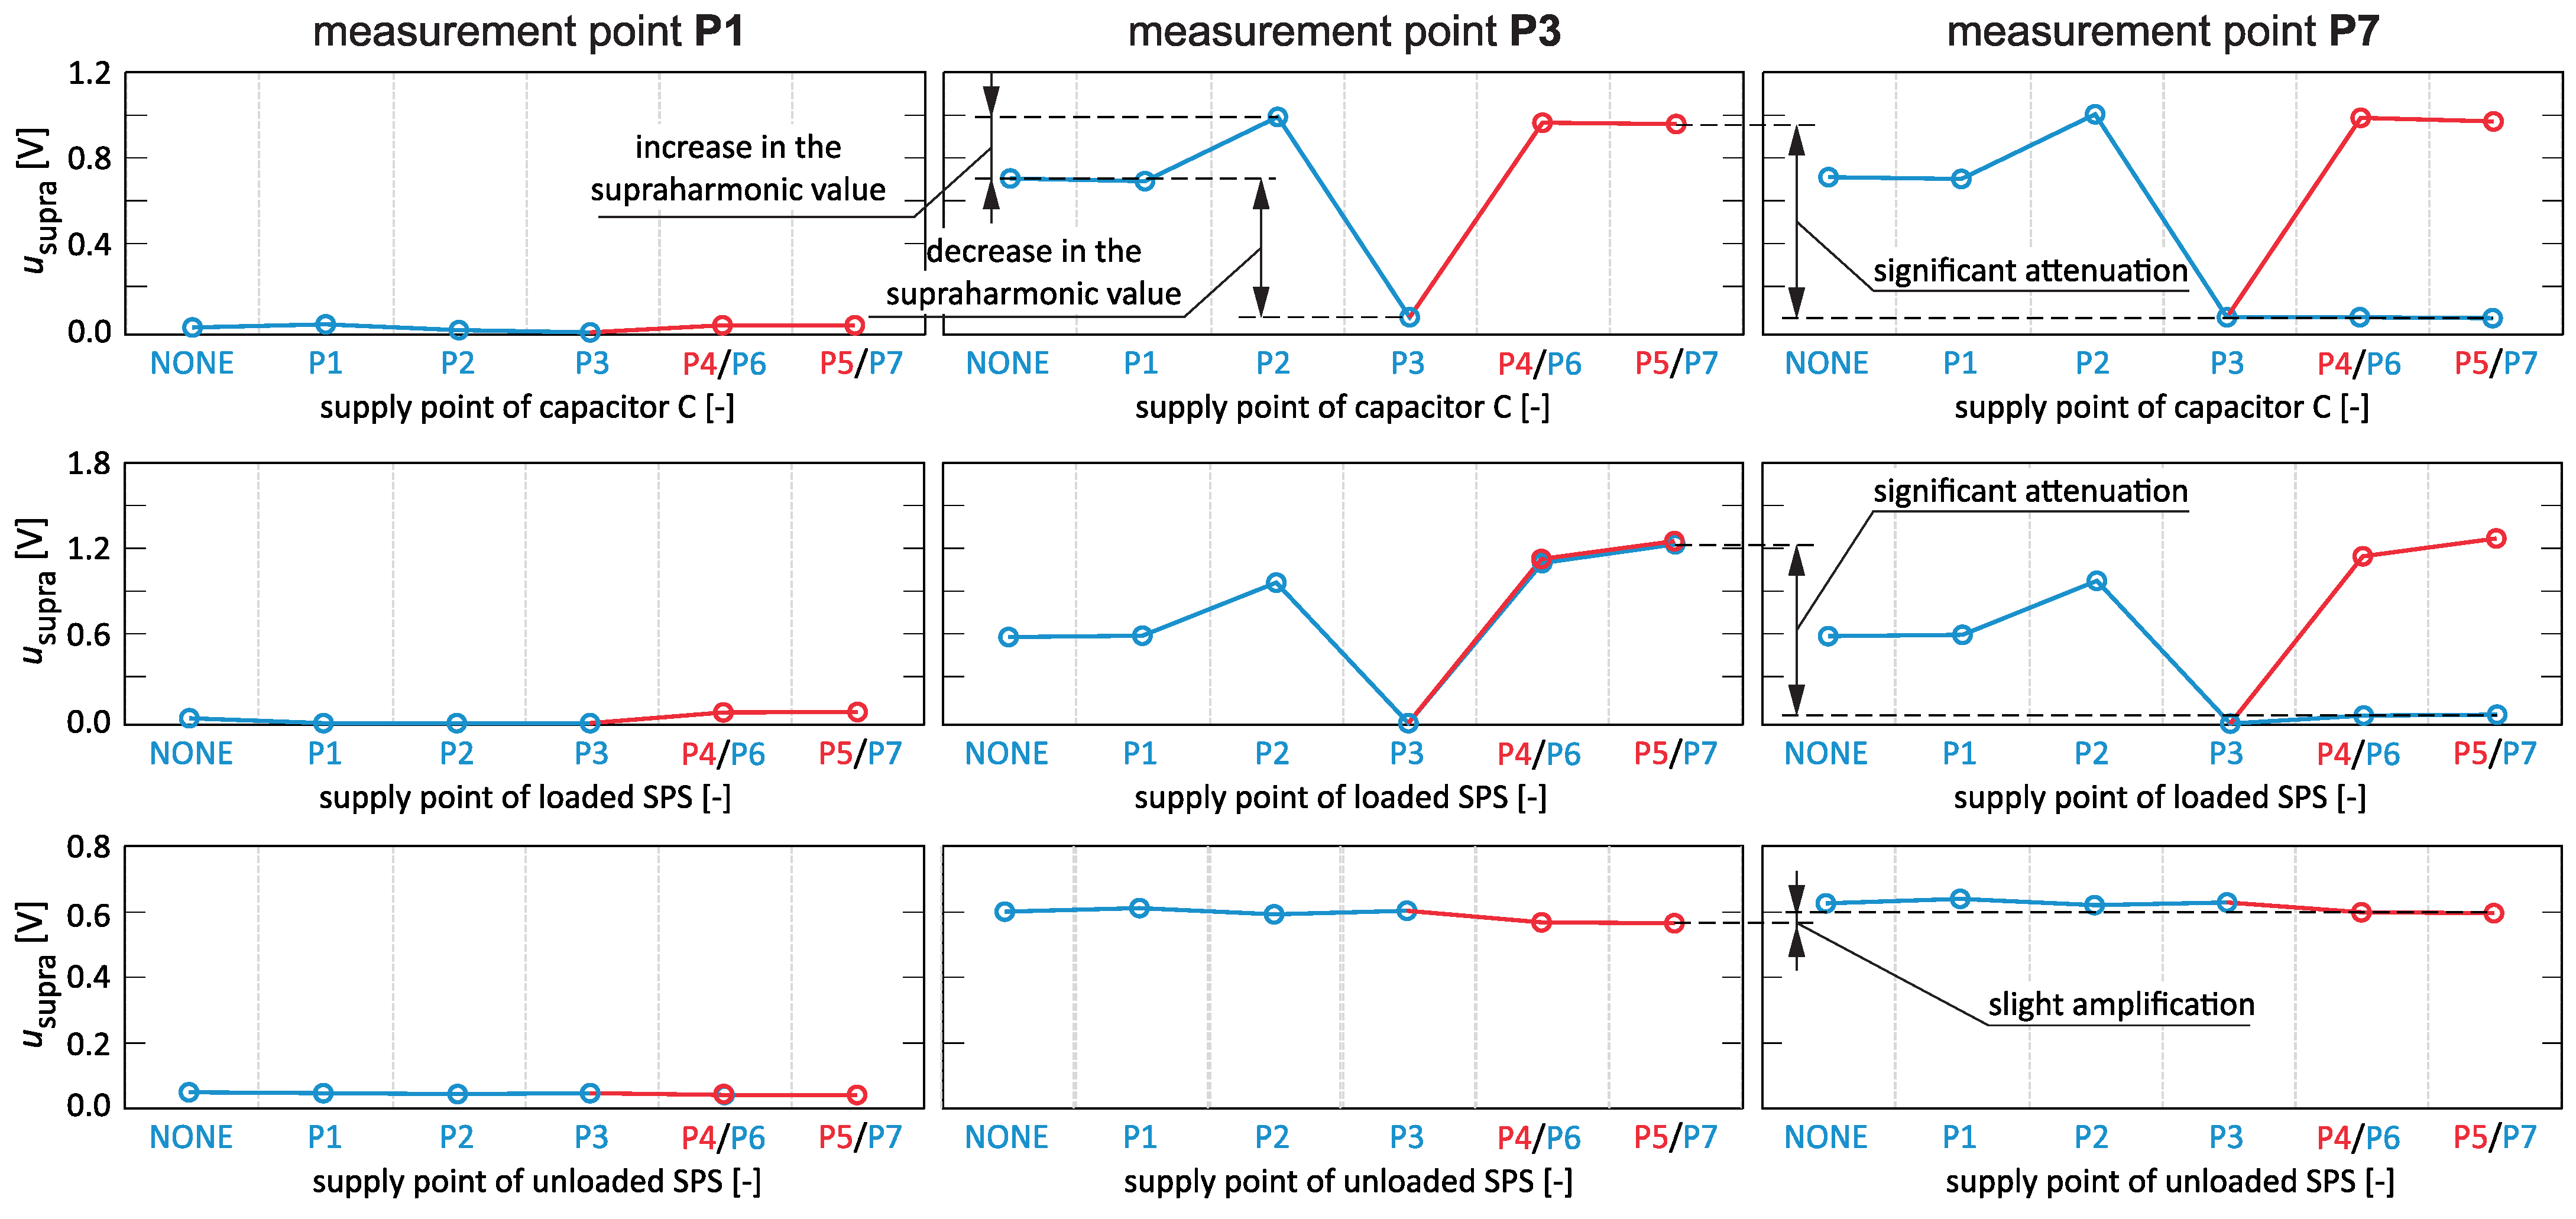
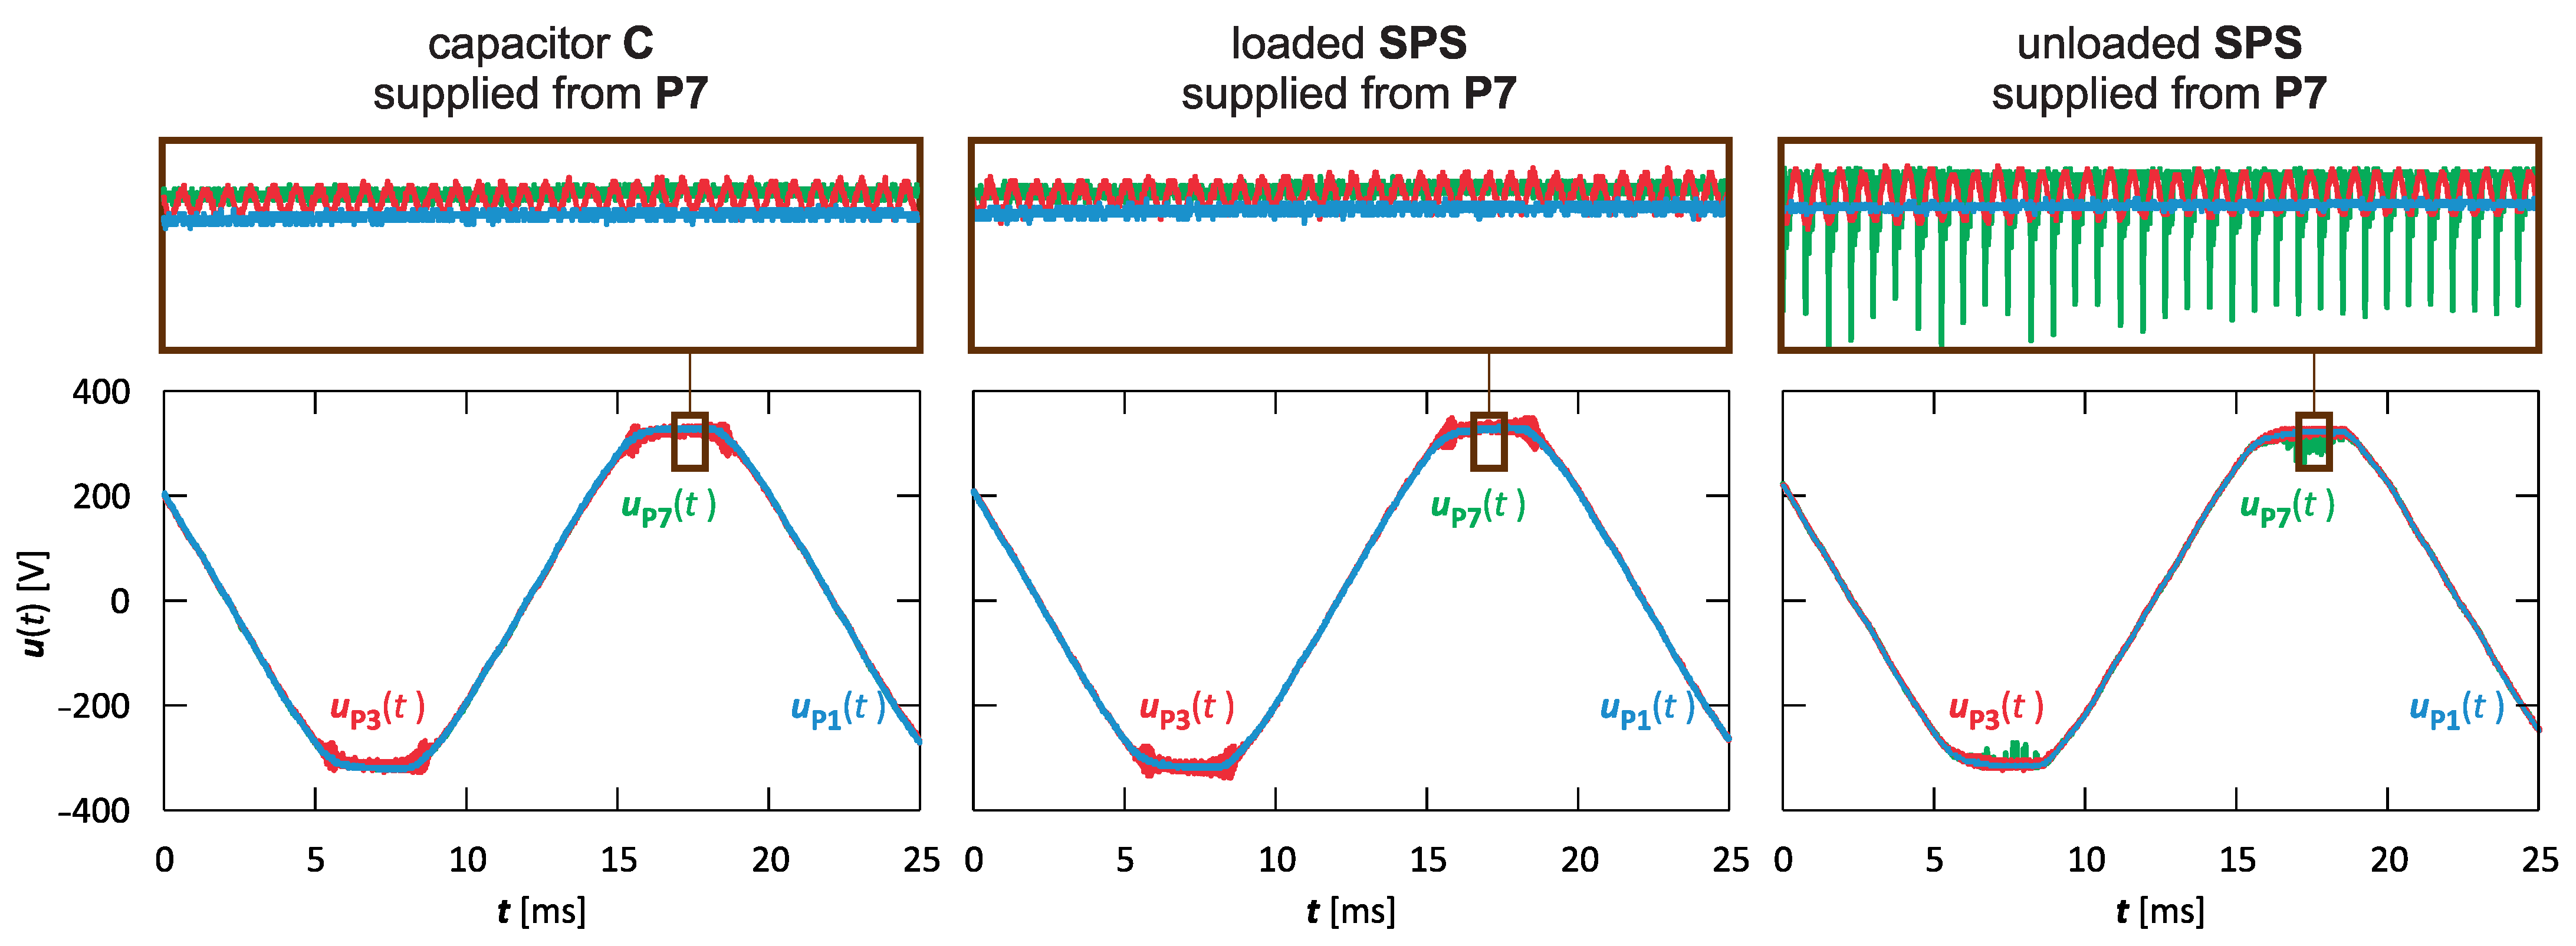
Analyzing the results presented in Figure 12 and Figure 13, it can be concluded that the interaction of two supraharmonic sources with the impedance of supply line is the main cause of problems in the evaluation of the propagation of supraharmonic components in the power grid, and not the interaction with other connected loads. Therefore, analogue research was performed for the case when there is only one dominant source of supraharmonics in the power grid. Figure 14 shows the propagation of the average value of one of the dominant supraharmonics generated by the FEL supplied from the network point P3 at individual points of the network, considering the connection of various types of loads commonly used in the LV network. By analyzing the obtained results, it is also possible to indicate several important problems from the point of view of diagnosing supraharmonics in the power grid, similarly to the case of the occurrence of two significant sources of supraharmonics. Various loads supplied from the same power circuit as the supraharmonic source can cause the supraharmonic values in the network to decrease or increase. Depending on the operating mode of specific loads, there can be significant attenuation (SPS in the loaded mode—Figure 14) or slight amplification (SPS in the idle mode—Figure 14) of the propagation of supraharmonics in the power grid. From the diagnostics point of view, such situations can cause an incorrect indication of the supply point of the source of disturbance. A step change caused by the attenuation of supraharmonic propagation by some load (e.g., capacitor C or loaded SPS) can cause an excessive indication of the number of supraharmonic sources in the power grid (e.g., capacitor C should not be identified as a source of supraharmonics). In turn, a small increase (in the case of a mass impact of loads of a specific type, the increase can be significant) caused by the amplification of the propagation of supraharmonics by a specific load (e.g., unloaded SPS) can result in an incorrect indication of the supply point of source of supraharmonics. Figure 15 shows a comparison of waveforms of phase voltage recorded at measurement points P1, P3, and P7 when the supraharmonics source FEL is supplied from network point P3 and the selected load is supplied from network point P7. The situation shown in Figure 15 shows the possible attenuation or amplification of the propagation of supraharmonics (caused by FEL) by the particular selected loads.
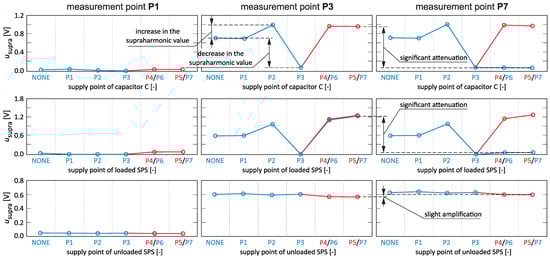
Figure 14.
Propagation of the average value of selected supraharmonic caused by FEL supplied from network point P3, considering the connection of selected types of loads in the power grid (capacitor C, loaded and unloaded SPS, “NONE” means no load connection).
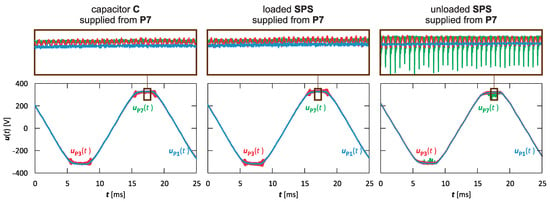
Figure 15.
Comparison of voltage waveforms at measurement points P1, P3, and P7 for the case when the supraharmonics source is supplied from network point P3 and additional load is supplied from network point P7.
3.3. Stage III—Measurement Results from Industrial Research
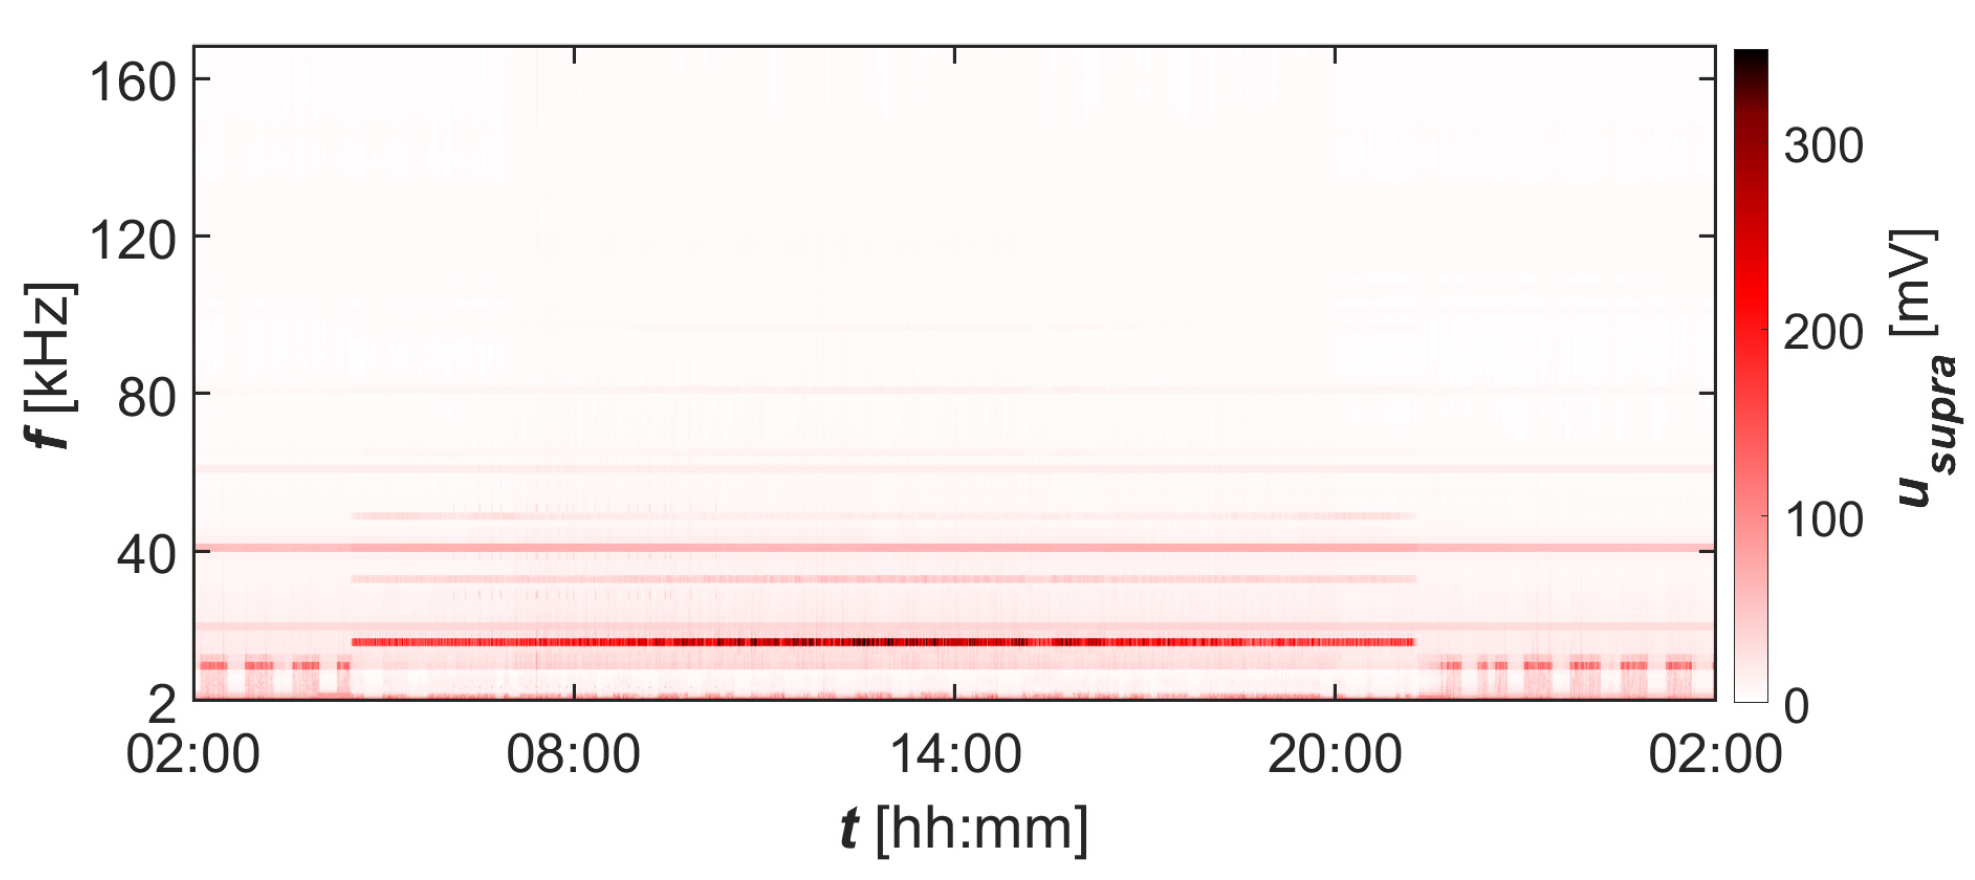
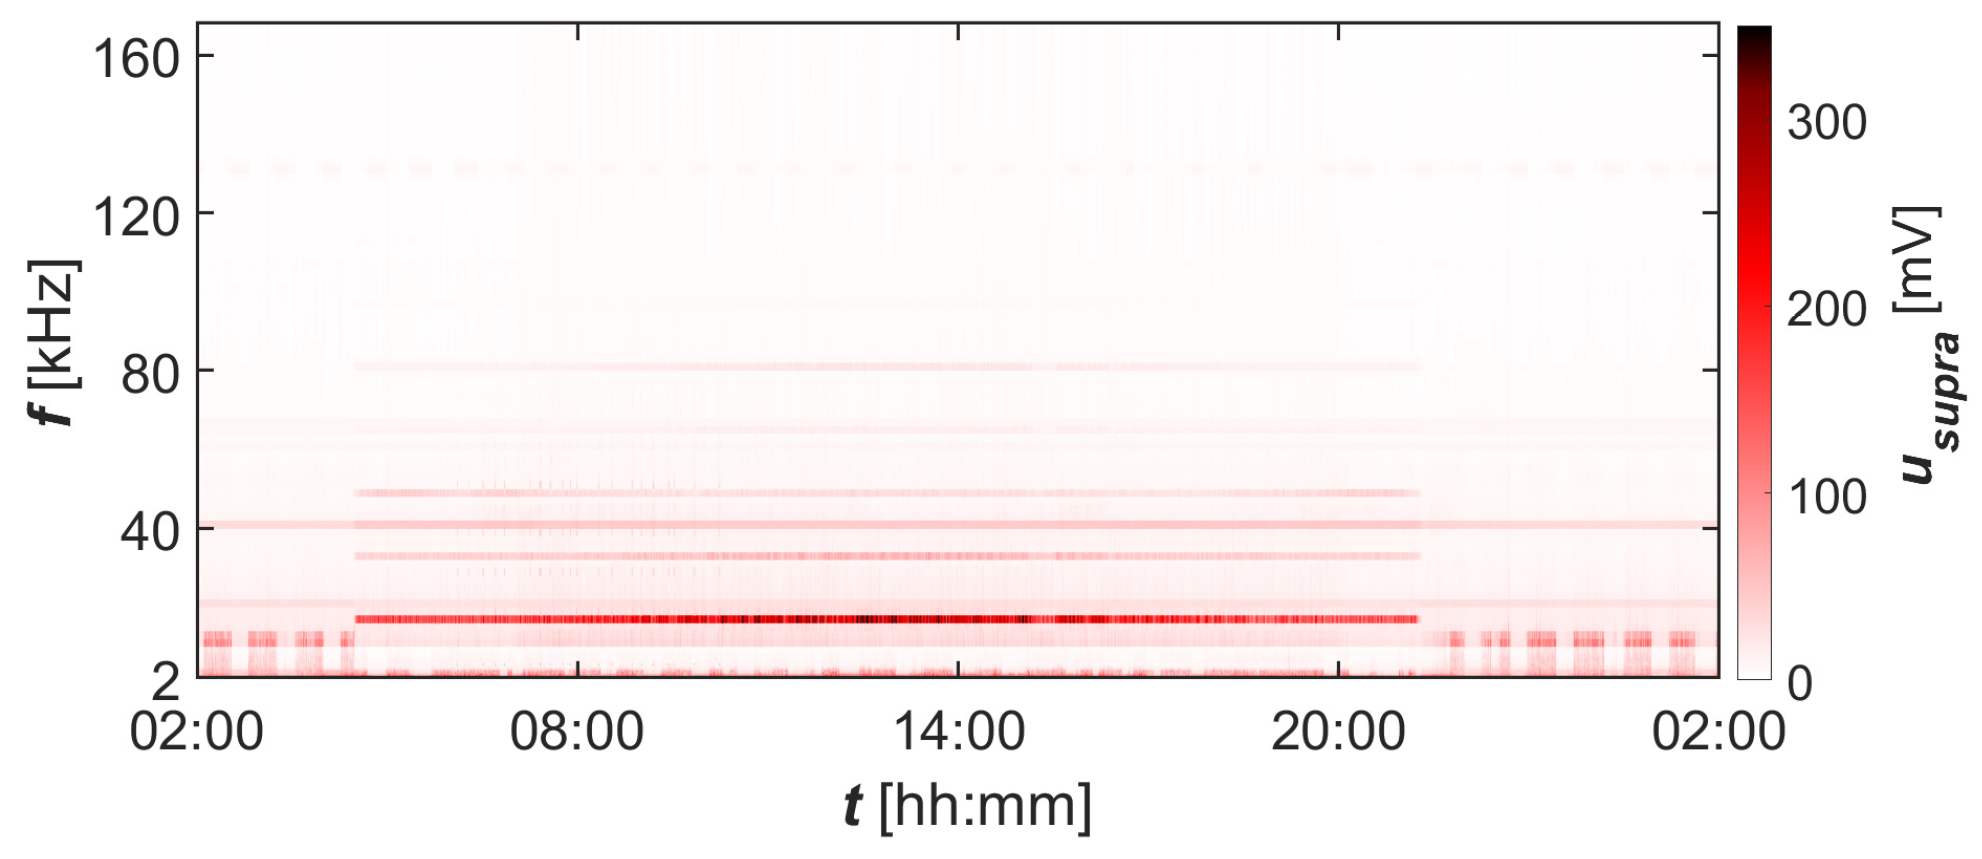
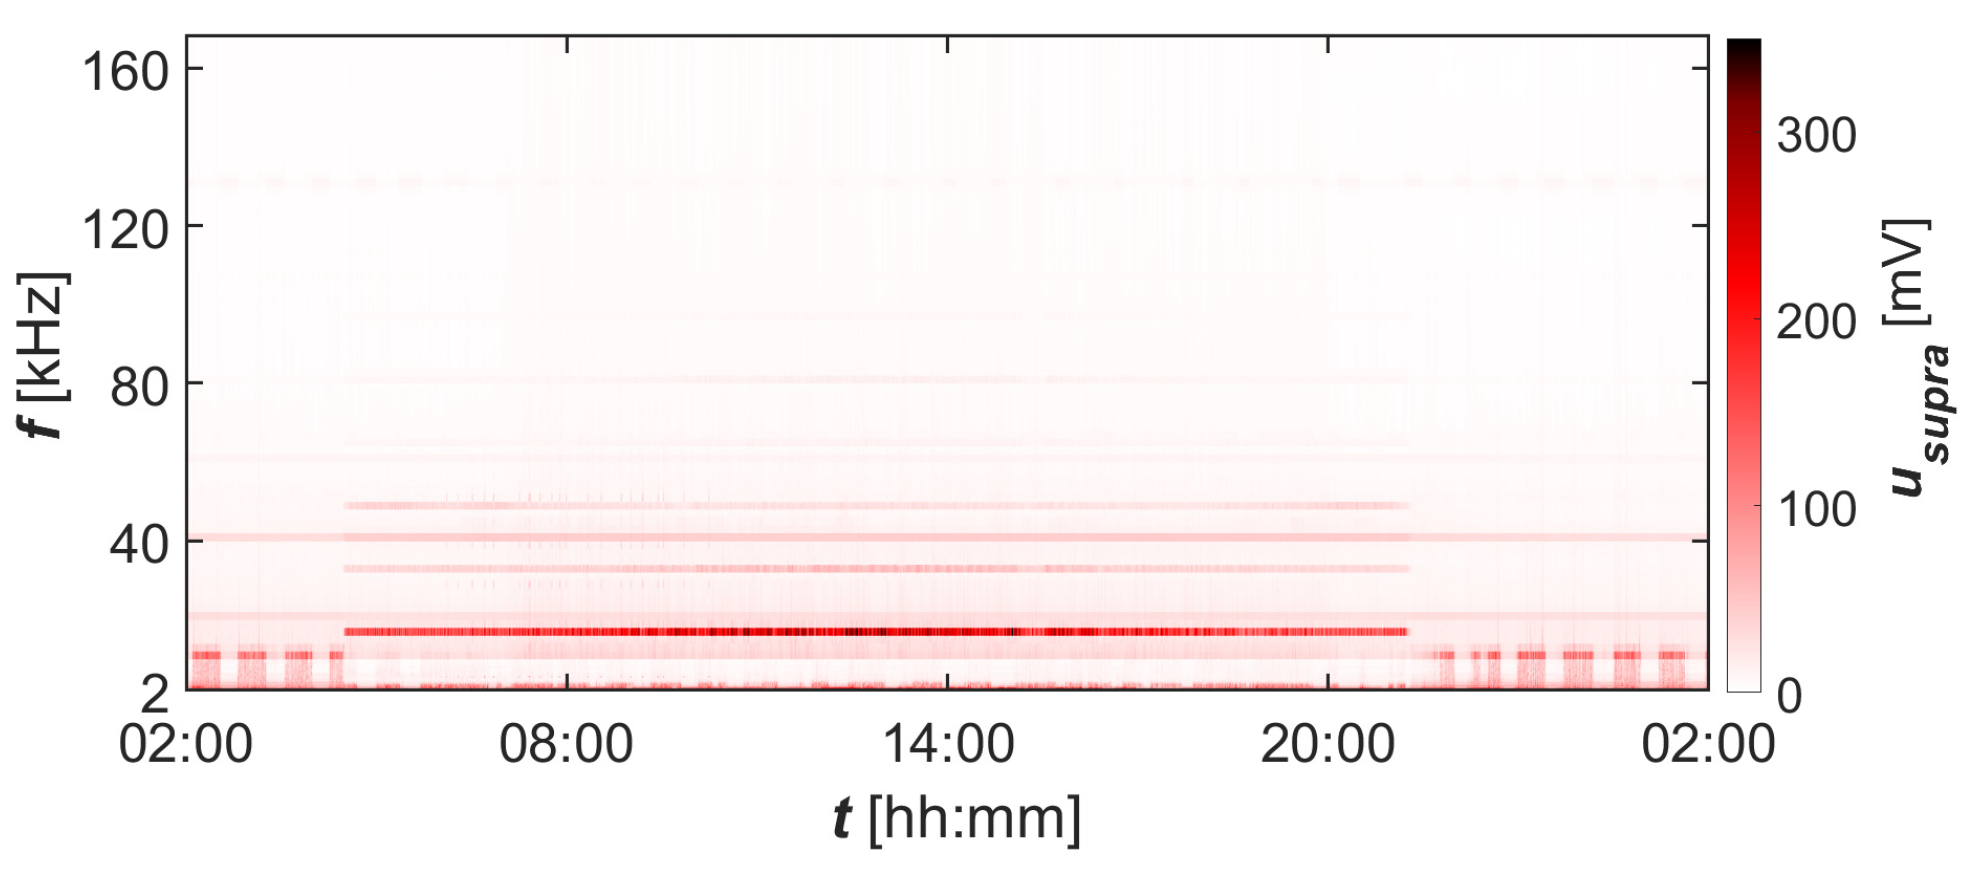
Figure 16, Figure 17 and Figure 18 show supraharmonic spectrograms for subsequent phase voltages at a point closer to the medium-voltage to low-voltage (MV/LV) transformer station.

Figure 16.
Spectrograms of supraharmonics of phase voltage L1 in the bandwidth 2–170 at network point closer to the MV/LV transformer station—connection point for PV panels.
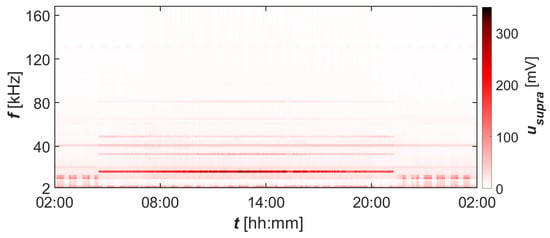
Figure 17.
Spectrograms of supraharmonics of phase voltage L2 in the bandwidth 2–170 at network point closer to the MV/LV transformer station—connection point for PV panels.
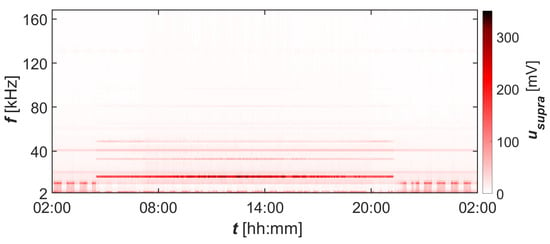
Figure 18.
Spectrograms of supraharmonics of phase voltage L3 in the bandwidth 2–170 at network point closer to the MV/LV transformer station—connection point for PV panels.
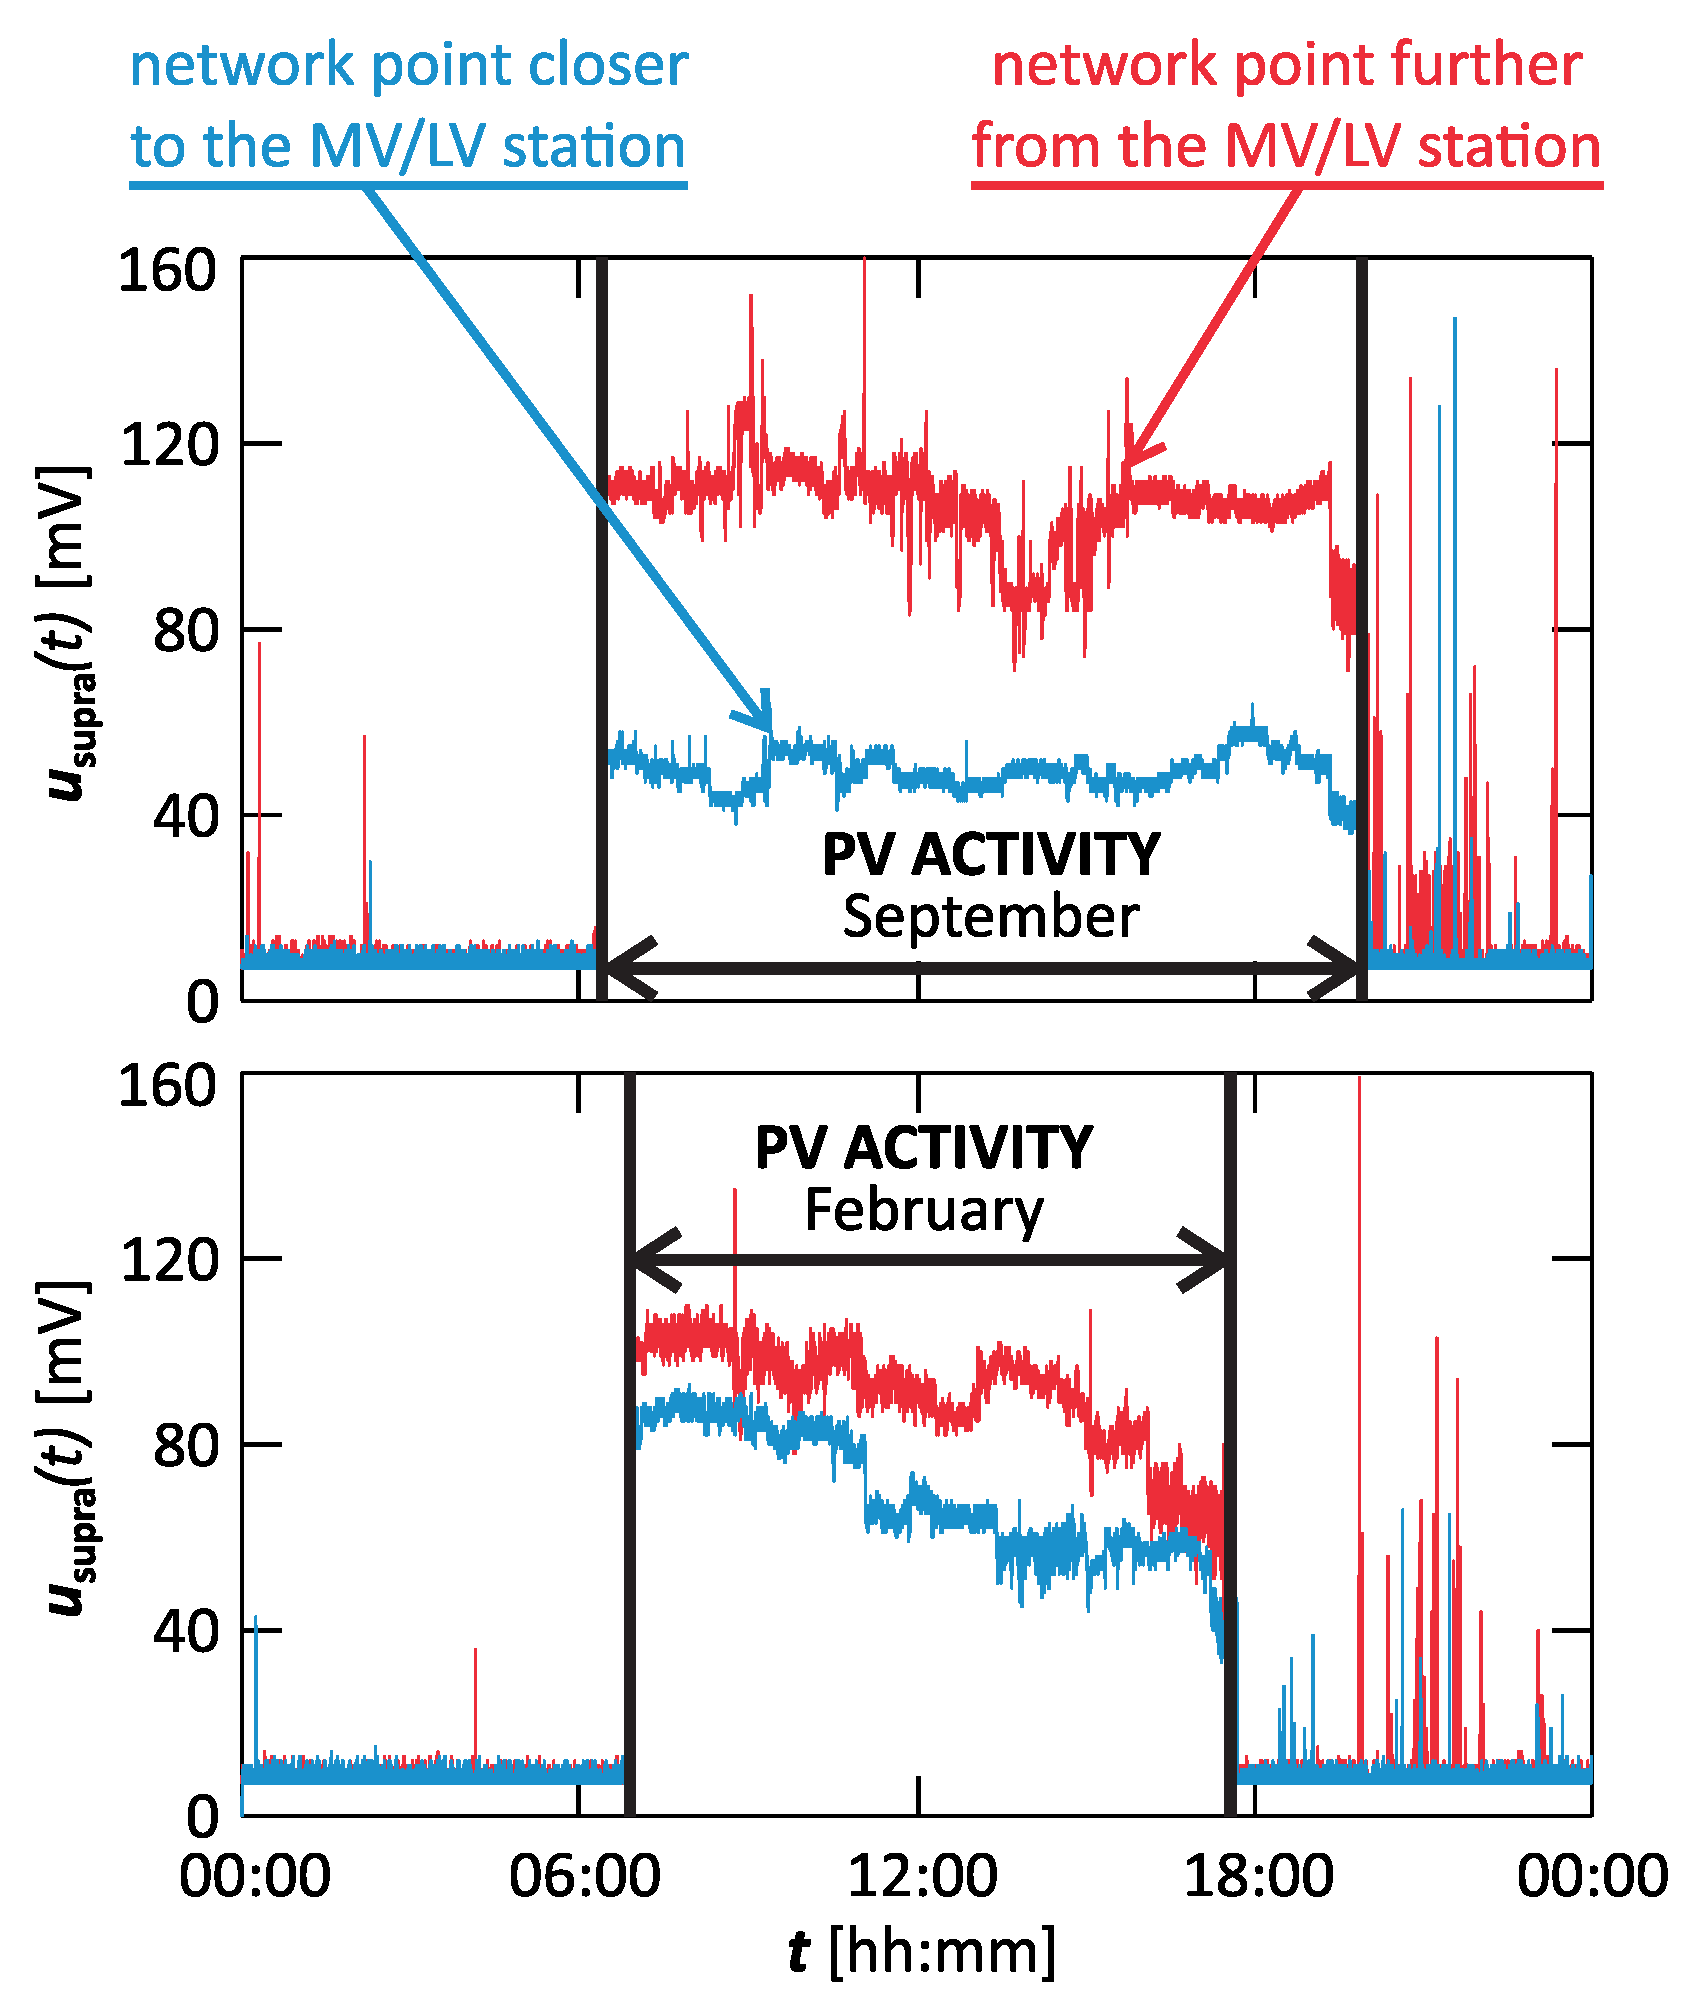
Figure 19, Figure 20 and Figure 21 show supraharmonic spectrograms for subsequent phase voltages at a point further from the MV/LV transformer station. Analyzing the results presented in Figure 16, Figure 17, Figure 18, Figure 19, Figure 20 and Figure 21, a close symmetry between the phases can be noticed at individual network points. It is also worth noting that the local extremes change at particular network points, which is related to the operation of specific loads at particular points in the network. For the purposes of this stage, the focus was on the assessment of components associated with the activity of photovoltaic (PV) panels supplied from a point closer to the MV/LV transformer station. For better analysis, selected supraharmonic components associated with the activity of PV panels are presented in Figure 22 in the form of time characteristics. Taking into account the propagation of supraharmonics discussed in Stage I, dominant supraharmonic values associated with the activity of PV panels at the point of their connection can be expected, and at points further away from the MV/LV station, it can be expected that the selected supraharmonics maintain an approximately similar level. However, based on the results presented in Figure 22, it can be seen that the selected supraharmonics do not maintain a constant value level. Moreover, at the connection point further away from the MV/LV station, there was amplification or attenuation of individual supraharmonics, which can incorrectly indicate that the further network point is the source of the supraharmonics. It is worth noting, however, that many industrial studies performed and repeated confirmed the connection of selected supraharmonics with the power supply point closer to the MV/LV station. The presented studies were carried out on a network with high short-circuit power in order to minimize the impact of other small sources of disturbance. The research carried out herein, some of which is also presented in [36], shows that in circuits with low short-circuit power, the presented problem can be significantly intensified.
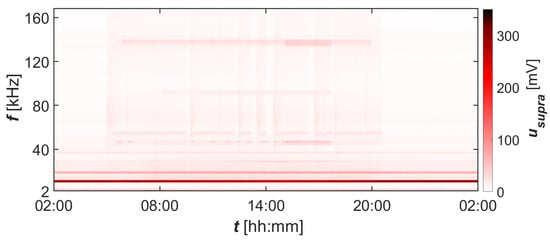
Figure 19.
Spectrograms of supraharmonics of phase voltage L1 in the bandwidth 2–170 at network point further from the MV/LV transformer station.
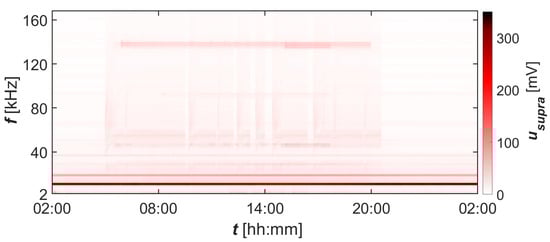
Figure 20.
Spectrograms of supraharmonics of phase voltage L2 in the bandwidth 2–170 at network point further from the MV/LV transformer station.

Figure 21.
Spectrograms of supraharmonics of phase voltage L3 in the bandwidth 2–170 at network point further from the MV/LV transformer station.
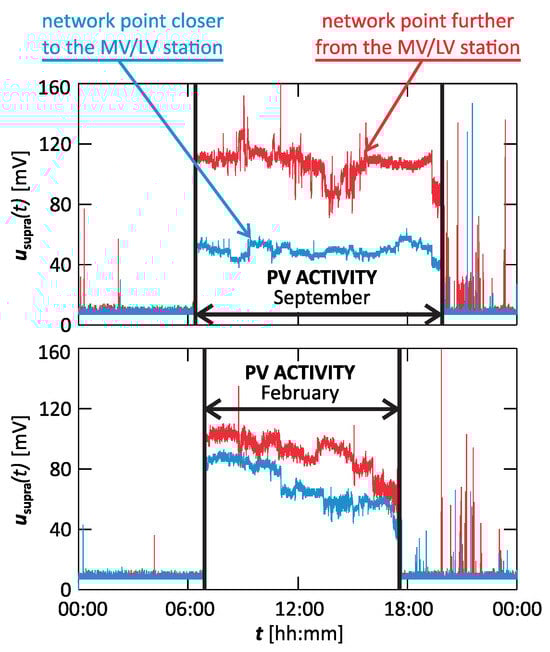
Figure 22.
Characteristics of selected supraharmonics associated with the PV activity at individual points in the network for phase voltage L1.
4. Conclusions
The increasing number of power electronic devices causes an increased need for effective supraharmonic diagnostics. Diagnostics of supraharmonics in modern power networks is a difficult task. This paper presents selected results of industrial measurements, which show that selected supraharmonics, depending on the properties of the power supply circuit and the influence of other loads in the power grid, can be amplified or attenuated. In the case of local amplification of selected supraharmonics, a situation can occur in which the maximum absolute value of supraharmonics related to the impact of a specific load can occur at a point in the network other than the supply point of this load. This situation causes significant difficulties in the supraharmonic diagnostic process aimed at identifying the point of supply of supraharmonic sources in the power grid. This article also presents the results of tests carried out under controlled conditions using a power grid model with a branching radial topology, showing the possible interaction of supraharmonic sources with selected loads (also de facto with the impedance of the supply line) and the propagation of selected supraharmonics for such situations. Due to the non-stationary operation of the analyzed loads, which is also influenced by the actual supply voltage state in the power grid (the degree of supply voltage disturbance depends on the currently operating disturbing loads in the power grid), there is an interaction between them and the power grid, i.e., the impedance of the supply line. From the point of view of the power system, the impedance changes at individual points of the power grid (the resultant impedance of the impedance of supply line and the impedance of a specific load at its current working condition), which affects the propagation of supraharmonics. Changing the resultant impedance of a power system can lead to local resonances that amplify or suppress specific supraharmonics. The research results presented in this paper show the problem of diagnosing supraharmonics in modern power networks and indicate that even if a specific load generates supraharmonics of small values, then these supraharmonics can be amplified due to the common connection of the capacitor in networks or the common use of switching power supplies. Therefore, even the smallest level of supraharmonics cannot be ignored at present. Based on the research carried out, the following concise recommendations can be presented in the field of supraharmonic diagnostics. When looking for a supply point for supraharmonic sources, this supply point should not be identified with the maximum value of a specific supraharmonic among all points of the power grid. In the case of the analysis of a circuit with a fixed and known topology, it should not be assumed that the propagation of supraharmonics is constant, because it is necessary to take into account the fact of the change in propagation resulting from the interaction between different loads supplied from the analyzed circuit of the power grid.
In summary, the article presents previously unexplained problems in the field of supraharmonic diagnostics, highlighting findings from experimental studies conducted on power networks. The aforementioned problems concern the propagation of supraharmonics in the situation of the occurrence of multiple sources of these disturbances and their potential interaction with other typical loads for low-voltage networks. The studies carried out have shown that the mutual interaction of various loads in the power network leads to changes in the propagation of supraharmonics, probably due to the change in the resultant impedance seen from the point of view of the power network. It is also worth noting that the analysis of supraharmonic propagation itself, which was carried out for the purposes of this article, is an unexplored problem due to the lack of universal knowledge. Understanding the problem of supraharmonic propagation is associated with the analysis of selected circuits; therefore, the article attempts to examine the propagation in the adopted configuration. Previous observations of laboratory systems and real low-voltage power networks indicate difficulties in the theoretical analysis of supraharmonic propagation. The basic problem is the analytical description of interactions between different loads. For example, analyses that are adequate for harmonics are ineffective with respect to supraharmonics. Therefore, experimental studies are the basic source of knowledge on the propagation of supraharmonics in low-voltage power networks.
Author Contributions
Conceptualization, P.K. and G.W.; Methodology, P.K. and G.W.; Software, P.K.; Validation, G.W.; Formal analysis, P.K. and G.W.; Investigation, P.K. and G.W.; Resources, P.K. and G.W.; Data curation, P.K.; Writing—original draft, P.K.; Visualization, P.K.; Supervision, G.W. All authors have read and agreed to the published version of the manuscript.
Funding
This research received no external funding.
Data Availability Statement
The data presented in this study are available on request from the corresponding author.
Conflicts of Interest
The authors declare no conflicts of interest.
References
- Standard EN 50160:2010/A2:2019; Voltage Characteristics of Electricity Supplied by Public Electricity Networks. CENELEC: Brussels, Belgium, 2017.
- Fuchs, E.; Masoum, M. Power Quality in Power Systems, Electrical Machines, and Power-Electronic Drives, 3rd ed.; Academic Press: Cambridge, MA, USA, 2022. [Google Scholar]
- Sitki Akkaya, E.Y.; Akgun, H.M. A New Comparative Approach Based on Features of Subcomponents and Machine Learning Algorithms to Detect and Classify Power Quality Disturbances. Electr. Power Compon. Syst. 2024, 52, 1269–1292. [Google Scholar] [CrossRef]
- Donolo, P.D.; Pezzani, C.M.; Bossio, G.R.; De Angelo, C.H.; Donolo, M.A. Derating of Induction Motors Due to Power Quality Issues Considering the Motor Efficiency Class. IEEE Trans. Ind. Appl. 2020, 56, 961–969. [Google Scholar] [CrossRef]
- Gnacinski, P.; Hallmann, D.; Peplinski, M.; Jankowski, P. The effects of voltage subharmonics on cage induction machine. Int. J. Electr. Power Energy Syst. 2019, 111, 125–131. [Google Scholar] [CrossRef]
- Gnacinski, P.; Peplinski, M.; Muc, A.; Hallmann, D.; Klimczak, P. Induction Motors Under Voltage Fluctuations and Power Quality Standards. IEEE Trans. Energy Convers. 2024, 39, 1255–1264. [Google Scholar] [CrossRef]
- Gnacinski, P.; Hallmann, D.; Muc, A.; Klimczak, P.; Peplinski, M. Induction Motor Supplied with Voltage Containing Symmetrical Subharmonics and Interharmonics. Energies 2022, 15, 7712. [Google Scholar] [CrossRef]
- Langella, R.; Testa, A.; Vendemia, V.; Drapela, J. New Comprehensive Analytical Model of Single-Phase AC/DC Diode Rectifiers in the Presence of Interharmonics in Supply Voltage. In Proceedings of the 2022 20th International Conference on Harmonics and Quality of Power (ICHQP 2022), Naples, Italy, 29 May–1 June 2022. [Google Scholar] [CrossRef]
- 6th CEER Benchmarking Report on All the Quality of Electricity and Gas Supply 2016. 2016. Available online: https://www.ceer.eu/ (accessed on 1 September 2021).
- Enslin, J.; Heskes, P. Harmonic interaction between a large number of distributed power inverters and the distribution network. IEEE Trans. Power Electron. 2004, 19, 1586–1593. [Google Scholar] [CrossRef]
- Siostrzonek, T.; Chmielowiec, K.; Firlit, A.; Barczentewicz, S. Advantages and disadvantages of using multi-pulse systems in the electric drive of hoisting machines. Prz. Elektrotechniczny 2020, 96, 43–46. [Google Scholar] [CrossRef]
- Teng, F.; Ding, Z.; Hu, Z.; Sarikprueck, P. Technical Review on Advanced Approaches for Electric Vehicle Charging Demand Management, Part I: Applications in Electric Power Market and Renewable Energy Integration. IEEE Trans. Ind. Appl. 2020, 56, 5684–5694. [Google Scholar] [CrossRef]
- Kuwalek, P.; Wiczynski, G. Dependence of Voltage Fluctuation Severity on Clipped Sinewave Distortion of Voltage. IEEE Trans. Instrum. Meas. 2021, 70, 1–8. [Google Scholar] [CrossRef]
- Kuwalek, P. Decomposition by Approximation With Pulse Waves Allowing Further Research on Sources of Voltage Fluctuations. IEEE Trans. Ind. Electron. 2024, 71, 5263–5273. [Google Scholar] [CrossRef]
- Gonzalez-Abreu, A.D.; Osornio-Rios, R.A.; Jaen-Cuellar, A.Y.; Delgado-Prieto, M.; Antonino-Daviu, J.A.; Karlis, A. Advances in Power Quality Analysis Techniques for Electrical Machines and Drives: A Review. Energies 2022, 15, 1909. [Google Scholar] [CrossRef]
- Nandi, R.; Tripathy, M.; Gupta, C.P. Multi-Objective Optimization Based Voltage Injection Technique for Minimizing Imbalance and Harmonics in AC Microgrid. IEEE Trans. Sustain. Energy 2024, 15, 1269–1287. [Google Scholar] [CrossRef]
- Chmielowiec, K.; Topolski, L.; Dutka, M.; Piszczek, A.; Hanzelka, Z.; Rodziewicz, T. Technical Requirements of Photovoltaic Inverters for Low Voltage Distribution Networks. Inventions 2024, 9, 91. [Google Scholar] [CrossRef]
- Bollen, M.; Olofsson, M.; Larsson, A.; Ronnberg, S.; Lundmark, M. Standards for supraharmonics (2 to 150 kHz). IEEE Electromagn. Compat. Mag. 2014, 3, 114–119. [Google Scholar] [CrossRef]
- Standard IEC 61000-4-30:2015/AMD1:2021; Testing and Measurement Techniques—Power Quality Measurement Methods. IEC: Geneva, Switzerland, 2021.
- Standard IEC 61000-4-7:2002/A1:2008; Testing and Measurement Techniques—General Guide on Harmonics and Interharmonics Measurements and Instrumentation, for Power Supply Systems and Equipment Connected Thereto. IEC: Geneva, Switzerland, 2009.
- Kuwalek, P.; Otomanski, P.; Wandachowicz, K. Influence of the Phenomenon of Spectrum Leakage on the Evaluation Process of Metrological Properties of Power Quality Analyser. Energies 2020, 13, 5338. [Google Scholar] [CrossRef]
- Kuwalek, P.; Bracale, A.; Sikorski, T.; Rezmer, J. Synchronized Approach Based on Empirical Fourier Decomposition for Accurate Assessment of Harmonics and Specific Supraharmonics. IEEE Trans. Ind. Electron. 2025, 72, 992–1002. [Google Scholar] [CrossRef]
- Frigo, G.; Braun, J. Supraharmonic Dynamic Phasors: Estimation of Time-Varying Emissions. IEEE Trans. Instrum. Meas. 2022, 71, 1–11. [Google Scholar] [CrossRef]
- Mendes, T.M.; Ferreira, D.D.; Silva, L.R.M.; Ribeiro, P.F.; Meyer, J.; Duque, C.A. PLL Based Method for Supraharmonics Emission Assessment. IEEE Trans. Power Deliv. 2022, 37, 2610–2620. [Google Scholar] [CrossRef]
- Carpinelli, G.; Bracale, A.; Varilone, P.; Sikorski, T.; Kostyla, P.; Leonowicz, Z. A New Advanced Method for an Accurate Assessment of Harmonic and Supraharmonic Distortion in Power System Waveforms. IEEE Access 2021, 9, 88685–88698. [Google Scholar] [CrossRef]
- Akkaya, S.; Yuksek, E.; Akgun, H. A comprehensive research of machine learning algorithms for power quality disturbances classifier based on time-series window. Electr. Eng. 2024, 106, 3983–4001. [Google Scholar] [CrossRef]
- Ritzmann, D.; Lodetti, S.; de la Vega, D.; Khokhlov, V.; Gallarreta, A.; Wright, P.; Meyer, J.; Fernández, I.; Klingbeil, D. Comparison of Measurement Methods for 2–150-kHz Conducted Emissions in Power Networks. IEEE Trans. Instrum. Meas. 2021, 70, 1–10. [Google Scholar] [CrossRef]
- Zhuang, S.; Zhao, W.; Wang, R.; Wang, Q.; Huang, S. New Measurement Algorithm for Supraharmonics Based on Multiple Measurement Vectors Model and Orthogonal Matching Pursuit. IEEE Trans. Instrum. Meas. 2019, 68, 1671–1679. [Google Scholar] [CrossRef]
- Lodetti, S.; Bruna, J.; Melero, J.J.; Khokhlov, V.; Meyer, J. A Robust Wavelet-Based Hybrid Method for the Simultaneous Measurement of Harmonic and Supraharmonic Distortion. IEEE Trans. Instrum. Meas. 2020, 69, 6704–6712. [Google Scholar] [CrossRef]
- IEEE Std 519-2022 (Revision of IEEE Std 519-2014); IEEE Standard for Harmonic Control in Electric Power Systems. IEEE: New York, NY, USA, 2022; pp. 1–31. [CrossRef]
- Powell, J.; McCafferty-Leroux, A.; Hilal, W.; Gadsden, S.A. Smart grids: A comprehensive survey of challenges, industry applications, and future trends. Energy Rep. 2024, 11, 5760–5785. [Google Scholar] [CrossRef]
- Frydlewicz, W.; Michalec, L.; Kostyla, P.; Kaczorowska, D.; Sikorski, T. Influence of the Supply Voltage Variation on the Conducted Emission in the Frequency Range up to 150 kHz Injected into the Power Grid by CFL and LED Lamps—Case Study. Appl. Sci. 2024, 14, 2590. [Google Scholar] [CrossRef]
- Mariscotti, A.; Mingotti, A. The Effects of Supraharmonic Distortion in MV and LV AC Grids. Sensors 2024, 24, 2465. [Google Scholar] [CrossRef] [PubMed]
- Barczentewicz, S.; Rodziewicz, T.; Bien, A.; Firlit, A. Individual emission assessment of harmonics in DSO environment. Int. J. Electron. Telecommun. 2024, 70, 169–174. [Google Scholar] [CrossRef]
- Alfalahi, S.T.Y.; Alkahtani, A.A.; Al-Shetwi, A.Q.; Al-Ogaili, A.S.; Abbood, A.A.; Mansor, M.B.; Fazea, Y. Supraharmonics in Power Grid: Identification, Standards, and Measurement Techniques. IEEE Access 2021, 9, 103677–103690. [Google Scholar] [CrossRef]
- Kuwalek, P.; Wiczynski, G. Preliminary Observations of Supraharmonics in Low Voltage Networks. In Proceedings of the 2023 IEEE International Conference on Energy Technologies for Future Grids (ETFG), Wollongong, Australia, 3–6 December 2023; pp. 1–6. [Google Scholar] [CrossRef]
- Sakar, S.; Rönnberg, S.K.; Bollen, M. Interharmonic Emission in AC–DC Converters Exposed to Nonsynchronized High-Frequency Voltage Above 2 kHz. IEEE Trans. Power Electron. 2021, 36, 7705–7715. [Google Scholar] [CrossRef]
- Sakar, S.; Rönnberg, S. Modeling and Analysis of DC-Link Capacitors Subjected to High Frequency Conducted Disturbances in Electronic Equipment. IEEE Trans. Power Electron. 2022, 37, 5949–5956. [Google Scholar] [CrossRef]
- Sanchez-Herrera, R.; Clavijo-Camacho, J.; Gomez-Ruiz, G.; Vazquez, J.R. Identification of Both Distortion and Imbalance Sources in Electrical Installations: A Comparative Assessment. Energies 2024, 17, 2536. [Google Scholar] [CrossRef]
- Mariscotti, A.; Sandrolini, L.; Pasini, G. Variability Caused by Setup and Operating Conditions for Conducted EMI of Switched Mode Power Supplies Over the 2–1000 kHz Interval. IEEE Trans. Instrum. Meas. 2022, 71, 1–9. [Google Scholar] [CrossRef]
- Espin-Delgado, A.; Ronnberg, S.; Sudha Letha, S.; Bollen, M. Diagnosis of supraharmonics-related problems based on the effects on electrical equipment. Electr. Power Syst. Res. 2021, 195, 107179. [Google Scholar] [CrossRef]
- Espin-Delgado, A.; Ronnberg, S. Modeling and Analysis of Supraharmonic Propagation for Stochastic Studies. IEEE Trans. Power Deliv. 2022, 37, 4899–4910. [Google Scholar] [CrossRef]
- Pinto, J.; Grasel, B.; Baptista, J. Analysis of Supraharmonics Emission in Power Grids: A Case Study of Photovoltaic Inverters. Electronics 2024, 13, 4880. [Google Scholar] [CrossRef]
- Osheba, M.S.; Aboutaleb, A.M.; Desmet, J.; Knockaert, J. The Impact of Grid Distortion on the Power Conversion Harmonics of AC/DC Converters in the Supraharmonic Range. Electronics 2024, 13, 2244. [Google Scholar] [CrossRef]
- Aboutaleb, A.M.; Desmet, J.; Knockaert, J. Impact of Grid-Connected Inverter Parameters on the Supraharmonic Emissions in Distributed Power Generation Systems. Machines 2023, 11, 1014. [Google Scholar] [CrossRef]
- Tebexreni, I.S.L.; Duque, C.A.; Seixas, J.M.d. Separation and Identification of Sources of Supraharmonic Signals Using Complex ICA. In Proceedings of the 2023 IEEE Power and Energy Society General Meeting (PESGM), Orlando, FL, USA, 16–20 July 2023; pp. 1–5. [Google Scholar] [CrossRef]
- Wang, Y.; Xu, Y.; Tao, S.; Siddique, A.; Dong, X. A Flexible Supraharmonic Group Method Based on Switching Frequency Identification. IEEE Access 2020, 8, 39491–39501. [Google Scholar] [CrossRef]
- Xu, L.; He, Y.; Lei, C.; Qiu, J.; Deng, Q. Research on Active Filter for Supraharmonics Suppression of Power Grid. In Proceedings of the 2020 IEEE 3rd Student Conference on Electrical Machines and Systems (SCEMS), Jinan, China, 4–6 December 2020; pp. 735–740. [Google Scholar] [CrossRef]
- Ronnberg, S.K.; Castro, A.G.d.; Moreno-Munoz, A.; Bollen, M.H.; Garrido, J. Solar PV inverter supraharmonics reduction with random PWM. In Proceedings of the 2017 11th IEEE International Conference on Compatibility, Power Electronics and Power Engineering (CPE-POWERENG), Cadiz, Spain, 4–6 April 2017; pp. 644–649. [Google Scholar] [CrossRef]
- Garrido-Zafra, J.; Moreno-Munoz, A.; Gil-De-Castro, A.; Ortiz-Lopez, M.A.; Morales, T. Supraharmonics reduction in LED drivers via random pulse-position modulation. Int. J. Electron. 2018, 105, 2128–2143. [Google Scholar] [CrossRef]
- Garrido, J.; Moreno-Munoz, A.; de Castro, A.G.; Pallares-Lopez, V.; Morales-Leal, T. Supraharmonics emission from LED lamps: A reduction proposal based on random pulse-width modulation. Electr. Power Syst. Res. 2018, 164, 11–19. [Google Scholar] [CrossRef]


Disclaimer/Publisher’s Note: The statements, opinions and data contained in all publications are solely those of the individual author(s) and contributor(s) and not of MDPI and/or the editor(s). MDPI and/or the editor(s) disclaim responsibility for any injury to people or property resulting from any ideas, methods, instructions or products referred to in the content. |
© 2025 by the authors. Licensee MDPI, Basel, Switzerland. This article is an open access article distributed under the terms and conditions of the Creative Commons Attribution (CC BY) license (https://creativecommons.org/licenses/by/4.0/).