Article

SACG-YOLO: A Method of Transmission Line Insulator Defect Detection by Fusing Scene-Aware Information and Detailed-Content-Guided Information

School of Software, North University of China, Taiyuan 030051, China
*
Author to whom correspondence should be addressed.
Electronics 2025, 14(8), 1673; https://doi.org/10.3390/electronics14081673
Submission received: 19 February 2025 / Revised: 26 March 2025 / Accepted: 3 April 2025 / Published: 20 April 2025

Abstract

:
To address the challenges in insulator defect detection for transmission lines, including complex background interference, varying defect region scales, and sample imbalance, we propose a detection method that effectively integrates scene perception information and detailed content guidance. First, a scene perception enhancement module is employed to extract global environmental information, improving the baseline model’s adaptability to complex backgrounds. Second, a detailed content attention module is introduced to enable the model to more accurately capture fine-grained features of small defect regions. Furthermore, a normalized Wasserstein distance metric function is adopted to mitigate the sensitivity of the regression branch in the baseline model. Simultaneously, a sample weighting function is utilized to reduce the impact of sample imbalance on the classification branch. Experimental results demonstrate that the proposed method achieves superior detection performance on a real-world transmission line insulator defect dataset.

1. Introduction

Transmission line insulators are vital components of the power system, serving the functions of isolating current, supporting conductors, and ensuring the safe operation of the line. With the popularization of drones and robot inspection technology, a large amount of inspection data has been obtained, which has raised higher requirements for the automatic detection of insulators [1]. To process these data efficiently, computer vision technology has received wide attention in insulators and their defect detection. The application of computer vision in insulator defect detection can be mainly divided into two categories: traditional image processing methods and deep learning methods.
Traditional image processing methods mainly extract and analyze features such as the color, texture, and shape of insulators to identify defects on the insulator surface. A work in the literature [2] proposed a terahertz imaging method based on an edge detection algorithm, applying the Canny operator to extract the edges of defects and then utilizing the time interval of the defect feature pulse to calculate the defect depth, obtaining the three-dimensional imaging of the defects. In the study conducted by [3], an advanced KNN edge filter was applied to preprocess the image, enabling the precise detection and identification of cracks, followed by an in-depth feature selection process. On the other hand, Tan et al. [4] proposed an innovative microwave nondestructive testing (NDT) technique for layer detection, which utilized the k-medoids clustering algorithm to efficiently identify and differentiate various layers. Furthermore, Liu et al. [5] introduced a groundbreaking NDT approach focused on detecting overheating defects in insulators, utilizing quantitative thermal imaging technology to effectively detect internal overheating issues within porcelain insulators, thus providing a more accurate and dependable method for defect detection. Works covered the literature [6] drew on the idea of text detection, improved the algorithm of a semantic-based arbitrary orientation scene text detector for insulator string detection, extracted the texture and sequence features of insulators, and used the encoded sequence state as labels for supervised training.Traditional detection methods rely on expert knowledge of insulator morphology and typically design feature extraction operators tailored to specific backgrounds and shapes. As a result, the models developed using these methods often suffer from low recognition accuracy and poor generalization capability. Due to their difficulty in adapting to complex and dynamic real-world scenarios, these methods are ineffective for detecting insulator defects in images with complex backgrounds.
In recent years, with the advantages of deep learning methods in large-scale data processing gradually appearing, the progress in insulator defect detection has been significantly improved [7]. Currently, convolutional neural network (CNN)-based target detection algorithm can be roughly divided into two categories. The first category includes two-stage detection algorithms, with representative methods including R-CNN [8], Faster R-CNN [9], etc. The multi-geometry reasoning network (MGRN), proposed in the literature [10] based on the complex backgrounds and aerial images of different scales, adopts the appearance geometry reasoning (AGR) sub-module and parallel feature transformation (PFT) sub-module to obtain appearance geometric features from actual samples to accurately detect insulator geometric defects. An improved defect detection algorithm based on an optimized deep learning network was proposed in [11], where Faster R-CNN serves as the backbone and a Feature Pyramid Network (FPN) is introduced to enhance multi-scale semantic extraction. In [12], a contact network defect detection method was developed by integrating Mask R-CNN with image processing techniques. It utilizes vertical projection for insulator localization and segmentation, followed by the detection of damages, contamination, foreign objects, and flashovers through the fusion of gradient, texture, and grayscale features using K-means clustering. Ref. [13] proposed a compact yet effective CNN architecture that adopts a VGG-style convolutional backbone with ReLU activations for inference, combined with a multi-branch structure during training. The model applies structural reparameterization to decouple the training and inference phases. In [14], string-dropping and crack defects in insulators were detected using an FPN-FRCN-based framework. The work in [15] introduced a region-based fully convolutional network (R-FCN) for defect detection in aerial images, further enhanced by Online Hard Example Mining (OHEM), sample optimization strategies, and Soft Non-Maximum Suppression (Soft-NMS).
The second category includes single-stage target detection algorithms represented by the SSD [16] and YOLO [17,18] series. These algorithms treat target detection as a regression problem. Although they are slightly inferior to two-stage algorithms in detection accuracy, they greatly improve real-time detection, which is more suitable for engineering applications. Li et al. [19] proposed an enhanced SSD model based on a residual network and a multi-level feature fusion strategy. To effectively process information from feature maps obtained in complex backgrounds, attention modules such as CBAM [20], SE-Net [21], and AAM [22] were designed. These modules enhance the representation of target features in challenging environments, thereby improving the saliency of the target to be detected. In [18], a sea surface target detection algorithm based on YOLO v4 was introduced, which incorporates a Reverse Depth Separable Convolution (RDSC) applied to both the backbone and feature fusion network of YOLO v4. This approach significantly improves detection accuracy without sacrificing speed. The study in [23] presented an improved insulator defect detection method, named CBAM-YOLOv8, aimed at addressing the challenges of traditional target detection algorithms, including low detection accuracy for small targets, limited feature map representation, and insufficient extraction of key information. Finally, ref. [24] developed a large insulator image database and enhanced the YOLOv5 model by incorporating smaller detection layers and optimizing the loss function. Zhang et al. [25] introduced a global convolution module to integrate spatial and channel information, thereby enhancing the model’s feature extraction capability. Additionally, they implemented a multi-scale information fusion module to improve the model’s ability to integrate critical features, ultimately achieving effective insulator defect detection. Similarly, Wang et al. [26] leveraged multi-scale channel information and a global–local attention mechanism to enhance the network’s learning capacity, enabling efficient detection of insulator defects even in complex backgrounds.
The above research has proposed effective solutions for insulator defect detection in transmission lines, but there are still some unresolved problems. The defective areas in the transmission line insulator defect detection task have complex background interference and scale variation problems, which pose challenges to feature representation; some defective areas have small sizes and complex morphological features, demanding higher feature extraction capabilities from the models of these small targets; moreover, there is the problem of sample imbalance among different defect categories. To address these problems, this paper mainly adopts the YOLOv8 model, widely used in power inspection, as the baseline model for improvement. The innovation of this paper mainly focuses on improving the feature representation capability of the model backbone network, enhancing the small-scale target detection ability, and resolving the sample imbalance problem. This paper proposes a transmission line insulator defect detection method that integrates scene-aware and detailed-content-guided information. The main contributions are as follows:
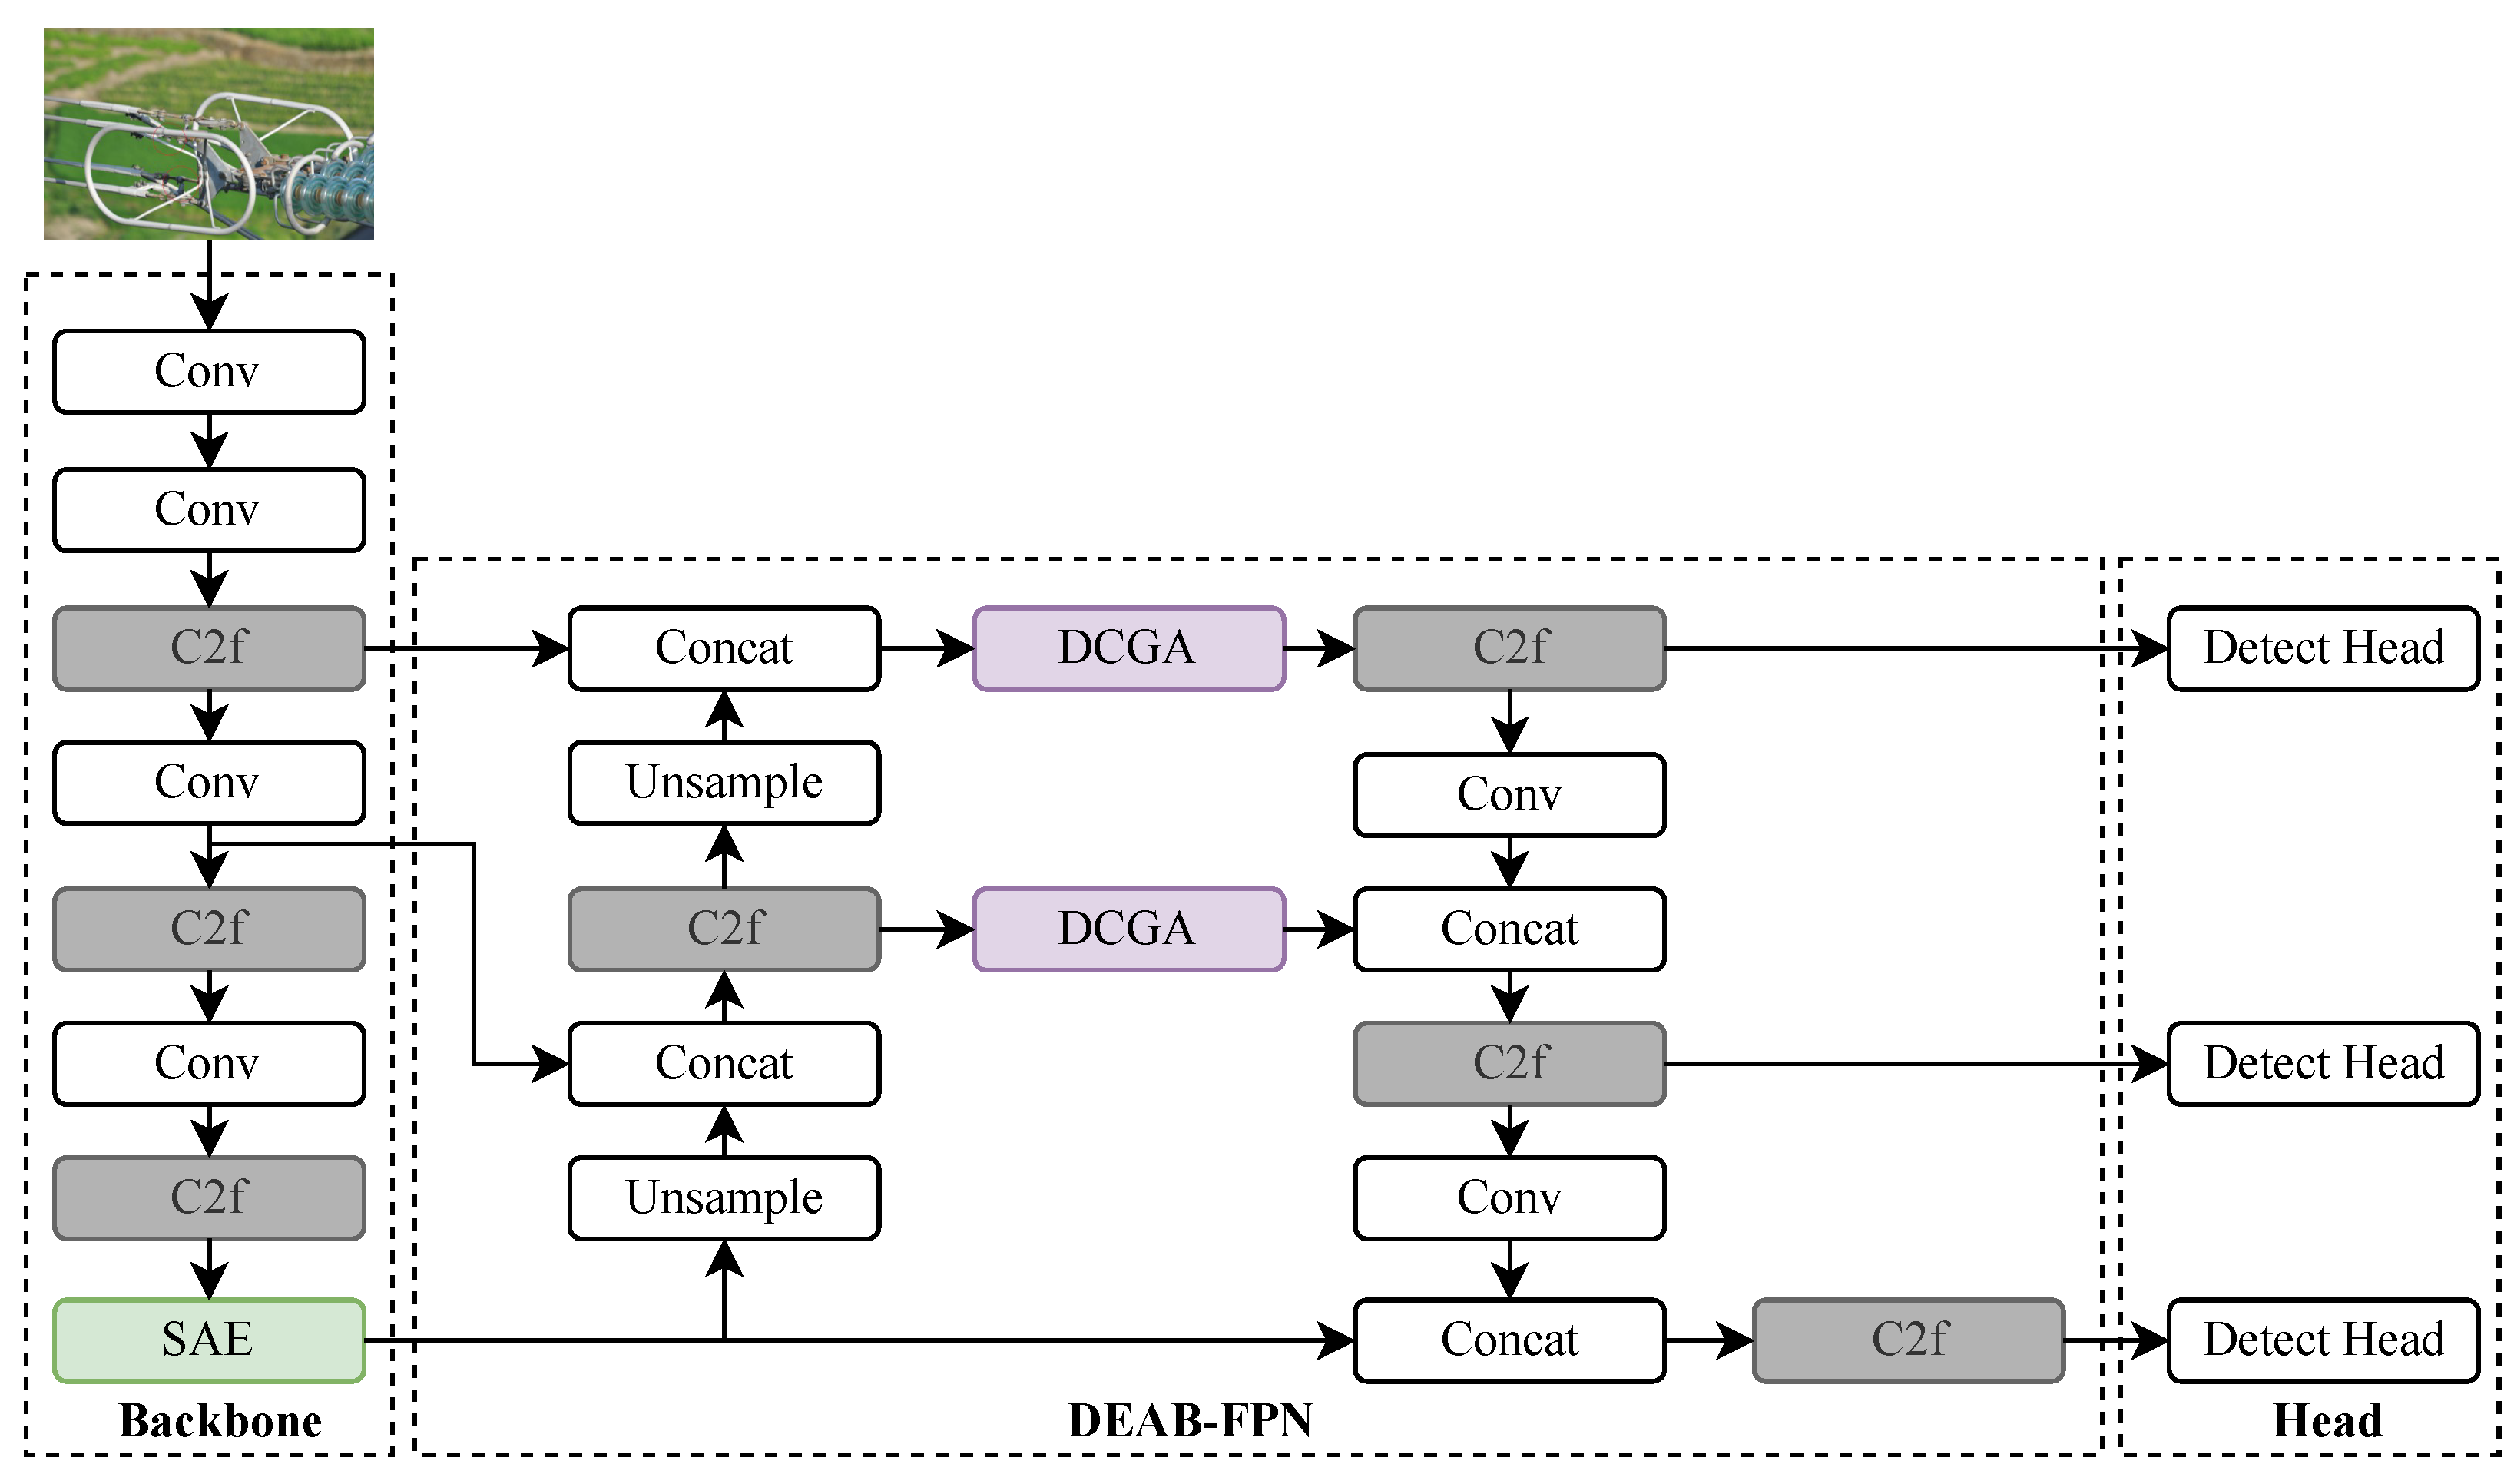
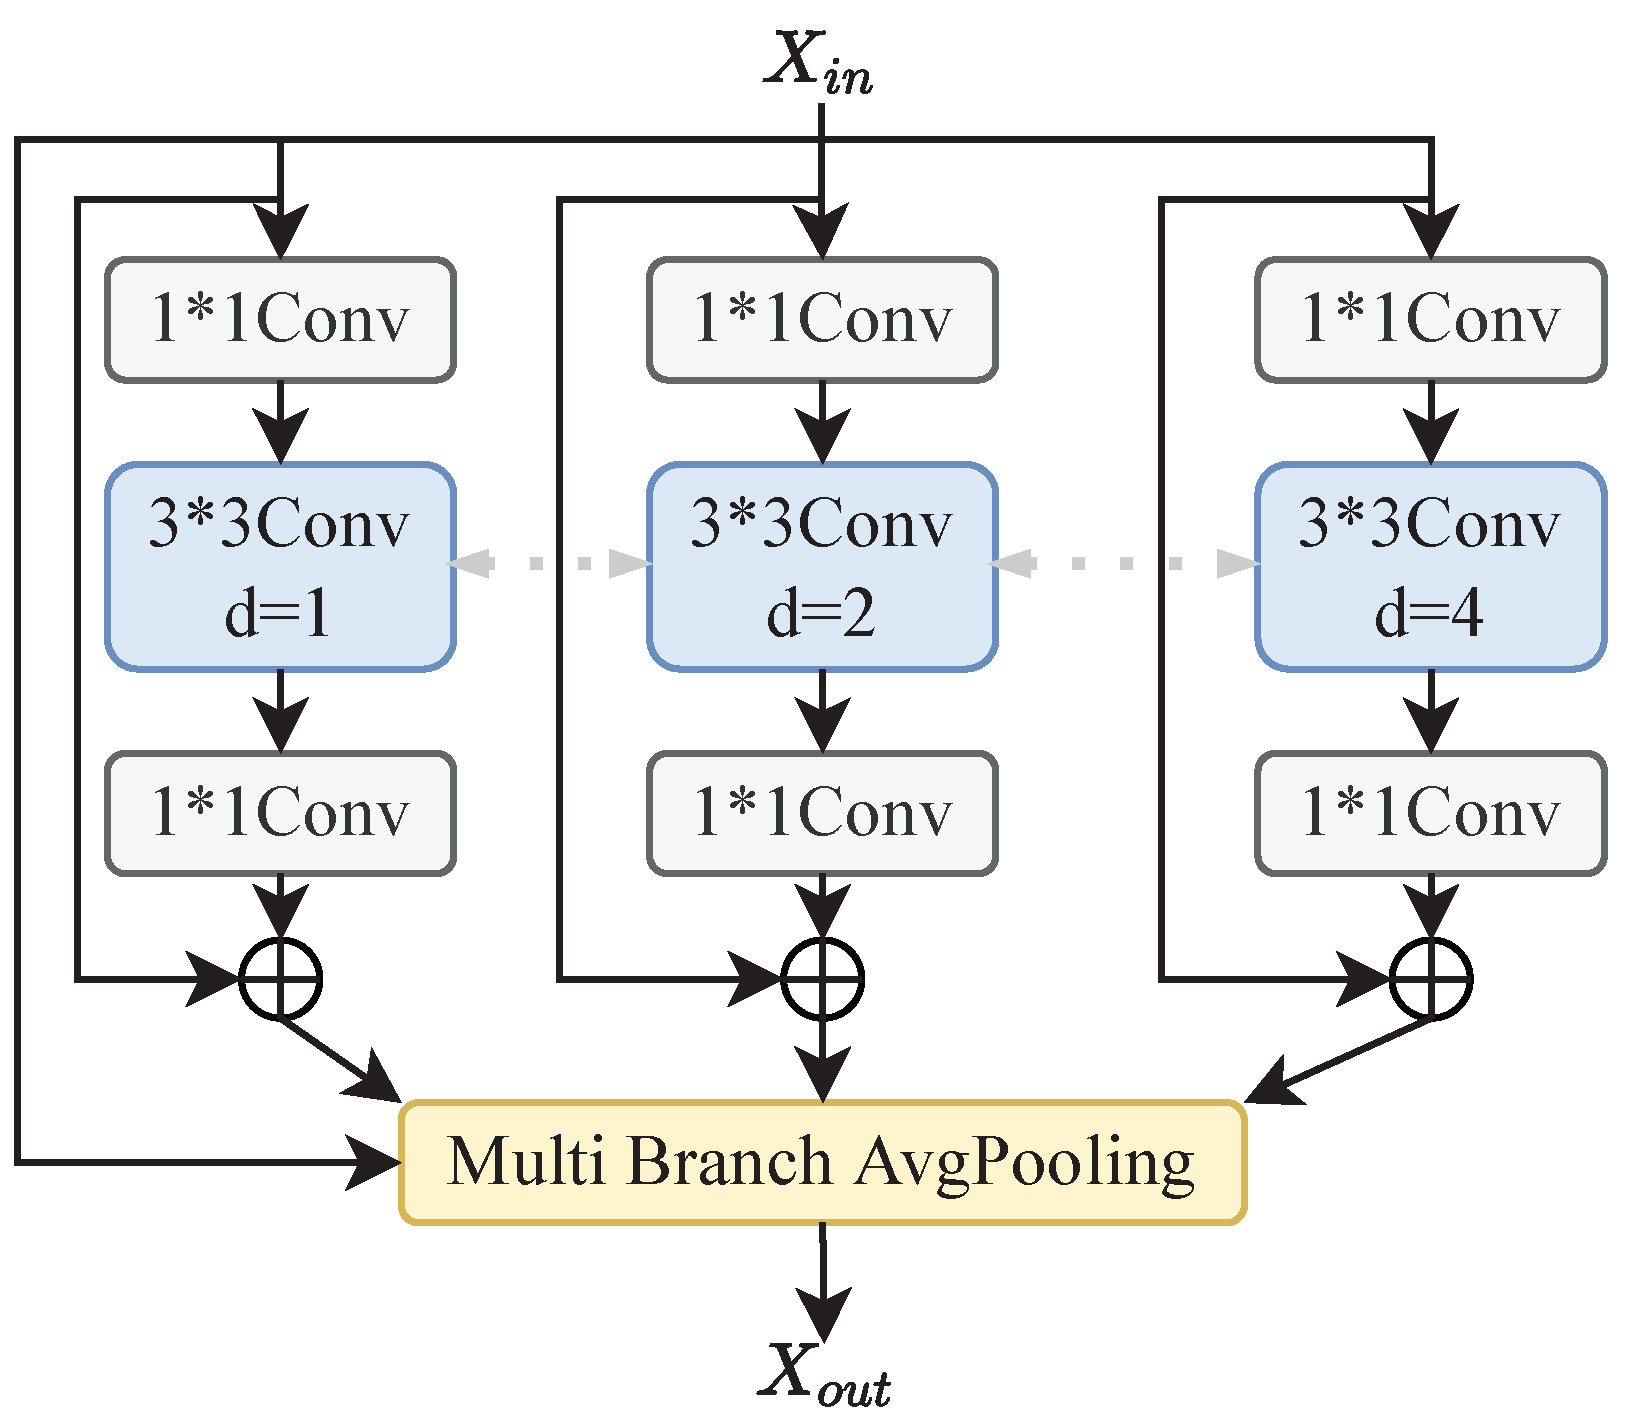
  • In this paper, a scene perception enhancement module called SAE is introduced in the backbone network to replace the original SPPF module, which can enhance the feature representation capability of the backbone network by adjusting sensory fields of different sizes to capture global dependency information and aggregate features of different scales.
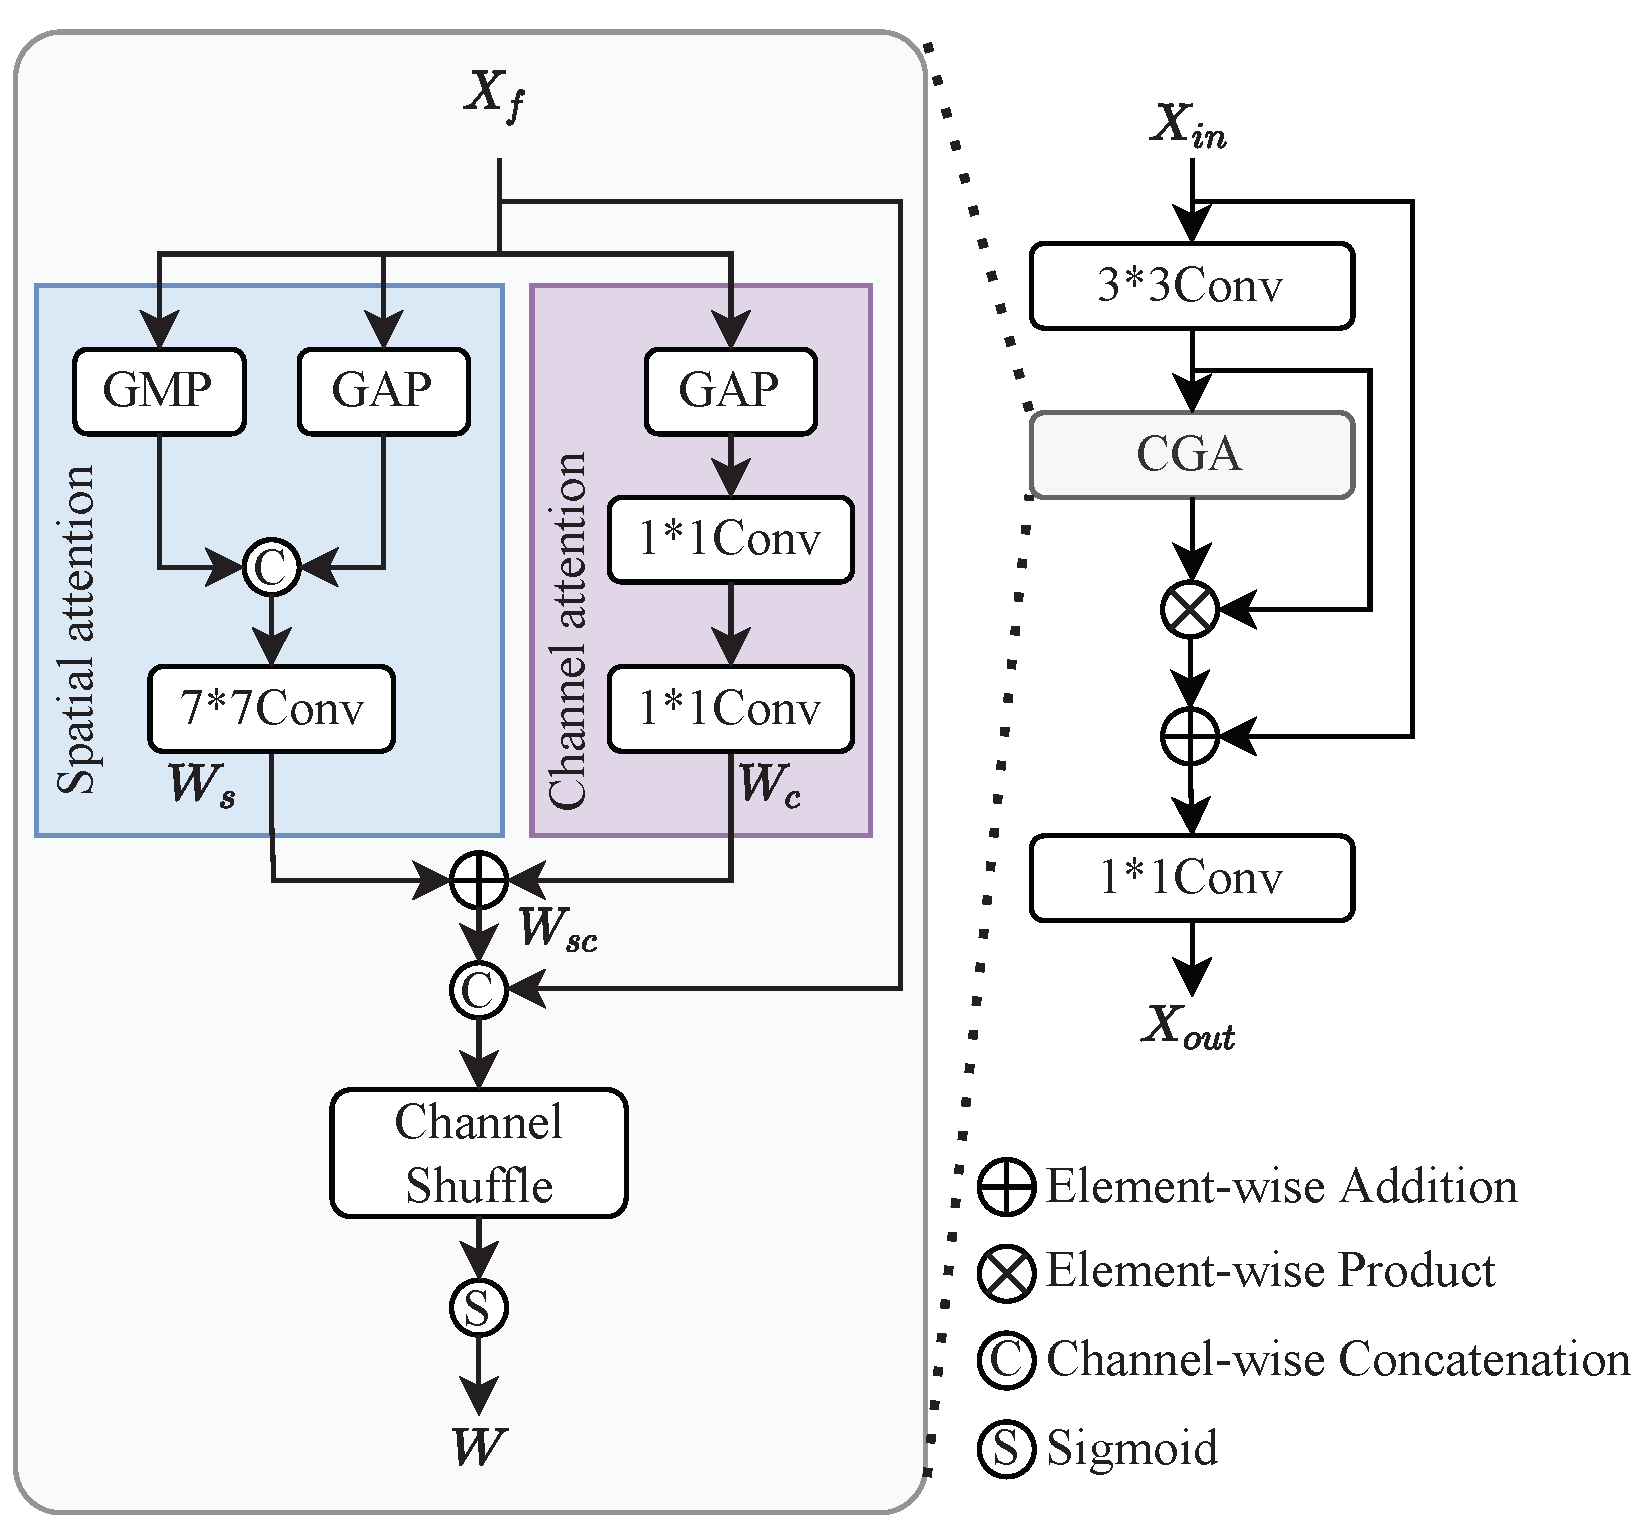
  • We introduce a detail enhancement module in the Neck section to improve the feature extraction capability of the Neck network for small-scale targets through the Detailed-Content-Guided Attention (DCGA) mechanism.
  • To address the sample imbalance problem in the dataset, we introduce a sample weighting function that assigns higher weights to difficult samples, thereby helping the model learn harder-to-recognize features.
The remainder of this paper is organized as follows. We introduce the proposed SACG-YOLO network model in Section 2. In Section 3, we introduced the dataset, evaluation metrics, and implementation details used in the experiment. In Section 4, we conduct a detailed experimental verification to prove the effectiveness of the proposed method. In Section 5, we provide a summary of the paper.

2. Proposed Methods

2.1. The Overall Structure of the Proposed Network

In this paper, we propose SACG-YOLO, a transmission line insulator defect detection method that integrates scene perception and detailed-content-guided information based on YOLOv8. First, in the Backbone section of YOLOv8, the SAE module is used instead of its original SPPF module to capture global information and aggregate features at different scales. Second, the DCGA module is introduced in the Neck network, enhancing the model’s ability to extract detailed information of small-scale targets. Then, the Normalization Wasserstein Distance (NWD) is used as a loss function to improve the model’s regression branching sensitivity when detecting small targets. Finally, a sample-weighting function is constructed to improve the model’s learning ability on hard samples. The overall improved network structure is shown in Figure 1.

2.2. Scene-Aware Enhancement Module

The detection of insulator defects in transmission lines presents significant challenges due to the complex backgrounds and the varying scales of defect regions introduced by UAV-based aerial photography. These factors render existing baseline models less effective in extracting multi-scale features. YOLOv8 incorporates the SPPF module in its Backbone to aggregate multi-scale features; however, it demonstrates limitations in modeling long-range visual contextual information. Additionally, its feature aggregation strategy, which relies solely on concatenating feature maps of different scales, which fails to account for the interaction and integration of multi-scale information under the interference of complex backgrounds. To address these shortcomings, we propose a scene-aware enhancement (SAE) module to replace the original SPPF module in YOLOv8, as depicted in Figure 2.
Inspired by the TridenNet [27] architecture, the SAE module exploits the prior knowledge that receptive fields of varying sizes exhibit differential capabilities in capturing long-range contextual information. By utilizing receptive fields of different sizes, the module effectively captures global information and facilitates the aggregation of multi-scale features. Specifically, the SAE module employs three parallel dilated convolution branches, each with a distinct dilation rate, to capture multi-scale information present in the input feature X i n . A weight-sharing mechanism is implemented across these branches, as indicated by the gray dashed arrows in Figure 2, to reduce the number of parameters and mitigate overfitting risks. The dilation rates α of the three branches are set to 1, 2, and 4, respectively, while a uniform convolutional kernel size of 3 × 3 is applied. To ensure numerical stability during training and to address potential issues of gradient explosion and vanishing, a residual branch is incorporated into the module. The outputs of all four branches are then balanced and aggregated using a multi-branch average pooling operation, producing the final output feature X o u t . The detailed computation is expressed as follows in Equation (1).
X o u t = A v g P [ X i n , X i n + f 1 × 1 ( f 3 × 3 α ( f 1 × 1 ( X i n ) ) ) ]
where f 1 × 1 represents a standard convolution operation with a 1 × 1 convolution kernel, and f 3 × 3 α refers to a dilated convolution operation with a 3 × 3 kernel, where the dilation rate is denoted as α .

2.3. Detailed-Content-Guided Attention

In the basic YOLOv8 model, the Neck part uses the FPN+PAN structure for feature refinement. However, during the downsampling process, large-scale targets dominate the feature processing, which leads to the underrepresentation of small-scale targets. This affects the model’s performance when detecting small targets. To address this issue, we introduce a Detailed-Content-Guided Attention (DCGA) module into the downsampling process of the Neck part. The DCGA module generates spatial importance maps for each channel of the input features in a coarse-to-fine manner, guiding the model to focus more on the detailed differences of small targets in the feature space. Moreover, this module effectively integrates both spatial and channel attention weights, enabling interaction between the two. This approach overcomes the limitations of previous methods that sequentially compute channel and spatial attention, ensuring more effective information exchange and improving small-target detection.
The detailed procedures of DCGA are illustrated in Figure 3. The input feature X i n R C × H × W is first passed through a 3 × 3 convolutional operation to obtain its local detail feature X f . Then, the content-guided attention (CGA) module optimizes the process from coarse to fine, resulting in the final fine spatial attention map W. Finally, a convolution operation with kernel 1 × 1 is applied to obtain the final output feature X o u t R C × H × W .
The CGA module consists of two stages. The first stage generates a rough spatial attention map, which performs coarse processing to obtain an initial attention map W s c , enabling quick capture of the main features in the image. First, the spatial importance map W s and the channel vector W c are obtained through spatial attention and channel attention, respectively, with the corresponding formulas provided in Equations (2) and (3):
W c = J 1 × 1 ( max ( 0 , J 1 × 1 ( X G A P c ) ) )
W s = J 7 × 7 ( [ ( X G A P s ) , ( X G M P s ) ] )
where max ( 0 , x ) denotes a ReLU activation function, J k × k ( · ) denotes a convolutional layer with a specific kernel size, [ · ] denotes a channel-level connection operation, and X G A P c , X G A P s , and X G M P s denote the features processed by global average pooling across spatial dimensions, global average pooling across channel dimensions, and global max pooling across channel dimensions, respectively.
W c and W s are then fused using the simple addition operation of the broadcast rule to obtain the rough attention graph W s c R C × H × W , as shown in Equation (4):
W s c = W s + W c
The second stage aims to optimize the attention map W s c generated in the first stage by using the content of the input features as a guide to generate the final channel-specific attention map W. In particular, each channel of W s c and X is rearranged in an alternating manner using the shuffle operation, as shown in Equation (5):
W = σ ( G J 7 × 7 ( C S ( X , W s c ) ) )
where σ denotes the sigmoid activation function, C S ( · ) denotes the channel shuffle operation, and G J k × k denotes the group convolutional layer with kernel size k × k .

2.4. Normalized Wasserstein Distance Metric Function

In the task of insulator defect detection based on YOLOv8, the commonly used IoU metric is employed. However, this leads to sensitivity in the positioning of predicted bounding boxes, particularly when detecting small-target defects. Thus, we introduce a normalized Wasserstein distance metric [28] while also using the DCGA module to enhance the model’s ability to extract fine-grained features from small targets.
Specifically, the Wasserstein distance metric models bounding boxes as two-dimensional Gaussian distributions. The similarity between the predicted and ground truth boxes is then computed by applying the normalized Wasserstein distance, as shown in Equations (6) and (7). This approach allows for measuring the similarity between predicted and ground truth boxes using distributional similarity. To overcome the limitations of IoU-based loss in small-target detection, we incorporate an additional loss term L N W D into the overall model’s loss function, which helps improve the detection performance from a functional constraint perspective, as shown in Equation (8):
N W D ( g a , g b ) = e x p ( W 2 2 ( g a , g b ) λ )
W 2 2 ( g a , g b ) = c x a , c y a , w a 2 , h a 2 T , c x b , c y b , w b 2 · h b 2 T 2 2
L N W D = 1 N W D ( g a , g b )
where λ is a constant that is closely related to the dataset, W 2 2 ( g a , g b ) represents a distance metric, and g a and g b are derived by modeling A = c x a , c y a , w a , h a and B = c x b , c y b , w b , h b , respectively, using Gaussian distributions.

2.5. Sample Weighting Function

To mitigate the impact of class imbalance in transmission line samples on the model’s performance, we introduce a sample weighting function L S W [28], as described in Equation (9). First, we compute the average IoU of all bounding boxes as the threshold μ , classifying samples with an IoU greater than μ as positive and those with an IoU less than μ as negative. The sample weighting function is then applied to place more emphasis on samples near the boundary between positive and negative classes, thereby reducing the loss caused by ambiguous or unclear samples.
f ( x ) = 1 e 1 μ e 1 x x μ 0.1 μ 0.1 < x < μ x μ

3. Details of the Experiment

3.1. Dataset Details

We collected a total of 1600 aerial images of insulator defects from various regions, which include 1025 samples of drop defects and 575 samples of damage defects. This dataset comprises insulator defect samples made from different materials (ceramic, glass, and composite), with image sizes ranging from 800 × 531 to 7036 × 4912 pixels. The dataset was split in a 3:1 ratio, with 1200 samples in the training set and 400 samples in the testing set. Furthermore, all samples in the dataset were annotated according to the standard format used for general object detection tasks and were stored in JPG format.

3.2. Evaluation Metrics

In the transmission line insulator defect detection task, we used a standard target detection metric to comprehensively assess the experimental results. The calculation formulas are as follows in Equations (10) and (11):
P = T P T P + F P
R = T P T P + F N
where TP (True Positive) refers to the case where the model correctly identifies samples predicted to be positive, FP (False Positive) denotes the case where the model incorrectly classifies samples that are actually negative as positive, and FN (False Negative) refers to the case where the model incorrectly classifies positive samples as negative. Precision (P) measures the proportion of correctly predicted positive samples out of all samples predicted as positive, while Recall (R) measures the proportion of correctly predicted positive samples out of all actual positive samples, with both evaluated for a specific IoU threshold. To more comprehensively evaluate the performance of insulator detection, the PR curve (Precision–Recall curve) was introduced in the detection model to compute the Average Precision (AP) and Average Recall (AR) indices. The calculation formulas are as follows in Equations (12) and (13):
A P = 1 N i = 1 N P ( i ) · Δ R ( i )
where P ( i ) is the precision at the i-th recall, and Δ R ( i ) is the change in recall at the i-th threshold. AP50 and AP75 represent the average precision at IoU (Intersection over Union) thresholds of 50% and 75%, respectively.
A R = 1 N i = 1 N R ( i ) · Δ P ( i )
where R ( i ) is therecall at the i-th precision, and Δ P ( i ) is the change in precision at the i-th threshold.

3.3. Implementation Details

The proposed model in this paper was experimentally validated. The software and hardware environment for the experiments were as follows: an NVIDIA GeForce RTX 3090 professional acceleration card (Made in China), running the Ubuntu 18.04 operating system. The programming environment was Python 3.8, and the model development framework used was PyTorch 2.3.1. During the training phase, the batch size was set to 16, with 100 epochs. The stochastic gradient descent (SGD) optimizer was used to compute and update the network parameters, with a learning rate of 0.01, a momentum parameter of 0.5, and a weight decay rate of 0.0001. Based on the dataset used in this paper, we set the hyperparameter λ involved in L N W D to 1.

4. Experiment

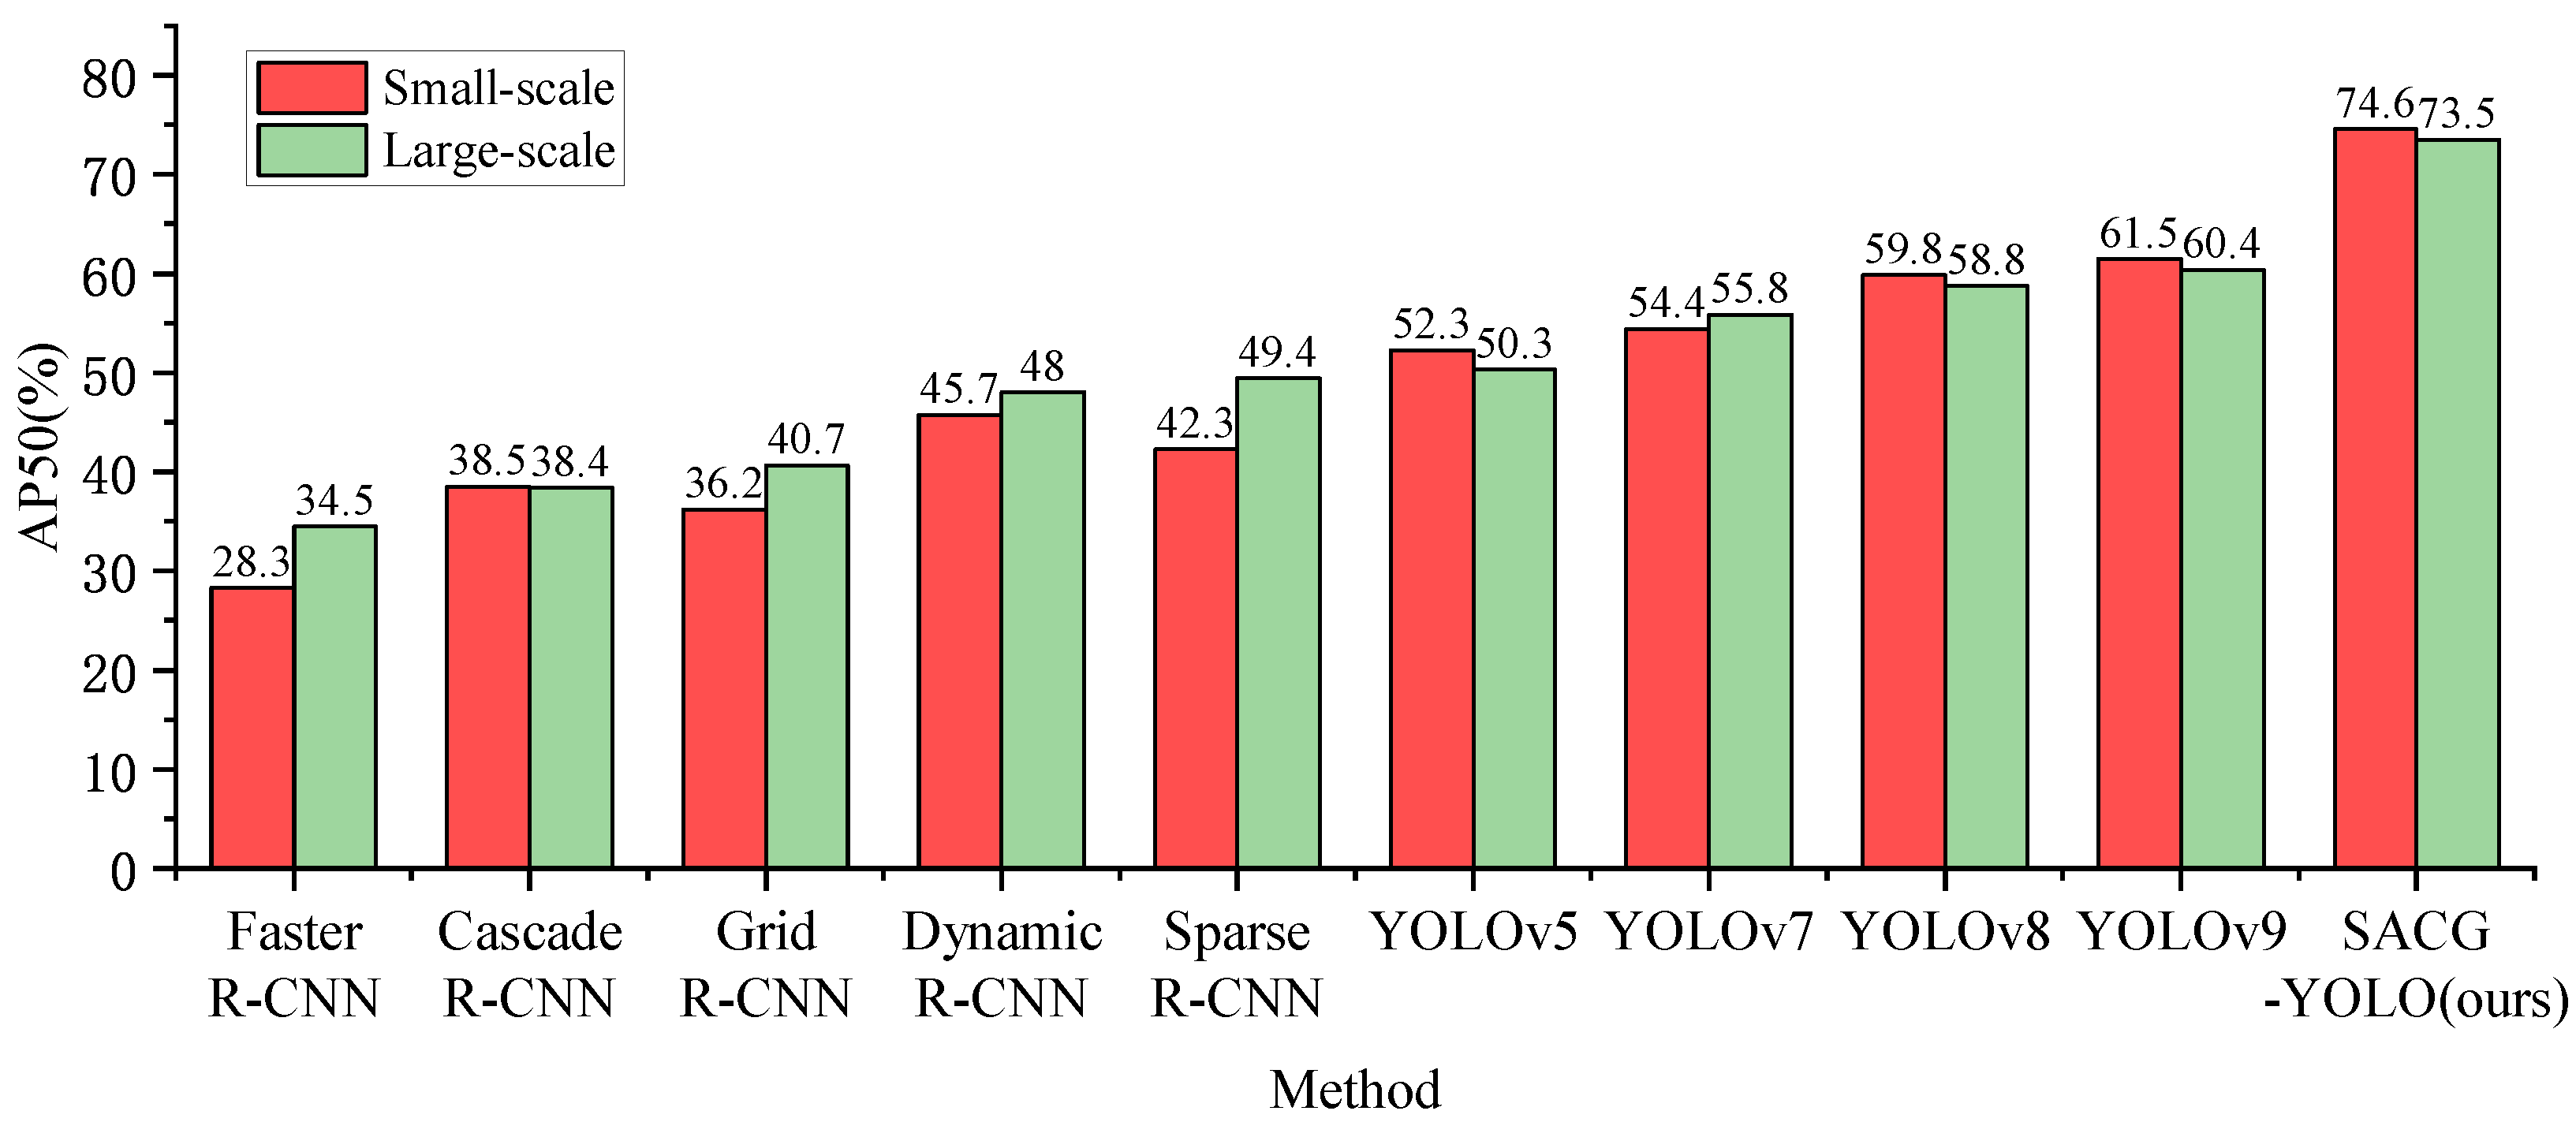
4.1. Comparison of the Proposed Model with Other State-of-the-Art Models

To evaluate the performance of the model proposed in this paper, we compared the SACG-YOLO with eight other state-of-the-art models, including Cascade R-CNN, Faster R-CNN, Grid R-CNN, Sparse R-CNN, YOLOv5s, YOLOv7s, YOLOv8s, and YOLOv9s. The experimental results are shown in Table 1. As can be seen from Table 1, the AP50 index of the proposed model was 82.7%, showing an improvement of 12.2% compared to the baseline model. When compared to other object detection models, our proposed model also demonstrated varying degrees of improvement across several metrics. Notably, it achieved the best performance on the damage class, which had fewer samples, with an AP of 72.5%, representing an improvement of 18.5% over the baseline model.
Furthermore, we conducted additional evaluations to demonstrate the detection performance of the proposed model on both small-scale and large-scale targets, as illustrated in Figure 4. The results indicate that the overall performance of the R-CNN series (e.g., Faster R-CNN and Cascade R-CNN) was relatively low, particularly in small-object detection, where accuracy was suboptimal. With successive iterations, the detection accuracy of the YOLO series progressively improved, with YOLOv9 achieving AP50 scores of 61.5% and 60.4% for small and large targets, respectively. Notably, the SACG-YOLO model proposed in this study outperformed other methods across both scales, achieving an AP50 of 74.6% in small object detection. This suggests that SACG-YOLO incorporates superior optimization strategies, such as enhanced feature extraction and multi-scale receptive fields, enabling it to excel in complex detection tasks.
To more intuitively demonstrate the advantages of SACG-YOLO over other models in the task of insulator defect detection on transmission lines, we selected several representative samples from the test set to showcase the detection results, as shown in Figure 5 and Figure 6. These figures illustrate the detection results of both the baseline model and our method for damage defects and drop defects across multiple background types. As seen in the figures, our model not only performed better at detecting defects with large differences between the foreground (defects) and background (e.g., damage3, damage2, and drop1), but it also delivered strong results on defects with smaller foreground–background differences (damage1) and defects with smaller target sizes (drop2). This demonstrates that our method excels in handling both challenging cases with subtle differences and small-scale defects.

4.2. Comparison Between the DCGA Module and Other Attention Mechanisms

To evaluate the effectiveness of the DCGA module, we added different attention mechanisms to the same position in the baseline model for comparison experiments. The experimental results are shown in Table 2. From the comparison of results obtained by adding the SE [29], CBAM [20], EMA [30], and DCGA, we can see that the DCGA module outperformed the others, particularly in terms of the AP50 and AP75 metrics. Compared to the baseline model, the addition of the DCGA module improved the overall AP by 4.4%, with a 2.6% improvement for dropped defects and a 12.2% improvement for broken defects. These results demonstrate that the DCGA module effectively enhances feature extraction, especially for broken defects, which are characterized by their complexity.
To verify the superior performance of the DCGA module in detecting small-scale insulator defective regions, we selected 50 small-target defect samples from the test set and conducted experiments. The results are shown in Table 3. As seen in the Table 3, the DCGA module outperformed other attention mechanisms in detecting small-scale insulator defects, with a total of 46 detections compared to the baseline model. This corresponds to a detection accuracy of 92.0%. Overall, the DCGA module effectively encodes detailed information in local channel features.

4.3. Ablation Experiments of Components in SACG-YOLO

To verify the effectiveness of the SAE, DCGA, L N W D , and L S W involved in the SACG-YOLO model proposed in this paper, we conducted a series of ablation experiments. Using YOLOv8s as the baseline model, we sequentially added different improvement measures, and the experimental results are presented in Table 4. These ablation experiments were performed under the same experimental conditions to assess the impact of each component on the overall performance of the model.
From the experimental results in Table 4, it is evident that the original YOLOv8s model performed at a baseline level, with an AP50 of 70.5% and an AP75 of 45.3%. However, with the introduction of various improvement methods, the model’s performance significantly improved. YOLOv8s + SAE showed some progress over the original model in certain metrics. Additionally, models like YOLOv8s + DCGA, YOLOv8s + L N W D , and YOLOv8s + L S W , as well as combinations of these improvements, enhanced the model’s performance to varying degrees. Overall, the model proposed in this paper achieved outstanding results, reaching 82.7% for AP50, outperforming all other variants, and 53.5% for AP75, which was also the highest among the improved models. These results demonstrate that the proposed model maintains high detection accuracy across different confidence levels.
To further demonstrate the effectiveness of the SAE module in enhancing global features, we visualized the feature maps before and after incorporating the SAE module, as shown in Figure 7. As shown in Figure 7, the baseline model was susceptible to environmental noise. After incorporating the SAE module, the activated regions were more concentrated in the target areas. This indicates that the SAE module enhances the model’s ability to capture key features in complex scenes, improving detection accuracy and reliability. It effectively removes irrelevant features and enhances target recognition precision. From the visual results, the feature maps with the SAE module appear more focused and contain less noise, demonstrating the effectiveness of the SAE module in scene perception enhancement.

5. Conclusions

This study proposes a novel method for detecting insulator defects in transmission lines, integrating scene perception with detailed content guidance to address the challenges posed by complex backgrounds. To enhance feature extraction under background interference, we introduce a scene-aware enhancement module that expands the receptive field and captures global contextual information. For small-scale object detection, an attention module guided by detailed content refines defect-specific features, while the normalized Wasserstein distance metric constrains IoU computation at the output stage. Experimental results demonstrate the effectiveness of the proposed method, with our model achieving a detection accuracy of 82.7%, surpassing the baseline model by 12.2%. Despite these promising results, the current model primarily focuses on detecting defects related to drop and damage, and its applicability to other types of defects remains an area for further investigation. Additionally, the integration of multiple modules increases computational demands, posing a challenge in terms of resource efficiency. Future work will focus on optimizing the model for greater computational efficiency and lightweight deployment.

Author Contributions

L.Z.: Conceptualization; formal analysis; methodology; software; funding acquisition; project administration; writing—original draft preparation; writing—review and editing. J.K.: Formal analysis; investigation; methodology; software; supervision. Y.A.: Formal analysis; investigation; resources; validation; visualization; writing—review and editing. Y.L.: Data curation; validation; visualization. M.J.: Data curation. R.L.: Visualization. All authors have read and agreed to the published version of the manuscript.

Funding

This research was funded by the 2024 Shanxi Provincial Graduate Education Innovation Program Projects (No.2024AL21).

Data Availability Statement

Restrictions apply to the availability of these data. Data were obtained from State Grid Corporation of China and are available from the authors with the permission of State Grid Corporation of China.

Conflicts of Interest

The authors declare no conflicts of interest.

Abbreviations

The following abbreviations are used in this manuscript:
CNNConvolutional neural network
CBAMConvolutional Block Attention Module
DCGADetailed content guidance attention
EMAEfficient multi-scale attention
FPNFeature pyramid network
IoUIntersection over union
MGRNMulti-geometry reasoning network
NDTNondestructive testing
NWDNormalized Wasserstein distance
OHEMOnline Hard Example Mining
R-FCNRegion-based Fully Convolutional Network
SAEScene-aware enhancement
SESqueeze-and-excitation
SGDStochastic gradient descent
Soft-NMSSoft Non-Maximum Suppression
UAVUnmanned aerial vehicle

References

  1. Liu, J.; Hu, M.; Dong, J.; Lu, X. Summary of insulator defect detection based on deep learning. Electr. Power Syst. Res. 2023, 224, 109688. [Google Scholar] [CrossRef]
  2. Mei, H.; Jiang, H.; Yin, F.; Wang, L.; Farzaneh, M. Terahertz imaging method for composite insulator defects based on edge detection algorithm. IEEE Trans. Instrum. Meas. 2021, 70, 1–10. [Google Scholar] [CrossRef]
  3. Zhu, Z.; Liu, X. Research on surface detection of ceramic insulator based on image processing. Electron. Meas. Technol. 2024, 47, 31–37. [Google Scholar]
  4. Tan, S.Y.; Akbar, M.F.; Shrifan, N.H.; Nihad Jawad, G.; Ab Wahab, M.N. Assessment of defects under insulation using K-medoids clustering algorithm-based microwave nondestructive testing. Coatings 2022, 12, 14–40. [Google Scholar] [CrossRef]
  5. Liu, G.; Wen, Y.; Gu, Y.; Zhou, J.; Chen, S. Decision Tree Clusters: Non-destructive detection of overheating defects in porcelain insulators using quantitative thermal imaging techniques. Measurement 2025, 241, 115723. [Google Scholar] [CrossRef]
  6. Zhou, Y.; Xu, B.; Song, A.; Chen, G. Anomaly Location and Discrimination Method of Insulator String Based on Improved TextDetection and Recognition. High Volt. Eng. 2021, 47, 3819–3826. [Google Scholar]
  7. Xie, X.; Zhou, J.; Zhang, Y. Application and challenge of deep learning in Ubiquitous Power Internet of Things. Electr. Power Autom. Equipment/Dianli Zidonghua Shebei 2020, 40, 77–87. [Google Scholar]
  8. Girshick, R.; Donahue, J.; Darrell, T.; Malik, J. Rich feature hierarchies for accurate object detection and semantic segmentation. In Proceedings of the IEEE Conference on Computer Vision and Pattern Recognition, Columbus, OH, USA, 23–28 June 2014; pp. 580–587. [Google Scholar]
  9. Ren, S.; He, K.; Girshick, R.; Sun, J. Faster R-CNN: Towards real-time object detection with region proposal networks. IEEE Trans. Pattern Anal. Mach. Intell. 2016, 39, 1137–1149. [Google Scholar] [CrossRef]
  10. Zhai, Y.; Hu, Z.; Wang, Q.; Yang, Q.; Yang, K. Multi-Geometric Reasoning Network for Insulator Defect Detection of Electric Transmission Lines. Sensors 2022, 22, 6102. [Google Scholar] [CrossRef]
  11. Ning, P.; Jin, J.; Xu, Y.; Kong, C.; Zhang, C.; Tang, D.; Huang, J.; Xu, Z.; Li, T. Enhanced Detection of Glass Insulator Defects Using Improved Generative Modeling and Faster RCNN. Procedia CIRP 2024, 129, 31–36. [Google Scholar] [CrossRef]
  12. Tan, P.; Li, X.F.; Ding, J.; Cui, Z.S.; Ma, J.E.; Sun, Y.L.; Huang, B.Q.; Fang, Y.T. Mask R-CNN and multifeature clustering model for catenary insulator recognition and defect detection. J. Zhejiang Univ.-Sci. A 2022, 23, 745–756. [Google Scholar] [CrossRef]
  13. Ding, X.; Zhang, X.; Ma, N.; Han, J.; Ding, G.; Sun, J. Repvgg: Making vgg-style convnets great again. In Proceedings of the IEEE/CVF Conference on Computer Vision and Pattern Recognition, Virtual, 19–25 June 2021; pp. 13733–13742. [Google Scholar]
  14. Zhao, W.; Xu, M.; Cheng, X.; Zhao, Z. An insulator in transmission lines recognition and fault detection model based on improved faster RCNN. IEEE Trans. Instrum. Meas. 2021, 70, 5016408. [Google Scholar] [CrossRef]
  15. Liu, S.; Wang, B.; Gao, K.; Wang, Y.; Gao, C.; Chen, J. Object Detection Method for Aerial Inspection Image Based on Region-based Fully Convolutional Network. Autom. Electr. Power Syst. 2019, 43, 162–168. [Google Scholar]
  16. Liu, W.; Anguelov, D.; Erhan, D.; Szegedy, C.; Reed, S.; Fu, C.Y.; Berg, A.C. Ssd: Single shot multibox detector. In Proceedings of the Computer Vision–ECCV 2016: 14th European Conference, Amsterdam, The Netherlands, 11–14 October 2016; Proceedings, Part I 14. Springer: Cham, Switzerland, 2016; pp. 21–37. [Google Scholar]
  17. Zhao, L.; Li, S. Object detection algorithm based on improved YOLOv3. Electronics 2020, 9, 537. [Google Scholar] [CrossRef]
  18. Liu, T.; Pang, B.; Zhang, L.; Yang, W.; Sun, X. Sea surface object detection algorithm based on YOLO v4 fused with reverse depthwise separable convolution (RDSC) for USV. J. Mar. Sci. Eng. 2021, 9, 753. [Google Scholar] [CrossRef]
  19. Li, R.; Zhang, Y.; Zhai, D.; Xu, D. Pin Defect Detection of Transmission Line Based on Improved SSD. High Volt. Eng. 2021, 47, 3795–3802. [Google Scholar]
  20. Woo, S.; Park, J.; Lee, J.Y.; Kweon, I.S. CBAM: Convolutional block attention module. In Proceedings of the European Conference on Computer Vision (ECCV), Munich, Germany, 8–14 September 2018; pp. 3–19. [Google Scholar]
  21. Wei, S.; Qu, Q.; Su, H.; Shi, J.; Zeng, X.; Hao, X. Intra-pulse modulation radar signal recognition based on Squeeze-and-Excitation networks. Signal Image Video Process. 2020, 14, 1133–1141. [Google Scholar] [CrossRef]
  22. Shuaihui, Q.; Shasha, X.; Tao, X.; Guangchuan, Y. AAM: An Advanced Attention Module in Convolutional Neural Networks. In Proceedings of the 2020 2nd International Conference on Machine Learning, Big Data and Business Intelligence (MLBDBI), Taiyuan, China, 23–25 October 2020; pp. 371–374. [Google Scholar]
  23. Lu, Y.; Hu, X.; Zou, X.; Han, L. Research on Insulator Defect Detection Model Based on Improved YOLOv8. J. Electrotechnol. Electr. Eng. Manag. 2024, 7, 11–17. [Google Scholar]
  24. Li, Y.; Du, J.; Yi, Y.; Wan, W.; Lin, Y. Insulator recognition and self-explosion defect detection method based on improved YOLOv5 model. In Proceedings of the International Conference on Automation Control, Algorithm, and Intelligent Bionics (ACAIB 2023), Xiamen, China, 28–30 April 2023; Volume 12759, pp. 634–639. [Google Scholar]
  25. Zhang, Q.; Zhang, J.; Li, Y.; Zhu, C.; Wang, G. ID-YOLO: A Multi-Module Optimized Algorithm for Insulator Defect Detection in Power Transmission Lines. IEEE Trans. Instrum. Meas. 2025, 74, 3505611. [Google Scholar] [CrossRef]
  26. Wang, Y.; Song, X.; Feng, L.; Zhai, Y.; Zhao, Z.; Zhang, S.; Wang, Q. MCI-GLA plug-in suitable for yolo series models for transmission line insulator defect detection. IEEE Trans. Instrum. Meas. 2024, 73, 9002912. [Google Scholar] [CrossRef]
  27. Li, Y.; Chen, Y.; Wang, N.; Zhang, Z. Scale-aware trident networks for object detection. In Proceedings of the IEEE/CVF International Conference on Computer Vision, Seoul, Republic of Korea, 27 October–2 November 2019; pp. 6054–6063. [Google Scholar]
  28. Yu, Z.; Huang, H.; Chen, W.; Su, Y.; Liu, Y.; Wang, X. Yolo-facev2: A scale and occlusion aware face detector. Pattern Recognit. 2024, 155, 110714. [Google Scholar] [CrossRef]
  29. Hu, J.; Shen, L.; Sun, G. Squeeze-and-excitation networks. In Proceedings of the IEEE Conference on Computer Vision and Pattern Recognition, Salt Lake City, UT, USA, 18–22 June 2018; pp. 7132–7141. [Google Scholar]
  30. Ouyang, D.; He, S.; Zhang, G.; Luo, M.; Guo, H.; Zhan, J.; Huang, Z. Efficient multi-scale attention module with cross-spatial learning. In Proceedings of the ICASSP 2023—2023 IEEE International Conference on Acoustics, Speech and Signal Processing (ICASSP), Rhodes Island, Greece, 4–10 June 2023; pp. 1–5. [Google Scholar]
Figure 1. The overall structure of SACG-YOLO.
Electronics 14 01673 g001
Figure 2. Scene-aware enhancement module.
Electronics 14 01673 g002
Figure 3. Detailed-Content-Guided Attention module.
Electronics 14 01673 g003
Figure 4. The results of detecting defect targets at different scales using the proposed model and other advanced models.
Electronics 14 01673 g004
Figure 5. Comparison of the visualization of the proposed SACG-YOLO and baseline on the class of damage defects.
Electronics 14 01673 g005
Figure 6. Comparison of the visualization of the proposed SACG-YOLO and baseline on the class of drop defects.
Electronics 14 01673 g006
Figure 7. The visualization comparison of feature maps before and after incorporating the SAE module.
Electronics 14 01673 g007
Table 1. The comparison of detection results between SACG-YOLO and other advanced models.
ModelsAP50 (%)AP75 (%)AR10 (%)AR100 (%)AP50-Damage (%)AP50-Drop (%)
Faster R-CNN75.034.041.147.458.791.3
Cascade R-CNN70.242.342.548.251.788.7
Grid R-CNN72.339.141.749.156.088.5
Dynamic R-CNN74.840.241.746.861.688.0
Sparse R-CNN77.340.043.460.264.190.5
YOLOv5s67.246.542.051.648.286.2
YOLOv7s69.448.542.052.350.388.5
YOLOv8s70.545.342.751.754.087.0
YOLOv9s71.447.643.152.056.786.0
YOLOv1178.549.647.354.863.589.4
YOLOv1272.347.548.853.460.587.4
SACG-YOLO (ours)82.753.544.748.672.592.9
Table 2. The comparison of the results between adding the DCGA module to the baseline model and other attention mechanisms.
ModelsAP50 (%)AP75 (%)AP50-Damage (%)AP50-Drop (%)
Baseline70.545.354.087.0
Baseline + SE72.743.562.187.3
Baseline + CBAM72.945.664.187.6
Baseline + EMA73.447.765.388.5
Baseline + DCGA74.948.766.289.6
Table 3. The comparison of the results between adding the DCGA module to the baseline model and other attention mechanisms regarding small-scale defect object detection.
ModelsNumber of Correct DetectionDetection Accuracy (%)
Baseline2040.0
Baseline + SE2448.0
Baseline + CBAM3264.0
Baseline + EMA4386.0
Baseline + DCGA4692.0
Table 4. Ablation study results of multiple modules in SACG-YOLO.
MethodSAEDCGA L NWD L SW AP50 (%)AP50 (%)AP75 (%)
DropDamage
YOLOv8s 87.054.070.545.3
YOLOv8s 88.465.274.646.4
YOLOv8s 89.666.274.948.7
YOLOv8s 88.966.376.946.8
YOLOv8s 90.465.477.448.2
YOLOv8s 90.667.078.048.7
YOLOv8s 88.767.177.247.5
YOLOv8s 89.267.678.447.9
YOLOv8s 90.668.279.350.2
YOLOv8s 91.369.479.849.5
YOLOv8s 89.667.477.450.6
YOLOv8s 90.670.680.649.3
Ours92.972.582.753.5
Disclaimer/Publisher’s Note: The statements, opinions and data contained in all publications are solely those of the individual author(s) and contributor(s) and not of MDPI and/or the editor(s). MDPI and/or the editor(s) disclaim responsibility for any injury to people or property resulting from any ideas, methods, instructions or products referred to in the content.

